Article

Preliminary Design and Analysis of Supersonic Business Jet Engines

Institute of Aircraft Propulsion Systems, University of Stuttgart, Pfaffenwaldring 6, 70569 Stuttgart, Germany
*
Author to whom correspondence should be addressed.
Aerospace 2022, 9(9), 493; https://doi.org/10.3390/aerospace9090493
Submission received: 31 July 2022 / Revised: 29 August 2022 / Accepted: 30 August 2022 / Published: 2 September 2022
(This article belongs to the Special Issue Supersonic and Hypersonic Transportation Systems)

Abstract

:
Currently projected supersonic business jets target selected supersonic flight missions with Mach numbers of about 1.4 and a larger number of long-range subsonic flight missions. They form a new type of aircraft that is specially tailored to these requirements. The question arises as to which engine configurations and technology levels are required to support these new applications. This is addressed firstly by exploring the design space of potential working cycles. An aircraft model is used to translate the results of the cycle study into an expected aircraft range. An optimal core engine and fan configuration result from the cycle study and the derived mission ranges. The preliminary design of the low-pressure components is investigated in the second step based on the optimal core configuration. The highest non-dimensional parameters are encountered in subsonic flight conditions. The highest dimensional parameters are encountered in supersonic high-altitude flight conditions. High-overall-efficiency configurations do not result in optimal aircraft ranges. There is an optimal number of two fan stages and a specific thrust of about 300 m/s, resulting in a maximum aircraft range that is 11% superior to that achievable with a single-stage fan. A fan hub-to-tip ratio range that is comparable to that of military fans is desirable, with an aerodynamic lower limit around 0.37. The low-pressure turbine stage count is a compromise between turbine mass and size.

1. Introduction

Currently projected supersonic business jets are to complement the market segments of today’s subsonic business jets by offering significant time savings on selected missions. The already offered and projected mission capabilities in the business jet segment are shown in Figure 1. Flight missions between 3000 and 4000 nm, as well as between 5000 and 7000 nm, are the most important to the so-called premium passengers [1]. They cover many continental routes and most routes across the North Atlantic and the Pacific at subsonic speeds. A market niche for supersonic business jets complementing these capabilities is projected [2,3,4]. In view of the current market representatives shown in Figure 1, this new type of aircraft shall outperform the current competition until a distance of 5400 nm by offering a subsonic flight Mach number of M a 0.95 . Moreover, it shall offer significant savings in flight time at cruise speeds of M a 1.4 and M a 1.1 , even though refueling is needed to achieve the required maximum range. The resulting design challenge is a subject in the European SENECA (noiSe and EmissioNs of supErsoniC Aircraft) project and is pursued by start-ups such as Boom Supersonic. The budget-impacted demise of Aerion [5] illustrates the size of it.
To date, no readily available engine exists that is tailored to the specific aircraft requirements. That is why the present paper provides performance and design assessments of engine technologies for near-term supersonic business-jet-type aircraft. More precisely, engine performance synthesis is linked to aircraft performance by means of a preliminary aircraft design model. This allows mission capabilities to be examined and an engine-architecture-dependent optimal range to be identified. Mechanical and aerodynamic characteristics of corresponding engine components, particularly the fan section and the low-pressure turbine, are then analyzed in dedicated design spaces. The main purpose is to provide and evaluate distinct design features in terms of component performance, structure, aerodynamic loading, weight, and size, which enable substantiated decisions during the preliminary design phase of future supersonic business jets. In theory, the knowledge gained can be extended to other aircraft categories.
So far, in the literature on supersonic business jets, potential whole-engine architectures have been compared and reviewed within the NASA N+3 Supersonic Program [7,8], although for higher flight Mach number regimes than in this paper or other more recent publications. A specific civil supersonic engine cycle and basic aerodynamic design were derived in [9], without taking mechanical design, any part or component masses, or design choice impacts on aircraft capabilities into account. A derivative strategy based on a fixed core engine and bypass ratio was pursued in [10], while no mechanical, aerodynamic, or aircraft impact considerations were provided. Cycle analyses coupled with mass estimation were performed in [11], without considerations of the engine dimensions or aircraft impacts, based on NASA’s WATE routine. The stage counts of compressor components and bypass ratios in [9] differed noticeably from those in [10,11]. Engine-efficiency-driven aircraft performance analysis based solely on technology level indicators is documented in [12]. Propulsion system integration and nacelle design [13,14], inlet and nozzle design [15,16], and principal aircraft design [4] publications do not address specific bare-engine components at all. Their topics, on the other hand, are simplified or neglected in this paper.
Various preliminary engine design systems have been presented and frequently reviewed in the literature. In addition to considerations regarding the mechanical and aerodynamic design of the components, such systems also provide the basis for cost assessments. It is common to couple several tools to achieve multi-objective modeling capabilities. As a commercially available example, the combination of NPSS (Numerical Propulsion System Simulation) [17] and WATE (Weight Analysis of Turbine Engine) [18] has been continuously developed [19]. Other software tools are mostly not commercially accessible, as they are in-house codes of research institutions and manufacturers. GESTPAN (GEneral Stationary and Transient Propulsion ANalysis) [20] can be coupled with WeiCo (WEIght and COst estimation) [21,22], which is also part of the TERA2020 (Techno-Economic Environmental Risk Analysis) software environment [23], or other Chalmers noise and emissions codes [24]. Additionally used by TERA2020 are TURBOMATCH [25] and PROOSIS [26], which are the basis of the optimization framework by [27]. GSP (Gas turbine Simulation Program) by the Netherlands Aerospace Centre (NLR) [28], GTlab (Gas Turbine Laboratory) by the German Aerospace Center (DLR) [29], EDS (Environmental Design Space) [30], and GTpy [31] are also developments from the academic field. Industrial developments include MOPEDS (MOdular Performance and Engine Design System) by MTU [32], PMDO (Preliminary Multi-Disciplinary Design Optimization) by Pratt and Whitney Canada [33], and Genesis by Rolls-Royce [34].
Mass estimation methods that are not reliant on detailed mechanical design were reviewed by [35]. Risk and cost are not part of this paper, nor are family concepts, such as those in [36,37]. Fundamental to this paper, the work by [38] covers engine components associated with the so-called gas generator, which consists of a high-pressure compressor, combustor, high-pressure turbine, and high-pressure shaft.
Supersonic flight imposes unique boundary conditions on the engine, such as high stagnation temperatures and wave drag, which result in design requirements differing from those of engines for subsonic transport aircraft. A previous study [6] concluded that the highest non-dimensional parameters, which are crucial for engine sizing, occur at the subsonic top of the climb, whilst the highest stagnation temperatures, which are crucial for secondary air system design and part lifing, are encountered at top-of-climb conditions and top speed. A variable-geometry exhaust nozzle is considered necessary to avoid thrust losses due to the range of nozzle pressure ratios applied. These findings were derived by using an aircraft model based on preliminary design methods, a matching cycle optimization, and a whole-mission simulation. Certification of such an aircraft requires compliance with regulations regarding engine noise during take-off. The compliance was regarded as feasible, as it was investigated against reasonable take-off distances of the aircraft model while maintaining a maximum jet velocity of 350 m/s, which was chosen as the upper threshold for jet noise based on [39,40]. Thus, no afterburner requirement could be identified for any of the missions or mission sections examined. As the most important seal of approval for aircraft performance, the achievable range also met preset demands. The present paper provides a more generalized analysis of possible engine cycles with engine architecture in mind. The impacts of engine technology selection are derived and discussed by using performance synthesis and preliminary design tools for aircraft and engine turbomachinery.

2. Materials and Methods

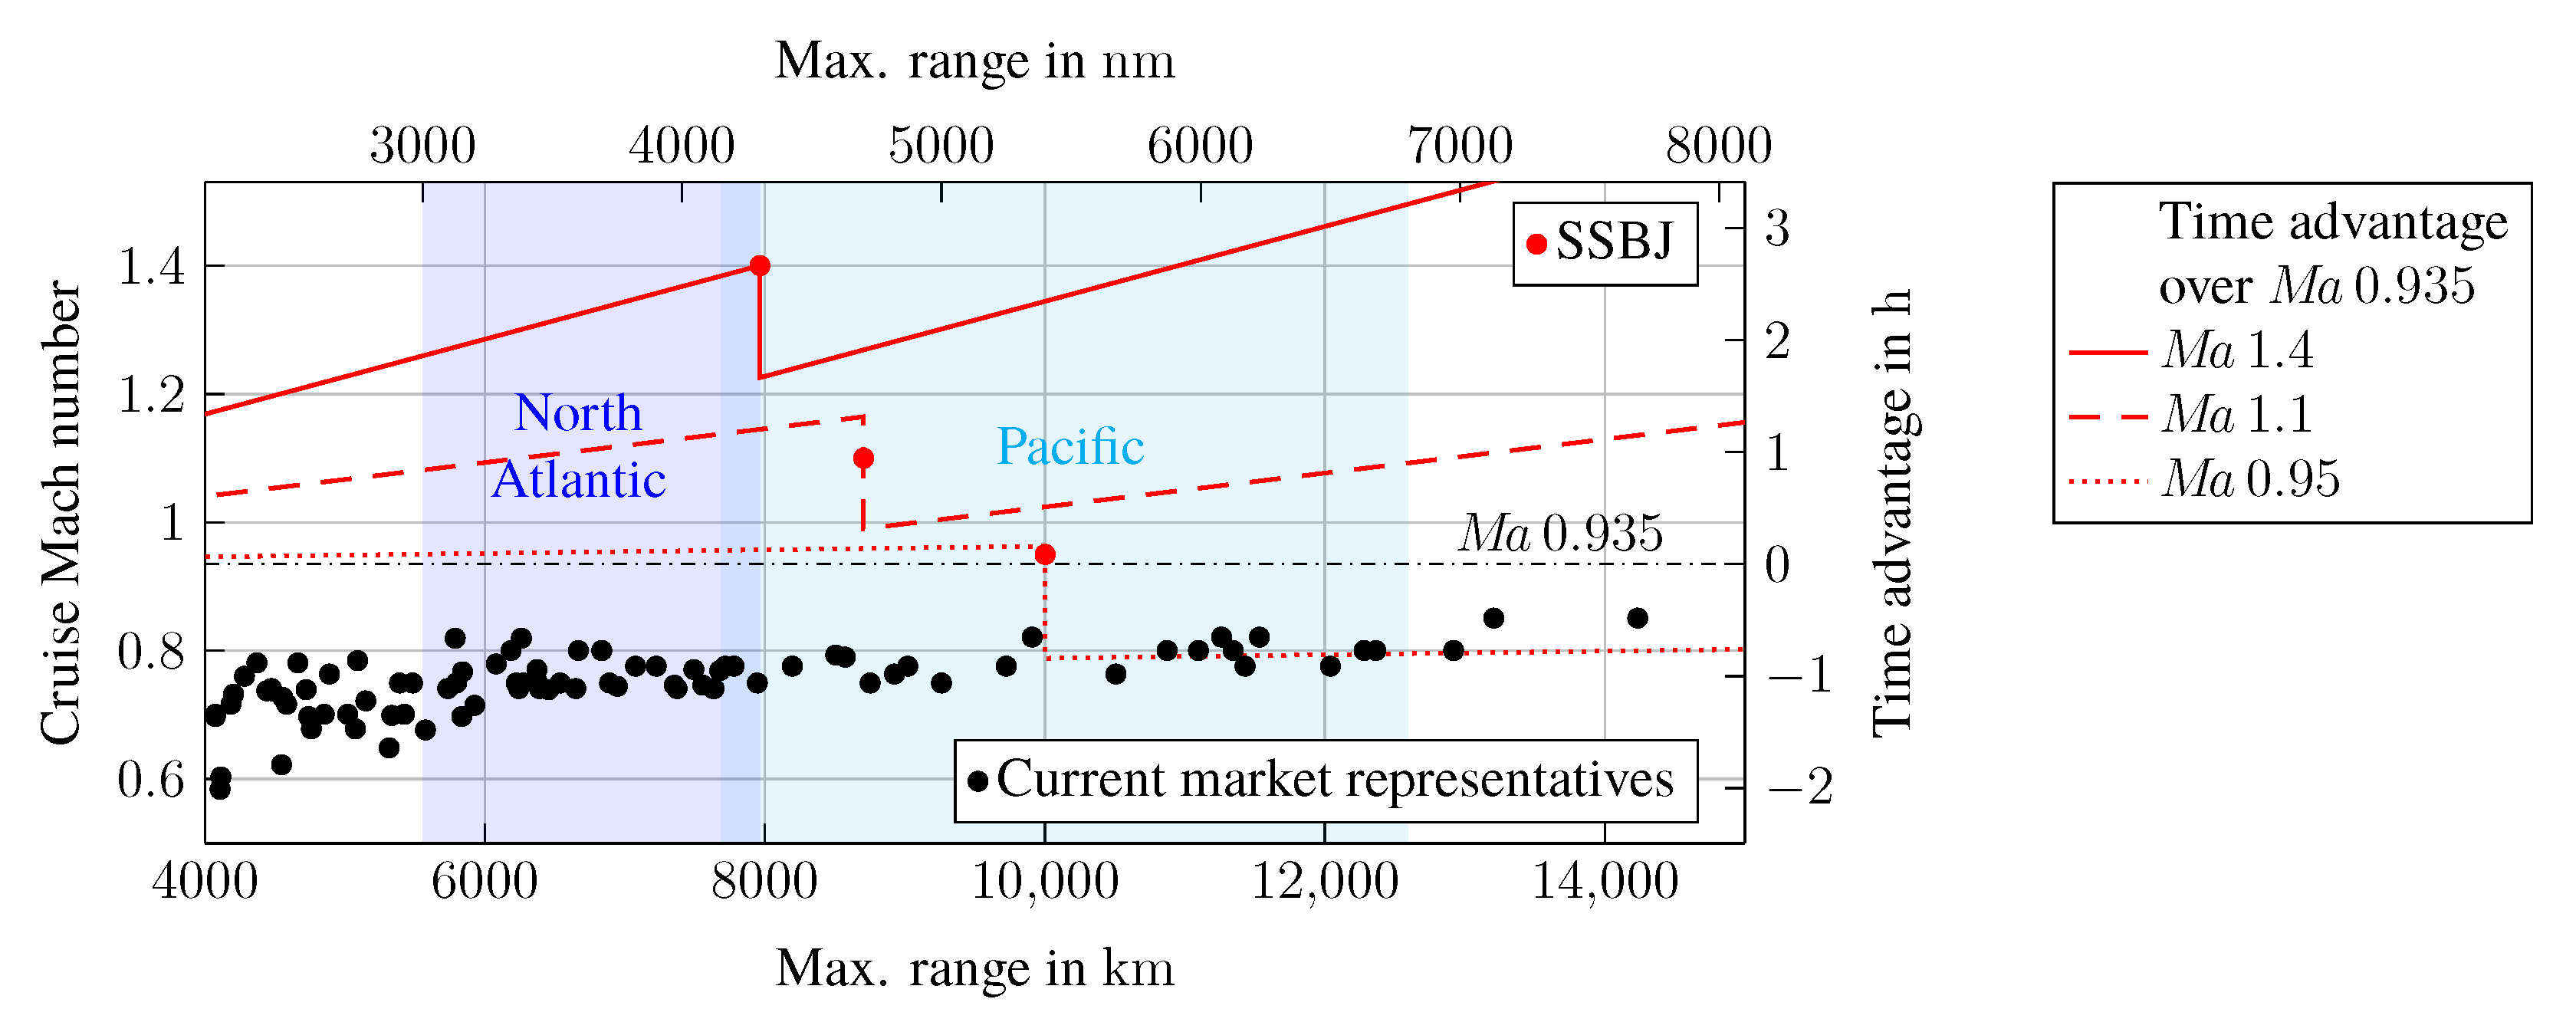
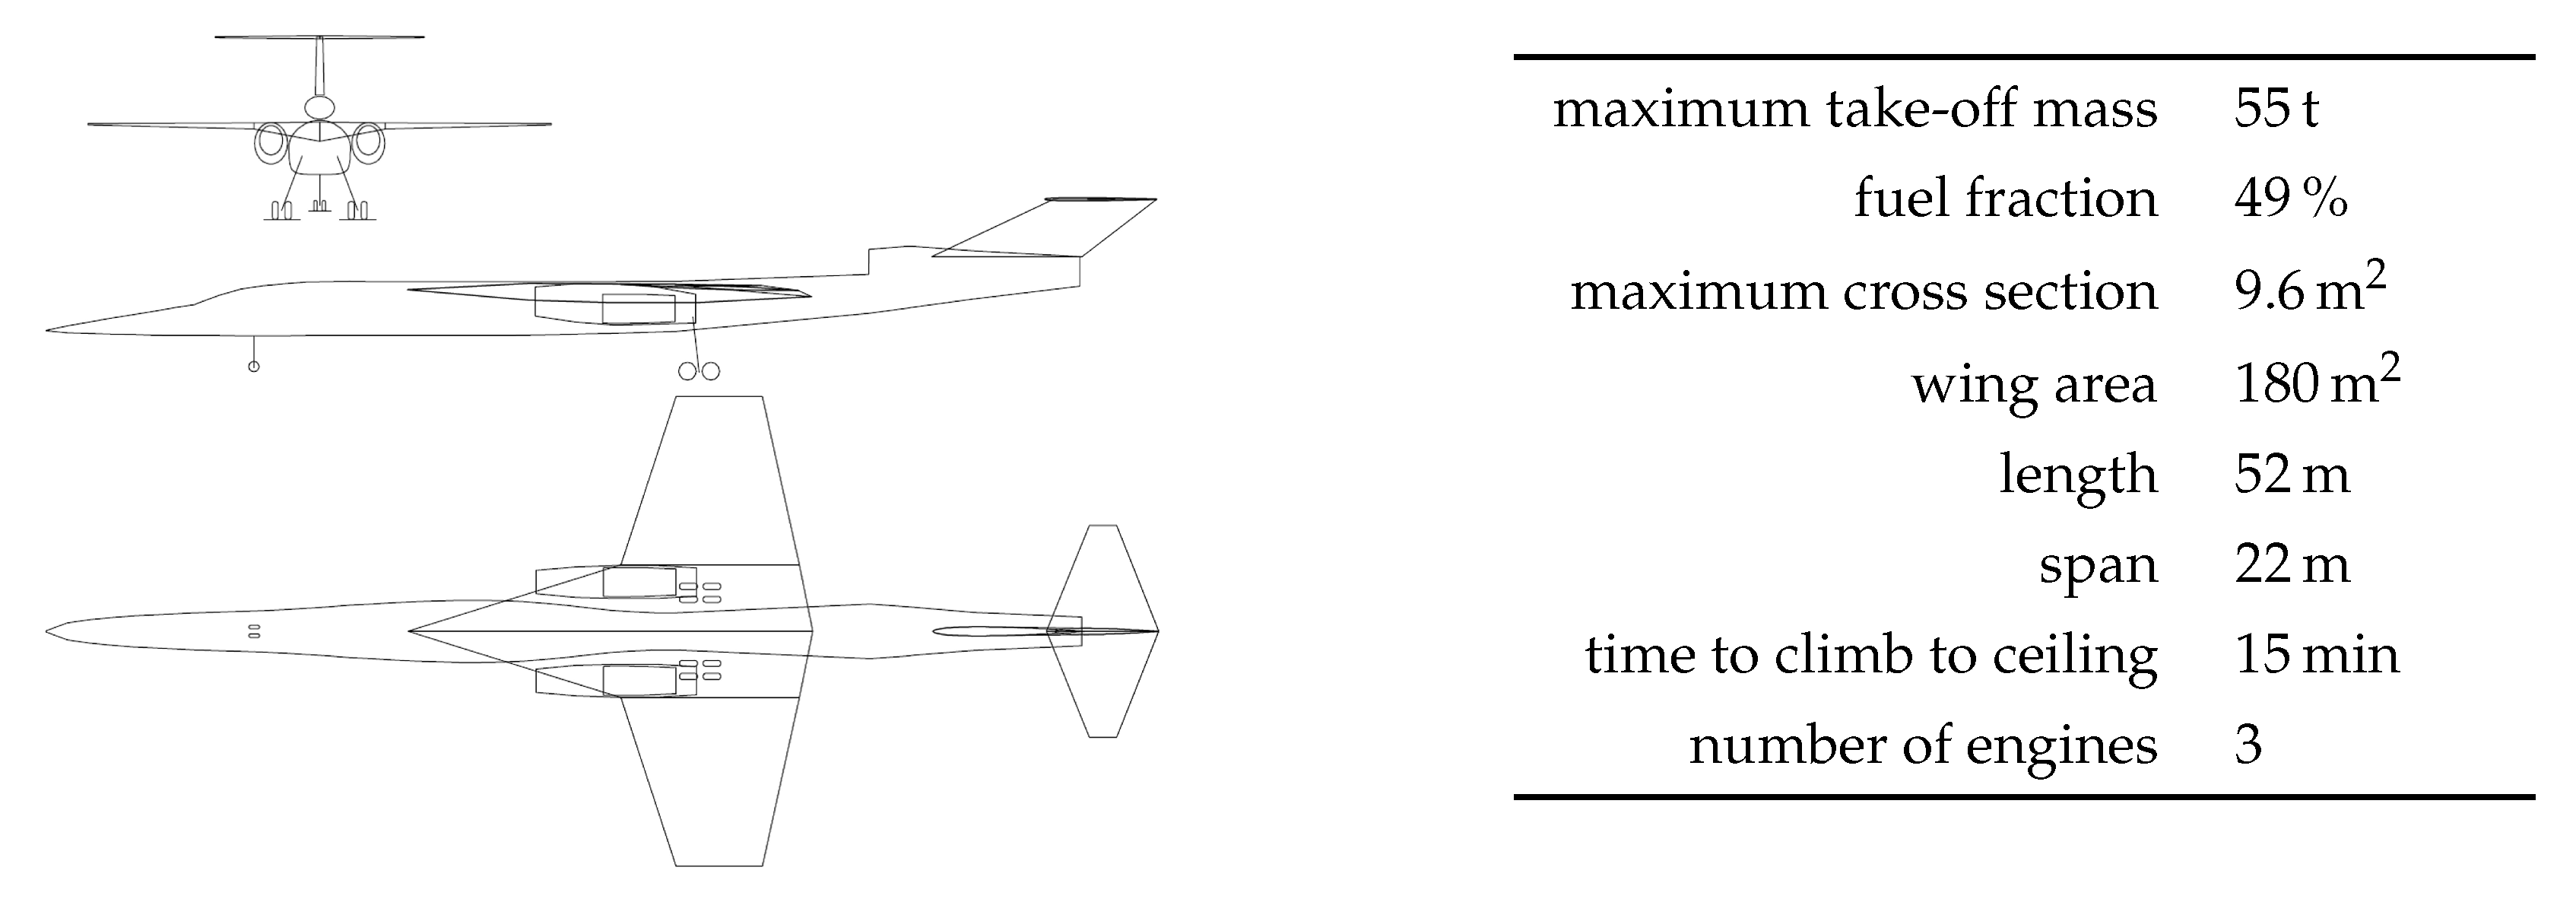
2.1. Reference Aircraft and Missions

All studies in this paper that were conducted at the whole-aircraft level were calculated using the aircraft preliminary design model from [6]. It was implemented in the preliminary design software Pacelab APD, which uses a variety of preliminary design methods. Many of them are semi-empirical and were gained from standard works, such as [41,42,43]. The design was driven by the findings of market analyses by [2,4,44,45] and the Aerion AS2 aircraft concept state before its last modification, which was the basis of [46]. According to the market analyses, the projected market niche is best met with an aircraft capable of covering the North Atlantic route spectrum with a design Mach number of 1.4 and a cabin for either a private jet layout or up to 19 business class seats. The model serves to conduct full mission calculations and to investigate engine-driven impacts; it makes no claim as the best feasible aircraft design approach.
The aircraft configuration depicted in Figure 2 features three engines to avoid difficult twin-engine operational performance standard clearance. The wing arrangement assumes large portions of natural laminar flow [4]. The resulting key aircraft parameters are also given in Figure 2. Exemplary engine cycle data had to be added in Pacelab APD in the form of an engine deck consisting of thrusts and fuel flows for various altitudes and flight Mach numbers, which were normalized by the sea-level static thrust. This setup allowed for engine scaling in terms of total air flow at the aircraft model level. Wave drag was estimated using a Pacelab-integrated code based on the Harris method [47,48]. Engine mass m engine for the aircraft model was estimated by
m engine = 12.24 · F N , ref 1 k N · 1 1 1 + 3 / 4 · BPR + 10 · OPR 1 / 4 · m ˙ / ( 1 k g / s ) 1 + BPR ,
which was given by [35], depending on the engine reference thrust F N , ref and the corresponding total air mass flow m ˙ , as well as the engine bypass ratio BPR and overall pressure ratio OPR .
The flight mission calculation was performed in incremental steps of altitude and time. The mission profiles that were attached to the aircraft model were adopted from [6]. They were based on commercial airliner climb path structures, which were complimented by a climb cruise segment and a fuel-optimized descent. The climb segment started with an initial climb below 10,000 ft, where an air-traffic-control-imposed speed limit of a calibrated air speed of 250 kts applied. Above 10,000 ft, a speed schedule of a constant calibrated air speed followed by a constant cruise Mach number, as soon as it was reached, dictated the climb. The rates of climb were, therefore, adjusted to available thrust and air traffic control advice, but may not be less than 300 fpm. The calibrated calibrated air speed air speed was set to 400 kts, which was derived from the Concorde climb profiles and exceeded the climbing air speeds of subsonic aircraft by far. Using this climb profile and a supersonic cruise Mach number, the so-called sound barrier at Mach 1 was met just before reaching 30,000 ft. Using the exemplary engine cycle from [6], only a comparably small rate of climb reduction was needed to pass the sound barrier, so a constant-altitude acceleration and even a dive were not mandatory.
The initial cruise altitude could be optimized for each applicable cruise Mach number or selected if avoidance of traffic dictated the choice. In this paper, the requirement in [6] to climb to ceiling altitude at lower air speeds than those given by the design Mach number, even in a subsonic mission, was also respected. Optimized initial cruise altitudes for subsonic cruise speeds are way below airliner cruise flight levels and are triggered by the aerodynamic design of the aircraft model, which is intended for supersonic flight. However, avoiding any traffic is considered valuable for saving time, at least when the maximum achievable range is not needed in a mission. In case initial cruise altitudes above those of airliner and state-of-the-art business jet traffic are desired, the aircraft model indicates enough residual climbing ability using the engine cycles described in later sections.

2.2. Engine Cycle Design

The specifications outlined in the previous sections determine the cycle design point in off-design mission top-of-climb conditions. For this paper, this means a free-stream Mach number of M a 0 = 0.95 at 14,111 m of altitude. Following the approach and results of [6], only engine cycles are regarded that can be assigned to a two-spool mixed turbofan engine configuration with a variable nozzle and no booster. Two examples of this configuration are provided in Figure 3. Since no afterburner is needed, the nozzle throat area is kept constant, while the expansion ratio is set by a variable exit area. In addition, technological boundaries are chosen and applied to the cycle calculations.
An upper limit is considered for the compressor exit temperature T t 3 . This is a material-related boundary condition limiting the overall pressure ratio Π ov of the engine in the design mission. A rather conservative value of T t 3 , max = 915 K was used by [6] to compensate for the small mission-related margin between the highest occurring temperature and the temperature range during a supersonic cruise. As a short-term limit, [49] gave T t 3 , max = 950 K . The compliance of the regarded engine cycles with these limits is discussed in later sections. A fixed proportion of the inner and outer fan pressure ratios is assumed to be Π Fan , i / Π Fan , o = 0.8875 per fan stage based on [50,51]. For low-bypass-ratio fans, comparably to military designs, this is dispensable by assuming a fan blade design with constant span-wise work distribution. The fan pressure ratio in the outer fan section is assigned values between 1.6 and 1.8 per fan stage. Equality of the bypass and core stream exit pressures is assumed, since the theoretical optimal ratio of the two is close to one even for off-design behavior throughout the whole flight mission [52]. A metal temperature limit is set for the high-pressure turbine vanes and blades. Possible values can be obtained from [53,54,55], where a maximum of 1323 K is still considered to provide sufficient creep life. A more conservative value of 1273 K is selected for this paper to also allow for safety against high-temperature corrosion, and again because of the comparatively small temperature differential between the top of the climb and cruise. The metal temperature imposed on the cycle dictates the cooling air flow m ˙ cooling for each turbine passage through
m ˙ cooling / m ˙ gas , passage m ˙ cooling / m ˙ gas , passage + 0.03 = T t , gas , passage T metal T t , gas , passage T t , cooling ,
where the constant 0.03 is a technology parameter for the cooling effectiveness, as described by [52]. To allow for single-stage and two-stage high-pressure turbine designs, one cooling flow is calculated for the stage 1 vane and a second flow is calculated for the entire remaining turbine, conservatively neglecting the temperature drop in a two-stage turbine.
Since a fixed-geometry streamline-traced inlet, as designed by [16], is assumed and no corresponding performance map is available,
p t 2 p t 0 = 0.99 · 1 0.075 · M a 0 1 1.35
gives a semi-empirical inlet total pressure ratio p t 2 / p t 0 based on MIL-E-5007 [56]. The preceding factor takes pipe friction losses into account. A nozzle thrust coefficient is applied based on NASA measurement data from [57,58], where the variable area ratio is assumed to result in nearly constant values for the regarded flight envelope.
Cycle calculations were performed by using the NPSS software. In order to produce a design chart for the engine cycles, the turbine inlet temperature and the total pressure ratio were varied. Different fan stage numbers were set through corresponding exponentiation of the fan stage pressure ratio and the high-pressure compressor pressure ratio results thereof. Full-mission analysis using the aircraft preliminary design model requires engine decks that are generated in the off-design calculation mode. For these off-design calculations, component maps from the GasTurb software were used instead of standard NPSS maps.

2.3. Preliminary Engine Design

2.3.1. Principal Modeling Structure and Capability

The Institute of Aircraft Propulsion Systems at the University of Stuttgart is developing preliminary design software tools for aircraft engine components. Their basis lies within the structural and geometrical similarities of marketed engine components, which are caused by applicable physical principles. The tools have a modular structure of components and subcomponents, which is analogous to that of popular performance tools. The implementation took place in C# in the Pacelab Suite development environment.
In the work by [38], this was performed, validated, and described in detail for core engine components and their subcomponents. In the process, suitable design laws from the fields of thermodynamics, aerodynamics, and mechanics were introduced. A high-pressure compressor and high-pressure turbine flow path and blading were aerodynamically designed using the mean-line and vortex methods. Radial profile distributions and Boolean operations delivered the geometry of single-rotor blades and stator vanes, while the blade root size was determined by using beam theory methods. Using a 2D finite-element method, the displacement equation was solved for the compressor and turbine disks, and the stress levels were determined. This resulted in characteristic shapes of the disks. The casing design calculations were supported by semi-empirical formulas that covered pressure tube dimensioning and blade containment. The combustor design neglected combustion and emission optimization and used combustion volumes and reference velocities to provide annular dimensional shaping.
In order to use the potential of the modular structure of the tools, design bricks were used for the mechanical design. The design bricks contained all of the required mathematical correlations and interrelationships and could form and incorporate entire components, as well as subcomponents. The properties of the working gas were determined from a fluid model, such as that described by [59,60]. Materials could be assigned to all components in order to map meaningful physical properties. The material properties were compiled in a database from publicly available data. In some cases, not all required material properties were available due to the source situation, so the missing values were estimated from relations of comparable materials. User inputs had an important role in defining assumptions and the technology level.
In the scope of the tools, not all conceivable parts of detailed designs are included. This is mainly due to necessary simplifications and the reasonability of reproducing parts through preliminary design methods. Some examples of parts that are not included are inlet casings, intermediate casings, and outlet casings, any bearings, bolts, and nuts, seals and corresponding disks or disk arms, vortex reducers or inducer disks, any actuators and valves, fuel and secondary air system piping, and heat shield panels. In addition, realized engines can contain individually optimized geometries that cannot be represented by the generalized geometries of the tools. These simplifications should be kept in mind when considering the results obtained. Apart from the simplifications, good geometric compliance of redesigned components with published designs is generally achieved [38,61,62]. The influences of the simplifications on the estimated total mass of the components were given, for example, by [63]. A mass estimation of a preliminary design created with the presented tools additionally requires calibration of the methods, as is the case with other tools [63]. When calibrated, deviations of up to 10% have been observed for individual parts [38].
Single components can be coupled by means of geometric, mechanical, and thermodynamic interdependencies to form assemblies. For this purpose, they were arranged in sequence at geometric interfaces, while the input and output variables of corresponding engine stations were passed on. The secondary air system was not modeled in detail, as it was by [64], but cooling air mass flows could be transferred across component boundaries. The temperature increases inside the rotating geometry of the turbomachinery components were taken into account by the corresponding increments. Power balancing and equal rotational speed of components connected by shafts could be set via a shaft module.
The work by [38] especially demonstrated the potential of the developed tools for scaling investigated components, investigating the effects of the scaling, and evaluating design decisions. Parametric geometry generation was automated within it. Trends in masses and dimensions can be easily examined. For this paper, the tool scope was extended to include a fan section and a low-pressure turbine. Transition ducts were also at hand. Since the fan dimensioning was based on the structure of the high-pressure compressor dimensioning and the low-pressure turbine dimensioning was based on the structure of the high-pressure turbine dimensioning, the respective basics, adaptations, and additions are explained in the following sections.

2.3.2. Fan-Section-Related Preliminary Design Tool Changes

For the development of a tool for the generation of fan models, the general program structure was taken over from the existing high-pressure compressor tool. At the main component level, the thermodynamic and aerodynamic design of the fan section took place. The thermodynamic design concerned the parameters given by the engine cycle. The aerodynamic design determined the flow path, flow angles, and numbers of blades. The main component was mainly composed of stages with a rotor consisting of a disk together with blades, a stator, and a casing. In addition, the geometric representation of a spinner as the foremost subcomponent was made possible. The options of the high-pressure compressor tool for inlet and outlet guide vanes were omitted. At the stage level, the optional inclusion of a splitter was made possible, as visualized in Figure 4. This allowed fan stages to be designed with two different geometric features. If the splitter was used, the result was a fan stage comparable to most civil turbofan engines. Here, in the direction of the flow, the splitter directly followed the rotor, and correspondingly, separate rows of guide vanes were created in the core and bypass flows. Without the splitter, only a single row of stator vanes followed the rotor, and the splitter was placed behind it as an additional subcomponent. This resulted in a fan stage comparable to those of military turbofans.
As with the high-pressure compressor, no prediction of efficiencies was provided for the main component, since an input of polytropic efficiency was made by the user as an indication of the technology level. The methods for generating a stepless flow channel were identical to those of the high-pressure compressor tool. They were semi-empirical correlations that imposed axial velocity distributions for all component planes and were described in detail by [38,65]. The work distribution in the radial direction could be modeled in different ways. While for short blades, as in the high-pressure compressor tool, a constant-work design was reasonable, for long blades, the specific work near the hub could be set to be smaller than the outer area of the blade. Possible distributions, such as those shown in Figure 5, were given, for example, by the pressure ratio distributions according to [62,66] or—more up to date—according to [51]. Near the hub, both distributions indicated a comparatively low pressure ratio, which was associated with a stronger deflection at a lower circumferential speed according to Euler’s turbomachinery equation. While the distribution from [66] showed its maximum at about two-thirds of the blade height and, again, smaller values towards the blade tip to avoid flow separation, the progression of the modern transonic design [51] did not show this behavior.
The calculation of the aerodynamics was greatly simplified compared to the methods of computational fluid dynamics or streamline curvature methods [67]. However, the applied neglect of radial flow components according to [68] was not significantly different in the fan from that in the higher-order methods. As in the high-pressure compressor tool, the primary objective was to map a reasonable blading. This was done analogously to the high-pressure compressor in a first step of performing a mean-line calculation, followed by a multilateral calculation to determine the distribution of the flow angles over the blade height, from which typical twisted blade geometries resulted. The blade numbers for each stage were calculated with respect to the Lieblein/diffusion factor by using the method described by [67]. For the multilateral calculation, the use of vortex methods [69] in the high-pressure compressor tool was adopted for constant-work designs. The method was described in detail by [69,70]. For non-constant work designs, a solution was also sought by using the vortex method. If no solution was found, this allowed compliance with the implemented limits, such as a reaction and axial flow criterion at the hub, and the blade was divided into several segments. Here, a correction using methods by [62] was applied to the mean radius of each segment. Since the limits for aerodynamic parameters, such as the DeHaller number and diffusion factor, vary widely in the technical literature, both were left as user inputs, as in the high-pressure compressor tool. However, the definitions for the flow coefficient and work coefficient were introduced for the hub section by using meridional velocities. With these, the limit values for the DeHaller number and diffusion factor could be tested specifically on the hub.
At the blade level, double circular arc profiles or multi-circular profiles were used to generate the geometry. Analogously to preliminary work by [61,62], the disk calculation was modified in such a way that the occurring loads were distributed over up to three disk bodies. This corresponded to the inspection of realized fan disks and compensated for the limited installation space with small hub-to-tip ratios according to [71]. The casing calculation remained methodologically almost unchanged, whereby the dimensioning of the containment was carried out according to [38,62]. The described procedure was validated by [61] for flow path parameters and by [62] for an entire fan stage of a medium-range commercial aircraft.

2.3.3. Low-Pressure-Turbine-Related Preliminary Design Tool Changes

For the development of a tool for the generation of low-pressure turbine models, the general program structure was taken over from the existing high-pressure turbine tool. The general procedure was very similar to that used for the compressor components. At the main component level, the thermodynamic and aerodynamic design of the fan section took place. The thermodynamic design concerned the parameters given by the engine cycle. The aerodynamic design determined the flow path, flow angles, and numbers of blades. The main component was entirely composed of stages with a rotor consisting of a disk together with blades, a stator, and a casing. A greater stage number was made possible compared to the maximum two-stage high-pressure turbine tool. The bore diameters of the disks were decoupled from each other. Possible resulting component geometries can be taken from Figure 6.
The number of stages is entered by the user. Therefore, the feasibility of the mechanical design must be considered during the application. Again, a mean-line calculation is performed to determine the main gas path parameters. This incorporates the suggestions by [72] for the axial velocity distribution. Blade numbers are determined for each stage using the method devised by [73], with the inclusion of the Zweifel number. The methods for blade cooling, if desired, are taken from the high-pressure turbine tool. The work distribution among the individual stages must be made by the user. Thus, the extent to which the aerodynamic exploitation is restricted for the first and rearmost stages can be adjusted as desired in order to compensate for suboptimal inflow conditions caused by the high-pressure turbine and to achieve as axial a discharge flow as possible. By default, an equal distribution of work between the stages is otherwise expected. For the multi-section calculation for determining the flow angle distributions in the radial direction, the method from [69] is used. If no reasonable solution is found here, the free vortex method is used. As a final safeguard, a distribution according to [74] can be carried out under the assumption of a constant exit flow angle. In contrast to the tools for the compressor components, the efficiency of the low-pressure turbine is calculated. In the low-pressure turbine tool, the loss correlations according to [75,76] are implemented. As [69] states, the two give quasi-concordant results. This can also be confirmed for the designs presented in this paper.

2.3.4. Application to the Study

To investigate the scaling behaviors of the components of the low-pressure system, parameter studies were carried out for a fan and low-pressure turbine. A detailed study of the scaling of the components of the core engine was provided by [38]. In the fan section, the hub-to-tip ratio was varied for a single stage. In addition, several values were used for the circumferential Mach number of the blade tip and for the axial inflow Mach number. According to [71], reasonable circumferential Mach numbers are in the range of 1.4 to 1.6, so this range was used for the study. Following [50], the axial inflow Mach number should not exceed 0.6, as otherwise, the flow channel will be blocked by the blades if the number of blades is reasonable. On the other hand, low axial inflow Mach numbers require a strong flow deceleration from the free-stream Mach number of the engine, which is associated with shock losses. In addition, after deceleration of the flow below the speed of sound, a corresponding length of the inlet diffuser causes associated frictional losses. Therefore, the axial inflow Mach number was only varied between 0.5 and 0.6. The effects of the variations on mass fractions, dimensions, and mechanical and aerodynamic feasibility were investigated. The technology level was determined by the selected boundary conditions. For example, reasonable values were chosen for efficiency and the blade aspect ratios, which were related according to [77]. To investigate the low-pressure turbine design, a comparison of conceivable architectures and aerodynamic loads was sought. For this purpose, the number of stages, the general flow path layout, the flow coefficient, and the work coefficient were varied.

3. Results

3.1. Engine Cycle Analysis

Performing cycle calculations as previously described resulted in the design space depicted in Figure 7. The cycle design space was reduced depending on the applied boundary conditions. The boundary conditions applied herein resulted in distinct regions of the plane of total efficiency and specific thrust, which were separated by the outer fan pressure ratio Π Fan , outer . The basic structure was the same for all of those regions; an example is illustrated in Figure 8. Applying a compressor exit temperature limit of 915 K excluded cycles with overall pressure ratios higher than about 37.5 . Additionally, cycles with comparably high turbine temperatures were disregarded due to unrealistic turbine cooling air needs.
The given values for the outer fan pressure ratio allowed for an easy identification of different numbers of fan stages that were equal to the pressure ratio exponentiation. A further criterion was introduced to distinguish between core engine architectures. For example, to distinguish between engine cycles involving either a single-stage or a two-stage high-pressure turbine, a maximum high-pressure compressor pressure ratio that can be provided by a core engine with a single-stage high-pressure turbine may be specified. In Figure 7 and Figure 8, this distinction is shown as an example for a high-pressure compressor pressure ratio of 12. Three-stage fan-based cycles were neglected for the present case for their overall low total efficiency level and resulting aircraft performance, as presented in the following section. Therefore, in the present case, combinations of low-pressure systems with single- or two-stage fan and core engines with a single- or two-stage high-pressure turbine are conceivable.
Caution is advised when evaluating the cycle data. Cycles with lower fan pressure ratios generally exhibit the greatest overall efficiencies. This is caused by the gain in propulsive efficiency associated with low specific thrusts. To provide the required thrust, however, a larger air mass flow is needed. This is accompanied by a correspondingly increased fan diameter, which, in turn, has an effect on the nacelle mass and, especially, the wave drag. Ultimately, it is not the overall efficiency or the specific fuel consumption that is decisive, but aircraft performance in terms of achievable range and take-off distance at a limited jet velocity.

3.2. Effects on Aircraft Performance

This section provides study results that highlight impacts of dry engine weight, fan diameter and total efficiency with regard to aircraft mission capability. First of all, Figure 9 shows the correlation between engine dry mass and aircraft range for engines of different aircraft-to-engine-size ratios. For this illustration, the engine dimensions in the aircraft model remain unchanged in each case when mass is varied. The exchange rates between engine dry mass and range are almost identical for the two considered supersonic business jet engine dimensions. In absolute values, they are also similar to that of two single-aisle medium-haul commercial aircraft used for comparison. The absolute exchange rate of a twin-aisle long-range commercial aircraft, on the other hand, deviates significantly. When relative changes are considered instead, the two supersonic business jet exchange rates remain almost identical, but are more comparable to that of the long-range airliner.
In a second step, cycles from the previous section were applied as engine decks to the aircraft preliminary design model. The thrust requirements of the aircraft determined the air mass flow through the engine. Higher air mass flows were taken into account by using larger fan diameters. The effect was exaggerated because the additional wave drag for larger fan diameters added to the thrust requirements. The results are given in Figure 10, where the overall efficiency axis from Figure 7 is replaced by an aircraft range axis, while the four coherent areas from Figure 7 are still well differentiable. It is evident that the engine with the highest overall efficiency does not achieve the optimal aircraft range. The range optimum instead lies with the most efficient two-stage fan-based engine cycle. This means that the effects of fan diameter and engine mass are not fully compensated by the better overall efficiency due to the lower specific thrust.

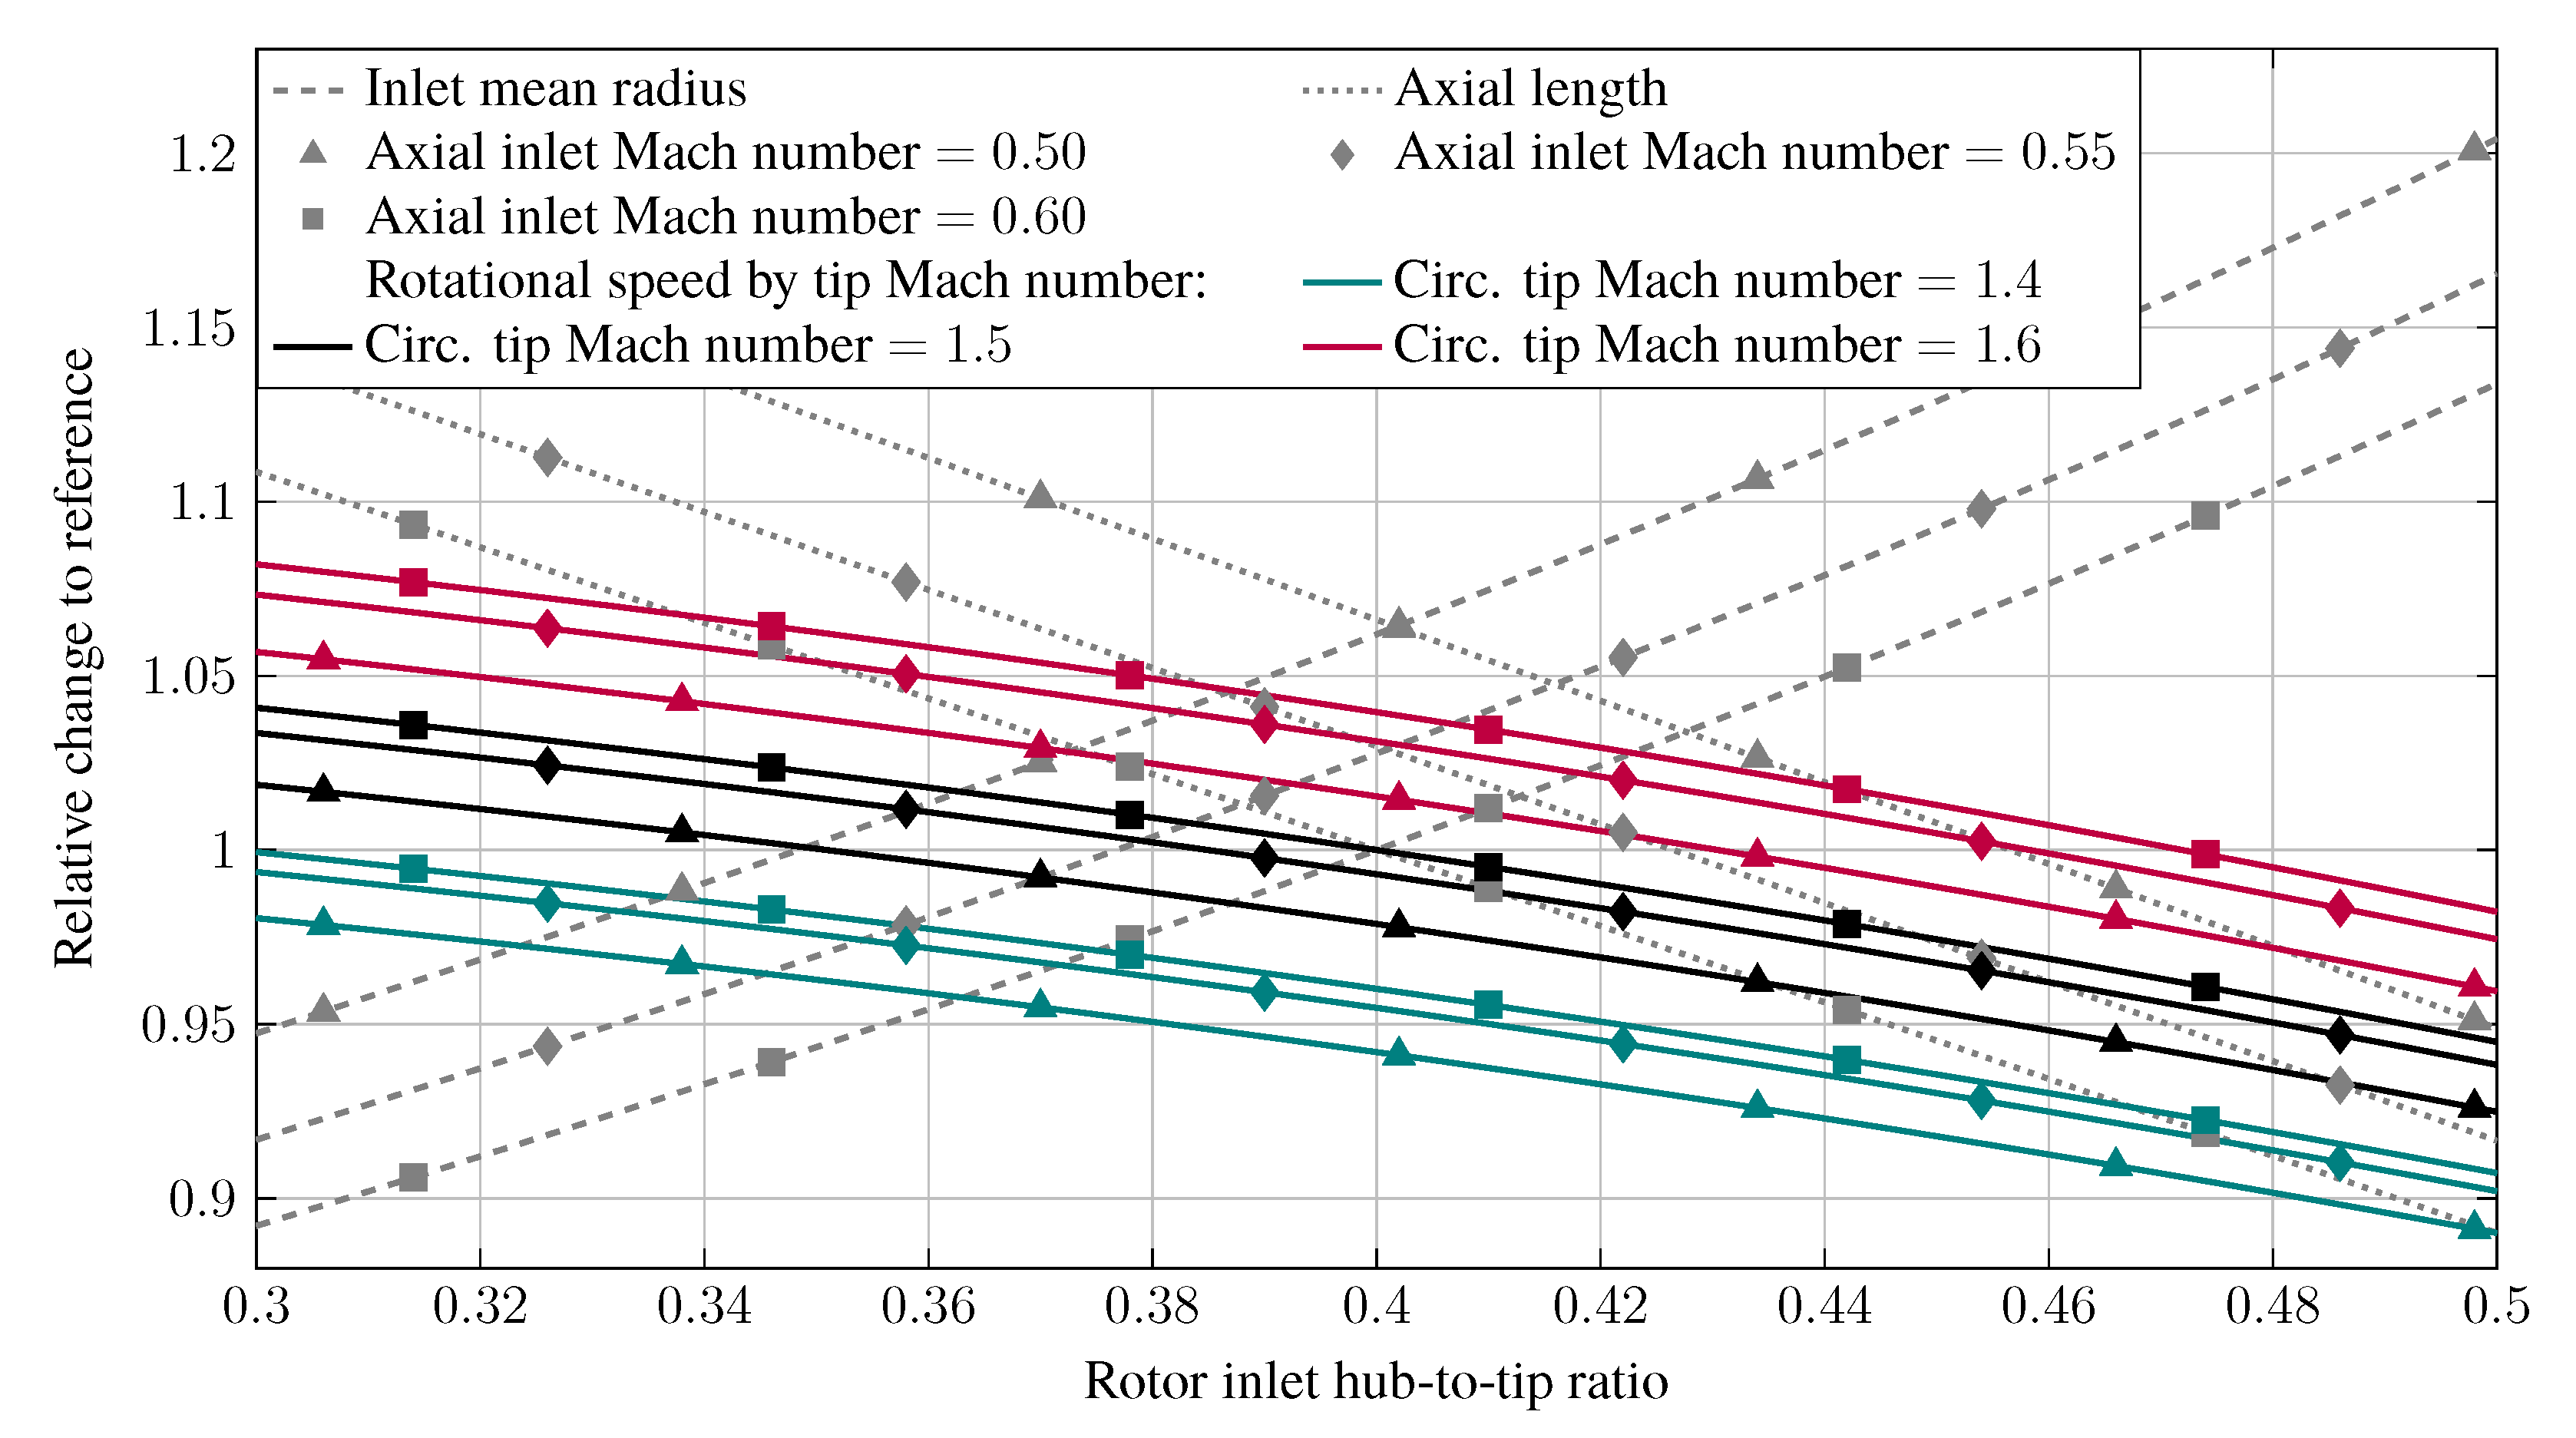
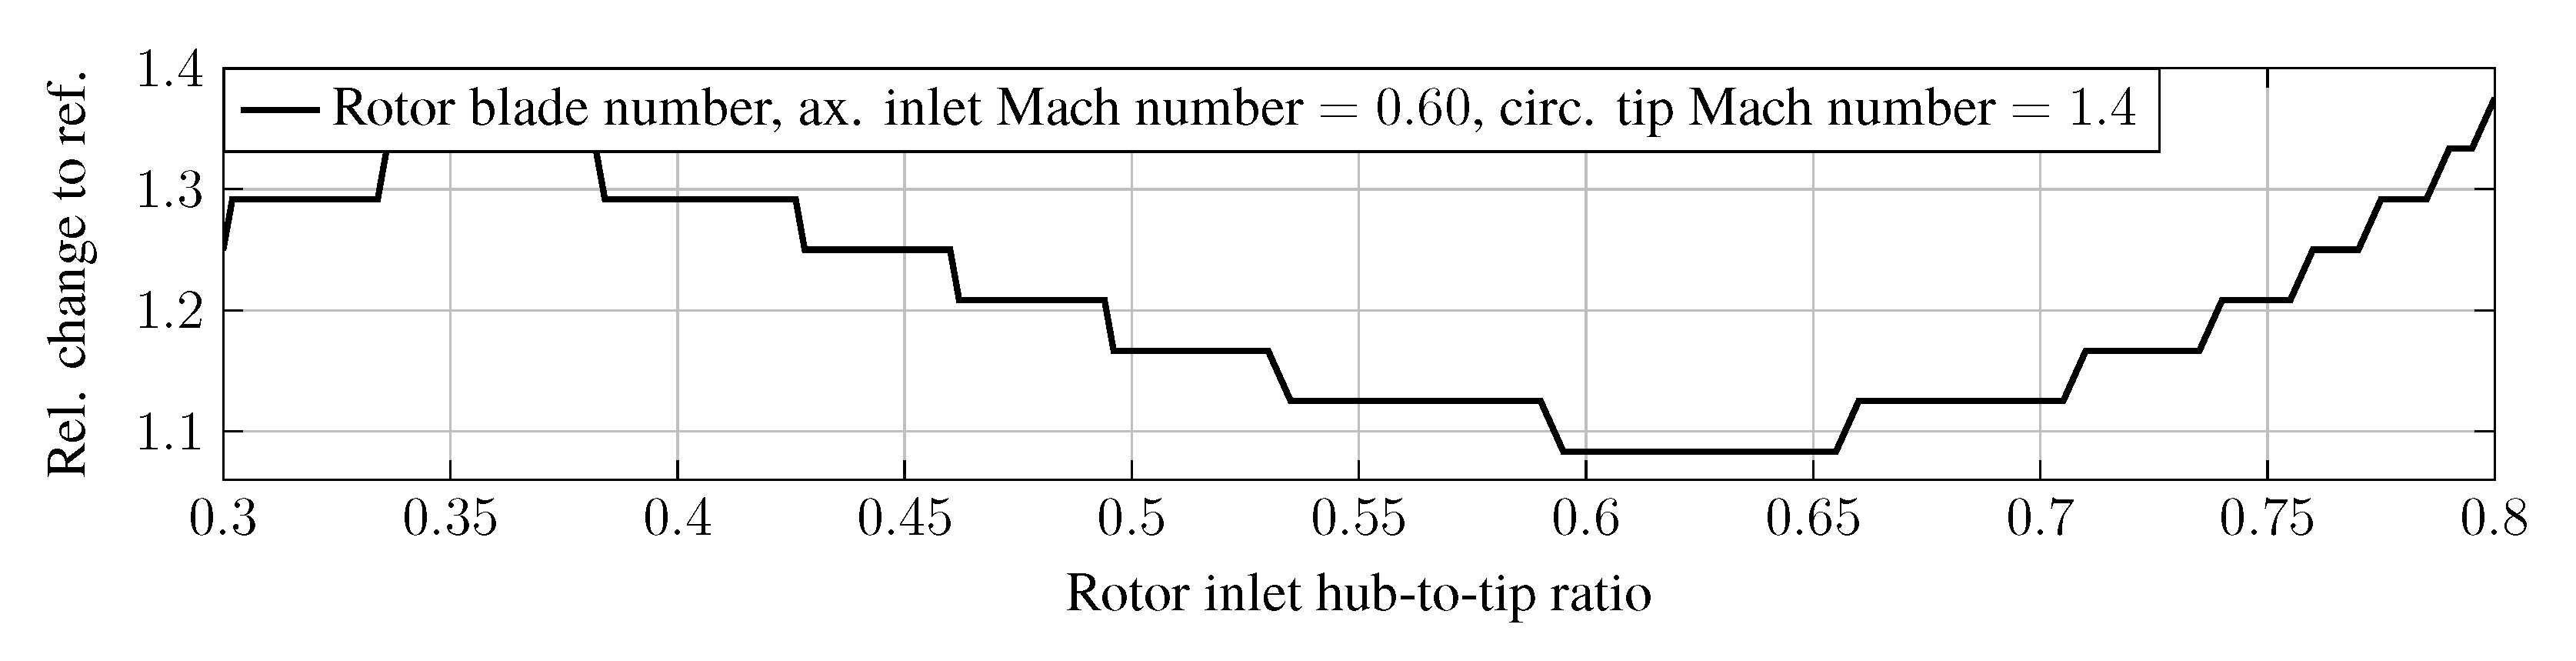
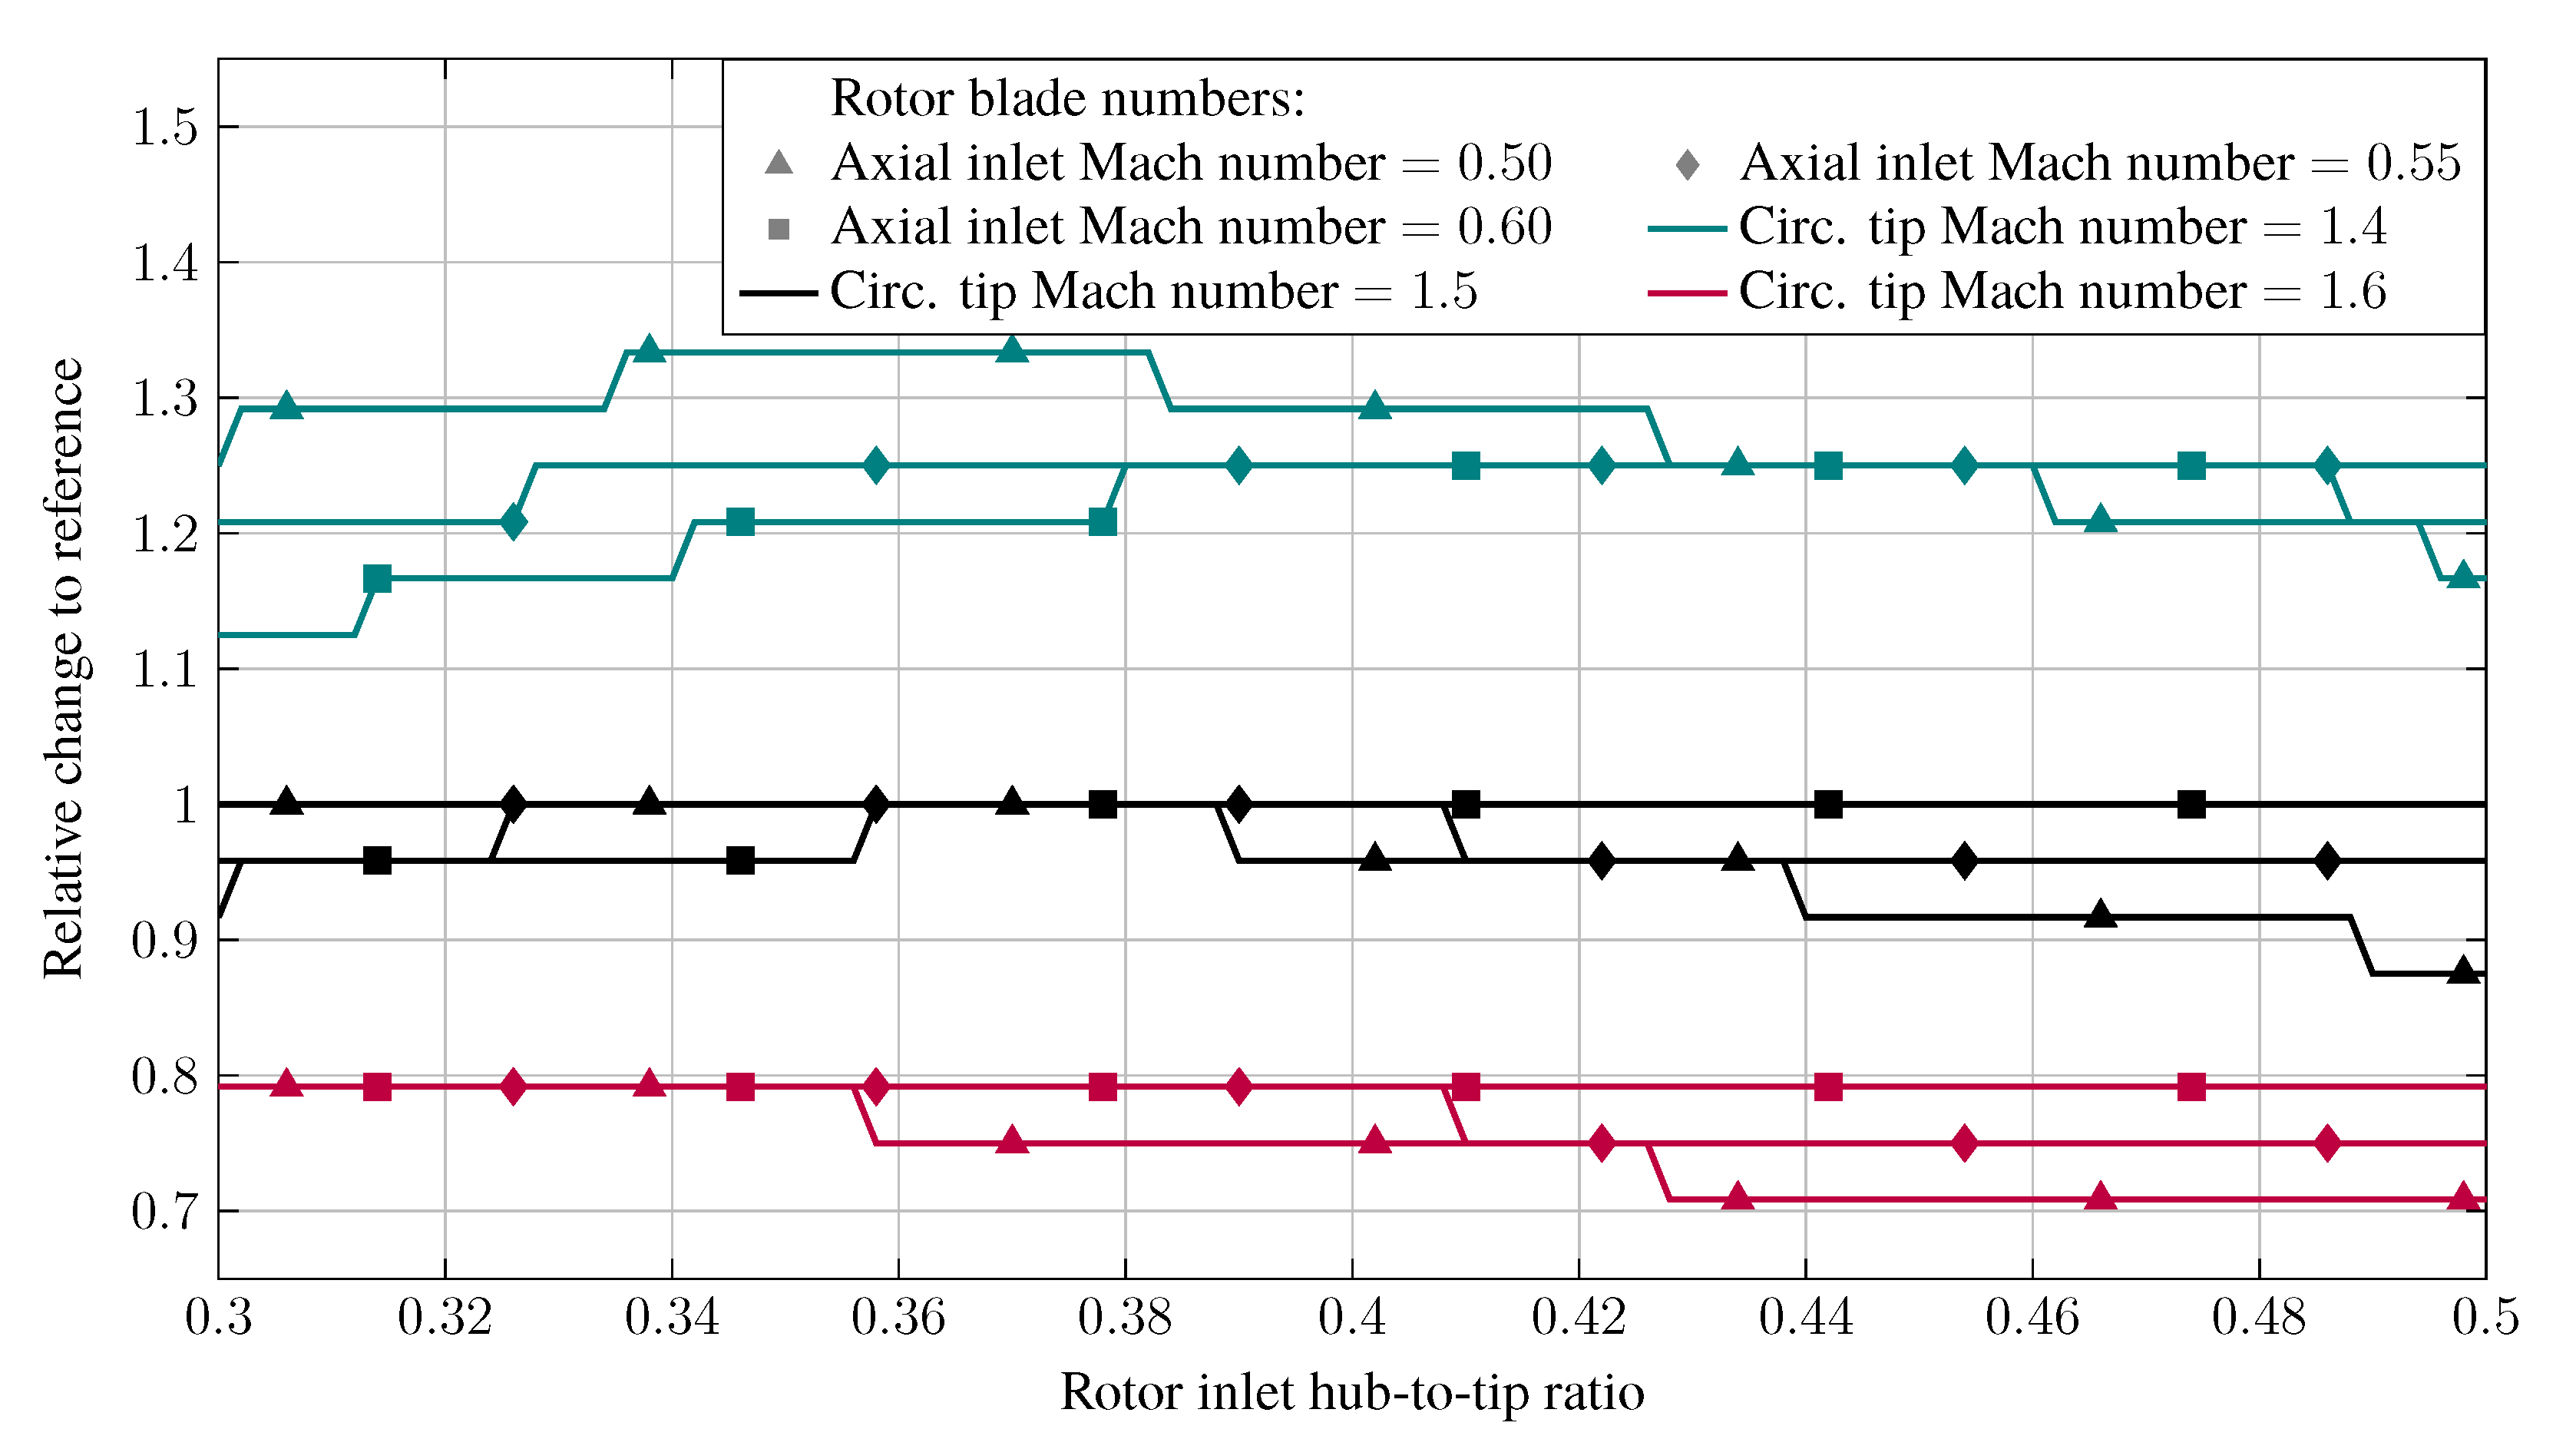
3.3. Fan Section Studies

On the basis of the engine cycle that promised the best aircraft characteristics in terms of range, the first of two fan stages is used as an example for reference. The examination of this single stage is sufficient, since other fan stages are subject to the same design rules. So, a second fan stage would show similar behavior. The design of the reference stage, summarized in Table 1, is based on empirical values from the basic literature. The axial inlet Mach number should be less than 0.6; otherwise, blockage of the rotor blades is to be expected [50]. Existing multi-stage fans—three military fans are used for comparison—have an outer diameter that decreases with fan section length. The reason for this was assumed to be the ability to compensate for thermal expansion, and the outer diameter progression was adopted for the reference fan stage. The reference fan stage also served as a power, rotational speed, and geometrical benchmark for the low-pressure turbine studies presented in the following section.
For the present design study, the hub-to-tip ratio, the axial inlet Mach number (0.5 to 0.6), and the circumferential Mach number at the blade tip (1.4 to 1.6) were varied, and the resulting fan stage designs were analyzed. The subjects of the investigation were dimensions of the gas path, part masses, and estimated aerodynamic loading of the reference fan rotor. For three values of both of the varied Mach numbers and in dependence on the hub-to-tip ratio, Figure 11 shows the inlet mean radius, the rotational speed, and the axial length. The inlet area only changes with the axial inlet Mach number, as the total inlet pressure and temperature, as well as the inlet mass flow, remain unchanged. Therefore, the blade height decreases with the increase in the hub-to-tip ratio. Each combination of an axial inlet Mach number and a circumferential tip Mach number results in a new decreasing rotational speed curve. With the blade and vane geometry parameters unchanged, there is also an inlet Mach number interdependency with the axial stage length, which is almost independent of the circumferential tip Mach number. Since the stage pressure ratio and efficiency are unchanged, for a given hub-to-tip ratio, a greater axial inlet Mach number gives a smaller axial length.
Finally, with an increasing hub-to-tip ratio, blade numbers according to [67] (see Equation (4)) increase for smaller blade heights h blade and larger mean diameters d mean , but decrease for smaller flow turning v u 2 v u 1 and larger passage inflow velocities v 1 . By evaluating the blade number equation
N = π · d mean · AR · v u 2 v u 1 2 · h blade · v 1 · DF 1 + v 2 / v 1
as depicted in Figure 12 over a wider range of hub-to-tip ratios than [38] did for high-pressure compressors, it becomes clear that different effects actually dominate in different spans of the hub-to-tip ratio with this method. For example, the increase in the blade number with the hub-to-tip ratio found for high-pressure compressors [38] does not necessarily apply to the range practicable for fan stages. Even with an increased circumferential tip Mach number, the needs for fewer blades are indicated only above certain hub-to-tip ratios. Still, the circumferential tip Mach number holds a far greater influence on the blade numbers than that of the axial inlet Mach number; see Figure 13. Since only whole numbers are reasonable as blade numbers, these progressions show step changes.
The effects on the total stage mass and its composition of part masses are evident in Figure 14. The disk mass increases with the hub-to-tip ratio, while the blade and vane masses and the casing mass decrease. The total mass curve clearly exhibits the step changes in the disk mass, which are caused by changes in the blade number. A mass optimum for the present case is found at a hub-to-tip ratio of 0.466. Additionally, a minimum hub-to-tip ratio is to be determined where the flow can still be turned at the rotor blade root. Several criteria are mentioned in the literature, with most including the DeHaller number. Since the fan blades can be quite long, the differences in circumferential velocity and the respective flow turning between the hub and tip become substantial. Therefore, at small hub-to-tip ratios, the flow might be turned through the axial direction in the rotor-fixed reference system. Then, the DeHaller number does not represent the maximum occurring deceleration of the flow. Estimation of exactly this deceleration is the purpose of the diffusion factor, so instead, a diffusion factor criterion is to be used. Both relate the flow and load coefficient to each other. Given critical values of the DeHaller number and diffusion factor, a critical load coefficient can, therefore, be expressed through the flow coefficient. This is exemplarily implemented for a DeHaller number of 0.72, and the outcome is illustrated in Figure 14 for the reference fan stage. Unsurprisingly, the flow and load coefficient at the hub change with the hub-to-tip ratio. As a result, the same goes for the critical maximum achievable load factor according to the DeHaller number limit applied. With this approach, designs featuring load factors greater than the maximum achievable values are marked as invalid due to the excessive aerodynamic loading at the fan rotor hub. In the present case, this excludes all designs with a hub-to-tip ratio smaller than 0.37. The predicted mass optimum is within the aerodynamically permissible range.

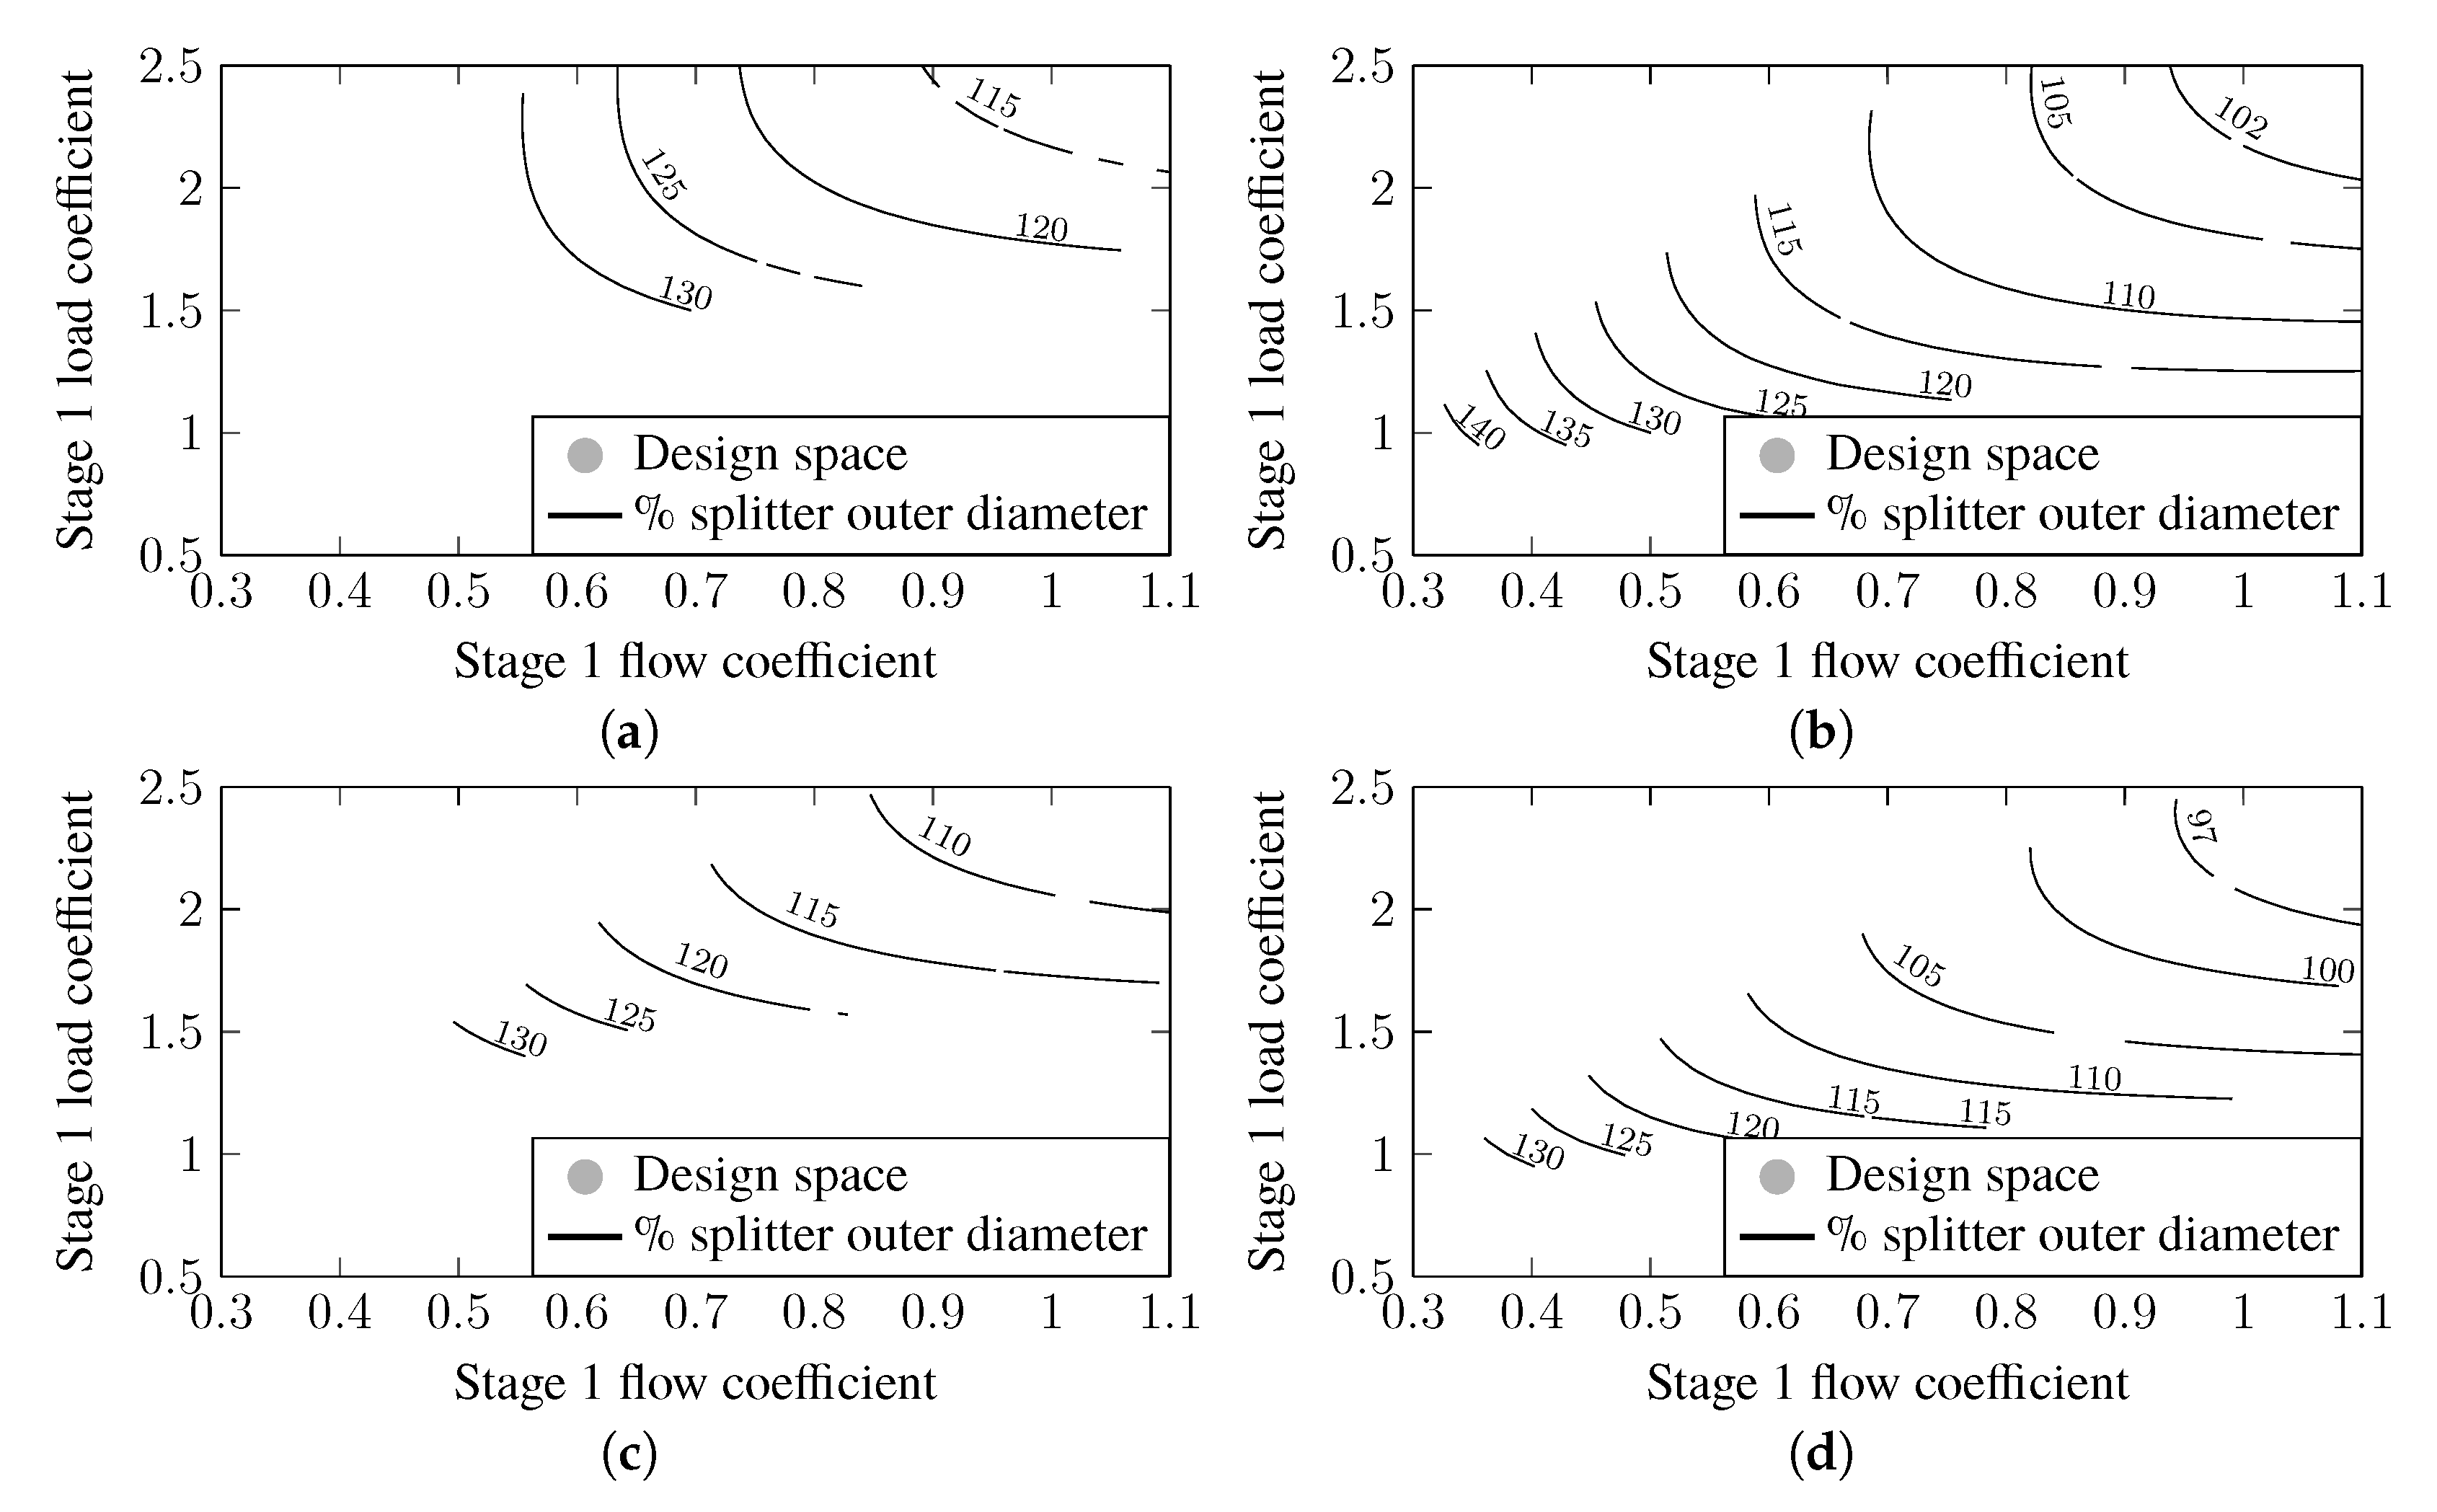
3.4. Low-Pressure Turbine Studies

As a starting point for considerations on the low-pressure turbine module, some boundary conditions are gained from the reference fan design. This is complimented with a second stage to form a two-stage reference fan section that is to be powered by the analyzed low-pressure turbine designs. So, the turbines’ rotational speed and power have to be equal to the fan values. A geometrical issue also has to be taken into account. Low-pressure turbine designs featuring a large outer diameter can potentially be obstructive to the bypass duct flow path. An inner bypass duct wall that evolves straight in axial direction from the splitter is definitely not the case for every marketed turbofan engine. Still, the geometric compatibility of the two components is observed in this study in terms of the ratio between the outer diameter of the low-pressure turbine module and the splitter of the fan section. A reference low-pressure turbine is defined with characteristics provided in Table 2.
Given the boundary conditions, the question of possible numbers of stages arises. The rotational speed range of the low-pressure shaft, which is determined by the comparatively small fan diameter, bears resemblance to military and so-called high-speed, low-pressure turbines [78]. Therefore, in this study, two-stage and three-stage low-pressure turbine designs are compared, each for a design with a constant hub diameter and constant mean diameter. For illustration purposes, Figure 6 provides low-pressure turbine designs based on the reference values from Table 2.
The respective design spaces are mapped in Smith diagrams—in other words, within the plane of the two work coefficients: the load and flow coefficients. The Smith diagram illustrates the relationship between aerodynamic loading and turbine efficiency. For the present design study, the flow coefficient and load coefficient were varied, and the resulting low-pressure turbine designs were analyzed. The subjects of the investigation were, primarily, the mechanical design’s feasibility, the mass, and the already mentioned geometrical dimensions, as well as the exit conditions in terms of the axial Mach number and flow angle. The exit conditions should be compatible for the turbine exit casing that is next in the engine architecture, and eventually also for the mixer section. The inlet conditions are dictated by the preceding high-pressure turbine, which is treated as invariant. Thus, the inlet conditions, total pressure and temperature, inlet mass flow, and Mach number are constant, analogously to the fan study, and likewise, a constant inlet area results. The study’s results are visualized in Figure 15 for the mechanical design behavior and efficiency, in Figure 16 for the total mass, in Figure 17 for the outer dimensions compared to those of the coupled fan, in Figure 18 for the exit Mach number, and in Figure 19 for the exit flow angle.
Most obviously, designs with a comparably high flow coefficient and load coefficient bear lower efficiencies. As a result, maximizing efficiency comes with more aerodynamically challenging designs. Designs featuring load coefficients that are too small are excluded due to disk feasibility. This happens when a disk rim diameter that is too large would be needed to compensate disk material stresses. The upper left side of the design space is limited by the feasibility of the connecting elements of the blade and disk that can sustain the centrifugal forces. The exact progression of the blade attachment design limit is determined by several effects. The centrifugal forces that occur are reduced by smaller blade heights and, hence, have larger flow coefficients, and they are likewise reduced by smaller turbine diameters and, hence, have larger load coefficients.
The total mass of the low-pressure turbine increases with the reduction of the work coefficients. As a result, maximizing efficiency and minimizing mass are conflicting targets. In Figure 16, all total masses are compared to the reference turbine values applied to a two-stage constant hub design. In the analyzed parameter range, the relative total masses vary from around 0.75 to more than 2.0. Two-stage designs can provide lower masses compared to their three-stage counterparts. The conclusion can be drawn that the additional stage involves more penalties than longer blades. These imply additional mass for themselves, for the disk, and for the casing due to the increased containment requirements. Regarding the flow path geometry, designs featuring a constant mean diameter offer lower masses than constant hub designs.
The general mass distribution corresponds to the geometric dimensions, as an increase in turbine diameter is caused by a reduction of the stage load coefficient. Higher flow coefficients increase the axial flow velocity through the turbine and, thus, lead to reduced flow channel heights. The maximum outer diameters, which are shown in Figure 17, are related to the outer splitter diameter. Again, the advantages in terms of flow path geometry lie with constant mean diameter designs. However, three-stage designs offer smaller outer diameters than those of two-stage designs. It becomes evident that practically no feasible designs with outer diameters smaller than the comparison diameter emerged from the study. A comparison value of 1.27 was provided by a modern military engine. The maximum value that can be adopted depends on the design of the bypass duct and, possibly, the nacelle.
If a certain critical value for the exit axial Mach number is mandatory, it can serve as an additional design limit. This would impose a boundary to the right side of the depicted design spaces. An observed maximum of M a 0.5 was provided in [49]. In any case, an axial discharge flow is desirable. Any deviation from the axial direction has to be compensated in the subsequent turbine exit casing.

4. Discussion

The findings presented here highlight the importance of an interdisciplinary approach to preliminary aircraft design. This is especially true in the featured topic area of civil supersonic aircraft. Aircraft and cycle designs are mutually dependent, while practicable engine architectures and engine technology also limit the design space of the cycles; see Figure 7. Thus, for example, the use of derivatives only provides a benefit to a supersonic business jet design within limits that are qualitatively similar to those presented. The choice of flight missions to be served has a significant influence on the engine. It constrains the aerodynamic design point of the turbomachinery components, as well as a possibly different design point for temperature loads depending on the mission selection.
The wave drag component penalizes engine concepts that have comparatively large overall diameters. Therefore, the evaluation of engine cycles must not be based on efficiencies or specific fuel consumption alone. Here, the matching with a suitable aircraft model is decisive. The requirements of the aircraft also dictate the benefits of different engine cycles. A set of requirements that are different from those in this paper will, thus, likely produce different results. Examples of this include the number of engines and the climbing capabilities in a subsonic mission.
The investigations of the preliminary engine design in this paper show that two factors that influence the largest outer diameter of the bare engine are to be expected. Most obviously, the fan diameter, which is determined by the design of the fan section, influences this size. However, the comparison of different designs of the low-pressure turbine revealed that the installation space required for this component is also a potential influence. Thus, geometric parallels to military turbofans were given, where the fan casing certainly does not always determine the diameter of the naked engine, but, rather, the ducting of the bypass flow around the low-pressure turbine. The actual influence depends on the design of the bypass duct, which was not investigated in this paper.
For the turbomachinery components investigated, it is true that small installation space requirements can be achieved with aerodynamically highly loaded blade rows. As expected, such a load entails a sacrifice in efficiency. If a comparative value for the size derived from military turbofans is taken into account, the three-stage design with a constant mean radius has the highest possible efficiency for the comparative value among the low-pressure turbine designs presented. If a low installation space requirement is aimed for, the component mass also develops advantageously.
The benefit of a reduced engine mass for an aircraft, which is measured in gain in achievable range, is comparable to that of a subsonic commercial aircraft. All engine design studies presented do not assume any technological progress beyond the state of the art. Core engines with similar architectures as considered, and even higher compressor pressure ratios have already been realized. In a low-pressure system, however, an as-yet unrealized application-specific engine design is needed for optimized performance. A pure derivative of an existing engine is, therefore, not considered reasonable.

Author Contributions

Conceptualization, S.S. and T.S.; methodology, T.S. and S.S; software, T.S.; validation, T.S. and S.S.; formal analysis, T.S.; investigation, T.S.; resources, S.S. and T.S.; data curation, T.S.; writing—original draft preparation, T.S.; writing—review and editing, S.S.; visualization, T.S.; supervision, S.S.; project administration, S.S. and T.S.; funding acquisition, S.S. All authors have read and agreed to the published version of the manuscript.

Funding

This research received no external funding.

Institutional Review Board Statement

Not applicable.

Informed Consent Statement

Not applicable.

Data Availability Statement

The data that support the findings of this study are available from the corresponding author, T.S., upon reasonable request.

Acknowledgments

The aircraft pre-design model discussed in this paper was implemented by using the Pacelab APD preliminary design software from PACE Aerospace Engineering and Information Technology GmbH. All pre-design models and tools of engine components were implemented using the Pacelab Suite preliminary design software from PACE Aerospace Engineering and Information Technology GmbH. The authors wish to acknowledge the software license and their appreciation for the support of PACE, as well as the fruitful discussions with company staff.

Conflicts of Interest

The authors declare no conflict of interest.

References

  1. Welge, H.; Nelson, C.; Bonet, J. Supersonic Vehicle Systems for the 2020 to 2035 Timeframe. In Proceedings of the 28th AIAA Applied Aerodynamics Conference, Chicago, IL, USA, 28 June–1 July 2010. AIAA 2010-4930. [Google Scholar]
  2. Liebhardt, B.; Lütjens, K. An Analysis of the Market Environment for Supersonic Business Jets. In Proceedings of the 60 Deutscher Luft-und Raumfahrtkongress, DLRK 2011-1457, Bremen, Deutschland, 27–29 September 2011. [Google Scholar]
  3. Henne, P.A. Case for Small Supersonic Civil Aircraft. J. Aircr. 2005, 42, 765–774. [Google Scholar] [CrossRef]
  4. Sun, Y.; Smith, H. Review and prospect of supersonic business jet design. Prog. Aerosp. Sci. 2017, 90, 12–38. [Google Scholar] [CrossRef]
  5. Hartbrich, I. Die Akustikprobleme der neuen Überschallflugzeuge. In VDI Nachrichten; VDI Verlag GmbH: Düsseldorf, Germany, 2021. [Google Scholar]
  6. Schlette, T.; Staudacher, S. Engine Design Requirements for Supersonic Business Jets. In Proceedings of the 14th European Conference on Turbomachinery Fluid Dynamics and Thermodynamics, Gdansk, Poland, 12–16 April 2021. [Google Scholar]
  7. Berton, J.J.; Haller, W.J.; Senick, P.F.; Jones, S.M.; Seidel, J.A. A Comparative Propulsion System Analysis for the High-Speed Civil Transport; NASA TM-2005-213414; NASA Glenn Research Center: Cleveland, OH, USA, 2005. [Google Scholar]
  8. Morgenstern, J.; Norstrud, N.; Stelmack, M.; Skoch, C. Final Report for the Advanced Concept Studies for Supersonic Commercial Transports Entering Service in the 2030 to 2035 Period, N+3 Supersonic Program; NASA CR-2010-216796; NASA Glenn Research Center: Cleveland, OH, USA, 2010. [Google Scholar]
  9. Nordqvist, M.; Kareliusson, J.; da Silva, E.R.; Kyprianidis, K. Conceptual Design of a Turbofan Engine for a Supersonic Business Jet. In Proceedings of the International Symposium on Air Breathing Engines, ISABE 2017, Manchester, UK, 3–8 September 2017; pp. 2580–2597. [Google Scholar]
  10. Korovkin, V.; Evstigneev, A.; Makarov, V.; Strelets, D.; Shevelev, O.; Kopiev, V.; Belyaev, I. Concept of Prototype of Near-Term Supersonic Commercial Aircraft with Derivative Engines Based on Existing Cores. In Proceedings of the ISABE 2019, Canberra, Australia, 22–27 September 2019. [Google Scholar]
  11. Verstraete, D. Multi-objective Optimisation of a Turbofan for a Supersonic Transport Aircraft. In Proceedings of the ISABE 2019, Canberra, Australia, 22–27 September 2019. [Google Scholar]
  12. Mirzoyan, A.; Mirzoyan, L. Studies on Required Performances of Advanced Supersonic Civil Aircraft and Their Propulsion Systems for 2020–2035 Timeframe. In Proceedings of the ICAS 2012, Brisbane, Australia, 23–28 September 2012. [Google Scholar]
  13. Rodriguez, D. Propulsion/Airframe Integration and Optimization on a Supersonic Business Jet. In Proceedings of the 45th AIAA Aerospace Sciences Meeting and Exhibit, Reno, NV, USA, 8–11 January 2007. [Google Scholar]
  14. Berens, T. Aerodynamic Propulsion Integration for Supersonic Business Jets. In Proceedings of the 46th AIAA/ASME/SAE/ASEE Joint Propulsion Conference & Exhibit, Nashville, TN, USA, 25–28 July 2010; American Institute of Aeronautics and Astronautics: Reston, VA, USA, 2010. [Google Scholar]
  15. Garzon, A. Use of a Translating Cowl on a SSBJ for Improved Takeoff Performance. In Proceedings of the 45th AIAA Aerospace Sciences Meeting and Exhibit, Reno, NV, USA, 8–11 January 2007. [Google Scholar]
  16. Slater, J.W. Design and Analysis Tool for External-Compression Supersonic Inlets. In Proceedings of the 50th AIAA Aerospace Sciences Meeting Including the New Horizons Forum and Aerospace Exposition, Nashville, TN, USA, 9–12 January 2012. [Google Scholar]
  17. Lytle, J.K. The Numerical Propulsion System Simulation: An Overview; NASA TM-2000-209915; NASA Glenn Research Center: Cleveland, OH, USA, 2000. [Google Scholar]
  18. Onat, E.; Klees, G.W. A Method to Estimate Weight and Dimensions of Large and Small Gas Turbines; NASA CR-159481; NASA Glenn Research Center: Cleveland, OH, USA, 1979. [Google Scholar]
  19. Tong, M.T.; Naylor, B.A. An Object-Oriented Computer Code for Aircraft Engine Weight Estimation. In Proceedings of the ASME Turbo Expo 2008: Power for Land, Sea, and Air, Berlin, Germany, 9–13 June 2008; Volume 1, pp. 1–7. [Google Scholar]
  20. Grönstedt, T. Development of Methods for Analysis and Optimization of Complex Jet Engine Systems. Ph.D. Thesis, Chalmers University of Technology, Göteborg, Sweden, 2000. [Google Scholar]
  21. Grönstedt, T.; Au, D.; Kyprianidis, K.; Ogaji, S. Low-Pressure System Component Advancements and Its Influence on Future Turbofan Engine Emissions. In Proceedings of the ASME Turbo Expo 2009: Power for Land, Sea, and Air, Orlando, FL, USA, 8–12 June 2009; Volume 4, pp. 505–516. [Google Scholar] [CrossRef]
  22. Arago, O.; Bretschneider, S.; Staudacher, S. A Unit Cost Comparison Methodology for Turbofan Engines. In Proceedings of the ASME Turbo Expo 2007: Power for Land, Sea, and Air, Montreal, QC, Canada, 14–17 May 2007; Volume 1, pp. 81–86. [Google Scholar]
  23. Kyprianidis, K. Multi-disciplinary conceptual design of future jet engine systems. Ph.D. Thesis, Cranfield University, Bedfordshire, UK, 2010. [Google Scholar]
  24. Thoma, E.M.; Grönstedt, T.; Zhao, X. Quantifying the Environmental Design Trades for a State-of-the-Art Turbofan Engine. Aerospace 2020, 7, 148. [Google Scholar] [CrossRef]
  25. MacMillan, W.L. Development of a Modular-Type Computer Program for the Calculation of Gas Turbine Off-Design Performance. Ph.D. Thesis, Cranfield University, Bedfordshire, UK, 1974. [Google Scholar]
  26. Bala, A.; Sethi, V.; Gatto, E.L.; Pachidis, V.; Pilidis, P. A Collaborative Venture for Gas Turbine Performance Simulation using an Object Oriented Programming Schema. In Proceedings of the ISABE 2007, Beijing, China, 2–7 September 2007. [Google Scholar]
  27. Alexiou, A.; Aretakis, N.; Kolias, I.; Mathioudakis, K. Novel Aero-Engine Multi-Disciplinary Preliminary Design Optimization Framework Accounting for Dynamic System Operation and Aircraft Mission Performance. Aerospace 2021, 8, 49. [Google Scholar] [CrossRef]
  28. Visser, W.P.J. Generic Analysis Methods for Gas Turbine Engine Performance. Ph.D. Thesis, Delft University of Technology, Delft, The Netherlands, 2015. [Google Scholar]
  29. Reitenbach, S.; Vieweg, M.; Becker, R.; Hollmann, C.; Wolters, F.; Schmeink, J.; Otten, T.; Siggel, M. Collaborative Aircraft Engine Preliminary Design Using a Virtual Engine Platform, Part A. In Proceedings of the AIAA Scitech 2020 Forum, Orlando, FL, USA, 6–10 January 2020. [Google Scholar]
  30. Kirby, M.R.; Marvis, D.N. The Environmental Design Space. In Proceedings of the ICAS 2008, Anchorage, AK, USA, 14–19 September 2008. [Google Scholar]
  31. Proesmans, P.J. Preliminary Propulsion System Design and Integration for a Box-Wing Aircraft Configuration: A Knowledge Based Engineering Approach. Master’s Thesis, Delft University of Technology, Delft, The Netherlands, 2019. [Google Scholar]
  32. Jeschke, P.; Kurzke, J.; Schaber, R.; Riegler, C. Preliminary Gas Turbine Design Using the Multidisciplinary Design System MOPEDS. J. Eng. Gas Turbines Power 2004, 126, 258–264. [Google Scholar] [CrossRef]
  33. Panchenko, Y.; Moustapha, H.; Mah, S.; Patel, K.; Dowhan, M.J.; Hall, D. Preliminary Multi-Disciplinary Optimization in Turbomachinery Design. In Proceedings of the RTO AVT Symposium, RTO-MP-089, Paris, France, 22–25 April 2002. [Google Scholar]
  34. Jones, M.J.; Bradbrook, S.J.; Nurney, K. A Preliminary Engine Design Process for an Affordable Capability. In Proceedings of the RTO AVT Symposium, RTO-MP-089, Paris, France, 22–25 April 2002. [Google Scholar]
  35. Kuz’michev, V.; Krupenich, I.; Filinov, E.; Ostapyuk, Y.; Koryanov, V.V.; Polyakova, M.; Yuan, H. Comparative Analysis of Mathematical Models for Turbofan Engine Weight Estimation. MATEC Web Conf. 2018, 220, 03012. [Google Scholar] [CrossRef]
  36. Lehmann, E.A. Multiple Application Core Engine. J. Aircr. 1980, 17, 802–809. [Google Scholar] [CrossRef]
  37. Buller, M.; Albrecht, G.; Rahman, A. The Design of a Common Core for the BR700 Family. SAE Trans. 1994, 103, 2077–2085. [Google Scholar]
  38. Bretschneider, S. Knowledge-Based Preliminary Design of Aero-Engine Gas-Generators. Ph.D. Thesis, Universität Stuttgart, Stuttgart, Germany, 2010. [Google Scholar]
  39. Lighthill, M.J. On sound generated aerodynamically. Proc. R. Soc. Lond. Ser. A Math. Phys. Sci. 1952, 211, 564–587. [Google Scholar]
  40. Smith, M.J.T. Aircraft Noise; Cambridge University Press: Cambridge, UK, 1989. [Google Scholar]
  41. Torenbeek, E. Synthesis of Subsonic Airplane Design; Delft University Press: Delft, The Netherlands, 1982. [Google Scholar]
  42. Raymer, D. Aircraft Design; American Institute of Aeronautics and Astronautics, Inc.: Washington, DC, USA, 2006. [Google Scholar]
  43. Nicolai, L.M.; Carichner, G.E. Fundamentals of Aircraft and Airship Design; Volume I—Aircraft Design; AIAA Education Series; AIAA American Institute of Aeronautics and Astronautics: Reston, VA, USA, 2010. [Google Scholar]
  44. Smith, H. A Review of Supersonic Business Jet Design Issues. Aeronaut. J. 2007, 111, 761–776. [Google Scholar] [CrossRef]
  45. Liebhardt, B.; Lütjens, K.; Tracy, R.R.; Haas, A.O. Exploring the Prospect of Small Supersonic Airliners—A Case Study Based on the Aerion AS2 Jet. In Proceedings of the 17th AIAA Aviation Technology, Integration, and Operations Conference, Denver, CO, USA, 5–9 June 2017. [Google Scholar]
  46. Bons, N.; Martins, J.R.R.A.; Mader, C.A.; McMullen, M.; Suen, M. High-fidelity Aerostructural Optimization Studies of the Aerion AS2 Supersonic Business Jet. In Proceedings of the AIAA Aviation 2020 Forum, Virtual Event, 15–19 June 2020. [Google Scholar]
  47. Harris, R.V.J. An Analysis and Correlation of Aircraft Wave Drag; NASA TM X-947; NASA Langley Research Center: Hampton, VA, USA, 1964. [Google Scholar]
  48. Harris, R.V.J. A Numerical Technique for Analysis of Wave Drag at Lifting Conditions; NASA-TN-D-3586; NASA Langley Research Center: Hampton, VA, USA, 1966. [Google Scholar]
  49. Grieb, H. Projektierung von Turboflugtriebwerken; Birkhäuser Basel: Basel, Switzerland, 2004. [Google Scholar]
  50. Grieb, H. Verdichter für Turbo-Flugtriebwerke; Springer: Berlin/Heidelberg, Germany, 2009. [Google Scholar]
  51. Kaplan, B.; Nicke, E.; Voss, C. Design of a Highly Efficient Low-Noise Fan for Ultra-High Bypass Engines. In Proceedings of the ASME Turbo Expo 2006, Barcelona, Spain, 6–11 May 2006. GT2006-90363. [Google Scholar]
  52. Kurzke, J.; Halliwell, I. Propulsion and Power; Springer International Publishing: Cham, Switzerland, 2018. [Google Scholar]
  53. Fullagar, K.P.L.; Broomfield, R.W.; Hulands, M.; Harris, K.; Erickson, G.L.; Sikkenga, S.L. Aero Engine Test Experience With CMSX-4® Alloy Single-Crystal Turbine Blades. J. Eng. Gas Turbines Power 1996, 118, 380–388. [Google Scholar]
  54. Horst, O.M.; Adler, D.; Git, P.; Wang, H.; Streitberger, J.; Holtkamp, M.; Jöns, N.; Singer, R.F.; Körner, C.; Eggeler, G. Exploring the fundamentals of Ni-based superalloy single crystal (SX) alloy design. Mater. Des. 2020, 195, 108976. [Google Scholar] [CrossRef]
  55. Bürgel, R.; Maier, H.J.; Niendorf, T. Handbuch Hochtemperatur-Werkstofftechnik, 4th ed.; Vieweg+Teubner Verlag/Springer Fachmedien Wiesbaden GmbH: Wiesbaden, Germany, 2011. [Google Scholar]
  56. Mattingly, J.D.; Heiser, W.H.; Pratt, D.T. Aircraft Engine Design, 2nd ed.; American Institute of Aeronautics and Astronautics: Reston, VA, USA, 2004. [Google Scholar]
  57. Fleming, W. Internal Performance of Several Types of Jet-exit Configurations for Supersonic Turbojet Aircraft; NACA-RM-E52K04; NASA Glenn Research Center: Cleveland, OH, USA, 1953. [Google Scholar]
  58. Krull, H.G.; Steffen, F.W. Performance Characteristics of One Convergent and Three Convergent-Divergent Nozzles; NACA-RM-E52H12; NASA Glenn Research Center: Cleveland, OH, USA, 1952. [Google Scholar]
  59. Münzberg, H.G. Flugantriebe; Springer: Berlin/Heidelberg, Germany, 1972. [Google Scholar]
  60. Walsh, P.P.; Fletcher, P. Gas Turbine Performance, 2nd ed.; Blackwell Science: Oxford, UK, 2008. [Google Scholar]
  61. Zobel, O. Datenmodell zur Vorauslegung moderner Wide-Chord-Fans mit Booster in Pacelab. Master’s Thesis, Universität Stuttgart, Stuttgart, Germany, 2008. [Google Scholar]
  62. Bürkle, M. Erweiterung eines Datenmodells zur automatisierten Vorauslegung von Fans für zivile Luftfahrtantriebe mit hohem Nebenstromverhältnis. Master’s Thesis, Universität Stuttgart, Stuttgart, Germany, 2012. [Google Scholar]
  63. Donus, F.; Schaber, R.; Schmidt, K.J.; Staudacher, S. Accuracy of Analytical Engine Weight Estimation During the Conceptual Design Phase. In Proceedings of the ASME Turbo Expo 2010: Power for Land, Sea, and Air, Glasgow, UK, 14–18 June 2010; Volume 6, pp. 1377–1384. [Google Scholar]
  64. Staudacher, S. Untersuchungen zum sekundären Luftsystem von Luftstrahltriebwerken. Ph.D. Thesis, Technische Universität München, München, Germany, 1995. [Google Scholar]
  65. Schlüter, R. Konstruktive Auslegung des Hochdruckverdichters von zivilen Flugtriebwerken der 25000 lbf-Schubklasse. Master’s Thesis, Universität Stuttgart, Stuttgart, Germany, 2006. [Google Scholar]
  66. Smith, S.F. A Simple Correlation of Turbine Efficiency. J. R. Aeronaut. Soc. 1965, 69, 467–470. [Google Scholar] [CrossRef]
  67. Cumpsty, N.A. Compressor Aerodynamics, reprint ed; Krieger Publishing Company: Malabar, FL, USA, 2004. [Google Scholar]
  68. Wu, C.H.; Wolfenstein, L. Application of Radial Equilibrium Condition to Axial-Flow Compressor and Turbine Design; NACA-TR-955; NASA Glenn Research Center: Cleveland, OH, USA, 1950. [Google Scholar]
  69. Wilson, D.G.; Korakianitis, T. The Design of High-Efficiency Turbomachinery and Gas Turbines, 2nd ed.; MIT: Cambridge, MA, USA; London, UK, 2014. [Google Scholar]
  70. Jung, M. Erstellung eines Vorauslegungstools für die Beschaufelung von axialen Hochdruckverdichtern für zivile Luftfahrtantriebe in der Entwicklungsumgebung Pacelab. Master’s Thesis, Universität Stuttgart, Stuttgart, Germany, 2007. [Google Scholar]
  71. Saravanamuttoo, H.I.H.; Cohen, H.; Rogers, G.F.C. Gas Turbine Theory, 5th ed.; Prentice Hall: Harlow, UK, 2001. [Google Scholar]
  72. Glassman, A.J. Computer Program for Preliminary Design Analysis of Axial-Flow Turbines; NASA-TN-D-6702; NASA Glenn Research Center: Cleveland, OH, USA, 1972. [Google Scholar]
  73. Dixon, S.L. Fluid Mechanics and Thermodynamics of Turbomachinery, 4th ed.; Butterworth-Heinemann: Boston, MA, USA, 1998. [Google Scholar]
  74. Crippa, M. Vorauslegungstool für die Beschaufelung von axialen NDT. Master’s Thesis, Universität Stuttgart, Stuttgart, Germany, 2007. [Google Scholar]
  75. Kacker, S.C.; Okapuu, U. A Mean Line Prediction Method for Axial Flow Turbine Efficiency. J. Eng. Power 1982, 104, 111–119. [Google Scholar] [CrossRef]
  76. Craig, H.R.M.; Cox, H.J.A. Performance Estimation of Axial Flow Turbines. Proc. Inst. Mech. Eng. 1970, 185, 407–424. [Google Scholar] [CrossRef]
  77. Peters, M.; Schmidt, T.; Jeschke, P. Influence of Blade Aspect Ratio on Axial Compressor Efficiency. J. Glob. Power Propuls. Soc. 2019, 3, 639–652. [Google Scholar] [CrossRef]
  78. Malzacher, F.J.; Gier, J.; Lippl, F. Aerodesign and Testing of an Aeromechanically Highly Loaded LP Turbine. J. Turbomach. 2006, 128, 643–649. [Google Scholar] [CrossRef]
Figure 1. Maximum range and cruise Mach number capabilities of business jets [6].
Aerospace 09 00493 g001
Figure 2. Aircraft design geometry and key parameters.
Aerospace 09 00493 g002
Figure 3. Schematics of possible engine configurations underlying the cycle.
Aerospace 09 00493 g003
Figure 4. Preliminary fan design model showing different stage architectures.
Aerospace 09 00493 g004
Figure 5. Fan blade work distributions according to [51,66].
Aerospace 09 00493 g005
Figure 6. Low-pressure turbine geometry.
Aerospace 09 00493 g006
Figure 7. Cycle design trades with technology constraints and separation of engine architectures.
Aerospace 09 00493 g007
Figure 8. Detailed view of the cycle design space for Π Fan , outer = 1 . 6 2 .
Aerospace 09 00493 g008
Figure 9. Engine dry mass and aircraft range exchange rates for different types of aircraft: (a) absolute changes; (b) relative changes.
Aerospace 09 00493 g009
Figure 10. Achievable aircraft range for the underlying engine cycles.
Aerospace 09 00493 g010
Figure 11. Relative changes in flow path parameters over the hub-to-tip ratio in the fan stage, depending on the inlet and circumferential Mach numbers.
Aerospace 09 00493 g011
Figure 12. Exemplary relative change in the blade number over the hub-to-tip ratio in the fan stage.
Aerospace 09 00493 g012
Figure 13. Relative changes in blade numbers over the hub-to-tip ratio in the fan stage, depending on the inlet and circumferential Mach numbers.
Aerospace 09 00493 g013
Figure 14. Relative changes in masses and aerodynamic parameters over the hub-to-tip ratio for the reference fan stage.
Aerospace 09 00493 g014
Figure 15. Comparison of the efficiencies of low-pressure turbine design maps: (a) constant hub, two stages; (b) constant hub, three stages; (c) constant mean, two stages; (d) constant mean, three stages.
Aerospace 09 00493 g015
Figure 16. Mass comparison of low-pressure turbine design maps: (a) constant hub, two stages; (b) constant hub, three stages; (c) constant mean, two stages; (d) constant mean, three stages.
Aerospace 09 00493 g016
Figure 17. Comparison of the dimensions of low-pressure turbine design maps: (a) constant hub, two stages; (b) constant hub, three stages; (c) constant mean, two stages; (d) constant mean, three stages.
Aerospace 09 00493 g017
Figure 18. Comparison of the exit Mach numbers of low-pressure turbine design maps: (a) constant hub, two stages; (b) constant hub, three stages; (c) constant mean, two stages; (d) constant mean, three stages.
Aerospace 09 00493 g018
Figure 19. Comparison of the exit flow angles of low-pressure turbine design maps: (a) constant hub, two stages; (b) constant hub, three stages; (c) constant mean, two stages; (d) constant mean, three stages.
Aerospace 09 00493 g019
Table 1. Characteristics of the reference stage.
Stage ParameterUnitValue
pressure ratio 1.6
polytropic efficiency 0.9
total inlet pressure kPa 60
total inlet temperature K 302
inlet mass flow kg / s 51.5
inlet hub-to-tip ratio 0.4
tip speed m / s 451
circumferential tip Mach number 1.5
axial inlet Mach number 0.6
Table 2. Reference low-pressure turbine characteristics.
Turbine ParameterUnitValue
polytropic efficiency 0.9175
total inlet pressure kPa 288
total inlet temperature K 1324
inlet mass flow kg / s 13.5
rotational speed rpm 11,000
first-stage load coefficient 1.5
first-stage flow coefficient 0.7
Publisher’s Note: MDPI stays neutral with regard to jurisdictional claims in published maps and institutional affiliations.

