Article

Effect of Local Momentum Ratio on Spray Windward Distribution of a Gas–Liquid Pintle Injector Element

Hypervelocity Aerodynamics Institute, China Aerodynamics Research and Development Center, Mianyang 621000, China
*
Author to whom correspondence should be addressed.
Aerospace 2022, 9(9), 494; https://doi.org/10.3390/aerospace9090494
Submission received: 16 July 2022 / Revised: 26 August 2022 / Accepted: 29 August 2022 / Published: 3 September 2022
(This article belongs to the Special Issue Liquid Rocket Engines)

Abstract

:
The variable-area pintle injector has unique geometry and spray characteristics compared to traditional coaxial injectors, and is advantageous for weight lightening and deep throttling of liquid rocket engines. To obtain an accurate prediction of the spray windward distribution of a gas–liquid pintle injector with discrete radial orifices, a pintle injector element using air and water as simulants was designed for spray experiments in the atmospheric environment. The air-film injection pressure drop and water-jet injection orifice diameter were both adjusted for a wide variance range from 0.19 to 2.85 for the local momentum ratio. Backlight imaging was adopted for shooting the frozen spray pattern from one side, and a new dimensionless parameter, i.e., the spray fraction, was defined to quantitatively analyze the time-averaged windward boundary band. The dimensionless spray windward boundary band model for a circular-orifice jet and the corresponding derivative formula of the spray half angle were summarized through parameter study. The predicted results of empirical models were in good agreement with the experimental results. It was found that when the local momentum ratio was about 1, the spray distribution range basically overlapped with the coverage scope of gas film with uniform liquid mist.

1. Introduction

Compared to the extensively used coaxial shear injector and coaxial swirl injector for liquid rocket engines [1,2], the pintle injector is famous for its wide throttle ability, intrinsic combustion stability and simple structure [3]. The pintle injector was initially developed by the Jet Propulsion Laboratory (JPL) in the 1950s. To date, it has contributed to various variable-thrust engines with 25 different propellant combinations [4]. Two typical pintle engines are the Apollo lunar module descent engine [5,6] and Chang’e-3 prober main engine [7], which achieved soft landings on the lunar surface in 1969 and 2013, respectively. Taking into account factors such as regenerative cooling and mixing performance, the gas–liquid pintle injector with discrete radial orifices is currently gaining growing emphasis due to its associated advantages for widely watched space exploration [8]. Previously, TRW Inc., the predecessor of Northrop Grumman Space Technology, performed a large amount of research on pintle engines [3], but most of their work has not been made public. Thus, academic studies and thorough knowledge on the pintle injector are still rather limited.
A thrust chamber usually has only one pintle injector, with its spray covering the entire combustor [9]. Therefore, the pintle engine has a uniform combustion flow field, which differs from conventional engines with dense injector units on the injection faceplate. Previous studies [10,11,12] suggest that the spray angle of gas–liquid pintle injectors always remain unchanged, which contributes to stable recirculation flow patterns and the mixing ratio distribution inside the combustor. The flame structure, combustion efficiency and stability of the pintle engine are all highly dependent on the spray characteristics.
Accordingly, fundamental research on the spray characteristics of the pintle injector plays an important role. In order to establish the optimization design procedure of the variable-area pintle injector under all throttling conditions, a research group mainly from Korea Aerospace University and Seoul National University conducted a large amount of original work for parameter sensitivity analysis [13,14,15,16]. Both Zhang et al. [17] and Zhou et al. [18] researched the gas–liquid pintle injector by means of experimental and numerical methods. Their results show that increasing the gas/liquid momentum ratio and Weber number will help to reduce the spray angle and droplet diameter, respectively. Through mechanism studies on penetration depth, droplet diameter distribution, fragmentation and atomization characteristics of the near-orifice liquid jet under transverse gas film, some quantitative conclusions also have been drawn in our previous work [19,20]. The related studies inevitably involve the spray spatial distribution, and the spray angle and penetration depth are the common evaluation indicators. The outermost spray boundary is often used to determine the spray angle and penetration depth, but cannot reflect the concentration change on the spray boundary band fully.
To overcome the overlapping effect between different liquid jets with pintle injectors with discrete radial orifices, a pintle injector element using air and water was adopted as the research object in this paper. Section 2 not only describes the visualization experimental system (Section 2.1) and the cold-test scheme (Section 2.2) adopted in this work, but also presents a simple discussion of the discharge coefficient (Section 2.3). In Section 3, the extraction method of the spray windward boundary band is introduced (Section 3.1), and the influence of the local momentum ratio on the windward boundary band is discussed in depth (Section 3.2). Then, the dimensionless spray windward boundary band model for the circular-orifice jet and the corresponding derivative formula of the spray half angle are proposed through parameter study (Section 3.3). Section 4 summarizes the conclusion of this paper. The current work provides guidance for performance optimization of the gas–liquid pintle injector.

2. Overview of Spray Experiments

2.1. Test and Measurement System

The cold tests were carried out at atmospheric temperature and pressure. The experimental platform depicted in Figure 1 mainly included the simulant supply devices, the spray collector, the research object (a pintle injector element), and the measurement and control system for the pressure and mass flow rate. During the test, air was supplied from a high-pressure cylinder, and water was derived from a tank pressurized by high-pressure nitrogen. When the air and water reached the pintle injector element, the corresponding inlet pressures and mass flow rates were regulated by the reduction valves. The spray collector was responsible for collecting and pumping out the injected liquid mist in time to avoid disturbing the optical measurement.
The conventional parameters measured in the cold tests included the air-cylinder pressure, the water-tank pressure, the mass flow rate and inlet pressure of the injection channel of air and water. As the spray fields do not emit light and are not easily illuminated, the backlight imaging was suitable for spray visualization and boundary band identification. A power-adjustable LED light source, which has a light-emitting area of 100 × 200 mm2, was used to provide a stable backlight. The frozen spray pattern was recorded by a high-speed camera (SA-Z) with an 80–200 mm zoom lens. The corresponding frame frequency, exposure time, and image resolution were set to 20,000 Hz, 25 μs, and 1024 × 672 pixels, respectively.

2.2. Operating Conditions of a Gas–Liquid Pintle Injector Element

For a typical gas–liquid pintle injector with discrete radial orifices, gaseous propellant and liquid propellant are injected from the axial injection channel and several radial orifices, respectively, due to an injection pressure drop. Then, they collide with each other for atomization, mixing, and combustion. In order to record the spray pattern of the single radial liquid jet and axial gas film, a two-dimensional geometry (i.e., pintle injector element) using dry air and filtered water as simulants was designed for cold tests. Its working process is illustrated in Figure 2a: air film from the rectangular slit impinges on the circular-orifice water jet with an impact angle of 90°; then, they are atomized. Figure 2b presents the detailed description of the injection-element assembly. The axial sealing of the water flow channel and the air collecting cavity (between the cover plate and the pedestal) is guaranteed by O-rings and copper gaskets, respectively.
The injection orifice for water shown in Figure 2a has four different diameters (d): 0.56mm, 0.68 mm, 0.97 mm, and 1.37 mm. The corresponding numbers of the four injection orifices are A, B, C, and D, respectively. The other key structural parameters shown in Figure 2a are as follows: the slit width (w) is 7mm, the slit height (h) is 2.23 mm, the skip distance (Ls) is 12 mm, and the pintle length (L) is 22 mm.
Cold tests were all conducted in the atmospheric environment, and the ambient temperature and pressure were 300 K and 101.3 kPa, respectively. The mass flow rates of air and water under throttling conditions are calculated as follows:
q G = C d _ G P i _ G A G k G R T ( 2 k G + 1 ) k G + 1 k G 1
q L = C d _ L A L 2 ρ L ( P i _ L P e _ L )
where qG and qL are measured by flowmeters; Pi is measured by pressure sensors; Pe and T are set to the ambient pressure and temperature in the paper, respectively; the difference between Pi and Pe is the injection pressure drop; ρL and kG are acquired through the NIST program.
The momentum ratio of the radial flow to the axial flow is often used as the key dimensionless parameter of the pintle injector with a radial slit. Due to the impingement of the single-orifice water jet and the planar air film, the local momentum ratio of the single-orifice water jet to partial axial air film is suitable to reveal the local flow characteristics of the pintle injection element [9]. The local momentum ratio (LMR) is defined as below:
L M R = q L v L q G v G w d
The operating conditions of the cold-test cases are shown in Table 1: as shown in the second row, the mass flow rate of the four water-jet orifices was proportional to the circular-orifice area; then six air injection pressure drops (their order, from large to small, was 2.13 MPa, 0.99 MPa, 0.62 MPa, 0.42 MPa, 0.31 MPa, and 0.24 MPa, corresponding to the six air mass flow rates from left to right in the second column of Table 1) were combined with the four water-jet orifices to form 24 cold-test cases with different local momentum ratios. According to Equations (1) and (2), it can be seen that vG changed slightly under different operating conditions, while vL remained unchanged at 33.48 m/s.

2.3. Discharge Coefficient

The discharge coefficient has been studied extensively as a crucial design parameter for various types of injectors, and many models have been proposed [21,22]. In this paper, it can be seen from Equations (1) and (2) that the discharge coefficient (Cd) connected the mass flow rate and injection pressure drop of the pintle injector. Through the measurement of conventional parameters under all operating conditions, Figure 3 shows the Cd variances in the air and water injection channel with the injection pressure drop (ΔP). As ΔP increased, the Cd of the air-film slit was only slightly reduced. The Cd of the water-jet orifice was mainly determined by the circular-orifice diameter. As the discharge coefficients of the water-jet orifice under different operating conditions were all within the same hollow circle when the orifice diameter was unchanged, it is believed that the influence of the local momentum ratio can be basically ignored. Therefore, the local high pressure at the orifice outlet, which was caused by gas–liquid impingement, had little effect on the water-jet injection. Further, it can be considered that there was a critical value for the circular-orifice diameter: when the circular-orifice diameter was smaller than the critical value, the Cd increased with the increase in the circular-orifice diameter; when the d was greater than this value, the Cd basically did not change with the circular-orifice diameter.

3. Results and Discussion

3.1. Extraction of the Windward Boundary Band

Figure 4 shows the typical far-field spray structure of the pintle injector element taken at different perspectives [20]. The focal plane of the high-speed camera from the side view is the z = 0 plane shown in Figure 2b. The irregular deformation of the jet/spray windward surface was caused by the air film impact. In order to describe the oscillating distribution of the jet/spray windward surface, the frozen spray pattern inside the red dashed box shown in Figure 4 was extracted. Further, the concept of the spray fraction γ proposed by Wu [23] was used for reference, which is defined as the dimensionless timescale occupied by the water jet/spray at a certain spatial location. For all the frozen spray patterns under various operating conditions, the limit approximation method was used to calculate the spray fraction. The frozen spray patterns were preprocessed as displayed in Figure 5: (a) Inverse color processing was performed for each frozen spray pattern by subtracting the background image, and the gray value of the background part in each frozen spray pattern was set to zero; (b) The instantaneous spray structure was enhanced by linear stretching in the grayscale range; (c) Each enhanced spray image was transformed into a binary image by using Otsu’s method, i.e., the maximum between-class variance method [24], to obtain the corresponding threshold value. Binarization processing converted the grayscale values of the background part to 0 (pure black), and the others to 1 (pure white).
By performing statistics on the aforementioned preprocessed images, the probability value of any spatial location (here, these were replaced by pixels) in the near-field region occupied by the water jet/spray is calculated based on Equation (4).
γ = lim t ( t s p r a y / t ) = lim n ( i = 1 n ( g i / n ) )
In Equation (4), gi represents the grayscale value of the same spatial location to be calculated in the i-th preprocessed image. When n approaches infinity, the obtained probability value is the spray fraction of the spatial location to be calculated. It has been proven that the sample size is large enough to calculate the true spray fraction when n is up to 80 [23]. In this paper, n was set to 1500 to further improve the authenticity of the spray fraction (see Figure 6a for the spray fraction distribution in the near-field region).
Figure 6a visually reflects the distribution characteristics of the water jet/spray in the near-field region: the pure red part with a constant spray fraction of 1 was always occupied by the jet/spray; the pure blue part with a constant spray fraction of 0 was completely free of the jet/spray; the other part with a spray fraction between 0 and 1 was aroused by the spray windward boundary oscillation. It can be seen from Figure 6b that the extracted windward boundary band contained several spray fraction isolines, any of which can be regarded as the conventional spray windward trajectory [20]. The x-y plane in Figure 6c [20], i.e., the z = 0 plane shown in Figure 2b, is used for subsequent discussion. The spray fraction boundary band near the injection orifice was thinner due to the development of the Rayleigh–Taylor unstable surface wave [19]. As the continuous water-jet broke, the formed liquid blocked and liquid mist groups moved downstream along with the airflow. The width of the spray windward boundary band increased significantly, but its growth rate slowed down gradually.

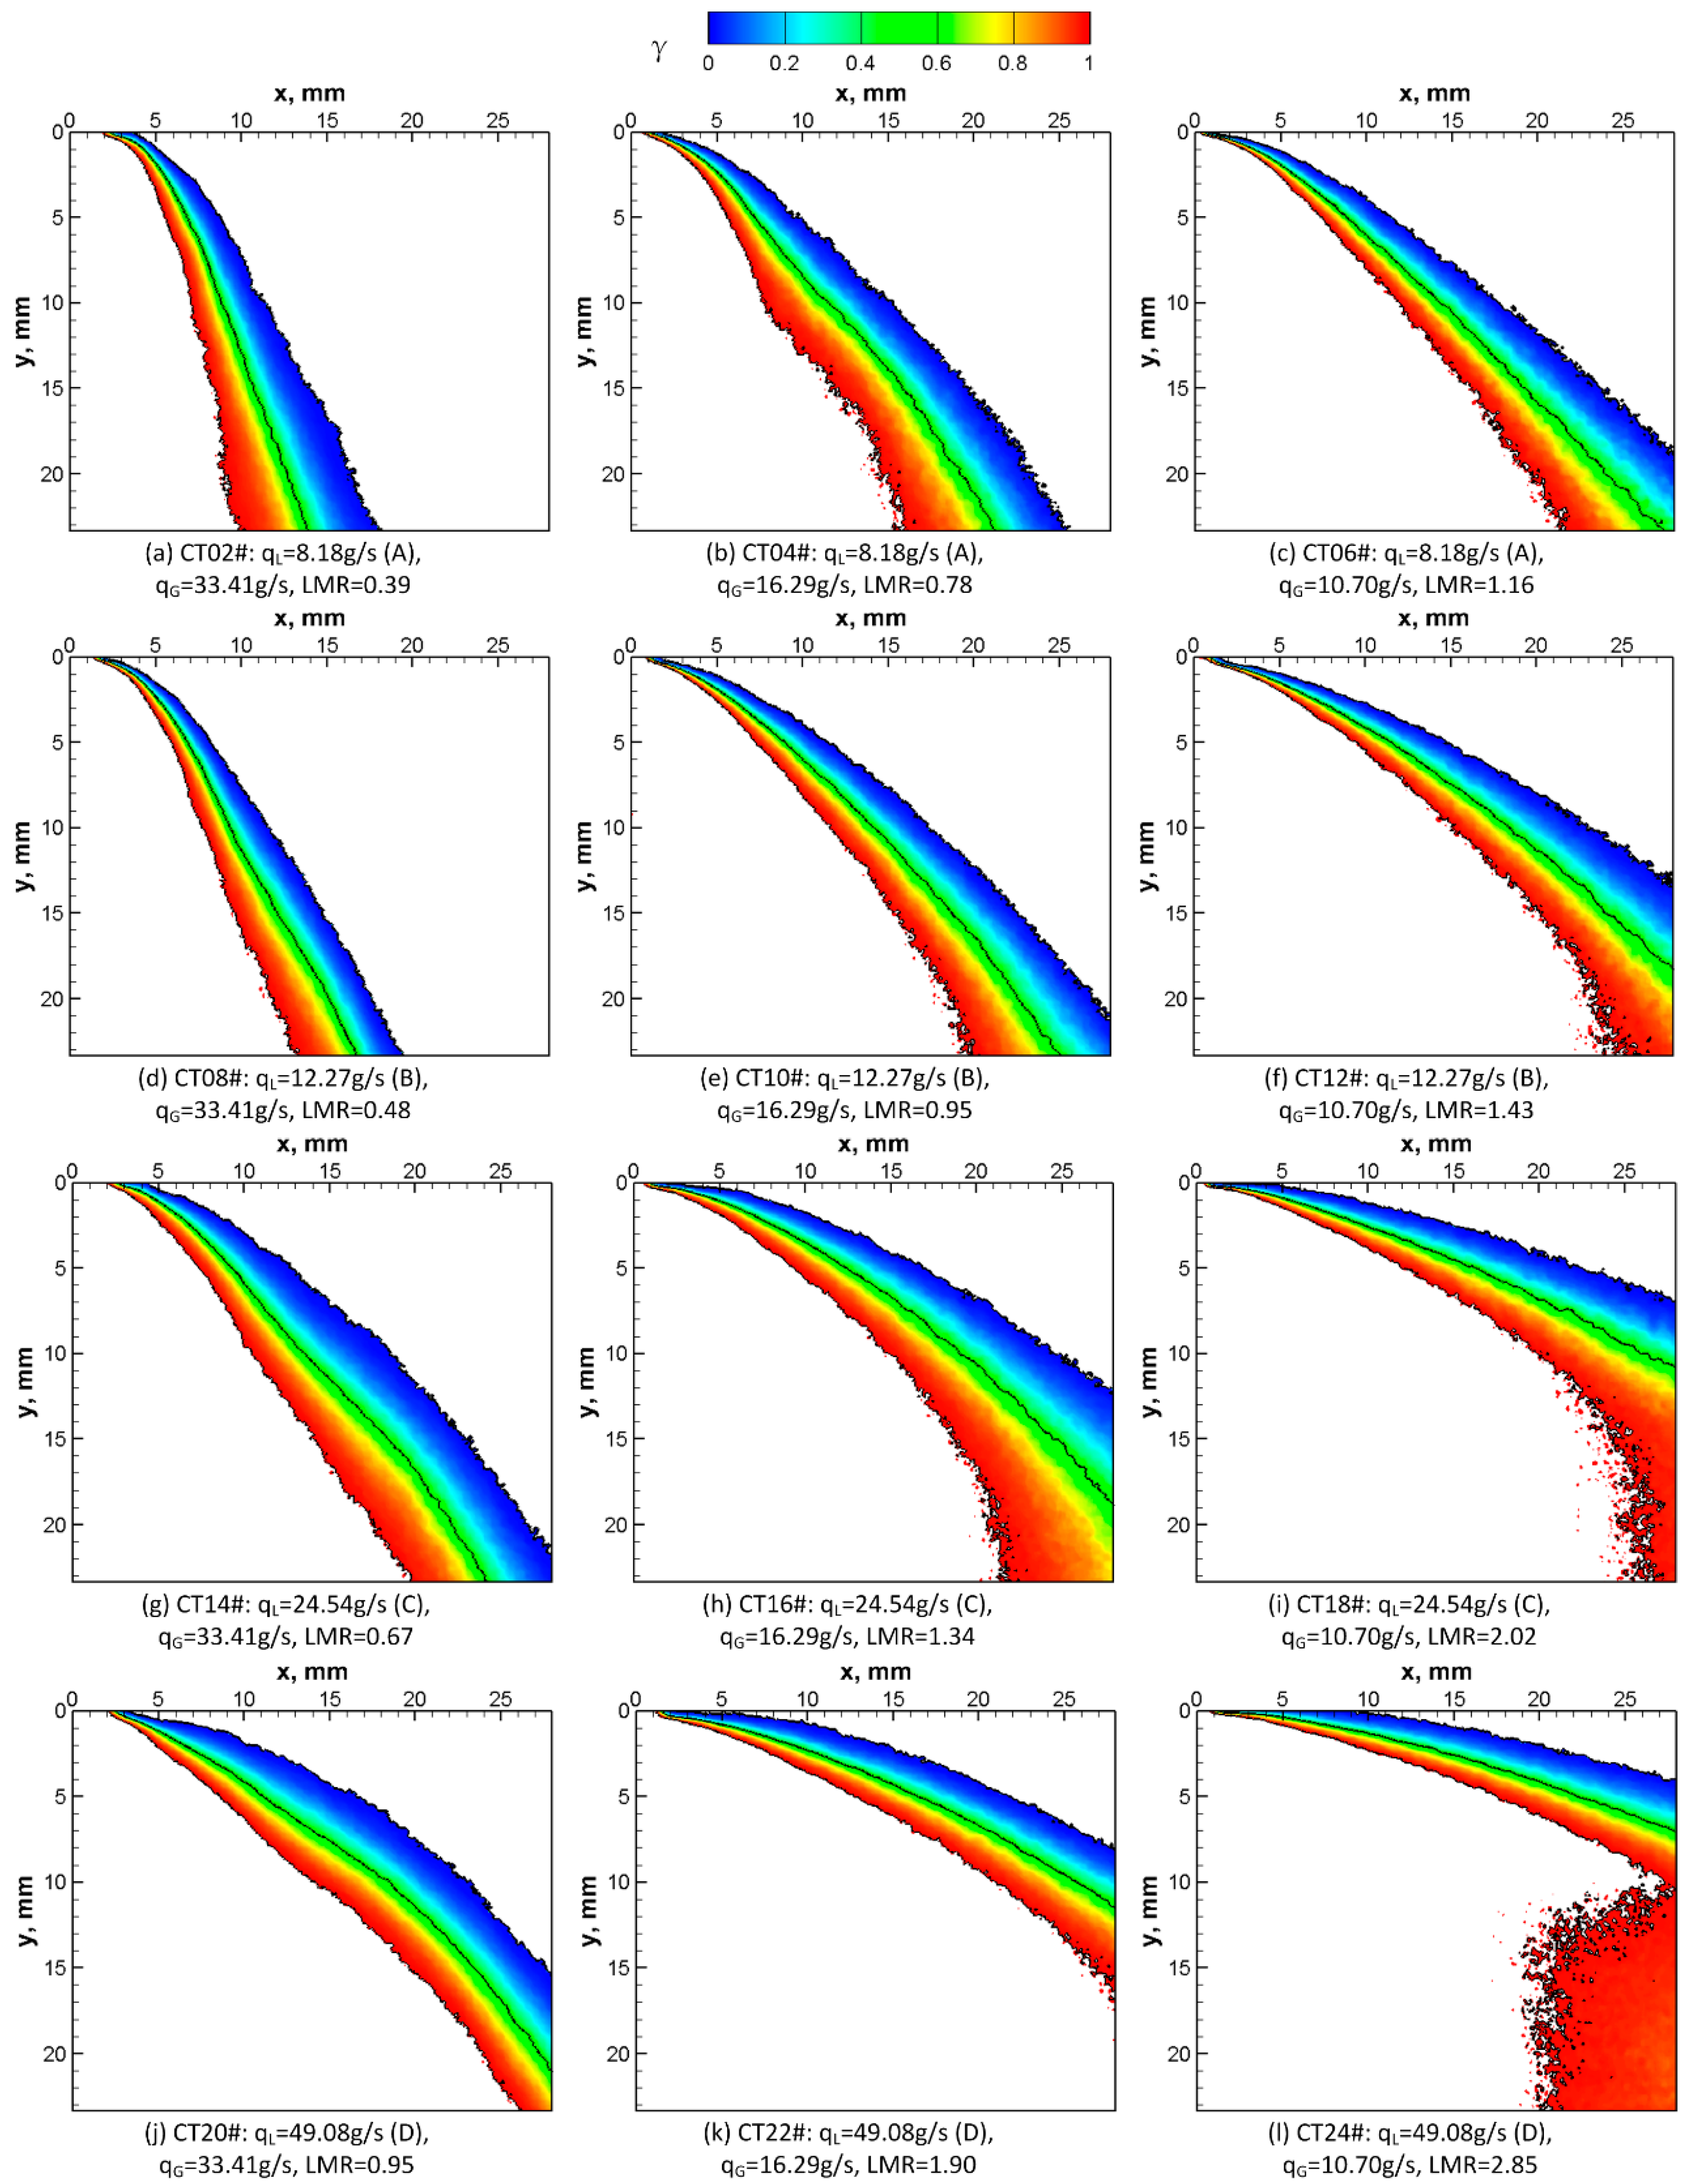
3.2. Effect of Parameter on the Windward Boundary Band

Using the aforementioned method, the spray windward boundary bands were extracted for half of the operating conditions in Table 1, and the results are displayed in Figure 7. The variation trend of the boundary band width along the flow direction was basically the same for different operating conditions, and the boundary band, especially the region of 0.1 < γ < 0.9, was approximately divided into two symmetrical parts, with the spray fraction isoline γ = 0.5 as the boundary. The effect of the local momentum ratio on the windward boundary band was analyzed by comprehensively considering the mass flow rate of the air film and water jet.
Figure 7 shows that by reducing the air mass flow rate or increasing the circular-orifice diameter (i.e., increasing the water flow), the penetration depth of the spray fraction isoline increased synchronously with the local momentum ratio. Further, the comparison of different spray windward boundary bands indicated that the effect of increasing the circular-orifice diameter was stronger than that of decreasing the air mass flow rate. When the water and air mass flow rate increase and decrease, respectively, to a certain extent, the water jet will exceed the coverage scope of air film, which is adverse for air-water mixing. The corresponding critical point of the local momentum ratio was around 1 for the circular-orifice injection. Taking Figure 7 as an example, the excess part of the windward boundary band will obviously expand in the y direction. In engineering applications, the spray distribution of the pintle injector with discrete radial orifices should be as large as possible without exceeding the coverage scope of gas film to improve the quality of gas–liquid mixing. Thus, the selection of the mass flow rate and throttling area of gas–liquid propellant should be considered under the condition that the local momentum ratio is around 1.

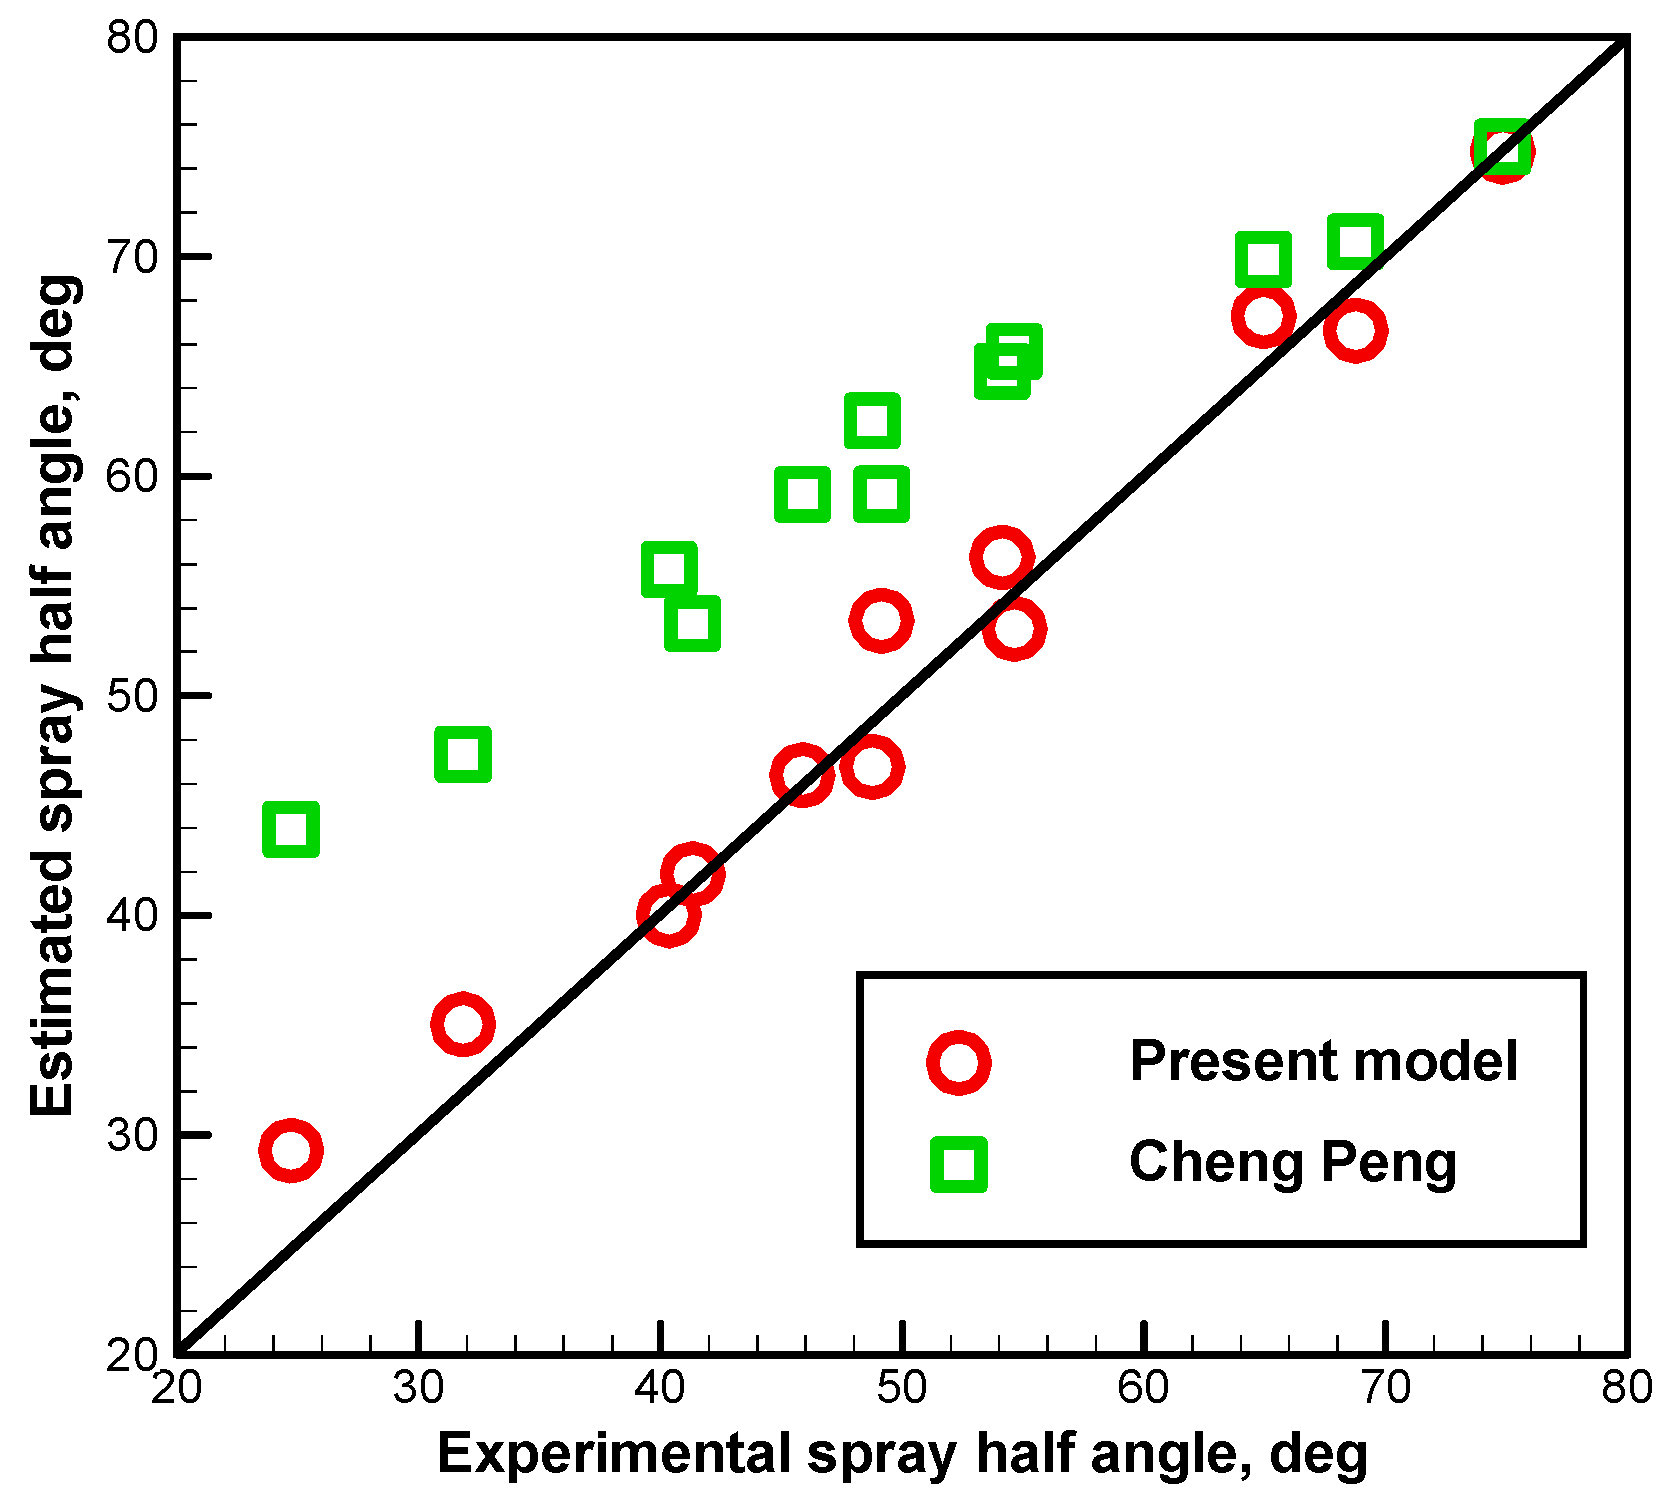
3.3. Empirical Model

According to the above analysis, the following assumptions were made for the boundary band within the coverage scope of air film: there was a proportional relationship between the boundary band width and the penetration depth of the spray fraction isoline γ = 0.5, and the spray fraction was approximately uniformly distributed from left to right at any y-coordinate value. Based on the assumptions, a dimensionless boundary band model was constructed, as shown in Equation (5), which represents the relationship between the penetration depth of the spray fraction isoline, the local momentum ratio, and the y-coordinate value. The experimental data were used to fit the empirical model through the non-linear least squares method, and the optimal constant coefficients in Equation (5) were obtained as follows: a = 3.7771, b = 1.1154, c = 0.5819, e = 0.6703.
x / d = [ a b ( γ 0.5 ) ] L M R c ( y / d ) e
It can be seen from Figure 8 that the estimated results of the dimensionless boundary band model reasonably tracked the experimental data, with most of the determination coefficients (R2) being greater than 90%. Moreover, the determination coefficient decreased gradually as the local momentum ratio moved away from 1. When the local momentum ratio was relatively small (as shown in Figure 8a,d), the experimental data and the estimated results near the orifice outlet were quite different. As the air mass flow rate for such operating conditions was large, the high-density air film expanded significantly after leaving the rectangular slit, and entered the supersonic state. Then, a shock wave and a separation zone [19] were induced upstream of the water jet and the circular orifice, respectively. The separation zone caused the water jet near the orifice outlet to be less affected by the air film, which led to the error at small local momentum ratios; along with the water jet moving away from the separation zone, the estimated results were gradually consistent with the experimental data. When the local momentum was relatively large, the error stemmed from the fact that the gas film easily bypassed the jet and moved directly downstream. The penetration depth of the spray fraction isoline will be larger as the water jet/spray captures less airflow.
As a more commonly used quantitative indicator of spray distribution for pintle injectors, the spray angle can intuitively represent the approximate spray distribution range in the near-field region. The pintle injector element is a simplified design of the pintle injector. As shown in Figure 6, its spray half angle (θ) can be expressed as the angle between the y-axis and the spray windward boundary. As the droplet concentration at the spray windward boundary (i.e., spray fraction isoline γ = 0, which cannot be captured accurately) was too low to effectively participate in the combustion reaction within the liquid rocket engine, the first-order polynomial fitting curve of the spray fraction isoline γ = 0.1 in the shooting range was used as a substitute. There is no widely accepted model for predicting the spray angle of pintle injectors with discrete orifices. Based on the law of momentum conservation, Cheng [11,25] has proposed a common predictive model for the spray half angle: θ = acos(1/(1 + LMR)). It can be seen from Figure 7 that as the y/d increased, the slope gradually decreased to a steady value within the near-field spray range. Thus, the spray half angle of the pintle injector element can be calculated by differentiating the empirical model of the spray windward boundary band and substituting the y/d value at the midpoint position of the spray fraction isoline γ = 0.1:
tan ( θ ) = x y = 2.8309 L M R 0.5819 ( y / d ) - 0.3297
As shown in Figure 9, the spray half angles derived from the boundary band model were in good agreement with the measured result (R2 = 92.35%), and the error was mainly caused by the separation zone upstream of the circular orifice when the local momentum ratio was relatively small. As for Cheng’s predictive model [11,25], the estimated results were significantly higher than the experimental data when the local momentum ratio was low. The reason for this was that the significant spanwise expansion of the spray windward boundary caused more air flow to be captured when the local momentum was low, which was not taken into account by Cheng. The spanwise expansion phenomenon gradually disappeared along with the increase in the local momentum ratio, and the error decreased accordingly.

4. Conclusions

In order to deepen the understanding of the flow and spray characteristics of gas–liquid pintle injectors with discrete radial orifices, the influence of the local momentum ratio on the spray distribution characteristics of the pintle injector element was analyzed by changing the mass flow rate of air and water. Additionally, it was found that the flow coefficient of the radial orifice was mainly determined by the circular-orifice diameter, while that of the axial slit remained basically unchanged under different injection pressure drops.
A quantitative description method for the spray windward boundary band of the gas–liquid pintle injector element is proposed in this paper, which effectively expands the application range of the commonly used evaluation indicators (spray angle and penetration depth) of the spray distribution range. Parameter study showed that the effect of increasing the circular-orifice diameter, i.e., increasing the water mass flow rate, had a stronger effect on extending the spray distribution than reducing the air mass flow rate. It was found that when the local momentum ratio was about 1, the spray distribution range basically overlapped with the coverage scope of gas film with better quality gas–liquid mixing. Moreover, the estimated results of the dimensionless spray windward boundary band model for the circular-orifice jet and the corresponding derivative formula of the spray half angle were in good agreement with experimental data.

Author Contributions

Conceptualization, X.J.; methodology, X.J.; validation, X.C.; investigation, X.J.; resource, Y.Y.; writing—original draft preparation, X.J.; writing—review and editing, Y.Y. and J.W.; visualization, X.J.; supervision, Y.Y.; project administration, X.C.; funding acquisition, X.J. and J.W. All authors have read and agreed to the published version of the manuscript.

Funding

This research was funded by the Independent Development Project of CARDC Hypervelocity Aerodynamics Institute (Program No. KT-ZZFZ-2022-26) and the CARDC Fundamental and Frontier Technology Research Fund (Program No. PJD20190099).

Institutional Review Board Statement

Not applicable.

Informed Consent Statement

Not applicable.

Data Availability Statement

Not applicable.

Conflicts of Interest

The authors declare no conflict of interest.

Nomenclature

AThrottling area of injection channel
CdDischarge coefficient
dCircular-orifice diameter
giGrayscale value
hRectangular-slit height
kSpecific heat ratio
LPintle length
LMRLocal momentum ratio
LsSkip distance
nSample number
PeOutlet pressure of injection channel
PiInlet pressure of injection channel
ΔPInjection pressure drop
qMass flow rate
RGas constant of air, 287.041 J/(kg·K)
TFluid temperature
tTotal test time-length
tsprayTime-length of a certain spatial location occupied by water jet/spray
vInjection velocity
wRectangular-slit width
ρFluid density
γSpray fraction
θSpray half angle
Subscribe
GAir
LWater

References

  1. Wei, X.; Feng, Y.; Ye, J.; Li, N.; Haidn, O.J. Influence of mass flow rate on the atomization characteristics of screw conveyor swirl injectors. Aerospace 2022, 9, 293. [Google Scholar] [CrossRef]
  2. Zhou, C.; Zou, J.; Zhang, Y. Effect of streamwise perturbation frequency on formation mechanism of ligament and droplet in liquid circular jet. Aerospace 2022, 9, 191. [Google Scholar] [CrossRef]
  3. Dressler, G.A.; Bauer, J.M. TRW pintle engine heritage and performance characteristics. In Proceedings of the 36th AIAA/ASME/SAE/ASEE Joint Propulsion Conference & Exhibit, Las Vegas, NV, USA, 24–28 July 2000; Available online: https://arc.aiaa.org/doi/10.2514/6.2000-3871 (accessed on 15 July 2022).
  4. Dressler, G.A. Summary of deep throttling rocket engines with emphasis on Apollo LMDE. In Proceedings of the 42nd AIAA/ASME/SAE/ASEE Joint Propulsion Conference & Exhibit, Sacramento, CA, USA, 9–12 July 2006; Available online: https://arc.aiaa.org/doi/abs/10.2514/6.2006-5220 (accessed on 15 July 2022).
  5. Casiano, M.J.; Hulka, J.R.; Yang, V. Liquid-propellant rocket engine throttling: A comprehensive review. J. Propuls. Power 2010, 26, 897–923. [Google Scholar] [CrossRef]
  6. Betts, E.M.; Frederick, R.A. A historical systems study of liquid rocket engine throttling capabilities. In Proceedings of the 46th AIAA/ASME/SAE/ASEE Joint Propulsion Conference & Exhibit, Nashville, TN, USA, 25–28 July 2010; Available online: https://arc.aiaa.org/doi/abs/10.2514/6.2010-6541 (accessed on 15 July 2022).
  7. Sun, Z.; Jia, Y.; Zhang, H. Technological advancements and promotion roles of Chang’e-3 lunar probe mission. Sci. China Ser. E Technol. Sci. 2013, 56, 2702–2708. [Google Scholar] [CrossRef]
  8. Yue, C.G.; Li, J.X.; Hou, X.; Feng, X.P.; Yang, S.J. Summarization on variable liquid thrust rocket engines. China Ser. E Technol. Sci. 2009, 52, 2918–2923. [Google Scholar] [CrossRef]
  9. Heister, S.D. Handbook of Atomization and Sprays: Theory and Applications; Springer Science & Business Media: New York, NY, USA, 2011. [Google Scholar]
  10. Sakaki, K.; Funahashi, T.; Nakaya, S.; Tsue, M.; Kanai, R.; Suzuki, K.; Inagawa, T.; Hiraiwa, T. Longitudinal combustion instability of a pintle injector for a liquid rocket engine combustor. Combust. Flame 2018, 194, 115–127. [Google Scholar] [CrossRef]
  11. Cheng, P. The Dynamics of Spray Combustion in Variable Thrust Rocket Engines. Ph.D. Thesis, Graduate School of National University of Defense Technology, Changsha, China, 2018. [Google Scholar]
  12. Jin, X.; Shen, C.; Zhou, R.; Fang, X. Effects of LOX particle diameter on combustion characteristics of a gas-liquid pintle rocket engine. Int. J. Aerosp. Eng. 2020, 2020, 8867199. [Google Scholar] [CrossRef]
  13. Son, M.; Radhakrishnan, K.; Koo, J.; Kwon, O.C.; Kim, H.D. Design procedure of a movable pintle injector for liquid rocket engines. J. Propuls. Power 2017, 33, 858–869. [Google Scholar]
  14. Radhakrishnan, K.; Son, M.; Lee, K.; Koo, J. Effect of injection conditions on mixing performance of pintle injector for liquid rocket engines. Acta Astronaut. 2018, 150, 105–116. [Google Scholar] [CrossRef]
  15. Lee, K.; Shin, D.; Son, M.; Moon, H.; Koo, J. Flow visualization of cryogenic spray from a movable pintle injector. J. Vis. 2019, 22, 773–781. [Google Scholar] [CrossRef]
  16. Lee, S.; Koo, J.; Yoon, Y. Effects of skip distance on the spray characteristics of a pintle injector. Acta Astronaut. 2021, 178, 471–480. [Google Scholar] [CrossRef]
  17. Zhang, Y.; Yu, N.; Tian, H.; Li, W.; Feng, H. Experimental and numerical investigations on flow field characteristics of pintle injector. Aerosp. Sci. Technol. 2020, 103, 105924. [Google Scholar] [CrossRef]
  18. Zhou, W.; Xu, X.; Yang, Q.; Zhao, R.; Jin, Y. Experimental and numerical investigations on the spray characteristics of liquid-gas pintle injector. Aerosp. Sci. Technol. 2022, 121, 107354. [Google Scholar] [CrossRef]
  19. Jin, X.; Bing, C. Fragmentation and atomization characteristics of near-orifice liquid jet under transverse gas film. Acta Phys. Sin. 2022, 71, 114701. [Google Scholar] [CrossRef]
  20. Jin, X.; Bing, C.; Lin, S.; Zhou, R. Experimental study on the spray characteristics of a gas-liquid pintle injector element. J. Vis. 2022, 25, 467–481. [Google Scholar] [CrossRef]
  21. Tharakan, T.J.; Rafeeque, T.A. The role of backpressure on discharge coefficient of sharp edged injection orifices. Aero. Sci. Technol. 2016, 49, 269–275. [Google Scholar] [CrossRef]
  22. Yu, B.; Fu, P.; Zhang, T.; Zhou, H. The influence of back pressure on the flow discharge coefficients of plain orifice nozzle. Int. J. Heat Fluid Flow 2013, 44, 509–514. [Google Scholar] [CrossRef]
  23. Wu, L.; Wang, Z.; Li, Q.; Li, C. Unsteady oscillation distribution mo del of liquid jet in sup ersonic crossflows. Acta Phys. Sin. 2016, 65, 094701. [Google Scholar]
  24. Otsu, N. A threshold selection method from gray-level histogram. IEEE Trans. Syst. Man Cybern. 1979, 9, 62–66. [Google Scholar] [CrossRef]
  25. Cheng, P.; Li, Q.; Xu, S.; Kang, Z. On the prediction of spray angle of liquid-liquid pintle injectors. Acta Astronaut. 2017, 138, 145–151. [Google Scholar] [CrossRef]
Figure 1. Schematic diagram of the experimental platform.
Aerospace 09 00494 g001
Figure 2. Structure of the gas–liquid pintle injection element [20].
Aerospace 09 00494 g002
Figure 3. Variances in the discharge coefficients with the injection pressure drop.
Aerospace 09 00494 g003
Figure 4. The typical side and front views of the spray far field [20].
Aerospace 09 00494 g004
Figure 5. Preprocessing of the frozen spray pattern.
Aerospace 09 00494 g005
Figure 6. Extraction of the windward boundary band [20].
Aerospace 09 00494 g006
Figure 7. Spray windward boundary bands for various operating conditions; superimposed on the contour are the spray fraction isolines (γ = 0, γ = 0.5, and γ = 1).
Aerospace 09 00494 g007
Figure 8. Comparison of the experimental data points and estimated curves for different spray fraction isolines (γ = 0.1, γ = 0.5, and γ = 0.9).
Aerospace 09 00494 g008
Figure 9. Comparison of the measured and estimated spray half angles.
Aerospace 09 00494 g009
Table 1. Operating conditions.
Test No.Injection Orifice and qL (g/s)
A and 8.18B and 12.27C and 24.54D and 49.08
qG (g/s)
and
vG (m/s)
67.42 & 262.89CT01#CT07#CT13#CT19#
33.41 & 265.22CT02#CT08#CT14#CT20#
21.95 & 269.01CT03#CT09#CT15#CT21#
16.29 & 272.04CT04#CT10#CT16#CT22#
12.98 & 273.06CT05#CT11#CT17#CT23#
10.70 & 275.90CT06#CT12#CT18#CT24#
Publisher’s Note: MDPI stays neutral with regard to jurisdictional claims in published maps and institutional affiliations.

