Article

Numerical Study of the Ratio of Depth-to-Print Diameter on the Performance and Flow Characteristics for a Dimpled, Highly Loaded Compressor Cascade

1
Marine Engineering College, Dalian Maritime University, Dalian 116026, China
2
Naval Architecture and Ocean Engineering College, Dalian Maritime University, Dalian 116026, China
3
School of Energy and Power Engineering, Beihang University, Beijing 100191, China
4
School of Energy and Power Engineering, Dalian University of Technology, Dalian 116026, China
*
Author to whom correspondence should be addressed.
Aerospace 2022, 9(8), 422; https://doi.org/10.3390/aerospace9080422
Submission received: 3 July 2022 / Revised: 28 July 2022 / Accepted: 29 July 2022 / Published: 3 August 2022
(This article belongs to the Special Issue Fluid Flow Mechanics (2nd Edition))

Abstract

:
The influence of the ratio of dimple depth-to-print diameter ( λ ) on the highly loaded compressor cascade NACA0065-K48 is investigated based on the Reynolds-averaged Navier–Stokes (RANS) method. Simulations are conducted with a validated shear-stress transportation (SST) turbulence model coupled with the Gamma-Theta ( γ Re θ ) transition model at the inlet Mach number of 0.7. At 5~25% of the axial chord on the suction surface, four rows of dimples are arranged in parallel, and the dimples’ spacing is 4 mm. Moreover, there are five kinds of λ , ranging from 0.125 to 0.875, which determine the pressed arc of a spherical dimple. Three flow regimes (diffuser–confuser flow, tornado-like vortex and horseshoe vortex) with the same topological structure are observed in these dimples, which affect the flow and performance of the cascade by changing the energy distribution. The distribution of turbulent kinetic energy (TKE) reflects the disturbance of the tornado-like vortex in the inferior arc dimples ( λ = 0.375 ) intensely, whereas the disturbance of the horseshoe vortex in superior arc dimples ( λ = 0.625 ,   0.875 ) is relatively weak. Numerical results indicate that the loss of the corner separation can be reduced with a dimples array, which is mainly related to the vertical climbing of the lateral flow that delays the starting point of the corner separation and weakens the mixing process. However, the loss in the wake of the dimpled cascades increases, which is caused by the thickened boundary layer induced by the high turbulent vortices. The dimpled cascade with λ = 0.625 can achieve the most significant loss reduction (13.47%), while ensuring the pressurization capacity.

1. Introduction

A highly loaded axial compressor with maximizing work is one of the primary pursuits of aero-engine designers, which is conducive to elevating the thrust–weight ratio [1]. According to the theory of the elementary stage, the work output of the compressor cascade mainly depends on wheel speed and the swirl velocity difference of airflow. Meanwhile, the change in swirl velocity is mainly determined by parameters related to the boundary layer [2]. Therefore, flow control technology is applied to minimize the influence of the boundary layer.
The flow control method is generally divided into active and passive modes [3]. The active control method means that appropriate external energy is needed to decrease the low-energy fluid, which has the potential to achieve an optimal performance of the full working conditions, such as boundary layer suction [4] and injection [5]. Pulsed injection/suction [6,7] gives the active control method more advantages than the conventional one under the same control flow rate, mainly because the generated higher momentum fluid stimulates the boundary layer through additional vortex structures. On the contrary, air jets have also been described as expanding the vortex to the flow field to improve the mixing process by injecting the flow that blocks the mainstream [8]. A twisted tape [9] structure of swirling impinging jets was proved to enhance the overall heat transfer rate. Similarly to Ref. [6], acute three-dimensionality was obtained by changing the injection angle, which transports more momentum. Compared with active control methods, passive control technologies garner more attention because there are no worries about weight increase and additional systems, including vortex generators (VGs) [10], rough surfaces [11], riblets [12] and so on. In addition to the above methods of energy redistribution by induced vorticity, it is also a passive strategy to change the flow field by installing a wedge [13] to generate oblique shock in supersonic flow. For the corner separation in compressor cascades, an end wall design [14] and end wall fence [15] were used to passively and effectively control the secondary flow.
The essence of the dimpled surface is a kind of VG, which can result in an earlier transition in the boundary layer. The exploration of this mechanism is driven by its excellent performance in drag reduction and heat transfer enhancement. In 1974, Achenbach [16] found that compared with smooth spheres, the critical Reynolds number of spheres roughened with glass spheres was smaller, and the drag coefficient was reduced. This is mainly because the flow after the transition has a stronger ability to resist separation. Generally, the resistance decrease in the dimpled surface is attributed to the reduction of pressure drag related to the wake. Inspired by drag reduction, Ananthan et al. [17] employed shallow dimples to suppress the trailing-edge noise of the airfoil. The generation and separation of the boundary layer were delayed by the suction and slip effect of the semicircular groove on the vehicle body, and the aerodynamic noise was also effectively controlled [18]. Previous studies have discovered that the concavity surfaces enhance heat transfer while reducing drag losses. Lin et al. [19] demonstrated the internal flow structure of staggered hemispherical cavities arranged on the high-aspect ratio channel by numerical simulations. There were two kinds of vortex structures in each hole, which have significant effects in enhancing the surface heat transfer. Ligrani et al. [20] gave the temporal and spatial evolution patterns of vortex structures that were shed from dimples in the flat channel through a smoke tracking test. In the flat channel, the mechanism of these spherical dimples was still explored through experiments or numerical methods [21,22]. Isaev et al. [23] found that with the increase in dimple depth, the corresponding jet–vortex flow pattern changed from a thin separation on the leeward side to an asymmetric tornado-like flow, and the heat transfer efficiency increased due to the enhancement of the vortex flow. Interestingly, the asymmetric dimples transformed a pair of vortexes into a monovortex tornado-like structure, thereby improving the heat transfer capacity [24]. Furthermore, the spherical dimples have been developed into a set of one-row oval-trench dimples, which can obtain a higher recirculation flow velocity. For the turbine that is in urgent need of cooling technologies, the research reported on the dimpled surface precedes the mechanism [25].
Since low-pressure turbines (LPT) are prone to separation, Lake et al. [26] processed dimple structures with a depth of 1.59 mm on the suction surface of a Pak-B blade. When a spacing of 2.2 mm was arranged in a single row near the separation point, the loss coefficient was relatively reduced. Zhang et al. [27] tried to use two different devices, surface trips and vented air jets, to eliminate laminar separation bubbles (LSB) in ultra-high-lift LPT and found that round dimples with a depth of 0.29 mm had less total pressure loss at the lowest Reynolds number. In the field of wind turbines and hydrofoils, the effect of dimpled surfaces to control separation, which is used to improve the lift coefficient, is also concerned. Sobhani et al. [28] simulated the two-dimensional NACA0021 airfoil of a darrieus vertical axis wind turbine and found that the average efficiency could be improved by 25% with a circular dimple. Then, Yoo and Oh [29] further optimized the position, size and depth of a single dimple on the suction side, aiming at the power coefficient, and explained that the dimple could delay the flow separation and weaken the blade wake. For another form named the horizontal wind turbine, Sedighi et al. [30] declared that dimples with an appropriate radius, spacing and locations could increase the generating torque by around 16.08% by delaying or eliminating separations. D’Alessandro et al. [31] pointed out that the dimpled surface that could weaken the LSB was related to the vortices around the dimple: the flow was accelerated after one rotation in the hole, which improved the turbulent kinetic energy and enhanced the ability to resist separation.
There is little literature on the effects of dimples in a compressor cascade. Lu et al. [32] made relevant efforts on a highly loaded linear cascade NACA0065-K48. It was found that four rows of dimples with a depth of 0.2 mm arranged parallelly in the vicinity of the blade-leading edge could eliminate LSB under an inlet Mach number of 0.3 to 0.8. Meanwhile, there are also several geometrical parameters of a dimple that determine the control ability to be studied. As Kim and Shin [33] pointed out, the ratio of depth-to-print diameter of the dimple played the most important role in its function.
For the purposes of exploring the flow control ability of the dimple depth-to-print diameter ratio in a high-speed and high-load compressor cascade, in the present study, the NACA0065-K48 blade with dimples placed at the forward suction surface is numerically analyzed. The simulation is carried out by solving RANS equations completed by a γ R e θ SST turbulence model. From the geometric analysis, dimples are divided into three forms (inferior arc, semicircle arc, superior arc) with a depth-to-print diameter ratio of 0.5 as the boundary. The effect of the dimples is evaluated by the aerodynamic performance (total pressure loss coefficient and deviation angle) of the cascade, then it is divided into the two aspects of wake and corner separation for discussion. Furthermore, the boundary layer of the suction surface and the secondary flow in the corner region are described in detail to clarify the effect of the dimple. In addition, the flow structures over the dimples are shown and modeled to illustrate the disturbance mechanism of the dimples.
This manuscript is organized as follows. The geometric parameters of the reference cascade and dimples are introduced in Section 2. Section 3 provides the governing equations, the numerical setting and its experimental validation. The simulation results are shown in Section 4, including the performance parameters of the cascade (Section 4.1), the flow structure in the cascade passage (Section 4.2) and the vortex structures in the dimples (Section 4.3). Finally, four conclusions are listed in Section 5.

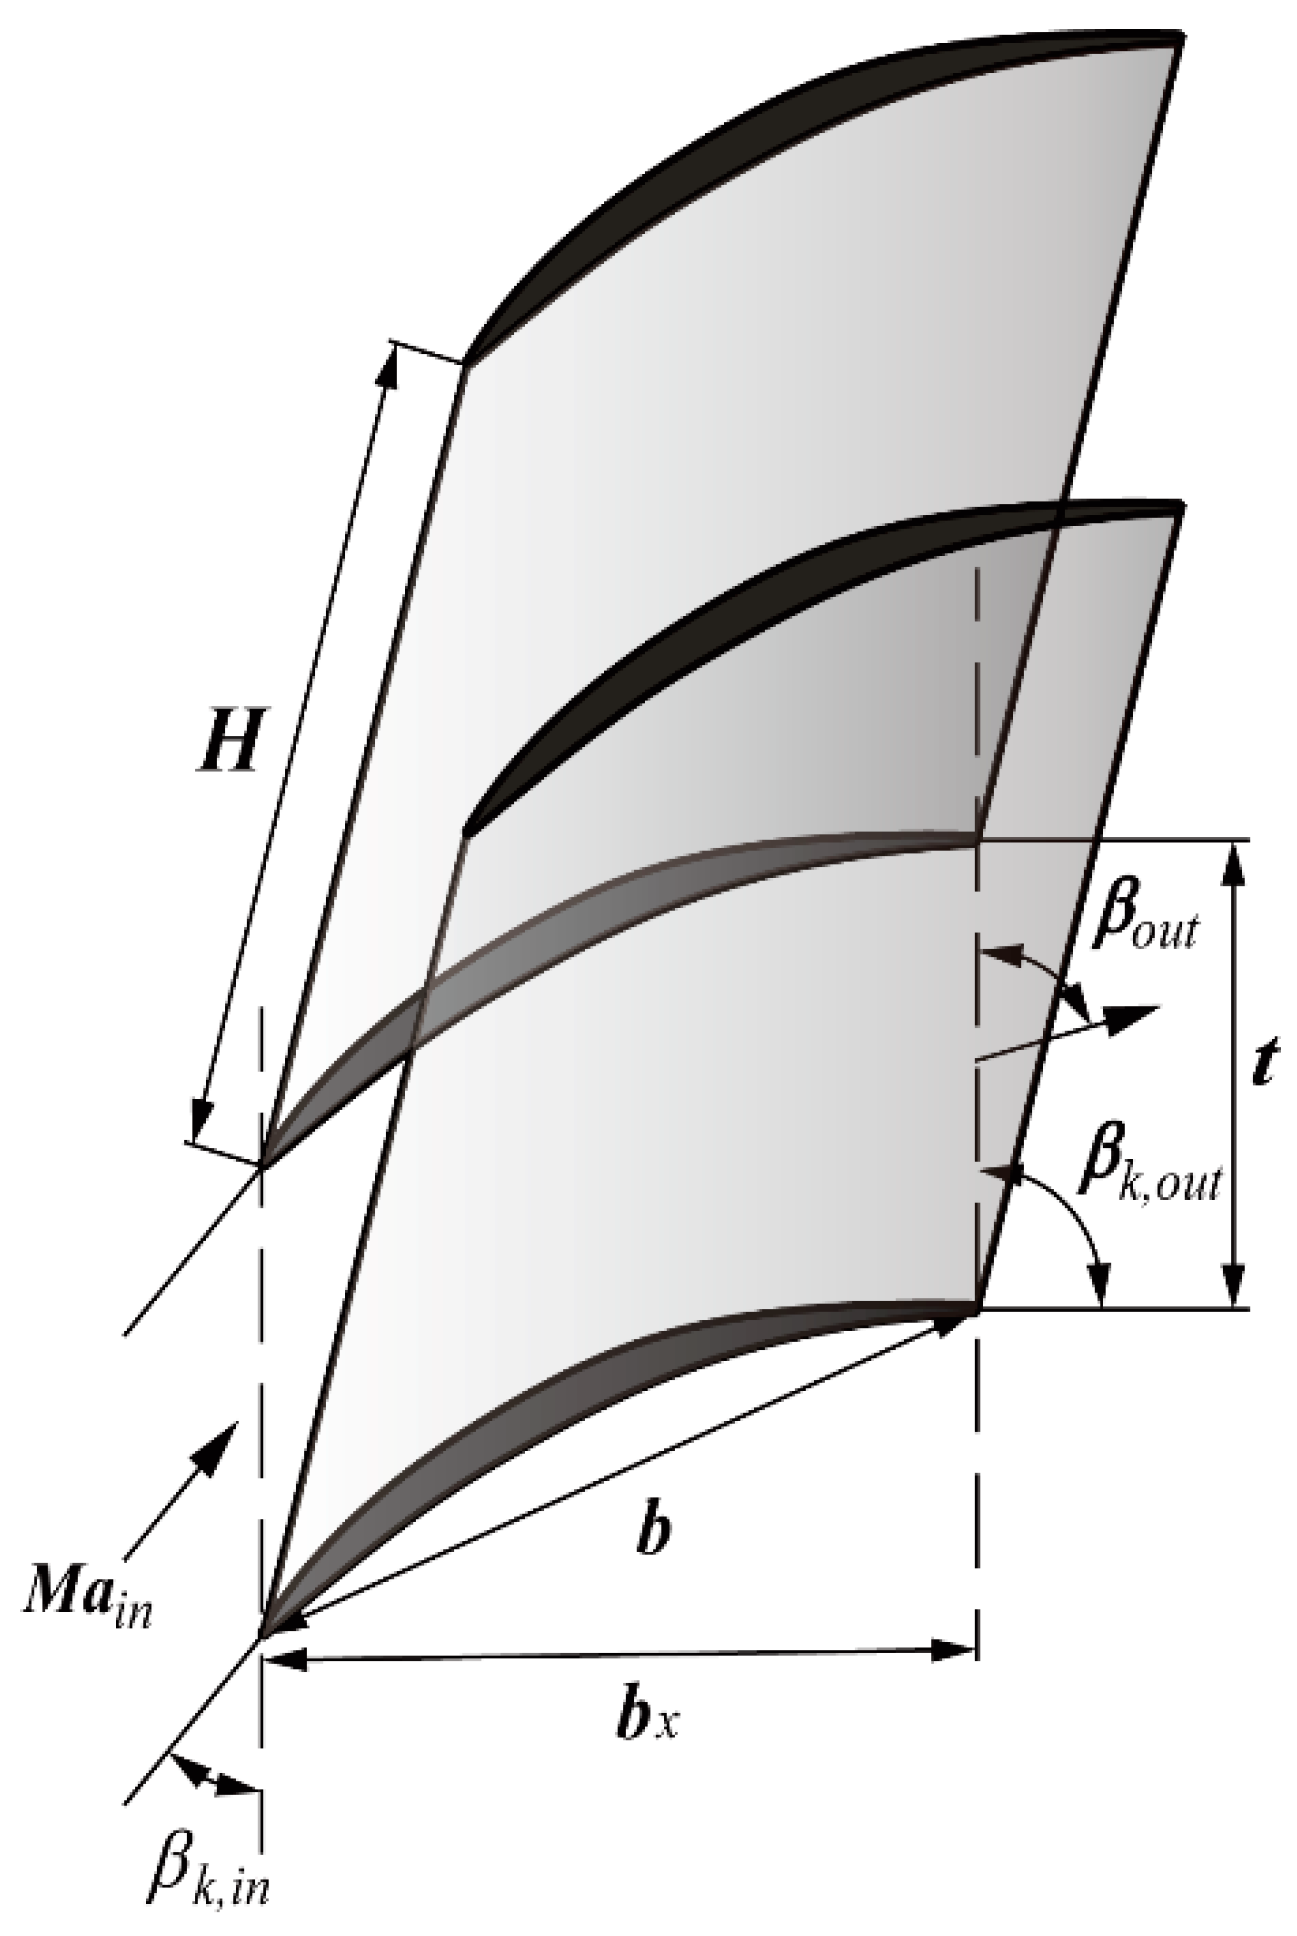
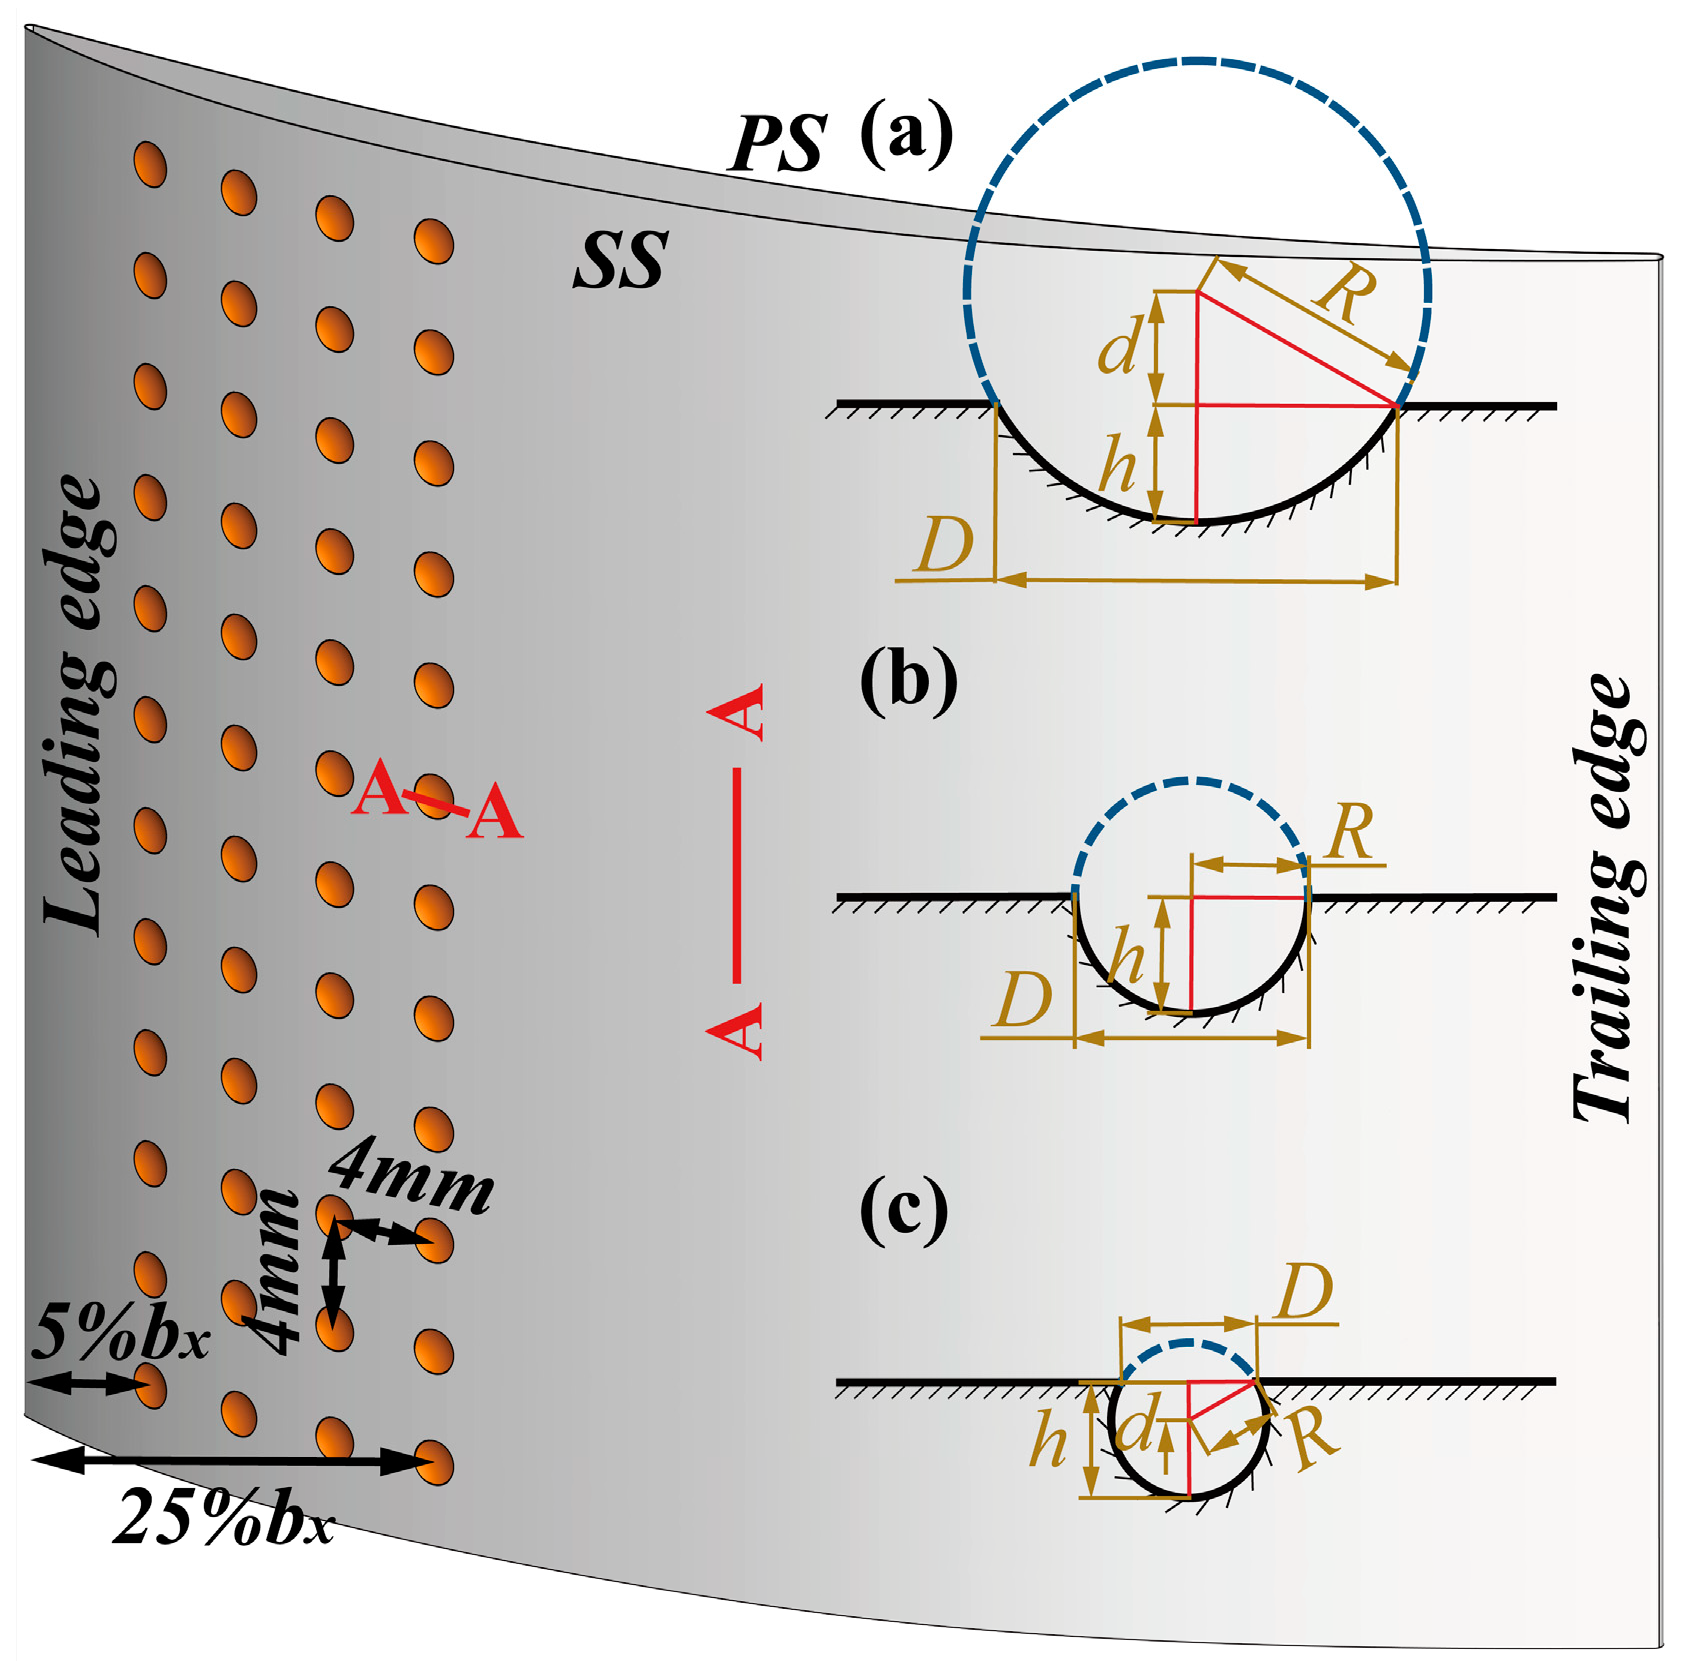
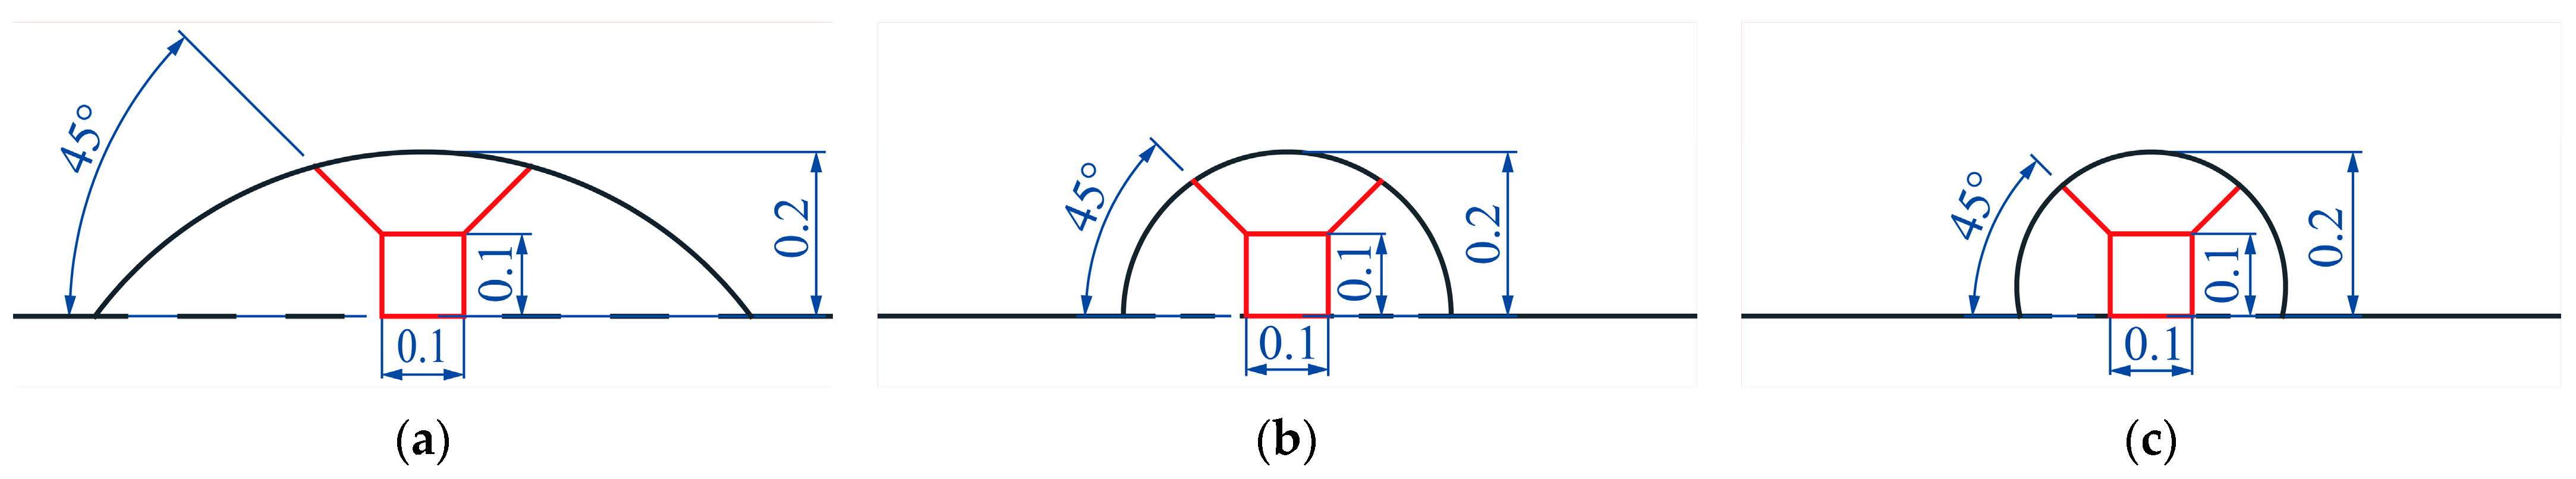
2. Geometric Details of Cascade and Dimple

A linear compressor cascade of NACA0065-K48 [32] was employed as the computational model, which was operated at a Mach number of 0.7. The liner cascade was constructed by stretching a blade directly along a height of 100 mm. It had a minimum loss at the incident angle of 6 ° , and the present study is based on this condition. The primary cascade parameters are summarized in Table 1, and the schematic of the cascade is shown in Figure 1.
Figure 2 shows the schematic of the dimples. Four rows of spherical dimples were arranged in parallel on the suction surface (SS) of the blade at a position of 5–25% of the axial chord ( b x ). The depth of the dimple was 0.2 mm, which was considered to achieve a better performance in Ref. [34]. The spacing between dimples in the streamwise and spanwise directions was 4 mm, which is an empirical value and will be discussed further in the future. The ratio of dimple depth-to-print diameter ( λ = h / D , h is the dimple depth, D is the dimple print diameter) between 0.125 and 0.875, which was adjusted by changing the print diameter D while keeping the depth h unchanged, was studied. The geometric relation d / h = 0.125 ( 1 / λ 2 4 ) can be obtained from Figure 2a, which explains that a dimple can be determined only with the parameters of the ratio λ and the depth h . The portion of the dimple with λ < 0.5 that invades the blade is an inferior arc (INF). When the ratio meets λ = 0.5 , the depth h equals the radius R of the sphere, and the part of the dimple immersed in the blade is a semicircular arc (SEM). When λ > 0.5 , d becomes negative, which means that the immersion is a superior arc (SUP). In order to cover all shapes, the schemes of the dimple and the corresponding specific parameters are shown in Table 2.

3. Computational Methodology

3.1. Definition of Aerodynamic Parameters

In this section, the aerodynamic parameters of this work are specified. Parameters used to evaluate the cascade performance include the total pressure loss coefficient ( ω ), the static pressure rise coefficient ( π ) and the deviation angle ( σ ):
ω = P t ¯ i n P t P t ¯ i n P s ¯ i n
π = P s ¯ o u t   P s ¯ i n  
σ = β k , o u t β o u t
where P t is the local total pressure of the calculation point, P t i n is the inlet total pressure, P s i n denotes the inlet static pressure, and P s o u t is the outlet static pressure. As can be seen in Figure 1, β k , o u t is the geometric outflow angle, and β o u t is the outflow angle. The mass flow weighted average X ¯ is calculated by the following formula:
X ¯ = i = 1 n m i · X i m i
where n is the number of nodes of the region to be measured, and m is the mass flow of measured microelements.
The boundary layer momentum thickness ( δ ) and axial vorticity ( Ω x ) are the parameters that describe the flow field:
δ = 0 δ ρ v ρ 0 v 0 ( 1 v v 0 ) d z
Ω x = w y υ z
where x , y and z are axial, pitch and span direction, respectively, and υ and w represent velocity components of pitch and radial direction, respectively.   δ is the thickness of the boundary layer. The subscript 0 indicates the freestream flow.

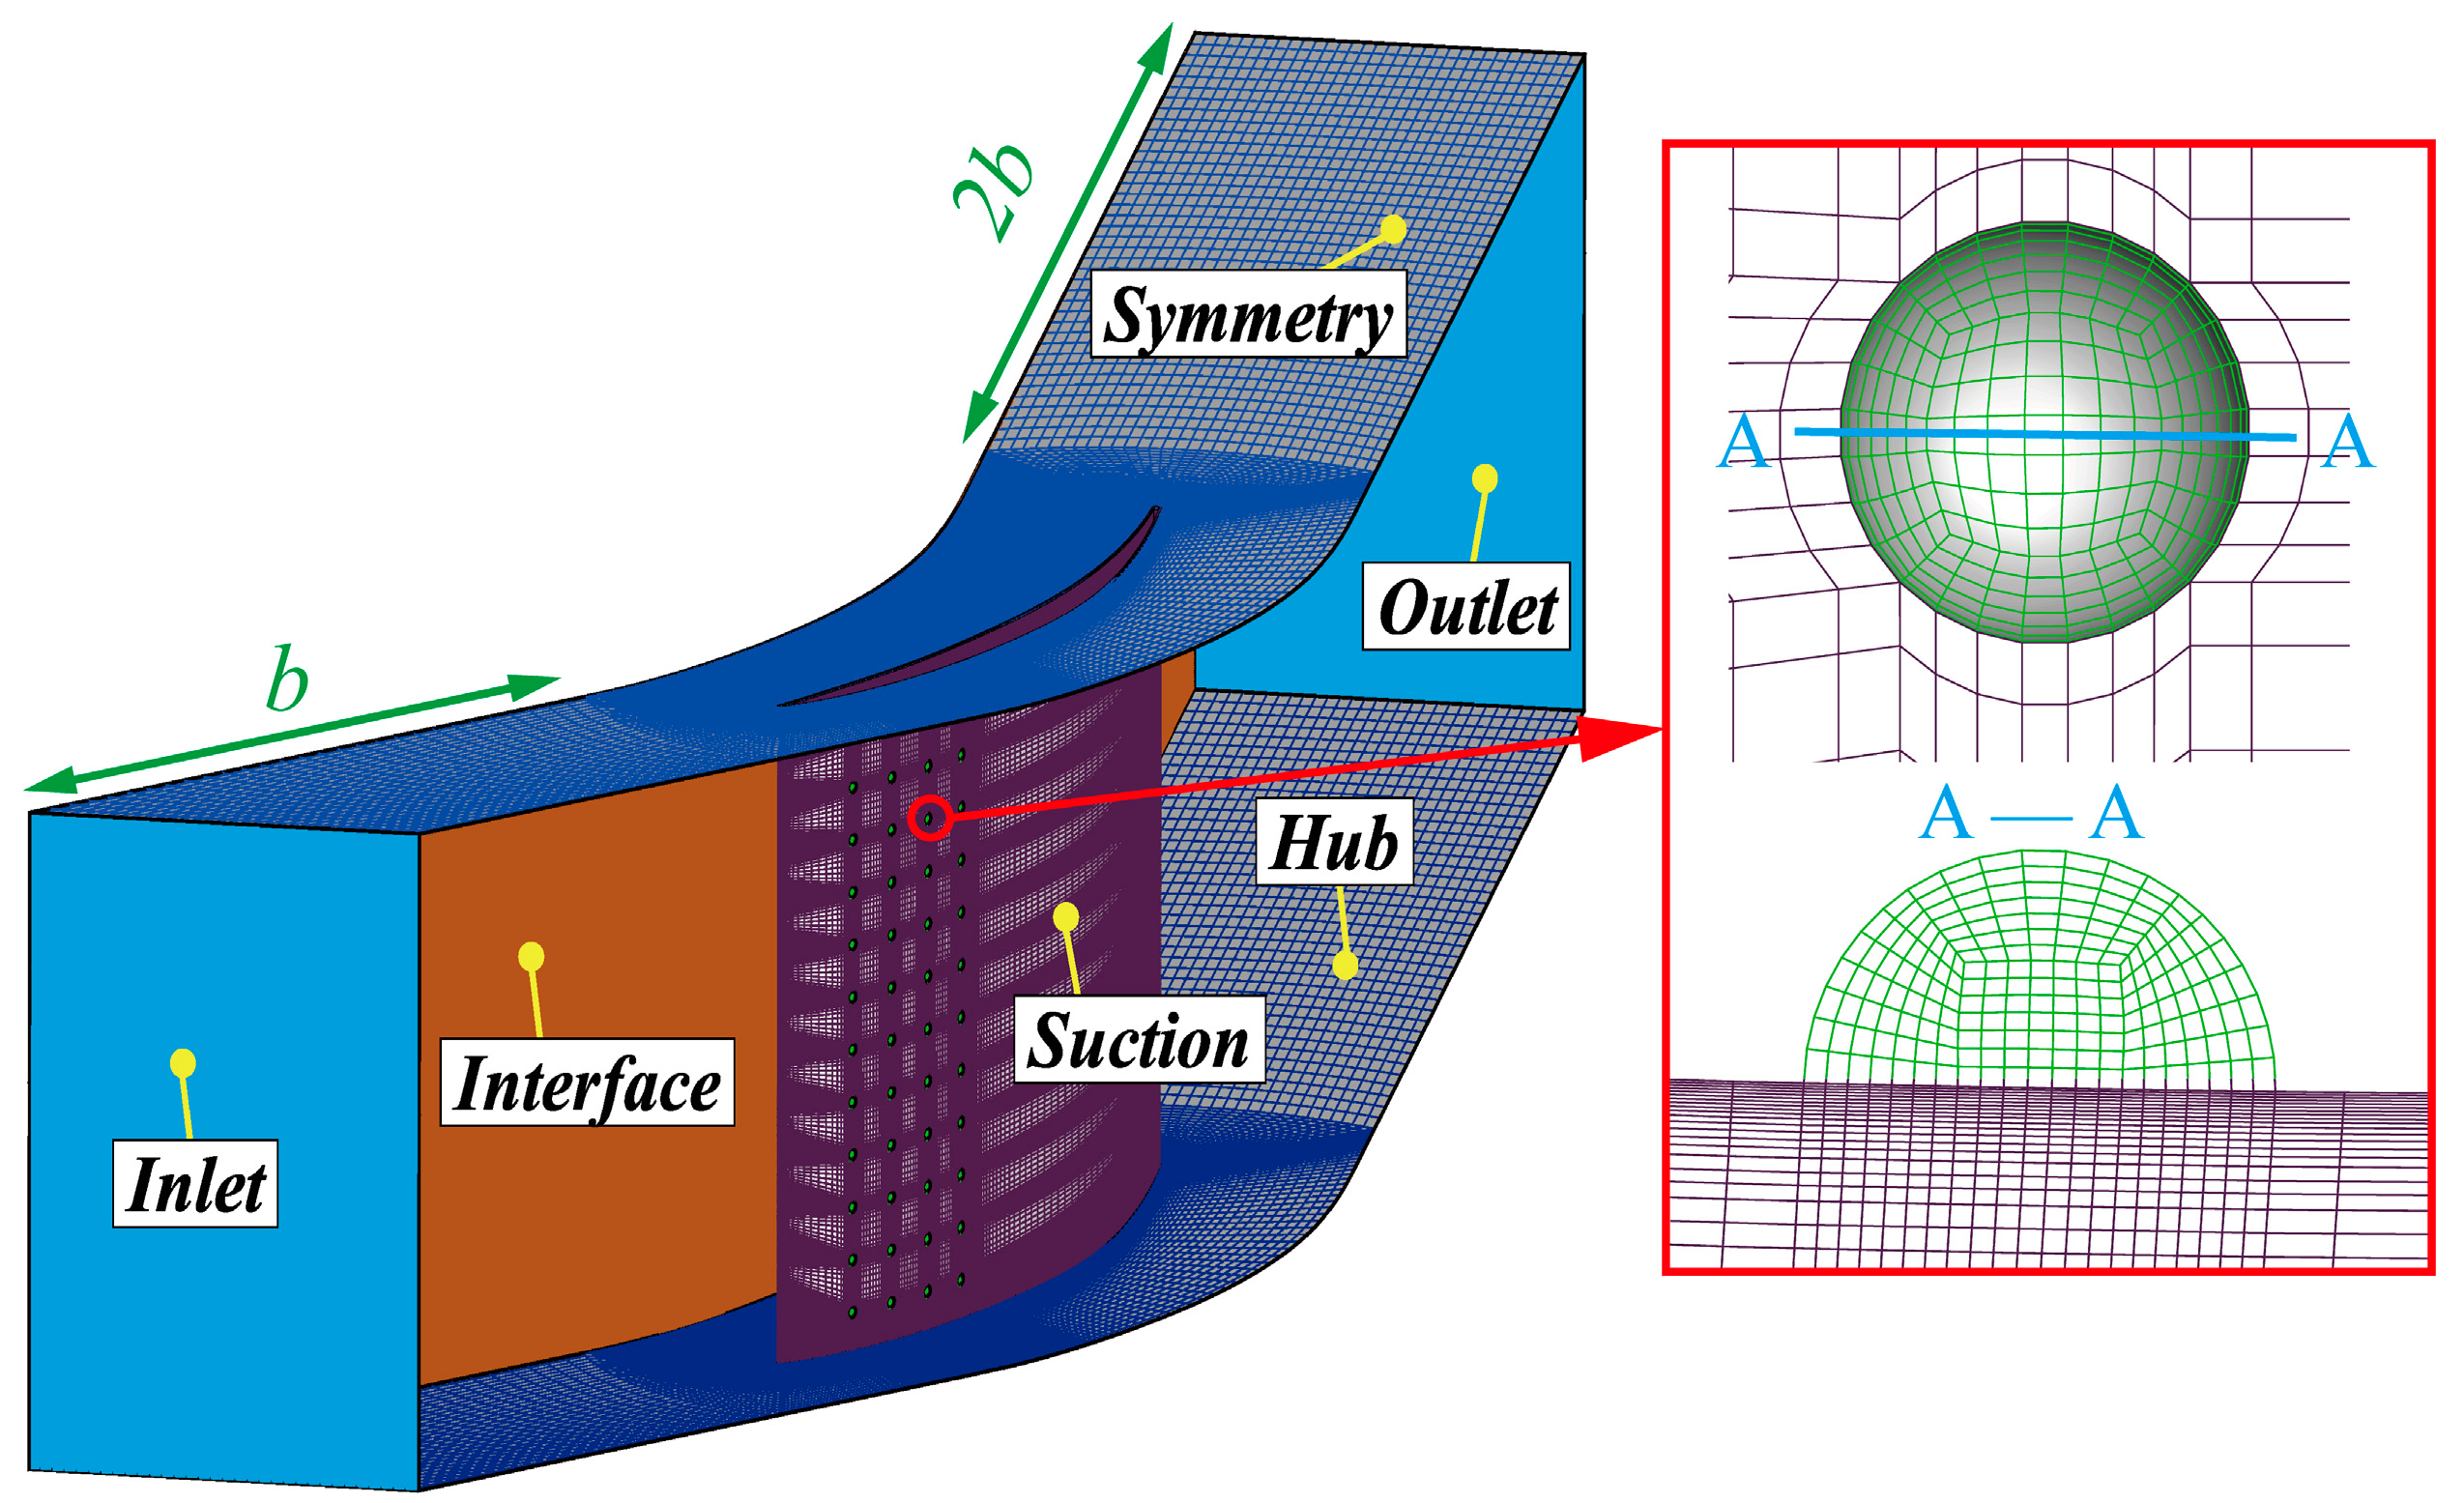
3.2. Computational Domain and Mesh

In order to save computing resources, the computational domain was constructed based on a single blade passage with half-span. The inlet was located at 1.0b upstream of the leading edge and 2.0b downstream of the trailing edge for the outlet. Hexahedral structural meshes were generated with an H-O-H topology in Ansys ICEM, shown in Figure 3. For mesh details inside the dimple, a C-shaped topology, which is conducive to maintaining the orthogonality at dimple junctions, was used, as shown in Figure 4. Therefore, the angle of the generated mesh is more than 30.6 ° and the mesh warpage is less than 28.8 ° . The first mesh layer height ( Δ y = y +   μ / ρ u ) was estimated at 1 × 10 6 m to ensure a y + value of approximately 1, which ensures that the turbulence model used in this simulation could accurately capture the transition boundary layer. Meanwhile, the growth rate of the grids was set to 1.1 to prevent divergence.
Table 3 lists the results of the gird independence study of cascades without dimples (ORI) and with dimples (DIM). The control nodes of ORI are the grids around the blade along the axial direction. As the number of nodes on the edges of the C-type grid increases from 4 × 4 × 4 to 10 × 10 × 10 , the total number of grids of DIM increases from 4.45 million to 9.31 million. The error refers to the absolute difference between the average of small fluctuations and the fluctuations themselves. The fine grid was 1,740,000 for ORI, as its error is small and the y + begins to stabilize. The parameters of the DIM had a slight difference after the grid number reached 7.22 million, and the grid with 8,174,000 cells was used for subsequent calculations to clearly show the flow of details in the dimples.

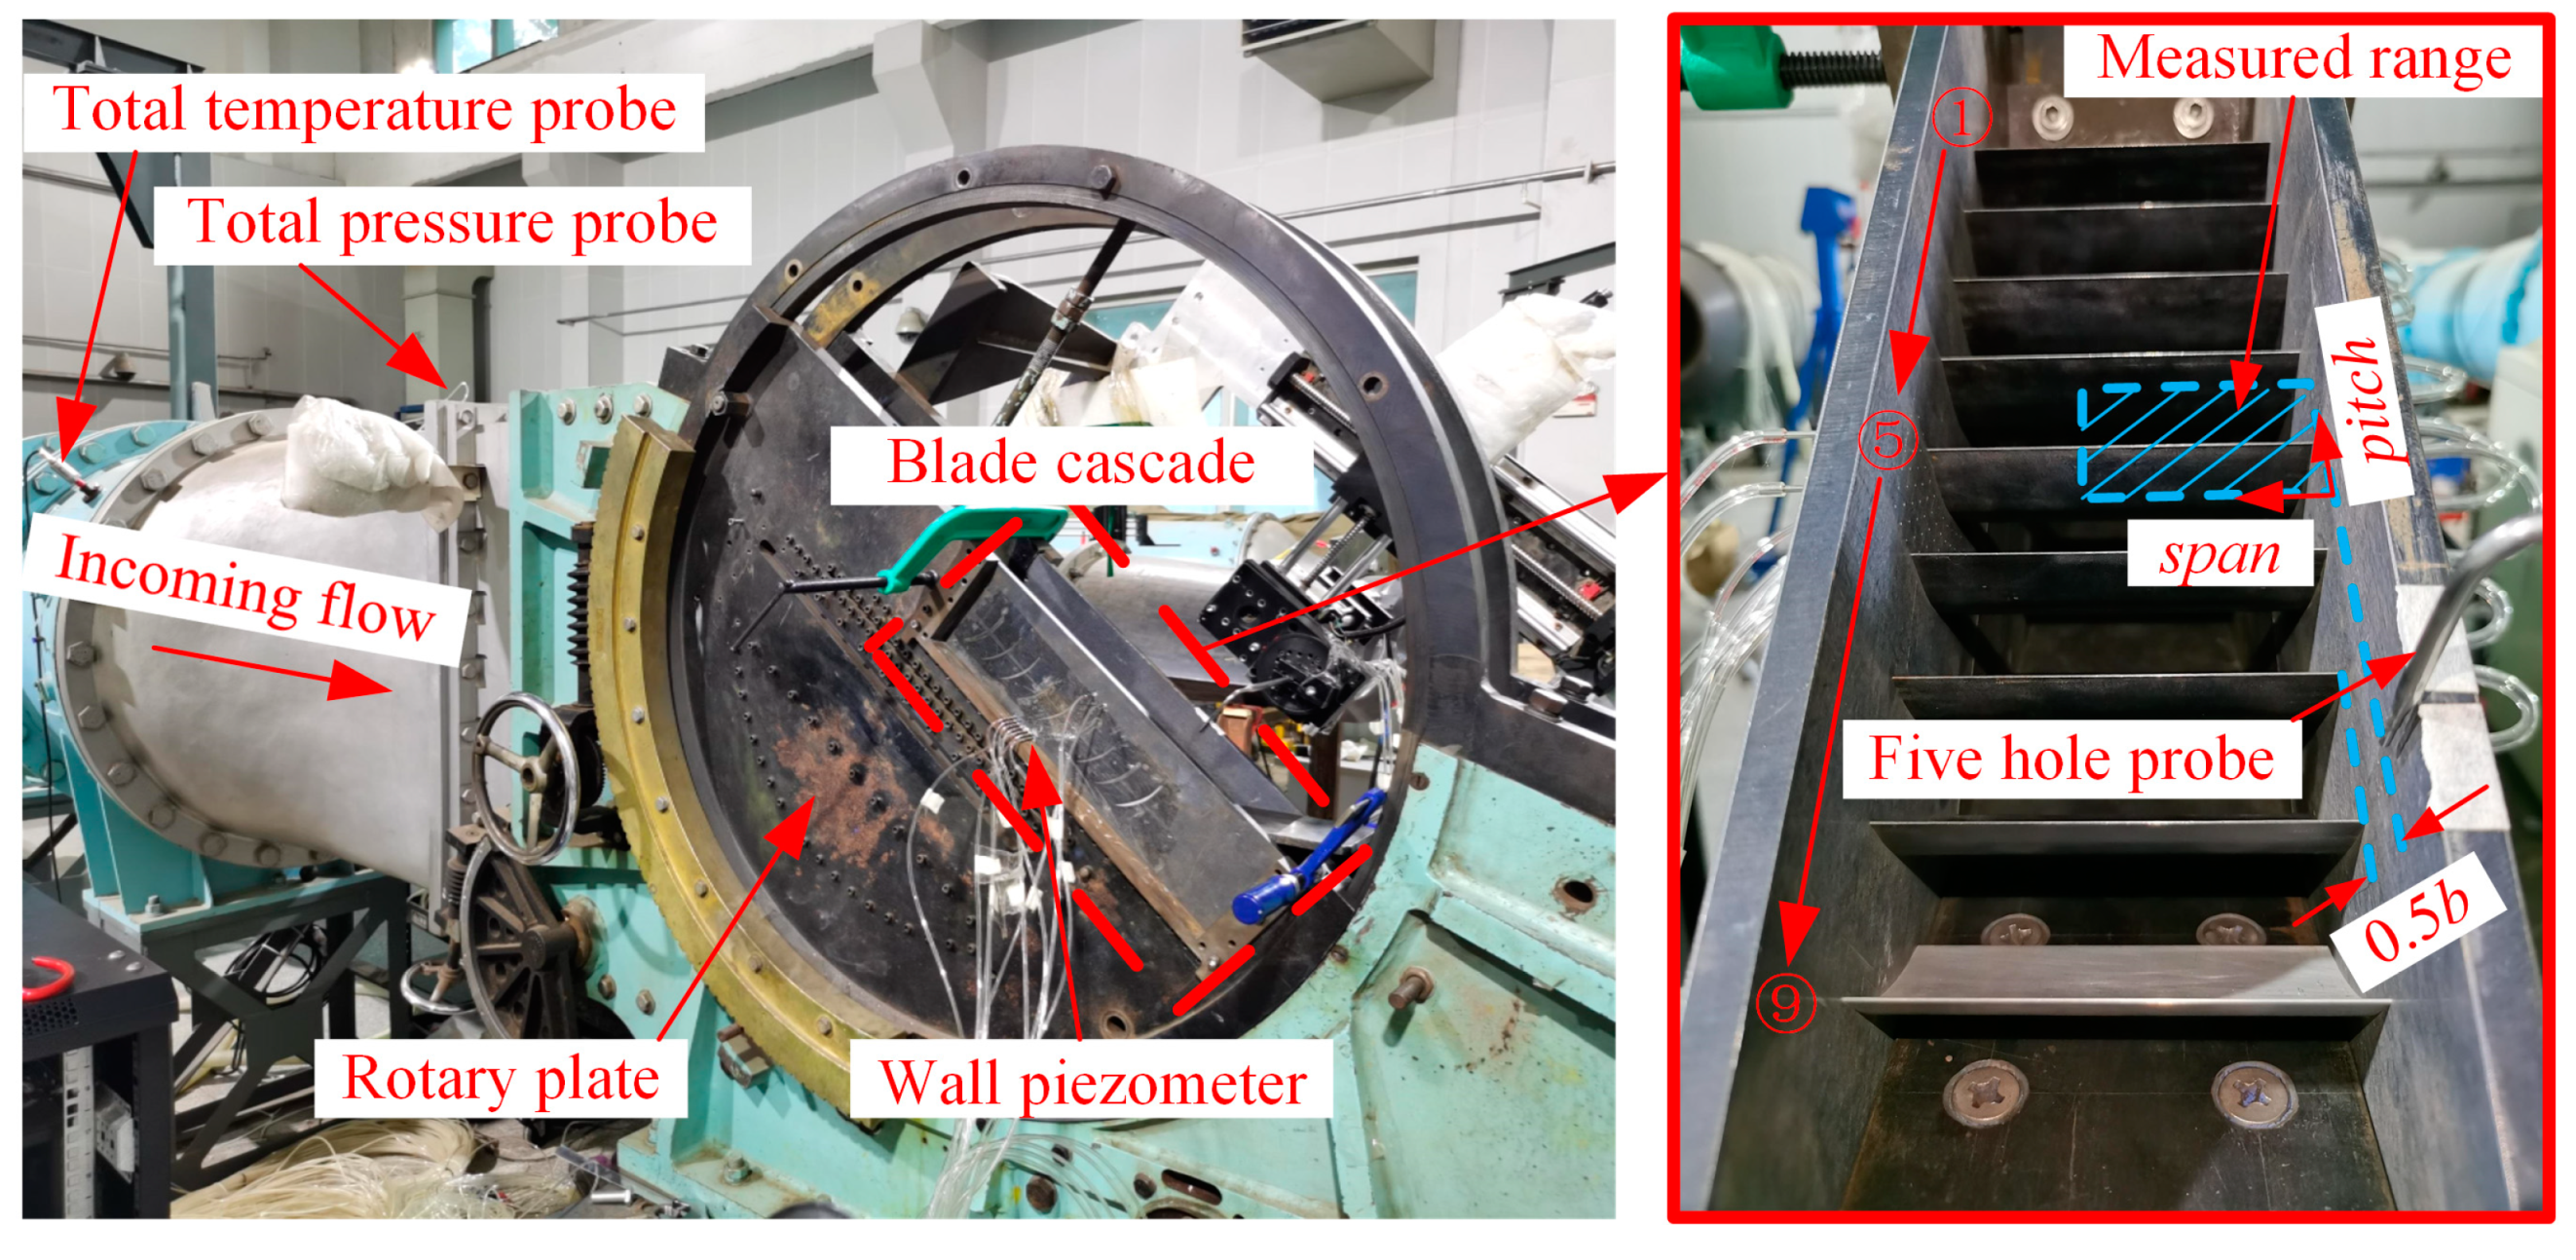
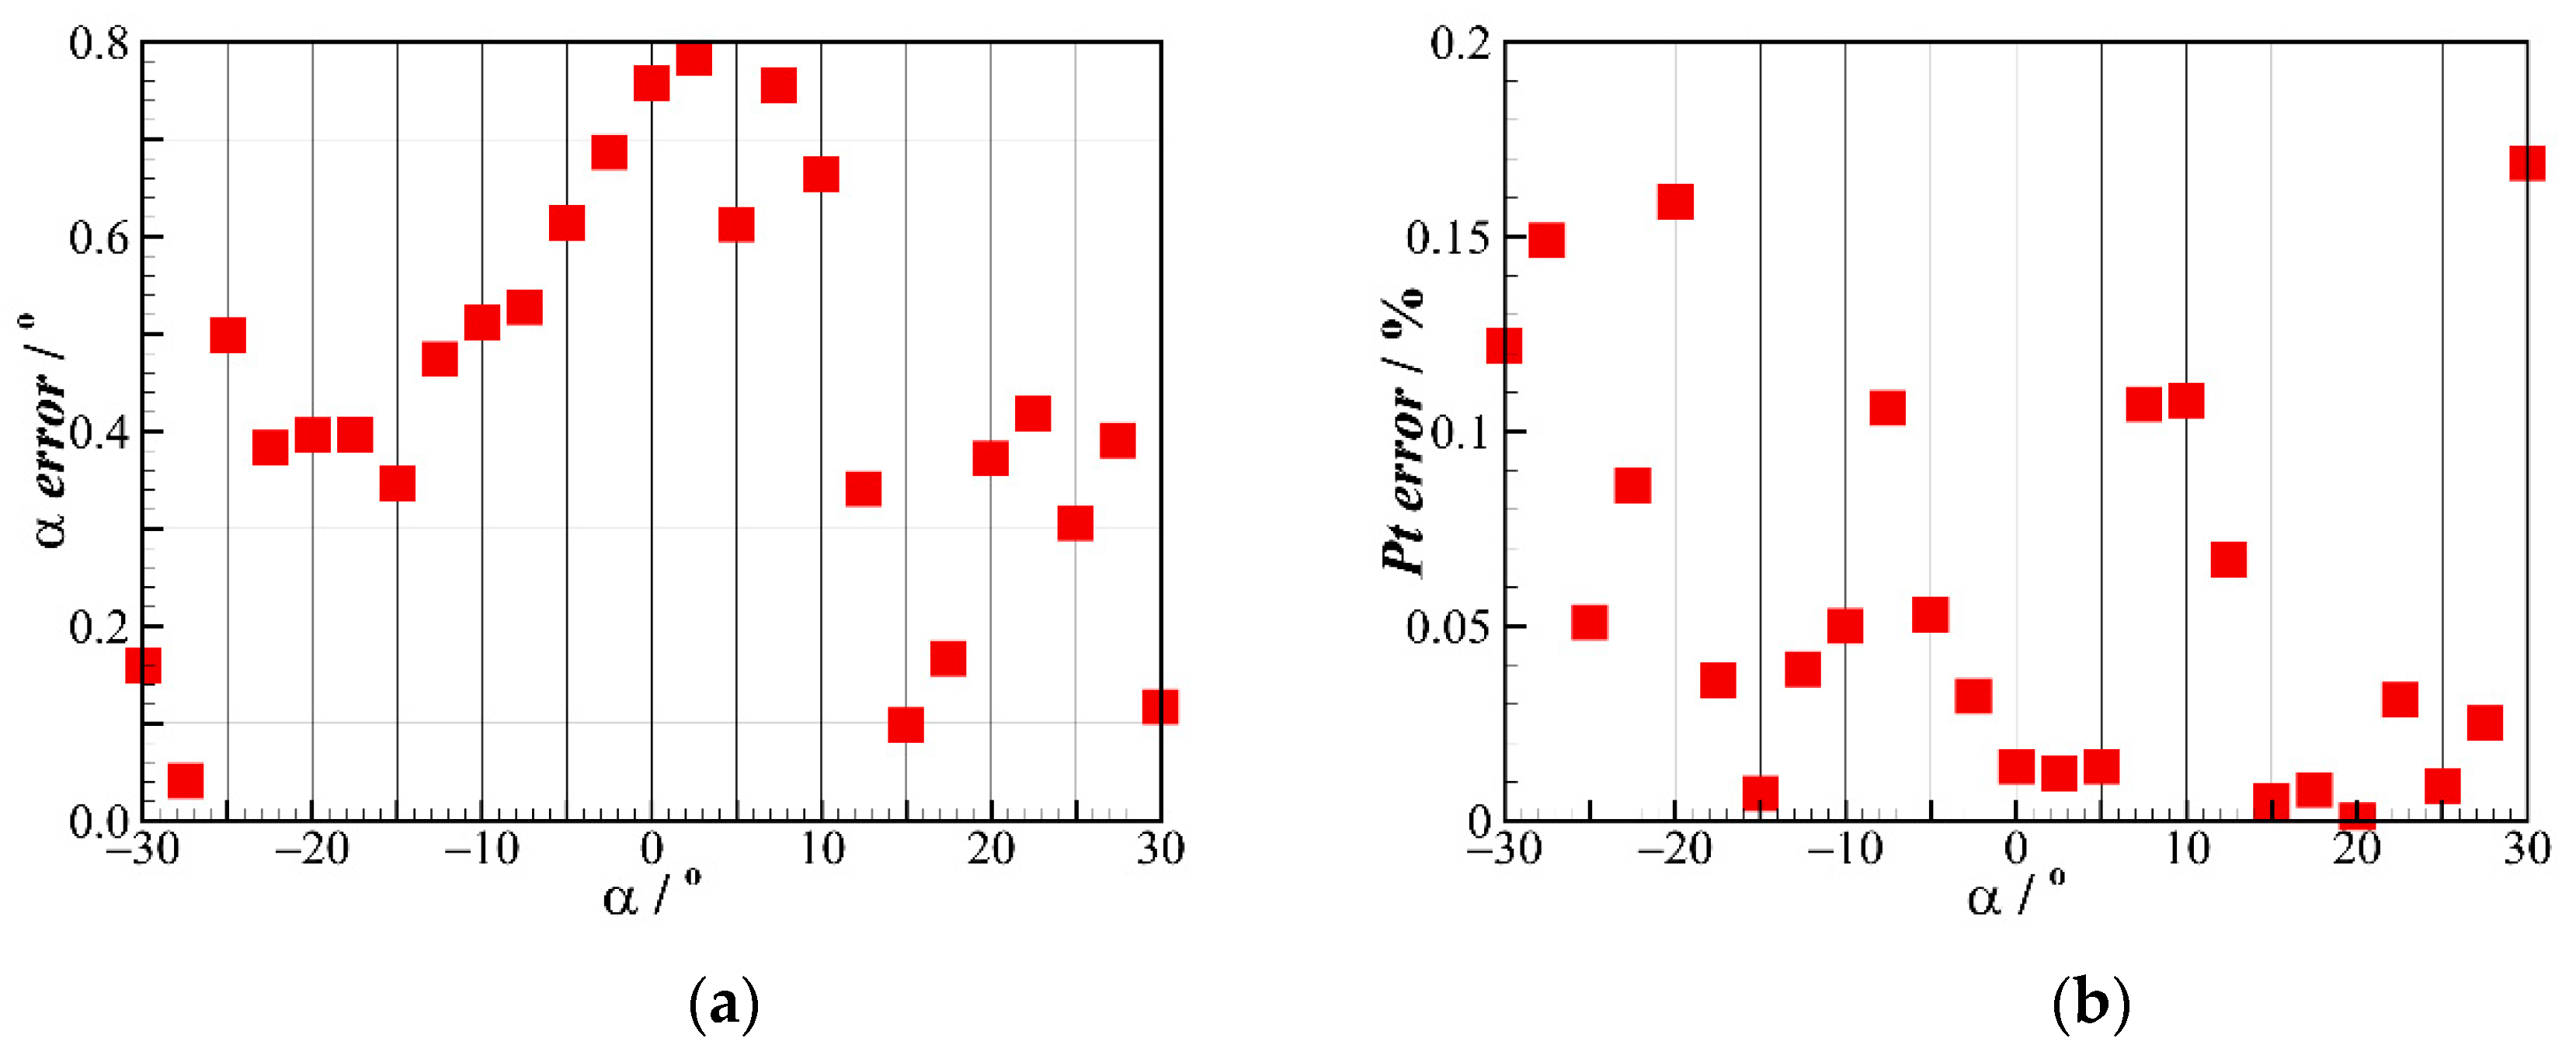
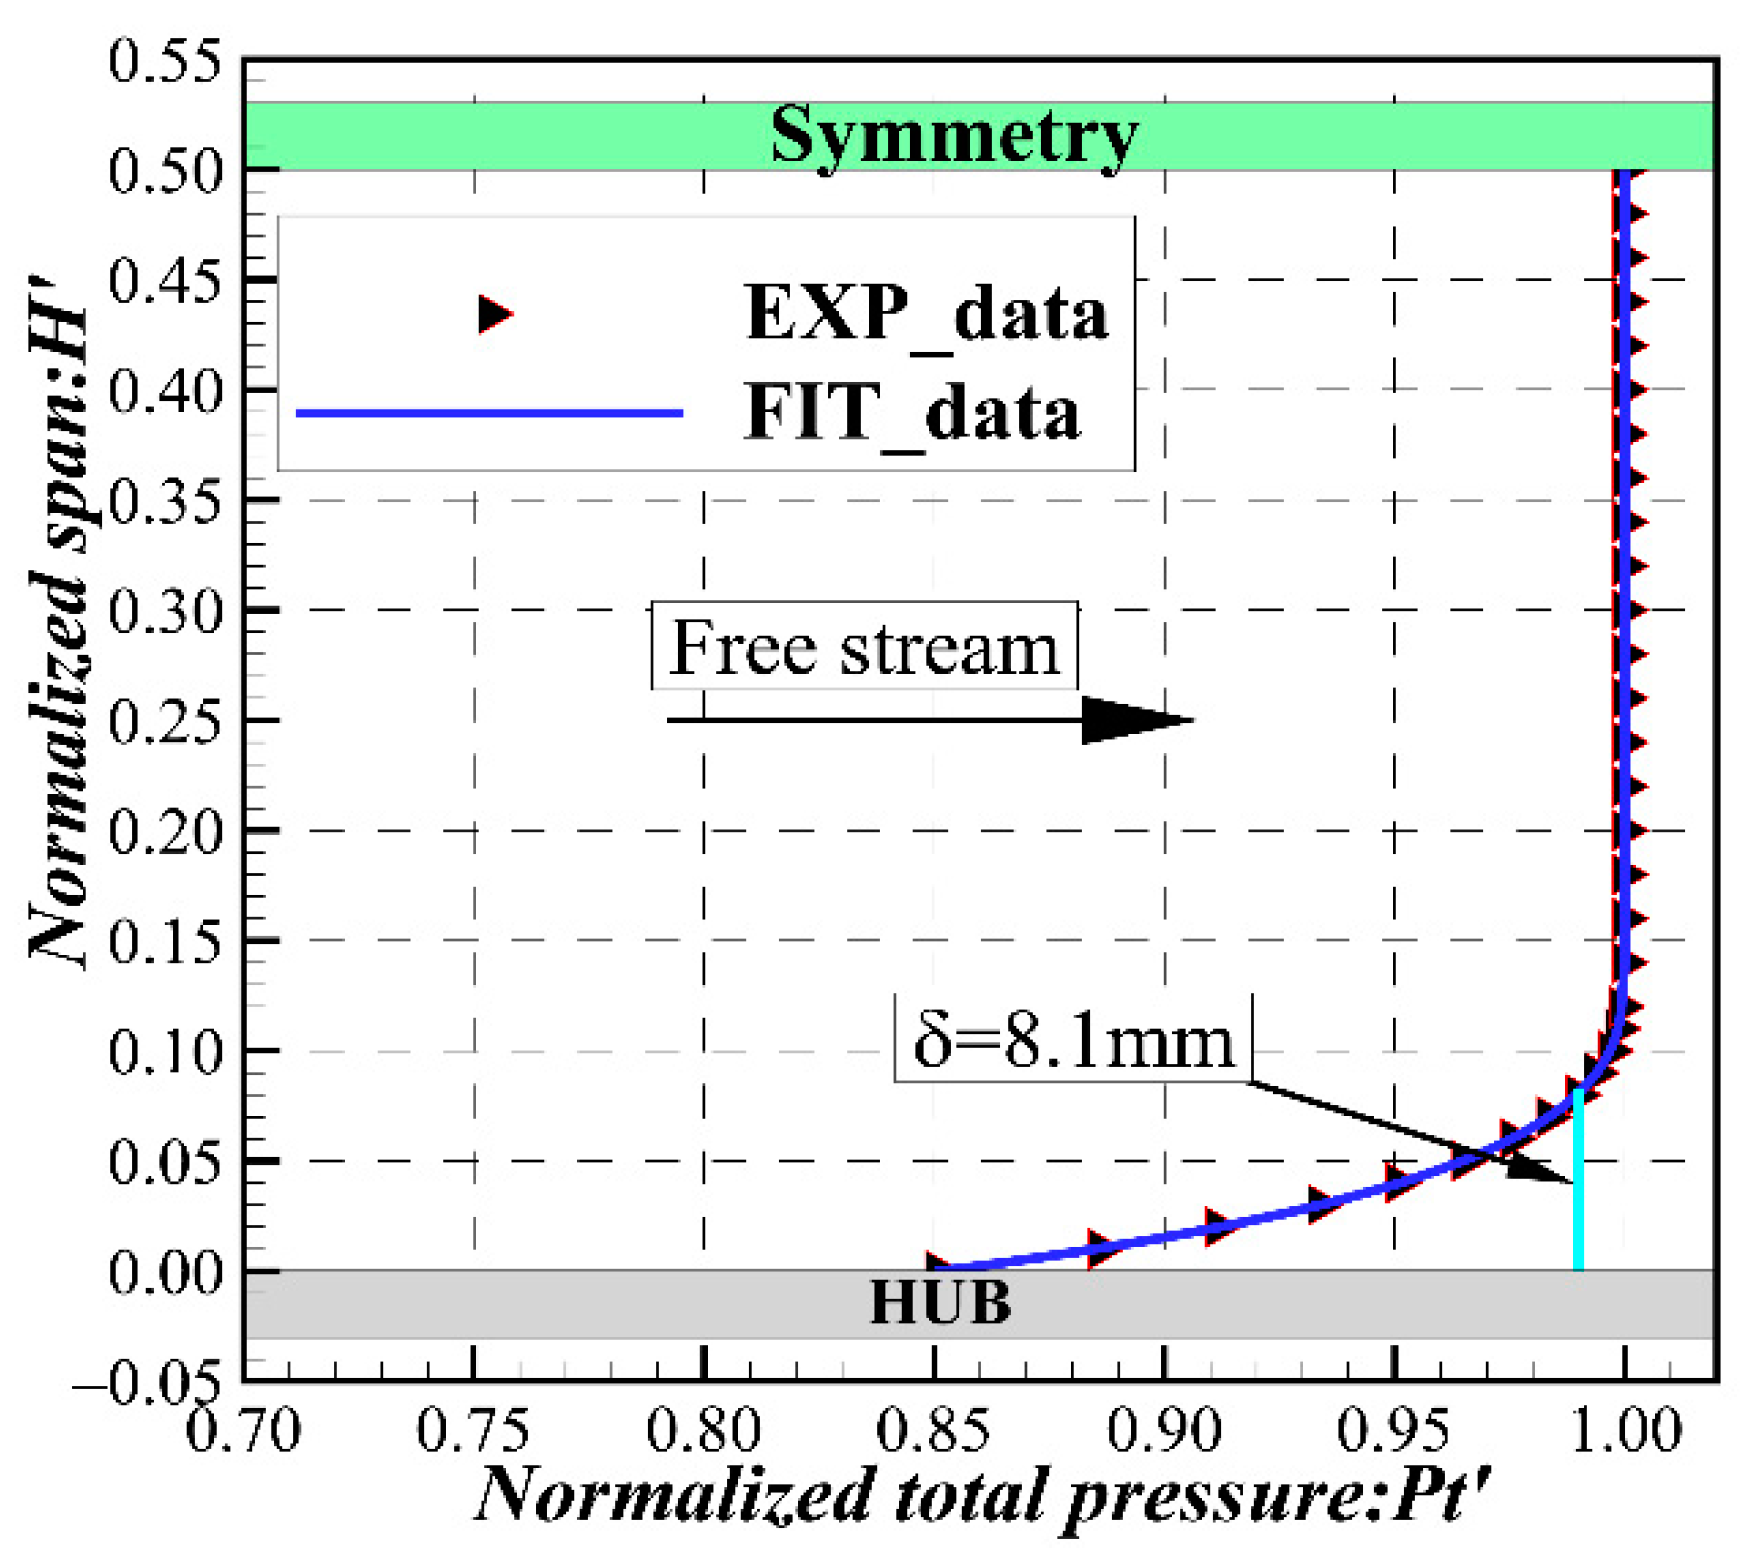
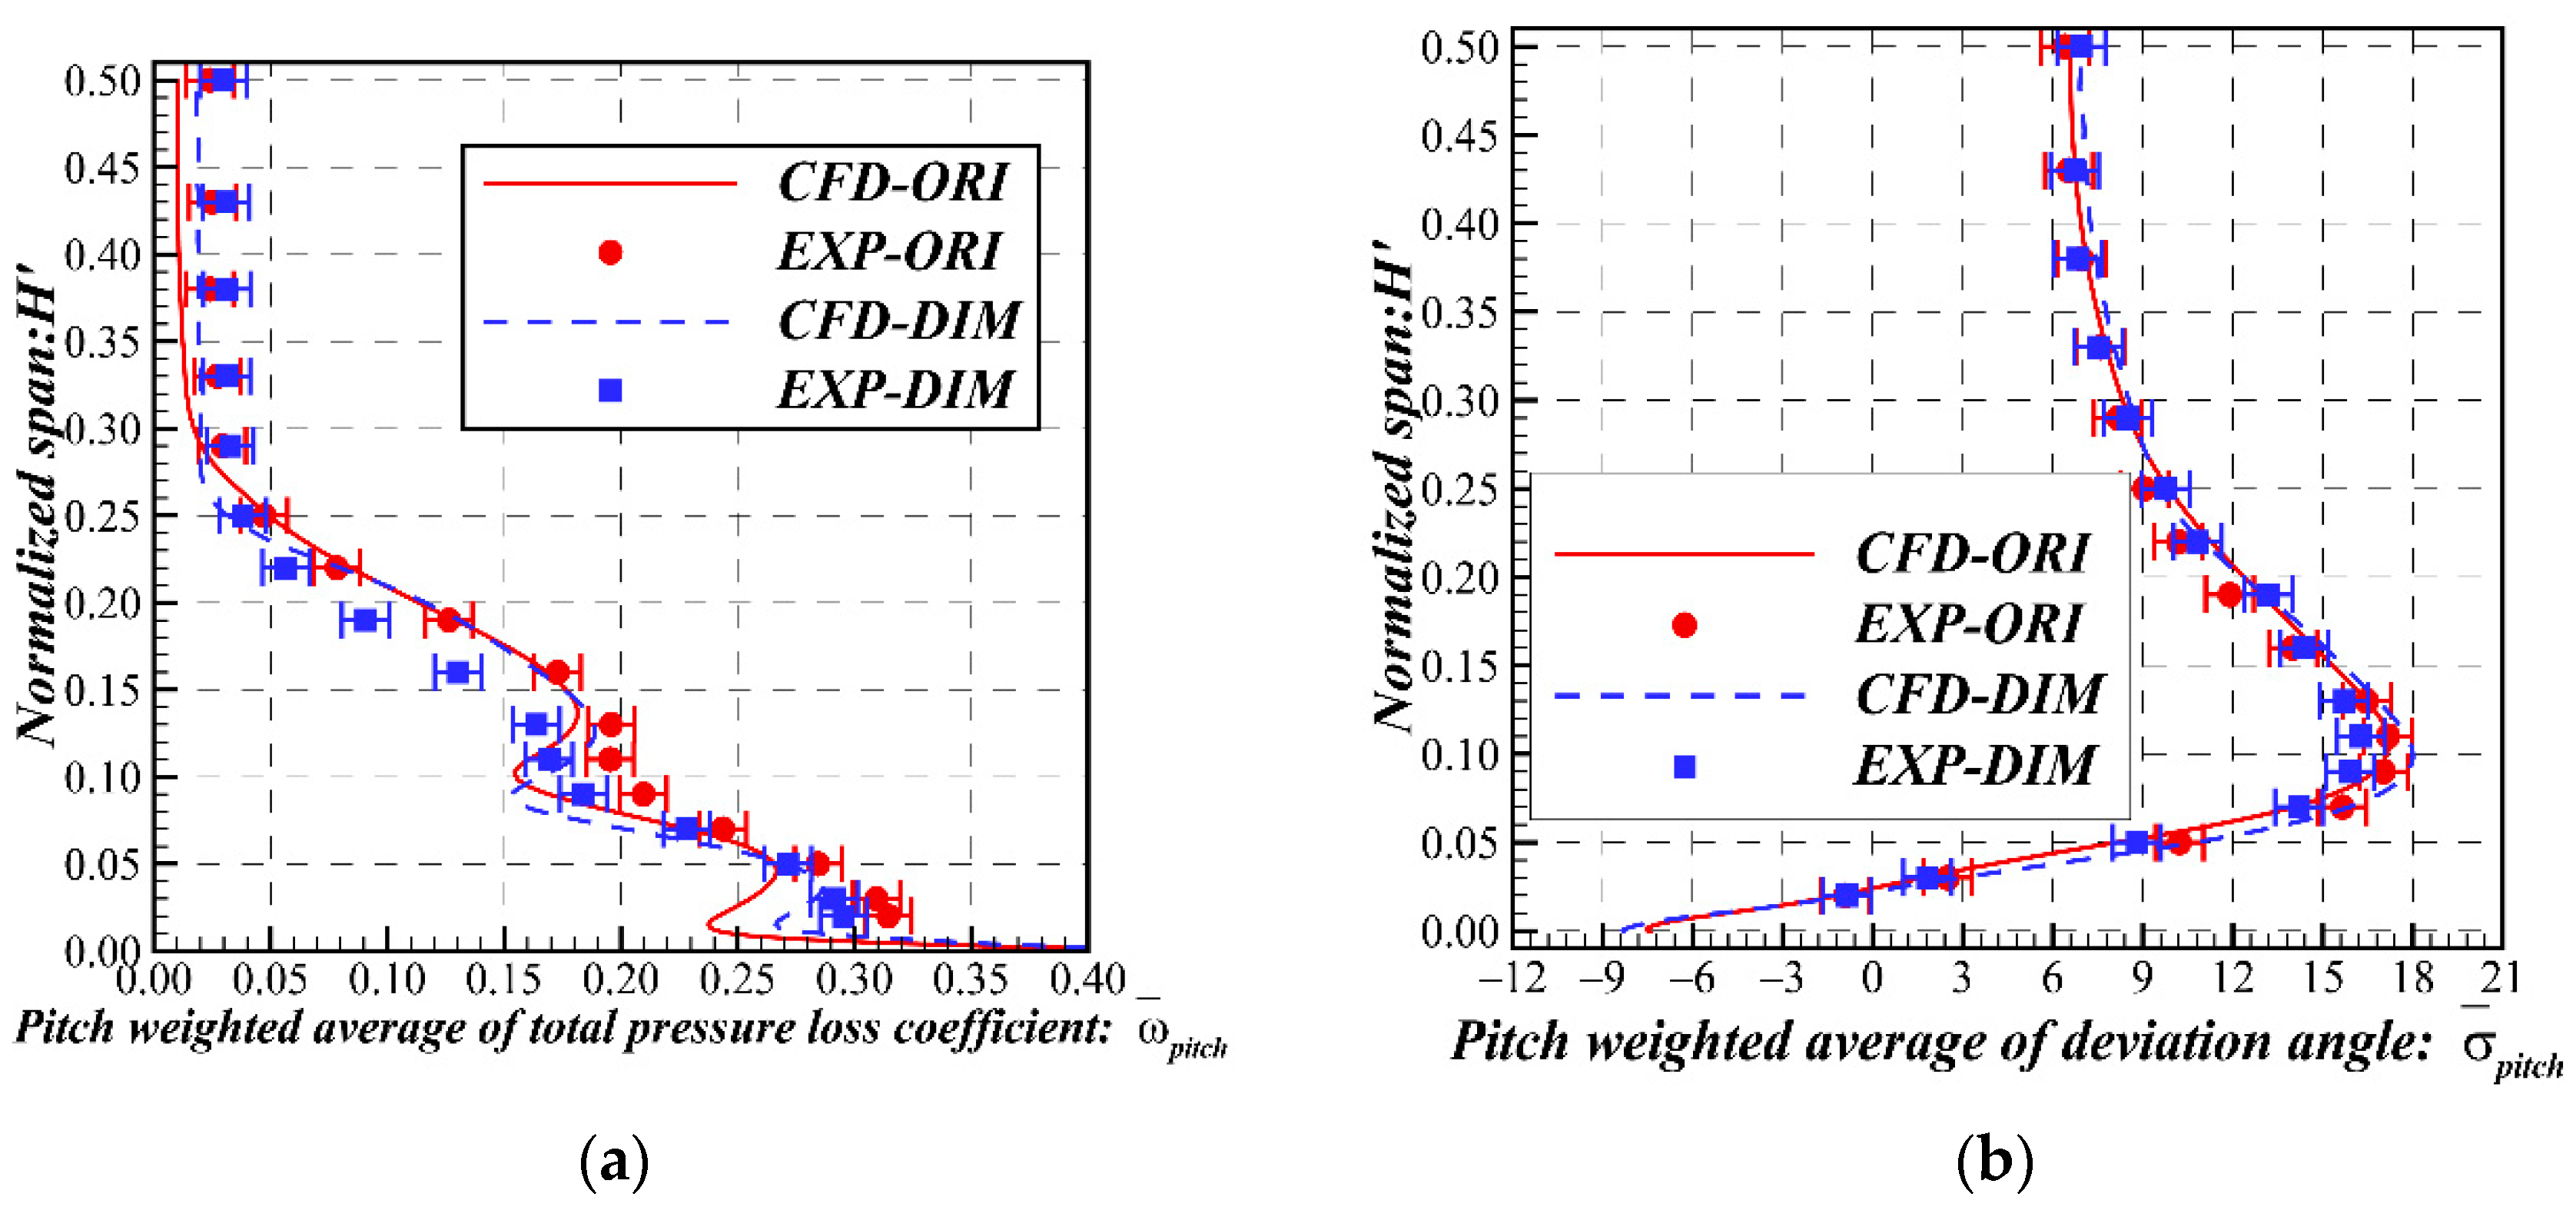
3.3. Boundary Conditions and Experimental Verification

The effects of dimples on the performance of the cascade under Mach number 0.7 are concerned. Therefore, the compressible Reynolds-averaged Navier–Stokes (RANS) solver equations and the shear-stress transport (SST) turbulent model were implemented to solve the problem. The SST turbulence model was solved using the k ω model in the boundary layer, and the k ε model outside the boundary layer was used to combine their advantages [35]. In order to capture the separated bubbles on the suction surface of the highly loaded blade accurately, the γ R e θ transition model [36] was coupled on the basis of the SST model. ANSYS CFX was employed as the numerical solver. A high-resolution scheme was used to determine the turbulence term to ensure the high accuracy and robustness of the solution. The fluid material was an ideal gas suitable for the calculation of compressible flow in this study. Translational periodic interfaces and the symmetric boundary were set on lateral and half-span surfaces, respectively (Figure 3).
Before further study, the reliability of the numerical method needs to be checked. The experimental results come from the high-speed linear cascade wind tunnel of Dalian Maritime University (Figure 5), which could make the inlet Mach number of tested objects reach 0.95. During the experiment, the continuous transformation of the incidence angle could be realized by rotating the rotary plate. Here, nine blades were placed on the blade cascade to create the periodicity of the flow passages. An L-shaped five-hole probe was used to sense the pressure on the outlet section of the medial blade (No. 5), and the distance between it and the trailing edge was about 0.5b. The pressure scanning model (DAS3217) and the thermocouple temperature measurement module (DTS3250) transmit the pressure and temperature information to the computer. The local total pressure, static pressure and velocity vector of measurement points are calculated by the interpolation program of the calibrated five-hole probe. The measured range covering the half-cascade passage ( 50   mm × 33   mm ) is assigned point-by-point, driven by two vertically distributed stepper motors. Therefore, the steady-state performance of the cascade can be evaluated.
The measurement error should consider the precision of transducers, the accuracy of the displacement mechanism and the measurement errors of the five-hole probe. The precision of the pressure transducer was 0.05%, and the error of angle rotation was 0.000135 ° . After experimental measurement, the error of the angle and total pressure of the five-hole probe were determined as ± 0.8 ° and 0.2%, respectively (Figure 6). Thus, the error of the measured angle ( Δ σ ) was ± 0.8 ° , and the accuracy of the measured total pressure ( Δ P t o u t / P t o u t ) was approximately 0.21%. Furthermore, the error of the total pressure loss coefficient ( Δ ω ) was about ± 0.01 , calculated according to the following equation:
Δ ω = ( ω p t i n Δ p t i n ) 2 + ( ω p t o u t Δ p t o u t ) 2 + ( ω p s i n Δ p s i n ) 2  
The boundary conditions were defined according to the experimental conditions. The average back pressure at the outlet was set to atmospheric value, and the solid surfaces were set to adiabatic and non-slip walls. The total temperature was 320 K at the inlet, where the total pressure was adjusted to maintain an inlet Mach number of 0.7. The inlet boundary layer was measured by the total pressure boundary layer probe and normalized by the maximum value. The thickness of the boundary layer ( δ ) was 8.1 mm, as shown in Figure 7. The distribution of inlet normalized total pressure was fitted as Equation (7), and its R-square was 0.9999:
{ 1.071 e x p ( 0.003889 H ) 0.2197 e x p ( 0.1884 H ) H 12 1 12 < H 50
where H is the height of blade. During the operation of the simulation, the convergence criterion were as follows: the residual error was less than 10 5 without fluctuation, and the Mach number of the inlet section was within the range of 0.7 ± 0.001 . For the present work, the solver invoked 22 CPUs (4.3-GHz processor) in parallel running for 30 h.
Firstly, Figure 8 shows the distribution of the pitch-weighted average of performance parameters along the spanwise direction. The errors of the deviation angle and total pressure loss coefficient were ± 0.8 o and ± 0.01 , respectively. As shown in Figure 8a,b, the numerical results were in good agreement with the experimental data. However, due to complexity causing the probe to be inoperative near the end wall, there were some discrepancies between the numerical and measurement results. The experimental results show that the loss of the DIM ( λ = 0.375 ) in the corner ( H 0.3 ) was smaller than that of ORI, which is consistent with the simulation results. Secondly, the limiting streamline on the suction surface indicated that the CFD method selected in this study could accurately capture the flow structure (LSB and corner separation), as shown in Figure 9. It should be noted that numerical calculations are insufficient to predict the flow in the separation bubble and the corner region. Overall, the numerical methods used in this study are credible, and the effectiveness of the dimple is also proved.

4. Results and Discussion

4.1. Performance Parameters of Cascade

A comparative analysis of the performance of the dimpled cascades and the prototype scheme (ORI), which is the main reference for evaluating the dimpled cascades, is carried out in this section. The evaluation is based on two parameters, the total pressure loss coefficient ( ω ¯ o u t ) and the deviation angle ( σ ¯ o u t ) of the outlet section, which correspond to the characteristics of efficiency and compression, respectively, as shown in Figure 10. The histogram in Figure 10 represents the relative change (Rc) in parameters between the dimpled cascade and the original cascade. The Rc is defined as:
R c = X X O R I X O R I × 100 %
where X is the parameter to be estimated, and X O R I is the corresponding variable of ORI. It is obvious that the loss of λ = 0.625 was greatly reduced (13.47%) compared with the ORI, and its deviation angle was reduced by 0.85%. On the contrary, the performance parameters of λ = 0.125 were the worst. In terms of efficiency, λ was effective as long as it exceeded 0.375 at the condition of M a i n l e t = 0.7 .
Compared with the overall change in outlet, the contribution of each region gives more intuitive data to study the impact of the dimples. Figure 11a shows the stacking of the pitch weighted average of the total pressure loss coefficient along the spanwise direction. In order to quantify the influence of the dimples, the area above H = 30 % H was defined as the wake area, and the rest represents the corner area. It can be seen from the partially enlarged figure of the wake region that the total pressure loss coefficient increases when the blade is dimpled. The loss increases significantly in the dimpled cascade with the inferior arc, and it is similar to the secondary level in the dimpled cascade with the semicircle arc and the superior arc. It should be pointed out that the loss of the wake region in the dimpled cascade has a wavy trend. From the loss distribution at the corner region, it was observed that the value of the inferior arc dimpled cascade fluctuated near the ORI, and the loss expressed by the distribution curve of λ = 0.625 was significantly less than that of ORI.
In order to explain the above trend more clearly, Figure 11b,c shows the Rc of the losses of dimpled cascades after averaging the mass flow in the wake and corner area, respectively. It can be seen that an excellent image of the dimpled surface was established in the corner region, whereas there is a poor one in the wake area. The dimpled cascade with λ = 0.125 is useless. Subsequently, with the increase in λ , the situation in the wake area improved until λ = 0.625 , and the loss increment was only 0.37%. At the same time, the corner separation loss continued to decline, decreasing by 13.83% until λ = 0.625 . When λ = 0.875 , the situation of the loss deteriorated again.

4.2. Flow Structure in Cascade Passage

The performance of the cascade is an overall reflection of the flow field, and further analysis of the corresponding flow characteristics is helpful to grasp the mechanism. Figure 12 is a 3D streamline near the suction surface and the end wall, which generally means the low-energy fluid. The S3 sections were established in the passage along the axial direction to reflect the development of flow loss. Compared with the loss development on the upper part of the blade, the INF dimples ( λ = 0.125 , λ = 0.375 ) rolled the high-loss area into a wavy shape, and it thus became larger. As shown in Figure 12b, the range of high-loss contour at 125 % b extends in the spanwise direction, which explains the increased wake loss of the dimpled cascades. This effect could not be identified well when   λ is greater than 0.375, and further discussion is conducted with boundary layer.
The influence of dimples on the corner separation is mainly related to the range of upward climbing and the forward invasion of the lateral low-energy flow (blue lines) from the pressure surface (PS). Since the centrifugal force of bending motion cannot be balanced with the lateral pressure, this lateral flow rushed to the suction surface of the downstream blade, and the incoming flow (yellow lines) of the end wall boundary layer was lifted and mixed by the forward invasion flow. After that, one part of the mixed flow led to the formation of the passage vortex (PV), and the other part formed a concentrated shedding vortex (CSV) together with the wake. The backflow of ORI extended to the position before 40 % b x and climbed from here to the span. The high-loss layer near the hub wall began to thicken rapidly from 60 % b x , and the turbulence in PV was very serious (Figure 12a). After being excavated, the thickness of the hub wall boundary layer at 5 % b x ~ 40 % b x was thinner than that of the ORI. The reverse flow was compressed to about 60 % b x and flowed almost vertically to the higher position, and the downstream mixing process became mild (Figure 12b–e). For the inferior arc (Figure 12b,c), the complicated flows still remained in the corner region. As shown in Figure 12d–f, the CSV was relatively apparent, which was mainly caused by the fact that the lateral flow was more inclined to flushing the blade and reducing participation in the mixing behavior. The reflow of λ = 0.625 (Figure 12e) was pushed further along the streamwise blade, and the high-loss contour contracted to a great extent at the location of 125 % b .
Figure 13 shows the limiting streamline on the suction surface, which mainly shows three flow structures, including the laminar separation bubble (LSB), corner separation and the wall corner vortex (CV) inside. The CV was weakened by the concave surface, which could confirm that the height of the projection of CV on the suction surface was reduced from 0.02 to 0.01, even disappearing at λ = 0.625 . The inferior arc schemes ( λ = 0.125 , 0.375) eliminated LSB. After λ 0.5 , the LSB was weakened but still existed, and the weakening begins from the middle part of blade. The LSB with λ = 0.625 could not cover the whole blade. The flow in the corner separation of the dimpled blade was improved as a whole. As shown in Figure 13e, the separation starting point S of λ = 0.625 was pushed far to the position of b x = 0.46 , compared with b x = 0.3 of ORI in Figure 13a. The projected height of the corner separation of λ 0.375 was reduced to the level of H = 0.34 ~ 0.35 , whereas it was H = 0.38 in the ORI. This value increased to H = 0.4 in λ = 0.125 , which may be due to extension of the backflow impacted by the higher velocity inflows. Overall, the characteristics of the closed corner separation of dimpled blades were degraded and its range was reduced.
Due to the weakening or elimination of LSB, the flow blockage in the middle of the blade was reduced, which does not match with the increase in the wake loss of the dimpled cascade, and it needs further explanation. The boundary layer is a thin layer with sharp changes in the stress near the wall, which plays a decisive role in the flow field. According to the ten local vertical lines established on the suction surface at H = 0.45 and the range of 5 % b x to 90 % b x in Figure 14, the boundary layer on the suction surface can be extracted.
Figure 15 shows the boundary layer of H = 0.45 on the blade, and four axial positions ( 20 % b x , 30 % b x , 60 % b x , 90 % b x ) are shown to clarify the influence of the dimples. The boundary layer shape before 30 % b x was not full enough, indicating that it is a laminar boundary layer. The dimpled surface increased the flow velocity near the wall, making the boundary layer thinner, as shown in Figure 15a. This phenomenon can be explained by the wall slip effect described by Li [18]. The semi-circular dimple ( λ = 0.5 ) obtained the most favorable near-wall velocity due to slip effect. Combined with Figure 13b, λ = 0.125 retains a vortex at 30 % b x , making it produce a negative velocity factor like the ORI. The reverse velocity of λ = 0.5 and λ = 0.875 appears at 60 % b x in Figure 15c, indicating that the separation bubbles in Figure 13d,f are detected. The boundary layers of λ = 0.125 and λ = 0.375 developed obviously beyond 60 % b x , which was caused by the disturbance of the vortexes generated by the dimples, as shown in the wavelike high-loss region in Figure 12b,c. Overall, the dimples with an inferior arc ( λ = 0.125 , 0.375 ) could eliminate the LSB while introducing additional vortices, which still leads to the deterioration of the boundary layer. The dimples with a semicircular arc ( λ = 0.5 ) and a superior arc ( λ = 0.625 , 0.875 ) could delay the separation of LSB and slightly reduce the thickness of the boundary layer.
The boundary layer momentum thickness ( δ , defined by Equation (5)) of each position in Figure 14 is drawn to Figure 16. The momentum loss is divided into two stages of smooth and rapid development. The sudden rising point of λ = 0.125 is about at 30 % b x , which is more forward than the position 50 % b x of the ORI, meaning the transition of the boundary layer occurred in advance. The further development of the turbulence boundary layer caused a great momentum loss. The location of the transition point ( T x ) of the remaining scheme is equivalent to or more backward than that of the ORI, indicating that the disturbance of these dimples makes the boundary layer of the blade maintain a low loss state, due to the wall slip effect. However, the slope of the curve of momentum loss thickness becomes large once it passes over the transition starting point, which is related to the high-turbulence outflow from the dimples, which will be discussed in Section 4.3.

4.3. Vortex Structures in Dimples

When the flow passes over the dimple, a pair of vortices is formed inside it, which affects the flow state and the performance of the cascade. Mahmood [37] indicated that the augmentation of heat transfer in the channel was the result of differently sized vortex pairs that were shed periodically from dimples. Then, Kovalenko [38] tried to establish the boundaries of flow regimes in dimples by summarizing the existing experimental results, which were determined by the relative depth h/2R and the Reynolds number Re2R, where Re2R is based on the diameter of dimple. In this study, h/2R corresponding to λ = 0.125 ~ 0.875 were 0.06~0.75 and Re2R were 5.28 × 10 7 ~ 4.13 × 10 6 , as shown in Table 4. The Reynolds numbers exceed the scope of Kovalenko’s research, which could be used as a supplement to it.
The disturbance of these vortices increased the turbulent kinetic energy (TKE) of the flow and injected dynamic energy into the inactive flow near the wall, thereby affecting the morphology of the boundary layer and the flow separation. The TKE parameter was provided by CFX. The mushroom-like vortex inside the dimple was observed in the spanwise-normal plane (section vertical to the flow direction) in [37], which meant that the parameter of axial vorticity ( Ω x , defined by Equation (6)) could be utilized to display the same image in the calculation.
Figure 17a shows the normalized TKE contours and axial vorticity iso-surfaces of different schemes at H = 0.47 and H = 0.03 . The TKE normalized by the scope of values ranging from 0 to 1 near the suction surface (SS) is represented by a blue-red colored contour map. Meanwhile, the two vorticity iso-surfaces ( Ω x ) restricted by the selected-value around the suction surface, yellow representing 1 × 10 5 and purple representing − 1 × 10 5 , are also plotted in Figure 17a. Secondary vortex pairs are generated inside the dimple and outward at the dimple’s diagonal direction, which is reinforced by downstream outflows (especially λ = 0.125 ). These vortex-passed zones show the characteristics of high TKE and continue to exert impact on the downstream locations. This phenomenon can be confirmed by an experimental investigation by Zhou et al. [39] on the characteristics of turbulent boundary layer flows over a dimple with λ = 0.2 . Note that with the increase in λ , the high TKE region near the trailing edge becomes smaller and moves backward, which corresponds to the position where increments occur sharply in Figure 16. At the H = 0.03 region, the dimples weaken the vorticity near the end wall, which lighten the corner secondary flow.
Figure 17b–f are the normalized TKE and streamline in the dimple at the front of H = 0.47 , which show the limiting streamline and 2D streamline inside and near it. Three regimes (diffuser–confuser flow, horseshoe vortex and tornado-like vortex) exist within the dimples as the flow velocity or the depth of dimple increases, as mentioned in [38]. Tay [40] refined these regimes into five flow stages through dye flow visualization. A significant recirculation zone appears in the anterior part of the spherical depression, and its vortex core is suppressed at the bottom of the dimple, as shown in Figure 17b. This behavior is consistent with stage Ⅱ discovered in [40], which was also defined as diffuser–confuser flow in [38]. This further confirms that the flow in the dimple with h/2R < 0.1 is characterized by the diffuser–confuser flow summarized and analyzed by Kovalenko, and the corresponding h/2R = 0.06 for λ = 0.125 is shown in Figure 17b. The limiting lines in Figure 17c,d show that there is a pair of asymmetric vortices (one of which dominates) in the sag body, which is coherent with stage Ⅳ of the experiment in [40], or the tornado-like vortex in [38]. The attachment point (N) of the tornado vortex is close to the front edge of the depression, and its axis is struck near the back edge and raised to the position of the bowl. The profile shows that the axis of the tornado vortex becomes very distorted in space, usually unstable. Figure 17e,f shows a pair of symmetrical horseshoe vortices attached downstream, and their axis is bending upstream. With the increase in velocity, the horseshoe vortex pair appears before the tornado pattern in [40], which indicates that the development of flow regimes depends not only on the flow velocity, but also on the relative dimple depth. These relationships are given in Table 4.
Each shape of the dimple drags two high TKE region-formed “braids”, distributed about the axis symmetrically on the margin. For tornado-type flows, the “braids” are almost covered with downstream plates, with the relatively uppermost TKE intensity. It can be seen from Figure 17a that although the dimples of λ = 0.375 and λ = 0.5 are much smaller than those of λ = 0.125 , the “braids” extend even farther. The TKE caused by the horseshoe vortex within the dimples of the superior arc shape is slight but closer to the central axis.
It can be observed in Figure 17 that there are always two nodes (N) and a pair of saddle points (S) in the spherical cavity, indicating that the topological structure is independent of the Re2R or the λ . Therefore, the topological structure of flow in the dimple can be represented by the same diagram (Figure 18). When the flow passes through the dimple, it is lifted by a three-dimensional vortex at the upstream rims (forming a separation line) and sucked into the cavity at the downstream rims (forming a reattachment line). During this process, the high-velocity fluid interacts with the low-velocity vortices to form a high-turbulence flow, then flows out of the dimple and stimulates the downstream flow field. A fraction of the high-turbulence flow is reengaged in the dimple and partially dissipated in the recirculation. The low-velocity fluid at the bottom of the dimple is transported to the upper space by the vortices, which ultimately mixes with the free-stream and forms the high-turbulence flow. For the dimples of different λ , the locations of a pair of spiral points (N), the saddle point (S) on the downstream rims and the curvature of the rotation axis of the vortex are mainly affected.

5. Conclusions

Based on the highly loaded compressor linear cascade NACA0065-K48, computations have been performed to study the effects of suction surface dimple arrays with different ratios of dimple depth-to-print diameter ( λ = 0.125 ~ 0.875 ) on the aerodynamic performance and flow structures in detail in this paper, and the following conclusions have been obtained.
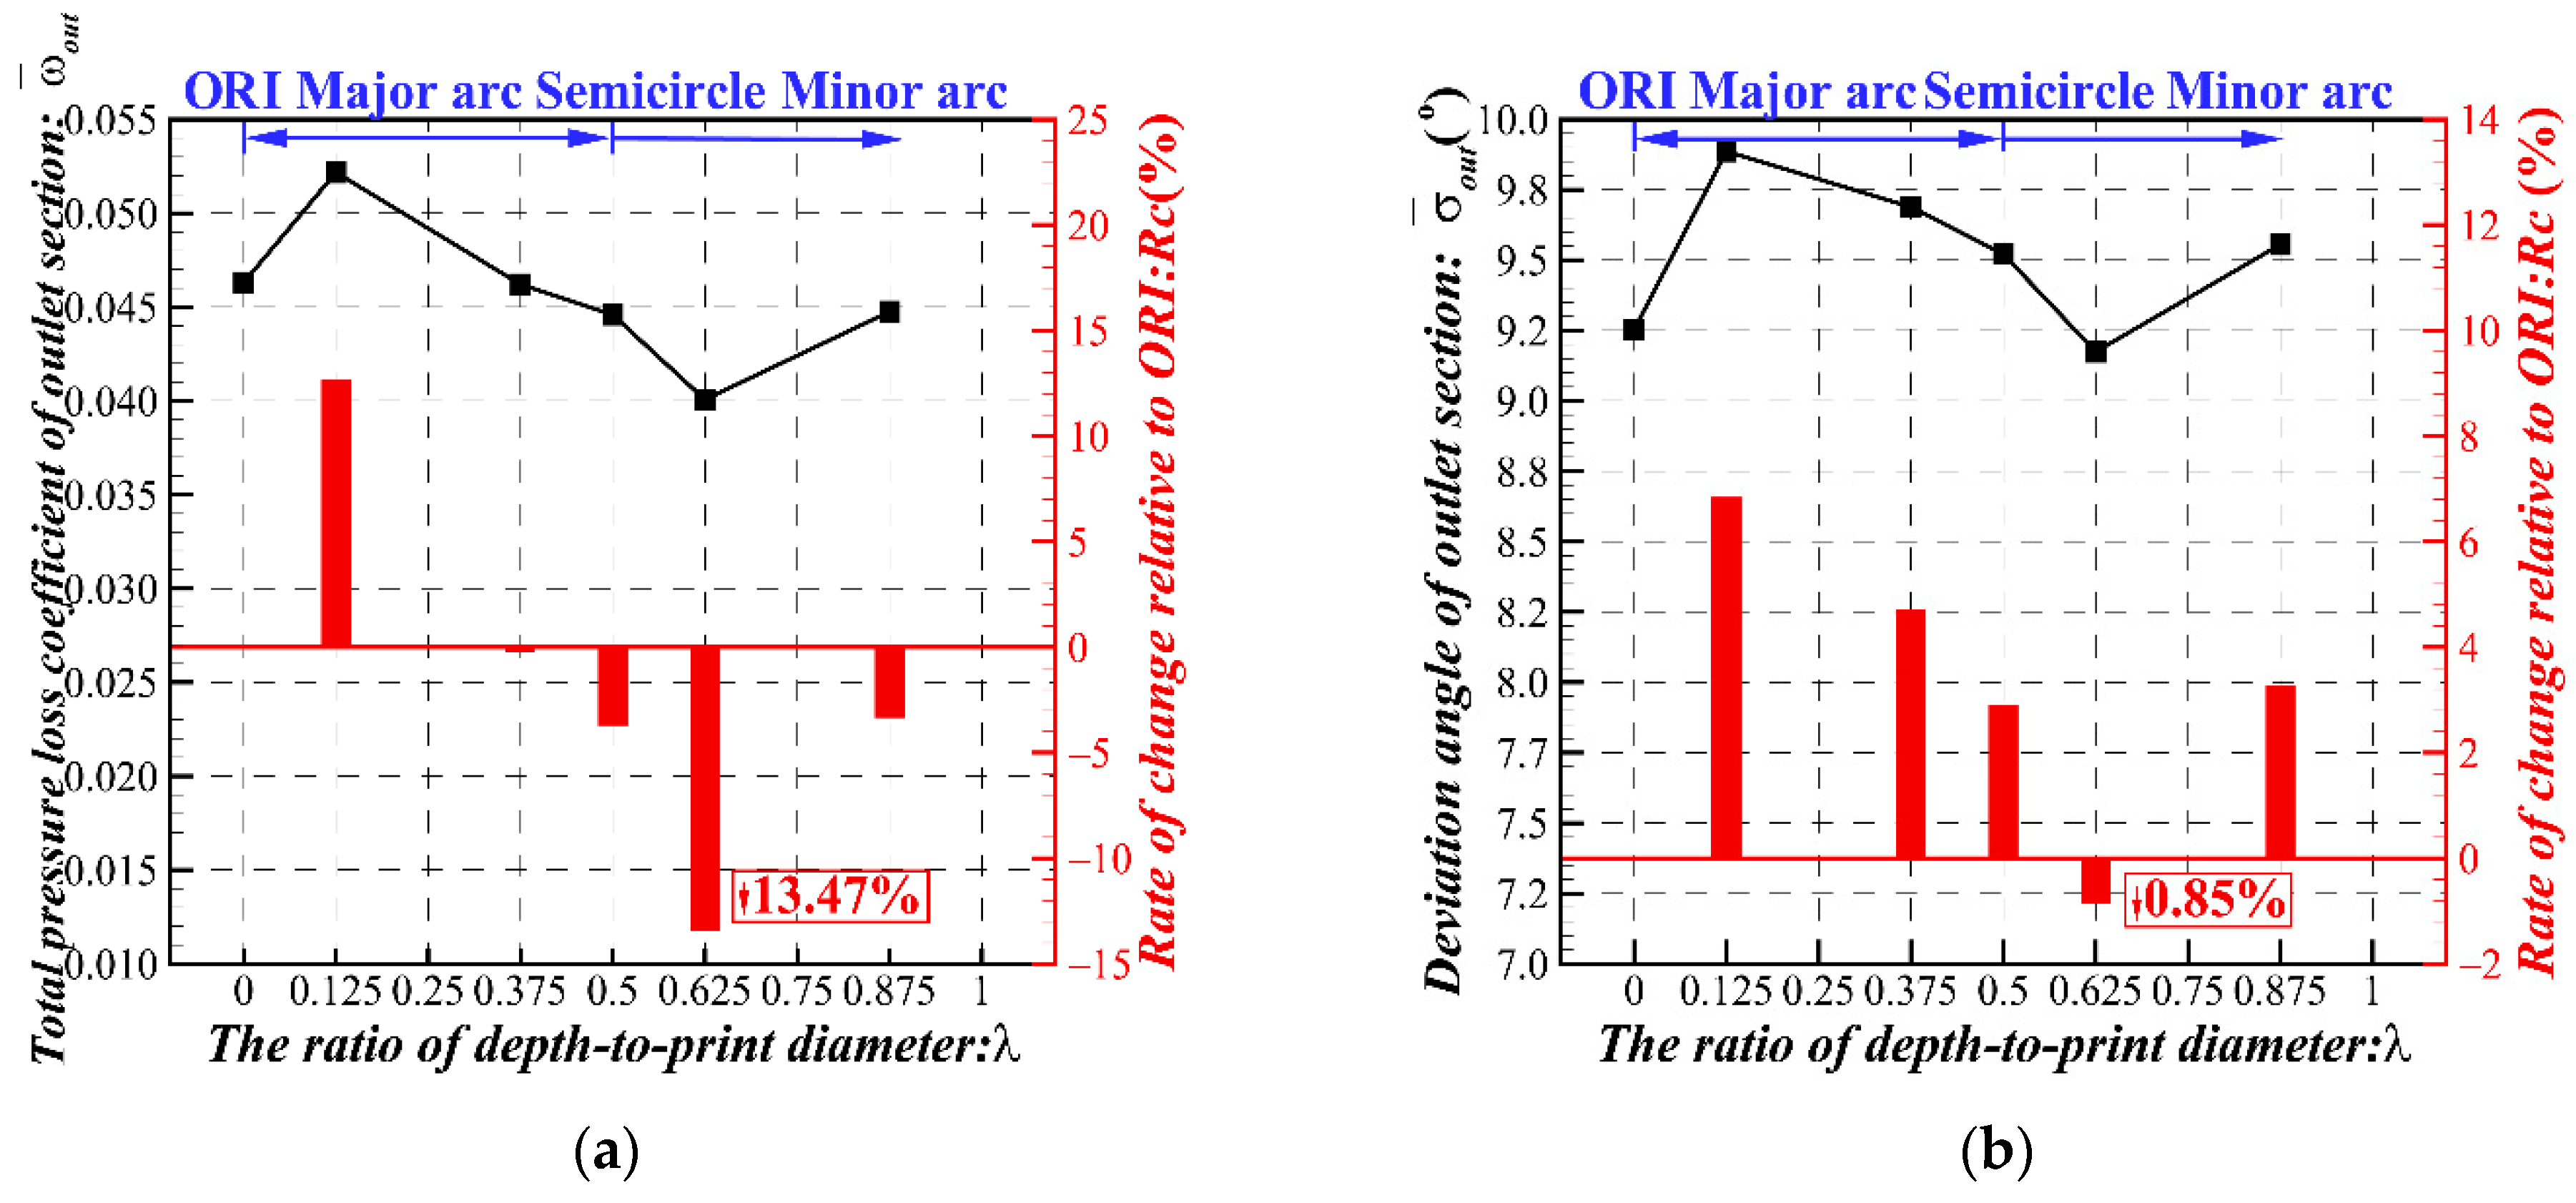
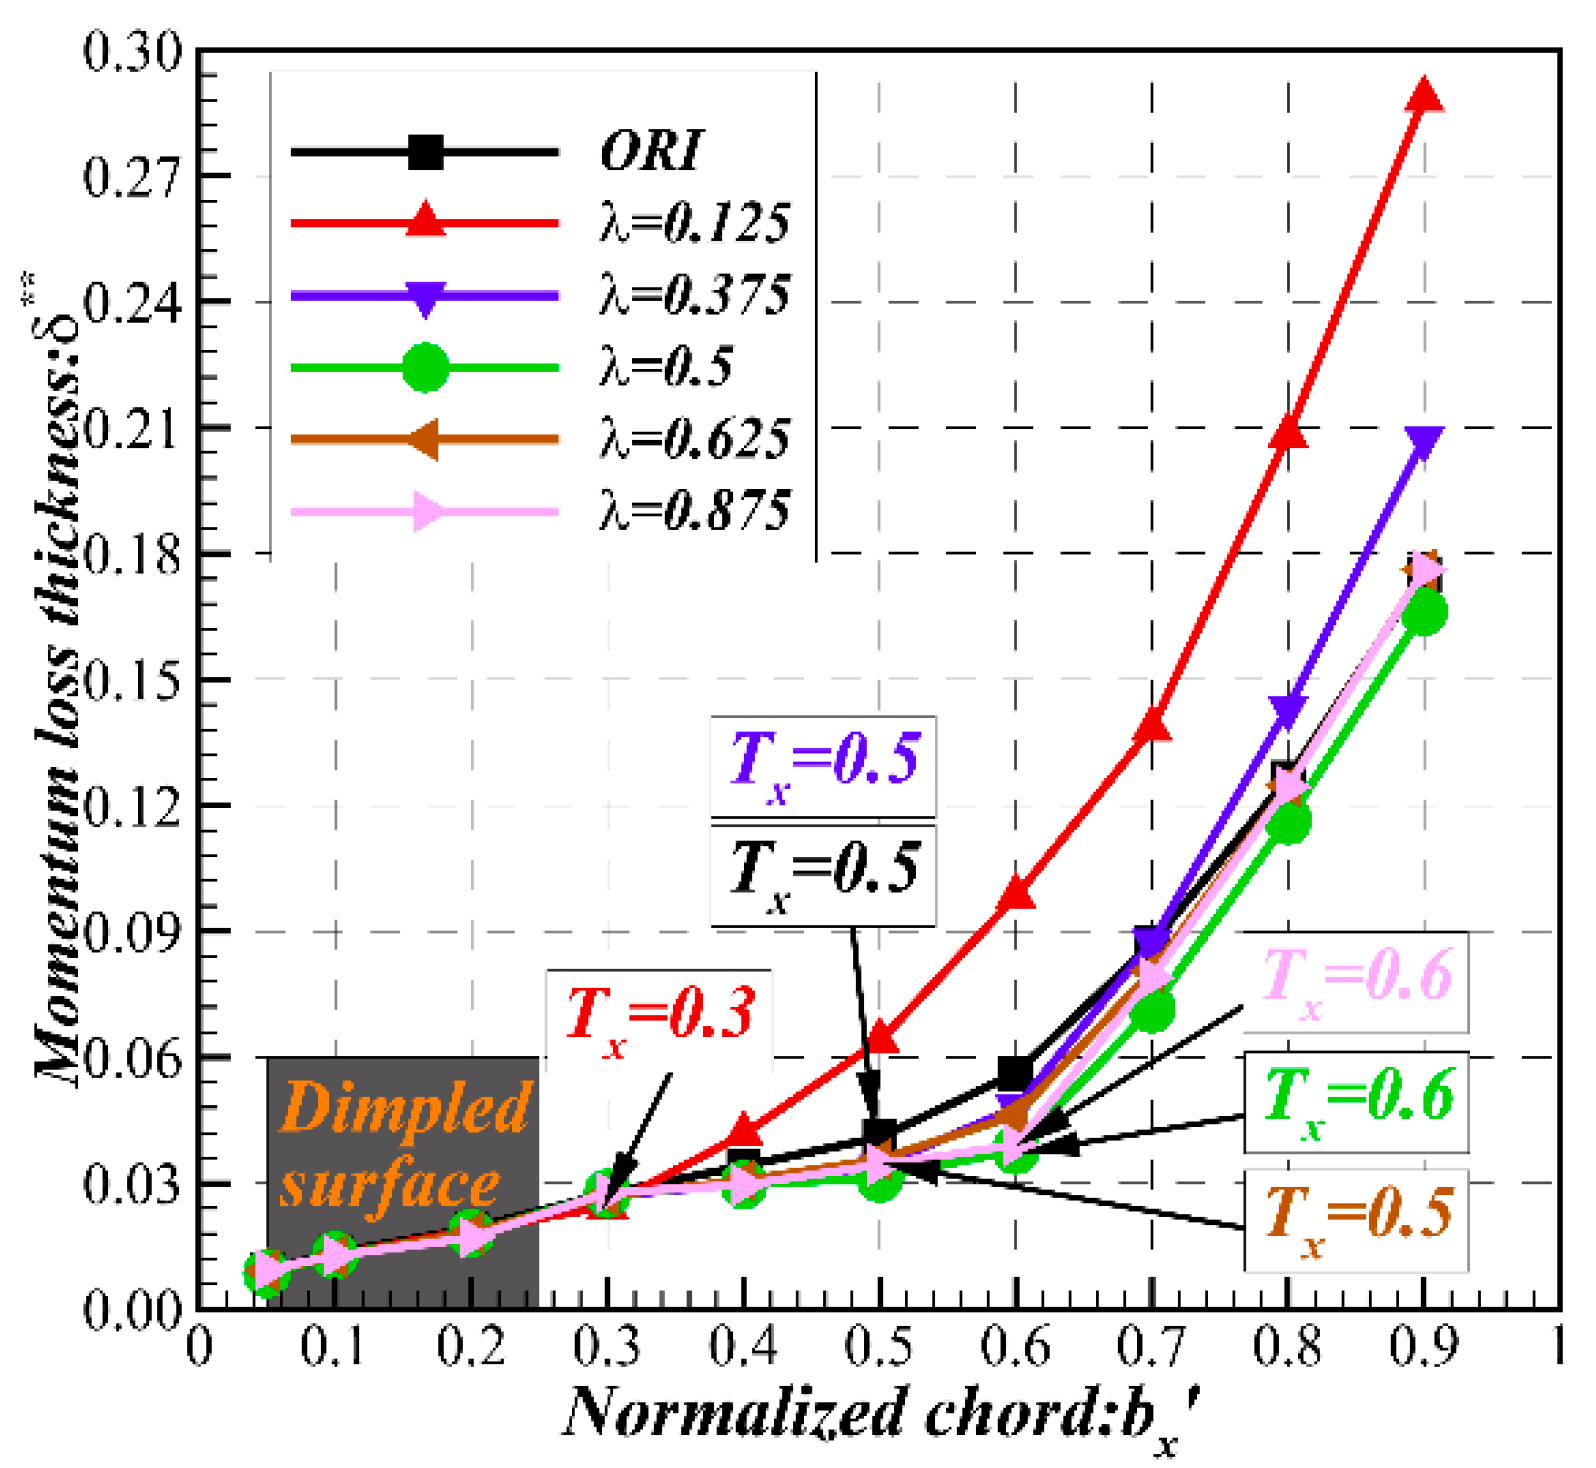
  • The ratio of dimple depth-to-print diameter determines three forms of intruded blade: inferior arc ( λ < 0.5 ), semicircular arc ( λ = 0.5 ) and superior arc ( λ > 0.5 ). Flow losses of the cascade increased significantly at λ = 0.125 and decreased at λ 0.375 . λ = 0.625 can reduce the total pressure loss coefficient by 13% while maintaining the pressurization ability of the cascade.
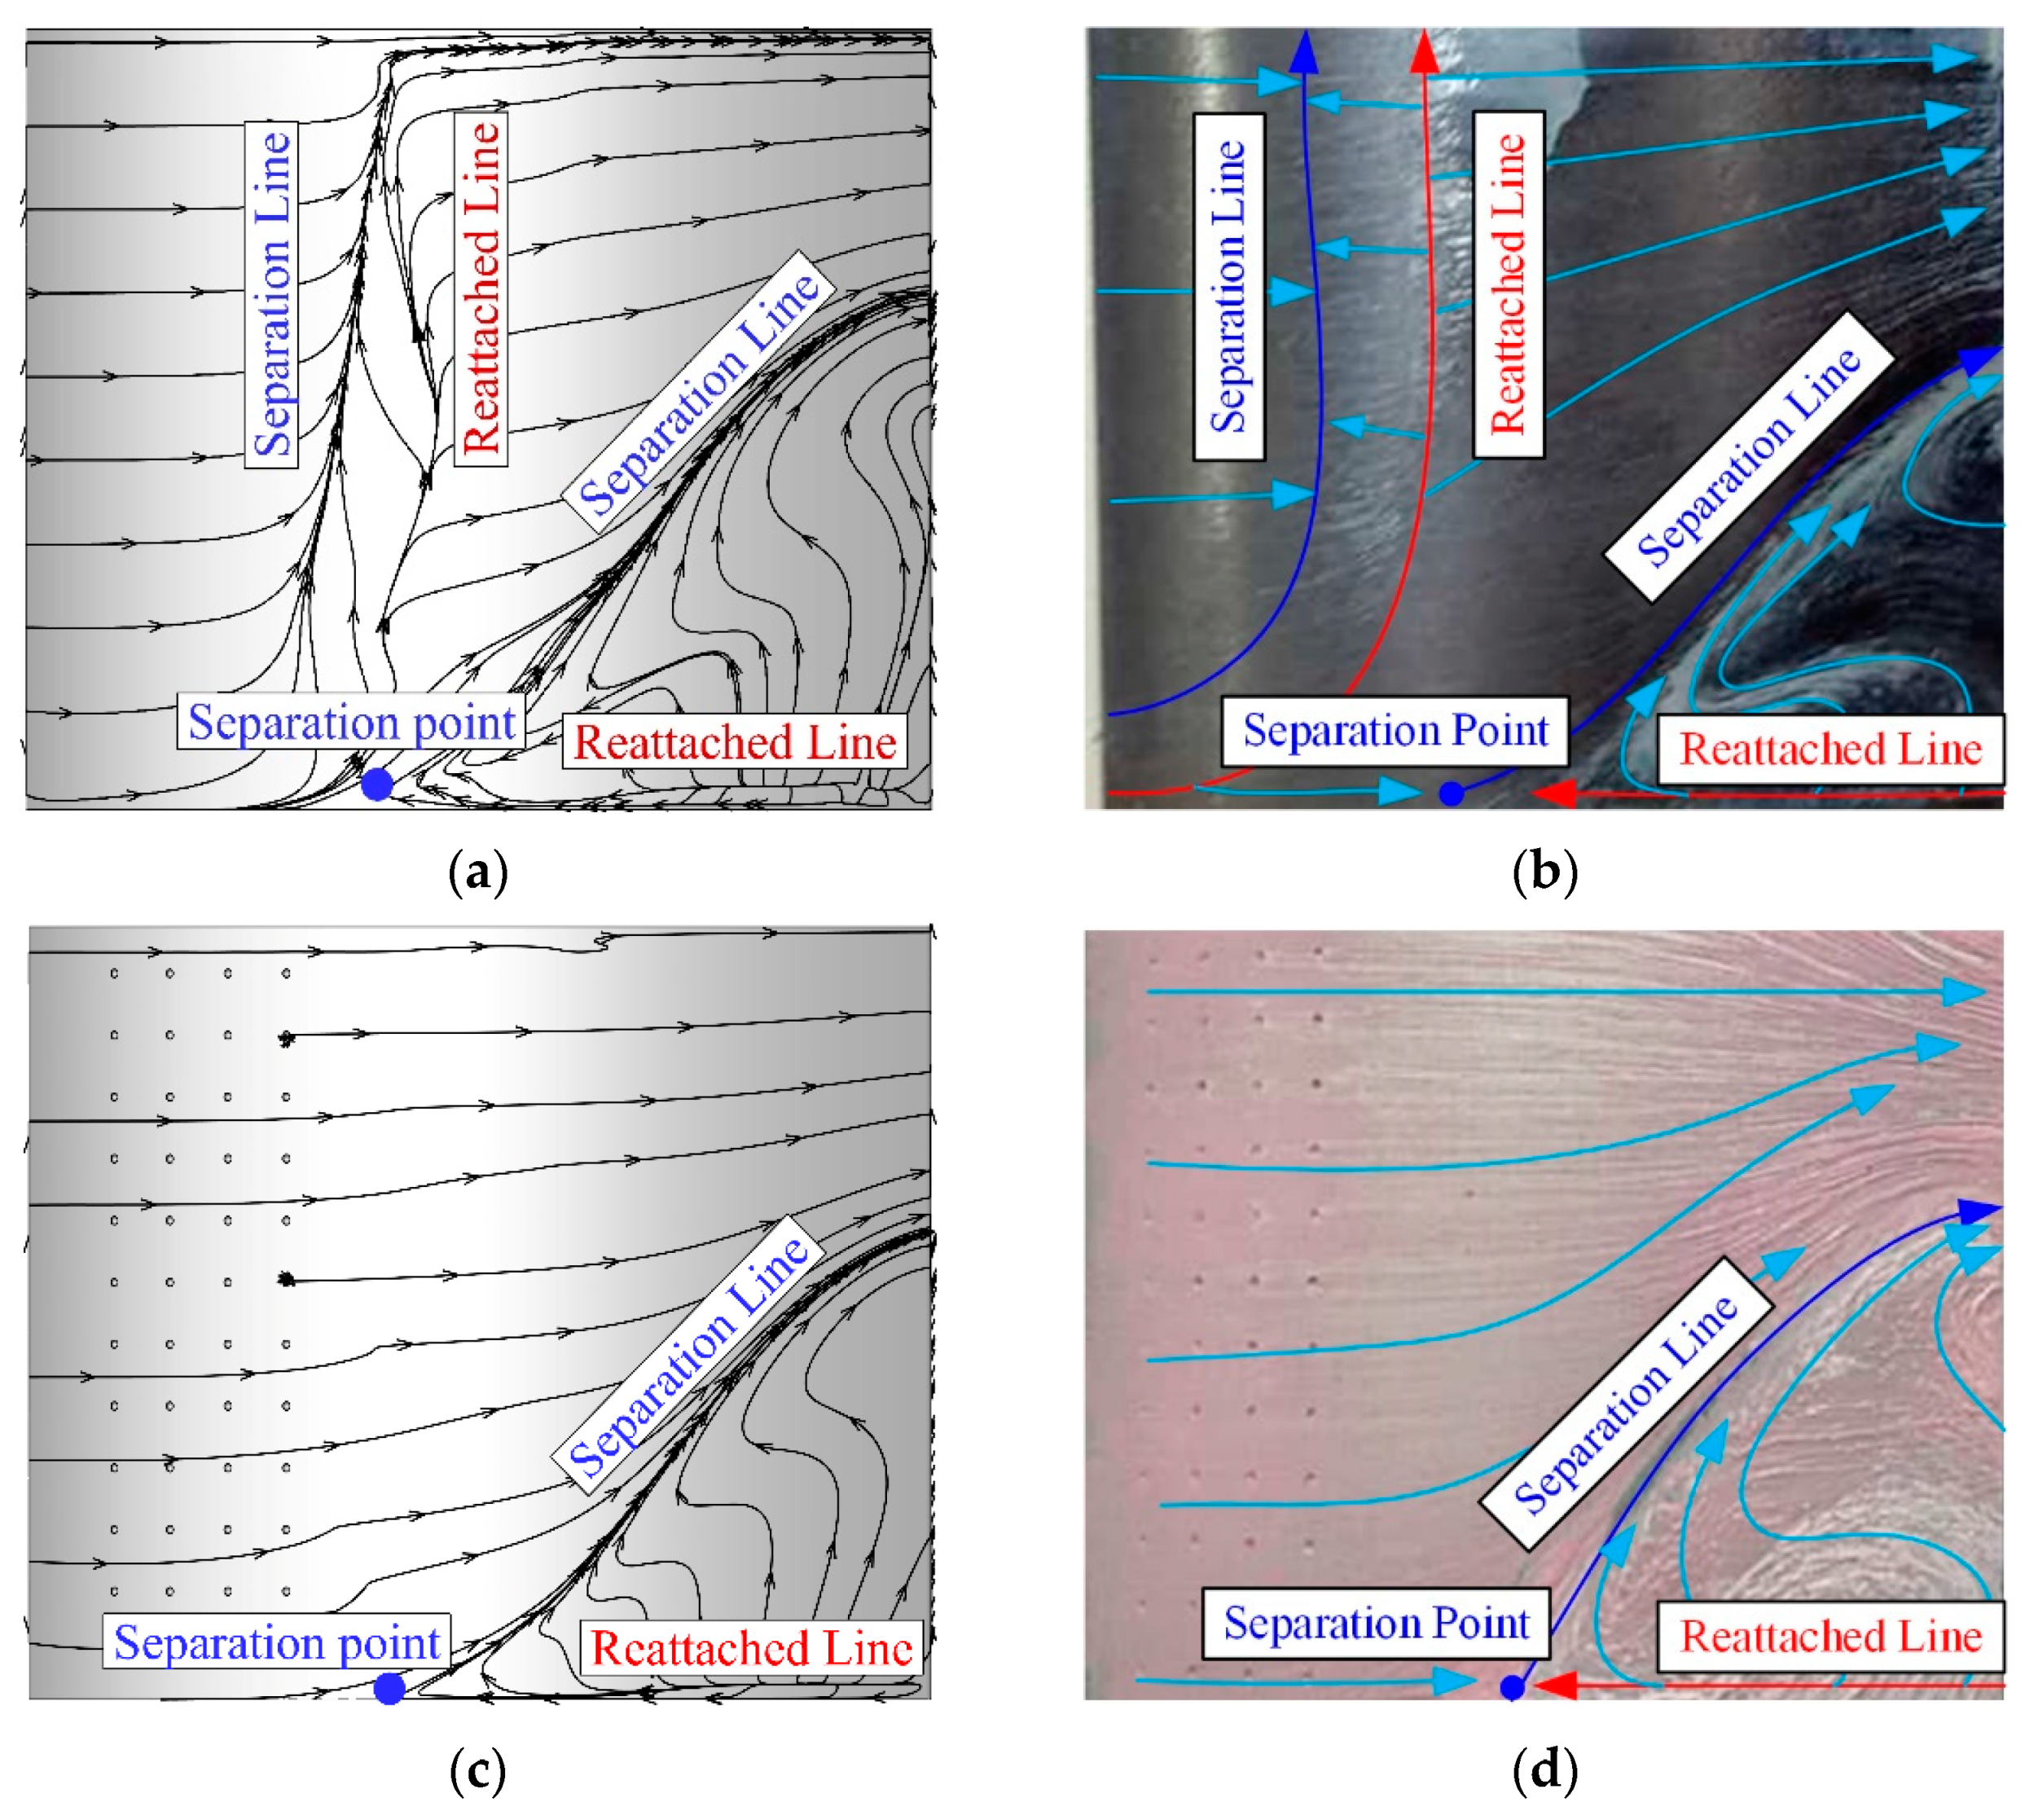
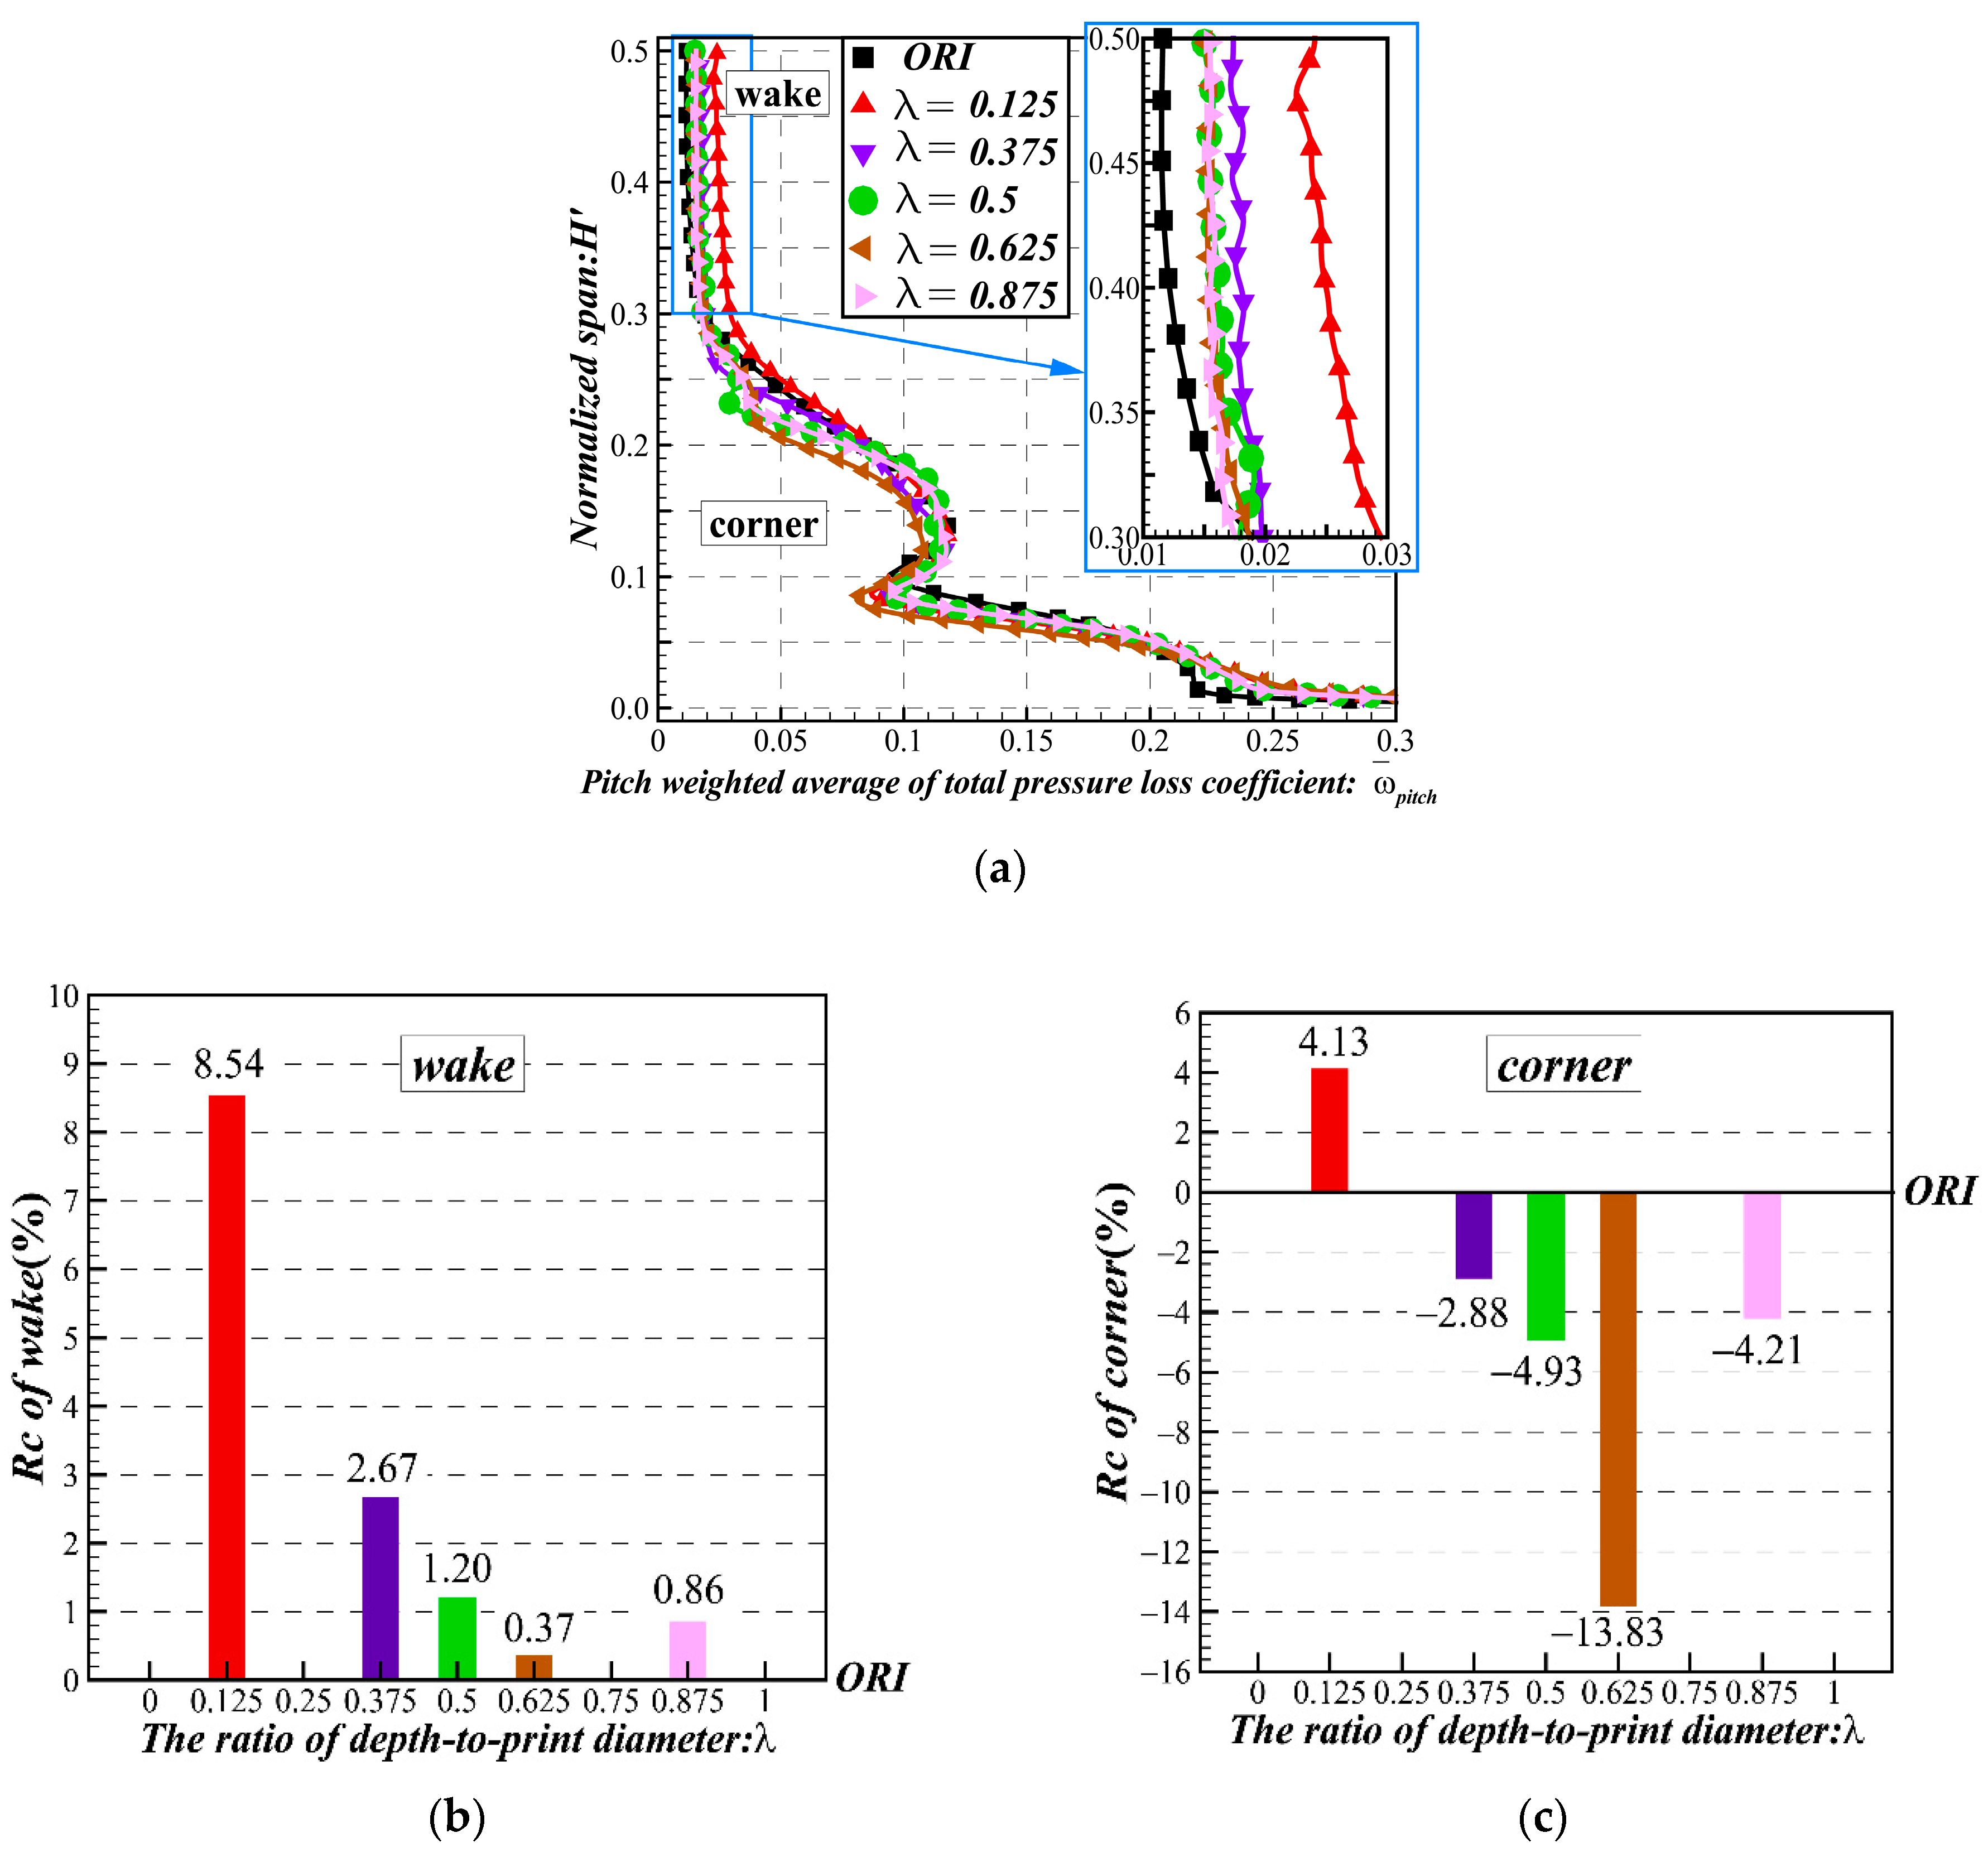
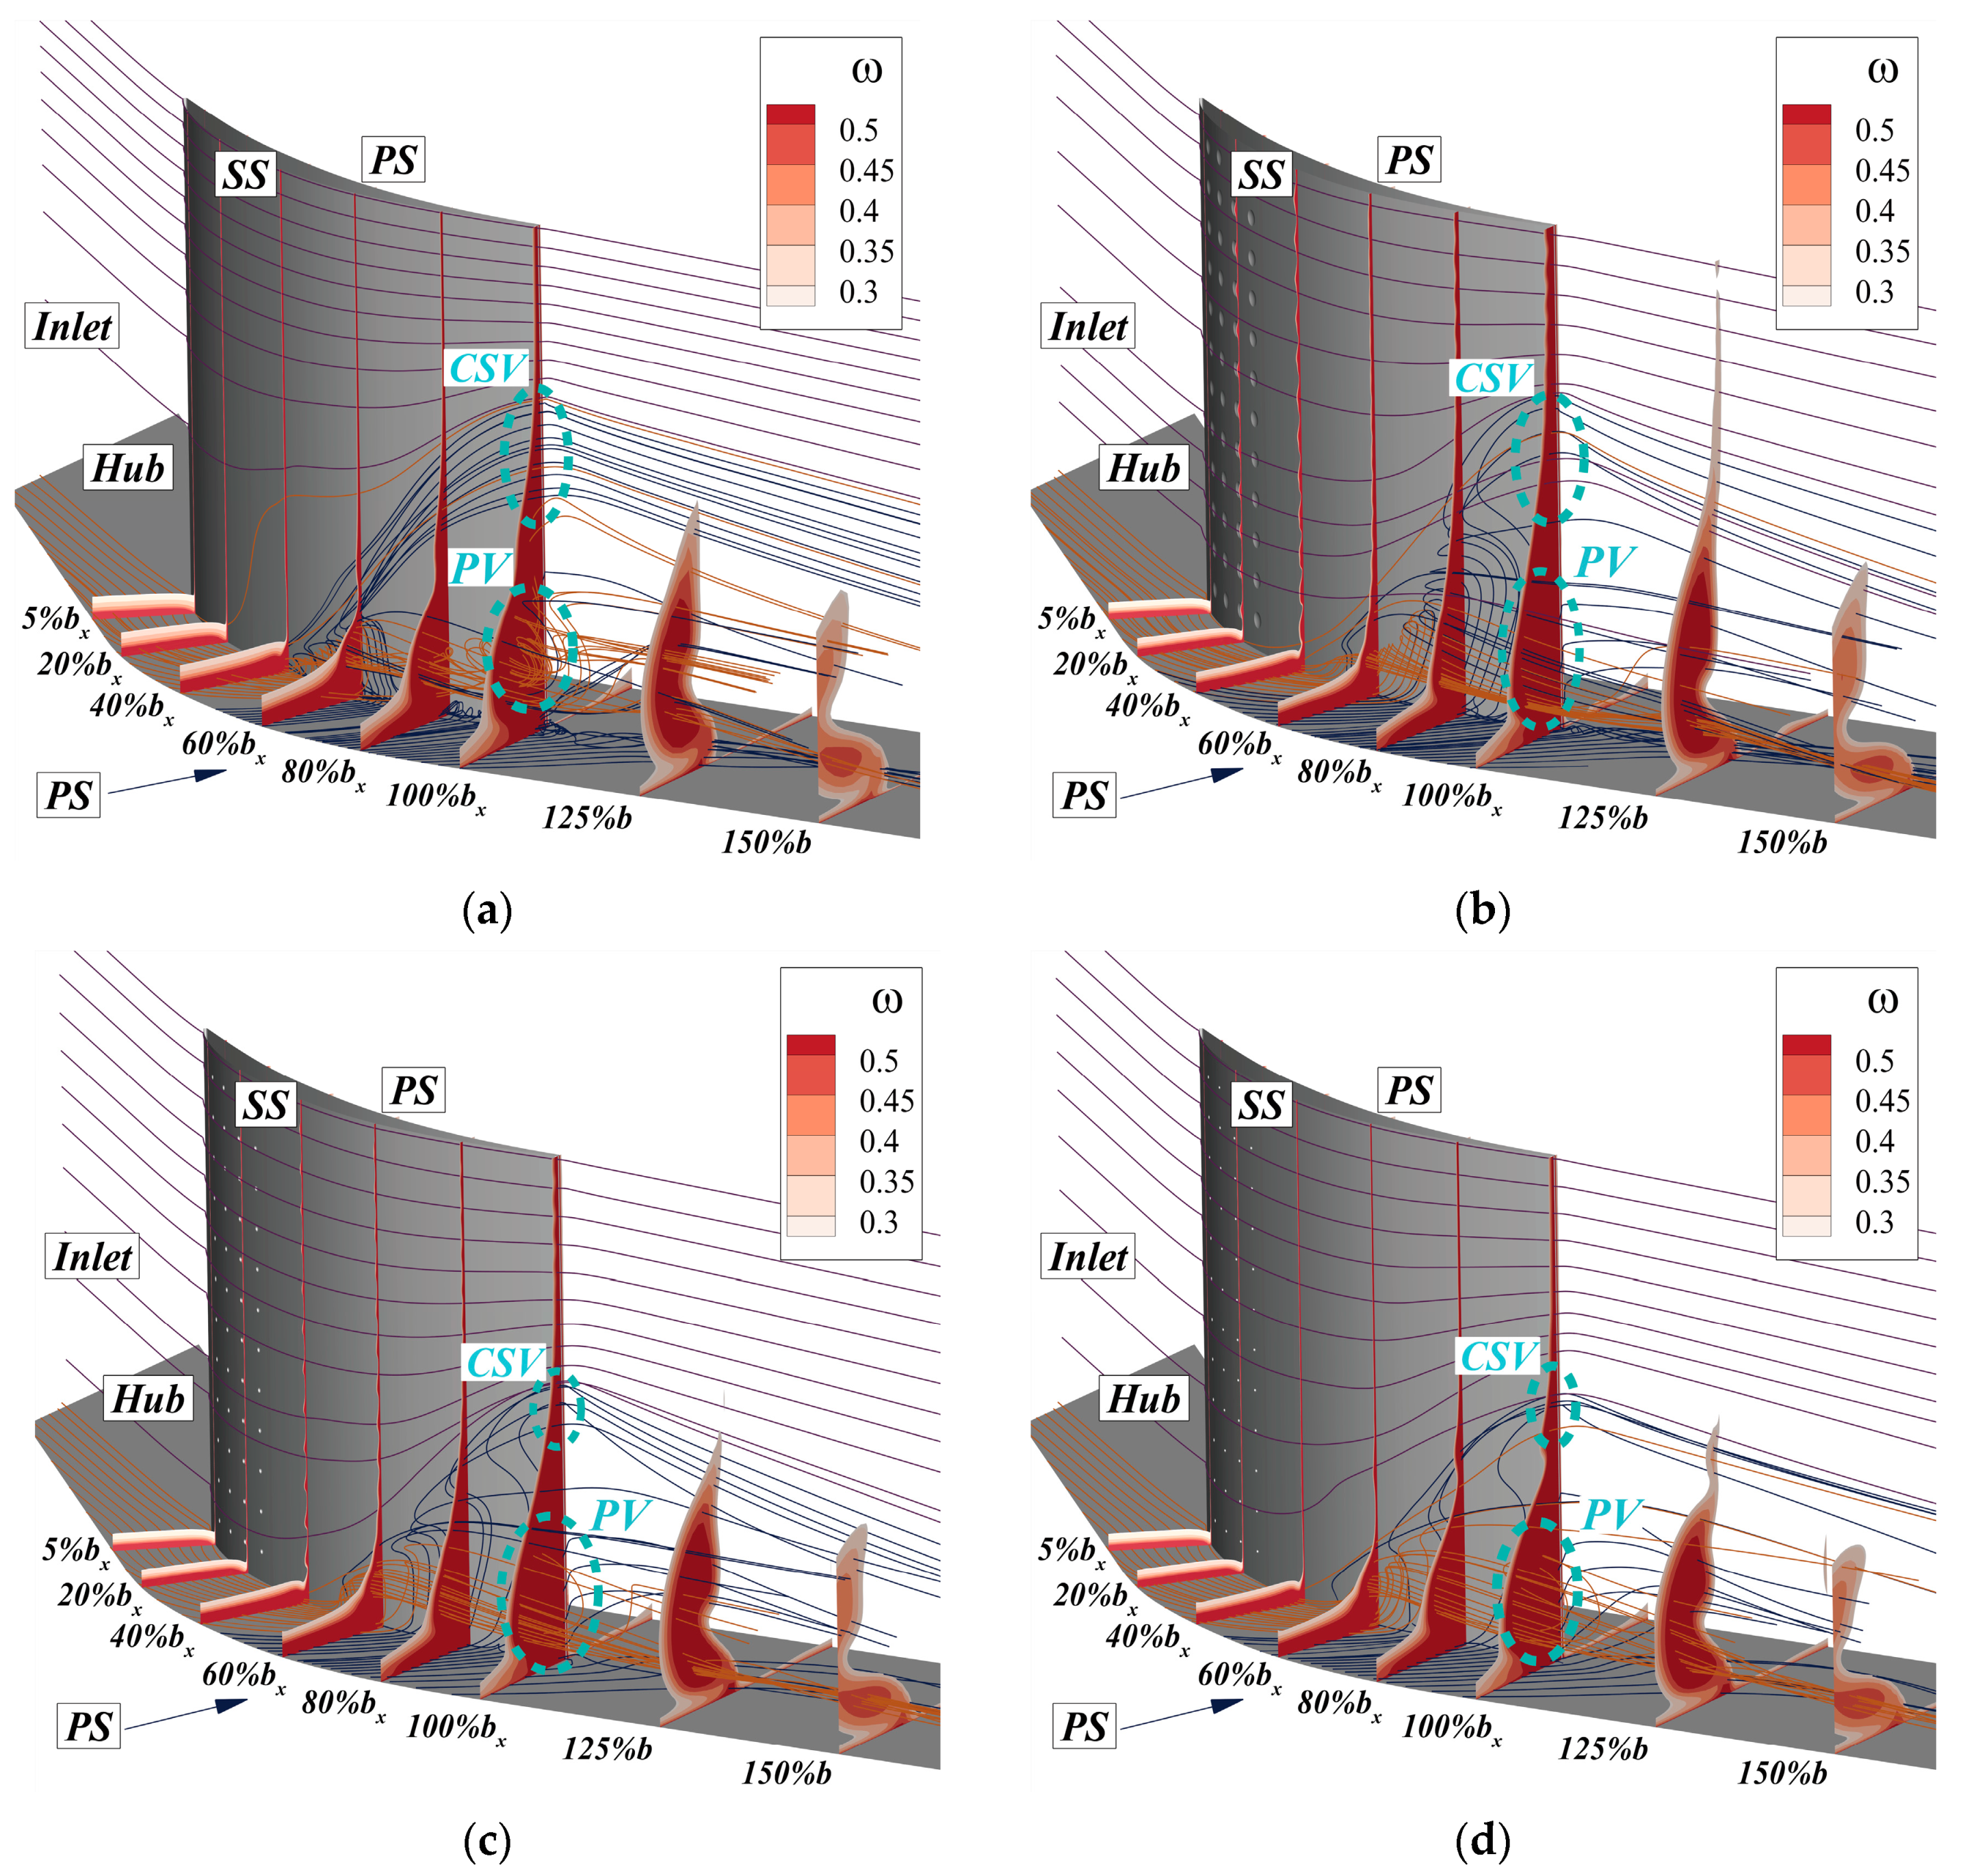
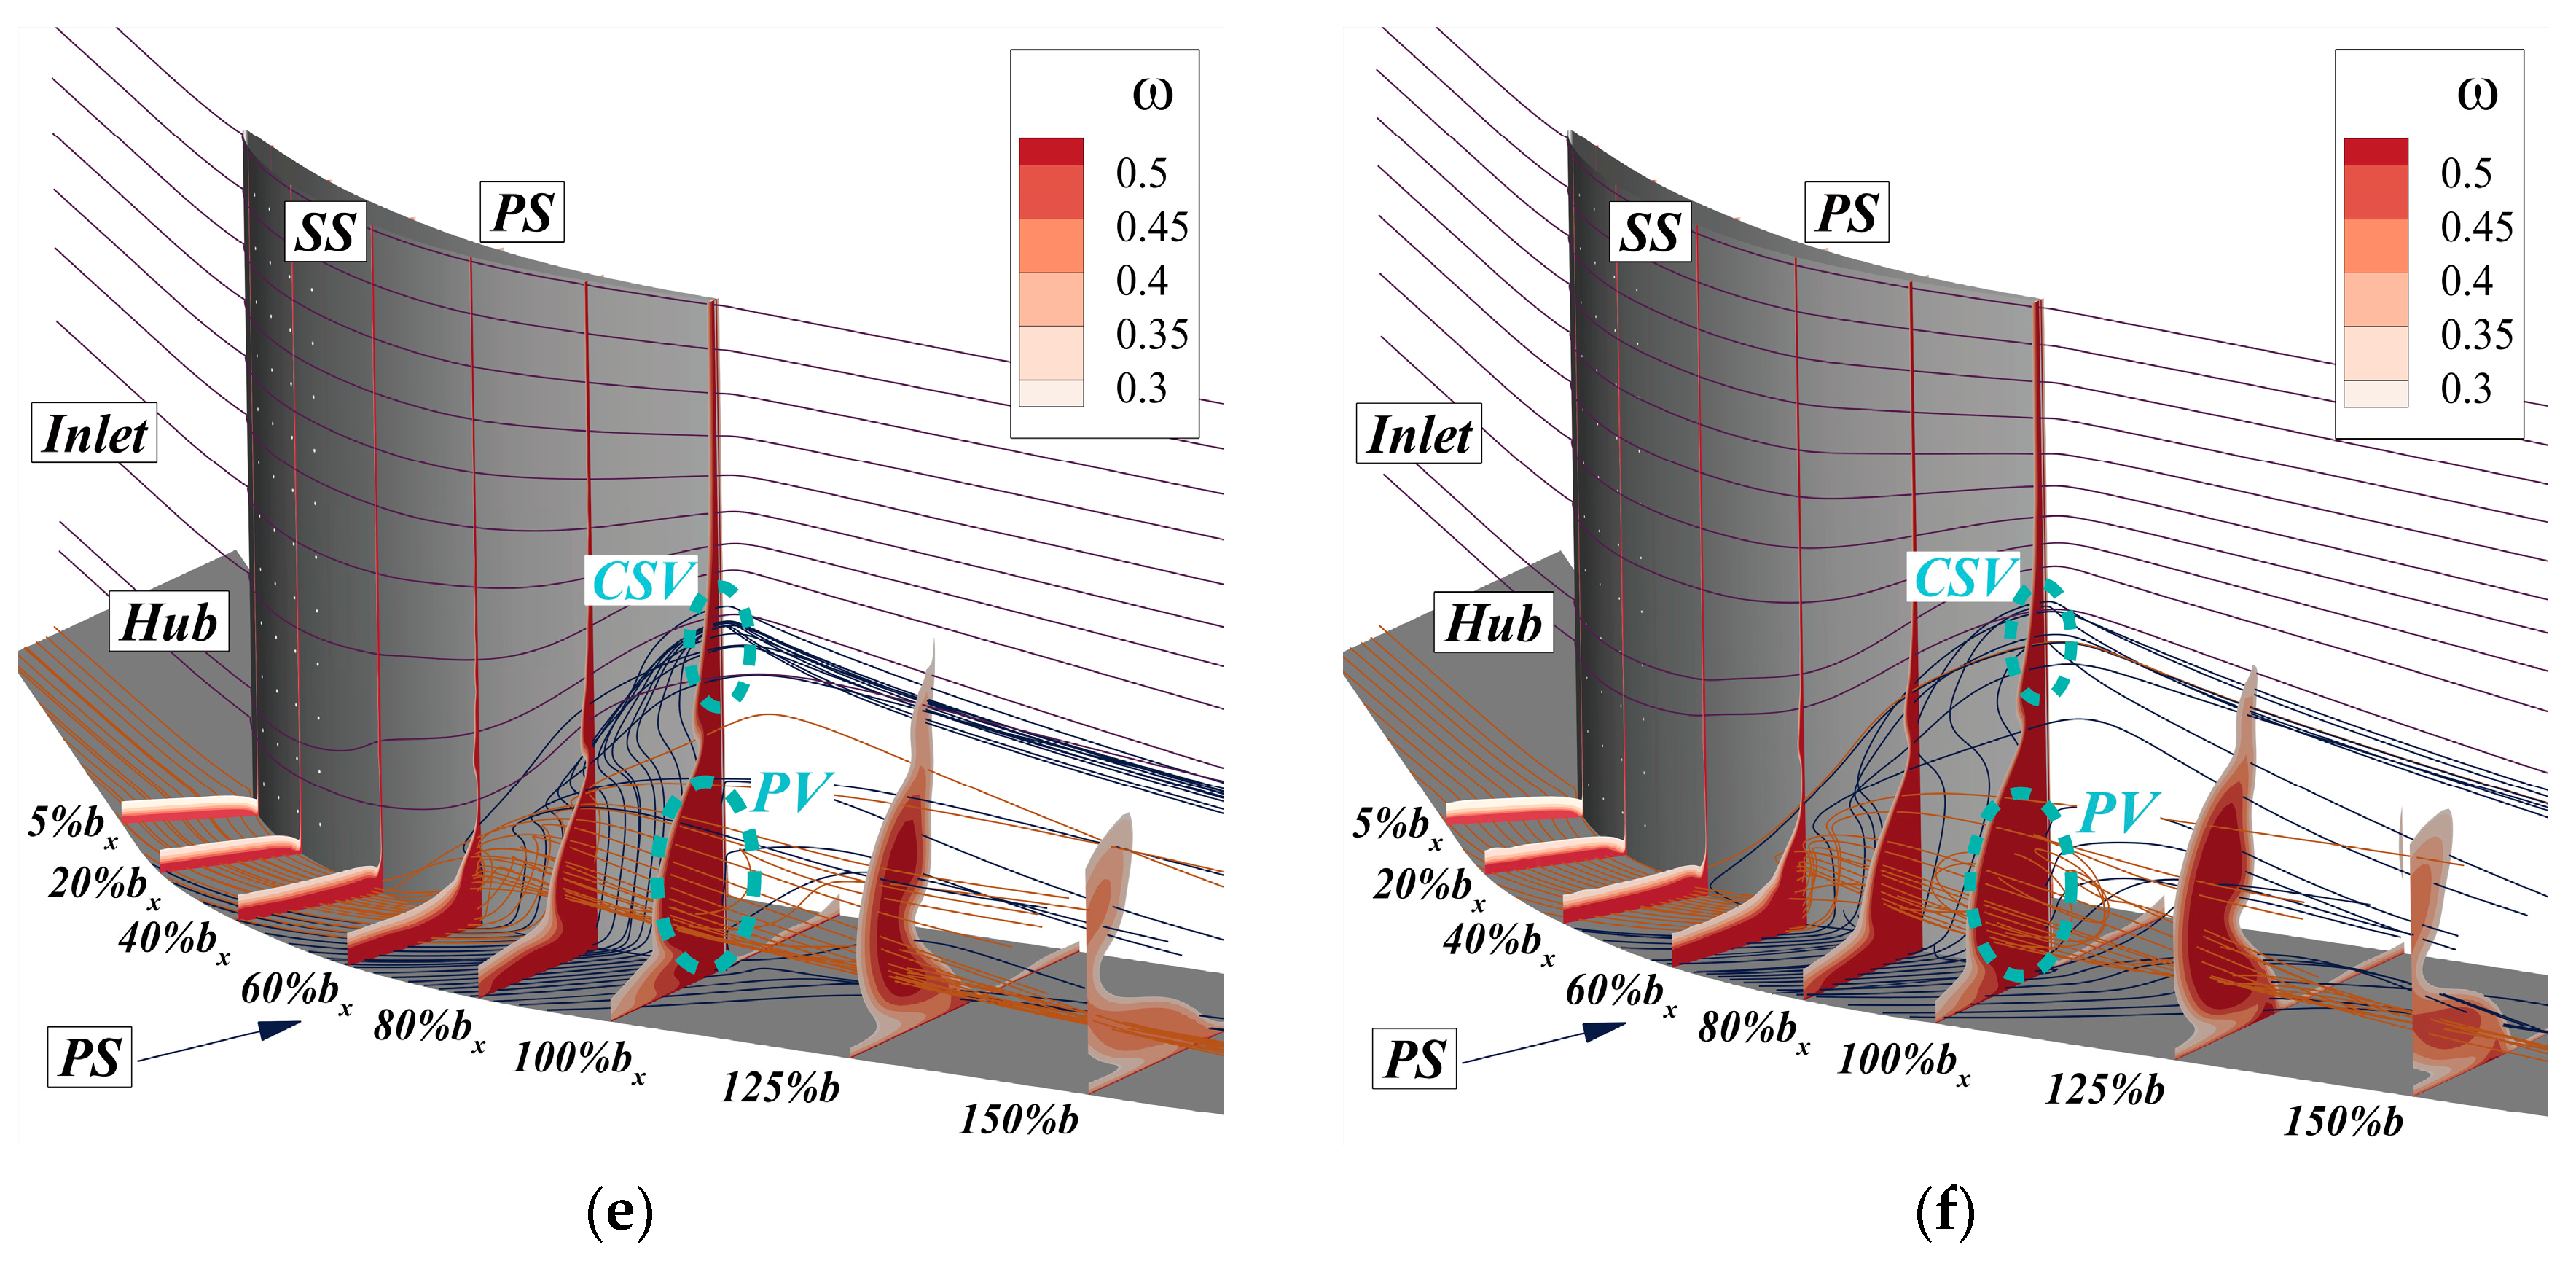
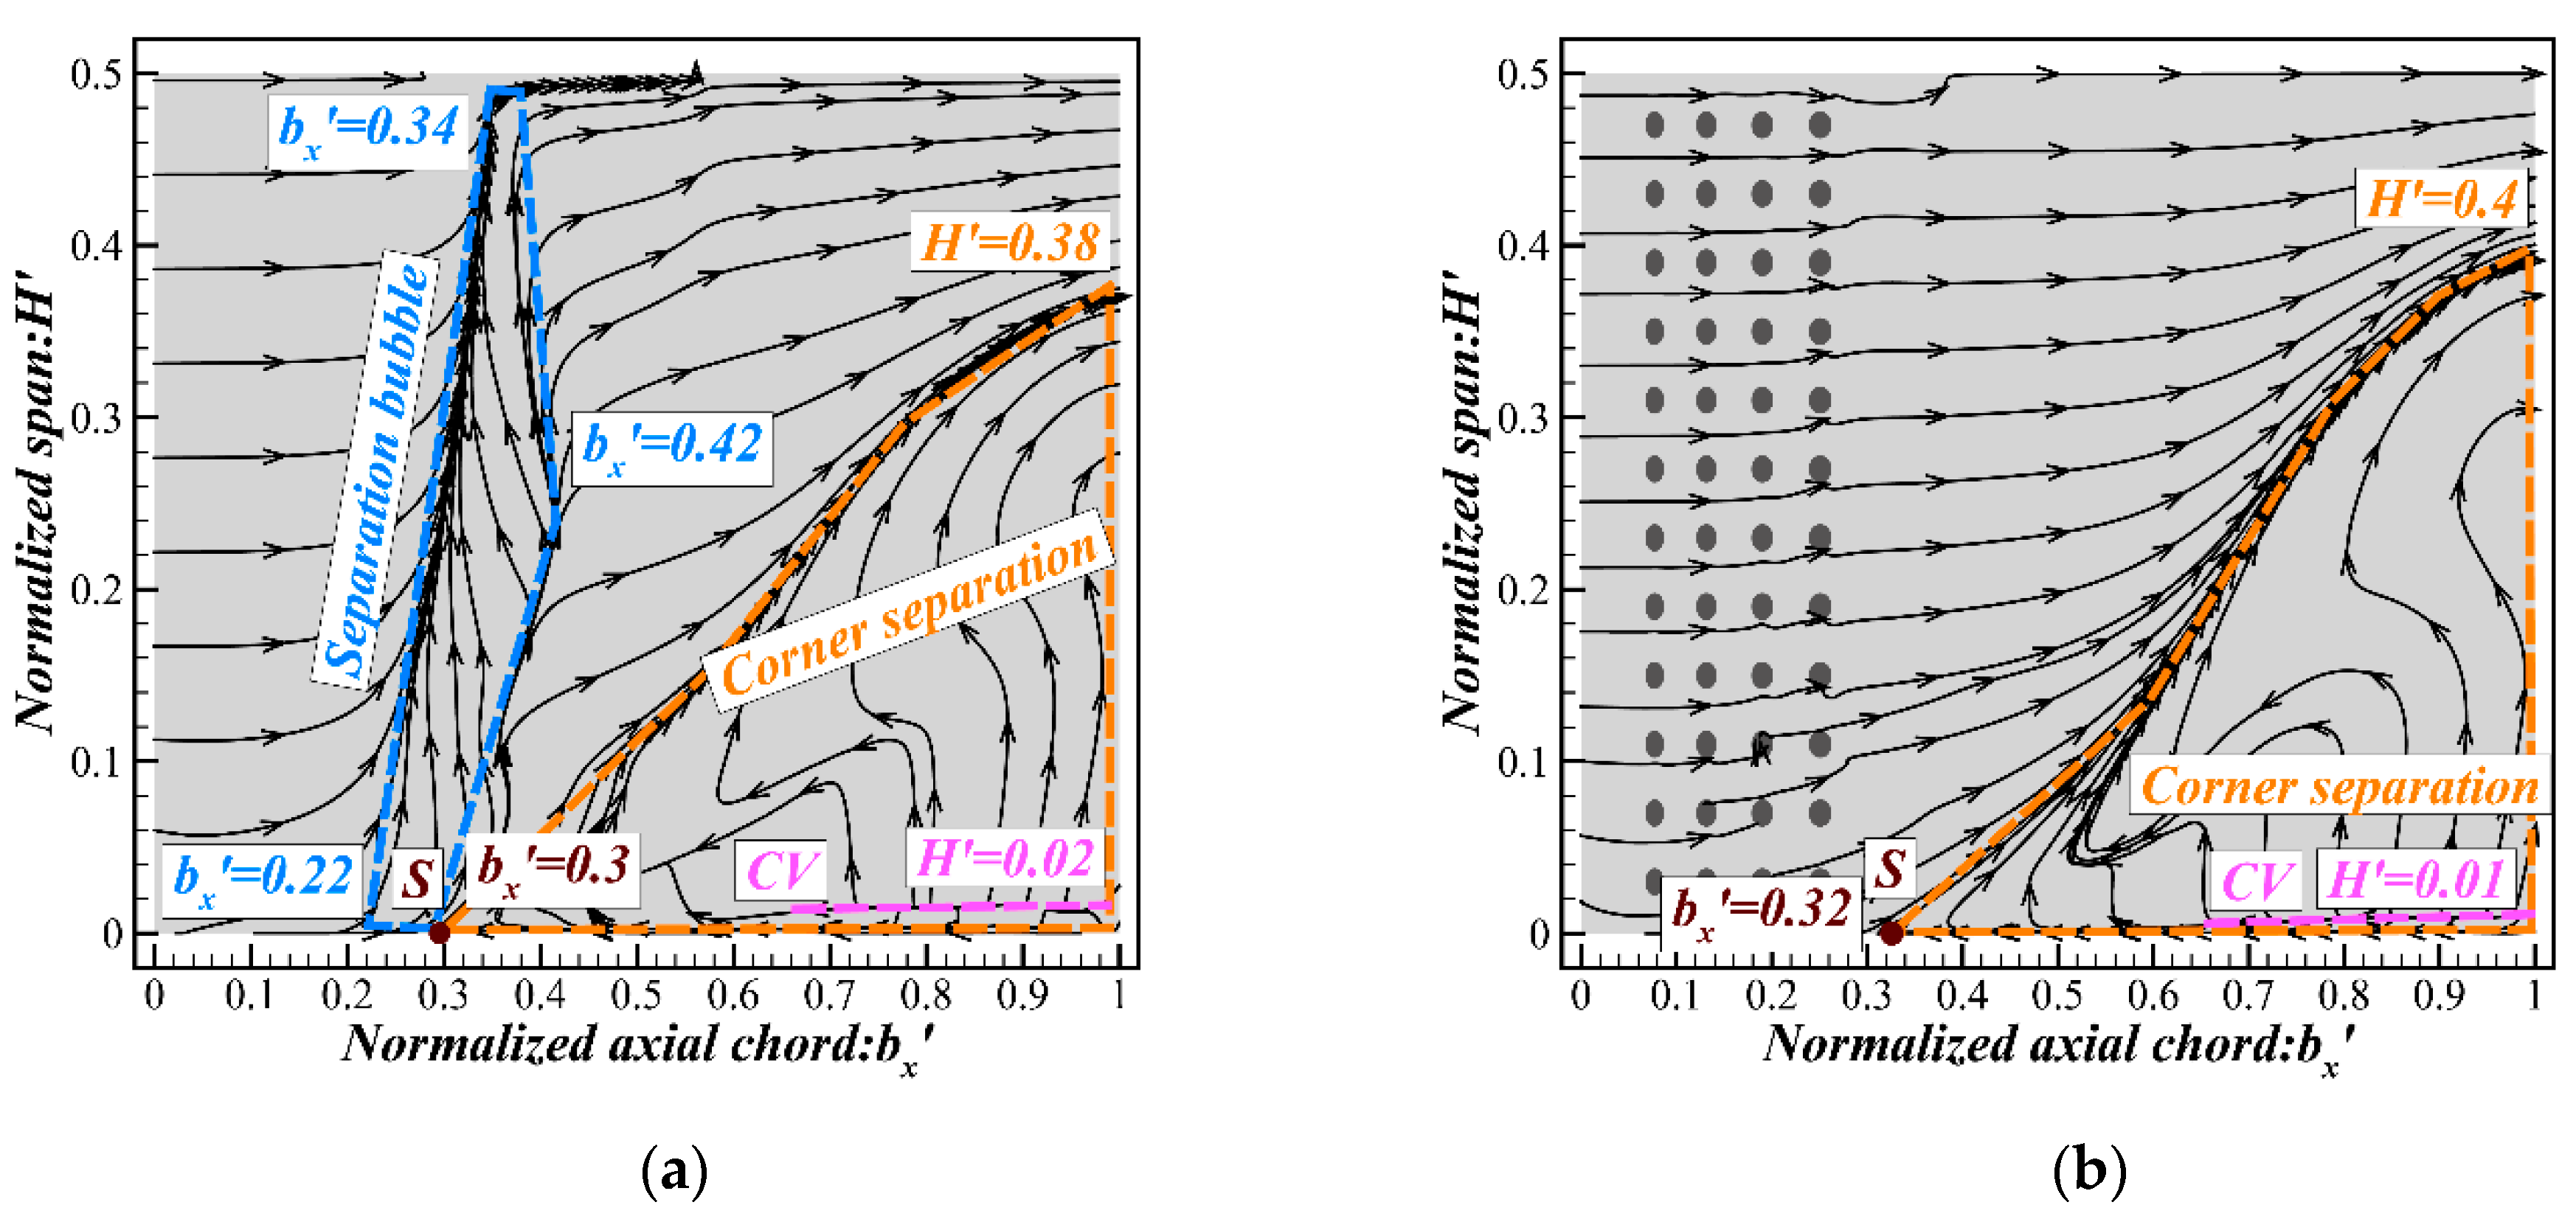
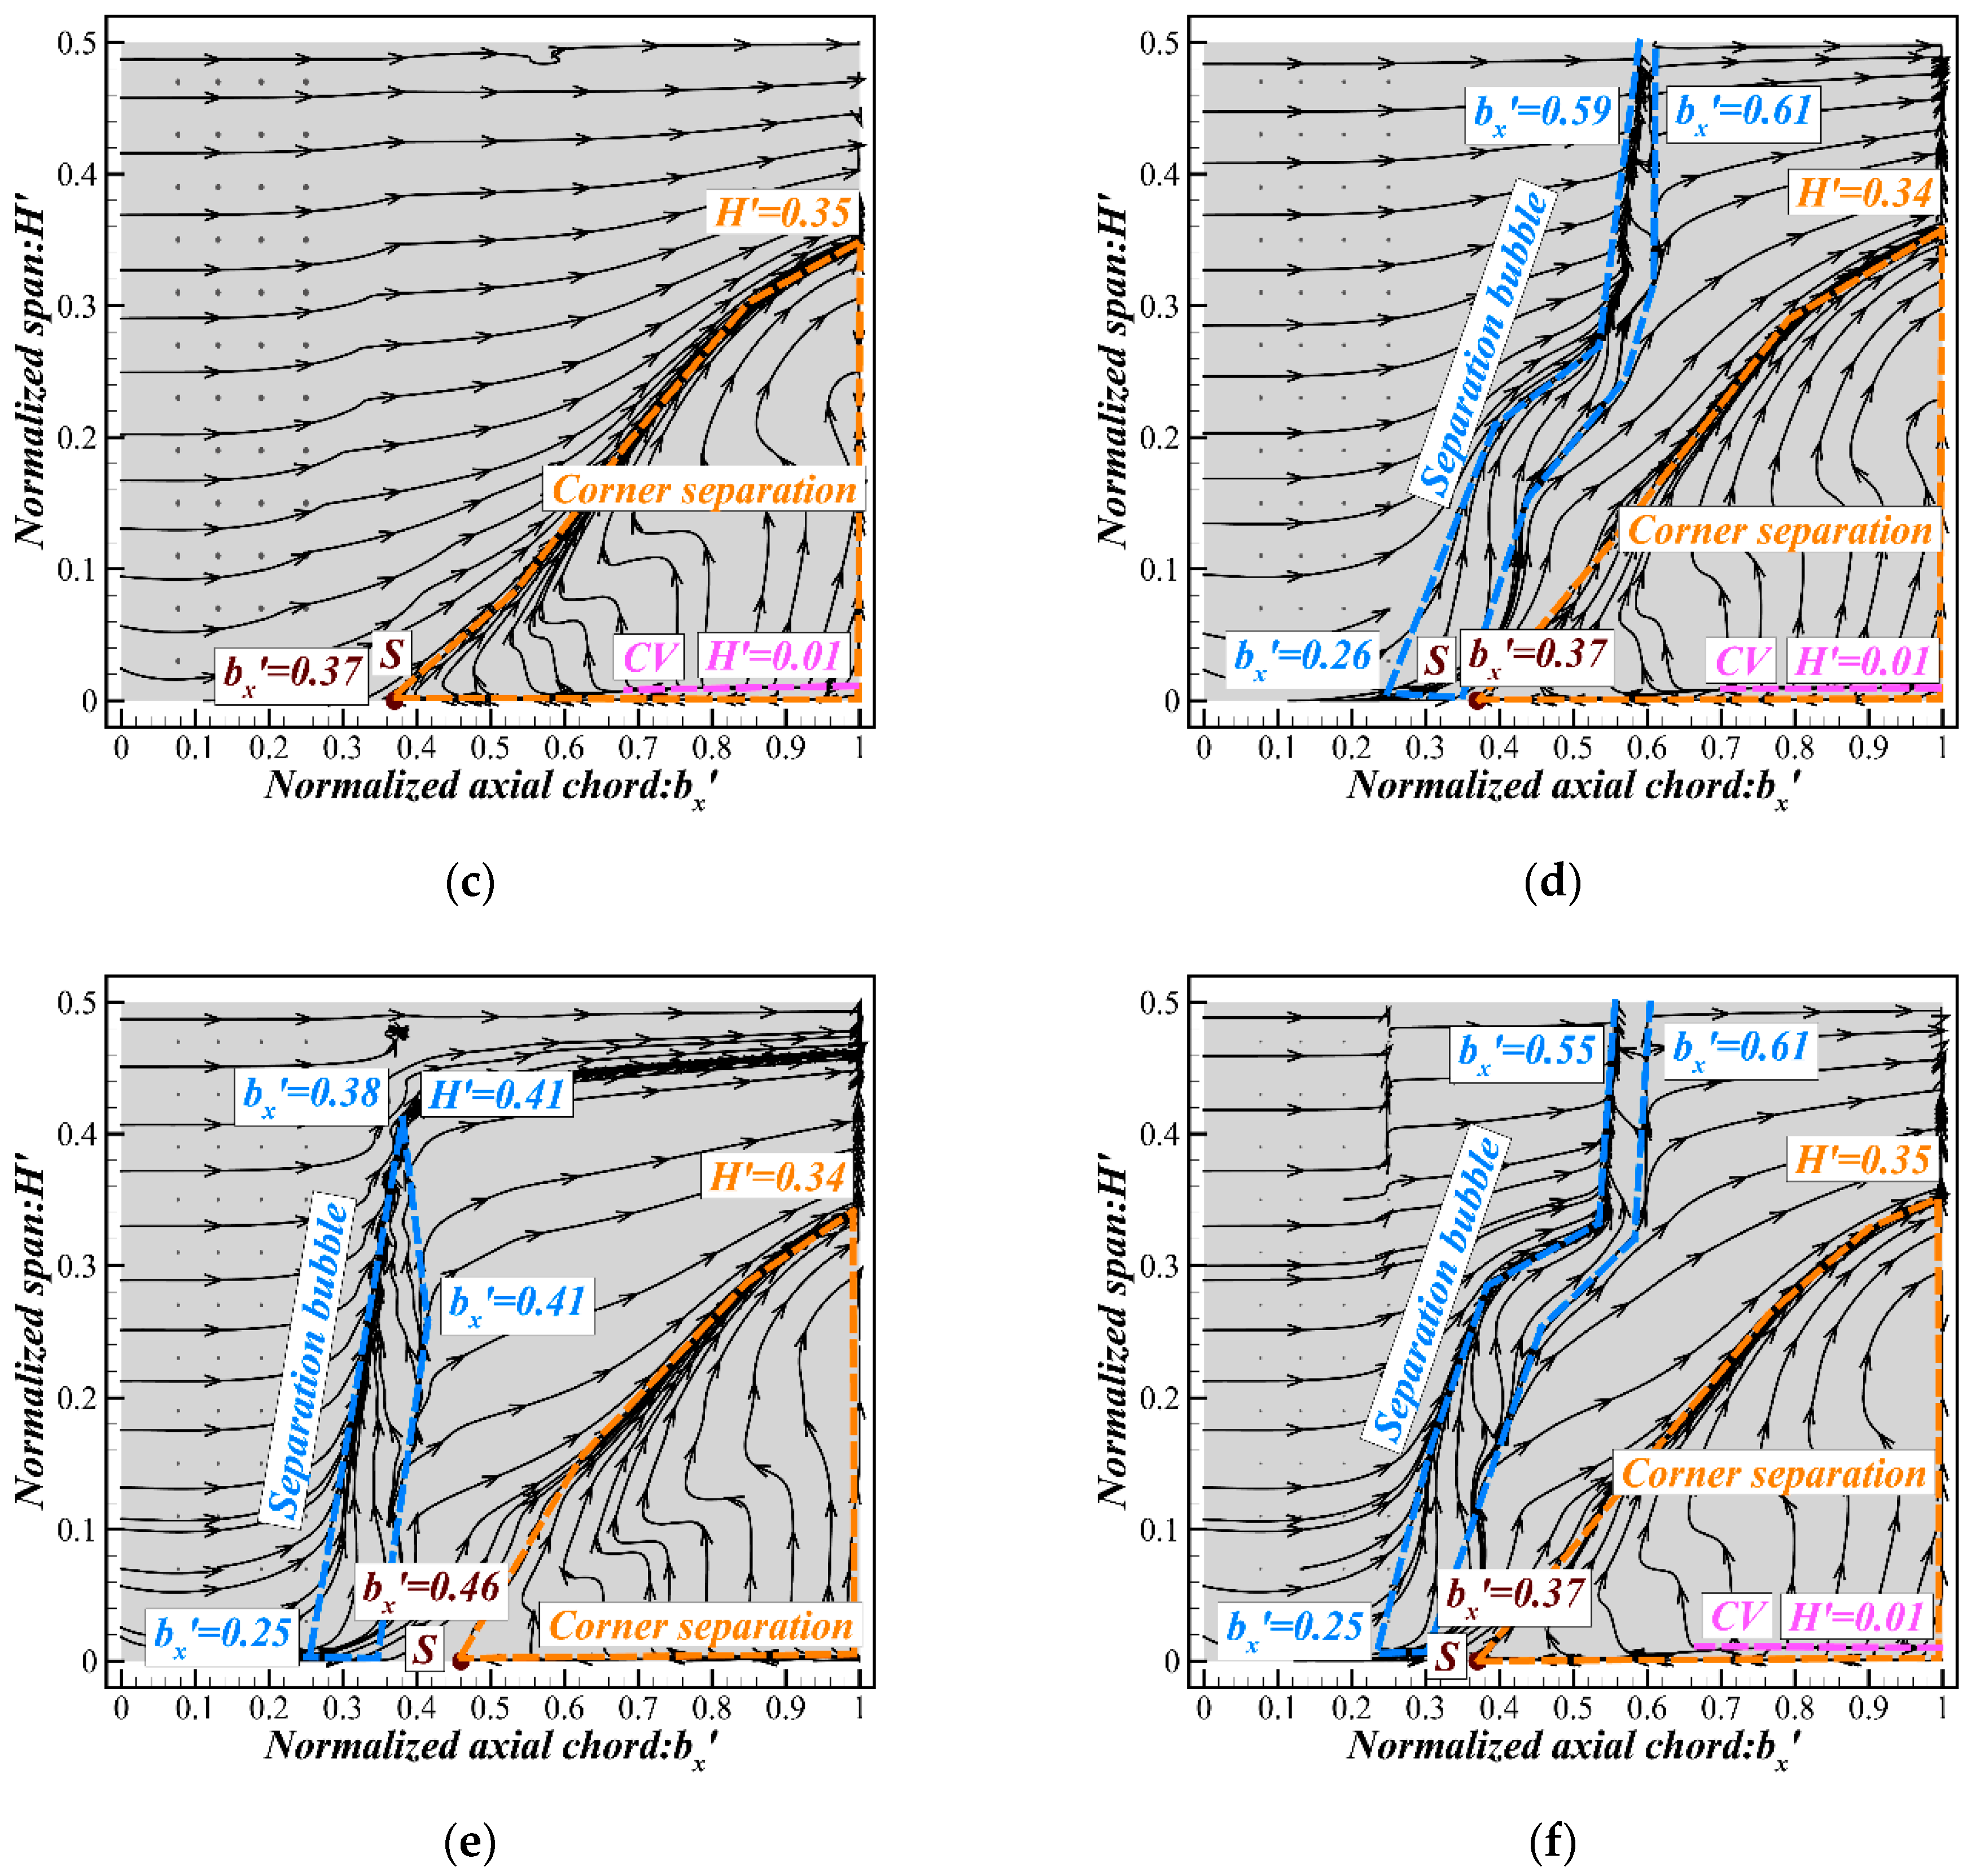
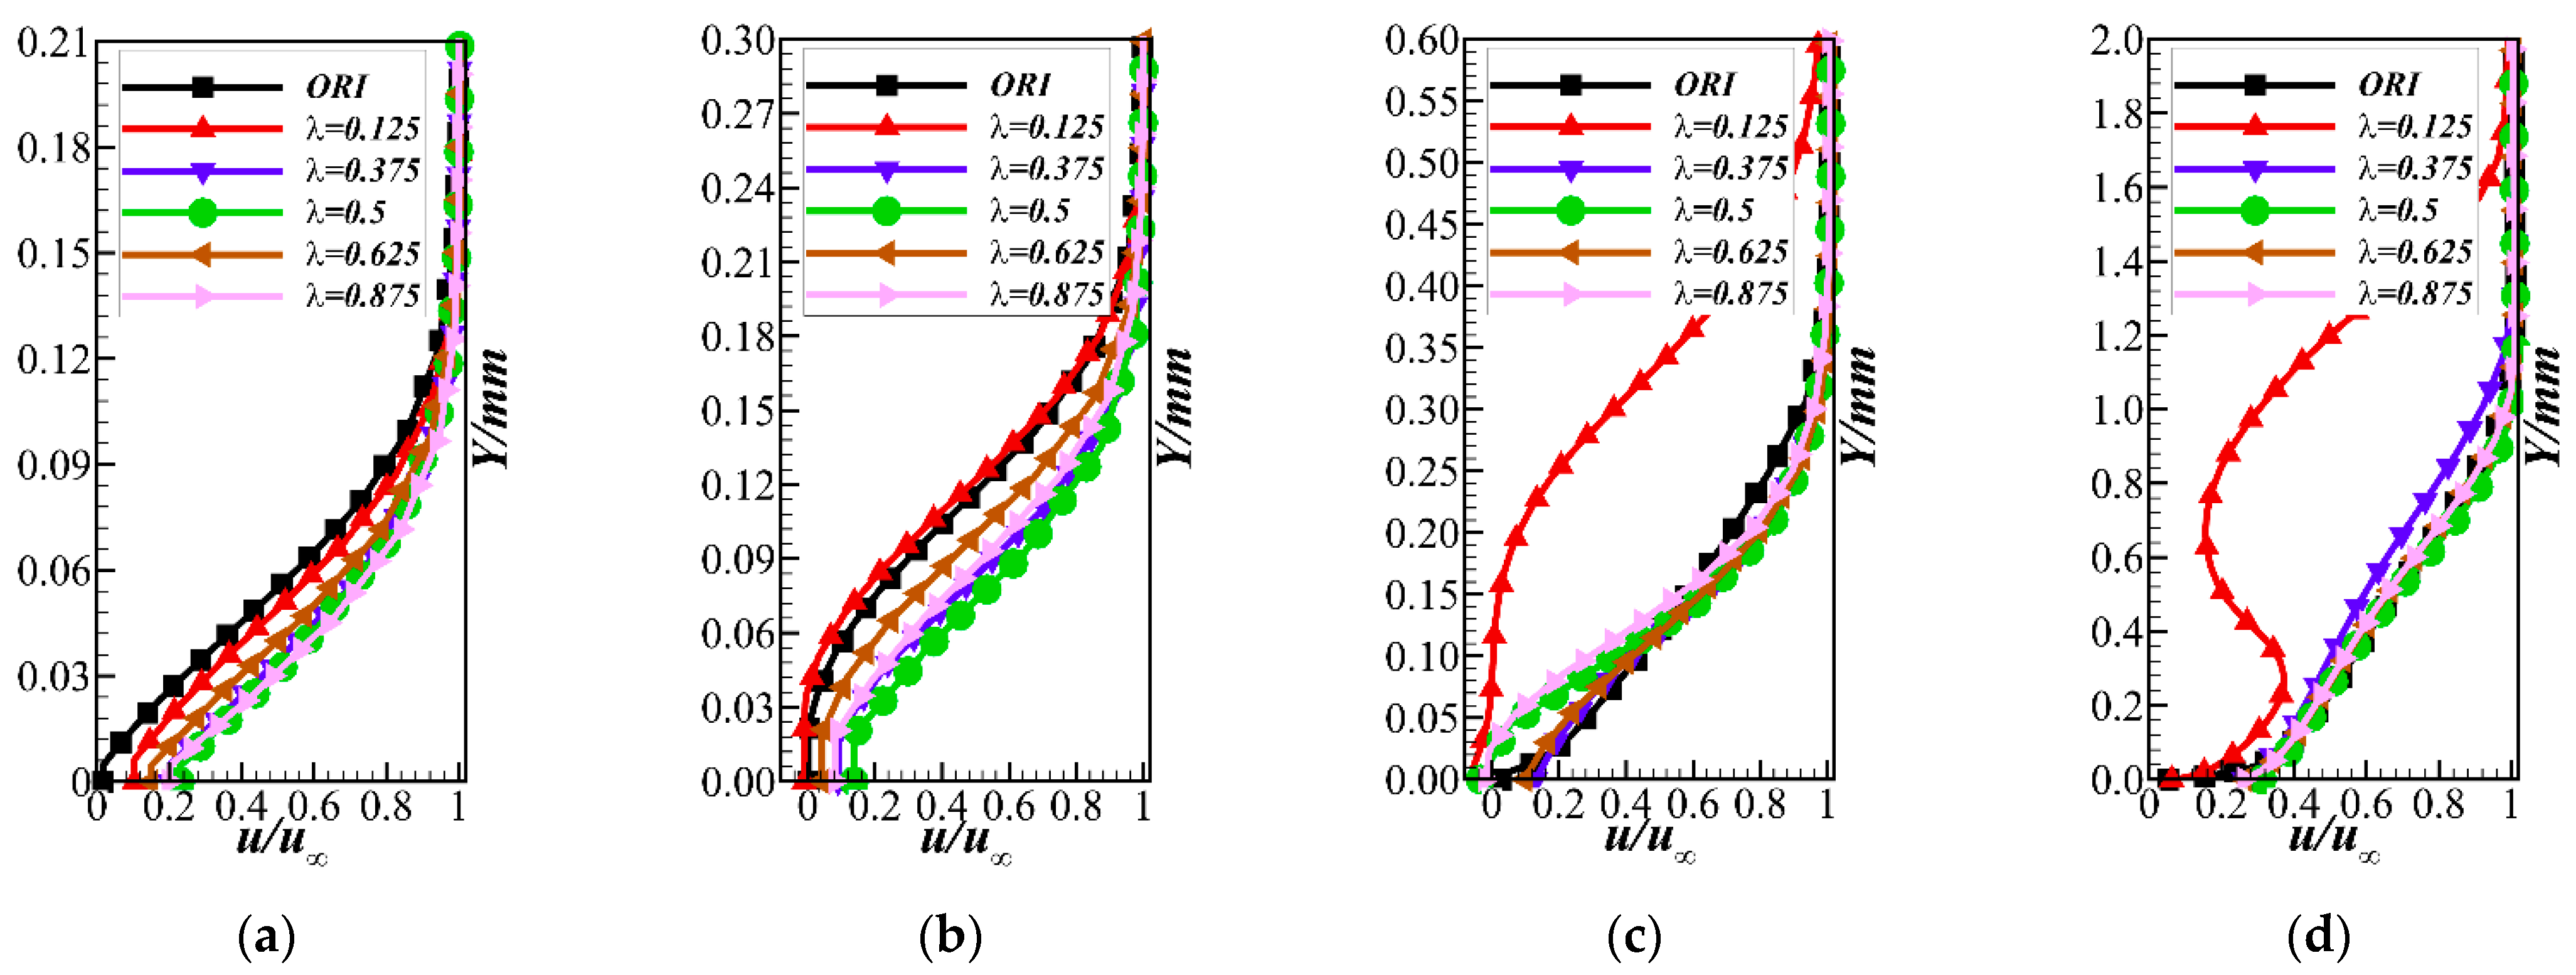
  • The disturbance from the dimple depression reduces the loss caused by corner separation (below 30% blade height) by 13.83%, but increases the loss of the wake by 0.37%. The laminar separation bubbles on the suction surface are weakened (eliminated in the inferior arc and delayed in the semicircle and superior arc), and the excessive disturbance leads to the barbaric growth of the boundary layer and eventually increases the wake loss. The lateral flow near the hub wall of the dimpled cascades is suppressed and flows vertically, which degrades the characteristics of the closed corner separation. Therefore, the starting point of the corner separation is delayed and the range shrinks.
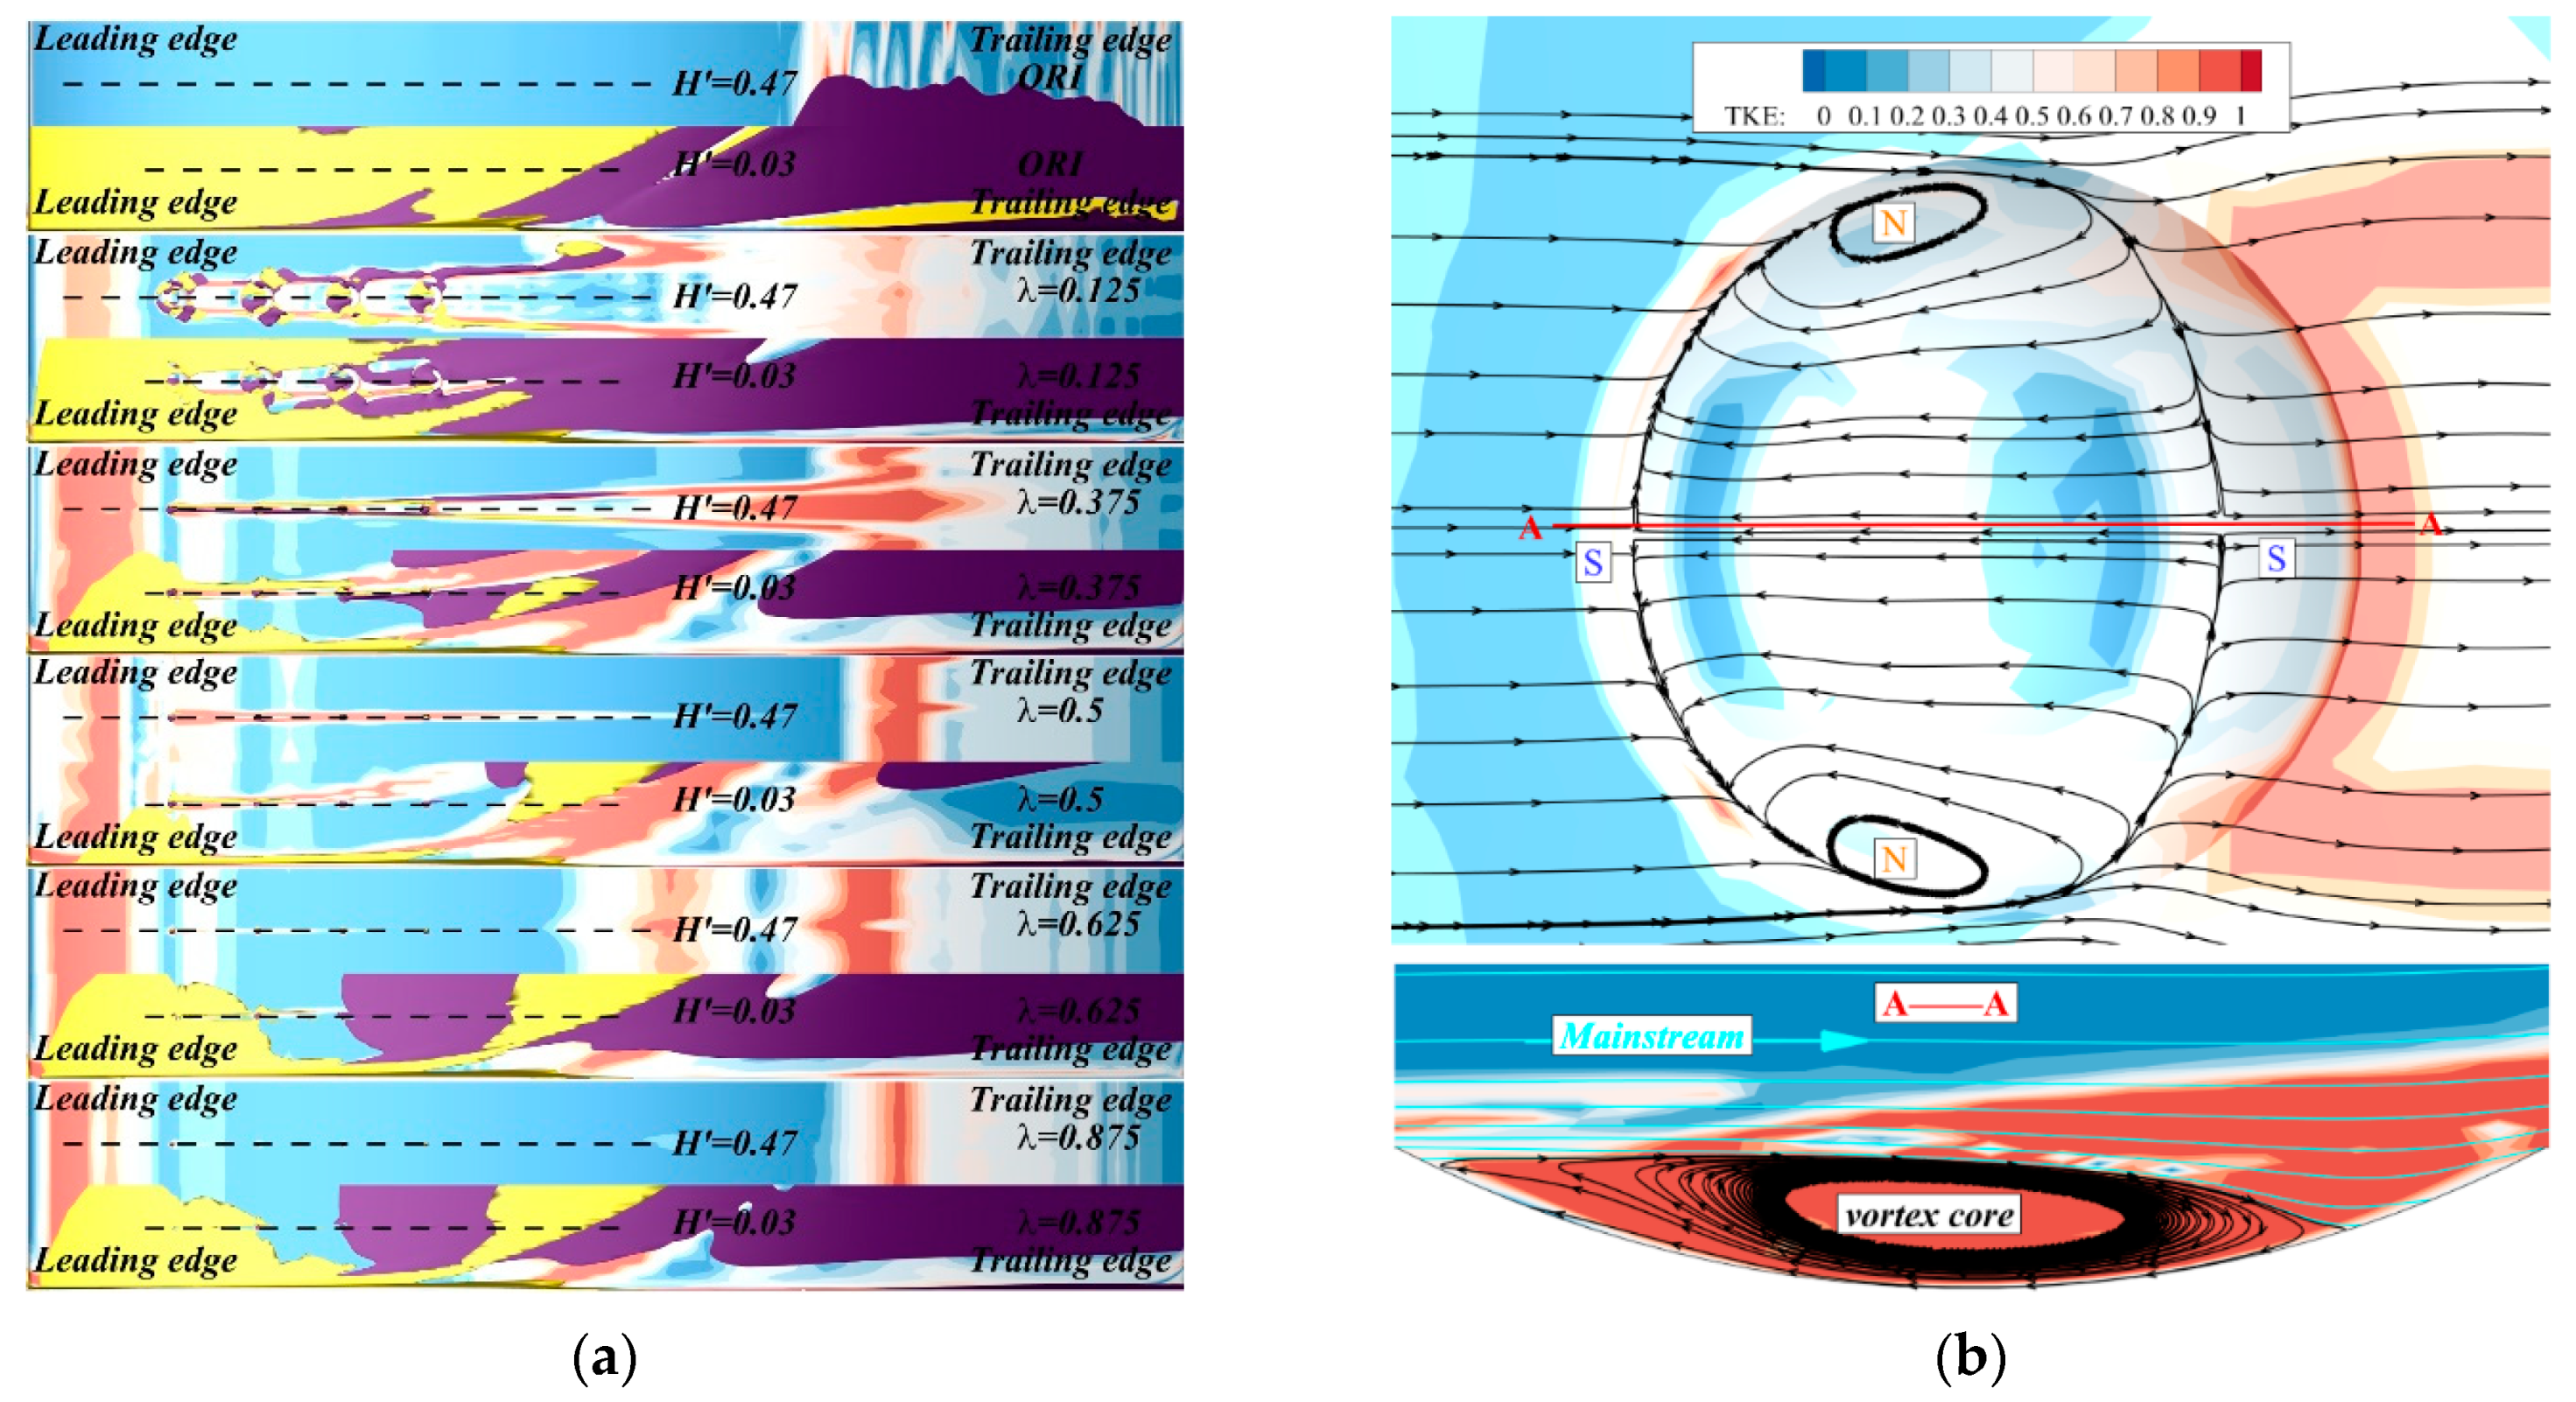
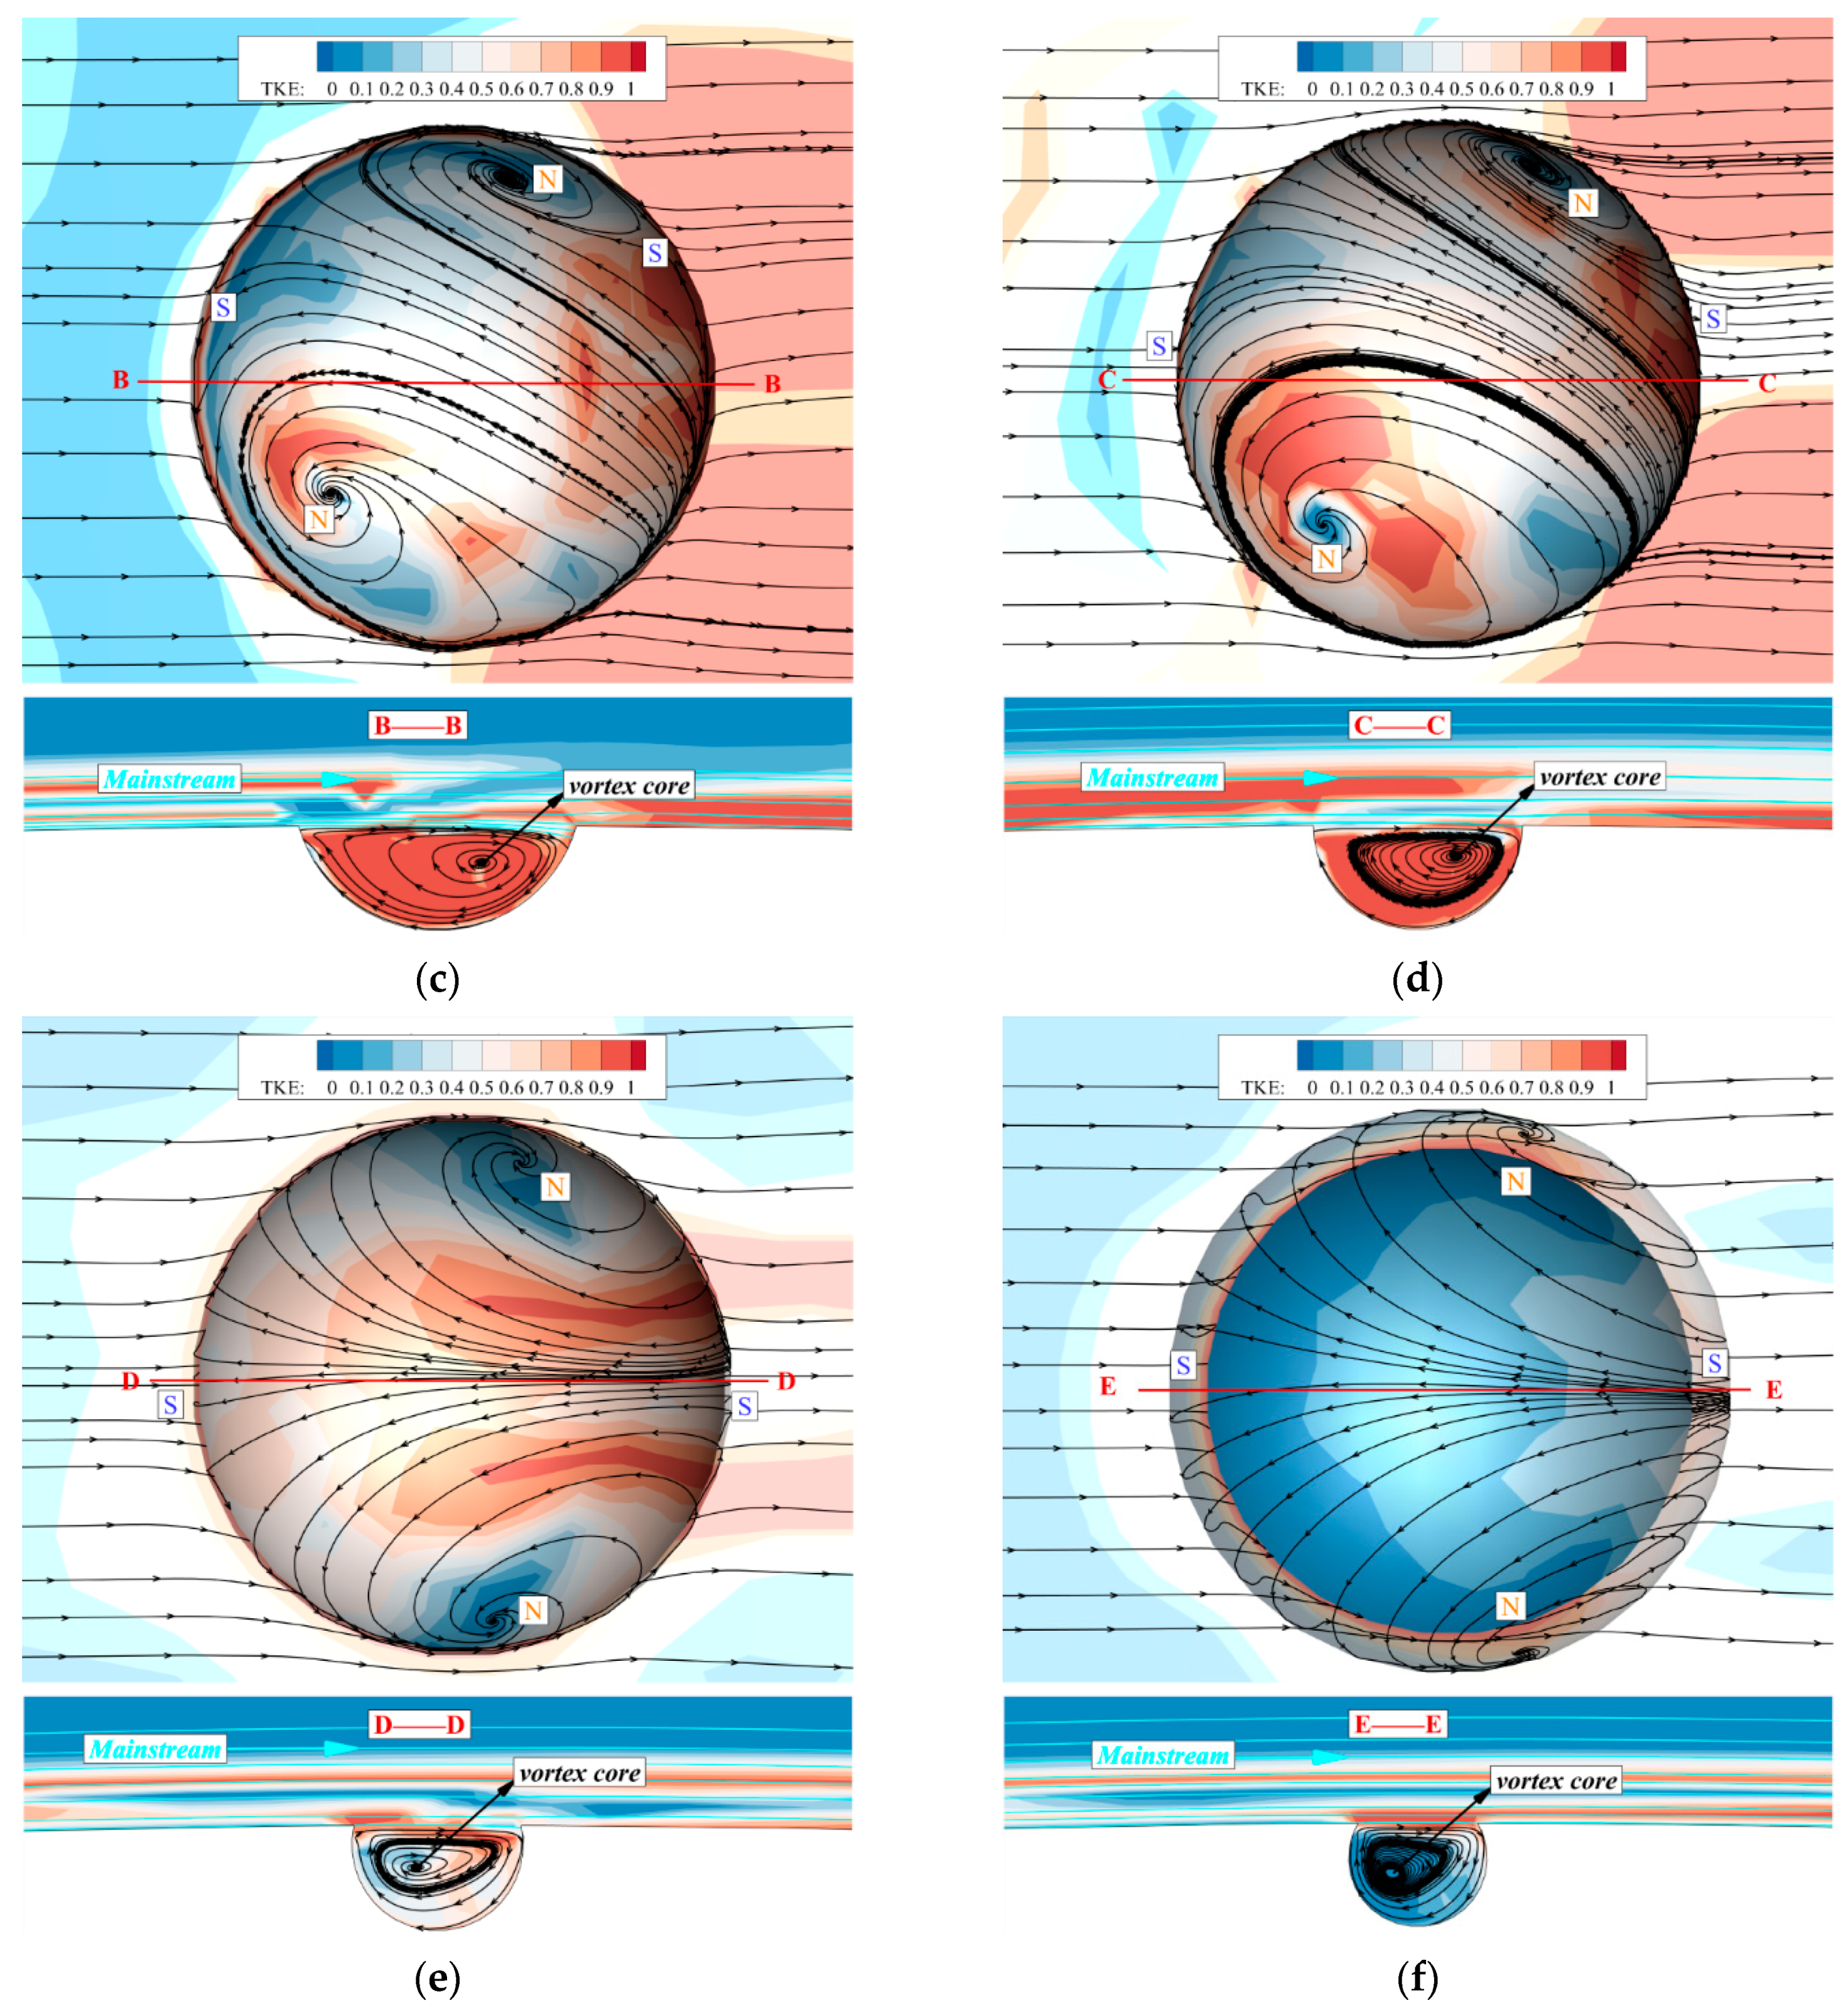
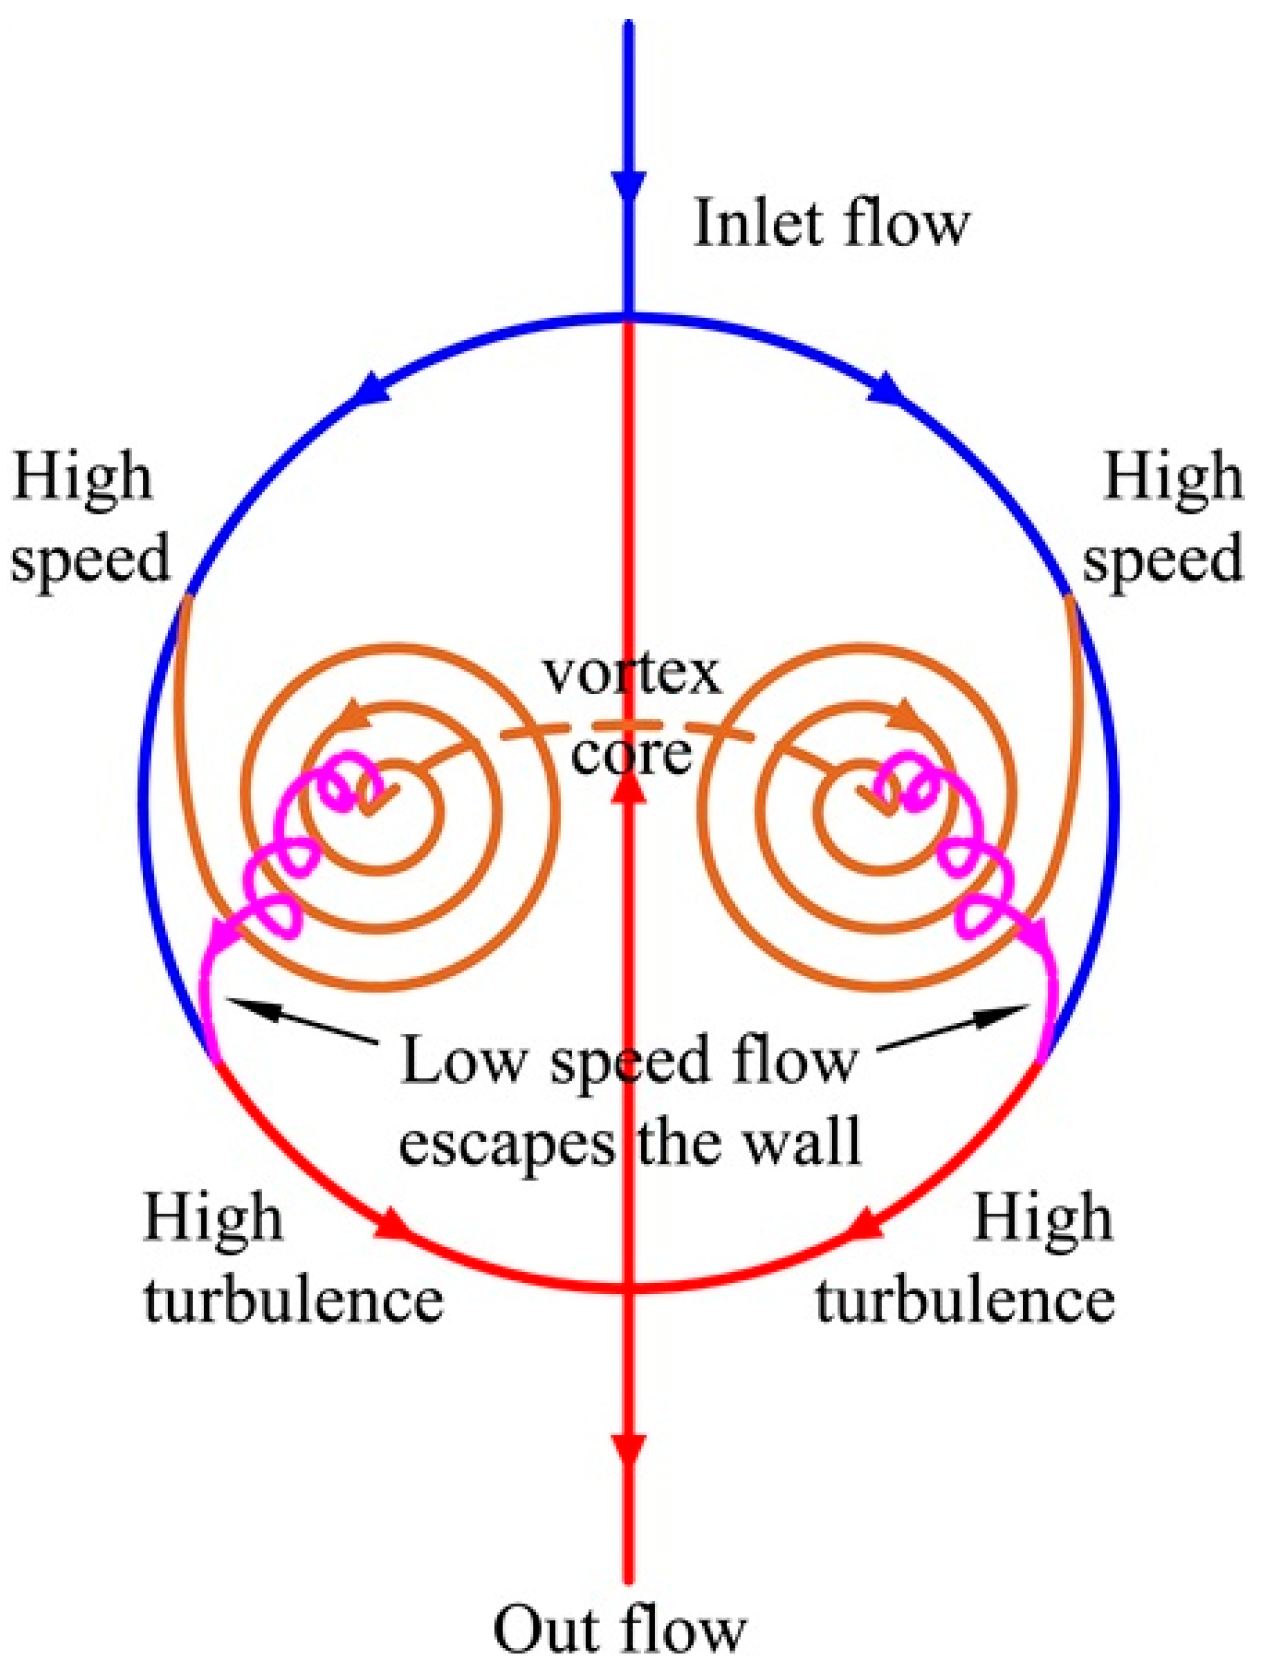
  • The vortices are formed in the flow passing the dimpled surface, and their shedding increases the turbulent kinetic energy of the downstream surface. Three kinds of flow regimes are observed within the dimple at the range of Re from 10 6 ~ 10 7 , including diffuser–confuser flow ( λ = 0.125 ), tornado-like vortex ( λ = 0.375 ,   0.5 ) and horseshoe vortex ( λ = 0.625 ,   0.875 ). The scale of the dimple with λ = 0.125 is large enough to make the vortex structure obvious, resulting in a significant increase in the loss of the wake. Turbulent energy density of the tornado is the highest. The three flow regimes have the same topological structure, and the influence of λ on them mainly lies in the locations of a pair of spiral points and a saddle point on the downstream rims, as well as the curvature of the rotation axis of the vortex.
  • For possible applications in the future, there may be some difficulties in the processing of the superior arc dimples, and 3D printing technology may have a significant contribution in solving this problem. The effect of dimples with λ = 0.625 in those working conditions that deviate from the Mach number of 0.7 or incidence angle of 6 ° also needs to be discussed in detail. In order to minimize the flow loss of the cascade, the height of the dimples array in the spanwise distribution needs to be further optimized.

Author Contributions

Conceptualization, H.L.; methodology, L.W. and H.L.; software, L.W.; validation, L.W., Y.Y. and Z.T.; formal analysis, L.W. and Z.T.; investigation, S.G.; resources, H.L.; data curation, L.W. and S.G.; writing—original draft preparation, L.W.; writing—review and editing, Y.Y. and H.W.; visualization, L.W. and Z.T.; supervision, X.K.; project administration, H.L.; funding acquisition, H.L and X.K. All authors have read and agreed to the published version of the manuscript.

Funding

This research was funded by the National Natural Science Foundation of China (No. 52176036, No. 52006021, No. 51676023), Fundamental Research Funds for the Central Universities (No. DUT19LK10), the China Postdoctoral Science Foundation (No. 2021M690498) and the Natural Science Foundation of Liaoning Province (No. 2020-BS-069).

Institutional Review Board Statement

Not applicable.

Informed Consent Statement

Not applicable.

Data Availability Statement

Not applicable.

Conflicts of Interest

The authors declare no conflict of interest. The funders had no role in the design of the study; in the collection, analyses or interpretation of data; in the writing of the manuscript; or in the decision to publish the results.

References

  1. Wennerstrom, A.J. Highly Loaded Axial Flow Compressors: History and Current Developments. J. Turbomach. 1990, 112, 567–578. [Google Scholar] [CrossRef]
  2. Taylor, J.V. Separated Flow Topology in Compressors. J. Turbomach. 2019, 141, 091014. [Google Scholar] [CrossRef] [Green Version]
  3. Liesner, K.; Meyer, R. Evaluation of Passive and Active Secondary Flow Control in a High Speed Compressor Cascade with Different Measurement Techniques. In New Results in Numerical and Experimental Fluid Mechanics VIII; Dillmann, A., Heller, G., Kreplin, H.-P., Nitsche, W., Peltzer, I., Eds.; Notes on Numerical Fluid Mechanics and Multidisciplinary Design; Springer: Berlin/Heidelberg, Germany, 2013; Volume 121, pp. 125–133. ISBN 978-3-642-35679-7. [Google Scholar]
  4. Liang, T.; Liu, B.; Spence, S. Effect of Boundary Layer Suction on the Corner Separation in a Highly Loaded Axial Compressor Cascade. J. Turbomach. 2021, 143, 061002. [Google Scholar] [CrossRef]
  5. Cao, Z.; Song, C.; Liu, B.; Gao, L. Influence of Endwall Slotted Injection on Performance and Flow Physics in a Compressor Cascade. Proc. Inst. Mech. Eng. Part A J. Power Energy 2020, 235, 319–334. [Google Scholar] [CrossRef]
  6. Lu, W.; Huang, G.; Yang, Y. Preliminary Study on Pulsed Jets with Three-Dimensional Effects for Flow Separation Control in a Compressor Blade. Aerosp. Sci. Technol. 2021, 117, 106966. [Google Scholar] [CrossRef]
  7. Zhang, H.; Chen, S. Pulsed Suction Control in a Highly Loaded Compressor Cascade With Low Suction Flowrates. J. Turbomach. 2021, 143, 061006. [Google Scholar] [CrossRef]
  8. Barzegar Gerdroodbary, M.; Amini, Y.; Ganji, D.D.; Takam, M.R. The Flow Feature of Transverse Hydrogen Jet in Presence of Micro Air Jets in Supersonic Flow. Adv. Space Res. 2017, 59, 1330–1340. [Google Scholar] [CrossRef]
  9. Amini, Y.; Mokhtari, M.; Haghshenasfard, M.; Barzegar Gerdroodbary, M. Heat Transfer of Swirling Impinging Jets Ejected from Nozzles with Twisted Tapes Utilizing CFD Technique. Case Stud. Therm. Eng. 2015, 6, 104–115. [Google Scholar] [CrossRef] [Green Version]
  10. Chung, K.-M.; Su, K.-C.; Chang, K.-C. The Effect of Vortex Generators on Shock-Induced Boundary Layer Separation in a Transonic Convex-Corner Flow. Aerospace 2021, 8, 157. [Google Scholar] [CrossRef]
  11. Jeong, H.; Song, S.J. Surface Roughness Impact on Boundary Layer Transition and Loss Mechanisms over a Flat-Plate under a Low-Pressure Turbine Pressure Gradient. J. Turbomach. 2021, 144, 011005. [Google Scholar] [CrossRef]
  12. Bliamis, C.; Vlahostergios, Z.; Misirlis, D.; Yakinthos, K. Numerical Evaluation of Riblet Drag Reduction on a MALE UAV. Aerospace 2022, 9, 218. [Google Scholar] [CrossRef]
  13. Barzegar Gerdroodbary, M.; Ganji, D.D.; Amini, Y. Numerical Study of Shock Wave Interaction on Transverse Jets through Multiport Injector Arrays in Supersonic Crossflow. Acta Astronaut. 2015, 115, 422–433. [Google Scholar] [CrossRef]
  14. Li, X.; Dong, J.; Chen, H.; Lu, H. The Control of Corner Separation with Parametric Suction Side Corner Profiling on a High-Load Compressor Cascade. Aerospace 2022, 9, 172. [Google Scholar] [CrossRef]
  15. Chen, Y.; Yang, L.; Zhong, J. Numerical Study on Endwall Fence with Varying Geometrical Parameters in a Highly-Loaded Compressor Cascade. Aerosp. Sci. Technol. 2019, 94, 105390. [Google Scholar] [CrossRef]
  16. Achenbach, E. The Effects of Surface Roughness and Tunnel Blockage on the Flow Past Spheres. J. Fluid Mech. 1974, 65, 113–125. [Google Scholar] [CrossRef]
  17. Ananthan, V.B.; Akkermans, R.A.D.; Hu, T.; Liu, P.Q.; Rathje, N. Trailing-Edge Noise Reduction Potential of a Locally Applied Shallow Dimpled Surface. J. Sound Vib. 2022, 525, 116745. [Google Scholar] [CrossRef]
  18. Li, M.; Wu, J.H.; Yuan, X.Y. Wall Suction & Slip Effect of Spherical-Grooved Bionic Metasurface for Controlling the Aerodynamic Noise. Appl. Acoust. 2021, 171, 107537. [Google Scholar] [CrossRef]
  19. Lin, Y.-L.; Shih, T.I.-P.; Chyu, M.K. Computations of Flow and Heat Transfer in a Channel with Rows of Hemispherical Cavities. In Proceedings of the Volume 3: Heat Transfer, Electric Power, Industrial and Cogeneration, Indianapolis, IN, USA, 7 June 1999; American Society of Mechanical Engineers: New York, NY, USA, 1999; p. V003T01A081. [Google Scholar]
  20. Ligrani, P.M.; Harrison, J.L.; Mahmmod, G.I.; Hill, M.L. Flow Structure Due to Dimple Depressions on a Channel Surface. Phys. Fluids 2001, 13, 3442–3451. [Google Scholar] [CrossRef]
  21. Leontiev, A.I.; Kiselev, N.A.; Burtsev, S.A.; Strongin, M.M.; Vinogradov, Y.A. Experimental Investigation of Heat Transfer and Drag on Surfaces with Spherical Dimples. Exp. Therm. Fluid Sci. 2016, 79, 74–84. [Google Scholar] [CrossRef]
  22. Amsha, K.A.; Craft, T.J.; Iacovides, H. Computational Modelling of the Flow and Heat Transfer in Dimpled Channels. Aeronaut. J. 2017, 121, 1066–1086. [Google Scholar] [CrossRef] [Green Version]
  23. Isaev, S.A.; Schelchkov, A.V.; Leontiev, A.I.; Baranov, P.A.; Gulcova, M.E. Numerical Simulation of the Turbulent Air Flow in the Narrow Channel with a Heated Wall and a Spherical Dimple Placed on It for Vortex Heat Transfer Enhancement Depending on the Dimple Depth. Int. J. Heat Mass Transf. 2016, 94, 426–448. [Google Scholar] [CrossRef]
  24. Isaev, S.A.; Leont’ev, A.I.; Baranov, P.A.; Metov, K.T.; Usachov, A.E. Numerical Analysis of the Effect of Viscosity on the Vortex Dynamics in Laminar Separated Flow Past a Dimple on a Plane with Allowance for Its Asymmetry. J. Eng. Phys. Thermophys. 2001, 74, 339–346. [Google Scholar] [CrossRef]
  25. Chyu, M.K.; Yu, Y.; Ding, H.; Downs, J.P.; Soechting, F.O. Concavity Enhanced Heat Transfer in an Internal Cooling Passage; American Society of Mechanical Engineers Digital Collection: Orlando, FL, USA, 24 December 2014. [Google Scholar]
  26. Lake, J.; King, P.; Rivir, R. Low Reynolds Number Loss Reduction on Turbine Blades with Dimples and V-Grooves. In Proceedings of the 38th Aerospace Sciences Meeting and Exhibit, Reno, NV, USA, 10 January 2000; American Institute of Aeronautics and Astronautics: Reston, NV, USA, 2000. [Google Scholar]
  27. Zhang, X.F.; Vera, M.; Hodson, H.; Harvey, N. Separation and Transition Control on an Aft-Loaded Ultra-High-Lift LP Turbine Blade at Low Reynolds Numbers: Low-Speed Investigation. J. Turbomach. 2006, 128, 517–527. [Google Scholar] [CrossRef]
  28. Sobhani, E.; Ghaffari, M.; Maghrebi, M.J. Numerical Investigation of Dimple Effects on Darrieus Vertical Axis Wind Turbine. Energy 2017, 133, 231–241. [Google Scholar] [CrossRef]
  29. Yoo, S.; Oh, S. Flow Analysis and Optimization of a Vertical Axis Wind Turbine Blade with a Dimple. Eng. Appl Comp. Fluid 2021, 15, 1666–1681. [Google Scholar] [CrossRef]
  30. Sedighi, H.; Akbarzadeh, P.; Salavatipour, A. Aerodynamic Performance Enhancement of Horizontal Axis Wind Turbines by Dimples on Blades: Numerical Investigation. Energy 2020, 195, 117056. [Google Scholar] [CrossRef]
  31. D’Alessandro, V.; Clementi, G.; Giammichele, L.; Ricci, R. Assessment of the Dimples as Passive Boundary Layer Control Technique for Laminar Airfoils Operating at Wind Turbine Blades Root Region Typical Reynolds Numbers. Energy 2019, 170, 102–111. [Google Scholar] [CrossRef]
  32. Lu, H.; Yang, Y.; Guo, S.; Pang, W.; Yang, F.; Zhong, J. Control of Corner Separation via Dimpled Surface for a Highly Loaded Compressor Cascade under Different Inlet Mach Number. Aerosp. Sci. Technol. 2019, 85, 48–60. [Google Scholar] [CrossRef]
  33. Kim, K.-Y.; Shin, D.-Y. Optimization of a Staggered Dimpled Surface in a Cooling Channel Using Kriging Model. Int. J. Sci 2008, 47, 1464–1472. [Google Scholar] [CrossRef]
  34. Lu, H.; Yang, Y.; Guo, S.; Huang, Y.; Wang, H.; Zhong, J. The Effect of Dimpled Surface on Loss Reduction and Vortices in a Highly Loaded Compressor Cascade. Proc. Inst. Mech. Eng. Part G J. Aerosp. Eng. 2018, 232, 374–387. [Google Scholar] [CrossRef]
  35. Menter, F.R. Two-Equation Eddy-Viscosity Turbulence Models for Engineering Applications. AIAA J. 1994, 32, 1598–1605. [Google Scholar] [CrossRef] [Green Version]
  36. Menter, F.R.; Langtry, R.B.; Likki, S.R.; Suzen, Y.B.; Huang, P.G.; Völker, S. A Correlation-Based Transition Model Using Local Variables—Part I: Model Formulation. J. Turbomach. 2006, 128, 413–422. [Google Scholar] [CrossRef]
  37. Mahmood, G.I.; Hill, M.L.; Nelson, D.L.; Ligrani, P.M.; Moon, H.-K.; Glezer, B. Local Heat Transfer and Flow Structure on and Above a Dimpled Surface in a Channel. J. Turbomach. 2000, 123, 115–123. [Google Scholar] [CrossRef]
  38. Kovalenko, G.V.; Terekhov, V.I.; Khalatov, A.A. Flow Regimes in a Single Dimple on the Channel Surface. J. Appl. Mech. Tech. Phys. 2010, 51, 839–848. [Google Scholar] [CrossRef]
  39. Zhou, W.; Rao, Y.; Hu, H. An Experimental Investigation on the Characteristics of Turbulent Boundary Layer Flows Over a Dimpled Surface. J. Fluids Eng. 2016, 138, 021204. [Google Scholar] [CrossRef]
  40. Tay, C.M.; Chew, Y.T.; Khoo, B.C.; Zhao, J.B. Development of Flow Structures over Dimples. Exp. Therm. Fluid Sci 2014, 52, 278–287. [Google Scholar] [CrossRef]
Figure 1. Schematic of cascade.
Aerospace 09 00422 g001
Figure 2. Schematic of dimples. (a) Inferior arc (INF); (b) semicircular arc (SEM); (c) superior arc (SUP).
Aerospace 09 00422 g002
Figure 3. Computational domain and mesh distribution.
Aerospace 09 00422 g003
Figure 4. C-shaped topology in the vicinity of dimples. (a) Inferior arc (INF); (b) semicircle arc (SEM); (c) superior arc (SUP).
Aerospace 09 00422 g004
Figure 5. High-speed linear cascade wind tunnel.
Aerospace 09 00422 g005
Figure 6. Measurement error of five-hole probe. (a) Yaw angle; (b) total pressure.
Aerospace 09 00422 g006
Figure 7. Variation of inlet normalized total pressure along height.
Aerospace 09 00422 g007
Figure 8. Pitch weighted average of performance parameters along the spanwise direction (DIM represents the case of λ = 0.375 ). (a) Total pressure loss coefficient; (b) deviation angle.
Aerospace 09 00422 g008
Figure 9. Limiting streamline on the suction surface of numerical and experimental results (DIM represents the case of λ = 0.375 ). (a) CFD-ORI; (b) EXP-ORI; (c) CFD-DIM; (d) EXP-DIM.
Aerospace 09 00422 g009
Figure 10. Performance parameters of cascade. (a) Total pressure loss coefficient; (b) deviation angle.
Aerospace 09 00422 g010
Figure 11. The total pressure loss coefficient of the outlet. (a) The loss along spanwise direction; (b) the loss in the wake; (c) the loss in the corner.
Aerospace 09 00422 g011
Figure 12. Three-dimensional flow near the suction surface and the end wall. (a) ORI; (b) λ = 0.125 ; (c) λ = 0.375 ; (d) λ = 0.5 ; (e) λ = 0.625 ; (f) λ = 0.875 .
Aerospace 09 00422 g012aAerospace 09 00422 g012b
Figure 13. Limiting streamline of suction surface. (a) ORI; (b) λ = 0.125 ; (c) λ = 0.375 ; (d) λ = 0.5 ; (e) λ = 0.625 ; (f) λ = 0.875 .
Aerospace 09 00422 g013aAerospace 09 00422 g013b
Figure 14. Vertical lines of suction surface at middle of blade.
Aerospace 09 00422 g014
Figure 15. Change in the boundary layer along the axial direction. (a) 20 % b x ; (b) 30 % b x ; (c) 60 % b x ; (d) 90 % b x .
Aerospace 09 00422 g015
Figure 16. Development of the momentum thickness of boundary layer.
Aerospace 09 00422 g016
Figure 17. Normalized turbulent kinetic energy (TKE) distribution on suction surface and flow inside the dimple. (a) Normalized TKE and axial vorticity on suction surface; (b) λ = 0.125 ; (c) λ = 0.375 ; (d) λ = 0.5 ; (e) λ = 0.625 ; (f) λ = 0.875 .
Aerospace 09 00422 g017aAerospace 09 00422 g017b
Figure 18. Flow diagram inside the dimple.
Aerospace 09 00422 g018
Table 1. Values of key parameters of NACA0065-K48 [32].
ParametersValue
Chord   b (mm)60
Axial   chord   b x (mm)55
Pitch   t (mm)33
Span   H (mm)100
Geometric   inflow   angle   β k , i n (°)42
Geometric   outflow   angle   β k , o u t (°)90
Outflow   angle   β o u t (°)-
Inlet   Mach   number   M a i n 0.7
Table 2. Geometric parameters of dimples.
Style λ h (mm) D (mm) d (mm) R (mm)
INF0.1250.21.6001.5001.700
0.3750.20.5320.0770.277
SEM0.5000.20.4000.0000.200
SUP0.6250.20.3200.0360.164
0.8750.20.2270.0670.133
Table 3. Grid independency study.
TypeNodesNumber
( × 10 4 )
ω ¯ o u t π ¯ o u t y +
ResultError (%)ResultError (%)ResultError (%)
ORI80720.06290.641.19120.130.6312-
1001280.06190.961.18820.120.4681-
1501740.06230.321.18850.090.34710.80
2002240.06270.321.19030.060.35270.80
DIM4444.80.0683-1.1545-2.8497-
6721.90.04010.001.20900.022.07920.01
8817.40.04010.001.20920.002.08130.11
10930.50.04020.251.20950.022.07660.12
Table 4. Flow regime corresponding the parameter of dimple.
λ h/2RRe2RFlow Regime
0.1250.0652,800,000diffuser-confuser
0.3750.368,600,000tornado-like vortex
0.5000.506,210,000tornado-like vortex
0.6250.615,100,000horseshoe vortex
0.8750.754,130,000horseshoe vortex
Publisher’s Note: MDPI stays neutral with regard to jurisdictional claims in published maps and institutional affiliations.

