1. Introduction
Hypersonic cruisers are currently considered the long-term future of long-range civil aviation. The expected high-level performance is challenging engineers and scientists from around the world in different technological and operational areas. Despite the wide range of solutions that are emerging for these challenges, it is widely agreed that there is an urgent need to improve the conceptual design stage, defining innovative and agile design methodologies able to capture all the most impacting design, performance, and operational characteristics since the beginning of the process and implementing multi-fidelity modeling strategies. The development of such an integrated methodology is one of the outcomes of the STRATOFLY Project, a Horizon 2020 Project funded by the European Commission in 2018, aimed at assessing the potential of this type of high-speed civil transport to reach TRL6 by 2035, with respect to key technological, societal, and economical aspects such as thermal and structural integrity, low-emissions combined propulsion cycles, subsystems design and integration including smart energy management, environmental aspects impacting climate change, noise emissions, and social acceptance and economic viability accounting for safety and human factors [
1,
2,
3].
Among the technological challenges, thermal and energy management is one of the most critical for hypersonic vehicles. Thermal management is an example of significant interaction between onboard systems in subsonic aircraft, as it makes various systems (typically engine, fuel, electrical, hydraulic, and environmental control systems) operate together to reject waste heat. In subsonic aircraft, heat exchangers spread across a range of systems use the aircraft fuel and ambient ram-air as heat sinks into which waste heat may be dumped [
4]. The higher the performance of the aircraft, the more critical the issue of cooling down the system, rather than heating it up, and this happens because of the more complex avionics integrated onboard and because of the higher speed regime flown by the aircraft. The issue of thermal management becomes, therefore, more severe when the system is a high-speed aircraft, either supersonic or hypersonic. During high-speed flight, the aircraft is exposed to extremely high temperatures and heat fluxes as result of two phenomena: air stagnation and skin friction. At altitudes below 100 km, where the ambient pressure and density are significant, stagnation and viscous temperature effects are exacerbated. As a result, some of the most challenging thermal problems in aerospace vehicle design are encountered at the leading edges of hypersonic air-breathing vehicles.
Hypersonic vehicles are unique examples of highly integrated systems. To optimize hypersonic vehicles, not only aerothermodynamics, propulsion, and structure but also onboard systems have to be designed as closely interrelated. A crucial multidisciplinary integrated onboard system in hypersonic vehicles is the thermal and energy management system. Because of the high-speed flight and high-intensity combustion, hypersonic vehicles can provide enough high-quality heat source for power generation such as the aerodynamic heat and the combustion heat dissipation through engine walls [
5]. Therefore, power-generation technology based on heat-to-electricity conversion through a closed thermodynamic cycle is appropriate for hypersonic vehicles. The cold source of the closed thermodynamic cycle cannot be ram-air in hypersonic flights. The fuel stored on board may act as cold source instead.
Many studies exist regarding hypersonic vehicles propelled by kerosene [
6,
7,
8], methane [
5], and liquid hydrogen [
9,
10,
11,
12,
13]. Kerosene has lower gravimetric energy density than liquid hydrogen (40 MJ/kg for kerosene vs. 120 MJ/kg for liquid hydrogen) [
14], which allows burning less mass of liquid hydrogen than kerosene to cover the same range while carrying the same number of passengers, thus keeping the take-off mass of the aircraft down. However, liquid hydrogen has a lower volumetric energy density than kerosene (10 MJ/L for liquid hydrogen vs. 35 MJ/L for kerosene) [
14], which leads to bigger tanks to store liquid hydrogen on board and poses quite significant issues of integration to avoid the increase in drag of the vehicle’s configuration. Generally, it can be stated that the properties of liquid methane lie in between kerosene and liquid hydrogen (50 MJ/kg and 25 MJ/L). On top of the technical properties of the different fuels, it is worth remembering that the environmental compatibility requirements will drive the design of future civil passenger aircrafts in all flight speed regimes. Keeping these constraints into account, especially in terms of pollutants and greenhouse gases emissions, both kerosene and liquid methane cannot meet the carbon neutral requirement and, for this reason, cannot pursue the Green Deal. Conversely, liquid hydrogen guarantees zero carbon dioxide emissions and lower nitrogen oxides emissions with respect to traditional fuel [
15]. However, the advantage of liquid hydrogen from an environmental sustainability perspective shows drawbacks that cannot be neglected: a tremendous increase, with respect to traditional fuel [
15], in water vapor emissions, which is not a pollutant but a greenhouse gas able to change the atmospheric composition and has a significant impact on climate [
16,
17,
18,
19,
20,
21,
22,
23]. Liquid hydrogen and sustainable aviation fuels (SAFs) seem to be the best alternatives to traditional fuels to propel high-speed aircraft, taking into account both technical performance and environmental compatibility requirements.
Future high-speed aircraft should, therefore, boost systems integration to enhance flexibility and safety, as shown by the thermal and energy management system (TEMS) on board the STRATOFLY MR3 vehicle, which includes the propulsive, fuel, thermal control, thermal protection, and electrical and environmental control systems [
24].
Among the systems integrated into the TEM, the environmental control system (ECS) is surely the most power-demanding load for the pneumatic power on the aircraft, often requiring the highest secondary power load onboard (either pneumatic, in traditional architectures, or electrical, in bleed-less configurations). It is worth remembering that the ECS is a continuous request of pneumatic power throughout the flight [
25].
The main functions of the ECS can be summarized as follows: (i) to maintain proper pressure levels within the cabin and systems compartments during all mission phases; (ii) to maintain proper temperature levels within the cabin and systems compartments during all mission phases; (iii) to maintain proper humidity levels and air chemical composition within the cabin (and system compartments where applicable) during all mission phases.
For high-speed aircraft, the requirements of the ECS are exacerbated by supersonic and hypersonic flight conditions, where advantage cannot be taken of the aircraft’s skin or ram-air as heat sinks. The ECS of aircraft flying through the atmosphere at high-speed regimes must therefore comply with additional requirements, which lead to the following peculiar characteristics: (i) both ECS and dedicated thermal control systems (TCS) for thermal control may be used; (ii) depending on the flight speed, a thermal protection system (TPS) may be required as well; (iii) fuel and specifically cryogenic fuels may act both as coolant means and as heat rejection means; (iv) the complete set of thermal heat loads transfers is present (i.e., conduction, convection, and radiation); (v) hot and cold cases are quite different with respect to subsonic aircraft, where the cold case is generally represented by cruise condition at night and the hot case is represented by on ground conditions during a hot day.
Future high-speed aircraft need therefore to face new challenges to satisfy both performance and environmental requirements. Future aircraft, either subsonic, supersonic, or hypersonic, will be more digital, electrified, and integrated than their predecessors. High integration of different technologies to reach a highly multidisciplinary system will be pushed to the extremes for high-speed aircraft.
The paper focuses on the design and performance assessment of an innovative ECS for future hypersonic aircraft propelled by liquid hydrogen. The ECS was integrated within TEMS, the multidisciplinary system on board the vehicle that manages the heat loads and the generation of electric power through the exploitation of cryogenic liquid hydrogen [
24]. The new technical solution was thoroughly investigated through detailed modeling and comprehensive analysis of the results. Comparisons with the architecture and performance of the A380, a state-of-the-art competitor of a hypersonic civil passenger aircraft, are shown. Finally, the main conclusions are drawn.
3. Environmental Control System Design: Architecture and Mathematical Modeling
Among the systems integrated into the TEM, the environmental control system is the most power-demanding load for the pneumatic power on the aircraft, often requiring the highest secondary power load onboard throughout the flight.
3.1. ECS Architecture
Traditionally, engine bleed-air strategy has been used to obtain high-pressure, high-temperature air from engine compressor stages to feed the ECS. Concorde adopted this approach, bleeding the air off the last stage of the high-pressure compressor of the engines. Tapping bleed-air off the engine compressor is extremely wasteful, especially as engine pressure ratios and bypass ratios increase in modern engines. Evidently, engine compressor bleed-air configuration is fuel inefficient in supersonic speed regimes and energy-efficient engines [
25].
No-bleed systems architecture allows the airplane’s engines to produce thrust more efficiently, as all the high-speed air produced by the engines goes to thrust. For this reason, recent architectures aim at overcoming the need for the engine bleed, pursuing the so-called bleed-less configuration. This is the typical architecture of more-electric aircraft (MEA) concepts, where the high-pressure, high-temperature air is provided by ram-air compressed by dedicated compressors driven by electrical motor, thus completely separated from the propulsive plant. The design of supersonic ram-air inlets for the electrical motor-driven compressors would require careful attention, but shock inlets could provide the required subsonic airflow without too much loo in ram recovery.
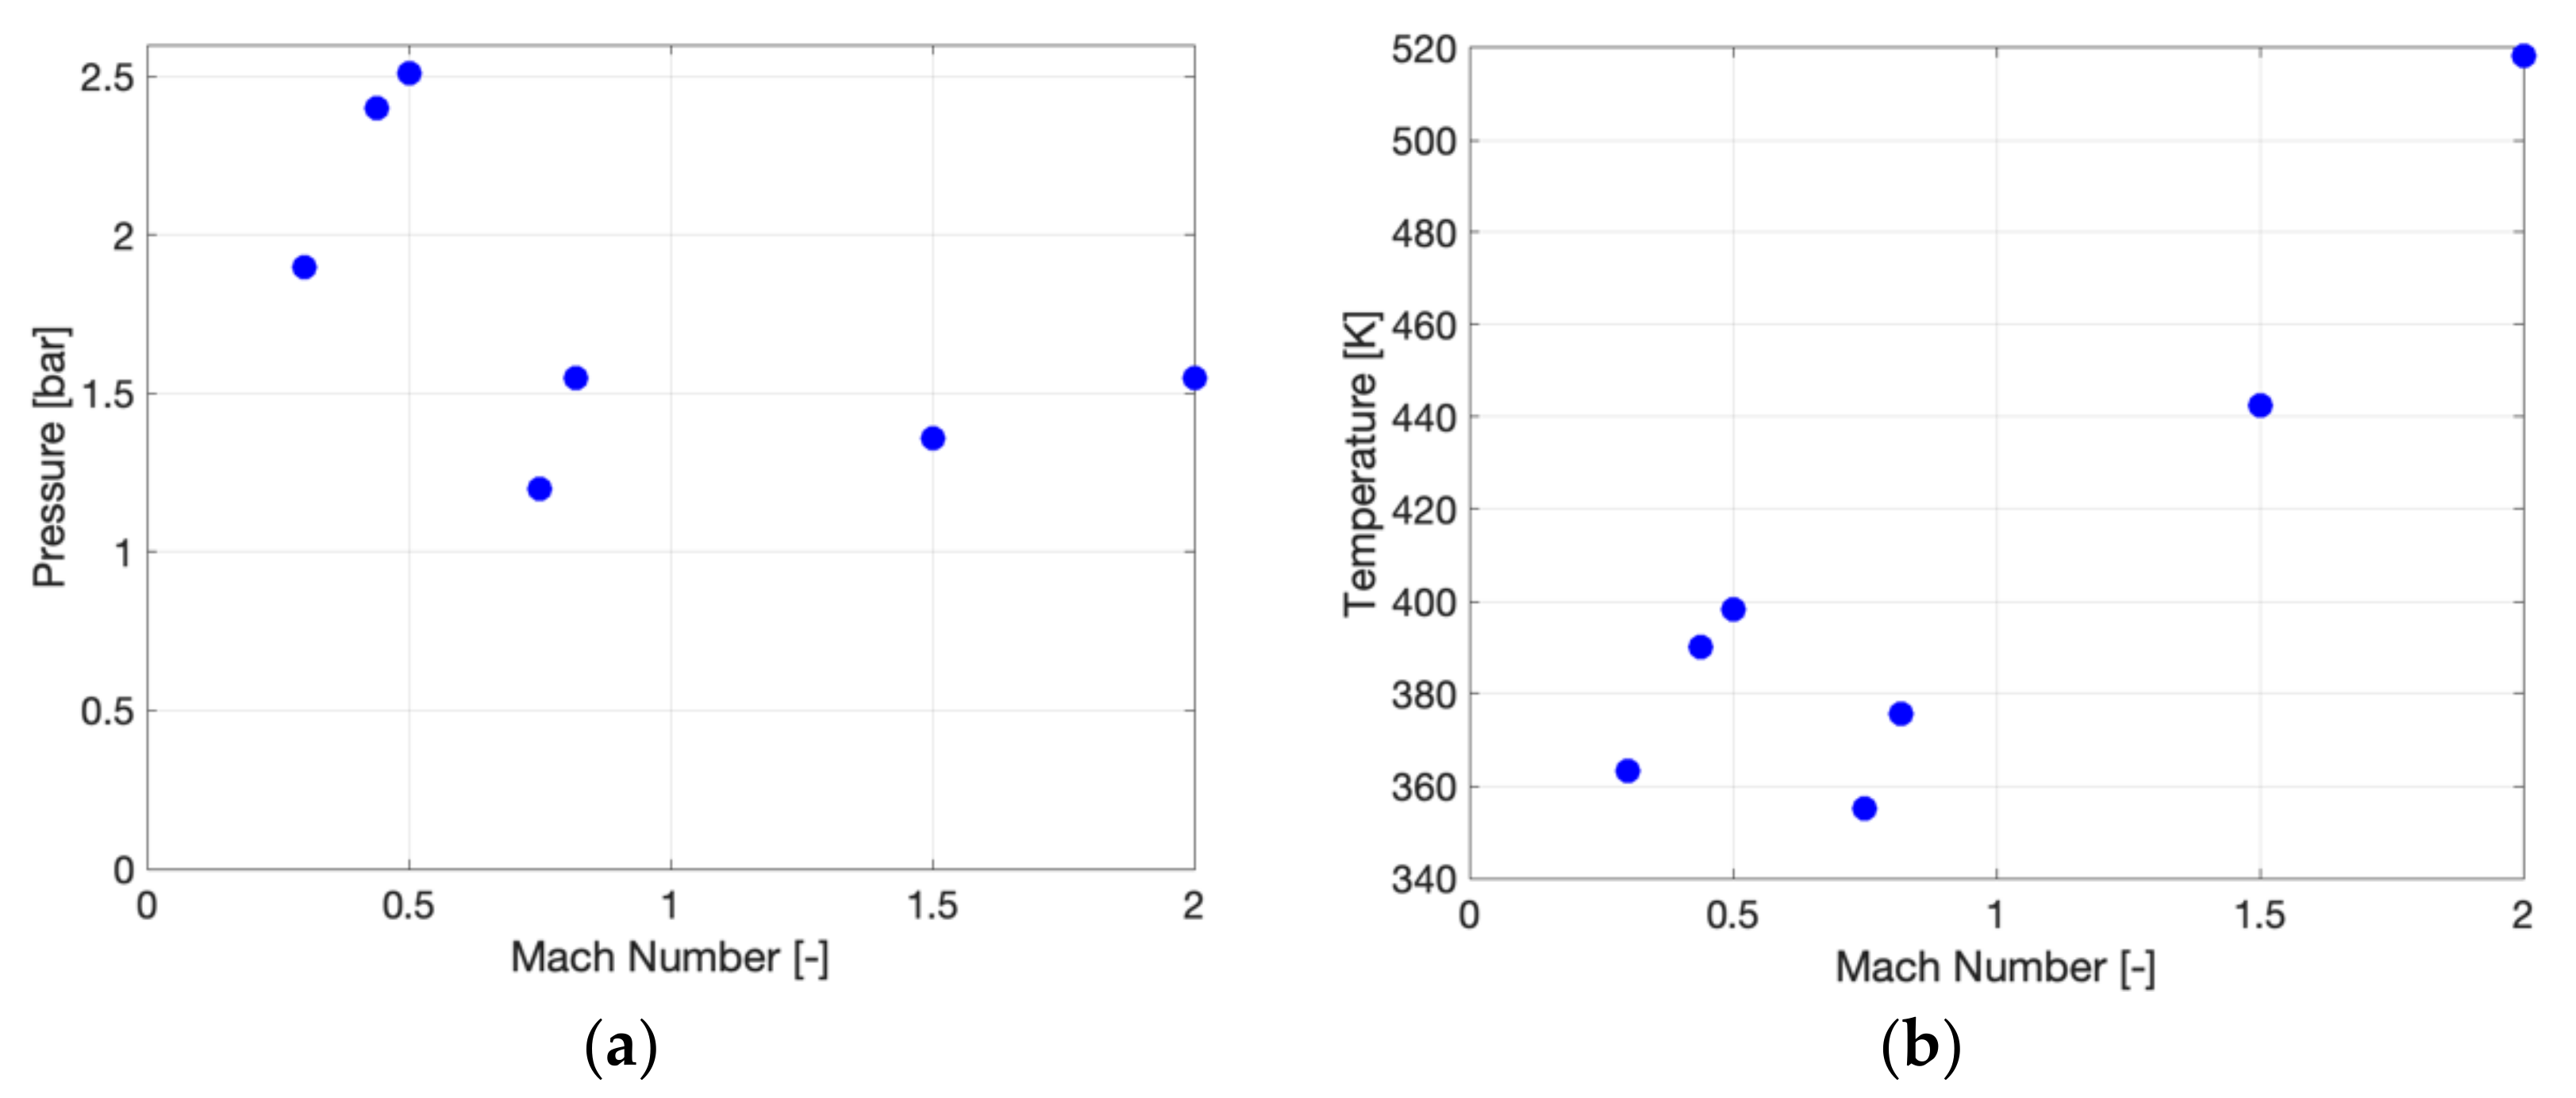
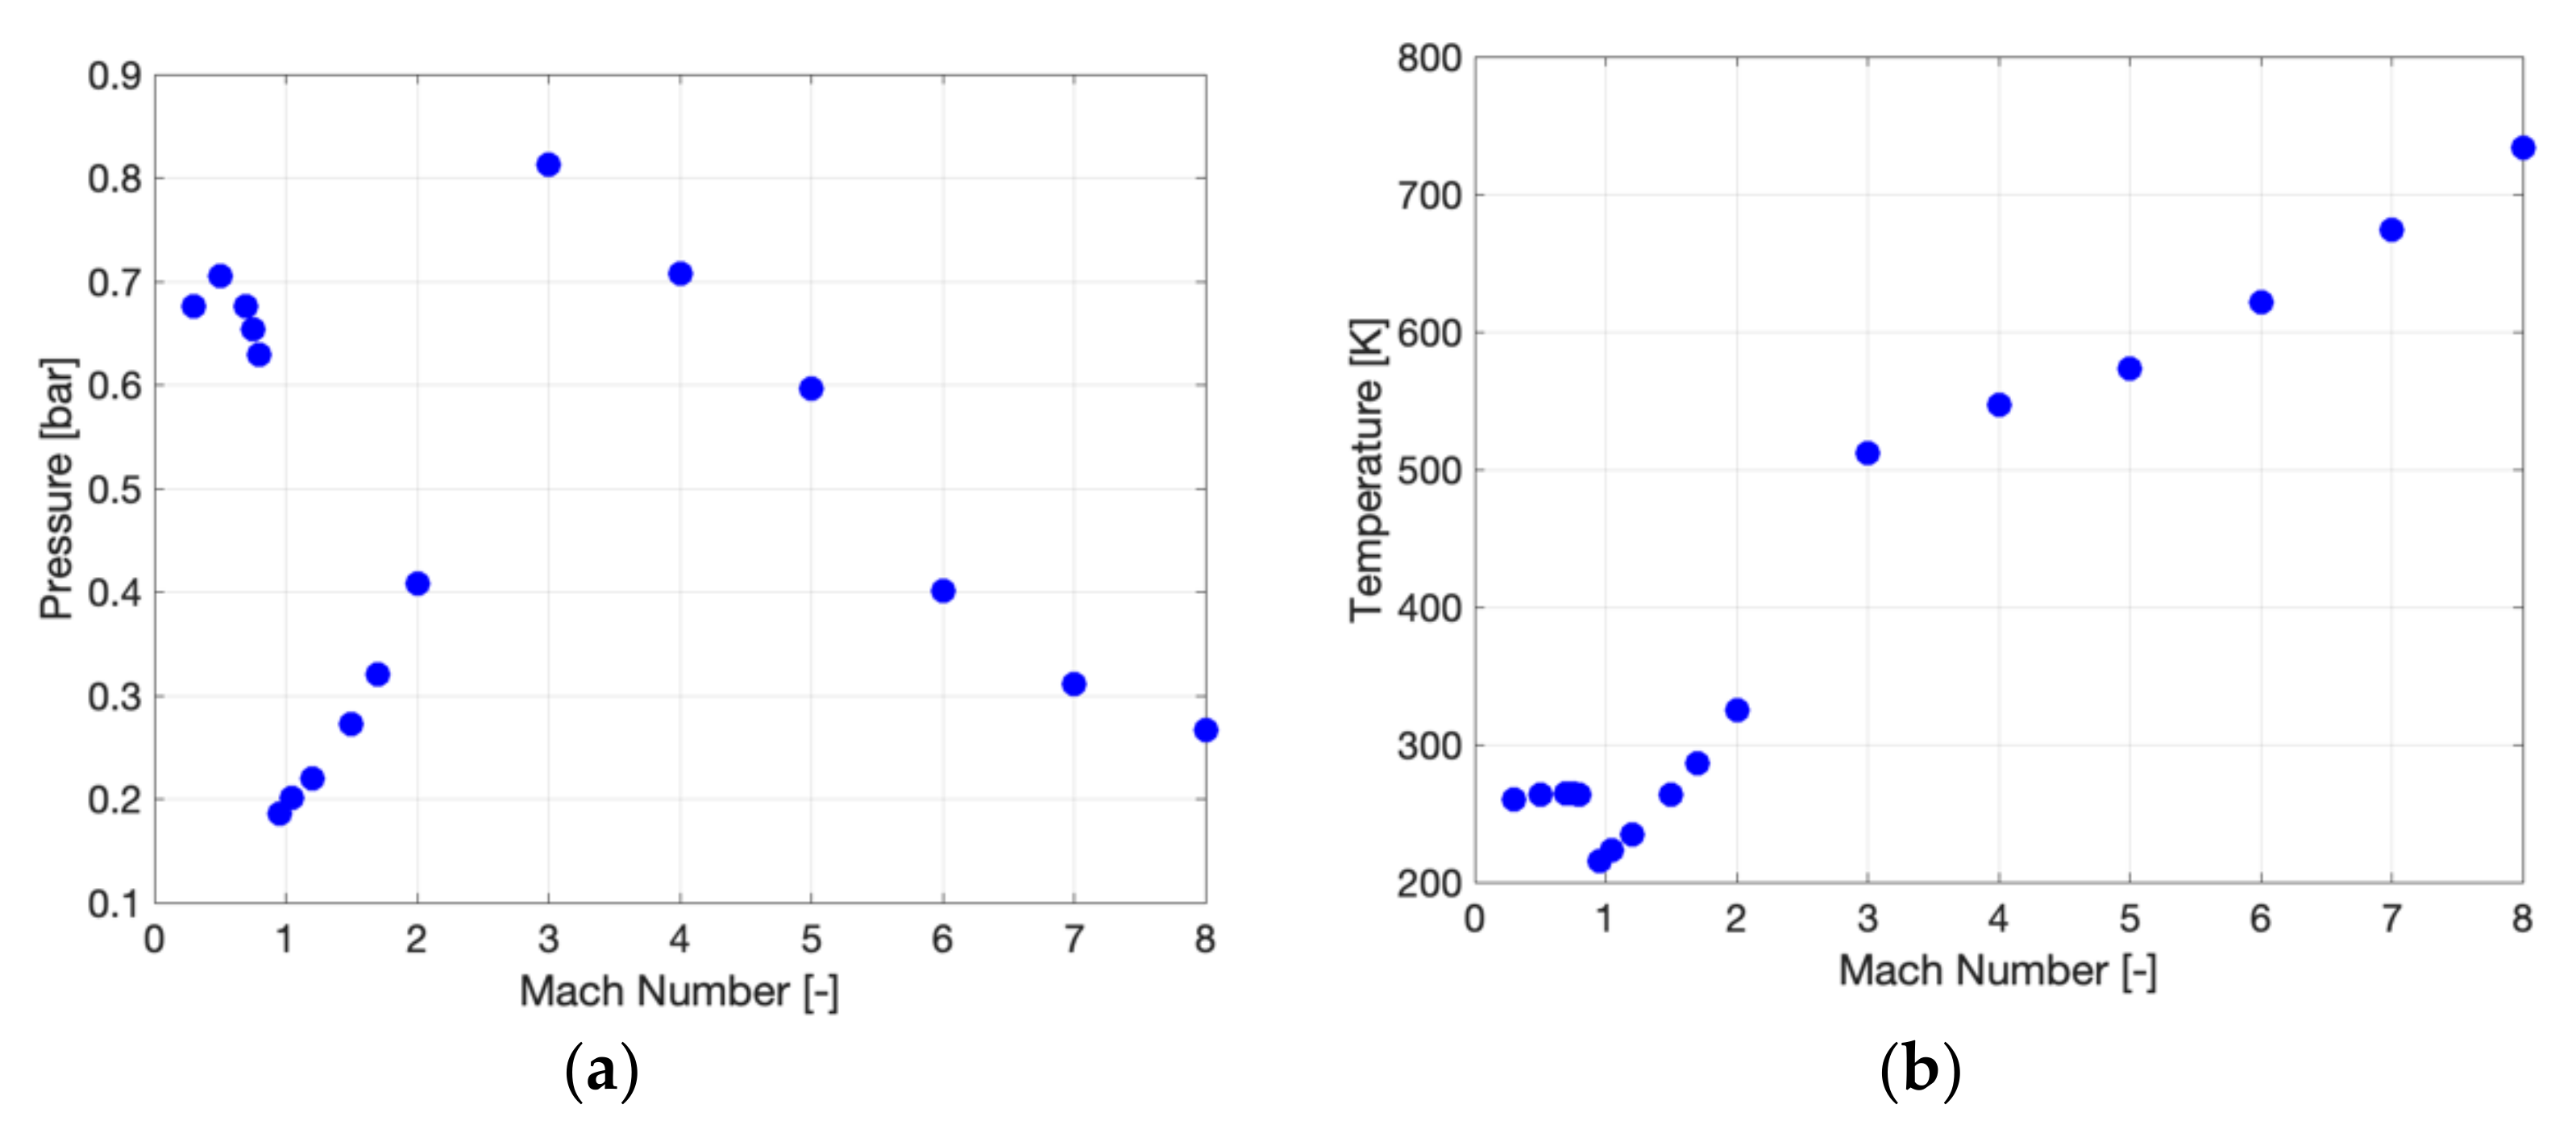
Comparisons between the pressure and temperature values of the bleed-air extracted by the ATR engine and the ram-air extracted by the engine inlet duct are shown in
Figure 4 and
Figure 5. These values have been extracted from CFD analyses by the experts of the propulsion system as part of the research activity carried out in the framework of the H2020 STRATOFLY Project.
Figure 4a,b depict the conditions of the traditional bleed configuration, whereas
Figure 5a,b depict the conditions of the innovative bleed-less configuration. Both the pressure and temperature values of the bleed-less configuration are lower with respect to those of the bleed configuration as expected. The STRATOFLY MR3 adopts a bleed-less architecture with a dedicated compressor to increase the pressure and temperature of the ram-air extracted by the engine inlet duct up to the required values. Detailed analyses should be performed to estimate the impact of ram-air extraction on the propulsive system’s performance.
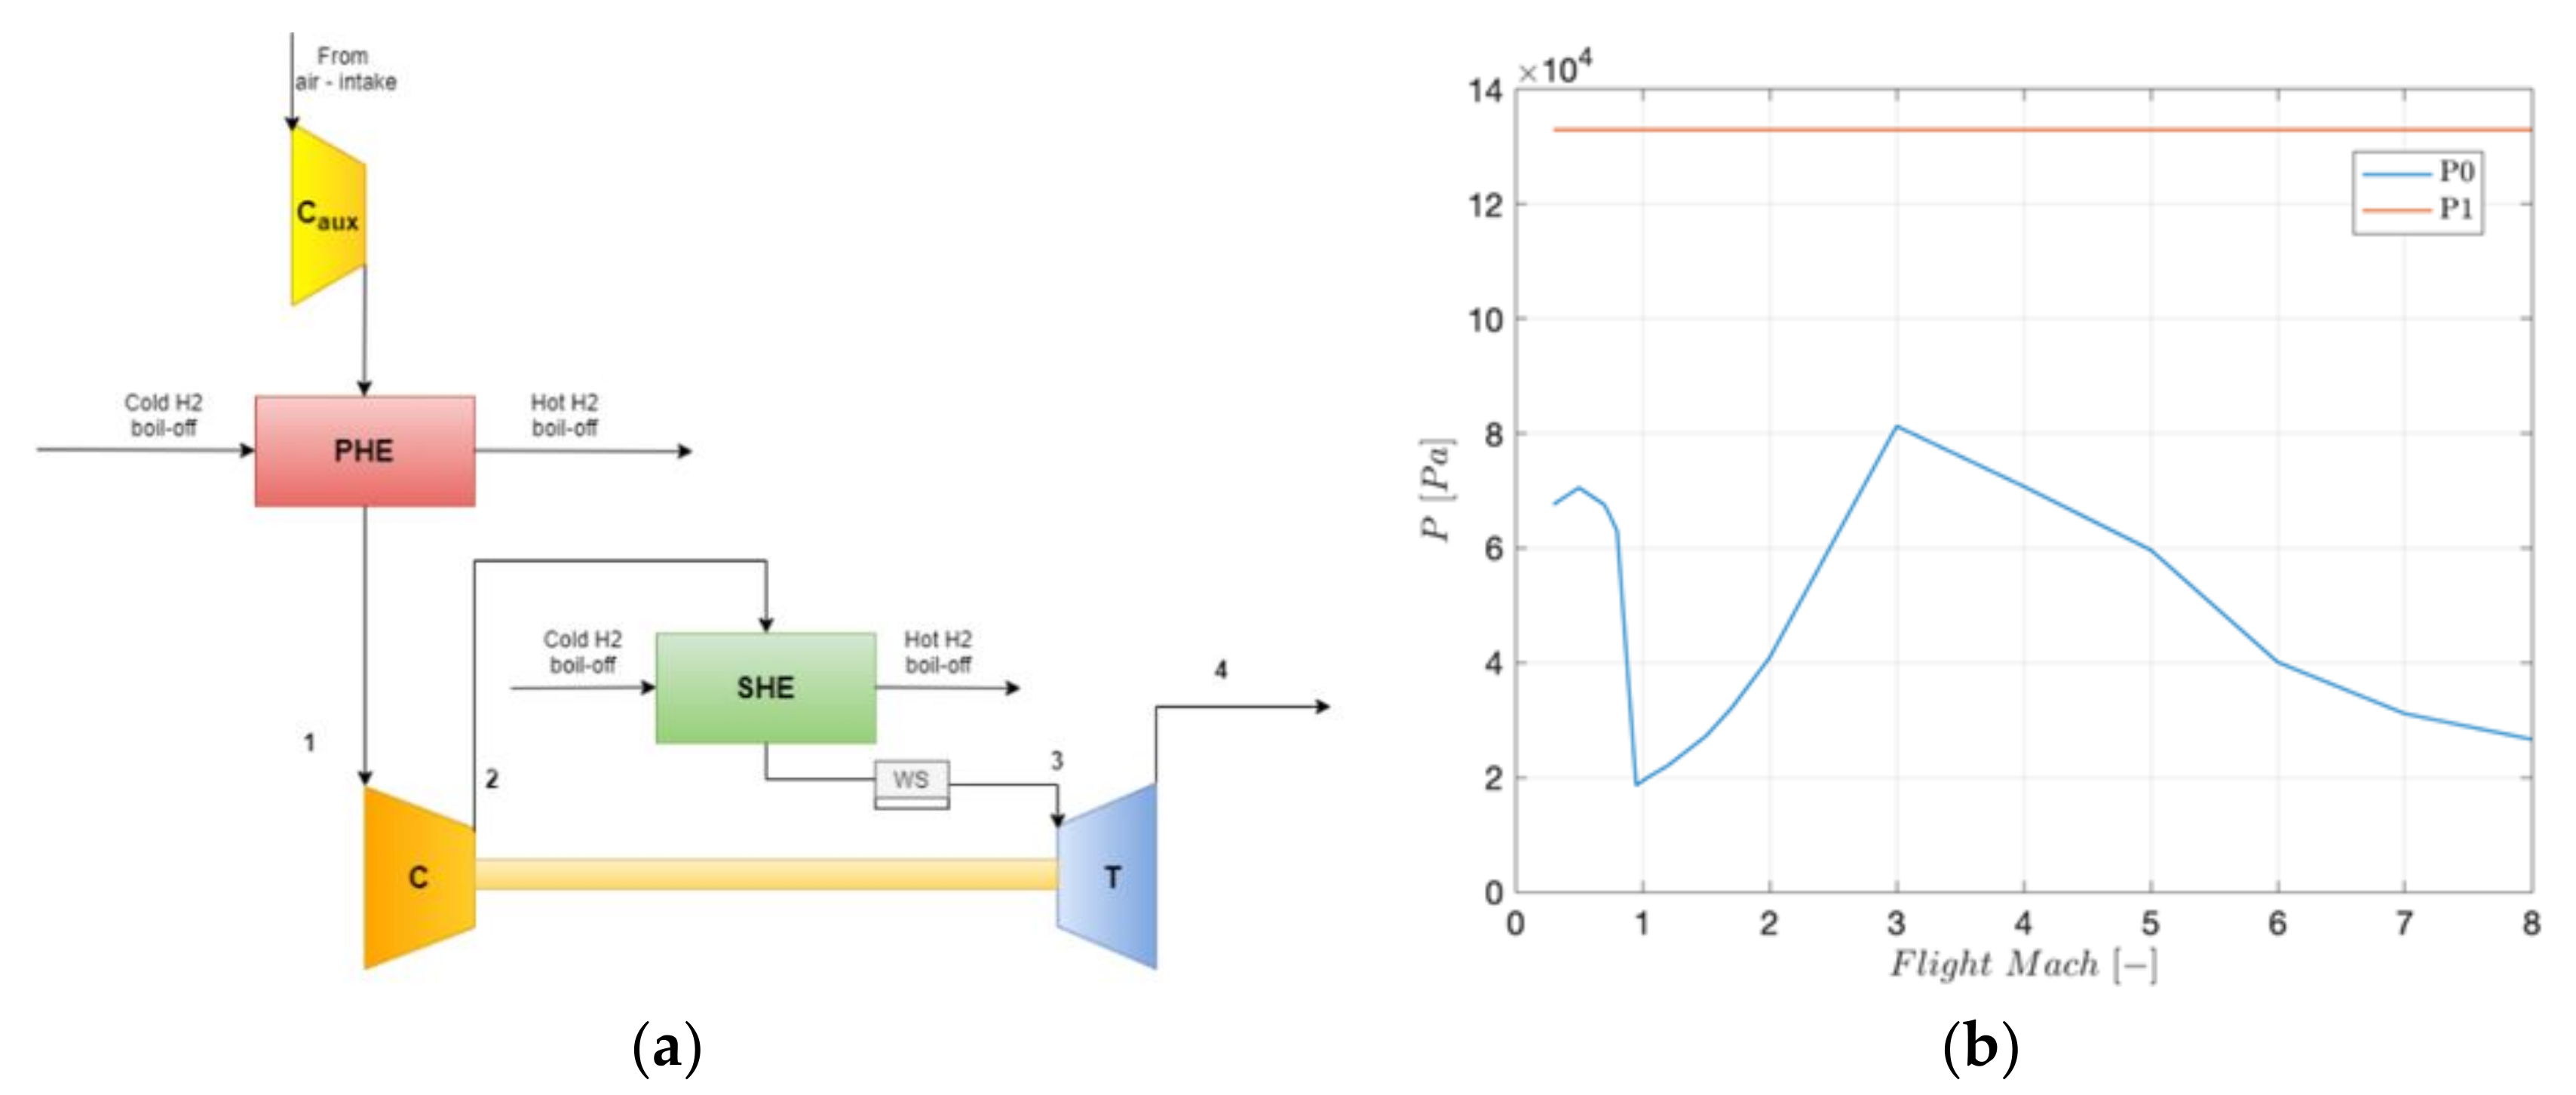
The air mass flow, extracted by the engine air intake, is then regulated through the cold air unit (CAU), which regulates the pressure and temperature of the air to meet the cabin requirements. In the open-loop architecture, selected for the ECS of the STRATOFLY MR3, an outflow valve regulates the air discharged outside the aircraft and additional relief valves balance the inside and outside pressures in all conditions. The CAU is an air cycle machine with a bootstrap sub-freezing architecture (
Figure 6a). A dedicated auxiliary compressor, driven by an electric motor, was integrated ahead of the primary heat exchanger of the CAU to reach the necessary air pressure level to finally comply with the requirements of air pressure and air temperature at the CAU’s exit.
Figure 6b shows the variation with Mach number of the pressure of the ram-air extracted by the engine inlet duct and of the air entering the CAU’s compressor. It is clear that the auxiliary compressor was needed to increase the ram-air pressure level to comply with the required air pressure values when entering the CAU’s compressor.
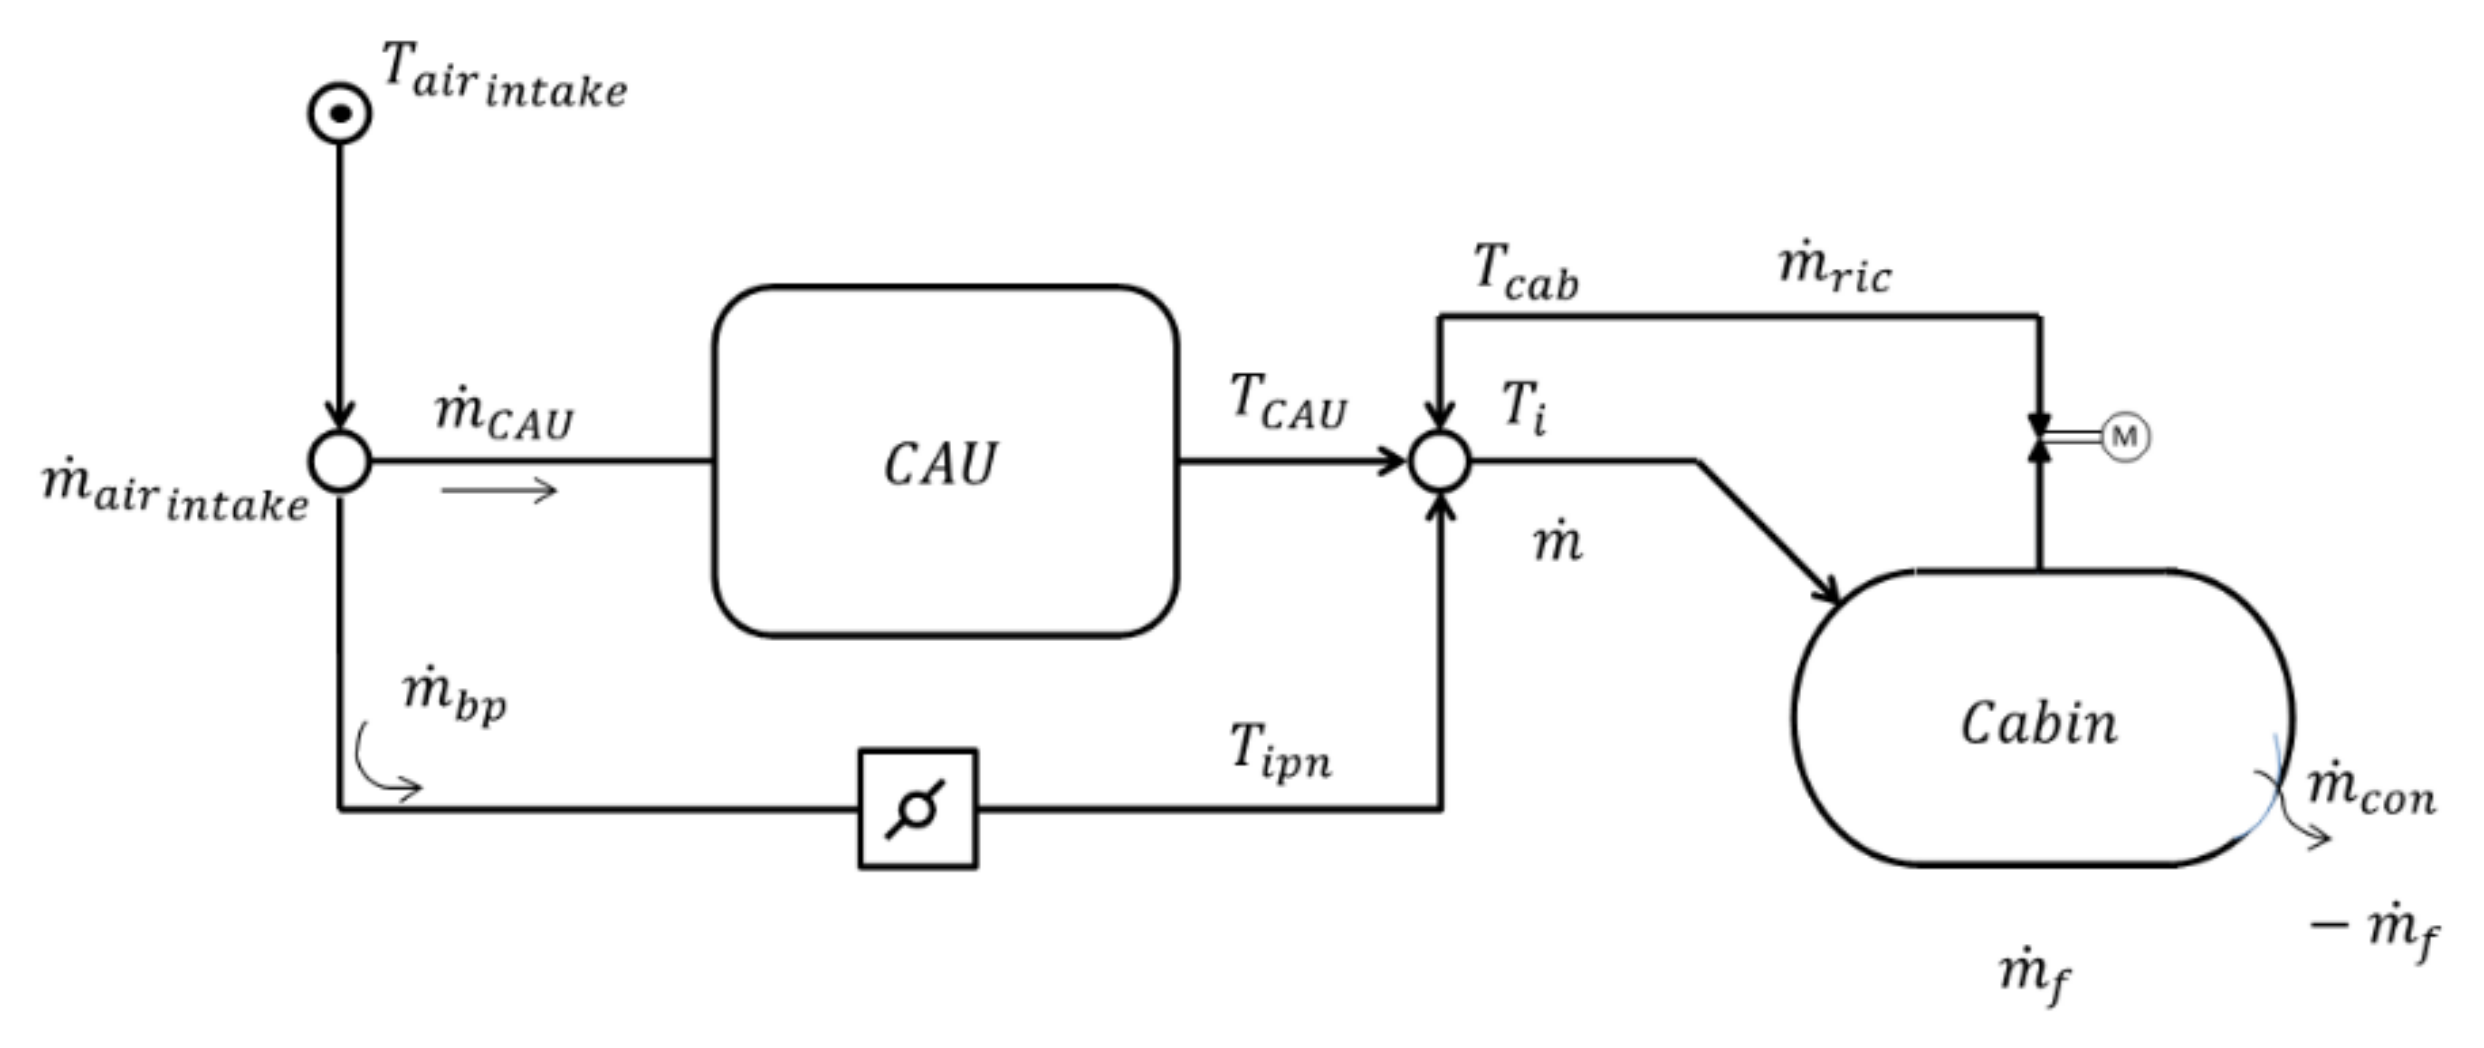
Figure 7 shows two different modes of operations of the CAU: the cold case and the hot case. In the cold case, when the cabin needs to be warmed up, the by-pass line is activated, and the air extracted from the engine air intake is mixed with the air flow exiting from the CAU. Before entering the cabin, the air flow is also mixed with the air recirculating from the cabin itself. In the hot case, when the cabin needs to be cooled down, no by-pass mass flow is required, and the air mass flow exiting from the CAU is mixed only with the air recirculating from the cabin, before entering the cabin itself.
3.2. ECS Mathematical Modeling
Depending on the environmental conditions, the modes of operations of the aircraft (particularly, the engine-on and engine-off conditions) and the configurations of the cabin (empty cabin or full of passengers), different scenarios can be defined: (i) cold case scenario, when the external environment either outside the aircraft or outside the cabin is cold and it is therefore necessary to warm up the cabin; (ii) hot case scenario, when the ex-ternal environment either outside the aircraft or outside the cabin is warm and it is therefore necessary to cool down the cabin.
The CAU should manage the inwards/outwards heat fluxes by providing the cabin with the correct air mass flow to comply with requirements.
The cabin temperature should range between 291 (18 °C) and 298 K (25 °C). CS-25 prescribes that pressurized cabins should be equipped to provide a cabin pressure altitude of no more than 2438 m (8000 ft) at the maximum operating altitude of the aircraft under nominal operating conditions. The higher the altitude simulated within the cabin during cruise, the better it is for the structure, due to the lower differential pressure values be-tween the outer atmosphere and inner environment. A compromise should therefore be reached between passengers’ comfort and structural performance. In addition to temperature and pressure requirements, CS-25 prescribes that each passenger and crew compartment should be ventilated, and each crew compartment should have enough fresh air to enable crewmembers to perform their duties without undue discomfort or fatigue, being not less than 0.28 m3/min (0.343 kg/min or 5.7 g/s). The supply of fresh air in the event of loss of one source should not be less than 0.147 m3/min (0.18 kg/min or 3 g/s) for any period exceeding five minutes.
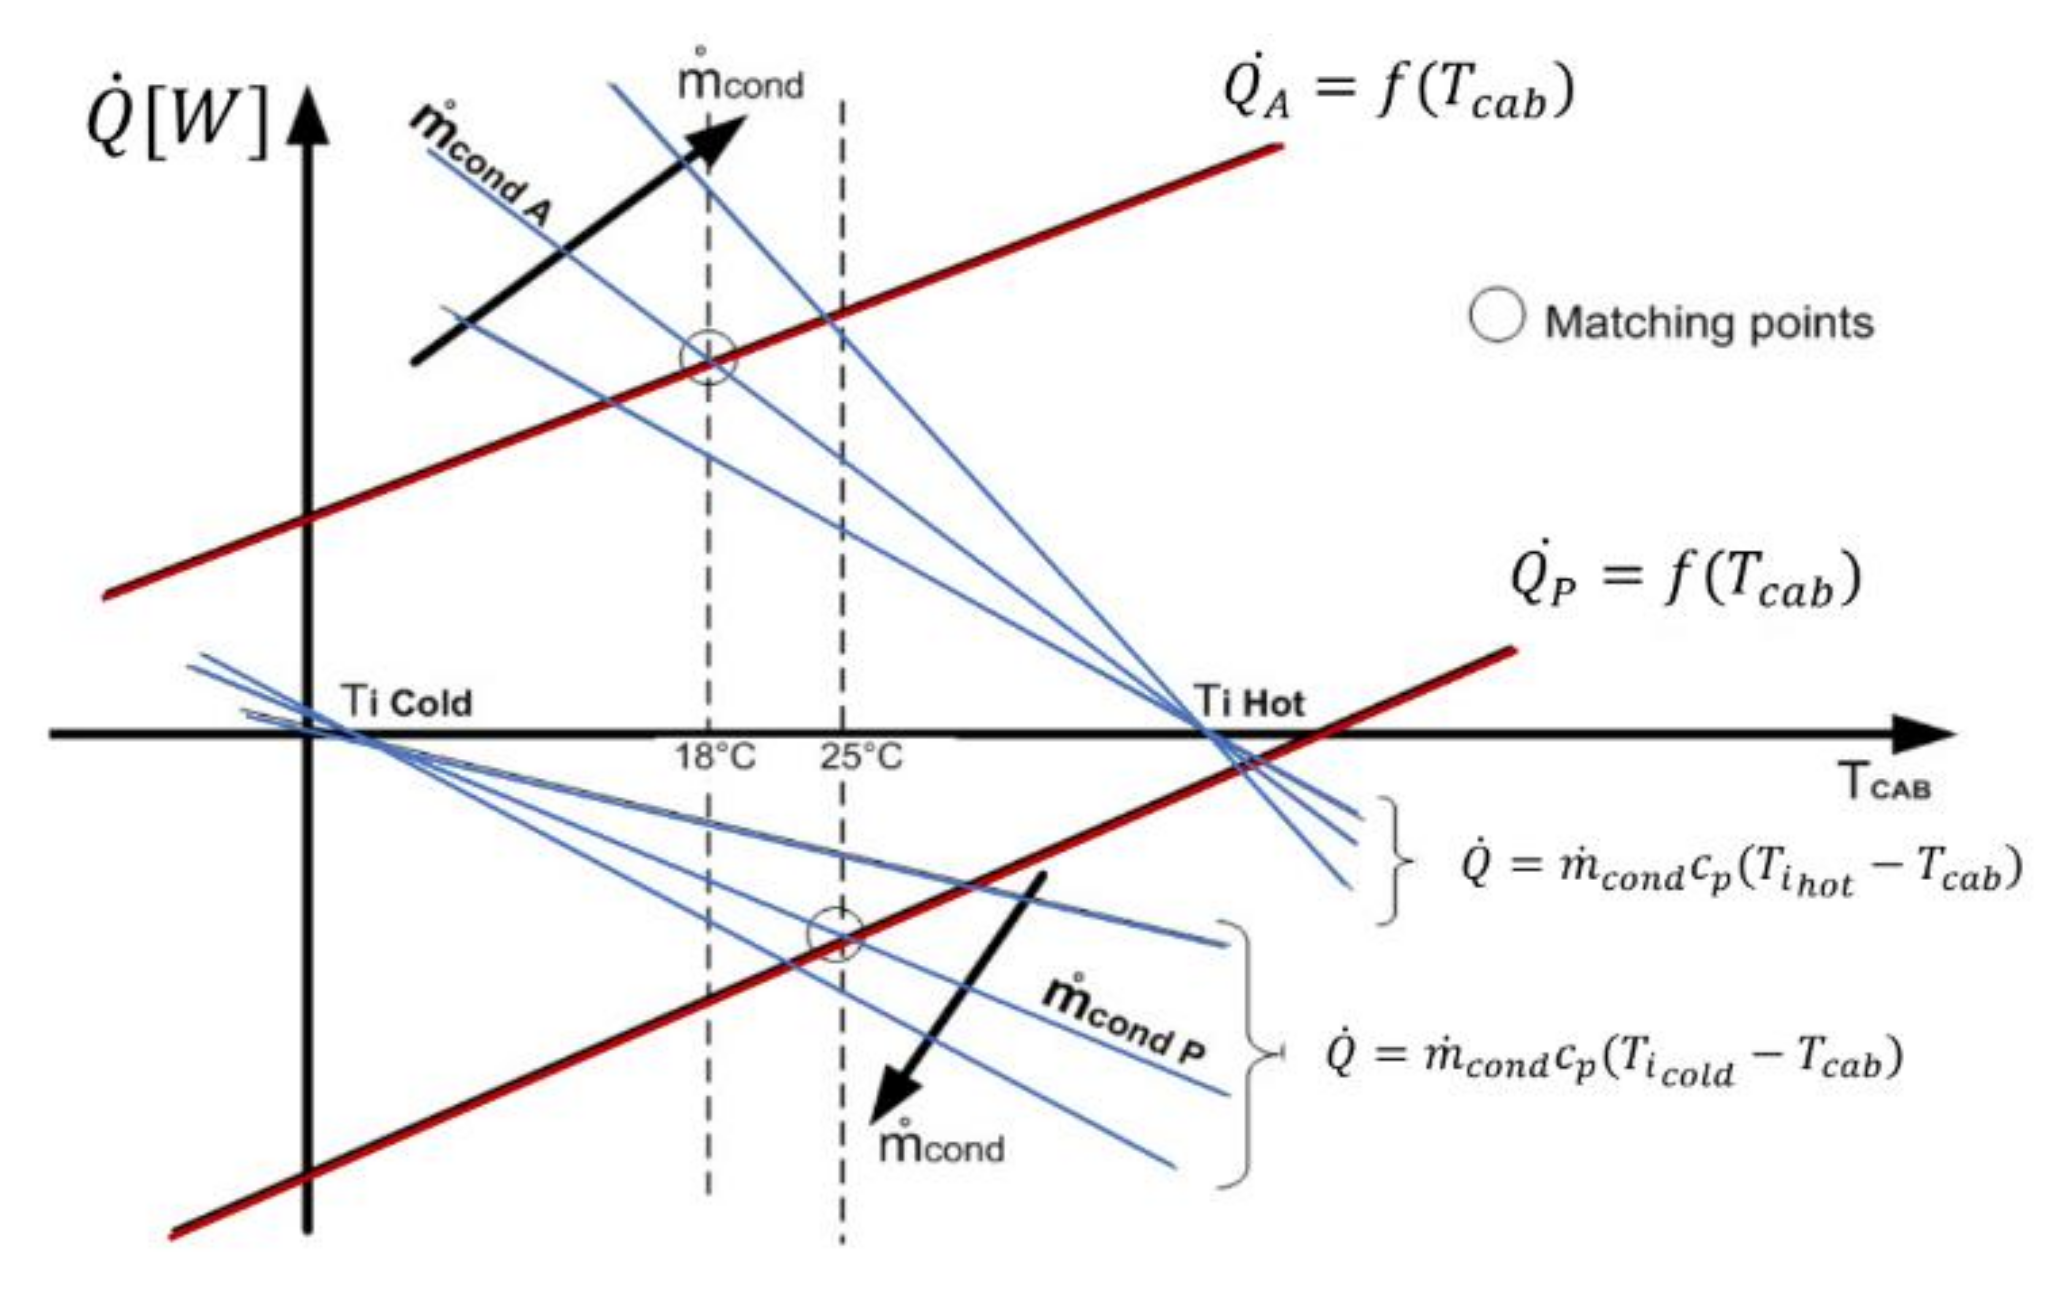
In cold case scenarios (
Figure 8), the ECS should provide the cabin with hot air mass flow to balance the outward heat fluxes. If the ECS was not active, the heat load would increase, and T
cab would reach unacceptable values (T
cab < 18 °C). A typical temperature value of the hot air mass flow entering the cabin is T
i = 50 °C, and the target temperature of the cabin is T
cab = 18 °C.
In hot case scenarios (
Figure 8), the ECS should provide the cabin with cold air mass flow to balance inward heat fluxes. If the ECS was not active, the heat load would decrease and the temperature of the cabin, T
cab, would reach unacceptable values (T
cab > 25 °C). A typical temperature value of the cold air mass flow entering the cabin is Ti = 2 °C, and the target temperature of the cabin is T
cab = 25 °C. In
Figure 8, the red lines represent the variation of the heat load with the temperature inside the cabin for the cold and hot case scenarios, while the blue lines depict the heat load supplied by the ECS. Depending on the desired cabin temperature, different values of air mass flow are required and, consequently, different heat loads provided by the ECS.
The mathematical relationship that expresses the heat load that the ECS should provide as a function of the desired cabin temperature with varying air mass flow is reported hereafter:
The air mass flow that the ECS should supply is therefore given by Equation (2), which reports also the values of the temperature of the air entering the cabin and the temperature of the air inside the cabin for the hot and the cold cases:
Table 2 summarizes some of the different scenarios that hypersonic vehicles can face. Unlike subsonic civil passenger aircraft that experience the cold case scenario in cruise, during cold nights, without passengers (load factor equal to zero, during transfers), hypersonic civil passenger aircraft experience the cold case scenario either when parking on ground, in the engine-off mode of operation, without passengers on board, or in the sub-sonic climb/cruise phases at 5000–10,000 m of altitude without passengers. Conversely, while the hot case for subsonic civil passenger aircraft happens on-ground, during hot days with passengers at full capacity (load factor equal to 1), and for hypersonic aircraft, it occurs in cruise phase (Mach 8 for the. STRATOFLY MR3), in the engine-on mode of operation with passengers at full capacity.
Table 2 lists only nominal conditions. Out-of-nominal conditions are further investigated.
From preliminary investigations, the worst-case scenario for hypersonic vehicles is the hot case, when the aircraft is flying at hypersonic speed, ranging, in the case of the STRATOFLY MR3, from Mach 4 to Mach 8.
Three types of heat loads can be determined at hypersonic speed as reported in Equation (3):
External heat load acting on the external skin: these heat loads are external to the vehicle;
Internal heat load generated inside the cabin: these heat loads are internal to the vehicle and internal to the cabin;
Internal heat load acting on the external skin of the cabin: these heat loads are internal to the vehicle but external to the cabin.
Unlike subsonic civil passenger aircraft, which should withstand only external and internal heat loads, hypersonic aircraft are also subject to internal heat loads acting on the external shell of the cabin because of their innovative and highly integrated configuration with embedded high-speed propulsion.
3.2.1. Mathematical Modeling of External Heat Loads
To assess the external heat load transfer (i.e., heat fluxes (W/m
2)), first the wall temperature, Tw, was calculated through a zero-dimensional steady-state analysis based upon the convective–radiative–conductive heat transfer balance [
27] as shown in Equation (4):
Hereafter, the reader can find suggestions for a generic hypersonic vehicle:
The external geometry of the vehicle can be simplified as a set of inclined flat plates;
The thermal conductivity,
k, can be estimated equal to 1 W/(mK) [
26], considering the insulation material of the tanks based upon quartz fiber;
The thickness of the skin (including insulation layer), t, is usually set equal to 0.1 m;
The internal side of panels has an insulation layer that is in contact with the cryogenic liquid hydrogen tank at 20 K. This simplifying hypothesis clearly holds true only for some compartments of the vehicle. A more detailed analysis that considers the two different types of vehicle’s compartment, i.e., those that have the external skin in contact with LH2 tanks and those that do not have the external skin in contact with LH2 tanks should be carried out as future research activity;
The following values of emissivity, ε, have been considered for different high-temperature materials for the TPS-panels of the skin: ε = 0.3 for metallic alloys (Inconel, Titanium); ε = 0.8 for ceramic materials (C/C, C/SiC); ε = 1.0 for the ideal upper limit.
The convective heat transfer coefficient,
hconv, is expressed by Equation (5), where the specific heat at a constant pressure is set equal to
:
The mathematical relationship of the Stanton number, S
t, is reported in Equation (6):
The turbulent skin friction coefficient, c
f, is given by Equations (7)–(9):
The convective heat transfer is estimated equal to 450 W/(m
2K) for aircraft that cruise at Mach 8. The external heat load transfer is thus calculated as follows (Equation (11)):
3.2.2. Mathematical Modeling of Heat Loads Generated Inside the Cabin
The internal heat loads are the sum of heat loads due to the metabolism (human beings) and to the onboard systems:
The heat load generated by the metabolism is expressed by Equation (13):
The heat load generated by human bodies at rest is estimated to be equal to , while the heat load produced by human bodies at work is estimated to be equal to . The number of passengers carried on board the STRATOFLY MR3 is and the estimated number of crew members in the cockpit and in the cabin is equal to .
The heat loads generated by the avionic equipment installed inside the cabin and usually related to the passengers’ comfort cannot be estimated through statistical models available for subsonic aircraft. Indeed, with respect to subsonic aircraft, the adoption of a windowless cabin configuration may, for example, lead to an increase in the electric power demand of avionic equipment and, consequently, to the generated heat loads. However, the technologies’ enhancement in cooling capabilities (e.g., integrated boil-off hydrogen heat exchangers and heat-pipes) of the avionic equipment can yield a reduction up to 20% of the expected heat loads inside the cabin ().
Therefore, the heat load produced by onboard systems inside the cabin (
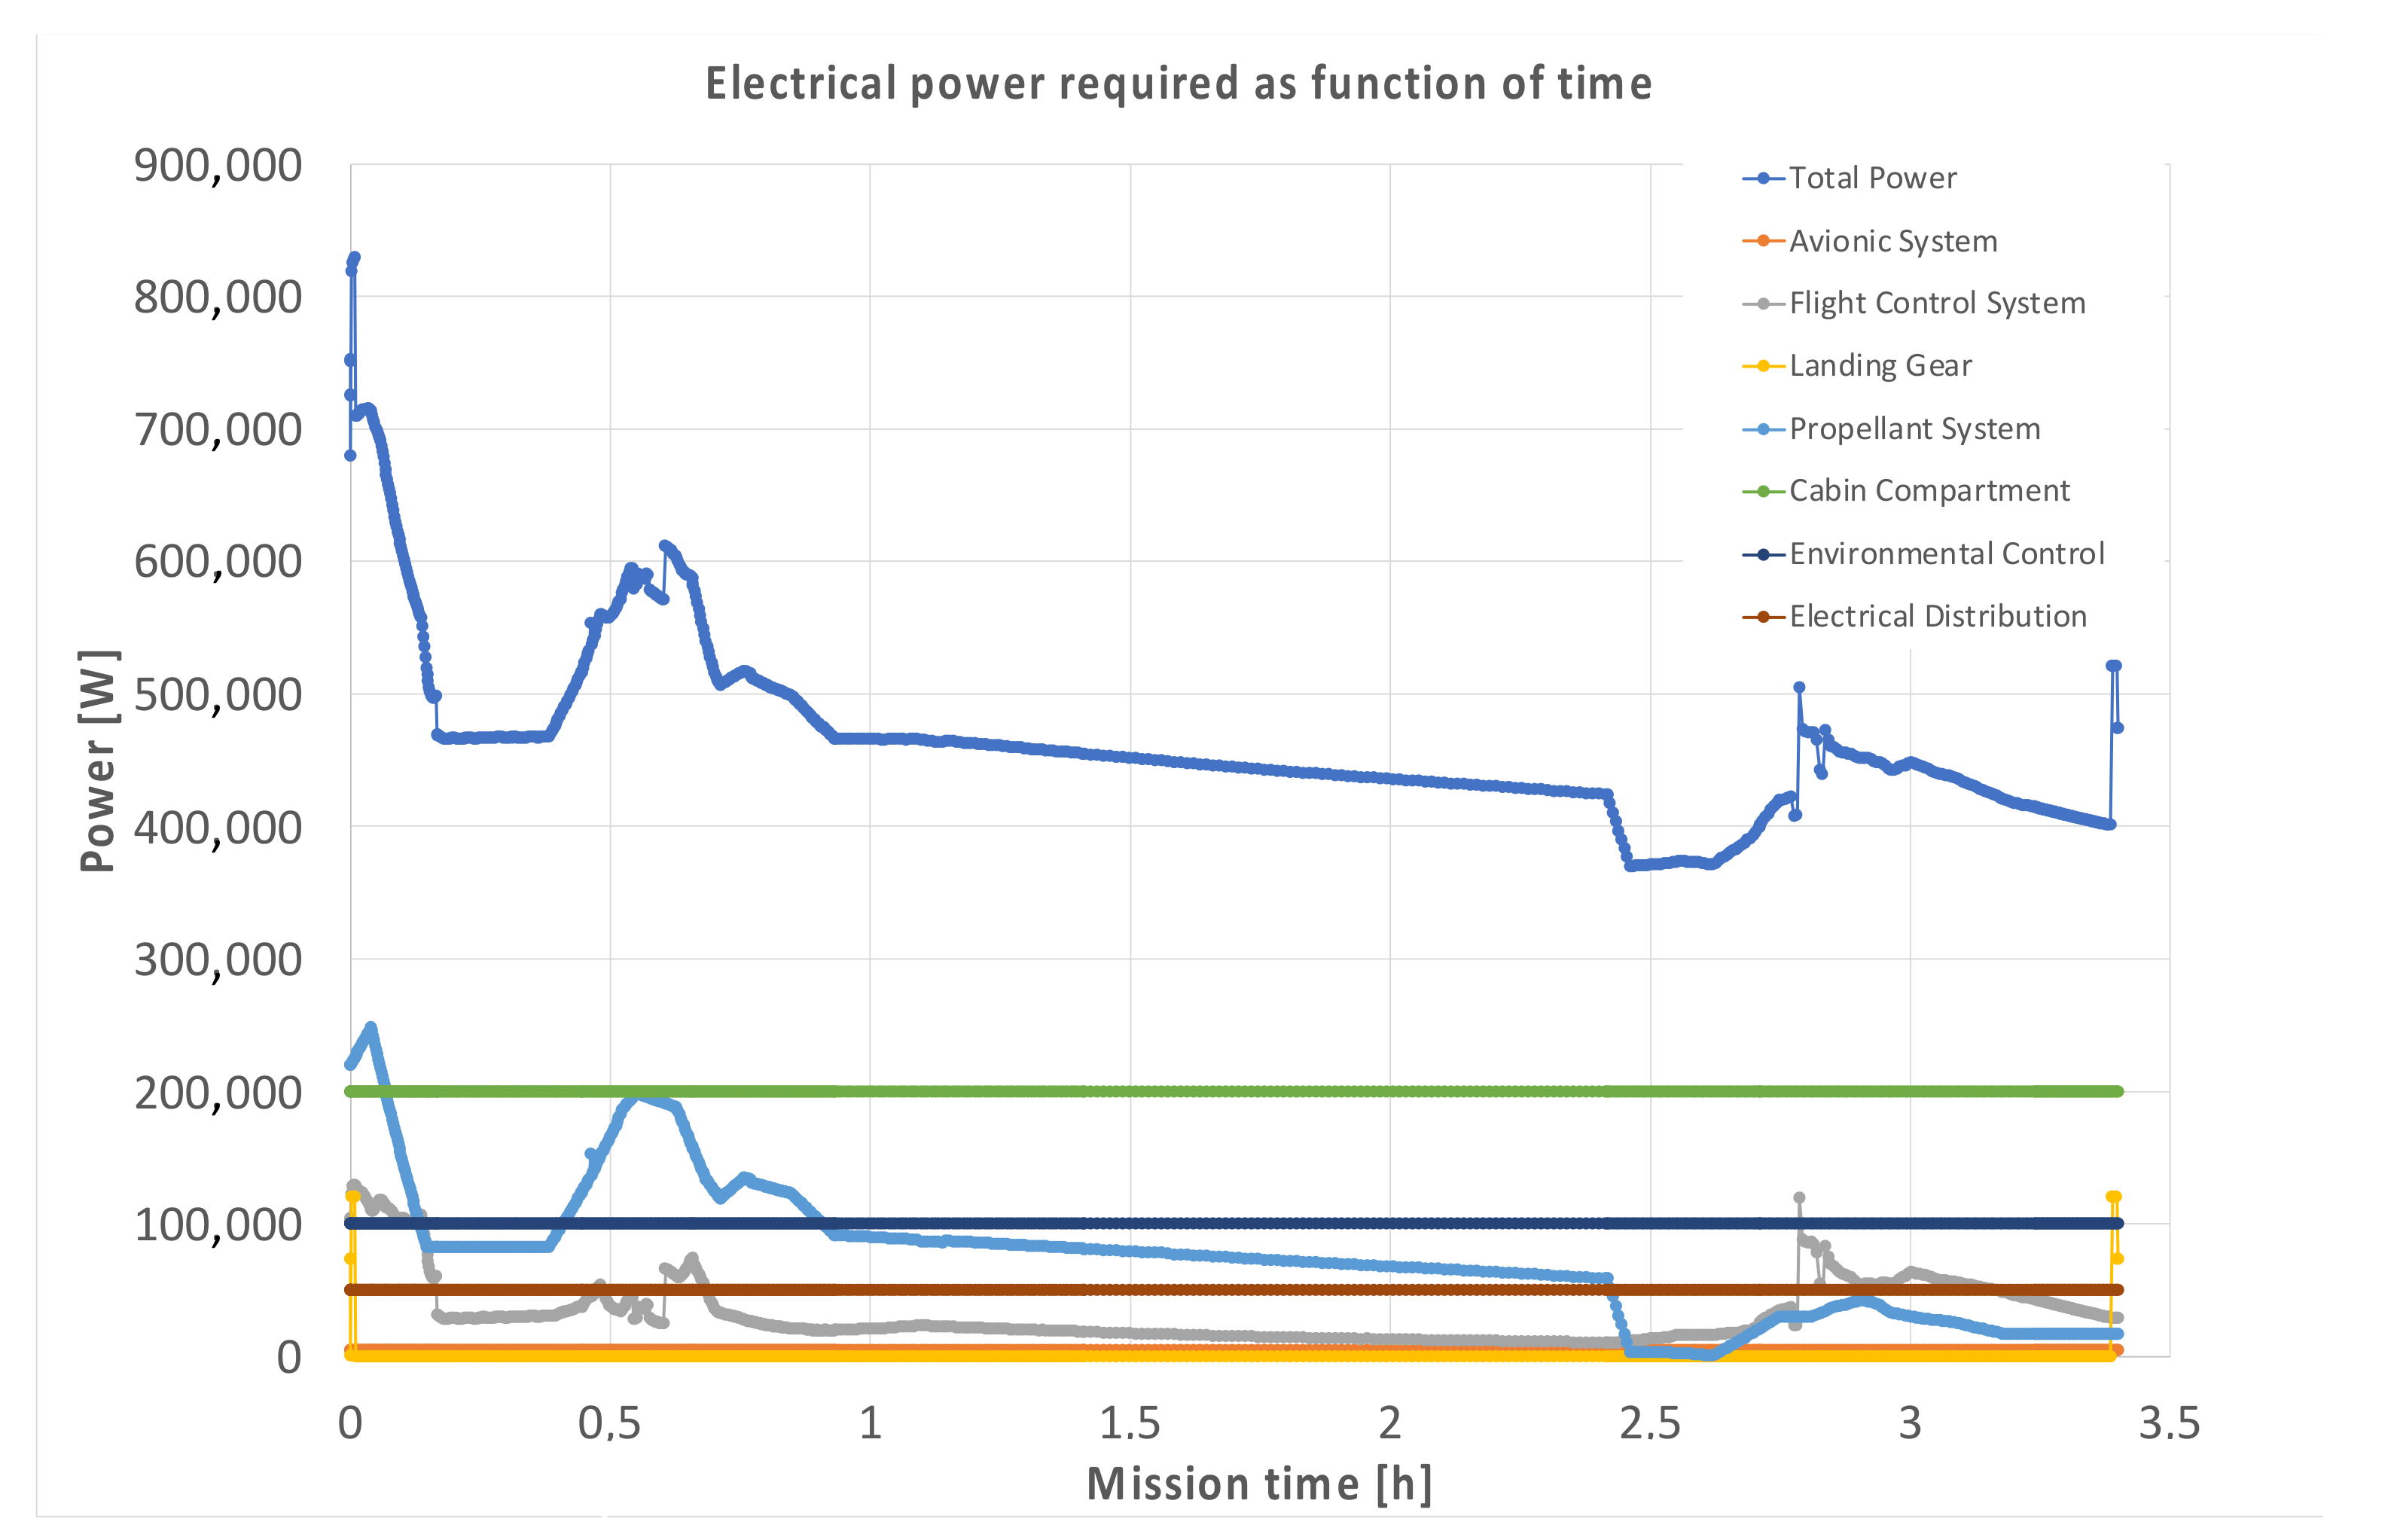
) is expressed as function of the electric power demand of the cabin onboard equipment (Equation (14)),
(cabin compartment contribution in
Figure 9), where the coefficient
is equal to 0.8:
Making benefit of the detailed analyses and simulations performed in the framework of the H2020 STRATOFLY Project for the sizing and integration of onboard systems of the STRATOFLY MR3, an electric power demand of approximately 200 kW for the entire cabin compartment as considered (). Therefore, a value of 160 kW for is here suggested for a hypersonic vehicle carrying 300 pax.
3.2.3. Mathematical Modeling of Heat Loads Generated Outside the Cabin
There are heat loads that are generated inside the vehicle but act on the external skin of the cabin (
). Typical examples are the loads coming from the engine compartment (
) and those generated by all subsystems installed on the aircraft but externally to the cabin (
). Complementary, the bottom of the cabin usually lies on the ventral skin of the aircraft along its entire length, which is exposed to
. The front and rear sides of the cabin, as well as the lateral side of most cabin’s compartments interface with liquid hydrogen tanks (
Figure 10a). The rear side of the cabin is not directly connected to liquid hydrogen tanks because of the landing gear retraction bay, but this contribution can be neglected. All cabin sides that interface with hydrogen tanks are considered isolated from the external environment; their contribution to the total incoming heat flow can thus be neglected.
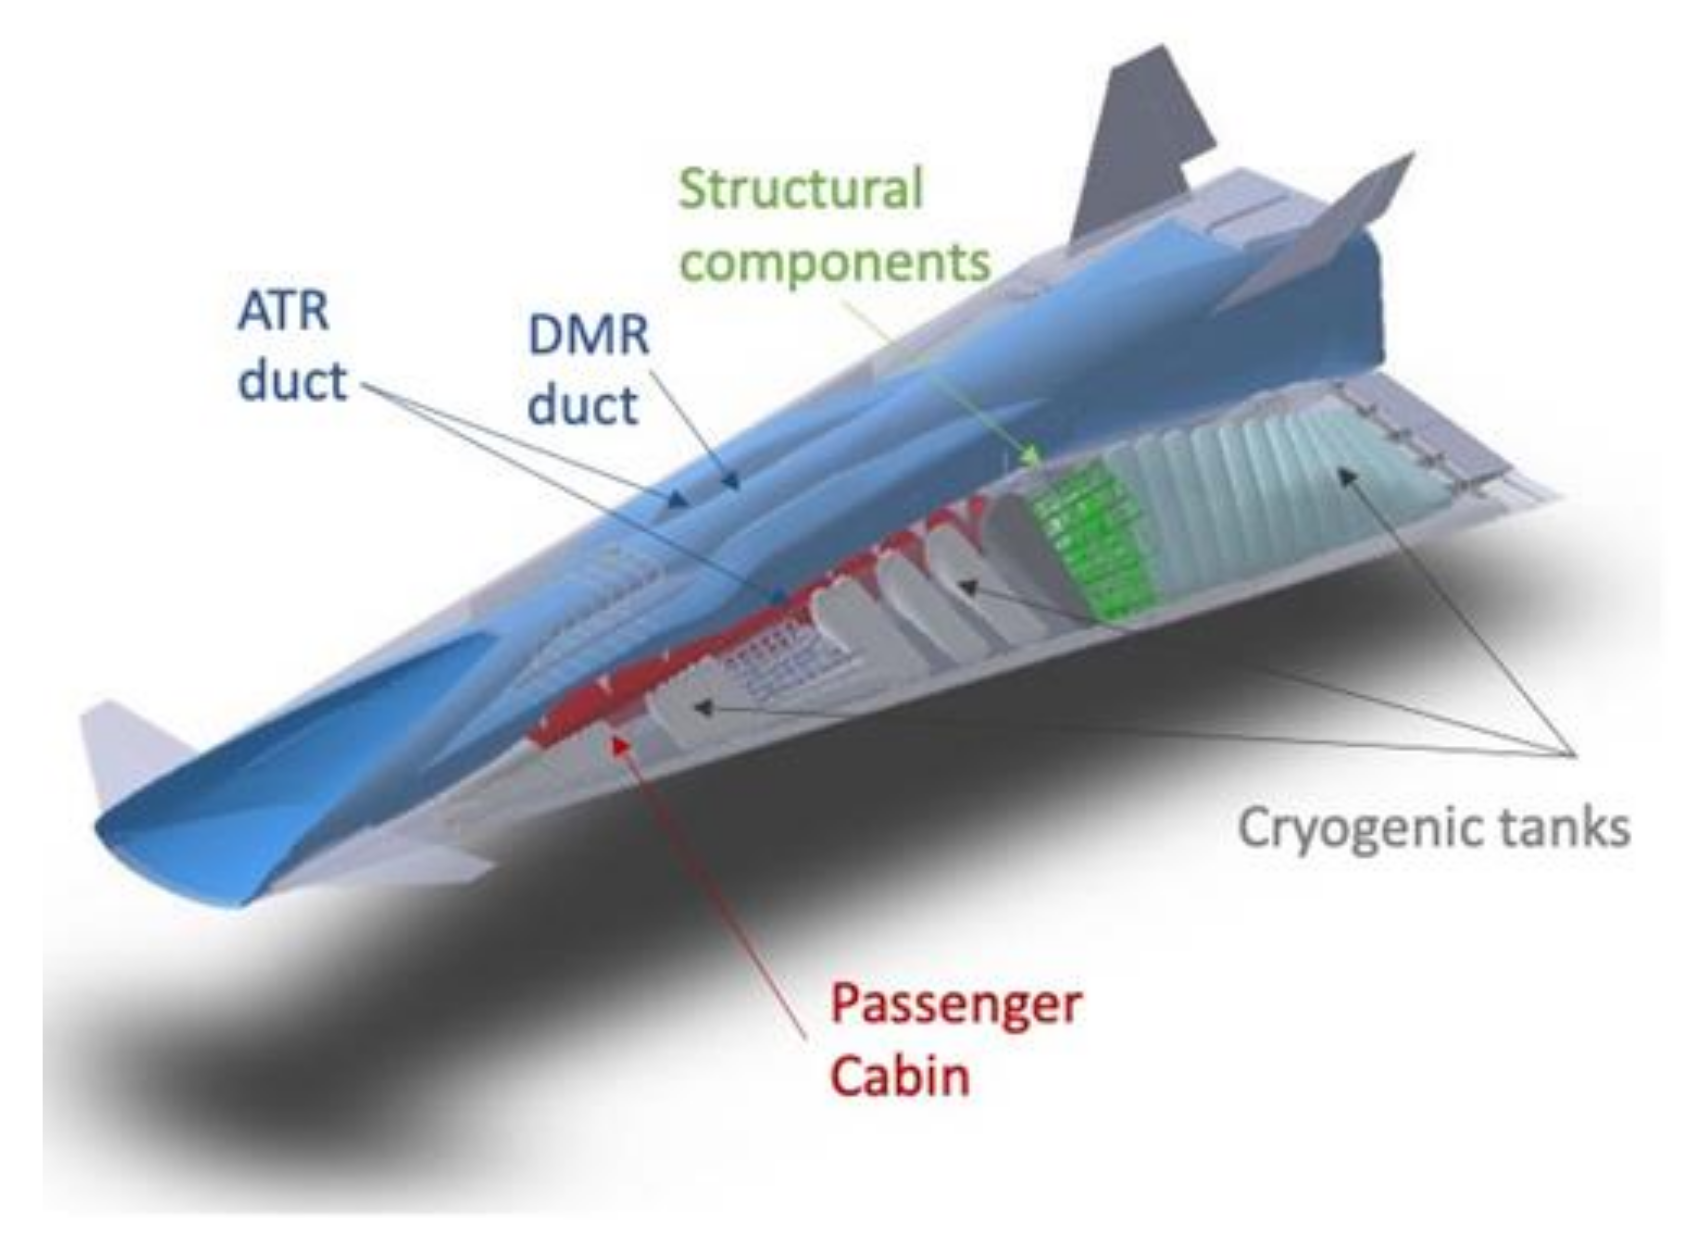
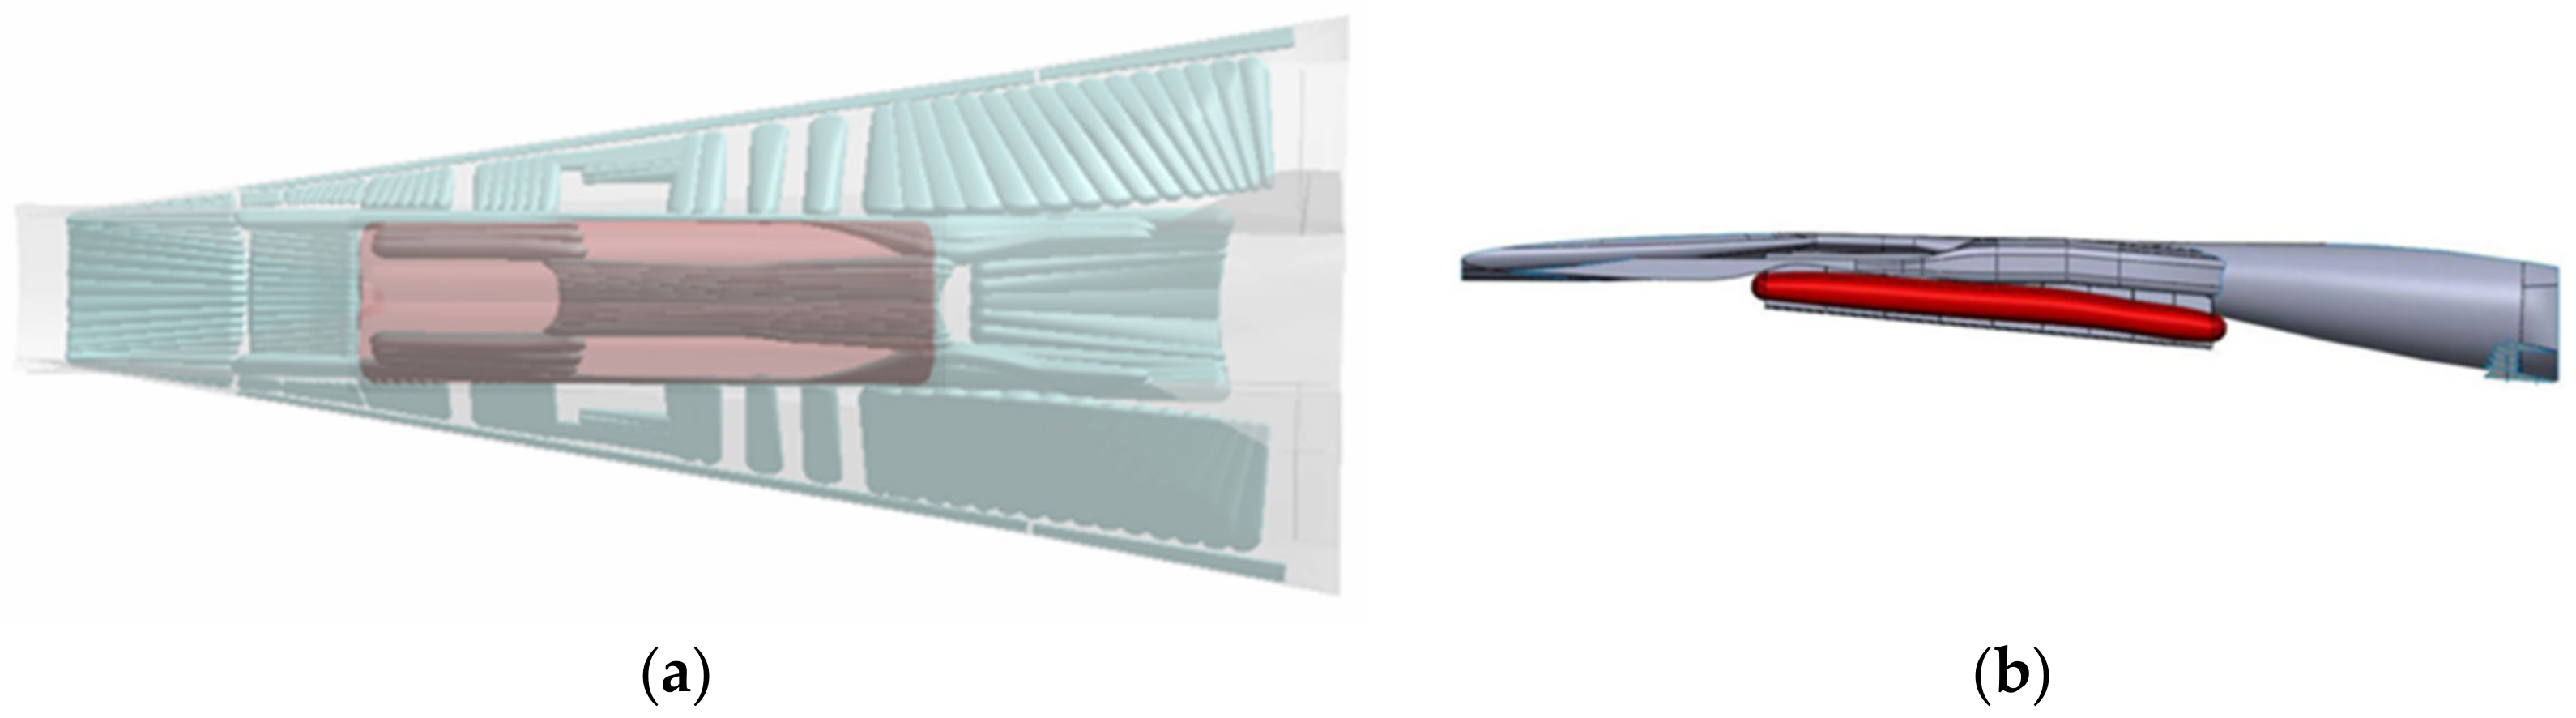
As far as the heat loads generated by the engine compartment are concerned, it is very important to understand the location and the mutual interfaces between the entire propulsive path (which includes the inlet, combustion chambers, and nozzle) and the cabin compartment. To meet mission requirements, the propulsive system of a hypersonic vehicle can be impressively long, and the aircraft concept built around it. A clear example is shown by the STRATOFLY MR3 concept, where the integrated propulsive subsystem extends for the entire length of the vehicle (
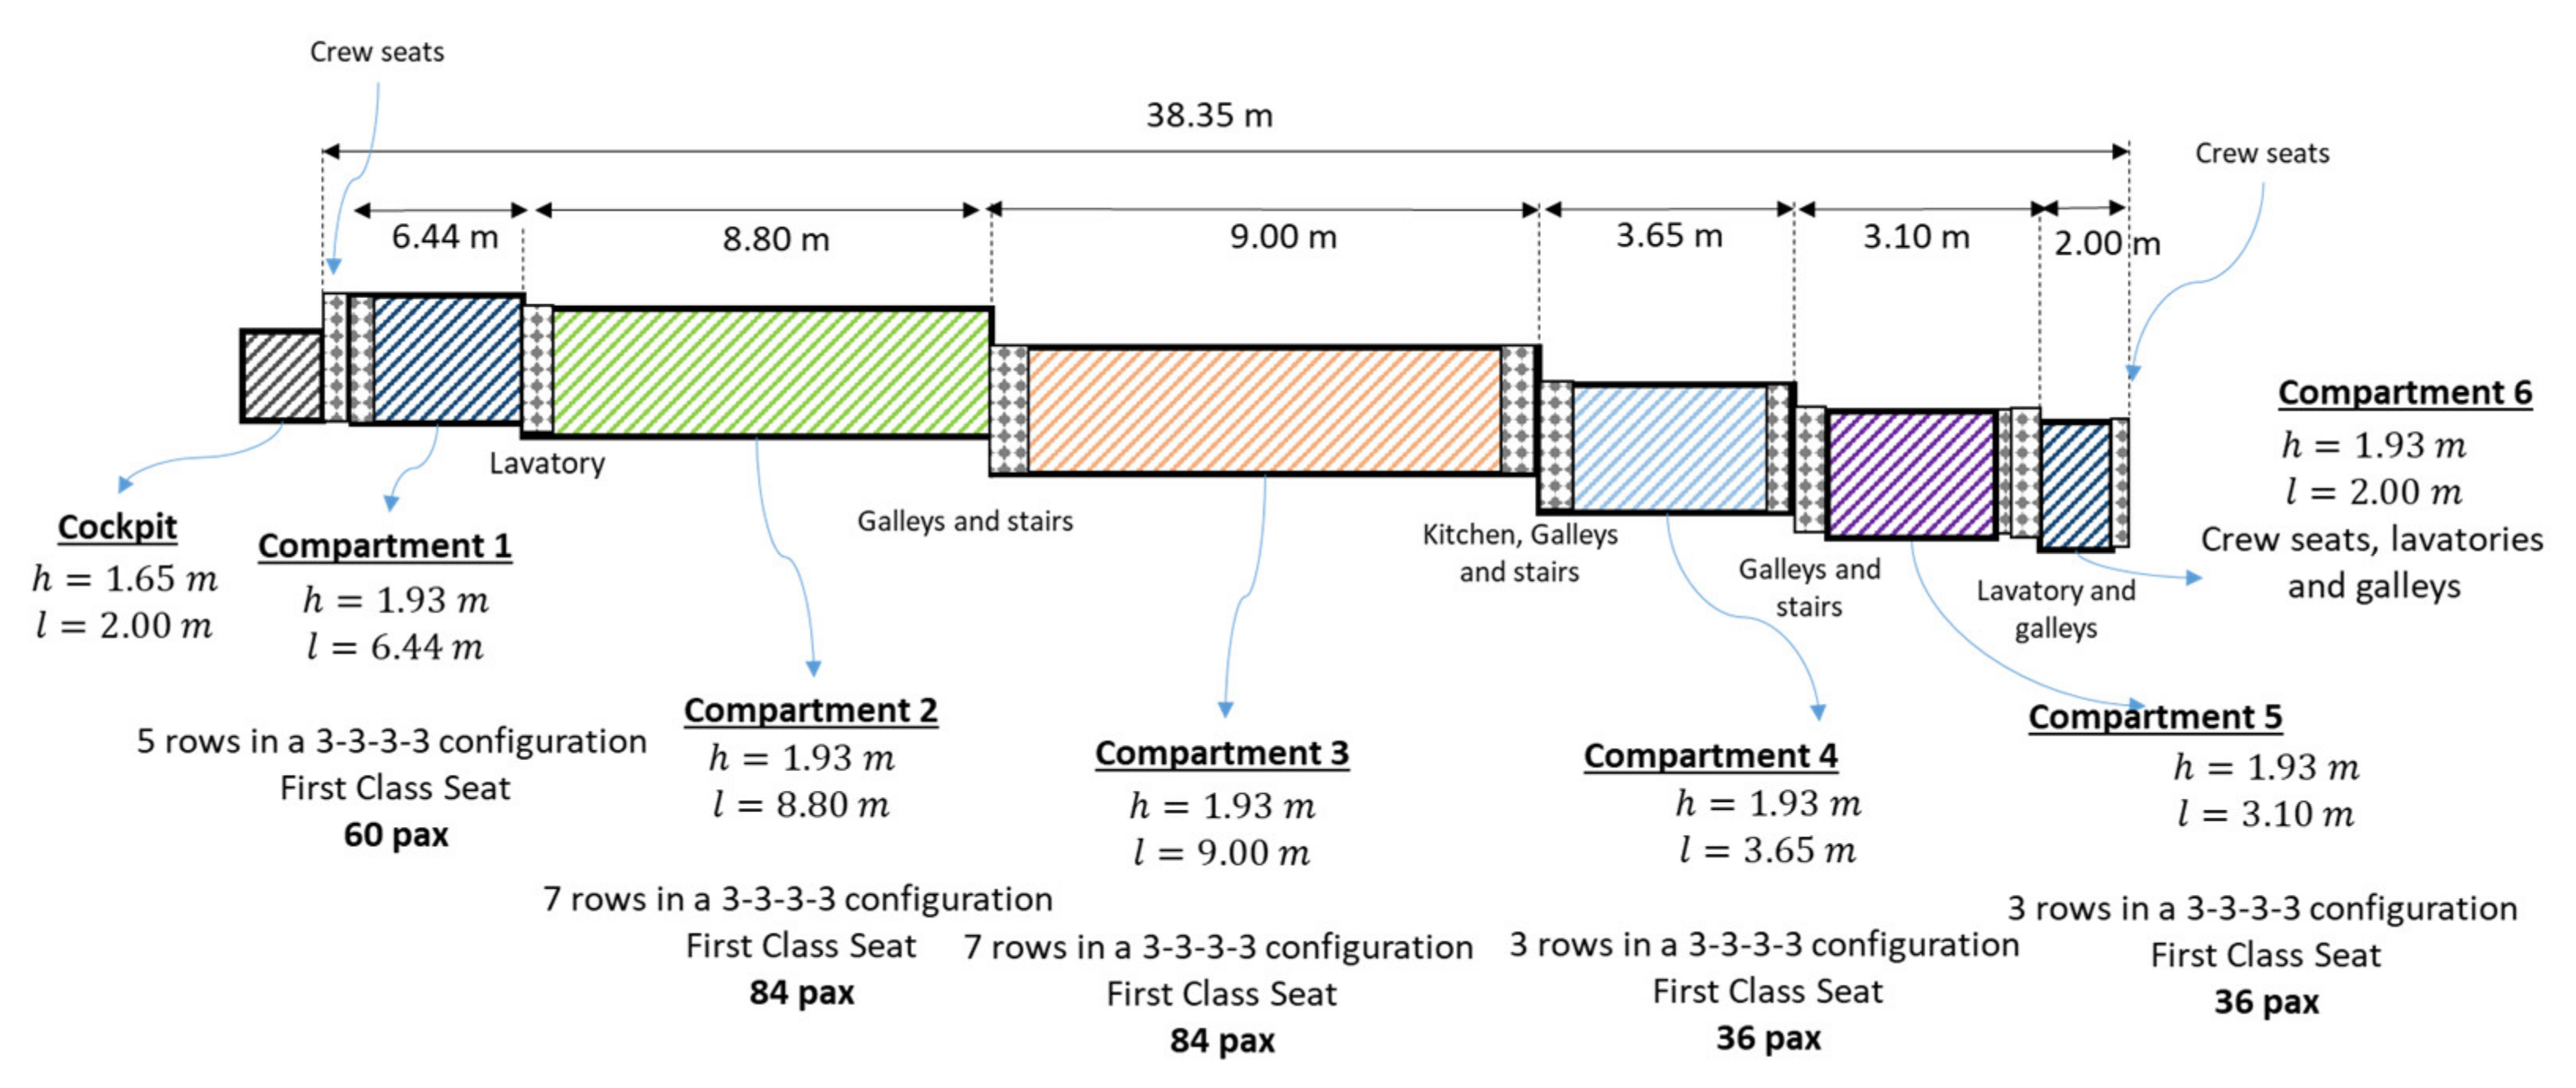
Figure 10b). In this case, to properly assess the temperature distributions and the thermal power due to the presence of the engines, a detailed thermal analysis was carried out. In detail, the internal configuration of the cabin consists of six passenger compartments at different floor levels and with different passenger capacities (300 first class seats), one cockpit with two pilots, stairs, lavatories, and galleys, as shown in
Figure 11, where the main technical data are reported. The cabin is thus modeled as a structure composed of seven single adjacent compartments between which the heat load transfer is neglected. The cabin ceiling is mechanically connected to the propulsive system bay through an aluminum reticular metal structure and each section of the cabin compartment interface with different areas of the propulsive flow-path.
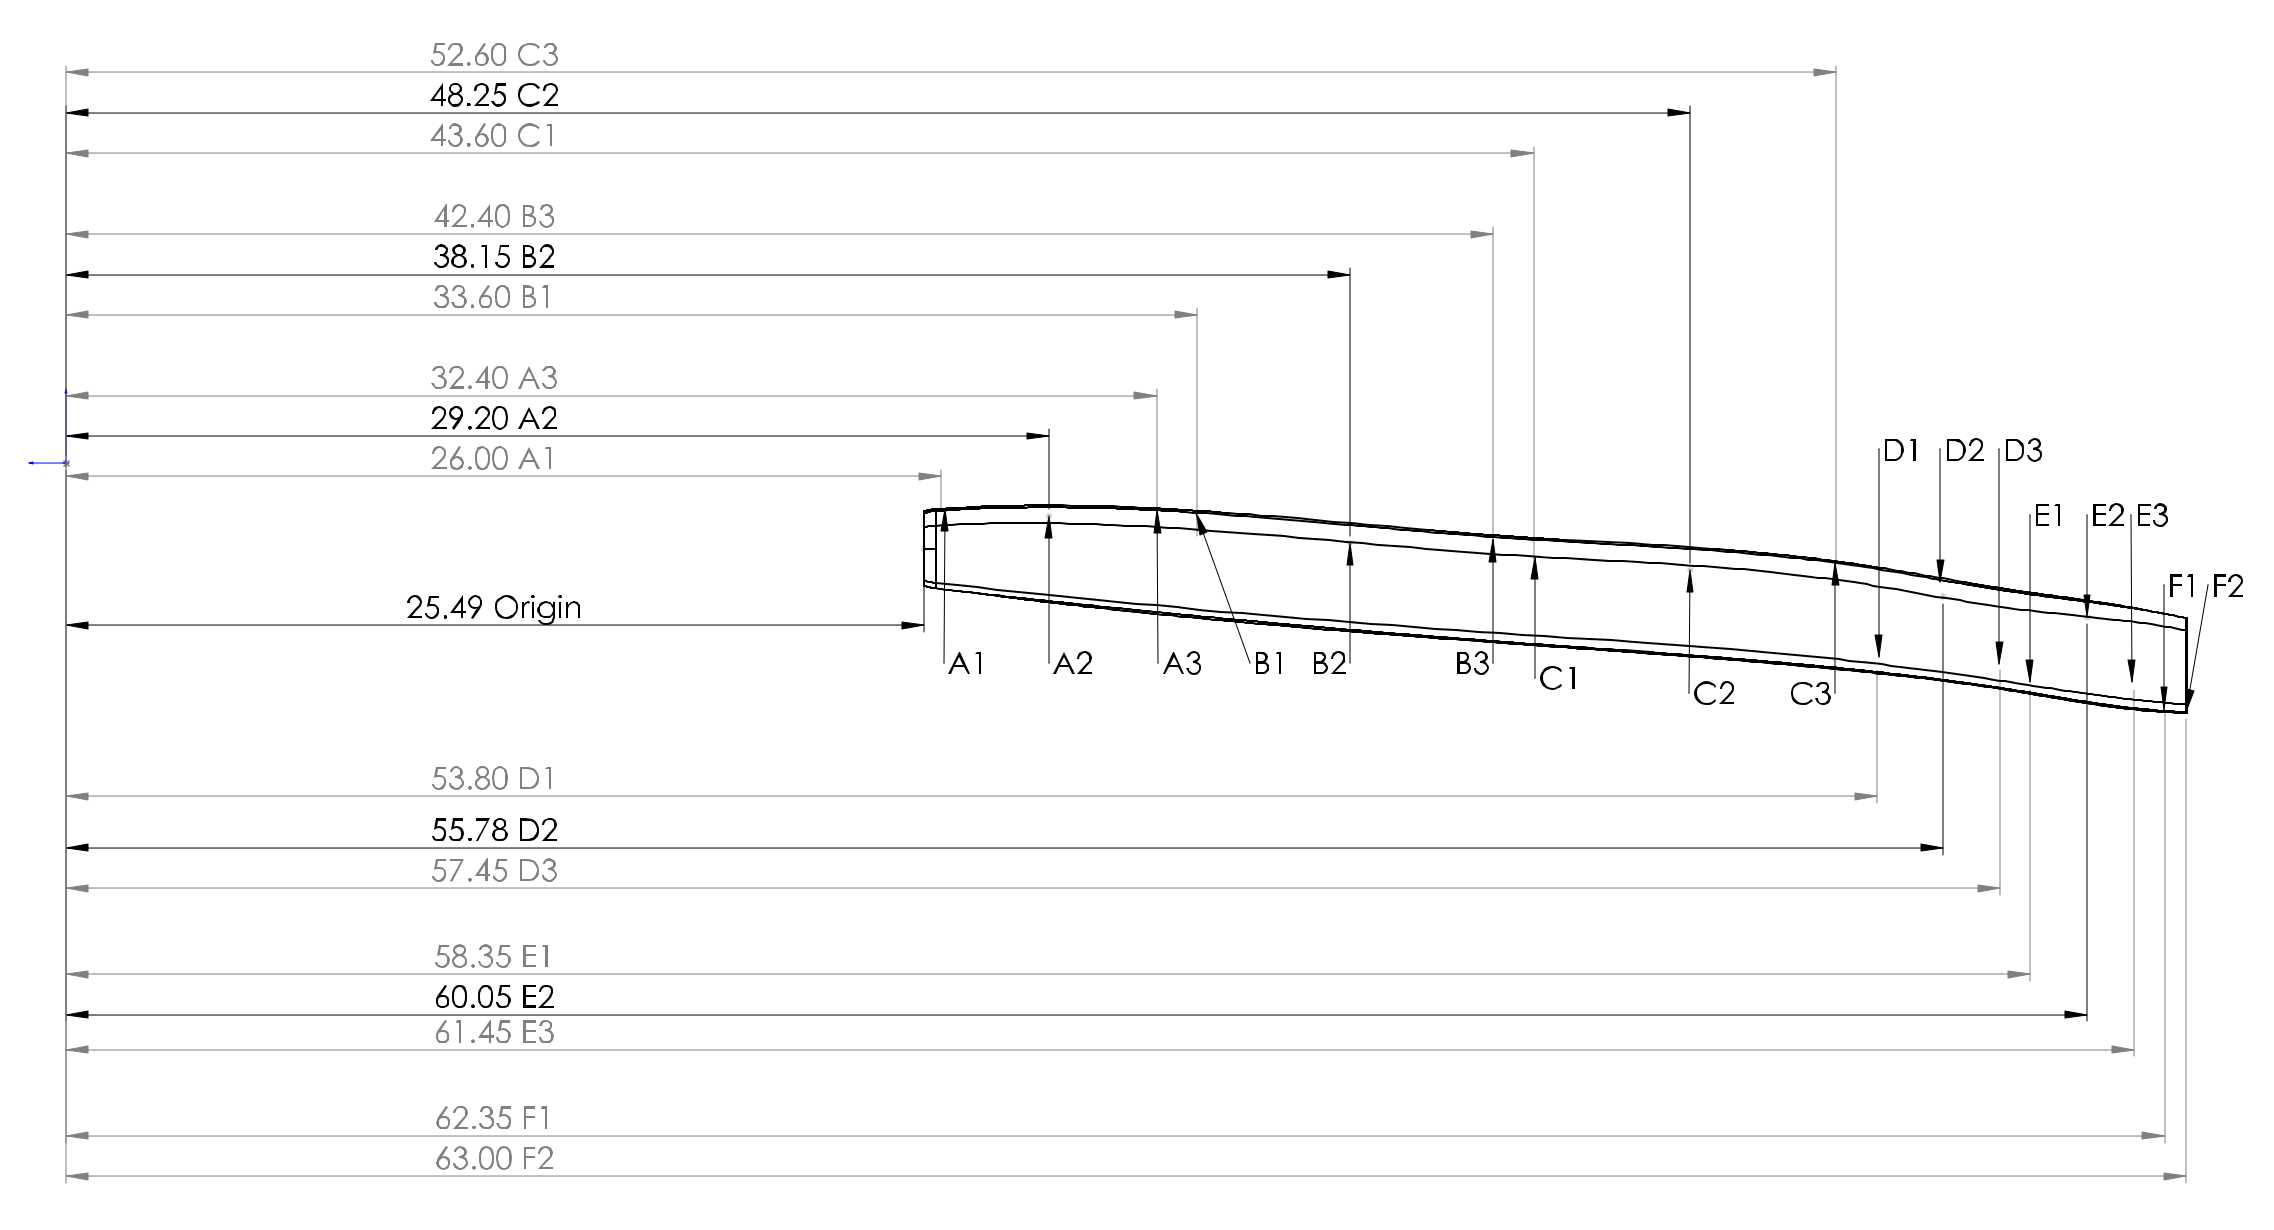
For each compartment, a set of control points were identified (
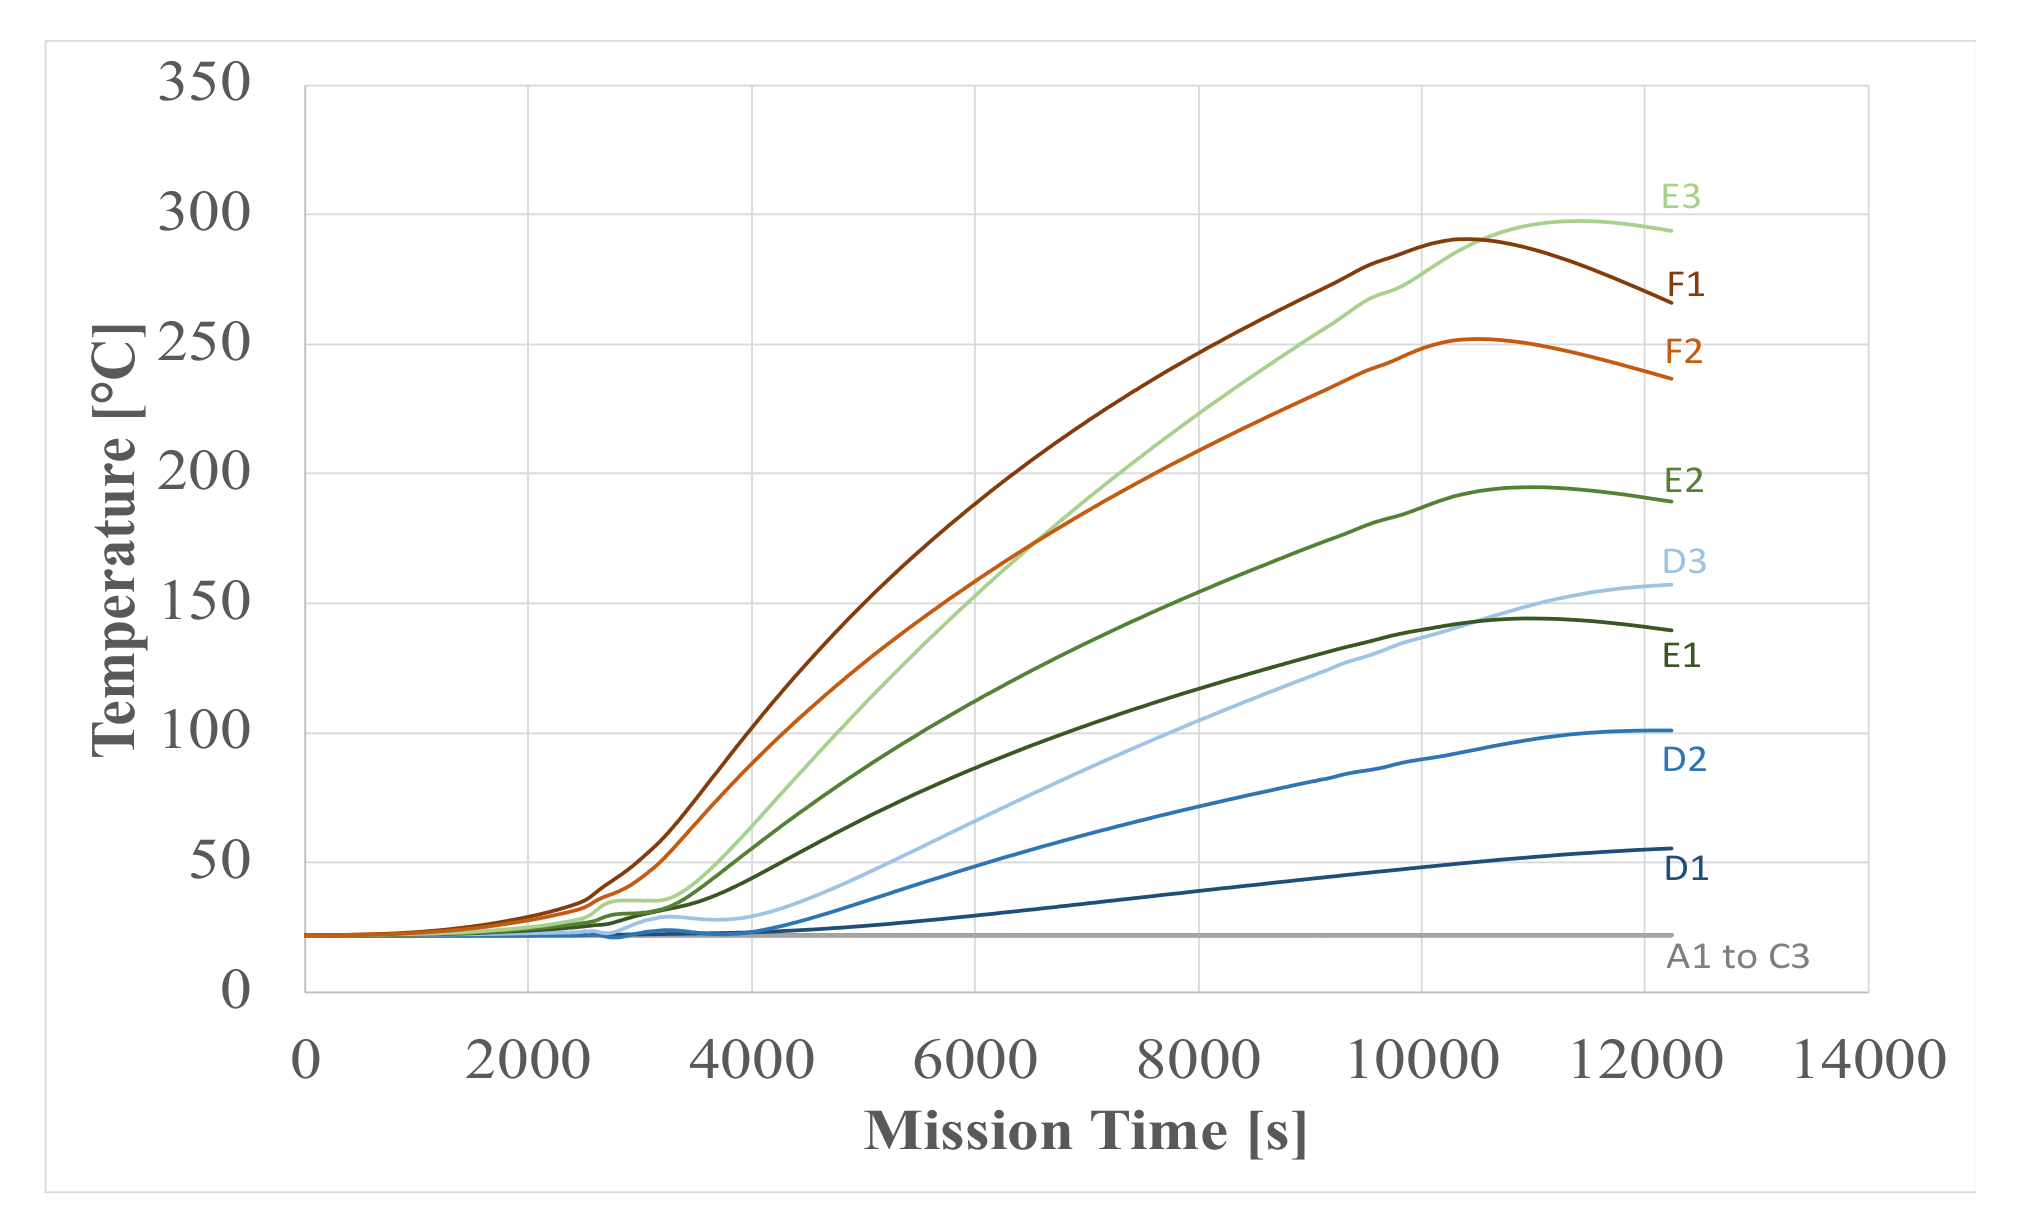
Figure 12). The first set of thermal simulations was carried out to verify a preliminary hypothesis of homogeneous temperature distribution along the cabin wall. These first simulations, even if carried out using a simplified model with no cryogenic tanks onboard, confirmed that the hypothesis was not applicable. The simulations revealed that the maximum average temperatures reached at the top external wall of the cabin exceeded 1000 °C. However, this result has been achieved without considering the integration of the liquid hydrogen tanks and the propellant depletion throughout the mission. Therefore, a second set of simulations with detailed modeling of cryogenic tanks and their internal temperature evolution along the mission (depending on the amount of residual fuel in each of them) was carried out. The results of this final set of simulations are reported in
Figure 13, where it is clearly visible that the last three compartments, located close to the nozzle structure, are those for which the highest temperatures are experienced throughout the reference mission profile. As expected, the highest temperatures were reached when the aircraft was slowing down during the descent phase because of the heat load accumulated during the entire trajectory. However, the maximum pick temperature reached was considerably lower than the one estimated in the first set of simulations. Therefore, it is possible to assert that the massive presence of cryogenic propellant on board can contribute to lower the temperatures inside the vehicle and, consequently, the heat fluxes entering the cabin up to 70%.
Once the temperature profile due to the presence of the engine was known, the thicknesses and conductivities of the layers’ materials of the cabin were assessed to estimate the incoming heat fluxes into the cabin.
As far as the contributions of the other subsystems (
) were concerned, as a rule of thumb, the expected heat loads coming from the subsystems equaled their electric power demand. However, estimations of the
were significantly different for the subsonic and hypersonic aircraft, because of the following reasons: (i) difference between subsonic and hypersonic aircraft in the electric power demand of onboard subsystems; (ii) the expected enhancement in self-contained cooling capabilities of the onboard subsystems in hypersonic aircraft due to the overall vehicle configuration with cryogenic fuel tanks, and (iii) the enhanced cooling performance of the cabin cross-sectional configuration in hypersonic aircraft. Therefore, making benefit of the detailed thermal analysis and simulations performed in the framework of the H2020 STRATOFLY Project, the
values were updated. Specifically, considering that for the MR3, hosting 300 pax, an average electrical power demand of 200 kW for all onboard subsystems other than the cabin was requested, and assuming that the massive presence of cryogenic tanks can lead to a reduction of up to 70%, as a preliminary estimation of the expected heat load acting onto the cabin, the onboard subsystems contribution (
) can be estimated to be 60 kW for a 300 pax aircraft. Complementary, as a first hypothesis, the lateral sides of the cross--section of each cabin compartment were considered isolated from the outside of the cabin thanks to the interface with hydrogen tanks (
Figure 14).
3.2.4. Cabin Wall Modeling and Heat Loads Estimation
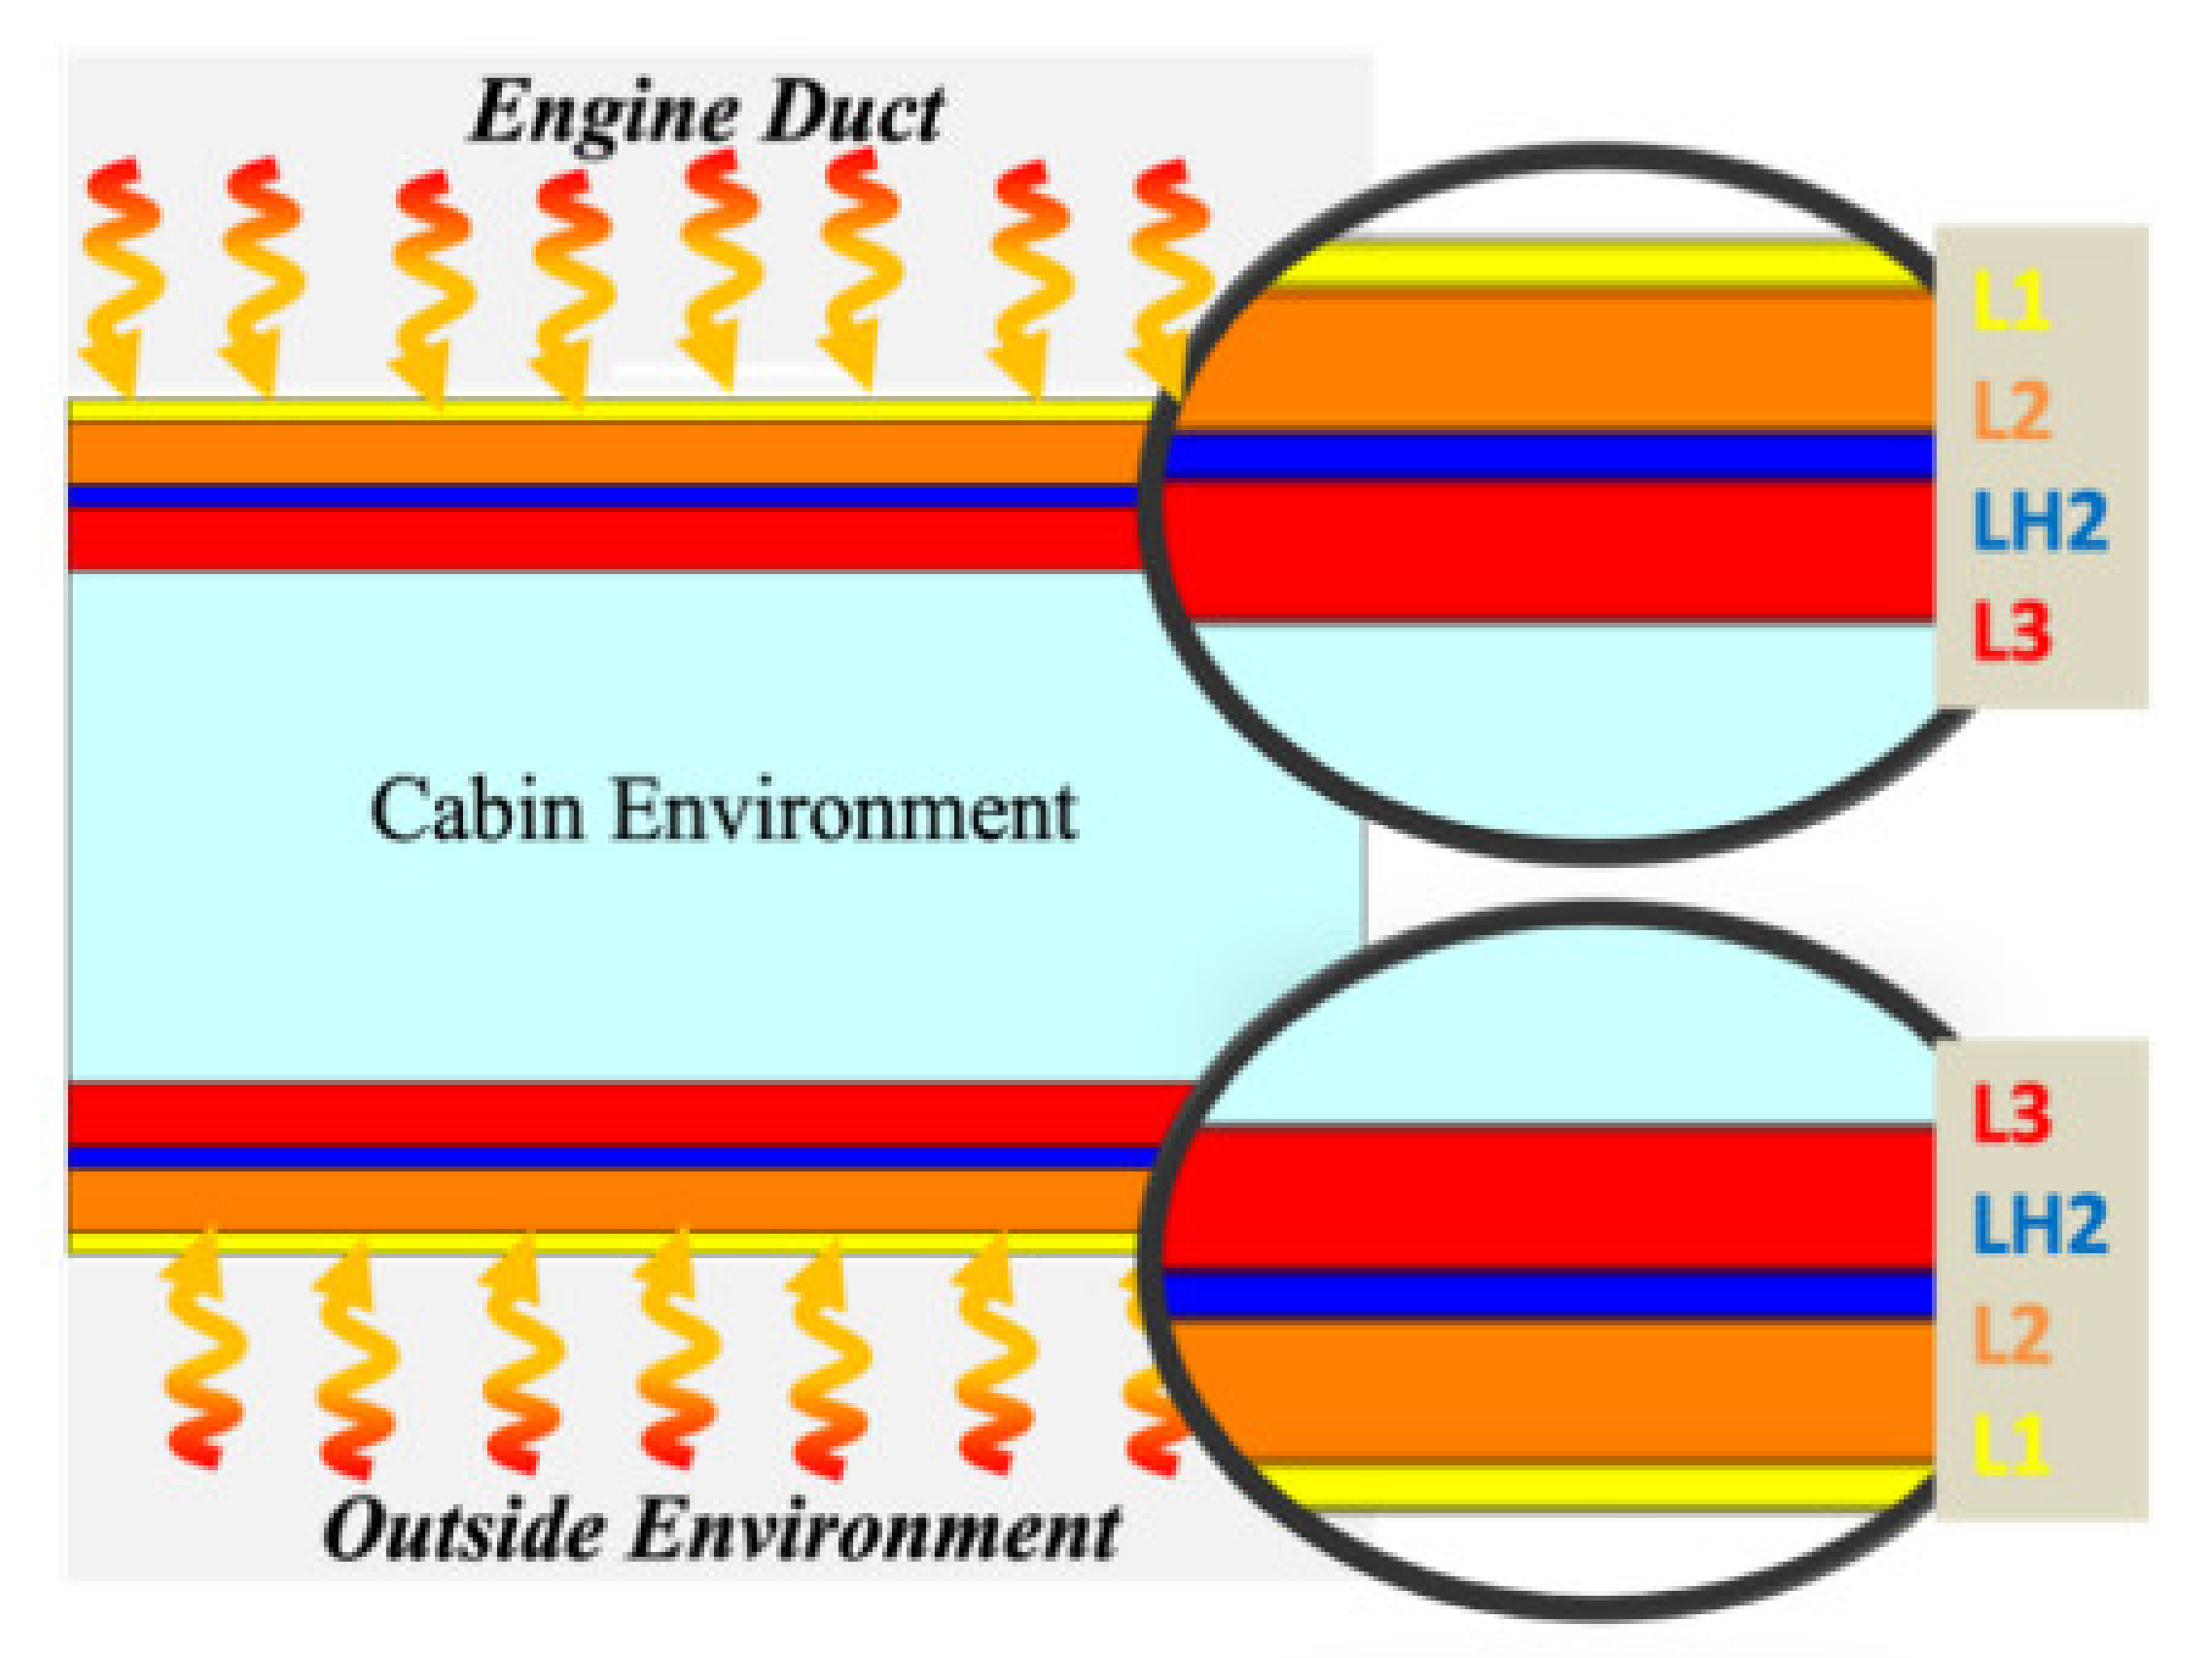
Unlike the lateral sides, the top and the bottom sides of each cabin compartment consist of multiple layers of shell and insulation materials. Both at the top and at the bottom, the sequence of layers from the outside of the cabin to the inside is as follows: CMC (shell, L1), glass fiber (insulation material, L2), boil-off hydrogen/air (insulation material), and glass fiber (insulation material, L3). Thicknesses and conductivities of the layers’ materials of the cabin compartment are reported in
Table 3. Through the layers of CMC and glass fiber conductive heat transfer occurs, whereas through either the layer of boiled-off hydrogen or air convective heat transfer happens, where the fluid flows inside the duct and absorbs a portion of the incoming heat load. The insulation layer of boiled-off hydrogen is an alternative solution to the insulation layer of air [
26]. Six thickness values were investigated for the layer of boiled-off hydrogen, whereas only two (i.e., 40 and 60 mm) were considered for the layer of air. The higher convective heat exchange guaranteed by the boiled-off hydrogen should be traded-off against the most critical materials compatibility and integration issues of hydrogen with respect to air.
Knowing the temperature of the external bottom skin of the cabin (wall temperature), the temperature of the upper external skin of the cabin (engine duct temperature), the additional thermal power provided by the onboard systems, the thermal conductivities, the thicknesses and surfaces of the materials’ layers, and considering as a constraint that the internal temperature of the cabin can vary between 18 and 25 °C, the heat loads acting on the bottom and on the top of the cabin only through conductive transfer were computed, respectively, using Equations (15) and (16) by exploiting the electrical analogy (see also Equation (17)).
The contribution of the insulation layer of boiled-off hydrogen to the estimation of the heat load was modeled as convective heat transfer, considering it as a fluid that flows inside a duct with a constant surface heat flow. The heat absorbed by boiled-off hydrogen through the hydrogen insulation layer was calculated using Equations (18) and (19):
Eventually, the heat loads acting on the bottom and on the top of the cabin through conductive and convective heat transfers are given, respectively, by Equations (20) and (21).
The boiled-off hydrogen density was hypothesized to be equal to , its speed inside the duct ranged between and , and the variation of boiled-off hydrogen temperature inside the duct was assumed to be equal to .
3.2.5. ECS Performance
Once the total heat loads acting on the cabin were computed, the air mass flow, m, that the ECS should provide could be calculated by Equation (2).
Considering that the selected worst-case scenario was the hot case when the vehicle flies at hypersonic speed from Mach 4 to Mach 8 and that the architecture of the ECS was bleed-less, the input values of the temperature and pressure of the air entering the CAU were theoretically those of the ram-air at the inlet combustor ahead of the struts. However, the pressure of the ram-air extracted by the engine inlet duct may still be too low to comply with the requirements at the CAU’s exit of 253 K for the air temperature and 8 × 10
4 Pa (0.8 bar) for the air pressure. In this case, a dedicated auxiliary compressor was integrated ahead of the primary heat exchanger. The ram-air extracted by the engine inlet duct entered first the dedicated auxiliary compressor and then flowed through the CAU (
Figure 9) to finally exit it. By imposing the required output values of air temperature and pressure and knowing the input values of air temperature and pressure in different flight conditions, it was possible to obtain the power supplied by the turbine and the necessary mass flow rate of the refrigerant fluid (boiled-off hydrogen) for the heat exchangers.
To mathematically model the CAU, the air was considered as an ideal gas with the following properties: (i) point molecules with negligible volume; (ii) only elastic collisions; (iii) non-interacting molecules.
Knowing the temperature of the air at the exit of the turbine, the inlet temperature was calculated as follows:
The turbine efficiency,
, was set equal to 0.9, while the turbine expansion ration,
, was 6 [
28]. Knowing the pressure of the air at the exit of the turbine, the inlet pressure was calculated as follows:
The power supplied by the CAU’s turbine could thus be computed:
The mechanical efficiency of the turbine,
, was set equal to 0.9 [
28].
The temperature of the air at the turbine inlet has the same value at the heat exchanger’s exit. The temperature of the air entering the heat exchanger,
T2, is obtained by assuming a mass flow rate of the coolant mean (boiled-off hydrogen) equal to 10% [
24] of the air mass flow:
The specific heat capacity of boiled-off hydrogen, , has been assumed equal to 11,720 , while the temperature of the boiled-off hydrogen entering the heat exchanger, , has been hypothesized equal to 30 K and that one exiting the heat exchanger, , equal to 100 K.
The pressure of the air entering the heat exchanger in the same section is obtained by assuming a typical value of 3% of leakage6 to estimate the pressure drop of the air through the heat exchanger:
The temperature of the air entering the secondary heat exchanger is the same as the temperature of the air exiting the compressor. The temperature of the air entering the CAU’s compressor can thus be computed as follows:
The compressor efficiency,
, has been set equal to 0.85. The pressure of the air entering the compressor is expressed by Equation (28):
The power required by the CAU’s compressor can thus be computed:
Knowing the temperature of the air at the auxiliary compressor inlet, T
0, i.e., the temperature of the ram-air extracted from the engine air inlet, and the temperature of the air entering the CAU, the mass flow of the boiled-off hydrogen, as coolant mean of the first exchanger of the CAU, is calculated as follows:
The temperatures of the boil-off hydrogen entering and exiting the primary heat exchanger were hypothesized to be equal to the values of the secondary heat exchanger.
Knowing the flight conditions and the overall vehicle layout, the process starts from the definition of the cabin requirements in terms of temperature and minimum air mass flow. Subsequently, the temperature of the external wall of the aircraft is determined by means of convective–radiative–conductive heat transfer balance. Then, once the geometric dimensions of the cabin are known, intrinsic properties, such as thicknesses and thermal conductivities, are hypothesized. This allows to determine the incoming heat flux and the subtractive heat flux due to the convective insulation layer. Consequently, the air mass flow that the ECS should supply to meet the requirements is calculated. In the case the air mass flow is lower than the minimum value prescribed by CS-25, it is necessary to recalculate it by modifying the convective insulation layer’ thickness. Otherwise, knowing the required air mass flow, the power demand of the CAU can be estimated. The air temperature and pressure conditions at the exit of the turbine of the CAU are known, as well as the input values of the ram-air extracted by the engine inlet duct. The process to size the power to drive the compressor and the power available at the turbine can thus be completed. If the estimated air pressure entering the CAU, P1, is lower than that the pressure of the ram-air extracted by the engine inlet duct, P0, an auxiliary compressor is required.
4. Application to the Case Study and Discussion of the Results
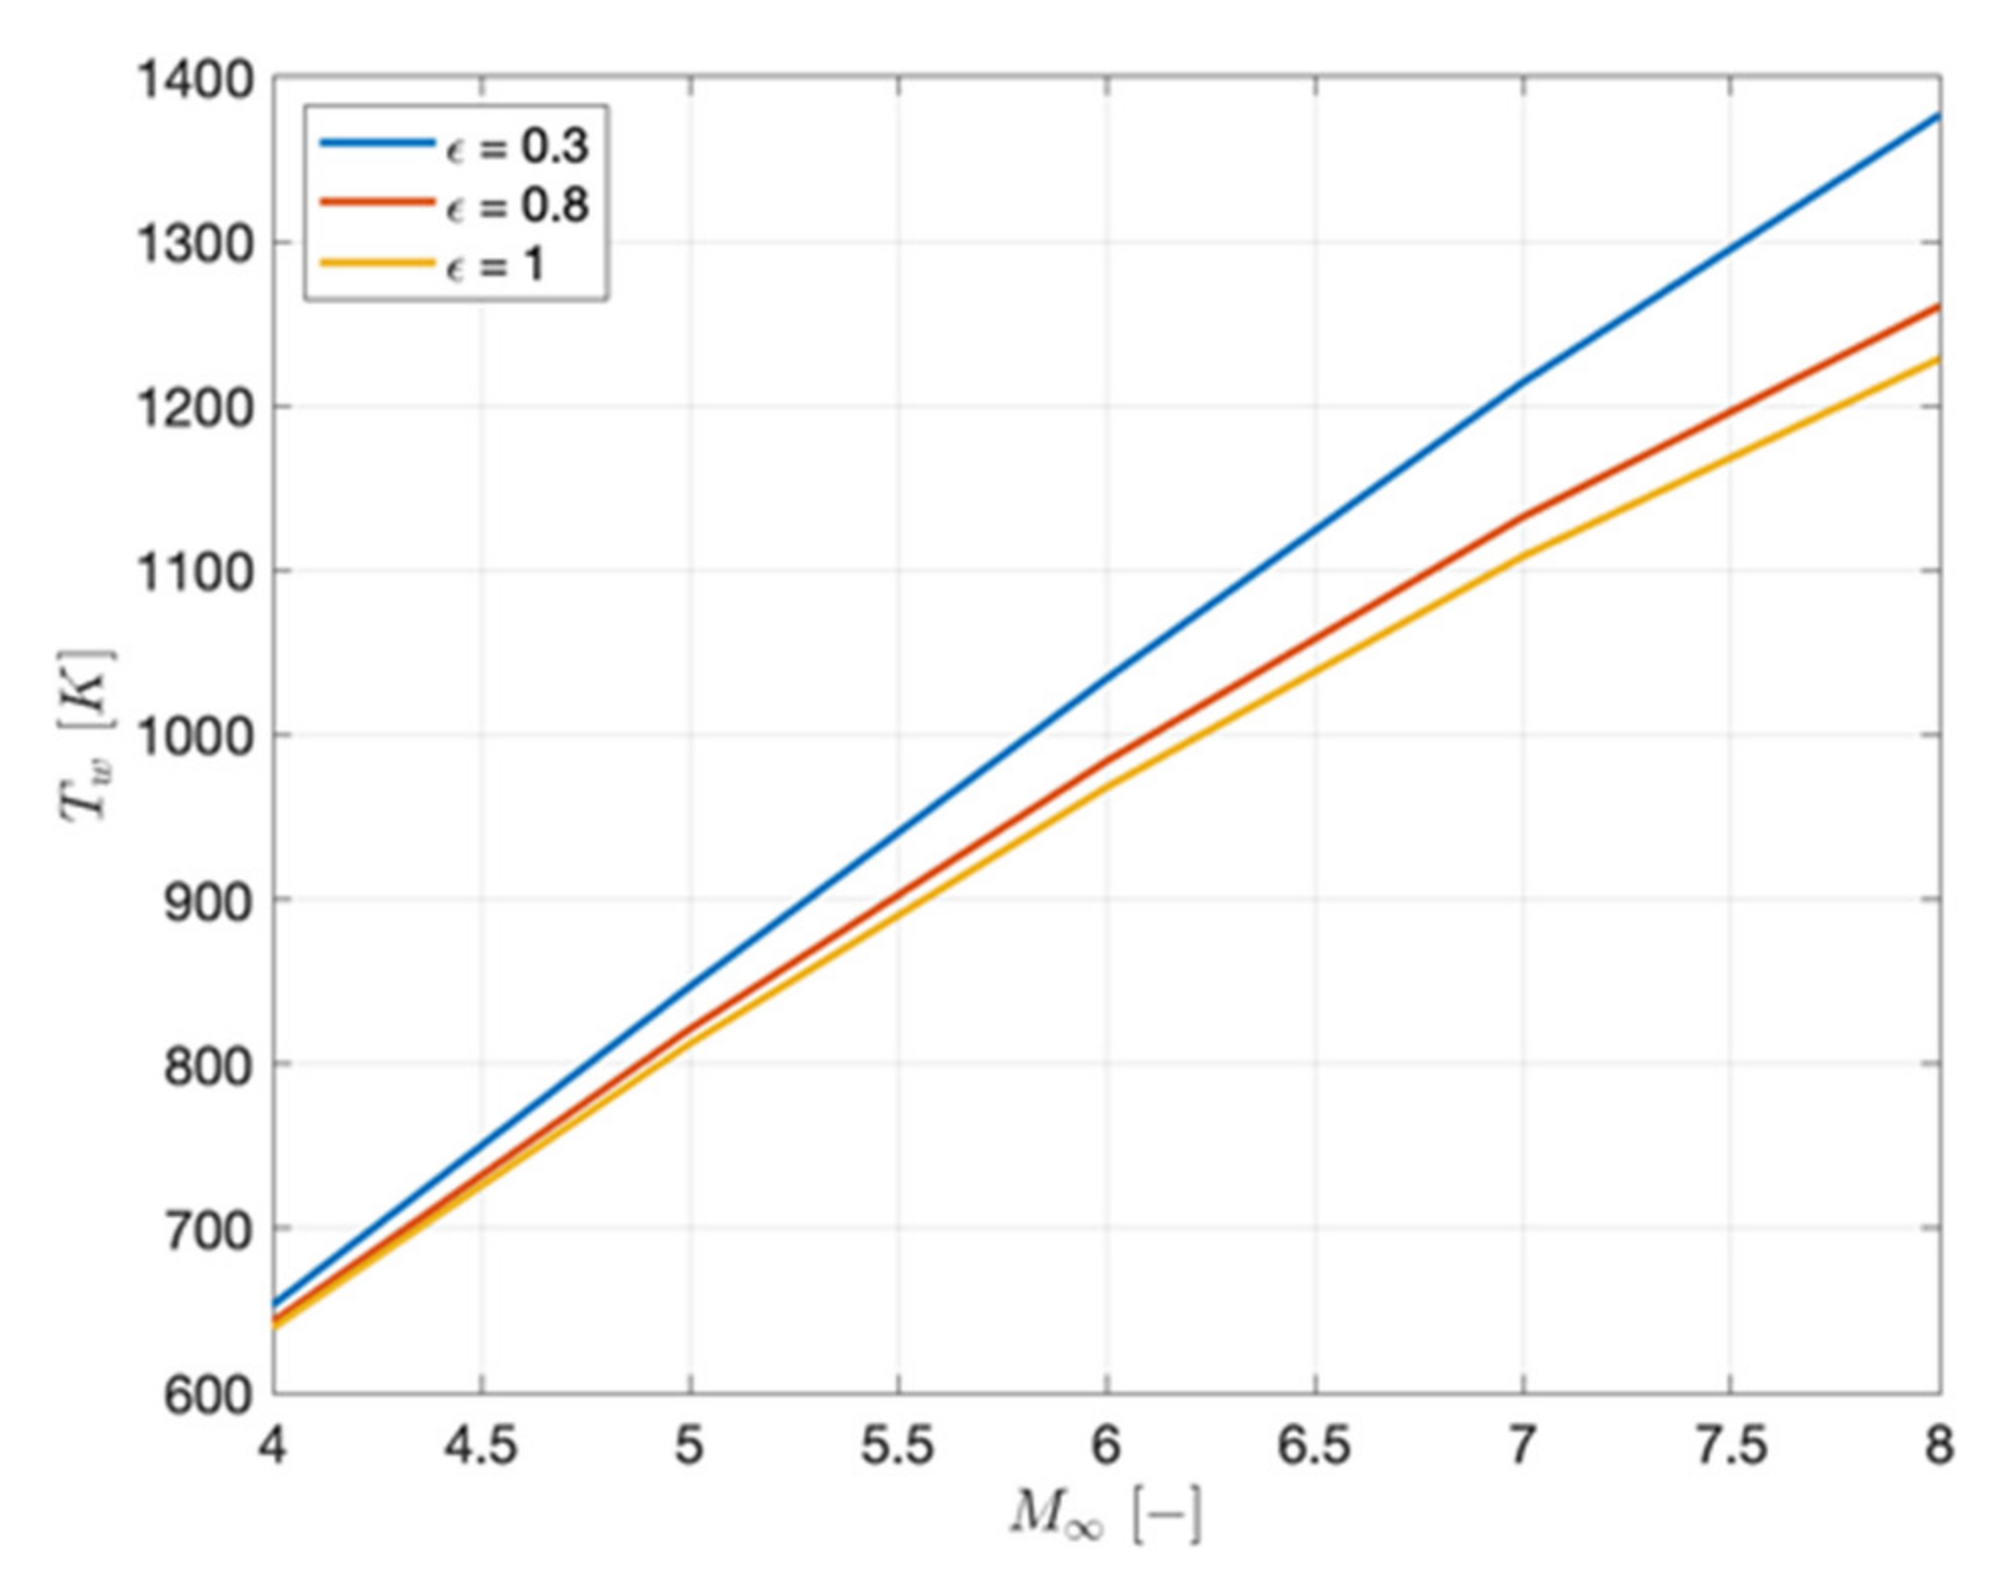
The equilibrium equation (Equation (4)) was solved, and the wall temperature was plotted as a function of Mach number for three different emissivity values (
Figure 15). If ceramic matrix composite materials (
ε = 0.8) were considered, the wall temperature remained below 1300 K for all Mach numbers.
The wall temperature and the recovery temperature for each Mach number of the hypersonic field are reported in
Table 4.
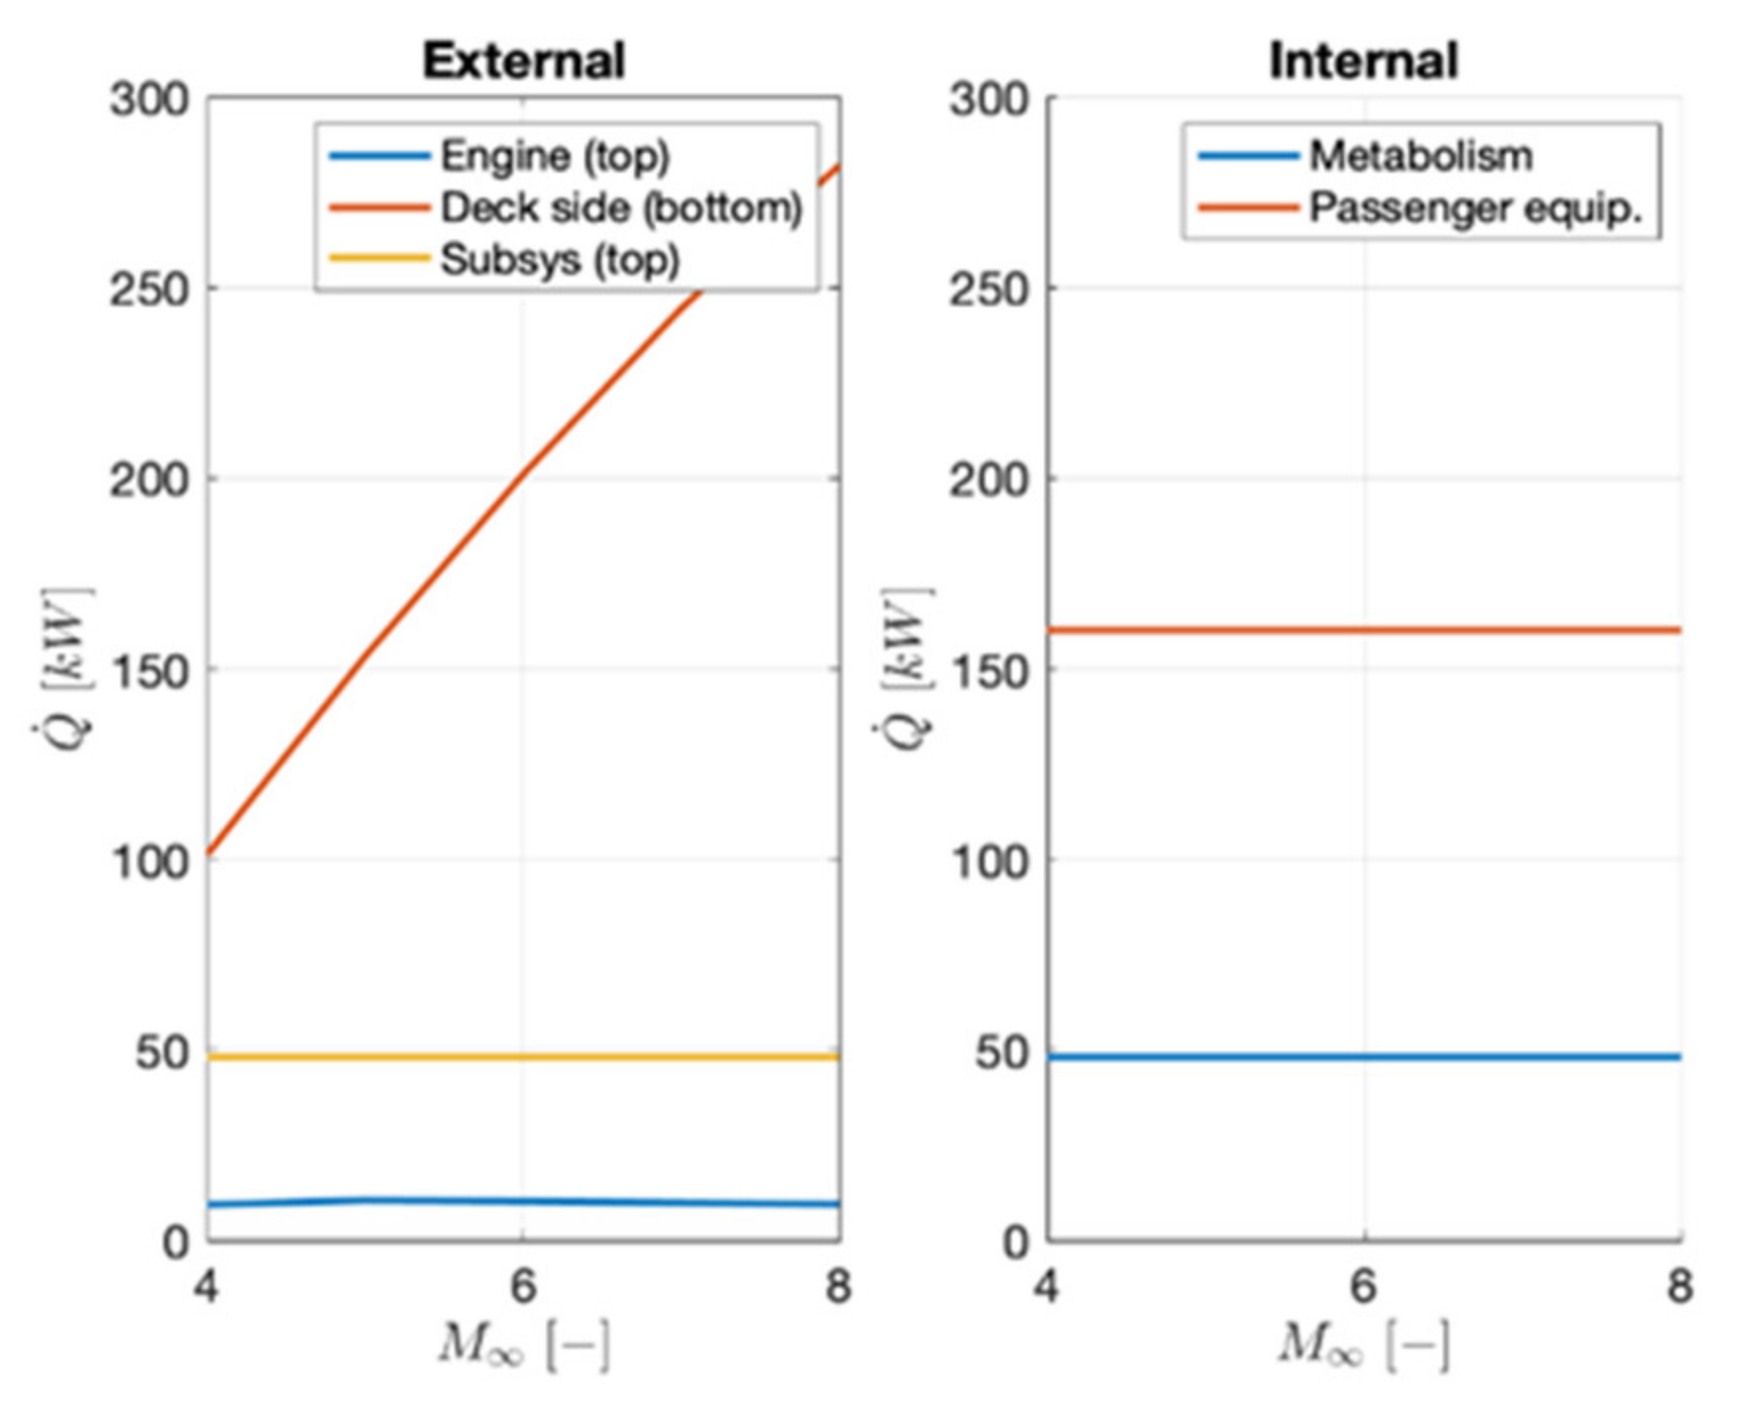
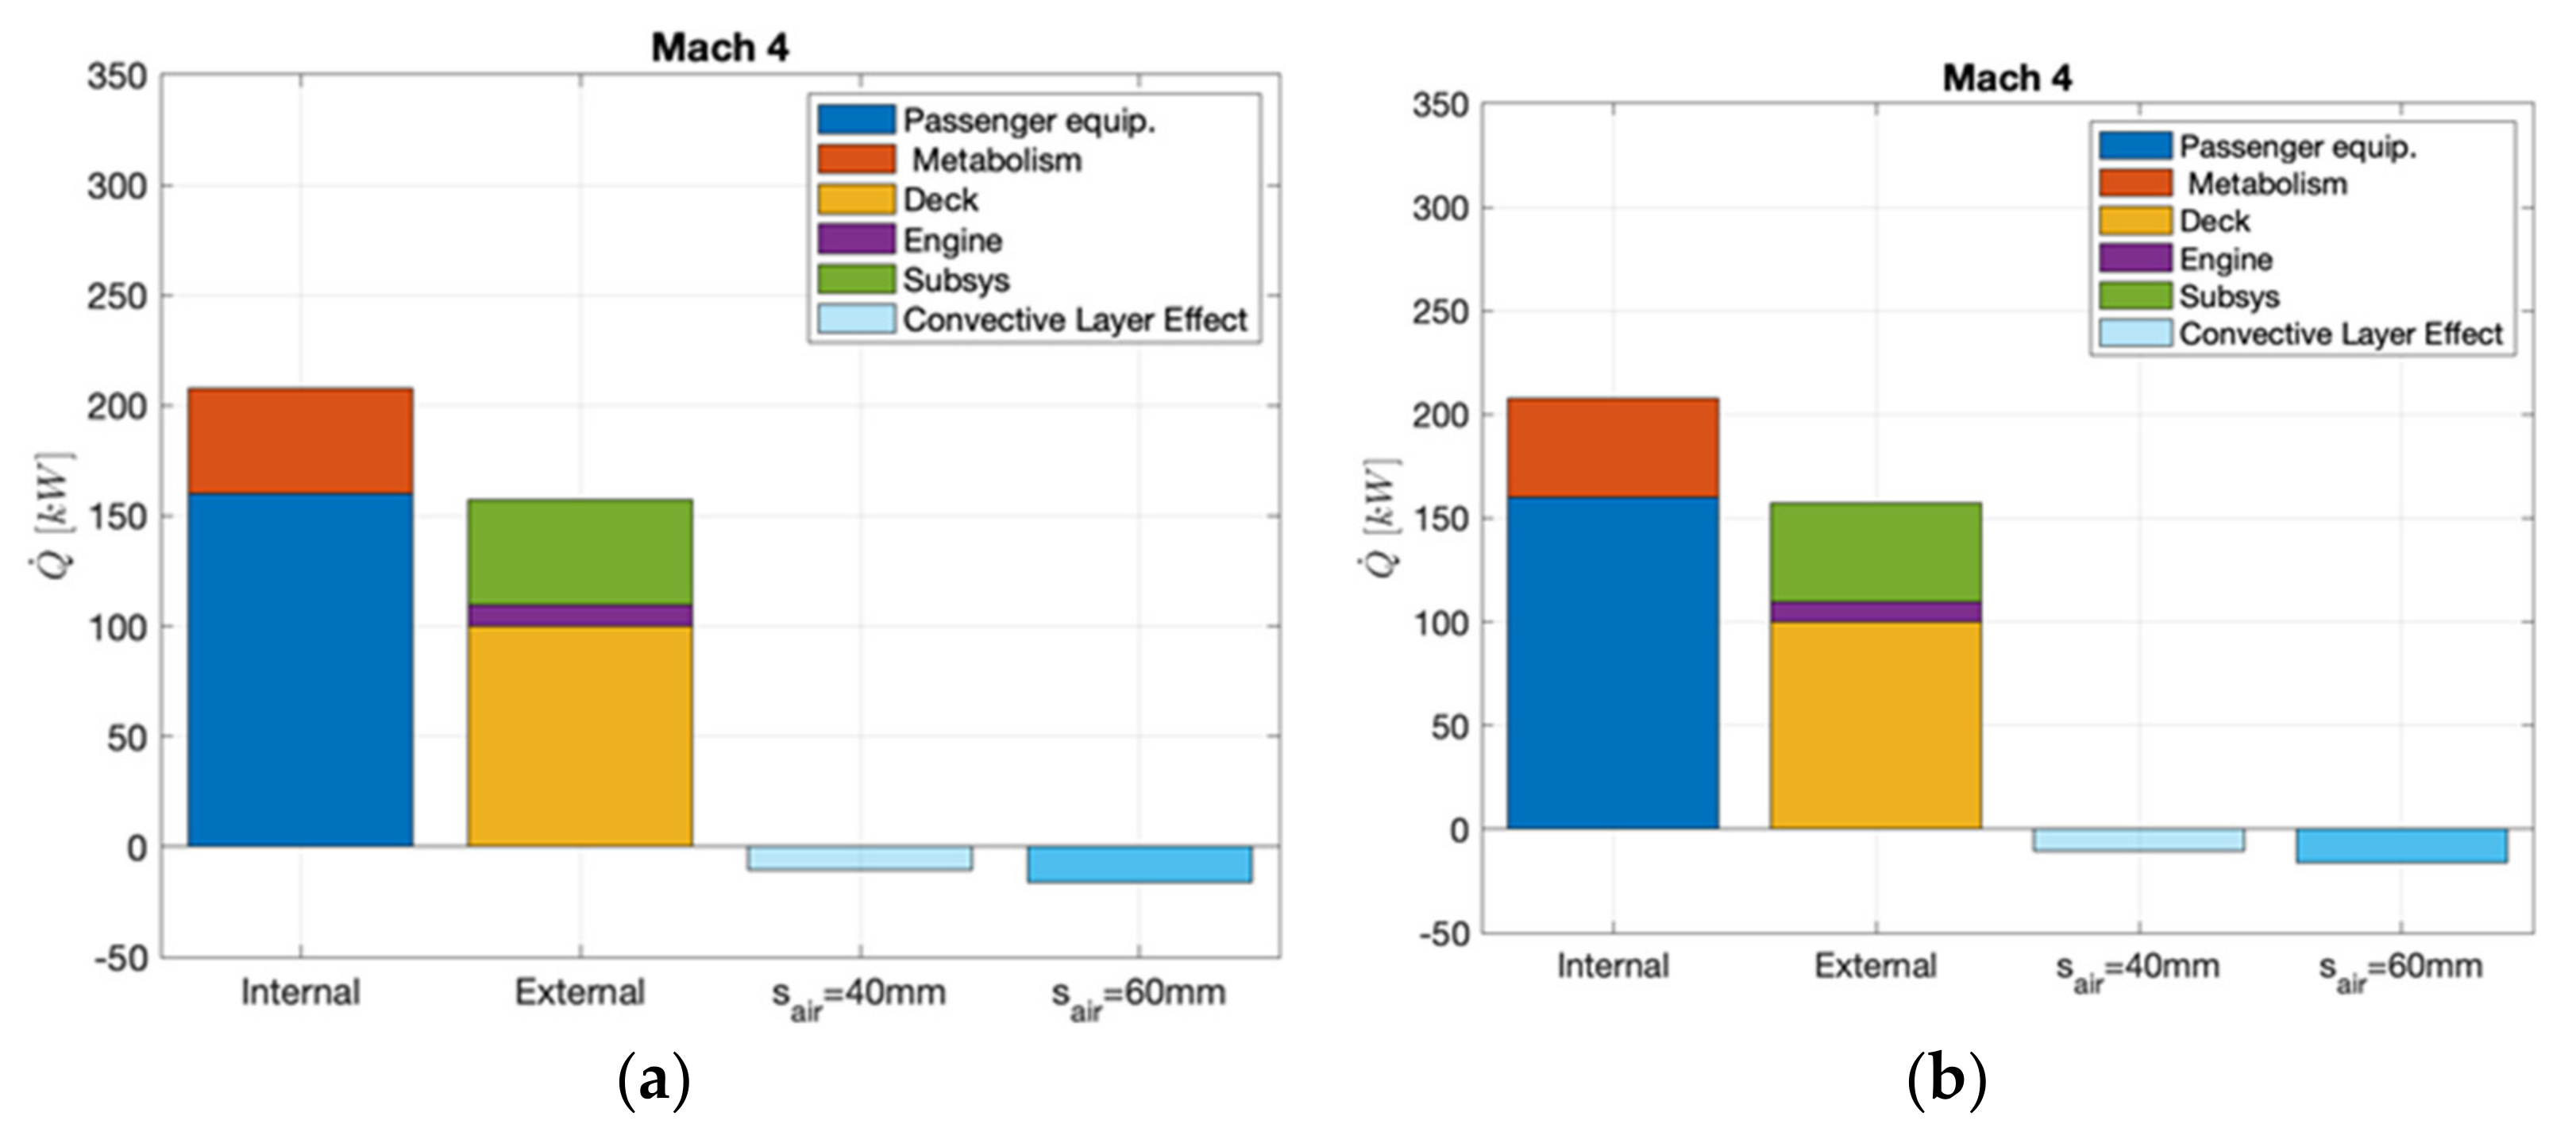
The heat loads acting on or inside the cabin (external heat load acting on the external skin, internal heat load generated inside the cabin, and internal heat load acting on the external skin of the cabin) are shown in
Figure 16. External heat loads acting on the external skin of the cabin (“deck side” in the legend of
Figure 16) increased with the Mach number as the wall temperature increased. Internal heat loads acting on the external skin of the cabin due to the propulsive compartment (“engine” in the legend of
Figure 16) increased as well with the Mach number. Conversely, the contribution to the internal heat loads acting on the external skin of the cabin due to the onboard systems and internal heat loads generated inside the cabin did not depend on the Mach number.
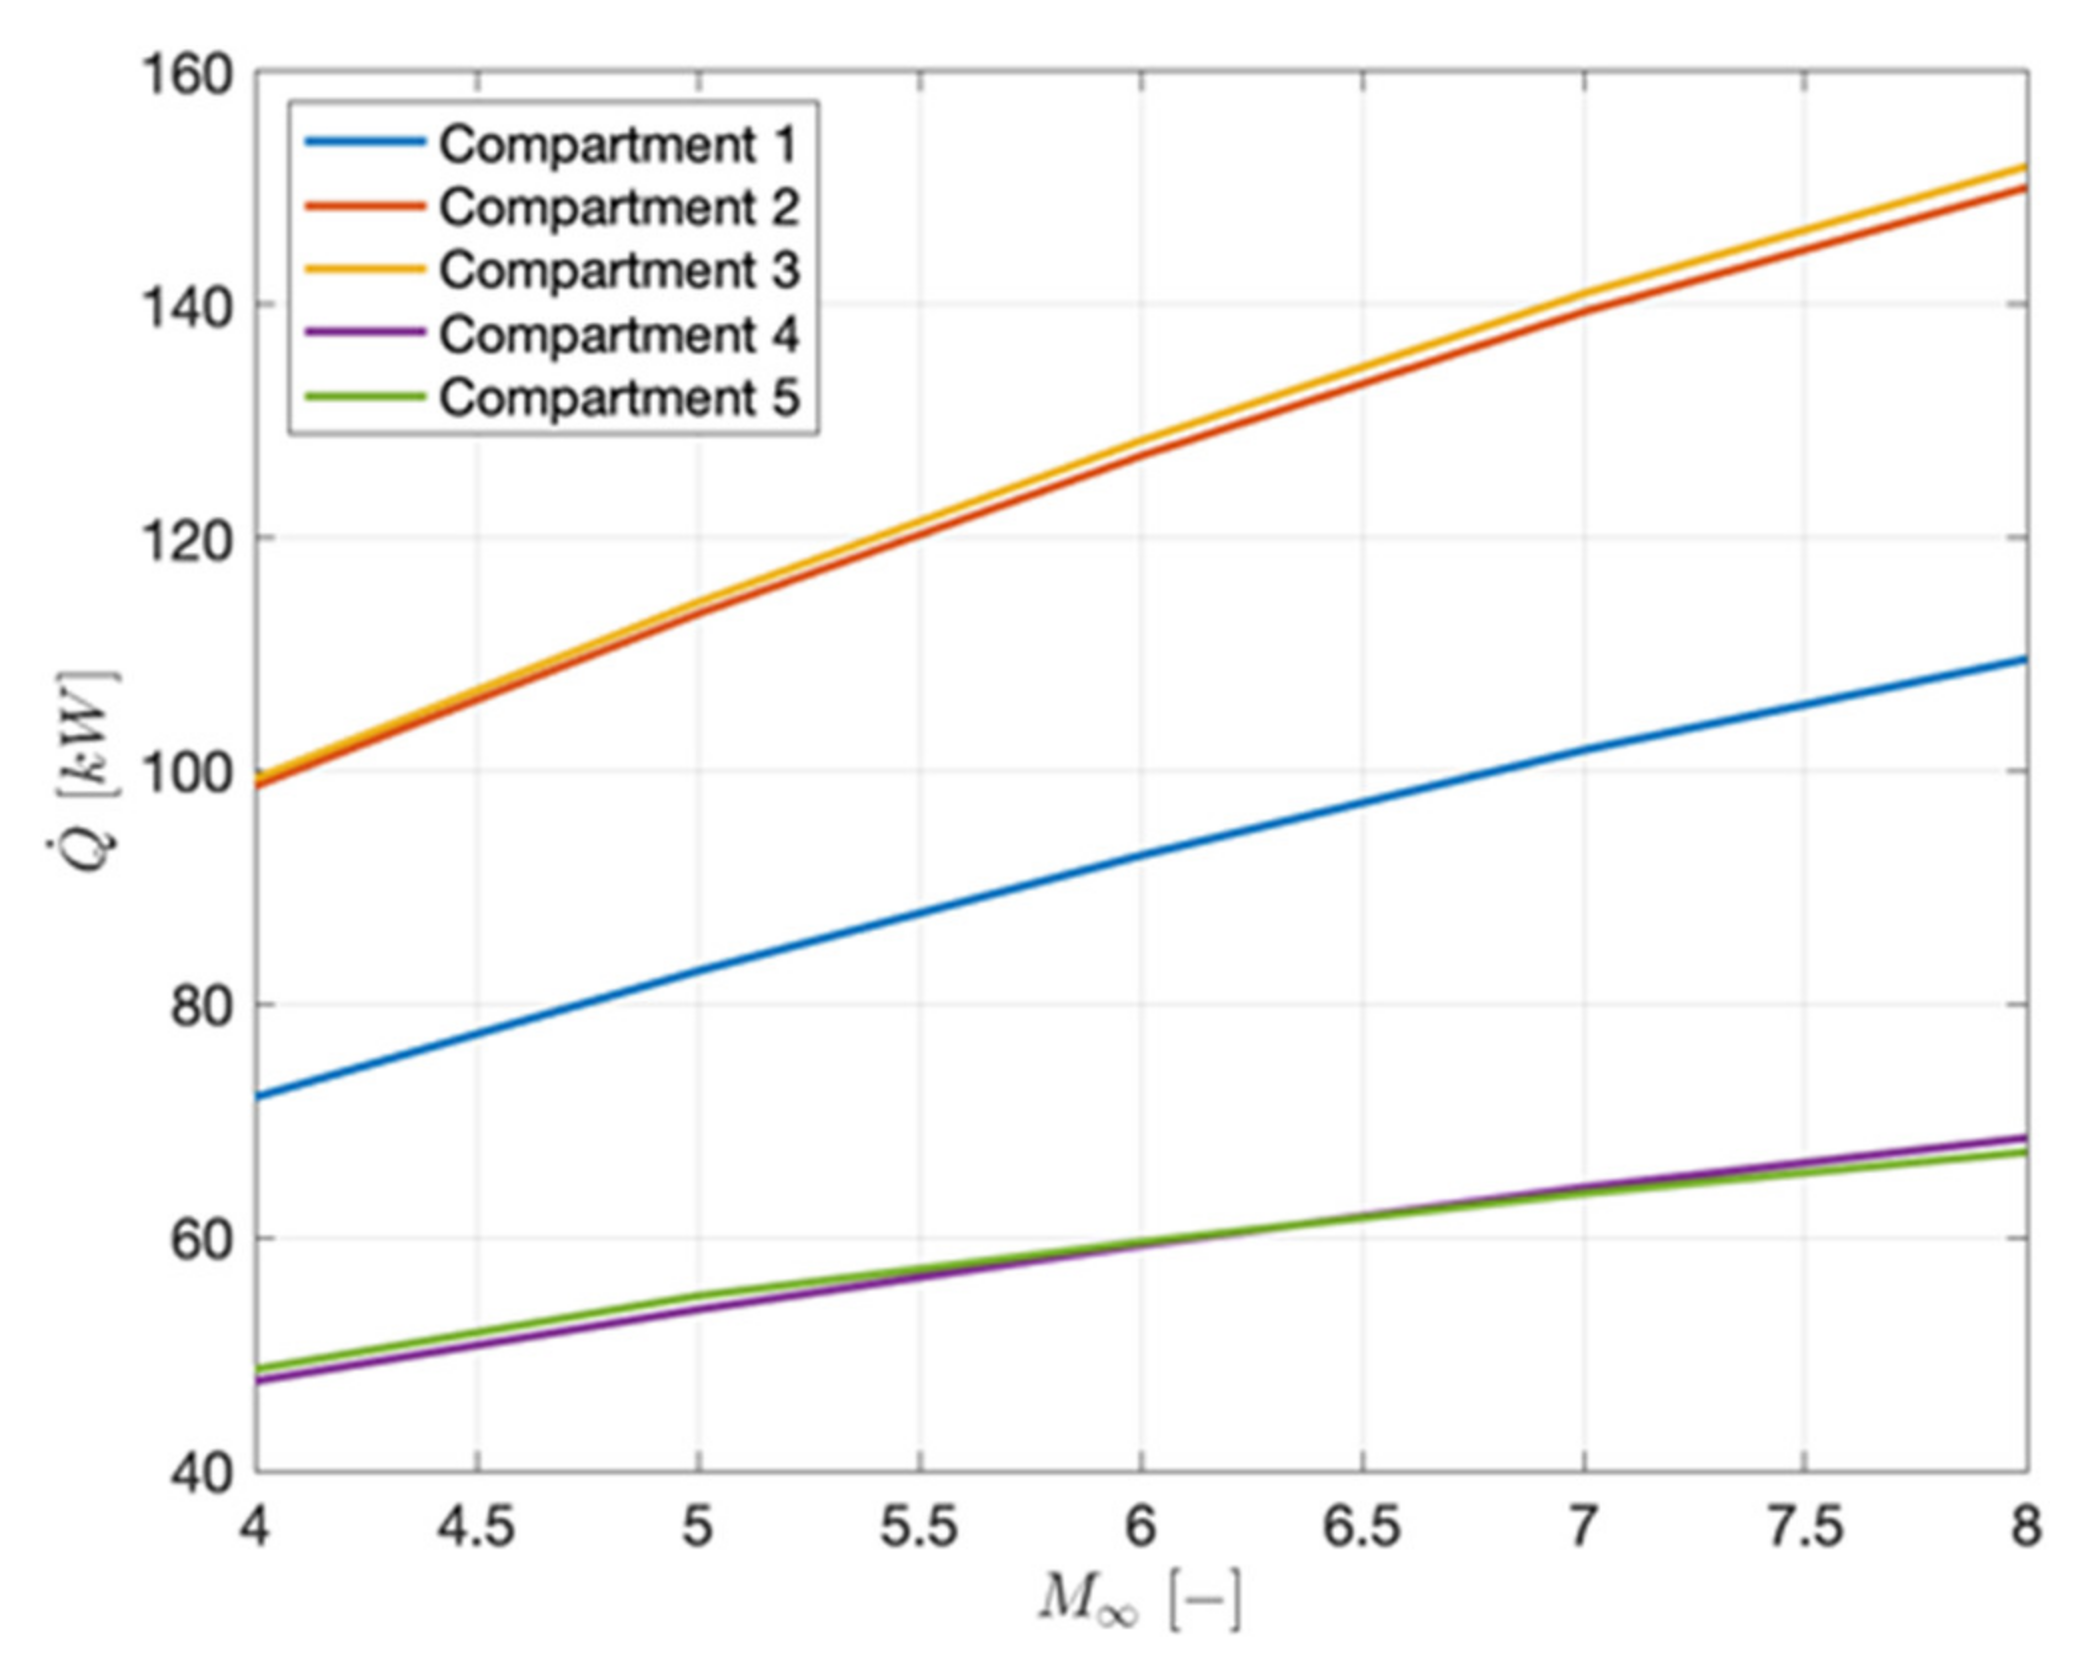
Figure 17 depicts the variation of the heat loads with the Mach number and cabin compartments. Heat loads were here calculated for the fixed values of thickness and speed of the boil-off hydrogen insulation layer. Specifically, the thickness of 2 mm and the speed of 70 m/s were considered (
Figure 16 and
Figure 17). Total heat loads were higher for compartment number two and compartment number three, if compared to the other cabin compartments, because the surfaces at the top and the bottom of compartments two and three were bigger, thus leading to higher external heat loads (Equation (15)) and internal heat loads acting on the external skin of the cabin (Equation (16)). In addition, compartment number two and compartment number three had the highest number of passengers with respect to the remaining cabin compartments, thus implying also higher internal heat loads.
Sensitivity analyses were performed to understand the impact of the fluid of the convective insulation layer (boil-off hydrogen and air) and the thickness and the speed of the convective insulation layer onto the heat loads.
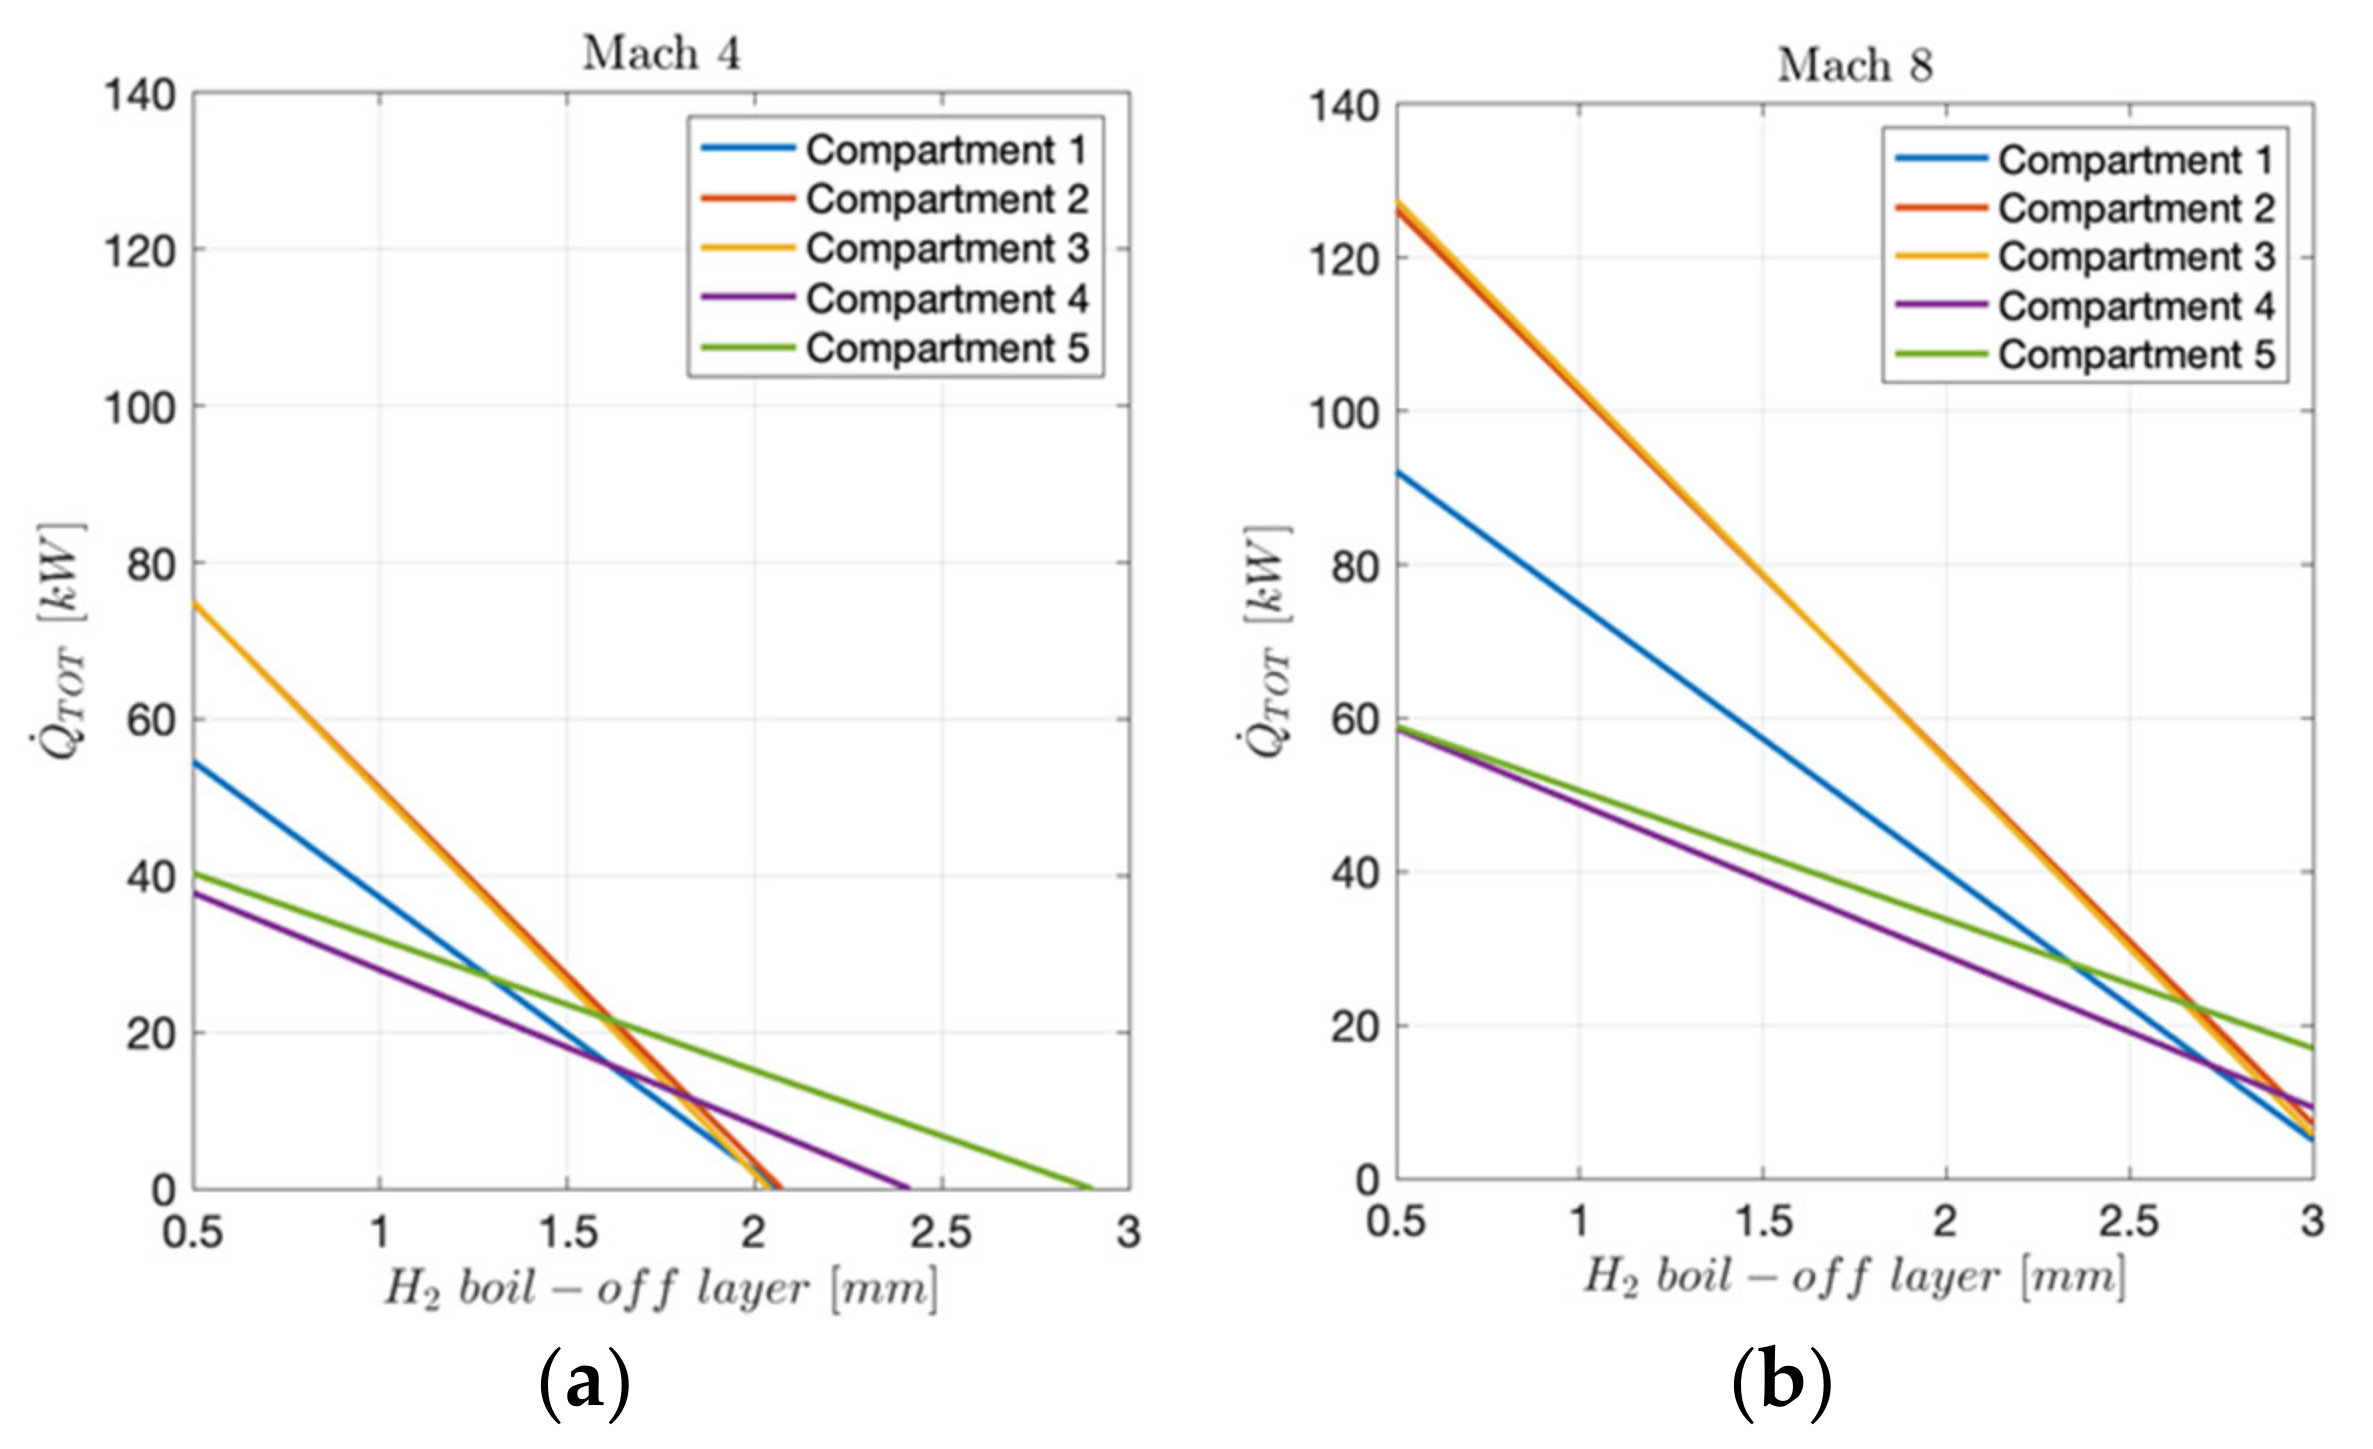
Figure 18a,b depict, respectively, the variation of total heat loads with the thickness of boil-off hydrogen insulation layer for the different cabin compartments at Mach 4 and at Mach 8 flight conditions. The results reveal that total heat loads were generally higher for compartments number two and number three of the cabin as previously highlighted (
Figure 17). However, the impact of the thickness of the hydrogen boil-off insulation layer was significant: the bigger the thickness of the hydrogen insulation layer, the lower the total heat loads, but the correlation was not the same for all cabin compartments with the curves for compartments number two and number three being steeper than those of the remaining compartments because of their bigger exchange surfaces. This lead to the lowest values of total heat loads for compartments number two and number three, if compared to the other cabin compartments, for thicknesses of the hydrogen layer above 2 mm at low hypersonic speeds. It is worth remembering that the high dependency of the heat loads on the thickness of the hydrogen layer was only due to the influence of thickness on the external heat load acting on the cabin and the internal heat load acting on the external skin of the cabin. In
Figure 18a,b, the speed of boil-off hydrogen was considered fixed and equal to 70 m/s as a conservative hypothesis.
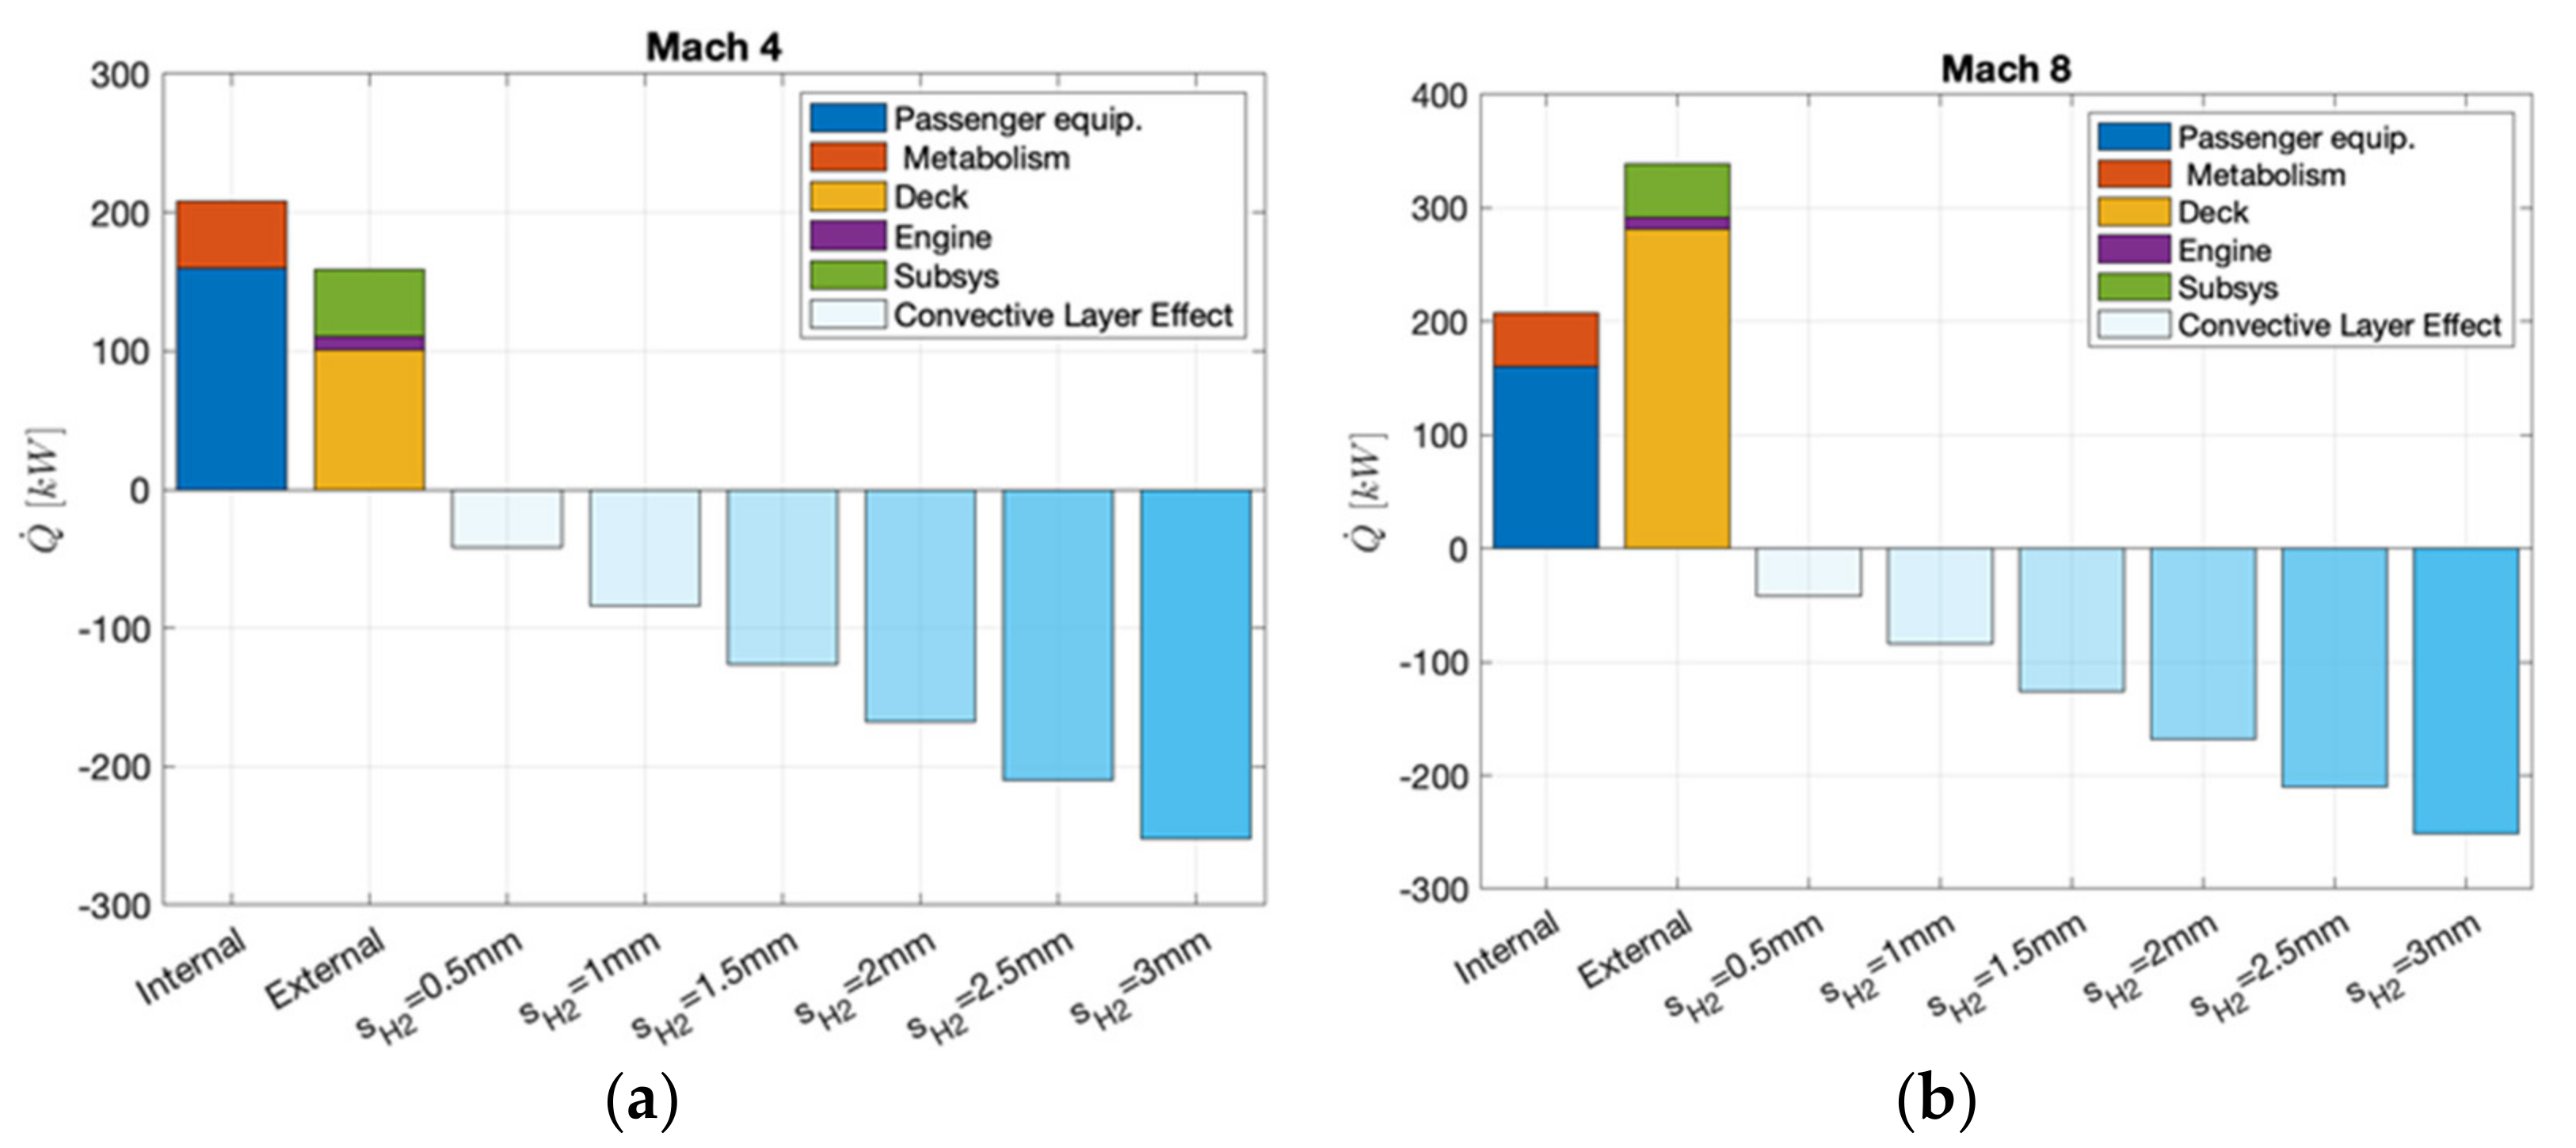
Eventually,
Figure 19a,b summarize the results of the sensitivity analysis on the thickness of the boil-off hydrogen convective layer, comparing the internal and external heat loads acting on the cabin with the subtractive heat loads provided by the boil-off hydrogen layer surrounding the cabin’s inner wall.
It is worth remembering that the enhancement of the cooling performance due to the increase in the convective layer’s thickness should be traded off against the increase in overall aircraft mass and, consequently, thrust requirements.
As anticipated, another solution, envisaging air as a fluid of the convective insulation layer was thoroughly analyzed, and the results compared those obtained with boil-off hydrogen. To properly select the thicknesses of the convective layer and the re-circulation speed of the air in the channel, the same mass flow of the fluid was considered (see Equation (31)):
where
and
are, respectively, the density of the boil-off hydrogen and of the air in (kg/m
3),
and
are their speeds (m/s), and
and
are the cross-sectional areas of the convective channel. Considering that the area of the channel was schematically represented as a simple rectangular shape and assuming the same width of the cross-section (approximately the cabin compartment width), Equation (31) can be rewritten as follows:
An alternative solution to the convective insulation layer of boil-off hydrogen may thus be a 60 mm thick convective layer, filled with air re-circulating at 0.7 m/s, reaching a mass flow of 0.5 kg/s (i.e., the same mass flow value obtained with a 2 mm thick convective layer of boil-off hydrogen flowing at 70 m/s).
The results show that compartments number two and number three are always those that experience the highest heat loads both at low and high Mach numbers of the hypersonic speed regime, if compared to the other cabin compartments. However, the change of fluid for the convective insulation layer revealed that the impact of the thickness of the layer for the air was almost negligible onto the heat loads. In fact, while for the boil-off hydrogen insulation layer, an increase of 1 cm of thickness implied a decrease of approximately 100 kW of heat loads, thanks to the high efficiency of the fluid; for the air insulation layer, an increase of 10 cm of thickness allowed for a decrease of less than 5 kW of heat loads.
Figure 20a,b illustrate the sensitivity of the heat loads absorbed by the fluid (hydrogen boil-off in
Figure 20a and air in
Figure 20b) with respect to the thickness of the convective insulation layer and the speed of the fluid. The results show that, as already noticed for the overall heat loads, the effect of the insulation layer’s thickness was significant on the heat loads absorbed by the boil-off hydrogen and negligible on the heat loads absorbed by the air. This is evident at low speeds of the fluid. As the speed values increased, the convective heat exchange guaranteed by the boil-off hydrogen layer and the air improved, but the general tendency was confirmed: an augment of 1 mm of thickness allowed for hundreds of kW of heat loads absorption for the hydrogen boil-off, while only for less than 5 kW for the air.
The air mass flow that the ECS should supply was computed using Equation (2).
Figure 21a–c show the variation of the request of total air mass flow for the aircraft with Mach number, whereas
Figure 22a–c depict the variation of the request of total air mass flow per cabin compartment with Mach number. Three values of thickness of the boil-off hydrogen insulation layer (i.e., 0.5, 2, and 3 mm) were selected and analyzed. The speed of the fluid was set equal to 70 m/s as a conservative hypothesis.
Figure 21 and
Figure 22 clearly show how the air mass flow rate required to cool down the cabin decreased as the thickness of the boil-off hydrogen insulation layer increased. As highlighted in
Figure 18a, as the thickness of the boil-off hydrogen increased above 1.5 mm, the heat loads acting on compartments number two and number three were lower than those acting on the other cabin compartments for low Mach numbers, thanks to the bigger exchange surfaces of compartments number two and number three. Consequently, the air mass flow that the ECS should supply to cool down the cabin had the lowest value in this condition for compartments number two and number three.
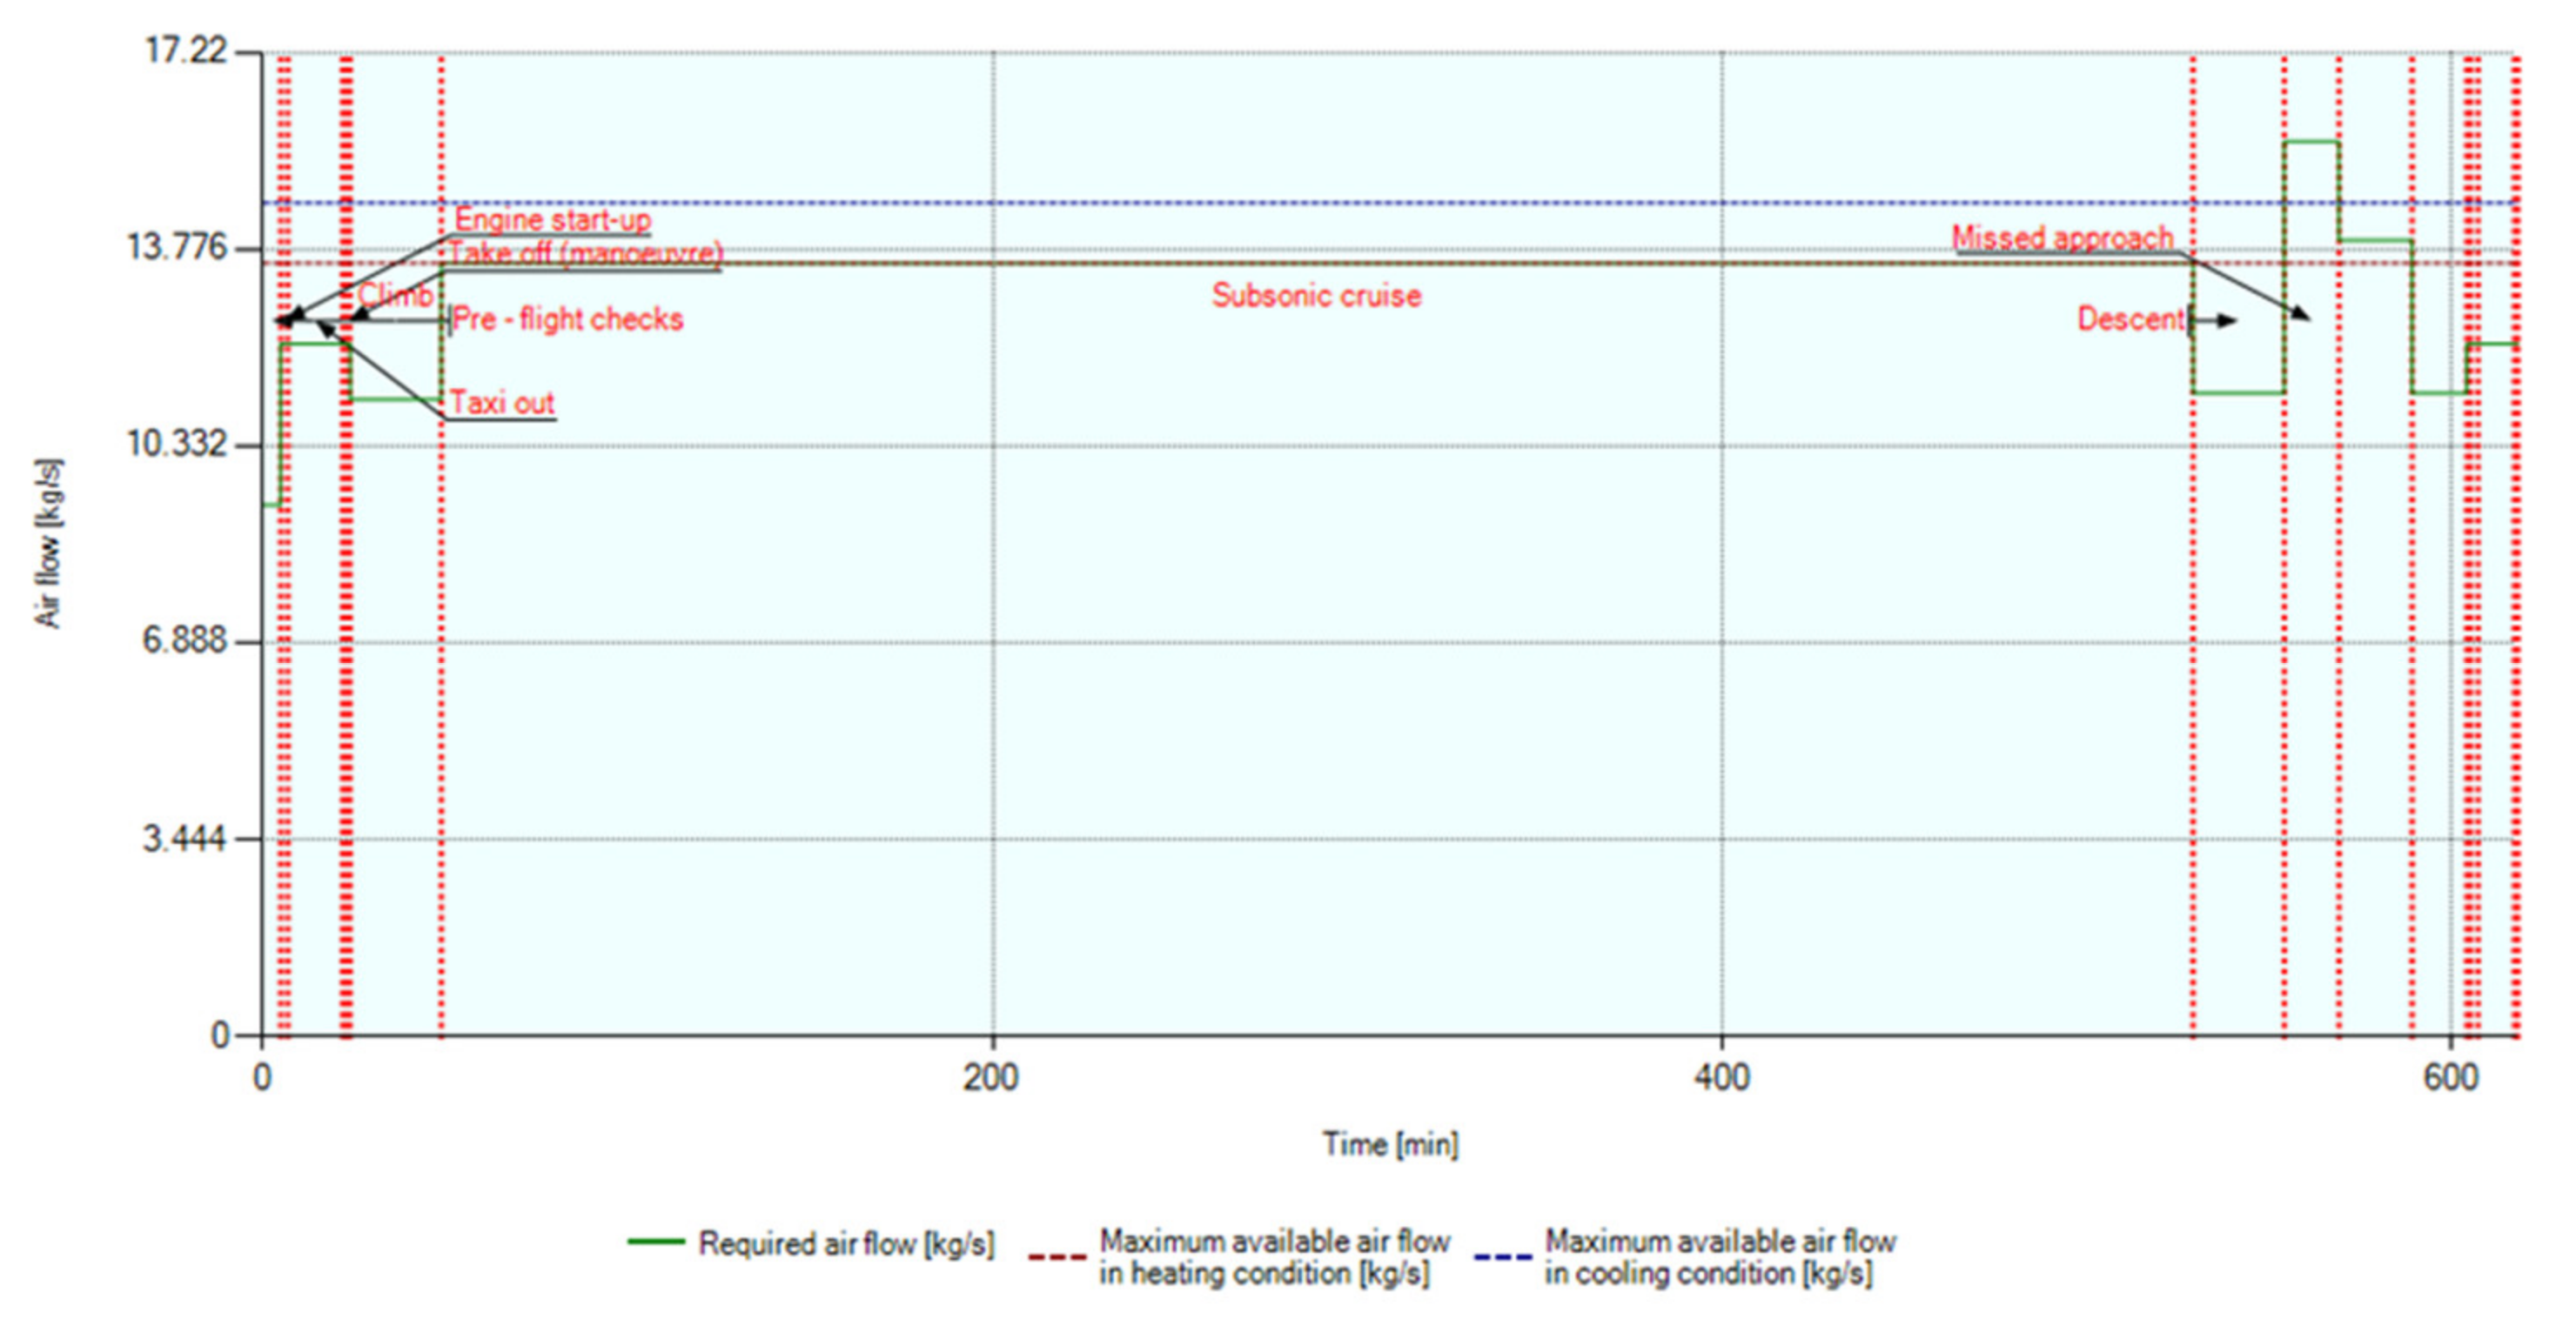
It is worth noting that the air mass flow required was higher than the minimum quantity recommended by CS-25, that is . Typical air mass flow provided by ECS through the engine bleed for a wide body aircraft was 10–20 kg/s. These values are in line with those obtained with 2 mm of thickness of the boil-off hydrogen insulation layer, which can thus be selected as the thickness’s value.
For comparisons,
Figure 23 refers to A380 ECS air flow requirements for different mission phases [
29].
Figure 24a,b show the variation with the Mach number of the air mass flow that the ECS should supply to the cabin and to the single compartments, in the case that the air is the fluid of the convective insulation layer. The results revealed that the air mass flow that should be provided by the ECS was higher than the typical values expected for a wide body subsonic aircraft, considering the maximum thickness of 60 mm for the insulation layer and a speed of 0.2 m/sec for the fluid.
Eventually,
Figure 25a,b summarize the results of the sensitivity analysis on the thickness of the air convective insulation layer, comparing the internal and external heat loads acting on the cabin with the subtractive heat loads provided by the air layer surrounding the cabin inner wall. This has led to the conclusion that the boil-off hydrogen should be chosen as the preferable fluid for the convective insulation layer, both for its higher convective heat exchange performance and for the more compact cross-sectional configuration of the cabin, notwithstanding the issues of materials compatibility.
Knowing the required air mass flow, it is possible to estimate the available power from the CAU’s turbine to drive the CAU’s compressor. The pressure and temperature values of the ram-air extracted from the engine air inlet at pre-combustion conditions for Mach numbers ranging from 4 to 8 are reported
Table 5. These values are inputs for the calculation of power supplied by the turbine.
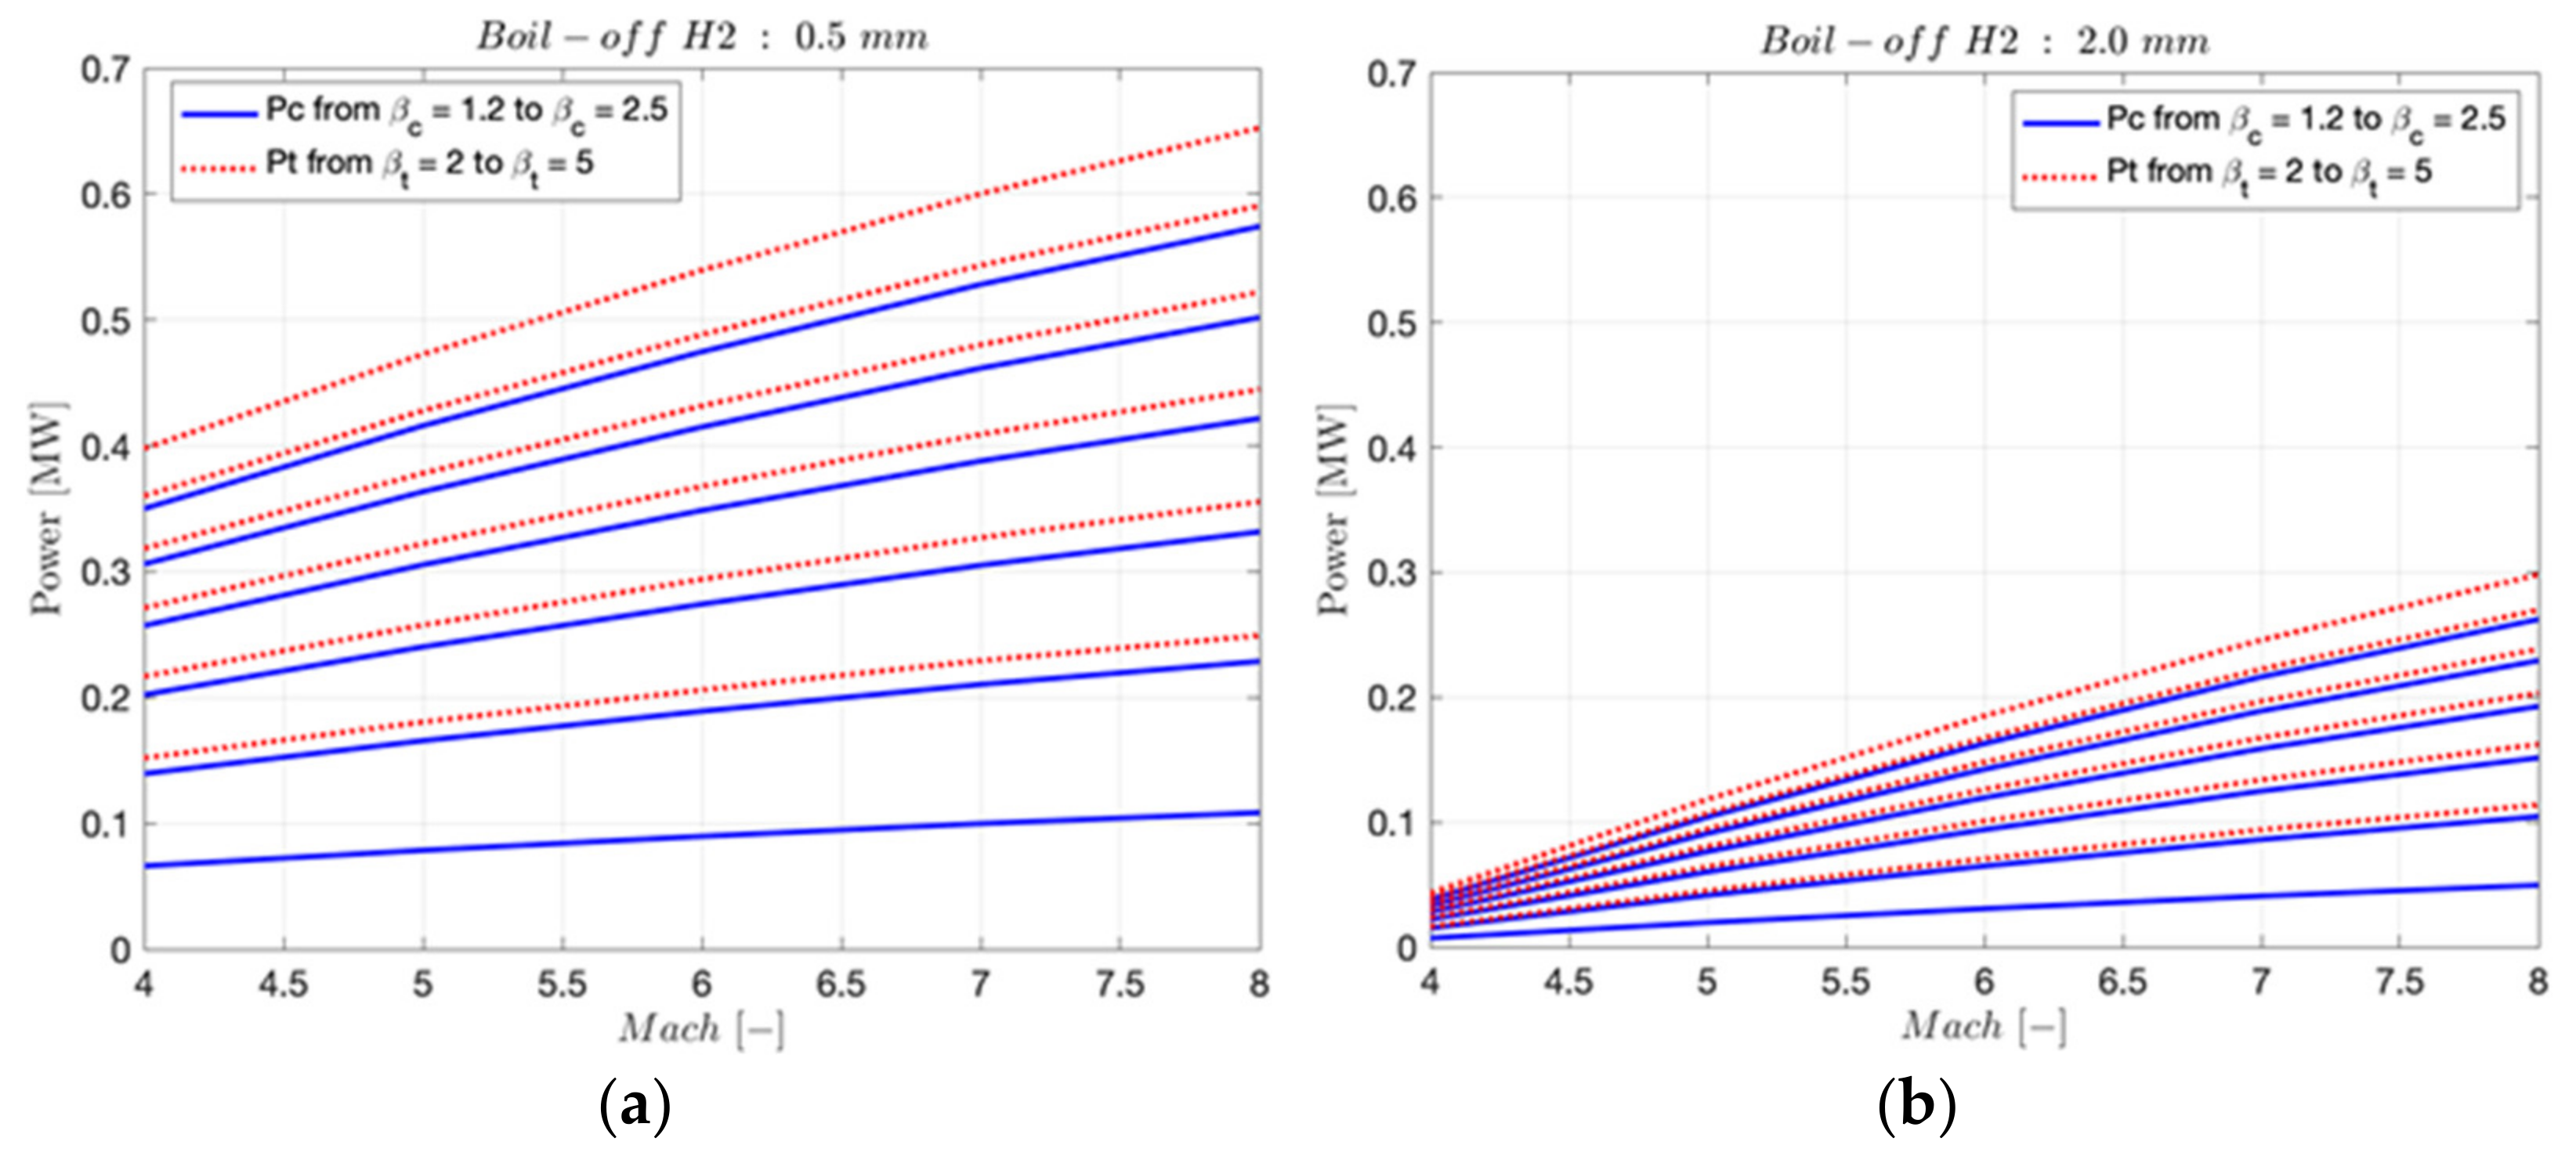
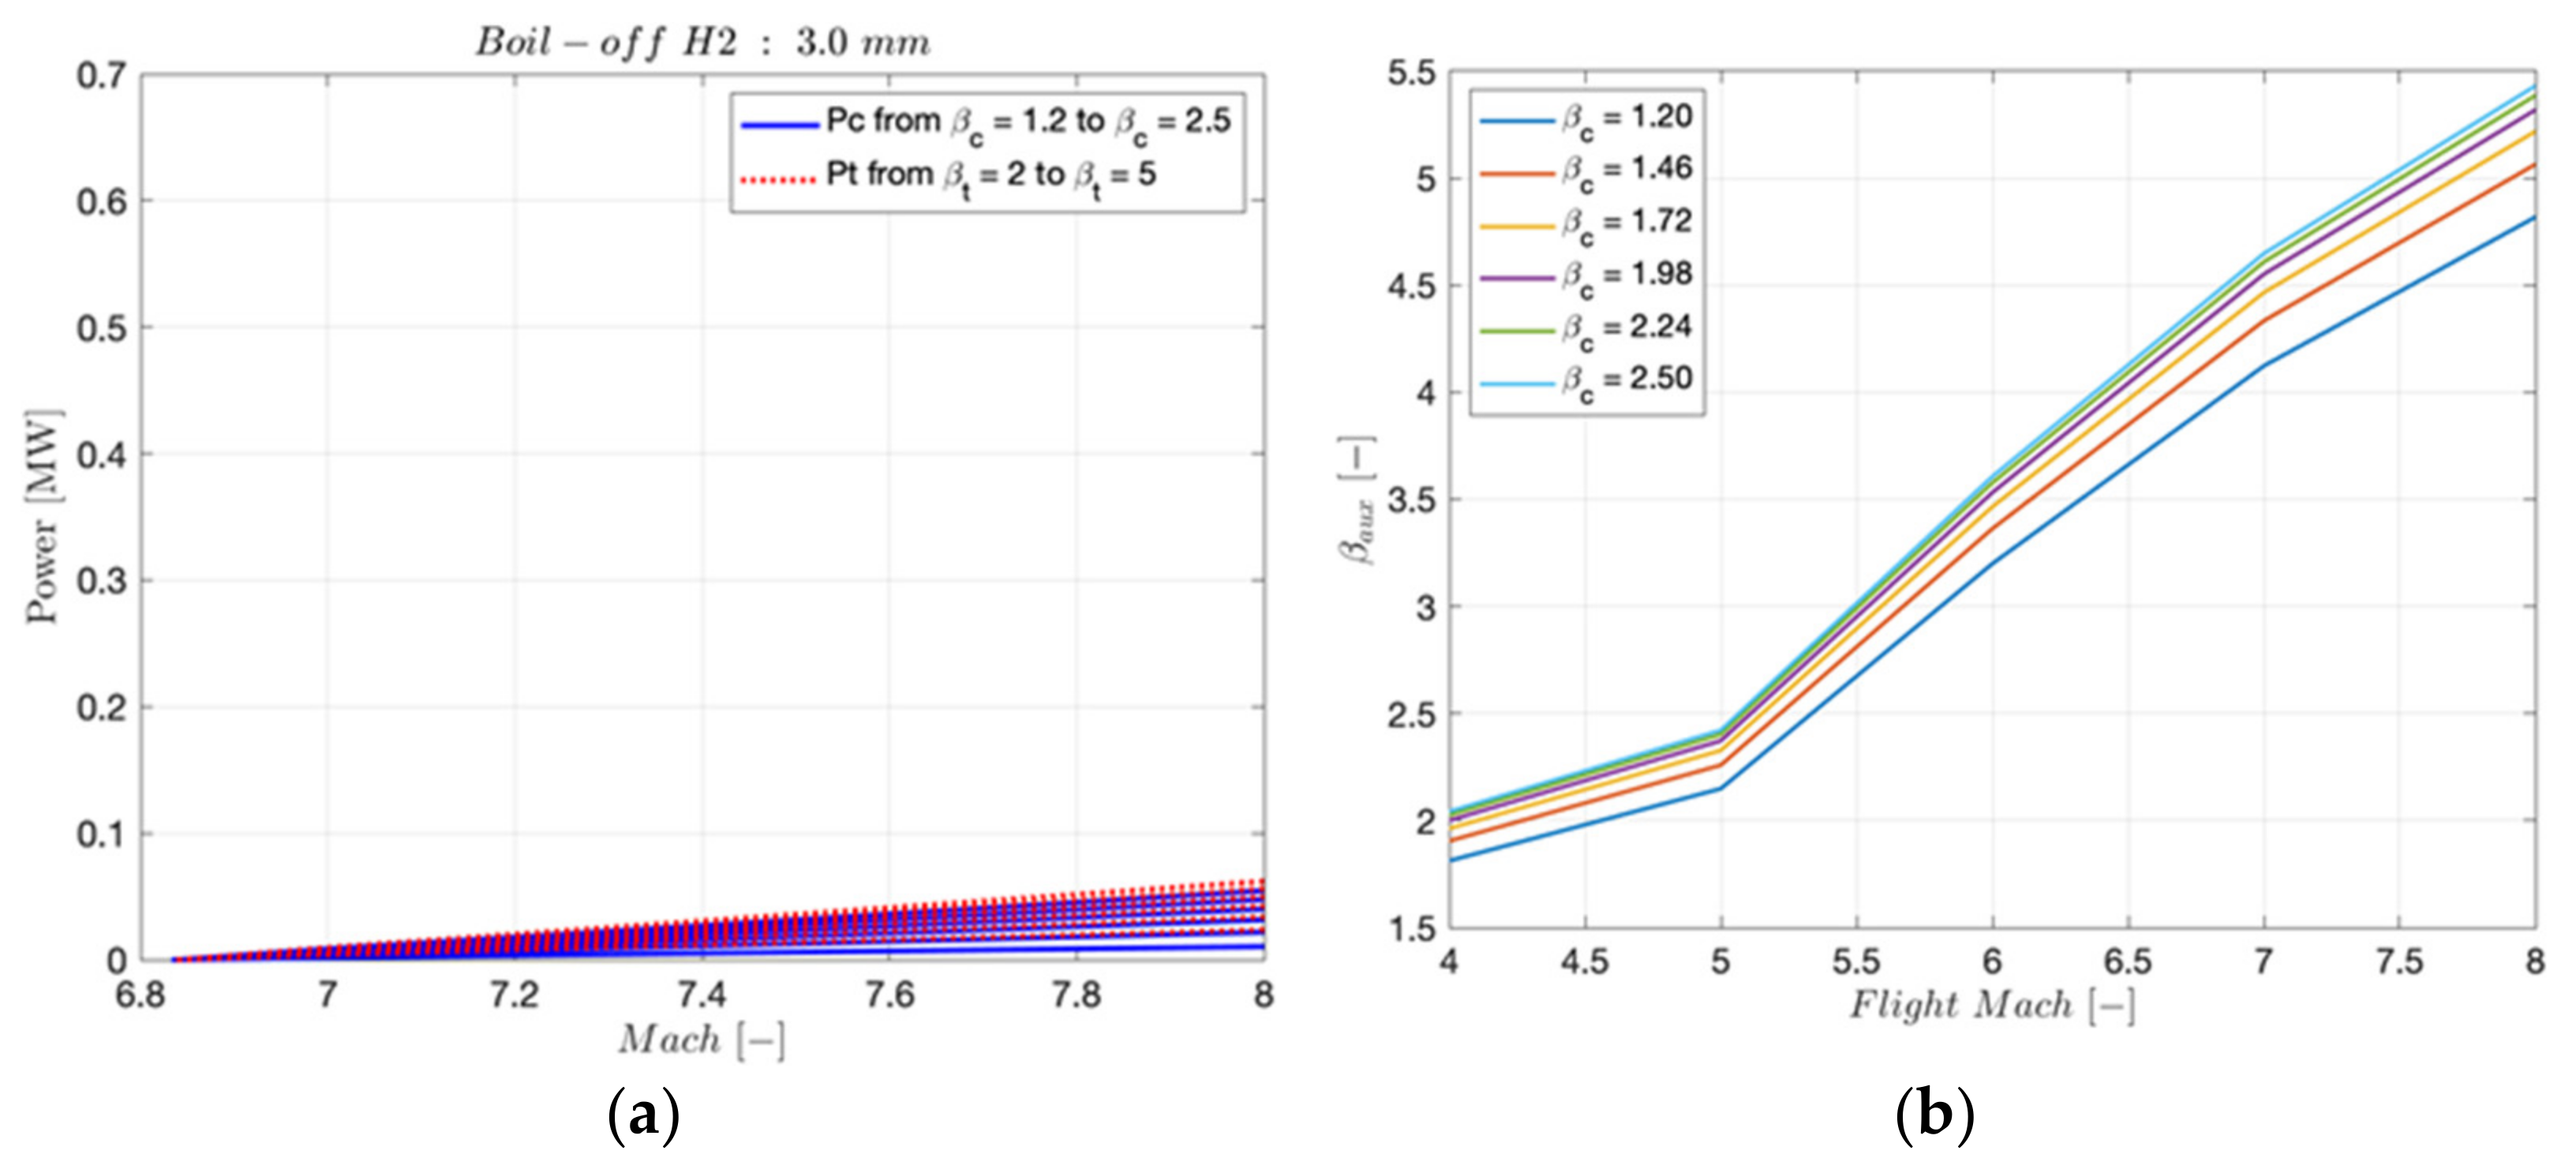
Figure 26a,b and
Figure 27 show the variation in the power supplied by the turbine to drive the compressor of the CAU (available power vs. requested power) for different values of thickness of the boil-off hydrogen layer. The figures also highlight the impact of the expansion ratio of the turbine, which ranges between 2 and 5, and the compression ratio of the compressor, which ranges between 1.2 and 2.5, as typical values of a conventional aircraft’s CAU. The results reveal that the turbine can drive the compressor throughout the hypersonic speed regime, i.e., the hot case and worst case scenarios, for all thicknesses of the hydrogen boil-off insulation layer of the cross-sectional configuration of the cabin. This implies that the open loop cycle with the air cycle machine is a feasible technical solution for all Mach numbers and all flight altitudes for the ECS.
It is worth noting that the bigger the thickness of the insulation layer, the lower the requested power to drive the compressor of the CAU. The excess of power can be used to supply additional loads, for example, the fan to recirculate air from the cabin to mix it with the air exiting the CAU.
Figure 27b illustrates the variation of the compression ratio of the dedicated auxiliary compressor as a function of the Mach number for different values of the compression ratio of the CAU’s compressor, which ranged from 1.20 to 2.50. It clearly emerges that as the flight speed and altitude increased, it was necessary to compress more the incoming air to meet the performance requirements at the CAU’s exit. In addition, the higher the compression ratio of the CAU’s compressor, the lower the values of the compression ratio of the auxiliary compressor. It is worth noting that the auxiliary compressor should be able to vary its compression ratio with the flight’s Mach number.
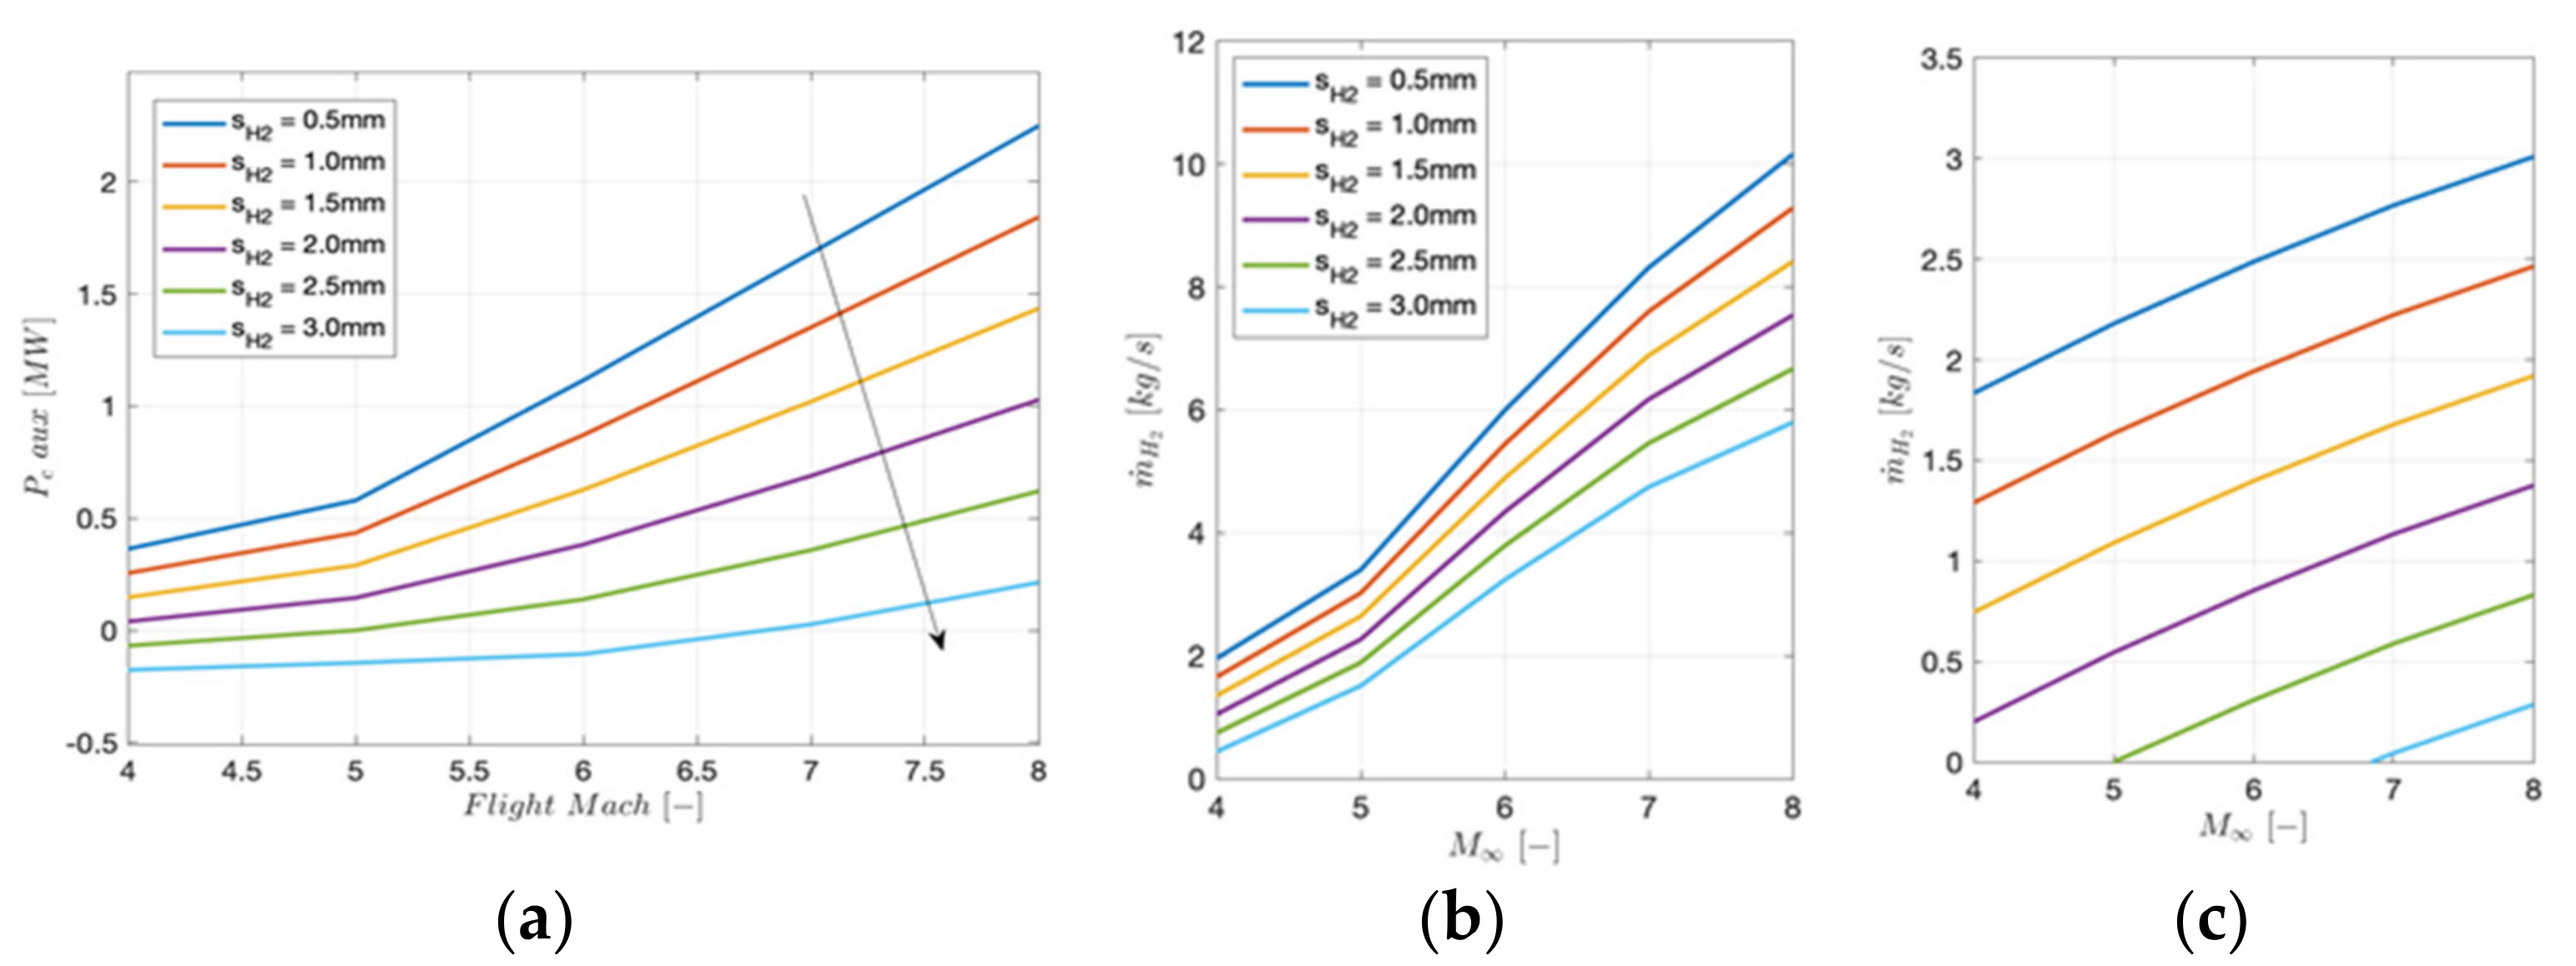
Considering as a hypothesis the compression ratio of the CAU’s compressor to be equal to
, the variation of the required power to drive the auxiliary compressor as function of the Mach number was plotted in
Figure 28a for different values of thickness of the boil-off hydrogen insulation layer. The results show that the thicker the boil-off hydrogen layer, the lower the required power to drive the auxiliary compressor. Alternatively, different locations for the ram-air extraction by the engine inlet can be investigated. Higher pressure values of the ram-air should be traded off against detrimental effects on engine performance.
The mass flow rate of the boil-off hydrogen as coolant mean of the primary heat exchanger of the CAU is plotted in
Figure 28b as function of the Mach number, ranging from Mach 4 to Mach 8, for different values of thickness of the boil-off hydrogen convective insulation layer of the cabin cross-section. The results revealed that the higher the thickness of the hydrogen layer, the lower the boil-off hydrogen mass flow required by the primary heat exchanger. The same considerations hold true for the variation of the boil-off hydrogen mass flow of the secondary heat exchanger with the Mach number and thickness of the hydrogen layer of the cabin cross-section as depicted in
Figure 28c. The hypothesis that the mass flow of the boil-off hydrogen can be estimated as 10% of the air mass flow supplied by the ECS was verified by the performance assessment of the multi-functional TEMS, where here made to estimate the mass flow of the boil-off hydrogen as coolant mean.


