Abstract
With the increasing bandwidths of servo control systems and decreasing mode frequencies, aeroservoelastic (ASE) stability evaluation has become an essential part of flight vehicle design. However, the theoretical method is limited by the modeling errors of numerical models, and the dry wind tunnel method is limited by the complex design of force controllers. Given these limitations, a novel ASE stability evaluation method for slender vehicles based on the ground frequency response test (FRT) is proposed in this paper. FRTs are implemented for a slender vehicle to obtain the frequency response functions (FRFs) of the real structure and servo control systems. The low-order unsteady aerodynamic FRFs established in physical coordinates are calculated by the quasi-steady aerodynamic derivative method. An ASE open-loop FRF is established for stability evaluation via the Nyquist criterion. Comparison with the theoretical results shows that the proposed method is feasible and accurate for different positions of the inertial measurement unit, different control laws, and different Mach numbers. To deal with the unavoidable influence of hanging supports in the test, an FRF fitting and resynthesis method is used to remove the hanging modes and provide an accurate ASE open-loop FRF with free–free boundary conditions.
1. Introduction
Aeroservoelasticity (ASE) is a phenomenon arising from the interaction of unsteady aerodynamic forces, elastic structures, and servo control systems [1]. The mode frequencies of many slender vehicles are very low because of their high slenderness ratio. On the other hand, the bandwidths of flight control systems (FCSs) and actuators are high enough to satisfy the demand for high maneuverability. As a result, the phenomenon of ASE instability is common in slender vehicles and may result in serious accidents. In 2001 [2], the X-43A Hyper-X research vehicle went out of control because of a control anomaly characterized by a diverging roll and yaw oscillation of the vehicle near 2 Hz, which is a typical ASE instability accident. Therefore, ASE stability evaluation has become an essential part of flight vehicle design.
Classical ASE stability analysis is based on the assembly of relatively detailed numerical models of structures, unsteady aerodynamic forces, and servo control systems. Servo control systems include an inertial measurement unit (IMU) system, an actuator system, and an FCS. Generally, modally based structures, frequency-domain unsteady aerodynamic forces, and servo control systems established by the transfer function model or the state-space model are used in classical ASE stability analysis [3,4,5]. For the structural modeling of slender vehicles, early studies mainly described simple beam models, such as a uniform free beam model [6] and a uniform, free–free, Timoshenko beam model [7]. With the development of finite element methods (FEMs) [8], many studies have used mature commercial finite element software to establish structural models [9,10,11]. These numerical modeling methods inevitably require the adoption of various simplifying assumptions, which resulting in modeling errors. Therefore, such models are unable to fully reflect the real characteristics of structures and servo control systems of real slender vehicles. As a consequence of these modeling errors, the accuracy of ASE stability analysis is insufficient for engineering requirements, and the analysis results should be verified and adopted very carefully.
To improve the modeling accuracy for structures and servo control systems, various types of ground tests are used to verify and update the numerical models, including the ground vibration test (GVT) and the structural coupling test (SCT). The GVT, also known as the modal test, generally uses a hammer or shakers to apply excitation forces to obtain the mode parameters, including mode frequencies, mode shapes, and mode damping [12]. The SCT is used to evaluate the coupling between the elastic structure and servo control systems [13]. Generally, the control surfaces (fins) are used for excitation. The collected signals generally include IMU signals and command signals of the FCS so as to obtain the frequency response functions (FRFs) of the servoelastic system. Allen and Pollock [14] carried out an ASE evaluation of a digital FCS for the AFTI/F-16 airplane, and the FRFs acquired from the SCT were mainly used to verify the numerical model and simplify model updating. Compared with numerical models, test data are more accurate for the damping and digital FCS. Zislin et al. [15] used ground test data to correct sensor mode shape, sensor position, and FCS. Vaccaro et al. [16] described in detail the process of using ground test data to modify the ASE model, in which the mode parameters identified by the GVT are used to update the mass and stiffness of the FEM model, and IMU factors are introduced to modify the servoelastic system based on the SCT results. In these updating methods, the accuracy of model tuning is highly affected by the experience of researchers. It is generally easy to obtain high-precision results for simple models, but with increasing model complexity, updating becomes very difficult and less accurate.
To directly consider the characteristics of real structures and servo control systems, a ground simulation test method using shakers for real-time loading of unsteady aerodynamic forces was developed, which is also called the dry wind tunnel (DWT) method [17]. In this method, the aerodynamic condensation method is used to concentrate the distributed unsteady aerodynamic forces at a limited number of excitation points, and a multi-input, multi-output (MIMO) force controller is used to load the forces in real time. This approach was first applied to flutter analysis by Kearns in 1962 [18]. In 2011, Zeng et al. [17] further improved the unsteady aerodynamic condensation method and used a mixed-sensitivity () force controller to improve the test accuracy. In the ensuing years, Wu et al. [19,20], Wang et al. [21], and Yun et al. [22] have made contributions to this method in terms of condensation of aerodynamic forces and force controller design. Wu et al. [23] applied this approach to the ASE stability evaluation of slender vehicles and used a proportional–integral controller for force control. In contrast to numerical models and updating models, the DWT method is carried out directly on real flight vehicles; therefore, it may be theoretically more accurate. However, the accuracy of this method is highly affected by the characteristics of the force controller. The difficulties in achieving a satisfactory force controller have restricted the development of this method and its application to complex models.
A novel ASE stability evaluation method for slender vehicles based on the FRFs of the structure and servo control systems acquired from ground frequency response tests (FRTs) is proposed in this paper. Combined with the calculated aerodynamic FRFs in physical coordinates, the ASE open-loop FRF is established for stability evaluation via the Nyquist criterion. Compared with the numerical models and updating models used in the theoretical ASE method, the proposed method can more accurately reflect the frequency-domain characteristics of the real structure and servo control systems. The FRFs acquired from tests contain fewer identification errors than identified mode parameters. Compared with the DWT method, there is no risk of instability and no need to use a complex and difficult force controller in the ground test, which makes the proposed method safe and easy to implement, avoiding the influence of force control errors. For a slender vehicle, FRTs of shaker excitation and fin excitation are carried out, the unsteady aerodynamic FRFs established in physical coordinates are calculated by the quasi-steady aerodynamic derivative method, and the ASE stability of the pitch channel is evaluated using the proposed method. Statistical results with different positions of IMU, different control laws, and different Mach numbers are compared with the theoretical results to verify the feasibility and accuracy of the proposed method. To deal with the unavoidable influence of hanging supports in the test, an FRF fitting and resynthesis method is proposed to remove the hanging modes and obtain an ASE open-loop FRF with free–free boundary conditions.
The present paper is organized as follows. In Section 2, the proposed ASE system proposed is established based on the improvement of a theoretical ASE system and SCT system. Section 3 introduces the proposed ASE stability evaluation method for slender vehicles; the relevant methods include the acquisition of FRFs in the FRT, the calculation of unsteady aerodynamic FRFs, and the use of the Nyquist criterion for stability evaluation. Descriptions of the modeling and testing techniques and processes adopted for a slender vehicle are the focus of Section 4. In Section 5, the results of the proposed method are presented and discussed, including a comparison of the results with the theoretical method and the FRF fitting and resynthesis method to remove the influence of hanging supports. Finally, Section 6 summarizes the findings and conclusions of the study.
2. ASE System Modeling
The ASE system proposed in this paper is an improvement of the theoretical ASE system and the SCT system. The theoretical ASE system is mature and established in generalized coordinates. The SCT system only evaluates the coupling of the structure and the servo control systems. On this basis, the improved ASE system is established in physical coordinates, and the order of the system is reduced by the unsteady aerodynamic condensation method.
2.1. Theoretical ASE System
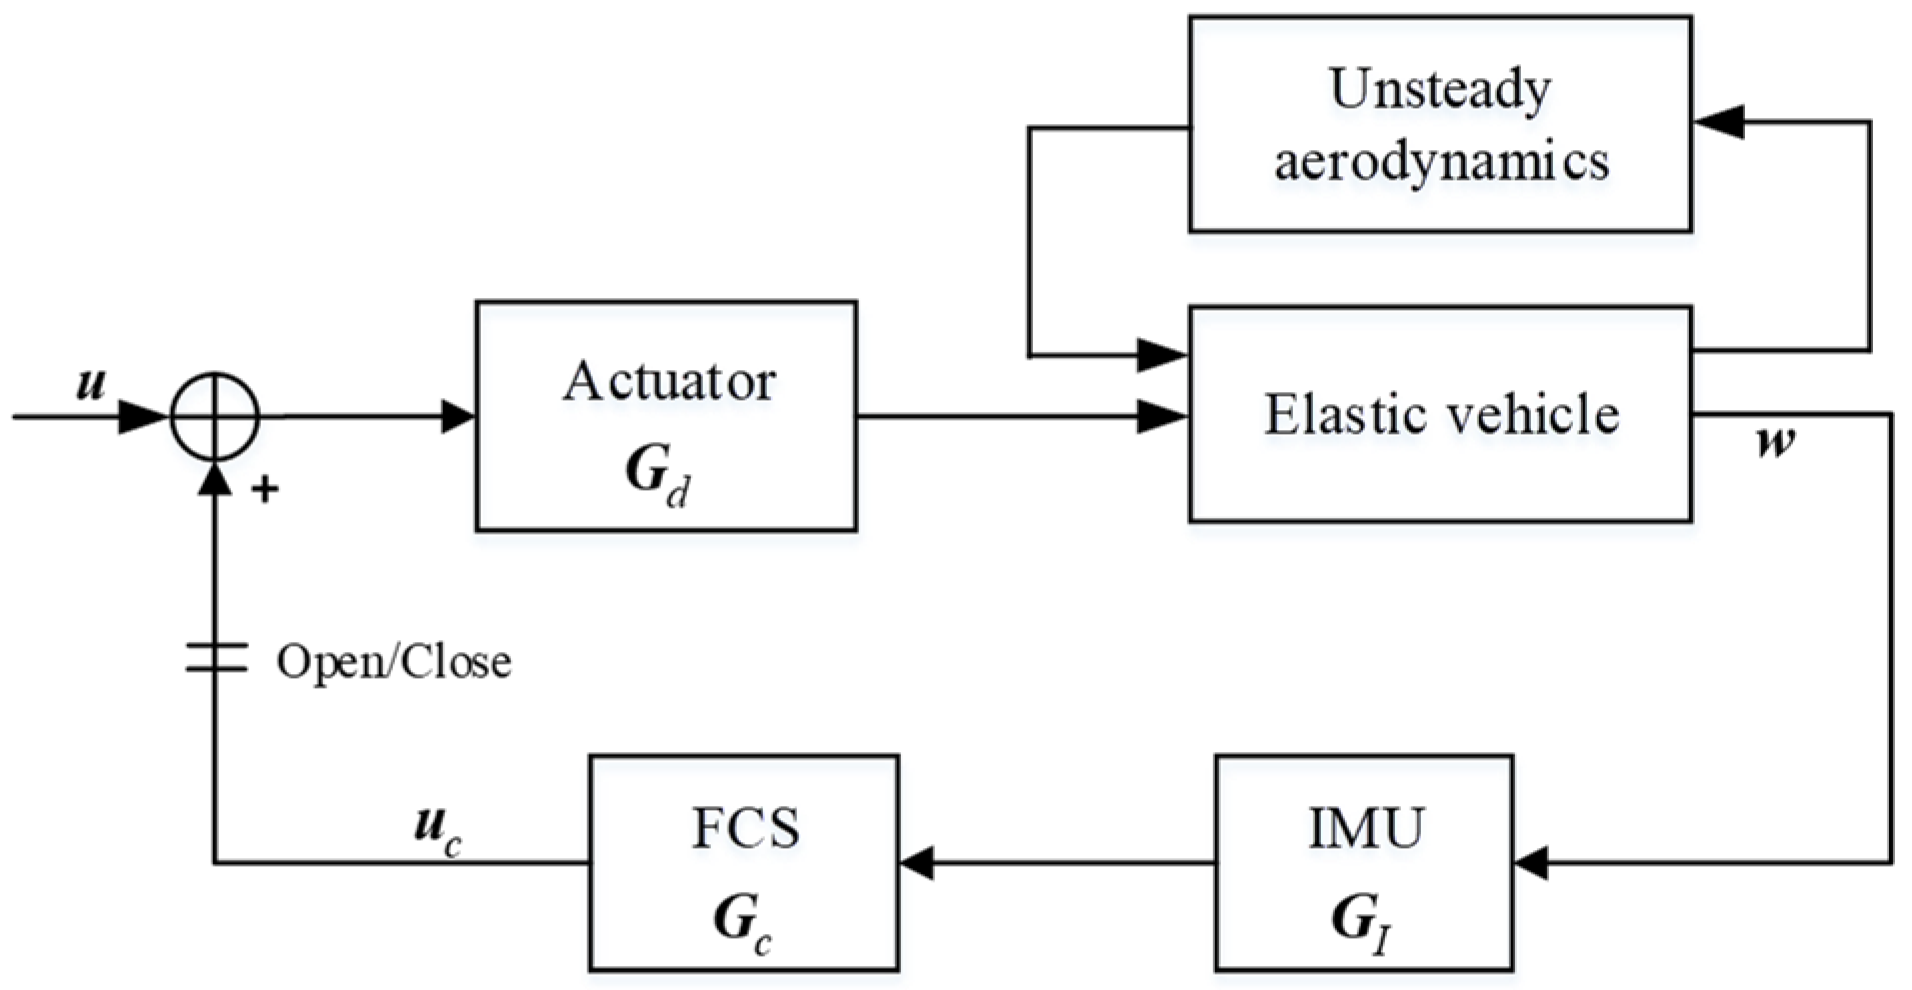
As shown in Figure 1, the theoretical ASE system is composed of an elastic vehicle, unsteady aerodynamics, an actuator, IMU, and FCS. It is assumed that the structural mode order is and the degree of freedom of the fin deflection is (generally, there are roll, pitch, and yaw channels). For the fin deflection command input, the aeroelastic equation of motion established in generalized coordinates can be expressed as
where , , and are the generalized mass matrix, the generalized damping matrix, and the generalized stiffness matrix, respectively, all of which have dimensions of ; and are the generalized aerodynamic influence coefficient (AIC) matrices associated with generalized displacements () and fin deflections (), with dimensions of and , respectively; is the mass coupling matrix between control and structural modes; is the atmospheric density; and is the flight speed.

Figure 1.
Block diagram of the theoretical ASE system.
Introducing the coefficient matrix () from the generalized displacements to the IMU acquisition signals () (a vector), the transfer function of unsteady aerodynamics and an elastic vehicle can be expressed in the Laplace domain as
The transfer function matrix of IMU, FCS, and the actuator are denoted by , , and , respectively, with dimensions of , , and , respectively, where is the number of control channels, usually including roll, pitch, and yaw channels. The open-loop transfer function of the theoretical ASE system can be expressed as
The theoretical ASE analysis can consider the numerical models of structure, servo control systems, and unsteady aerodynamic forces. Compared with real flight vehicles, modeling errors cannot be avoided.
2.2. SCT Systems
The SCT is a ground test method for flight vehicles with FCS to evaluate the stability of the servoelastic system, in which the unsteady aerodynamic forces are not considered. A block diagram of the classical SCT system is shown in Figure 2. For an ASE system with fins as control input, the SCT uses fins to excite and collect the control command signals of the FCS. The open-loop FRF acquired from the SCT is used to evaluate the stability of the servoelastic system. The open-loop transfer function of the SCT system can be written as
where is the transfer function matrix of the fin deflection inertial forces () to the IMU acquisition signals, and is the transfer function matrix of the fin deflection angles to the inertial forces.

Figure 2.
Block diagram of the SCT system.
2.3. Improved ASE System
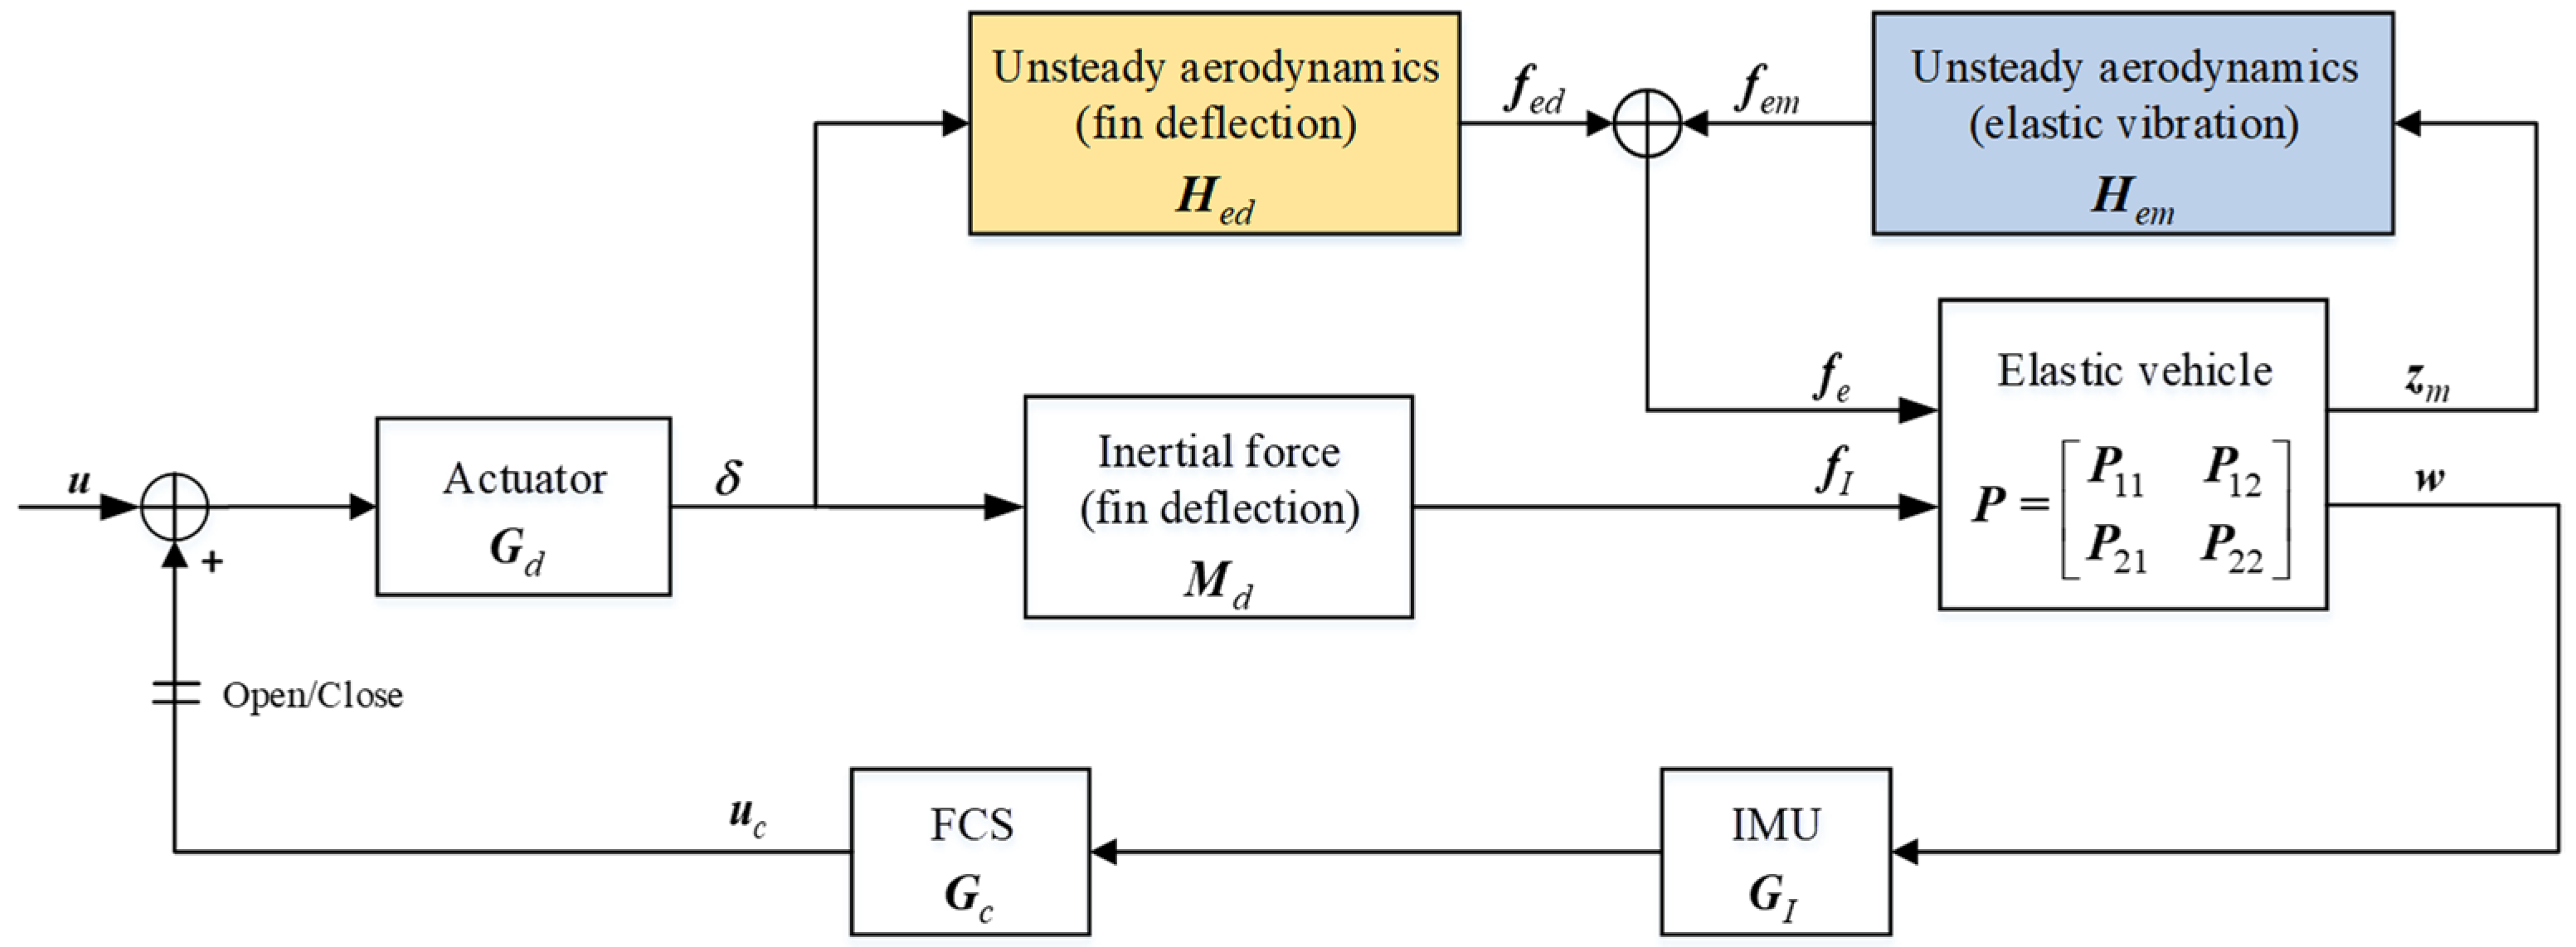
To directly use the experimental frequency-domain characteristics of the test model, which is the same as in the SCT, and to introduce unsteady aerodynamic forces, we propose an improved ASE system, as shown in Figure 3. In contrast to the theoretical ASE system, the proposed ASE system is established in physical coordinates. The elastic vehicle system () in the SCT system is only a block matrix in the proposed ASE system. Forces acting on the elastic vehicle can be divided into unsteady aerodynamic forces generated by elastic vibration, unsteady aerodynamic forces generated by fin deflections, and inertial forces generated by fin deflections. To facilitate the implementation of the FRTs, the order of physical coordinates used to calculate the unsteady aerodynamic forces should be condensed to a small number, including excitation points and measurement points, which are the application points of the concentrated unsteady aerodynamic forces and the control points for calculating aerodynamic forces generated by elastic vibration, respectively.

Figure 3.
Block diagram of the improved ASE system.
is the transfer function matrix of the unsteady aerodynamic forces () and the fin deflection inertial forces () to the vibrational displacements () in physical coordinates and the IMU signals (), which can be written as
where and are and vectors, respectively, and and have dimensions of and , respectively.
The transfer function matrices in physical coordinates of unsteady aerodynamic forces generated by elastic vibration and fin deflections are denoted by and , respectively. The unsteady aerodynamic forces at the excitation points can be written as
The inertial forces generated by fin deflections can be written as
Upon substituting Equations (6) and (7) into Equation (5), the IMU signals can be written as
The open-loop transfer function of the positive-feedback ASE system can be expressed as
where the first term is the transfer function matrix obtained from the SCT, and the other terms are introduced after unsteady aerodynamic forces have been taken into consideration. , , and are the transfer function matrix of the fin deflection command signals to FCS command signals, vibrational displacements at the measurement points, and fin deflection response signals, respectively. and are the transfer function matrix of the forces at the excitation points to the FCS command signals and the vibrational displacements at the measurement points, respectively.
3. ASE Stability Evaluation for Slender Vehicles
3.1. Preliminaries
A schematic representation of the slender vehicle studied in this paper is shown in Figure 4. The X axis is directed backward along the centerline of the body. The Z axis is vertically upward, and the Y axis is determined by the right-hand rule. The aerodynamic surface comprises the body and fins. The IMU collects the vibrational response of the body, and the FCS calculates the control command to drive the actuators. The vehicle is divided into aerodynamic grids, with on the body (subscript ) and on the fins (subscript ). The excitation points and measurement points are also divided between the body ( and ) and fins ( and ). The ASE system is established by one of the roll, pitch, or yaw channels, i.e., and .

Figure 4.
Schematic diagram of the slender vehicle.
3.2. FRFs Acquired from the FRT
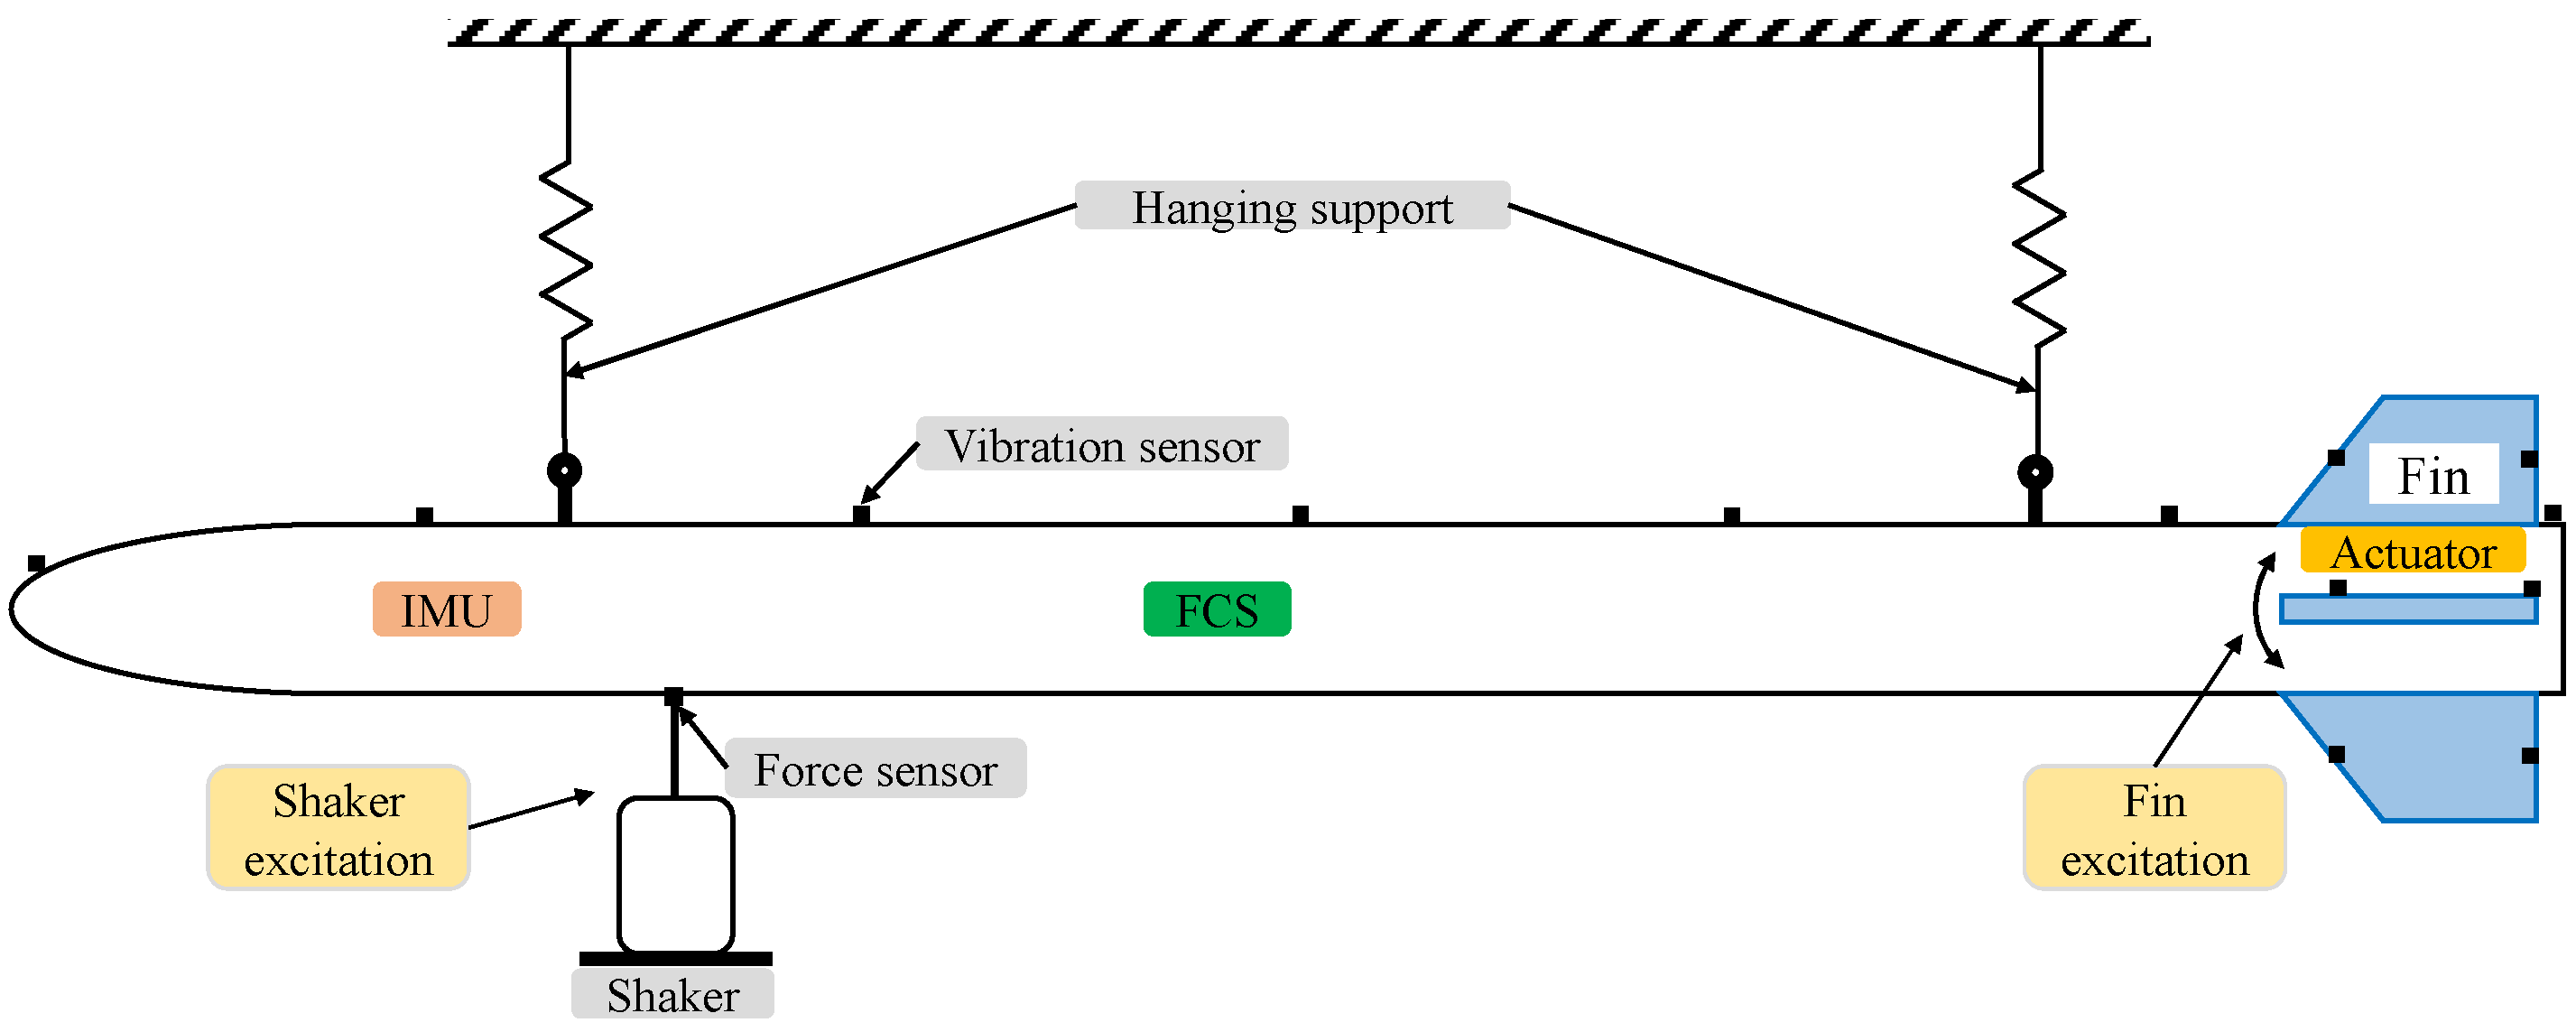
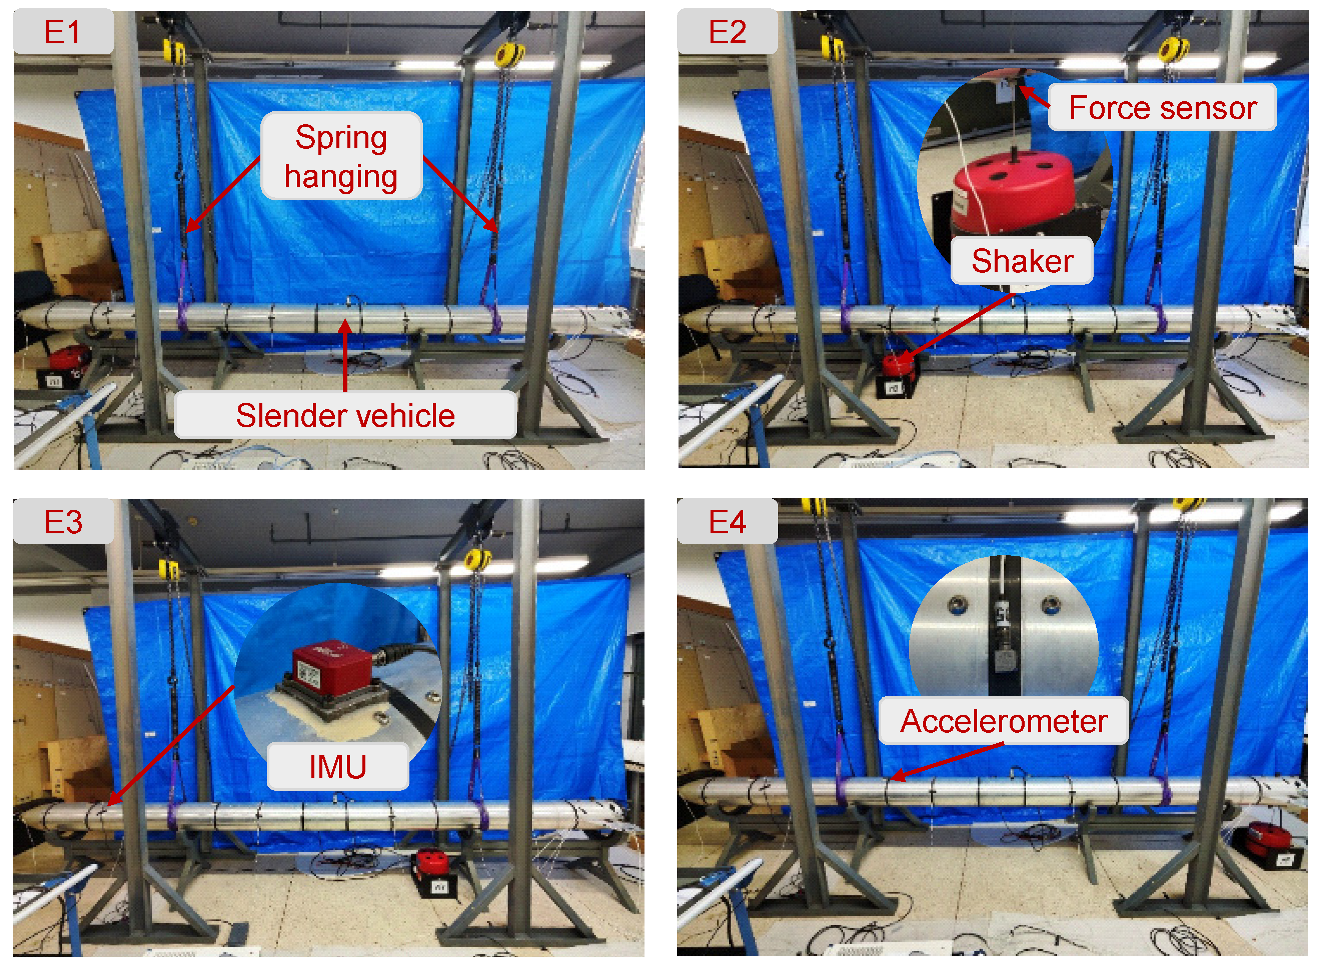
The FRT for slender vehicles described in this paper includes an independently implemented shaker excitation test and a fin excitation test, as shown in Figure 5. In general, the FRT is conducted with free–free boundary conditions using hanging supports, the stiffness of which is adjusted such that hanging-mode frequencies are kept far below the first elastic mode. The shaker needs to apply excitation separately at each excitation point in the single-input and multi-output (SIMO) shaker excitation test. The fins are deflected for excitation in the fin excitation test, which is also a SIMO test. Vibration sensors are used to collect the displacement signals or acceleration signals of the measurement points. Force sensors are used to collect the force signals in the shaker excitation test. The FCS command signals and the fin deflection response signals must also be collected.

Figure 5.
Schematic diagram of the FRT.
3.2.1. Shaker Excitation
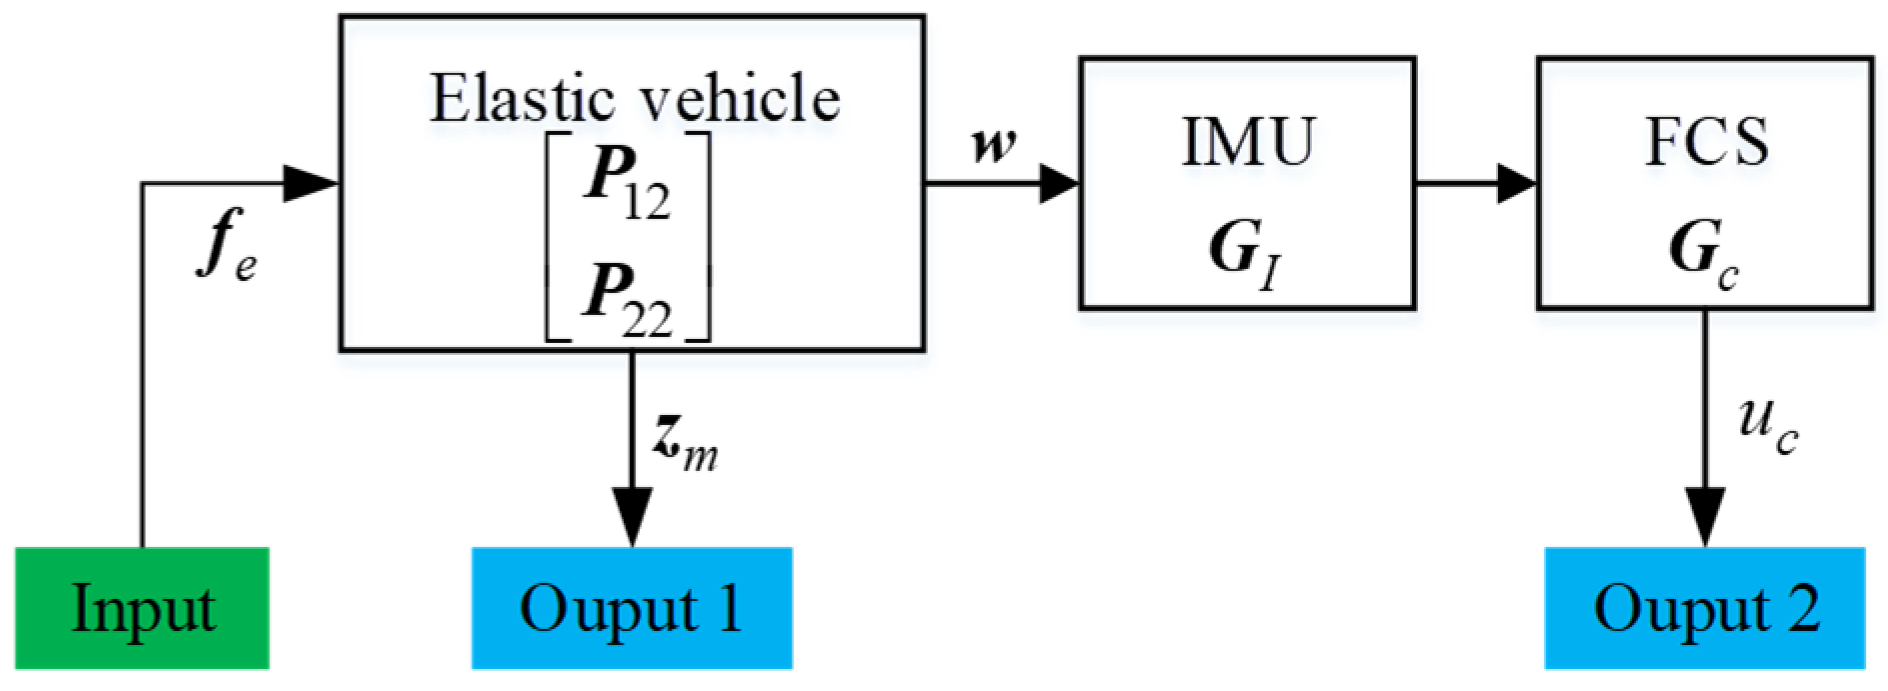
The FRT of shaker excitation is used to obtain the FRFs of the structure and servo control systems in Equation (9), which includes and . A block diagram of shaker excitation is shown in Figure 6. The shaker is used to excite each excitation point, and the output signals comprise the vibrational displacement signals (Output 1) at the measurement points and the FCS command signal (Output 2). The FRFs acquired from the test are
where is the imaginary unit, is the simple harmonic oscillation frequency, is the matrix of FRFs of the forces at the excitation points to the displacements at the measurement points, and is the matrix of FRFs of the forces at the excitation points to the FCS command signal.
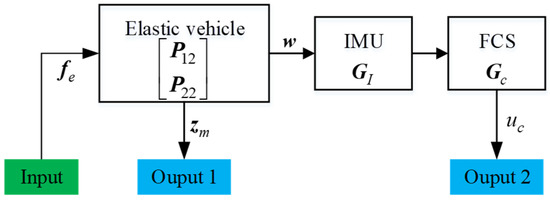
Figure 6.
Block diagram of shaker excitation.
3.2.2. Fin Excitation
The FRT of fin excitation is used to obtain the FRFs of the structure and servo control systems in Equation (9), which include , , and . The block diagram of fin excitation is shown in Figure 7. The input signal is the fin deflection command signal, and the output signals comprise the fin deflection response signal (Output 1), the displacement signals at the measurement points (Output 2), and the FCS command signal (Output 3). For Output 2, it is difficult to distinguish the displacements caused by fin deflections from those caused by elastic vibration of the fins, and the unsteady aerodynamic forces generated by the fin deflections are much greater than those generated by elastic vibrations. Therefore, the elastic vibrational displacements at the measurement points of the fins are not considered during the fin excitation test, i.e., the matrix only considers the block matrix of elastic vibration of the body. The FRFs acquired from the test are
where is the FRF of the fin deflection command signal to the fin deflection response signal, is the matrix of FRFs of the fin deflection command signal to the displacements at the measurement points, and is the FRF of the fin deflection command signal to the control law command signal.

Figure 7.
Block diagram of fin excitation.
3.3. FRFs of Unsteady Aerodynamics
3.3.1. Unsteady Aerodynamics of Elastic Vibration
In the proposed method, the unsteady aerodynamics transfer function matrix () is acquired using frequency-domain unsteady aerodynamics calculation methods, which are fast, and the accuracy generally meets the needs of engineering applications. The calculation methods commonly used in engineering, such as the subsonic and supersonic doublet-lattice method (DLM) [24,25], piston theory [26], and the quasi-steady aerodynamic derivative method [27], can be used to establish the unsteady aerodynamic forces in physical coordinates. The aerodynamic forces () at the aerodynamic pressure points can be calculated from the displacements () and their streamwise derivatives () at the aerodynamic control points, i.e.,
where is the aerodynamic influence coefficient (AIC) matrix in physical coordinates, and , , and are all vectors.
To improve the accuracy of the unsteady aerodynamics calculation, a large number of aerodynamic grids is generally used. If the same number of excitation and measurement points as the aerodynamic grids is directly used in the FRT, the experiment is difficult to implement. Therefore, it is necessary to use the unsteady aerodynamics condensation method to ensure equivalence of the distributed unsteady aerodynamic forces at the aerodynamic pressure points with the concentrated forces at the excitation points [17,19].
The spline interpolation methods commonly employed in general aeroelastic analysis can be used for the interpolation of displacements and forces, including, among others, the beam spline method, which considers only distributed transverse loads [28]; the infinite-plate spline method (IPS) [29]; and the thin-plate spline method (TPS) [30]. The interpolation matrix is related to the position coordinates of interpolation points and interpolated points but has nothing to do with the quality, stiffness, and other material properties of the structure.
and can be interpolated from the displacements () at the measurement points using the interpolated matrix, and :
The displacements () at the pressure points can be interpolated from the displacements () at the excitation points using the interpolated matrix, :
According to the principle of virtual work, the conversion relationship between the aerodynamic forces () at the pressure points and the concentrated aerodynamic forces () at the excitation points can be obtained as
Substitution of Equations (13) and (15) into Equation (12) yields
It should be noted that because the body and fins are interpolated separately, all the terms in Equation (16) are divided according to the body and fins:
To apply the proposed method to ASE stability evaluation, as an example in this paper, we use the quasi-steady aerodynamic derivative method, which is commonly used for slender vehicles and the calculation accuracy of which generally meets the needs of engineering applications. The body is divided into aerodynamic segments, and fins are taken as an independent aerodynamic segment (i.e.,). The unsteady angle of attack of each aerodynamic segment is equal to the instantaneous angle between the resultant velocity vector and the chord [23], i.e.,
The aerodynamic forces of aerodynamic segments can be expressed as
where is the area diagonal matrix of the aerodynamic segments, and is the aerodynamic derivative diagonal matrix, the diagonal elements of which are the derivatives of the normal force coefficient of each aerodynamic segment with respect to the angle of attack (or fin deflection angle for fin segment). The aerodynamic derivative can generally be obtained by a computational fluid dynamics (CFD) solver or by a scaled-model wind tunnel test.
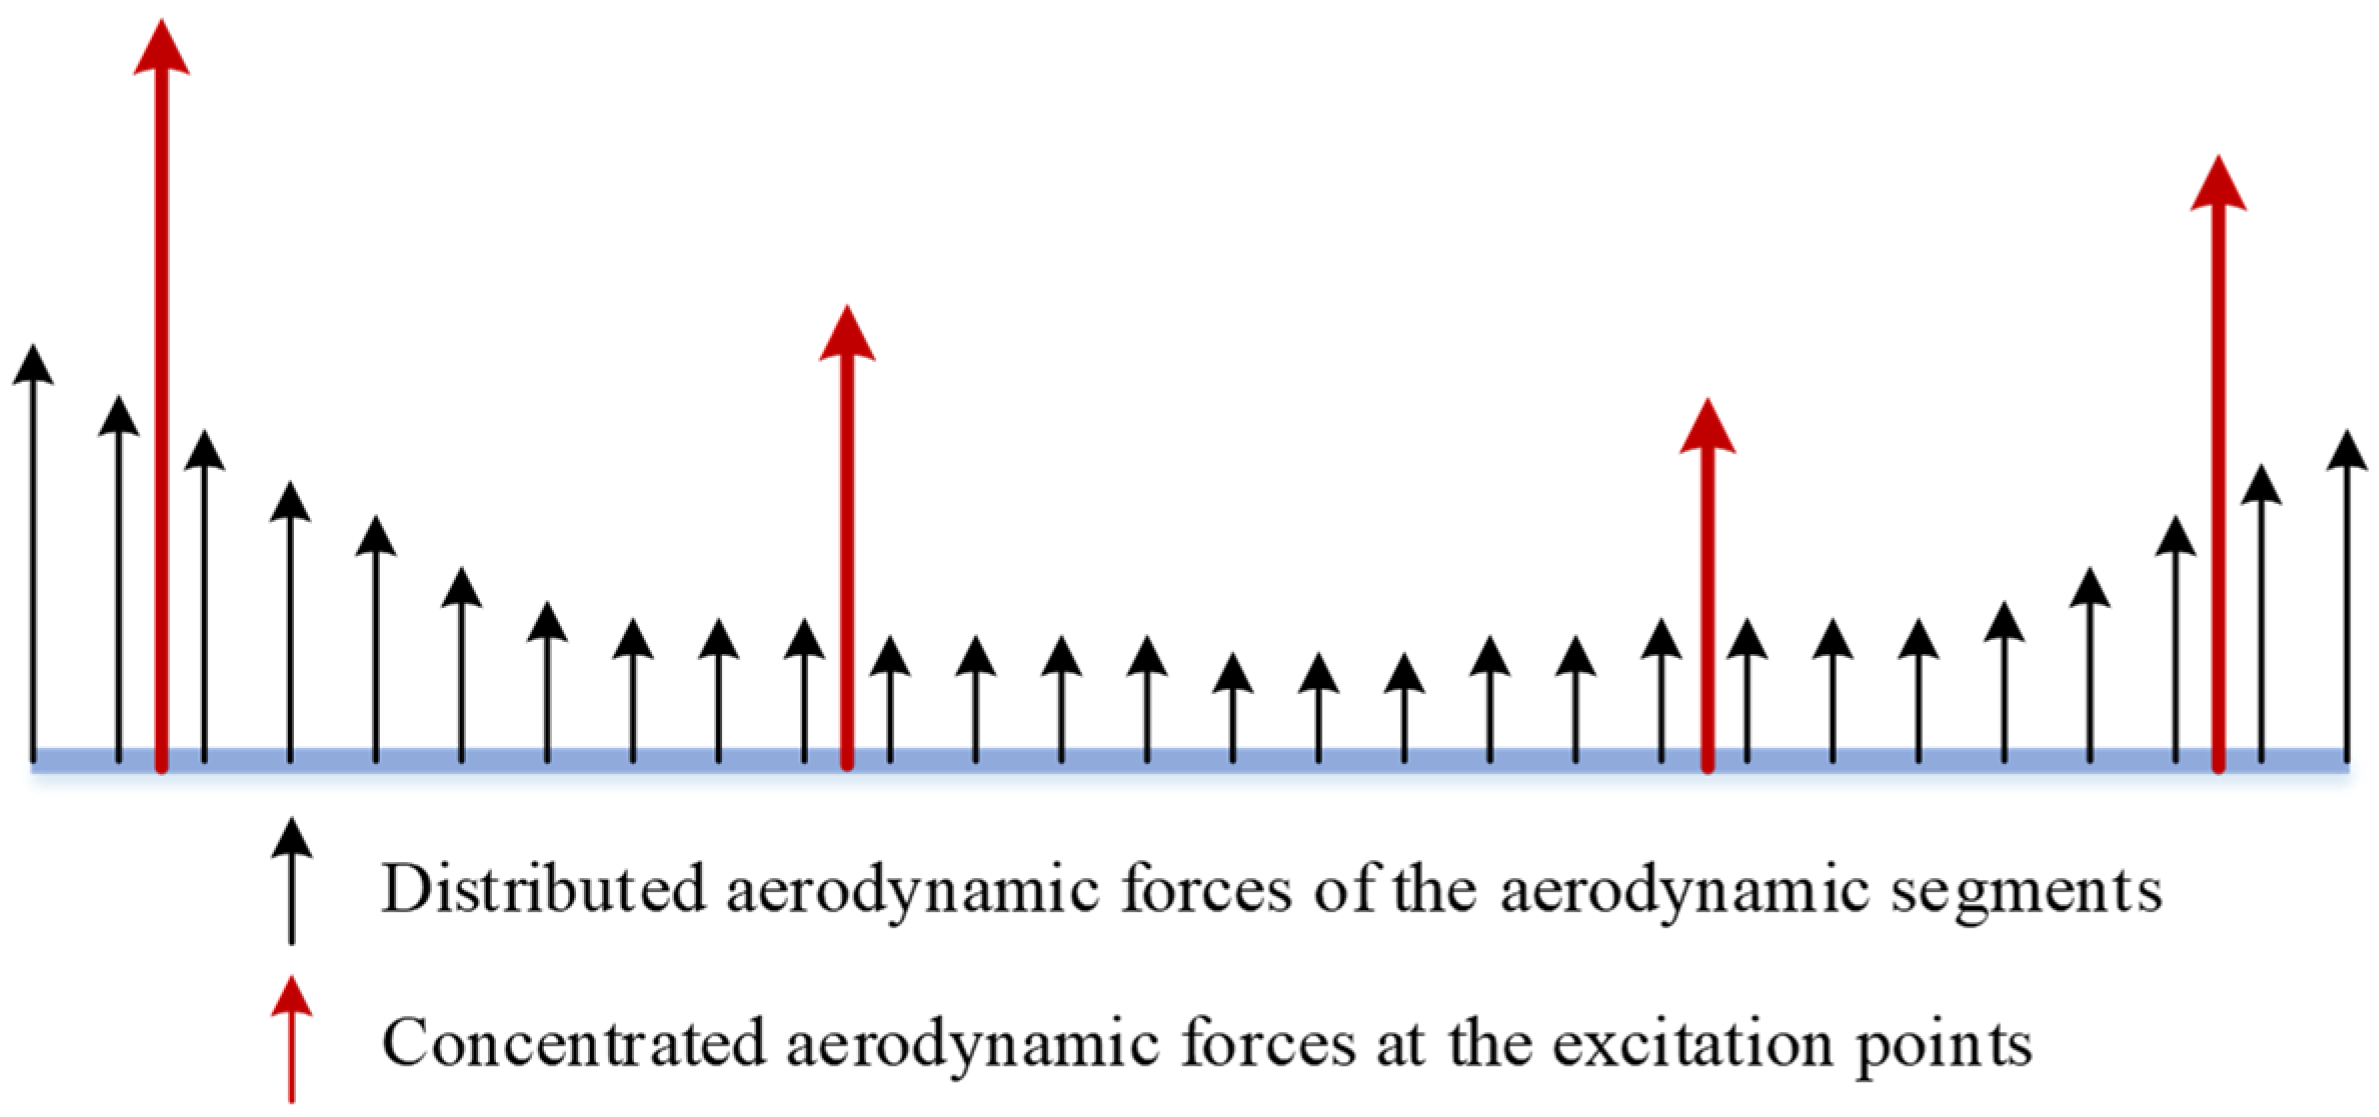
A schematic diagram of aerodynamic condensation is shown in Figure 8, in which the distributed aerodynamic forces of the aerodynamic segments are equivalent to the concentrated aerodynamic forces at the excitation points. In this paper, we need to obtain the unsteady aerodynamic FRFs (), i.e., substitution of Equations (13) and (15) into Equation (19), by which the required aerodynamic FRFs can be obtained:
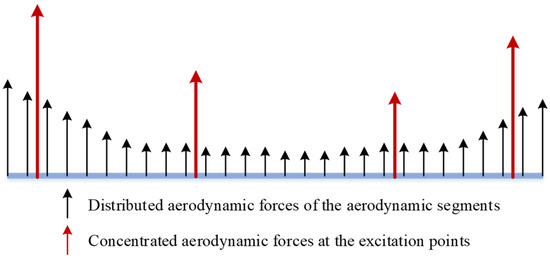
Figure 8.
Schematic diagram of aerodynamic condensation for the quasi-steady aerodynamic derivative method.
3.3.2. Unsteady Aerodynamics of Fin Deflections
Using the frequency-domain unsteady aerodynamic calculation method, the AIC matrix () in physical coordinates of fin deflections is calculated; the body remains stationary, and the fins rotate around the fin axis through 1 rad. The unsteady aerodynamic forces generated by fin deflections can be expressed as
According to the principle of virtual work, with the introduction of the interpolation matrix (), the unsteady aerodynamic forces generated by fin deflections at the excitation points can be written as
Substitution of Equation (22) into Equation (21) yields
Taking the quasi-steady aerodynamic derivative method as an example, the aerodynamic forces of aerodynamic segments are still as shown in Equation (19). The difference is that the displacements and their streamwise derivatives of the aerodynamic control points are generated by fin deflections, which are recorded as and .
The fin deflection mode is defined as a rigid mode generated when the body remains stationary and the fin deflects for 1 rad. The artificially constructed fin deflection mode shape () and mode slope () are only related to the position coordinates of control points and the fin axis. It should be noted that in the fin deflection mode, only the control points of fins have non-zero values, and the values of the control points of the body are all zero. Using the fin deflection angle and mode, the displacements and their streamwise derivatives can be written as
With the substitution of Equations (22) and (24) into Equation (19), the FRFs of the unsteady aerodynamic forces generated by fin deflections can be written as
3.3.3. Placement of Excitation and Measurement Points
The calculation accuracy of unsteady aerodynamic condensation is closely related to the number and locations of the excitation and measurement points. The placement of these points can be determined by the error between the interpolated modes and the original modes (the target modes) at the aerodynamic pressure and control points [19,31].
As with displacement interpolation, the interpolated mode shapes and mode slopes (, , and ) at the aerodynamic control points and pressure points can be interpolated from the mode shapes ( and ) at the measurement and excitation points:
where the subscripts and refer to the body and fins, respectively, and and can be interpolated from the experimental mode shapes.
Interpolation errors are defined as
where , , and are the original mode shapes and mode slopes, which can be interpolated from the experimental mode shapes, and is the weight coefficient matrix determined from practical engineering experience and the ASE characteristics of the research model, which indicate the importance of each order mode in ASE analysis.
For the general model, a genetic algorithm can be used to search the excitation and measurement points, and the optimization objective is to minimize the interpolation errors. It should be noted that for the placement of excitation and measurement points of slender vehicles, generally, approximately uniform distribution along the axis of the body can obtain high interpolation accuracy because it is a one-dimensional interpolation problem with a simple elastic mode.
3.4. Stability Evaluation
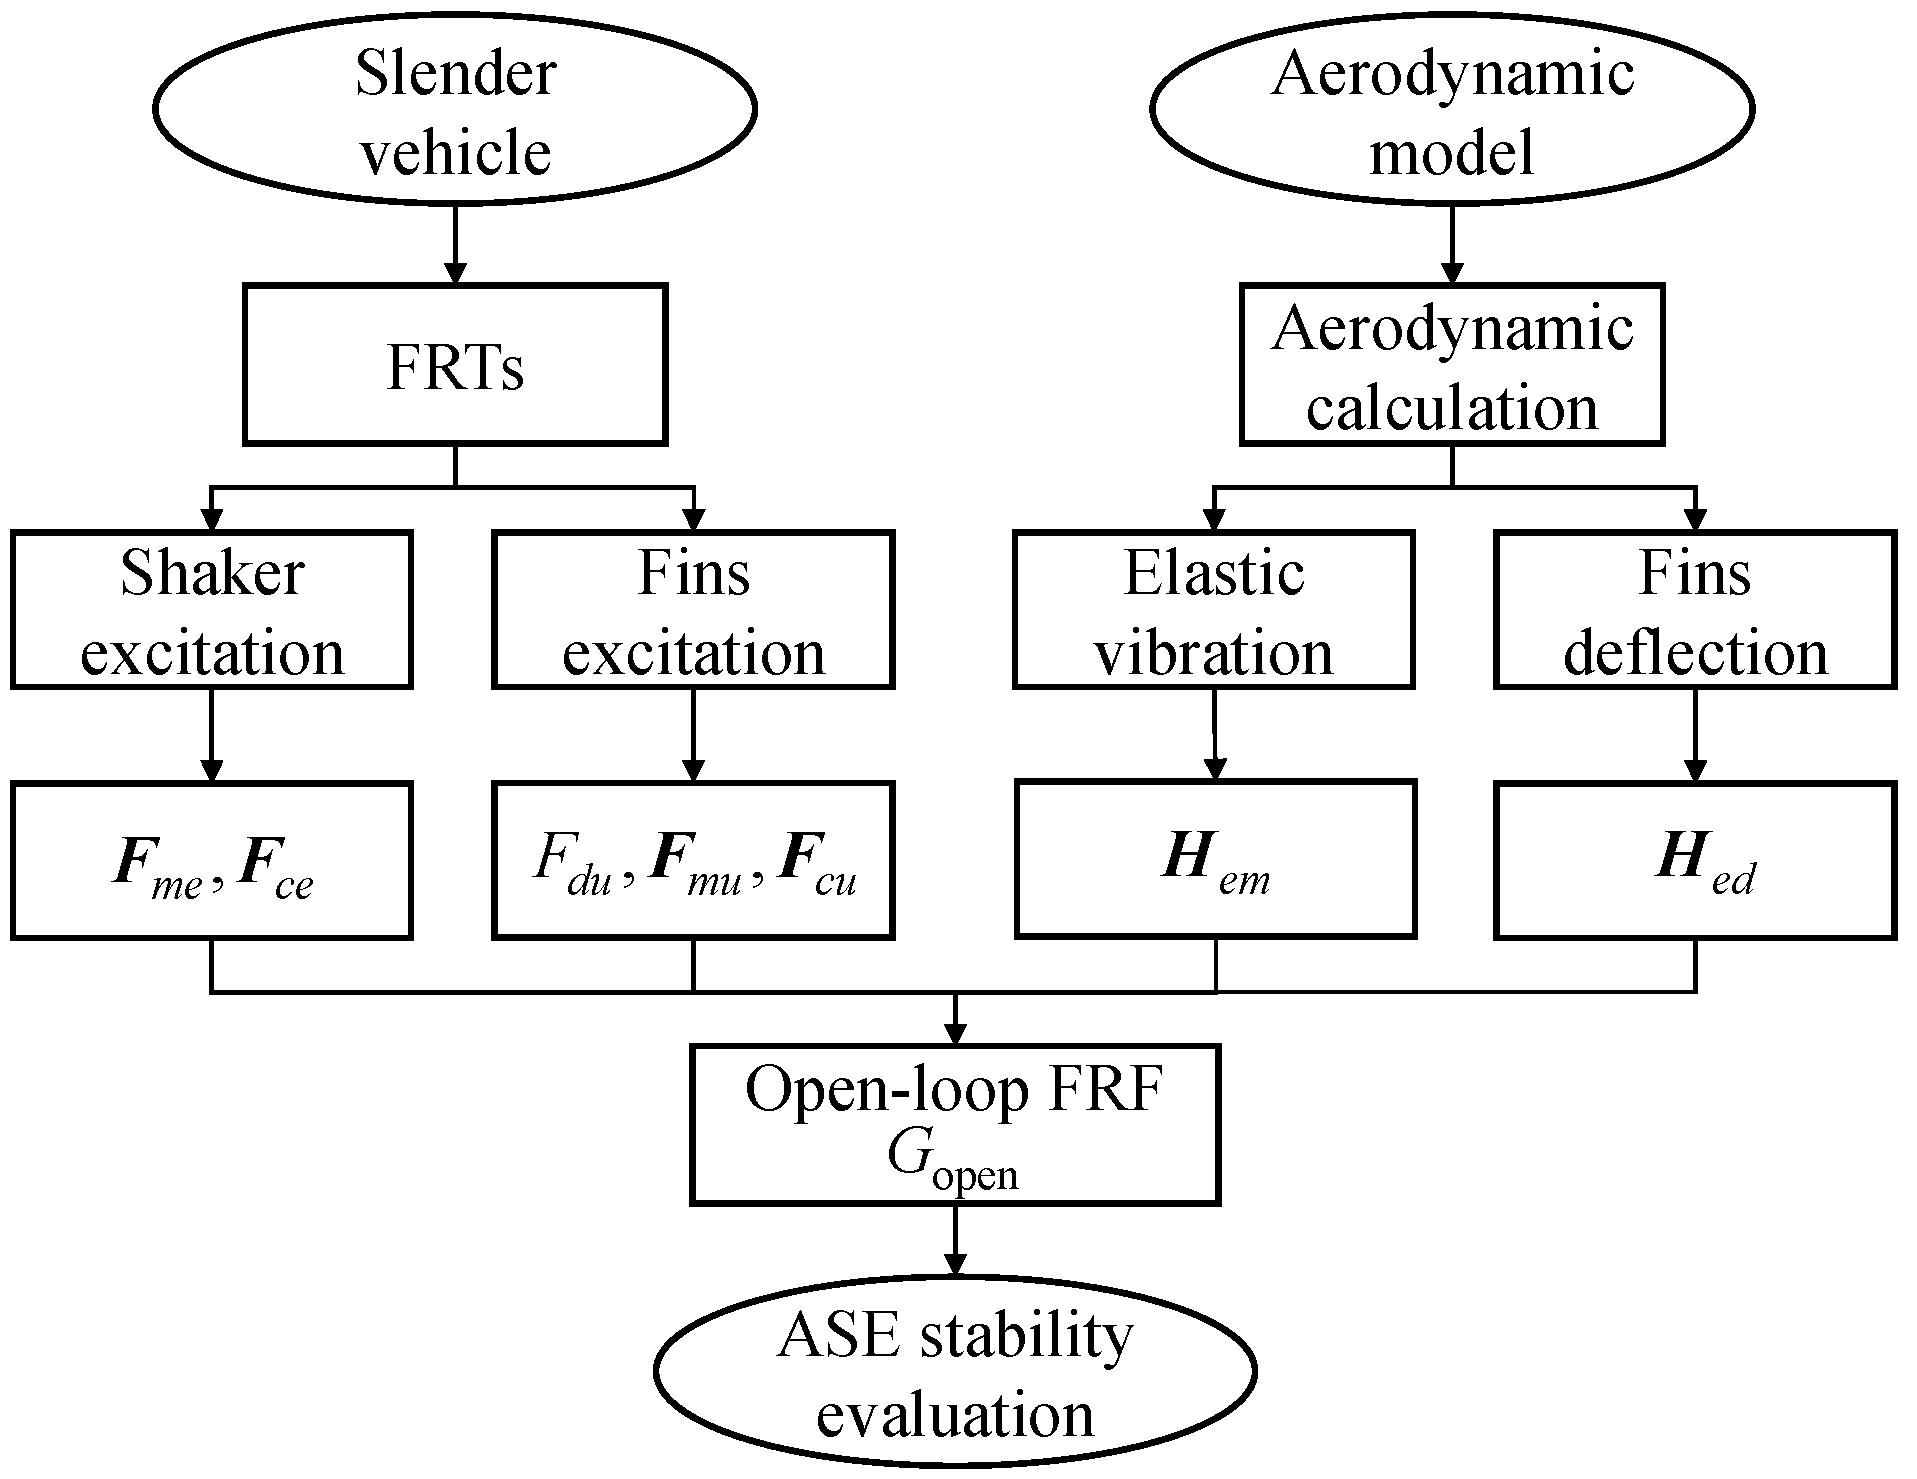
As shown in the flow chart in Figure 9, the FRFs of the structure and servo control systems acquired from the FRT (Equations (10) and (11)) and those of the unsteady aerodynamic forces (Equations (16) and (25)) are introduced into Equation (9). The ASE open-loop FRF is expressed as
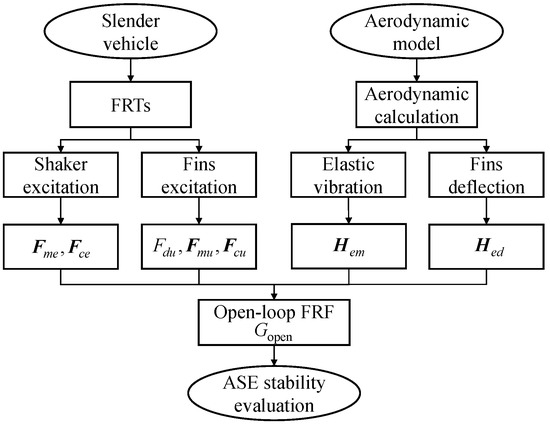
Figure 9.
Flow chart of ASE stability evaluation.
The Nyquist criterion is used for stability evaluation [32]. Because the elastic vehicle system is stable and the open-loop control system is stable, the Nyquist criterion can be expressed as follows: a necessary and sufficient condition for the closed-loop system to be asymptotically stable is that the Nyquist diagram does not touch or encircle the critical point, . The distance of the Nyquist diagram from the critical point is usually expressed in terms of the gain margin and phase margin.
The gain margin () is the inverse of the gain of the function at the phase crossover frequency (), for which (i.e., when the Nyquist diagram intersects the negative real axis):
The phase margin () is the phase of the function at the gain crossover frequency () for which (i.e., when the Nyquist diagram intersects the unit circle) minus :
4. Application of the Proposed Method
4.1. Description of the Slender Vehicle
4.1.1. Structural Parameters
In order to verify the feasibility and accuracy of the proposed method, a slender vehicle with an FCS was designed and manufactured. As shown in Figure 10, the body is composed of 14 cylindrical aluminum compartments, which are connected by steel counterweights. Only the horizontal fins were designed, and an ASE stability evaluation of the pitch channel is carried out. The FCS and actuators are located inside the body, and the IMU located on the upper surface. The measured mass is 310.6 kg, and the pitching moment of inertia is 652.0 kg.m2. The modal parameters of the slender vehicle are obtained through GVTs, using an LMS SCADAS data acquisition system and LMS Test Lab software [33]. The PolyMAX method is used for modal parameter identification. A spring hanging support is used to realize the free–free boundary conditions, for which the pitch and plunge frequencies are 1.10 Hz and 1.30 Hz, respectively, with damping ratios of 6.0% and 3.0%, respectively. The measured mode frequencies of the first and second bending modes are 18.0 Hz and 50.2 Hz, respectively, with damping ratios of 0.45% and 0.55%, respectively.

Figure 10.
Schematic diagram of the slender vehicle.
4.1.2. Servo Control Systems
The servo control systems of the slender vehicle are composed of an IMU, FCS, and actuator system, with a working cycle of 5 ms. The IMU is an SBG Ellipse2 miniature inertial system, and the FCS is a TMS320C6747 fixed- and floating-point digital signal processor. The IMU is placed at two positions of the body: 0.625 m (U1) and 1.725 m (U2) away from the head. Using pitch-rate feedback, two different control laws (C1 and C2) are used in this paper, which can be written as
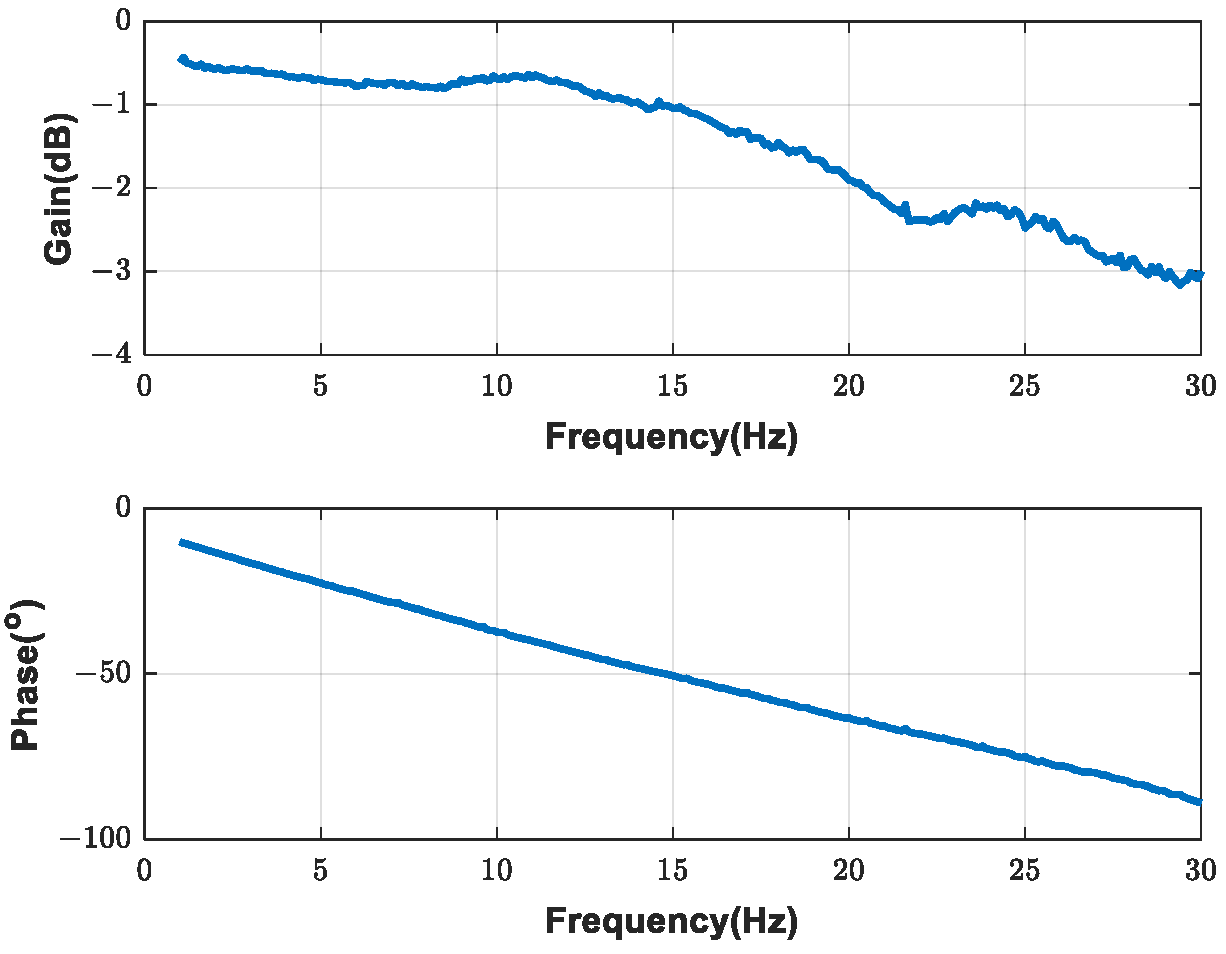
The experimental FRF of the actuator system is shown in Figure 11.
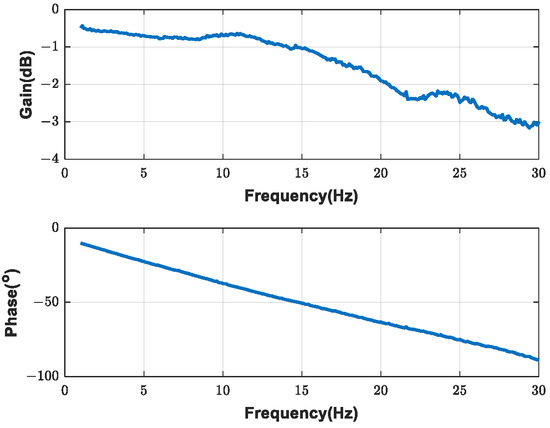
Figure 11.
Experimental FRF of the actuator system.
4.1.3. Aerodynamic Derivative
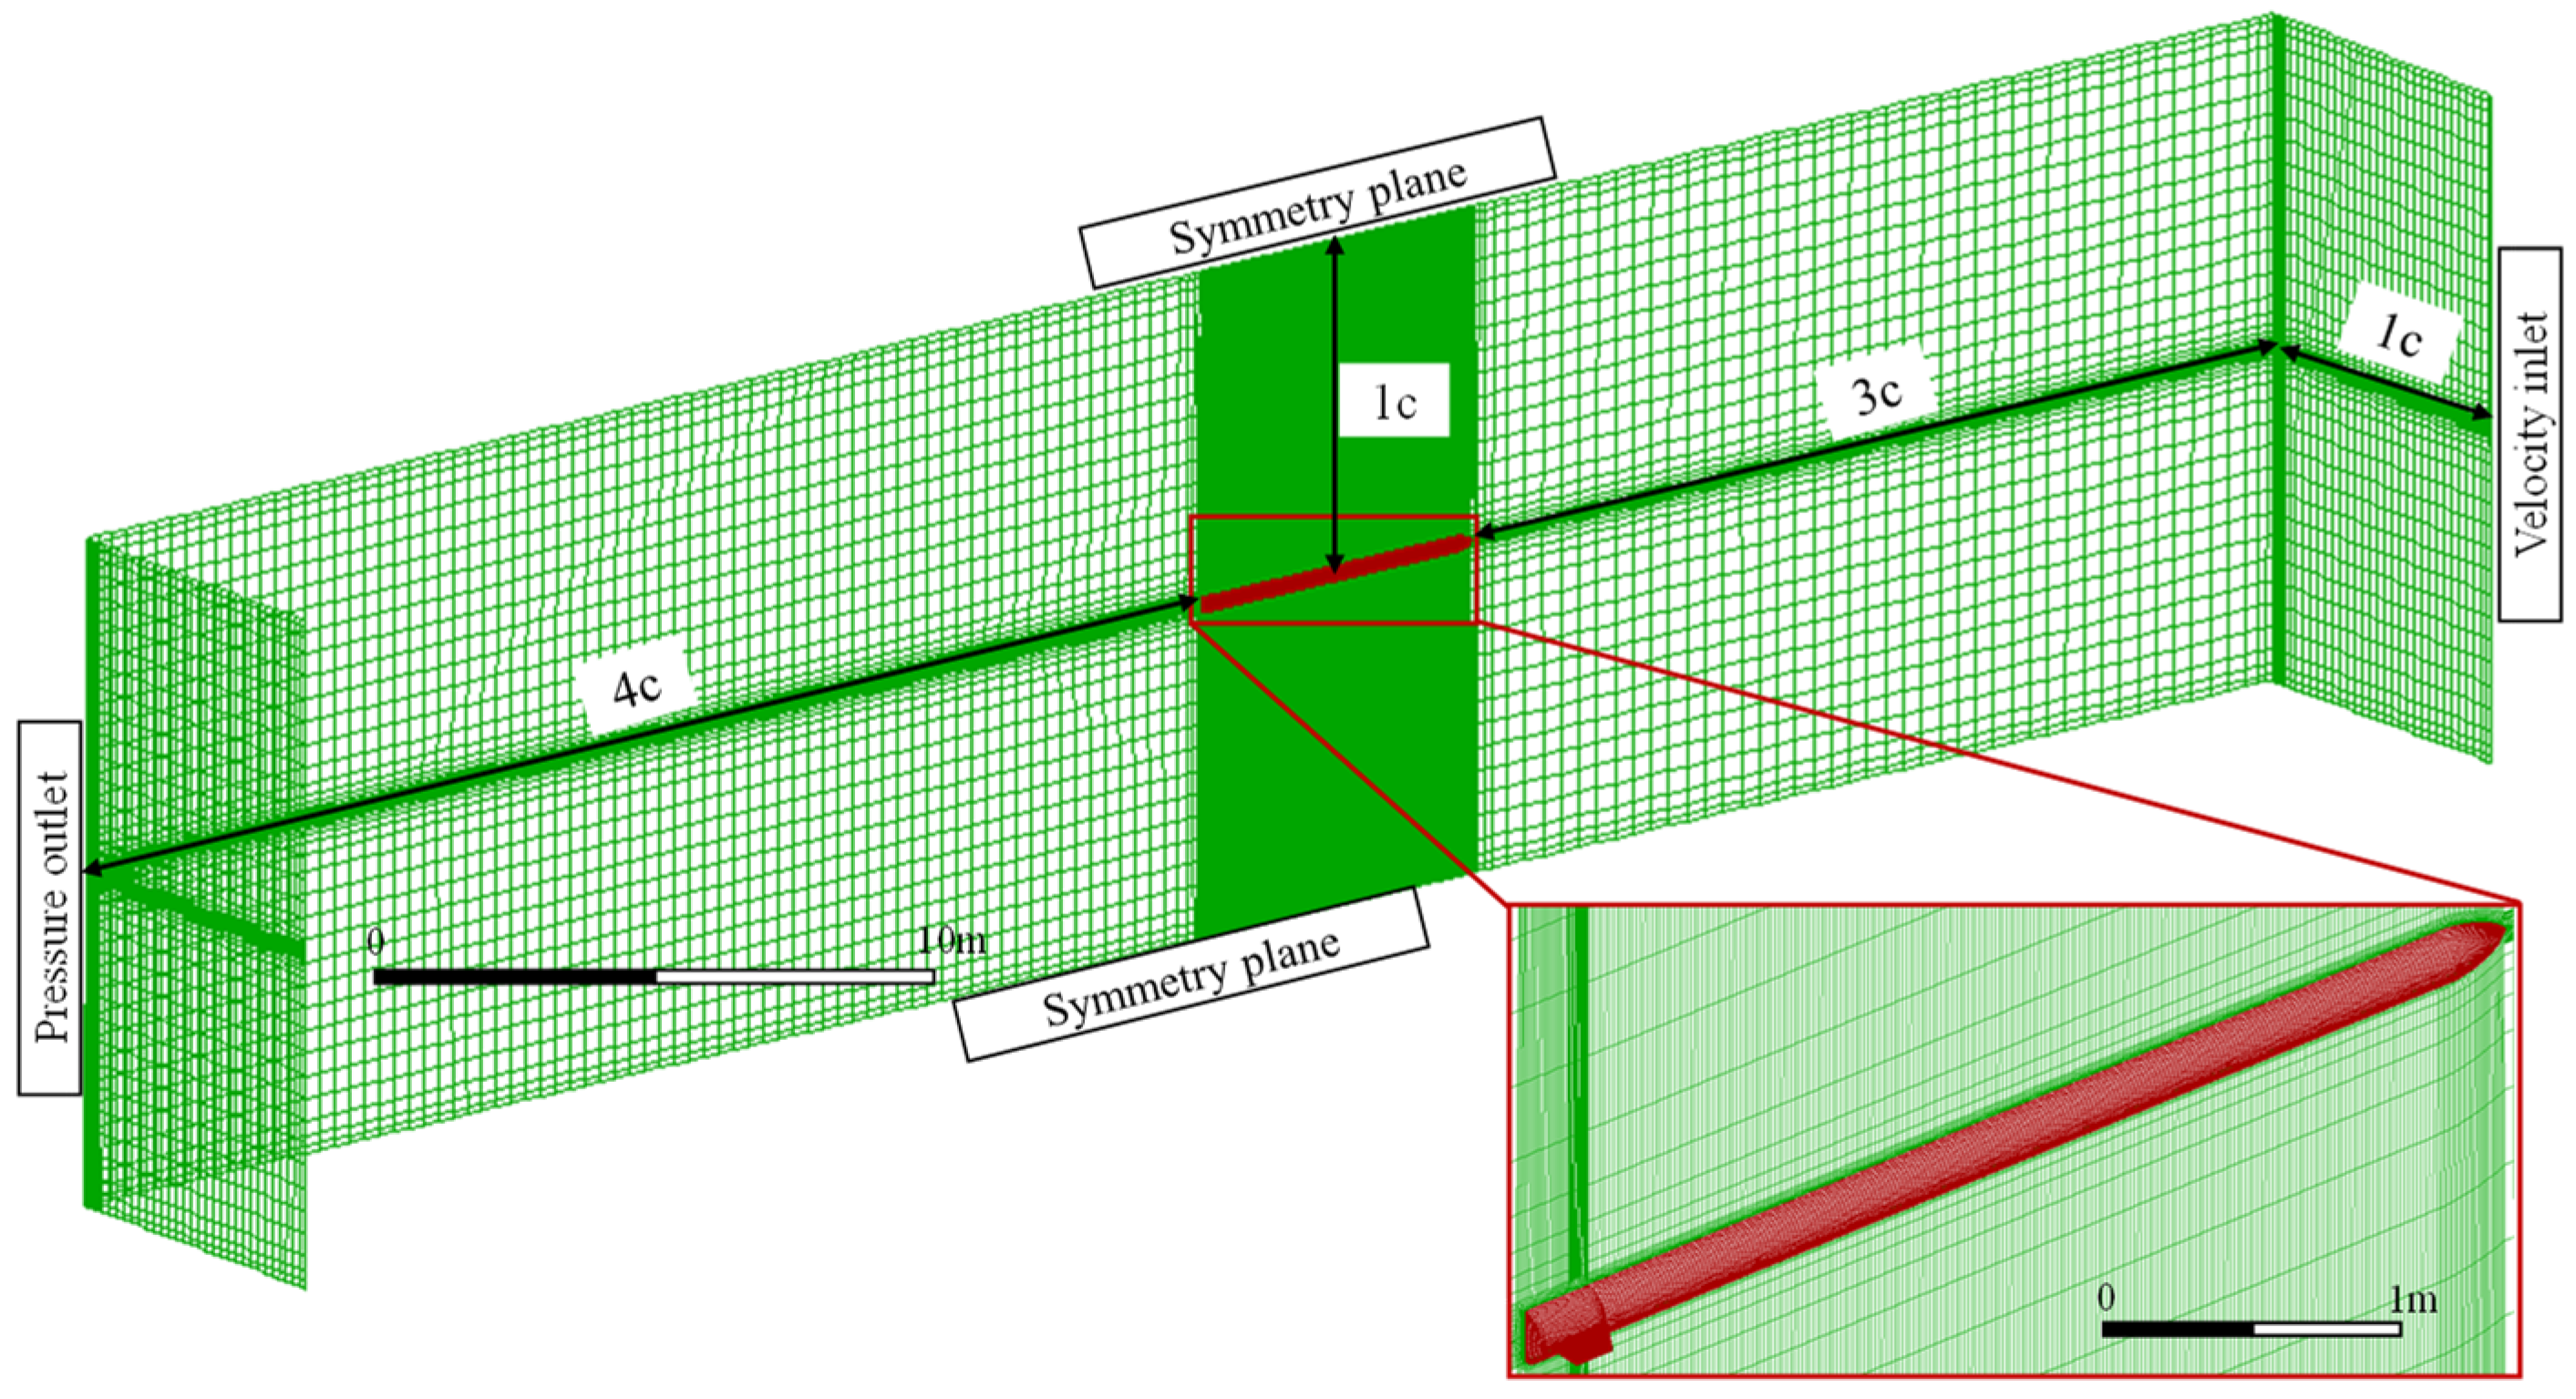
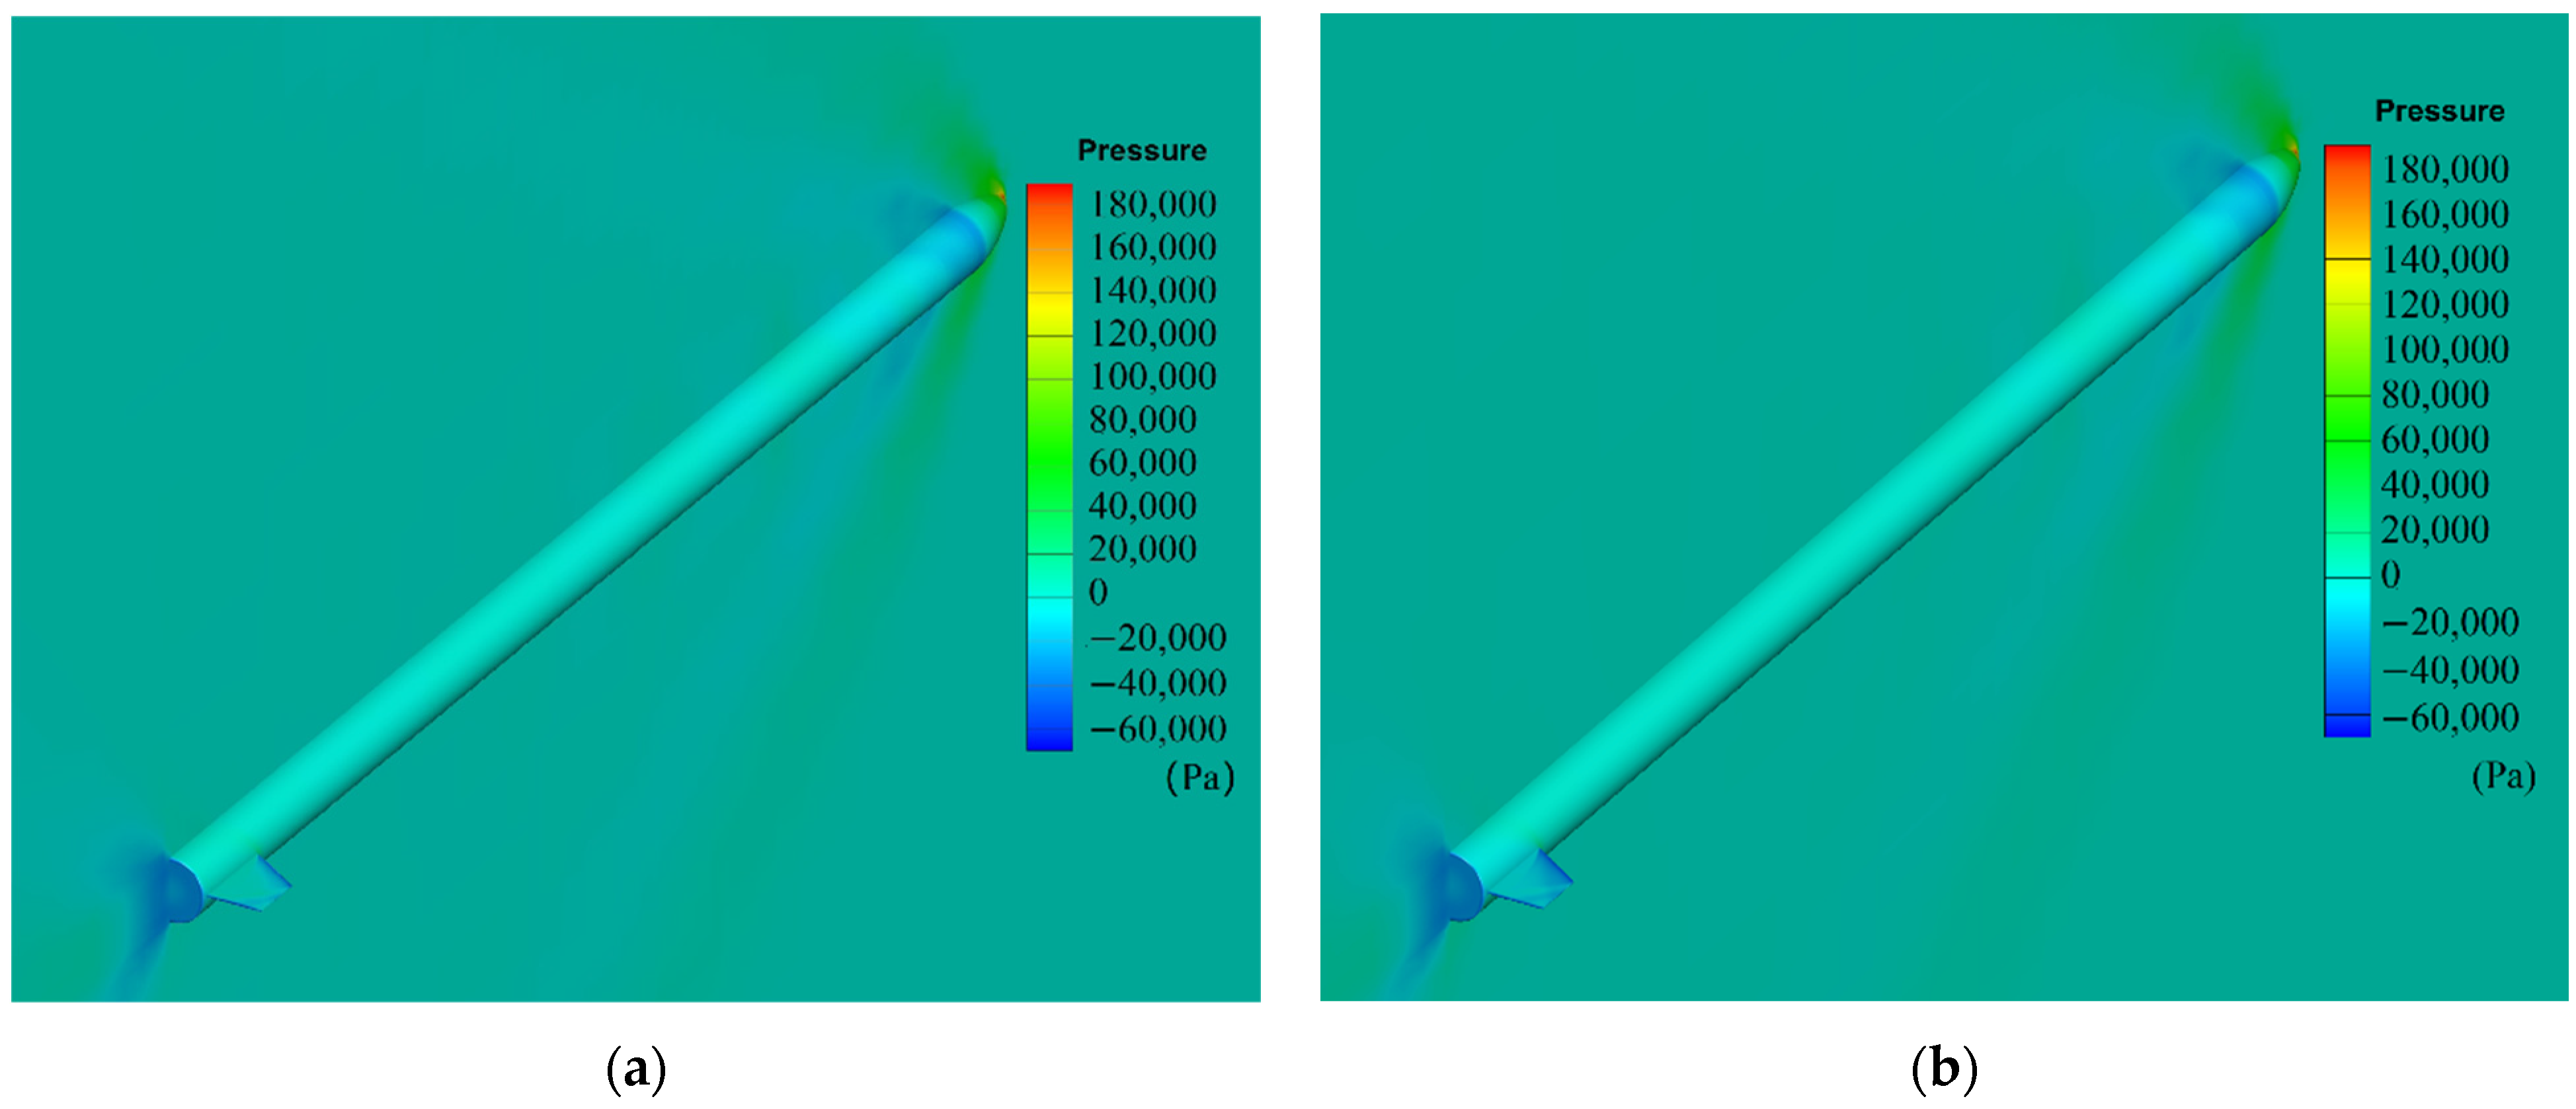
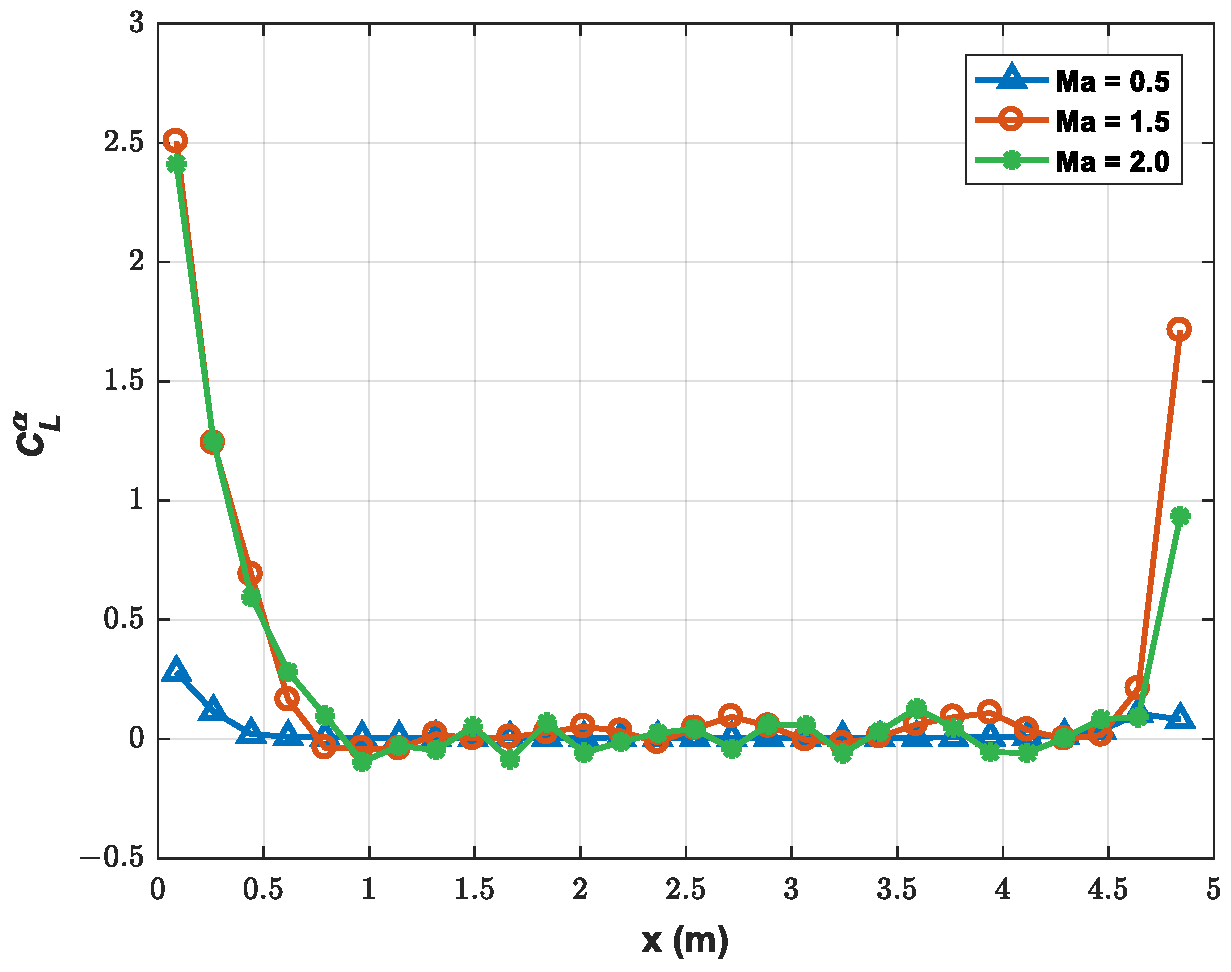
The quasi-steady aerodynamic derivative method is used to calculate the aerodynamic forces. The body is divided into 28 aerodynamic segments, and each fin (right and left) is taken as an independent aerodynamic segment, as shown in Figure 12. The aerodynamic derivatives of each segment of the slender vehicle are calculated using a commercial CFD solver. The structured mesh that satisfies the grid independence test is shown in Figure 13, in which represents the length of the slender vehicle, and the total number of nodes is about 3.56 million. The altitude is taken as sea level, and the calculated Mach numbers are 0.5, 1.5, and 2.0. The aerodynamic force on each segment is the resultant force of all its aerodynamic grids, and the projected areas of each segment in the X–Y plane are used as the area of the segment. The aerodynamic derivatives of each segment of the body are obtained by calculating the aerodynamic forces at and angles of attack. The pressure distribution diagram at Ma = 1.5 is shown in Figure 14. For Mach numbers of 0.5, 1.5, and 2.0, the aerodynamic derivatives of each segment of the body are shown in Figure 15, and the aerodynamic derivatives of the fin are 3.068/rad, 3.132/rad, and 2.603/rad, respectively.

Figure 12.
Aerodynamic segment division of the slender vehicle.
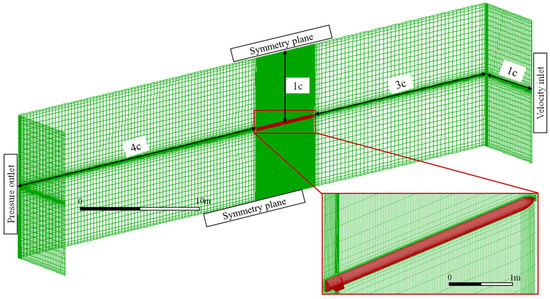
Figure 13.
Computational mesh and boundary conditions.
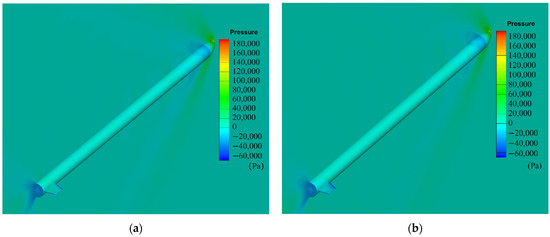
Figure 14.
Pressure distribution at Ma = 1.5. (a) Angle of attack is . (b) Angle of attack is .
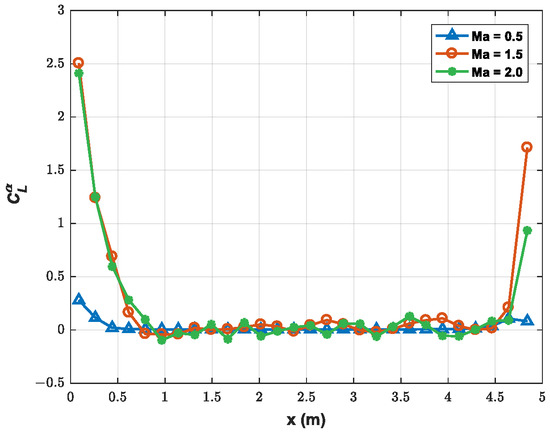
Figure 15.
Aerodynamic derivatives of the body segments.
4.2. Model of Theoretical ASE
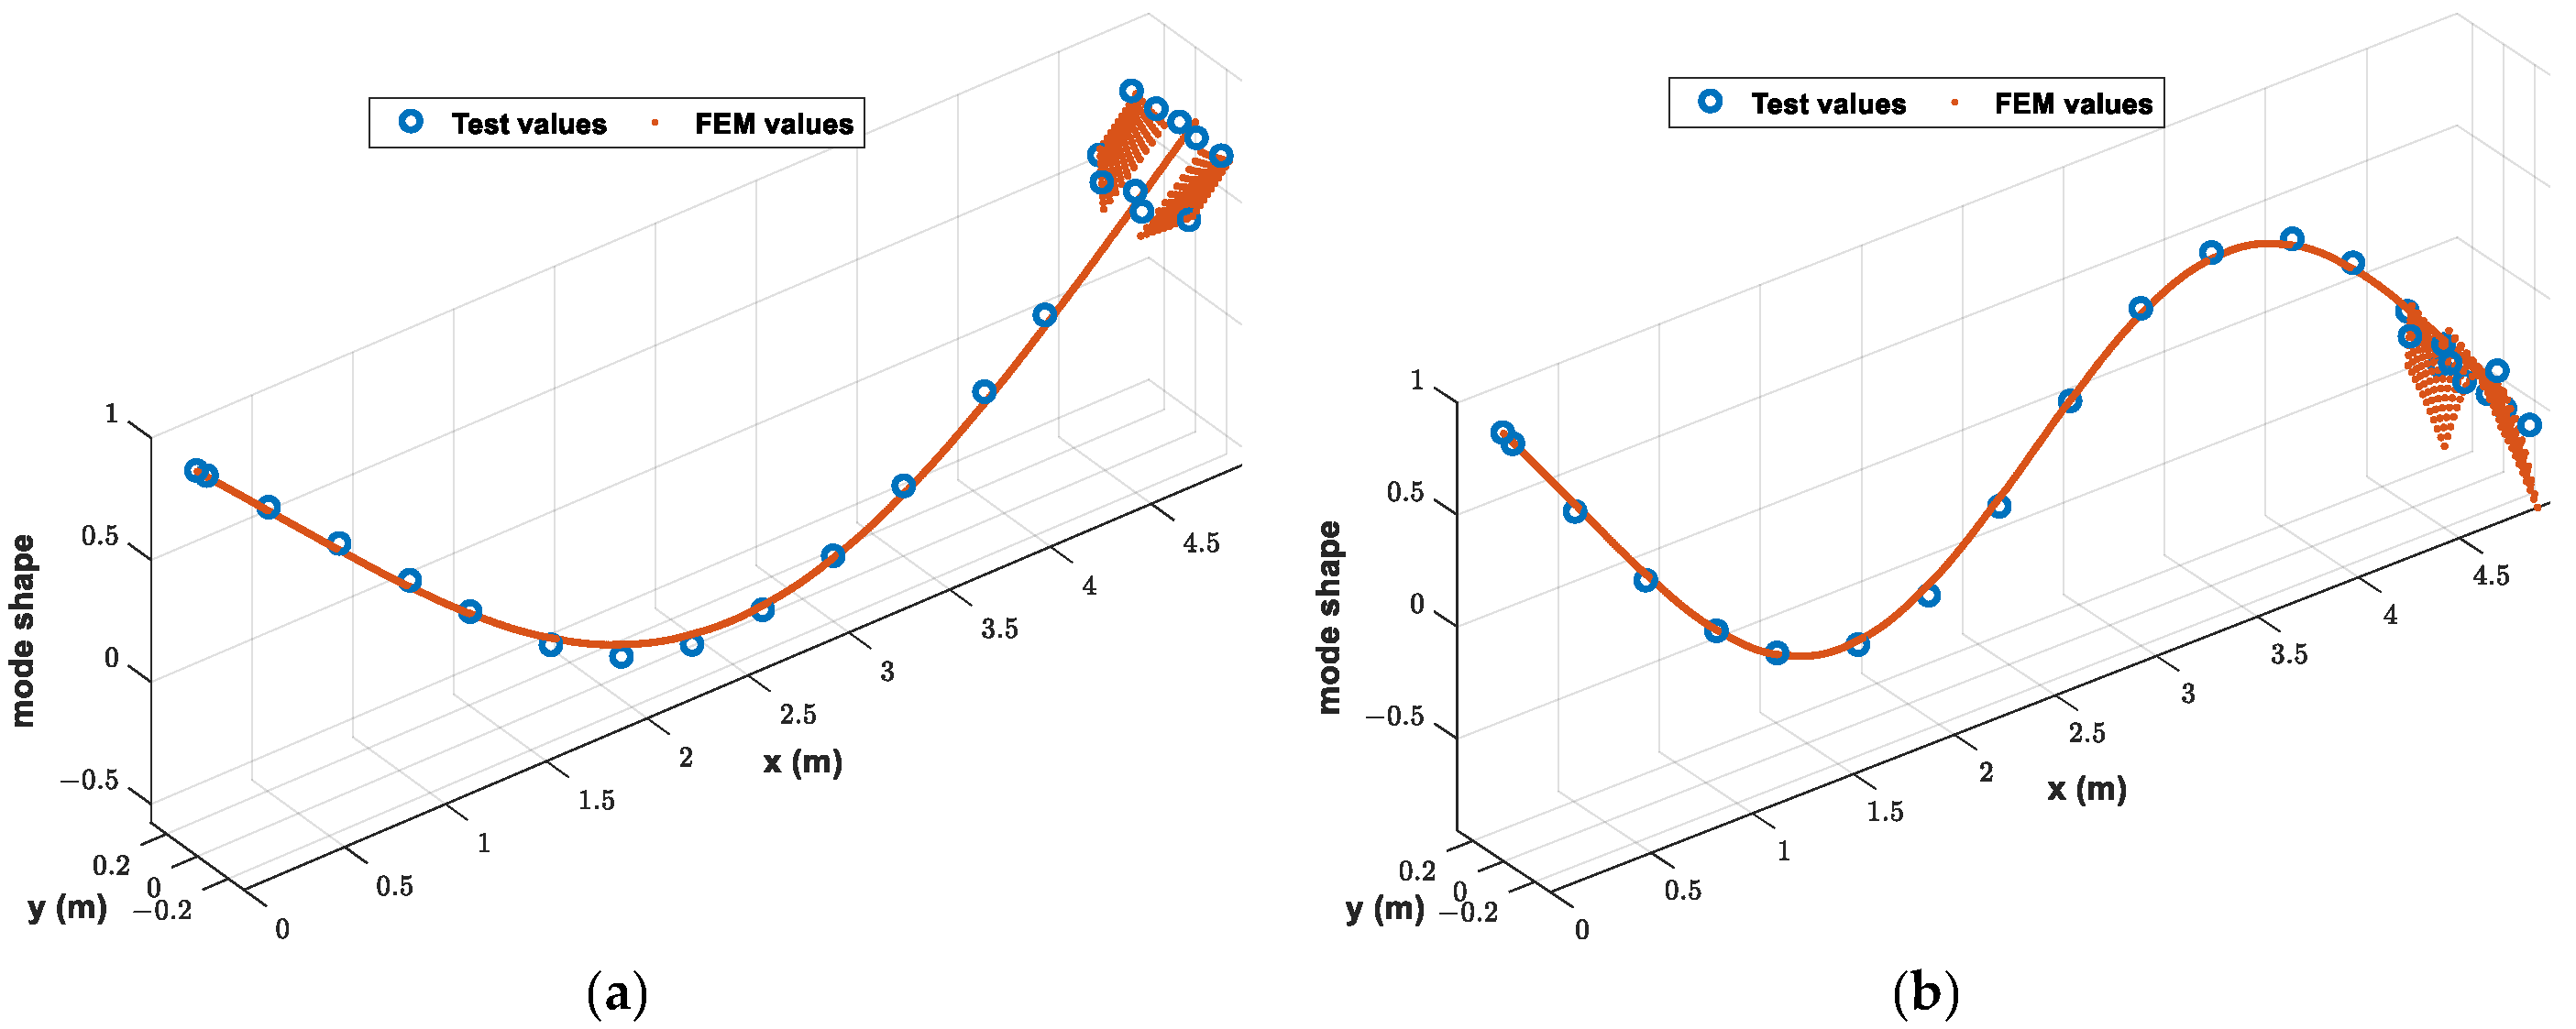
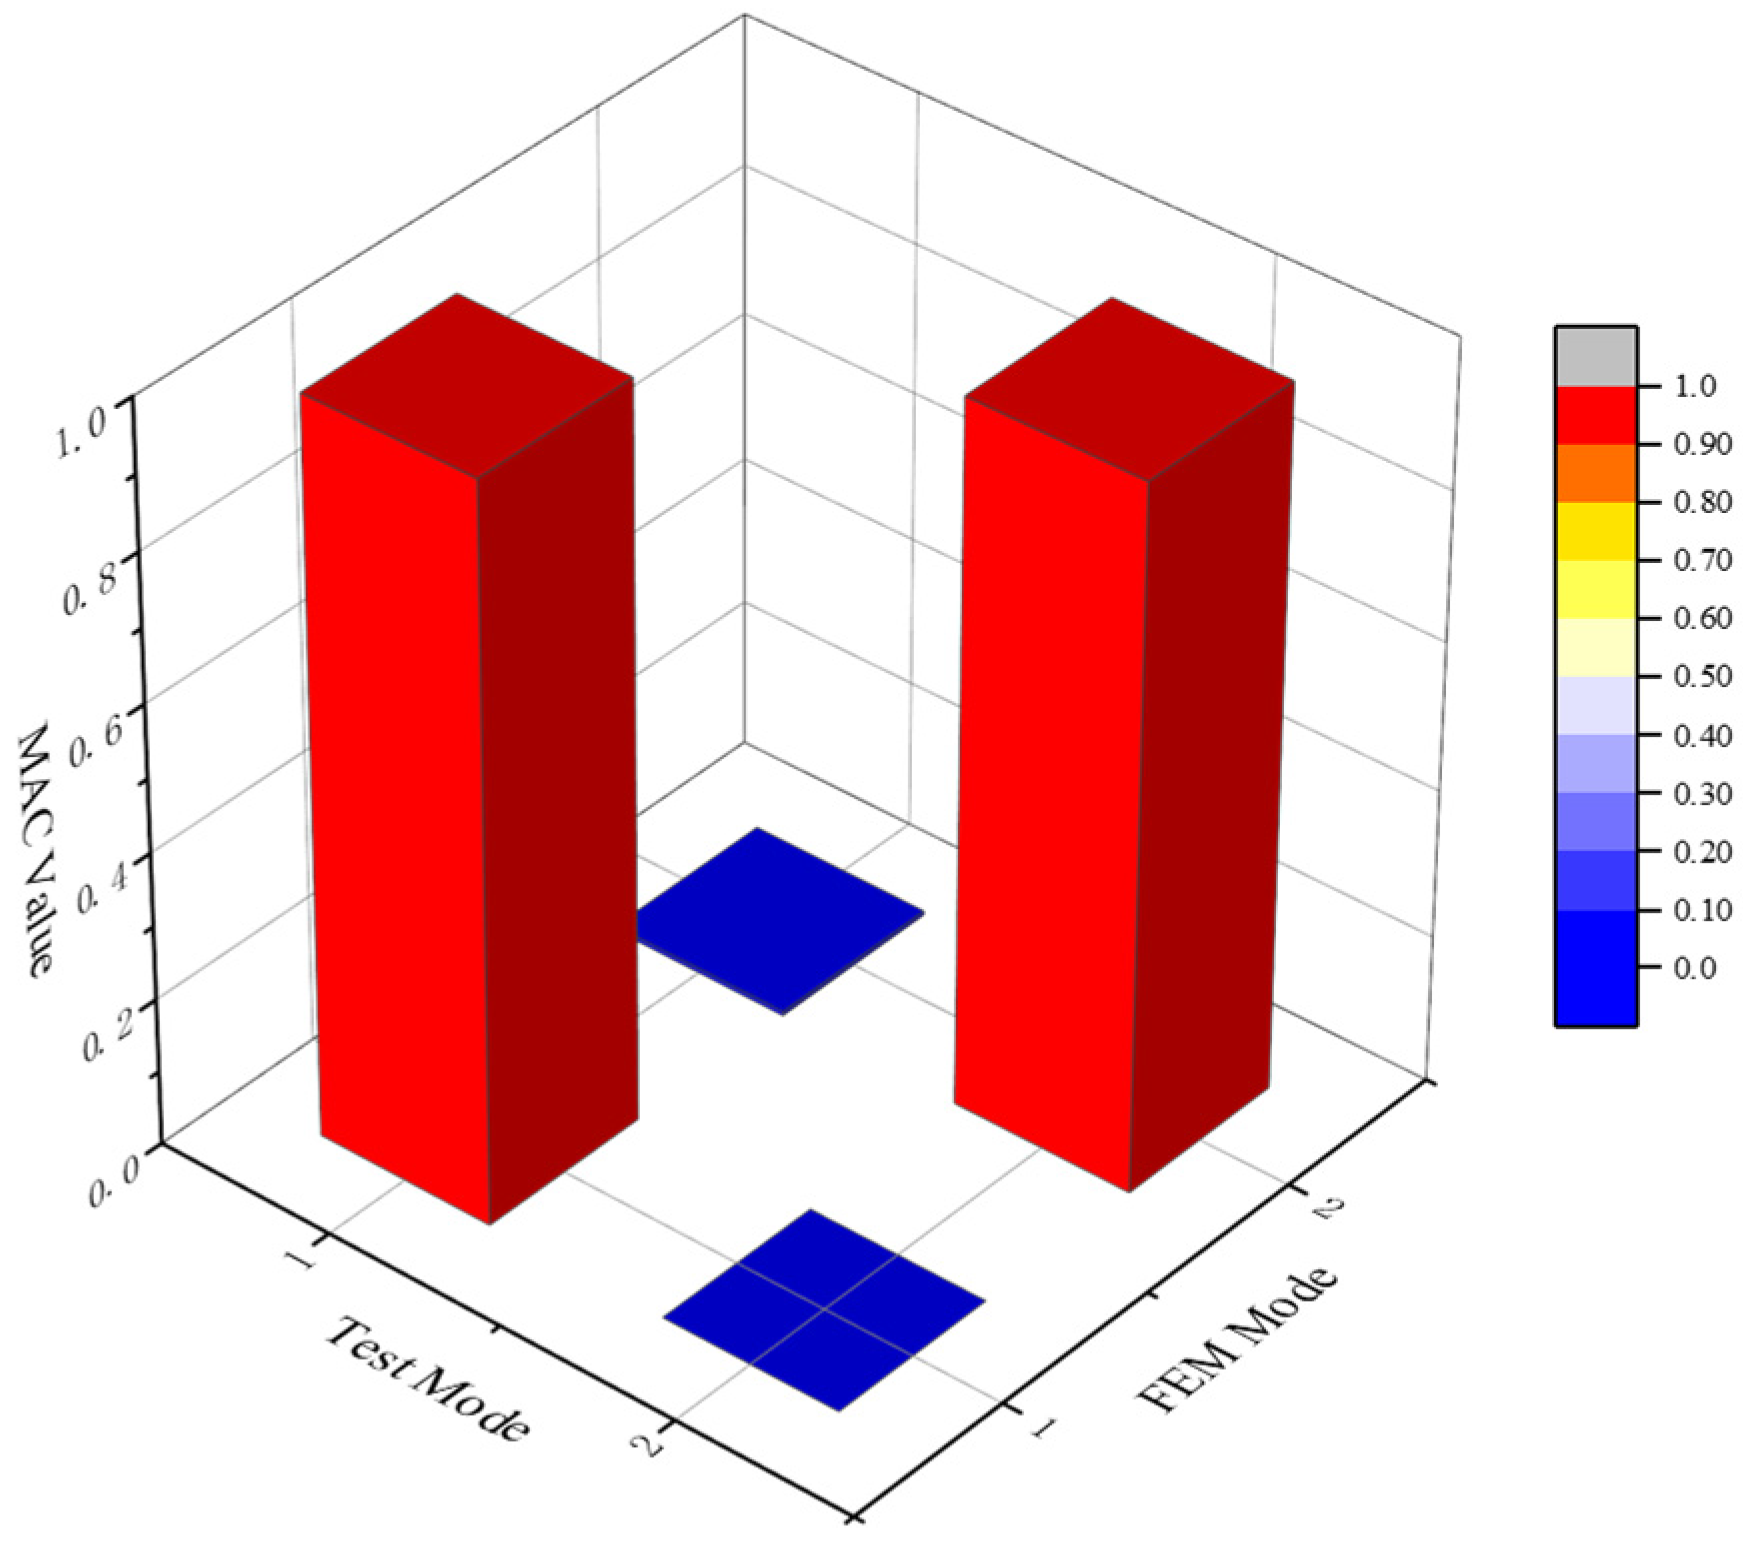
The nominal results of the slender vehicle acquired from the theoretical ASE stability analysis are used for comparison with the results of the proposed method. The theoretical ASE model is established under free–free boundary conditions, and the numerical models of the structure and servo control systems are updated according to the test values. The updated mode shapes are shown in Figure 16. It can be seen that the FEM values are in good agreement with the test values. A diagram of the MAC (modal assurance criterion) values between test and FEM mode shapes is shown in Figure 17. MAC values of the first bending mode and the second bending mode are 0.99 and 0.95 respectively, which means that the test and FEM mode shapes are highly correlated and almost identical. The measured mode frequencies and mode damping ratios are used directly in the theoretical model, as in the experimental FRF of the actuator system. The control law is the discrete transfer function model of Equation (31) and the sampling delays of digital servo control systems are considered. The servo control systems have a pure delay of 15 ms according to the FRT of fin excitation. The numerical models are modified by the test date and use the same aerodynamic data as the proposed method; therefore, the theoretical ASE stability analysis results can be considered to be relatively accurate and used as the nominal results.
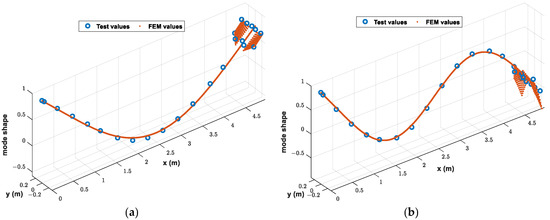
Figure 16.
Mode shapes of test and FEM. (a) First bending mode. (b) Second bending mode.
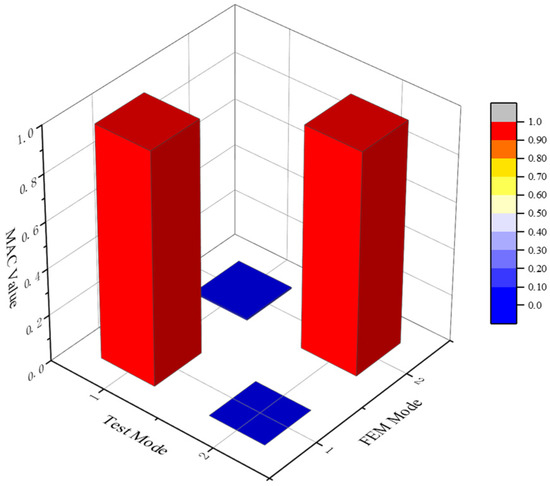
Figure 17.
MAC value between test and FEM mode shapes.
4.3. Locations of Excitation and Measurement Points
The ASE stability of the slender vehicle described in this paper is mainly affected by the plunge, pitch, and first bending modes. Within the interest frequency range, the fins conform to rigidity and symmetry assumptions. The rigidity assumption is illustrated by the mode shapes shown in Figure 16, in which the fins can be regarded as rigid in the first bending mode. The symmetry assumption is that the motion and the unsteady aerodynamic forces of the fins in the pitch channel are symmetrical, and the resultant forces are located on the centerline of the body. According to these two assumptions, the projection point on the body of the pressure point of the fin can be selected as the excitation point, and the measurement points are arranged at the leading and trailing edges of the chord line. For the body, the excitation and measurement points can be approximately evenly distributed. The locations are listed in Table 1 and illustrated in Figure 18. The beam spline method is adopted for the body, and the rigid-body interpolation method is adopted for the fin. A mode comparison is shown in Figure 19. It can be seen that the interpolated modes are in good agreement with the target modes for the first and second bending modes, which indicates that the locations of excitation and measurement points are appropriate.

Table 1.
Locations of excitation and measurement points.

Figure 18.
Locations of excitation and measurement points.

Figure 19.
Comparison of target modes and interpolated modes. (a) and . (b) and . (c) and .
4.4. FRT Procedure
4.4.1. FRT Setup and Implementation
In the FRTs, a spring hanging support is used, and the pitch and plunge frequencies are 1.10 Hz and 1.30 Hz, which are kept far below that of the first elastic mode. A shaker (MB Dynamics Model 110) is used in the test, accelerometers (PCB 333B30) are used to collect the acceleration signals, and a force sensor (Kisler 9712b250) is used to collect the force signals. The FRFs of the excitation forces to the displacements are obtained by frequency-domain integration of the acceleration signals. For signal generation and acquisition, a real-time PXIe module is used, with a sampling frequency of 200 Hz. An embedded controller (PXIe-8840) is used for two-way communication between the host computer and the PXIe module. An analog input module (PXIe-4309) is used to collect the acceleration and force signals. An analog output module (PXIe-6738) is used to output the drive signals of the shaker. A serial interface module (PXIe-8431/8) is used for two-way communication between the FCS and the PXIe module, which includes the acquisition of the FCS command signals and transmission of the actuator drive signals.
The FRTs involve two processes, with the frequency of the excitation signals in the range of 1–30 Hz and with a frequency resolution of 0.1 Hz:
(1) Shaker excitation: Photographs of the test implementation are shown in Figure 20. A shaker is used to excite four excitation points, with a burst random signal. The signals to be collected synchronously for each excitation comprise the excitation force signal, the acceleration signals, and the control law command signal. The H1 method is used for identification of the FRFs [34].
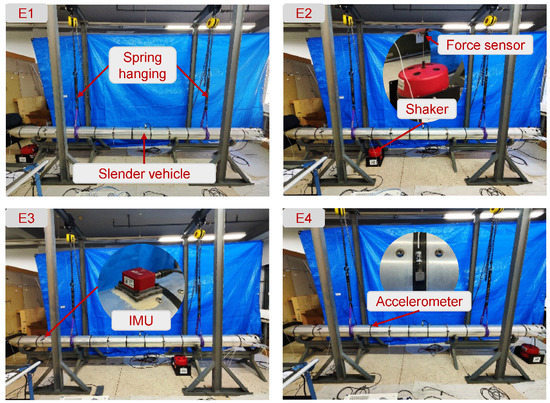
Figure 20.
FRTs of shaker excitation.
(2) Fin excitation: A sine-step-sweep signal is used. The FCS receives the actuator driving command signal from the PXIe module to drive the fins. The synchronously collected signals comprise the acceleration signals of the six measurement points on the body, the fin deflection response signal, and the control law command signal. A least-squares frequency response evaluation method is used [13].
To avoid the error and uncertainty arising from a single test and considering that there are inevitably nonlinear factors in real structures, six groups of shaker excitation tests with different excitation force peaks and two groups of fin excitation tests with different deflection angles are carried out.
According to the different positions of the IMU (U1 and U2) and the different control laws (C1 and C2), the FRTs have four states, which are recorded as U1C1, U1C2, U2C1, and U2C2.
4.4.2. FRF Identification
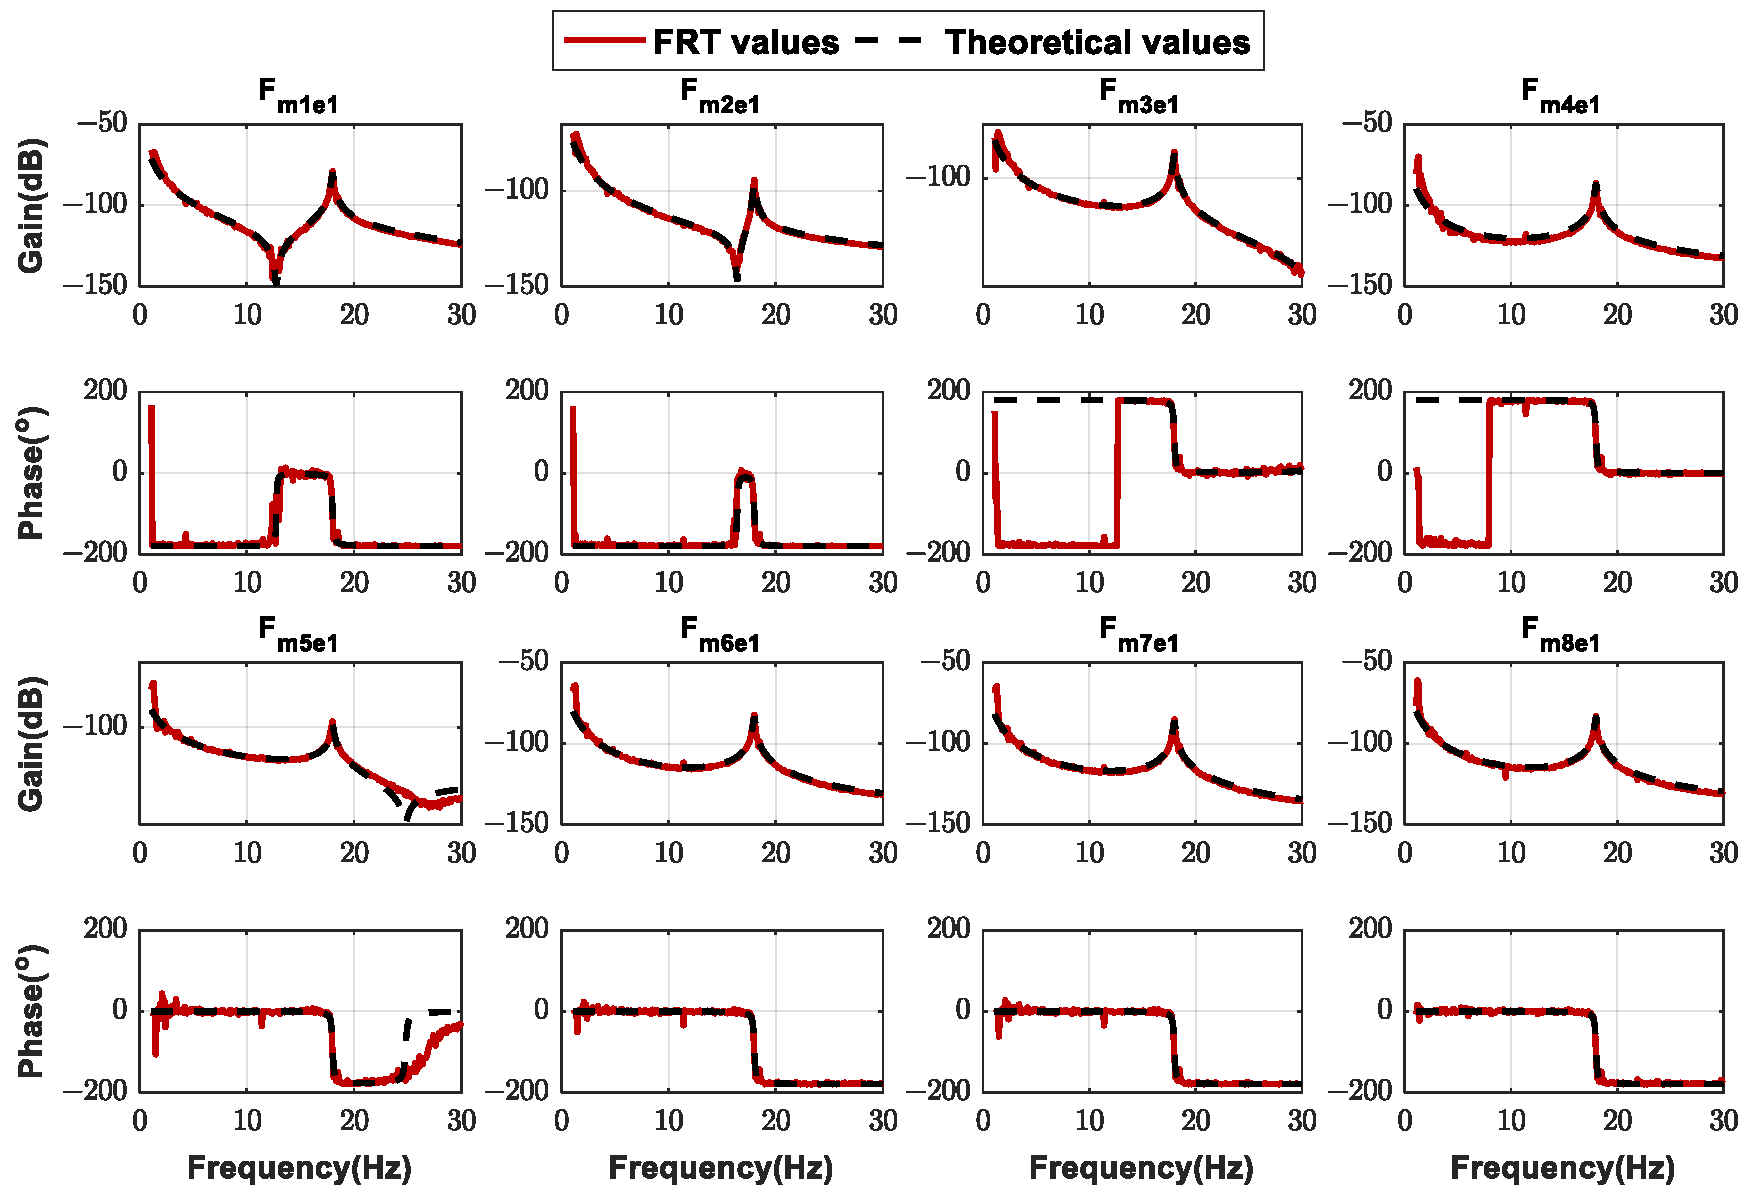
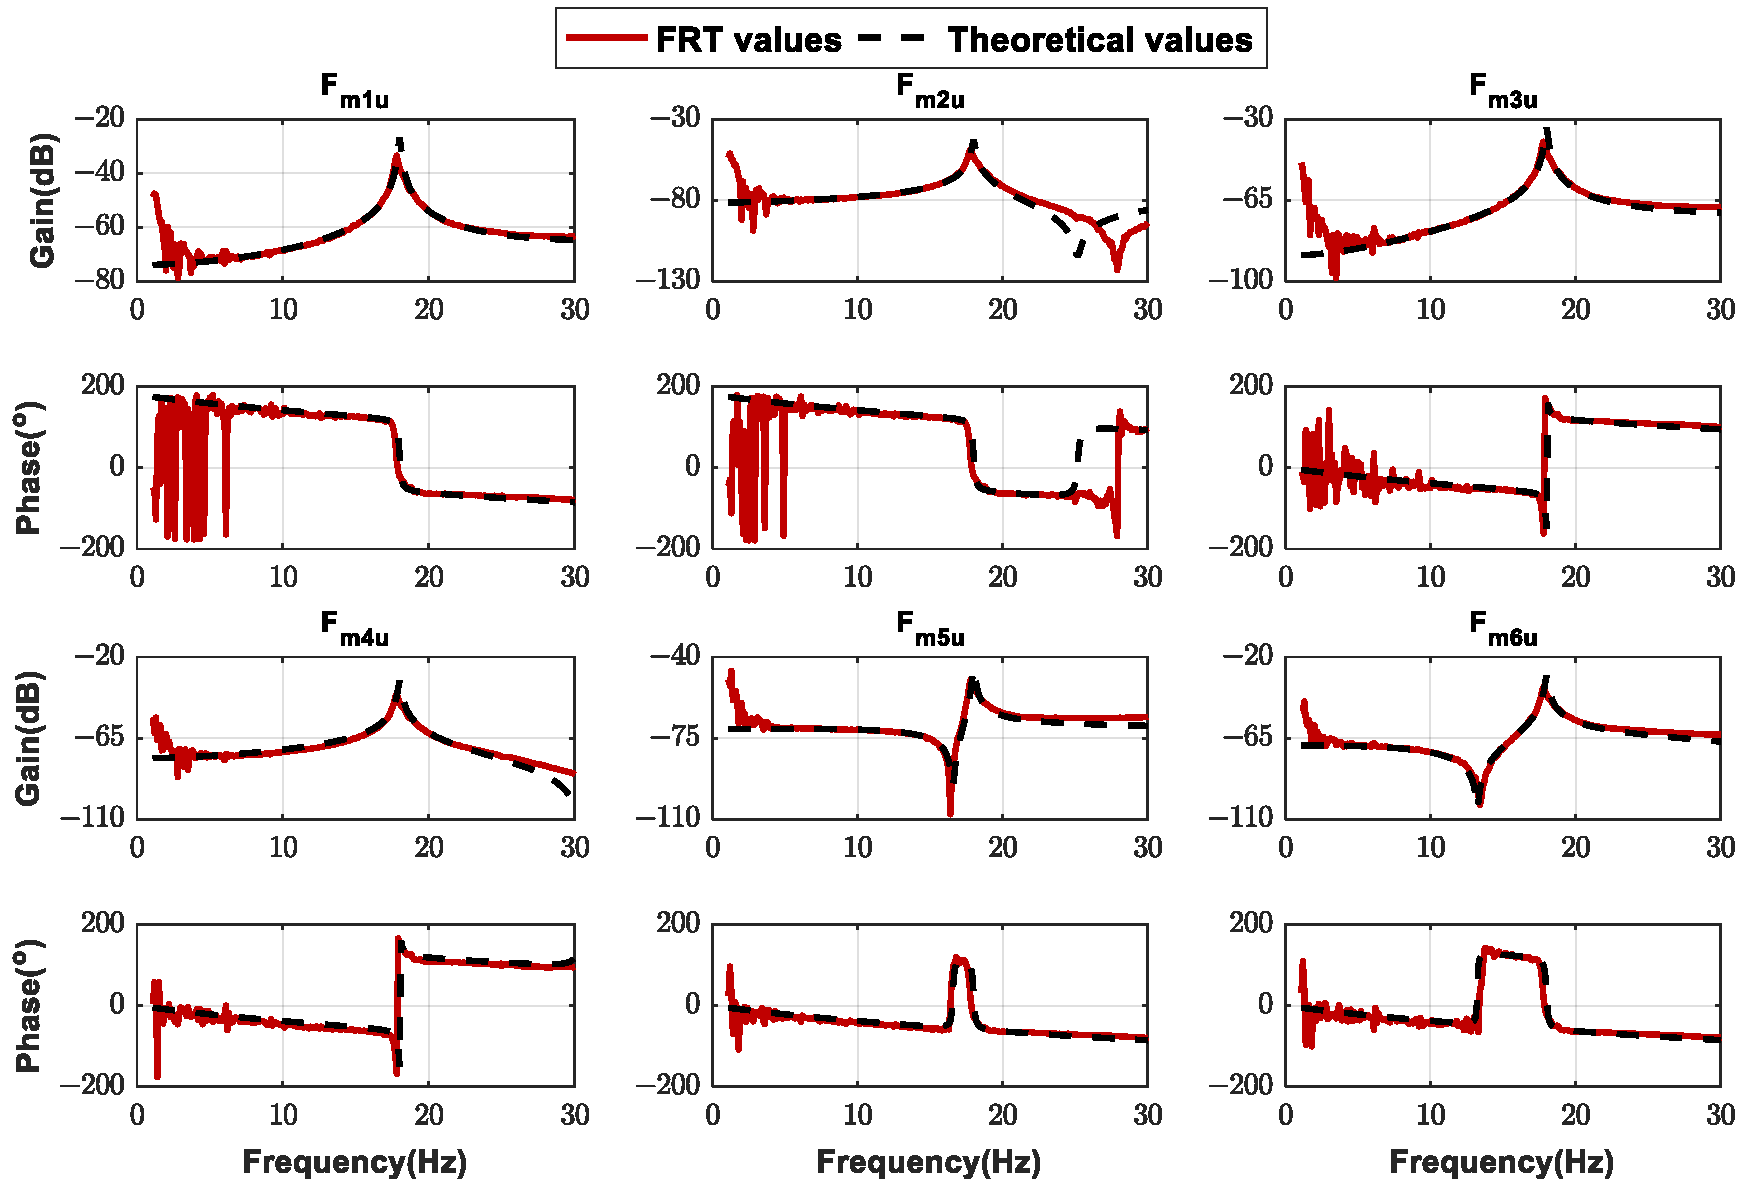
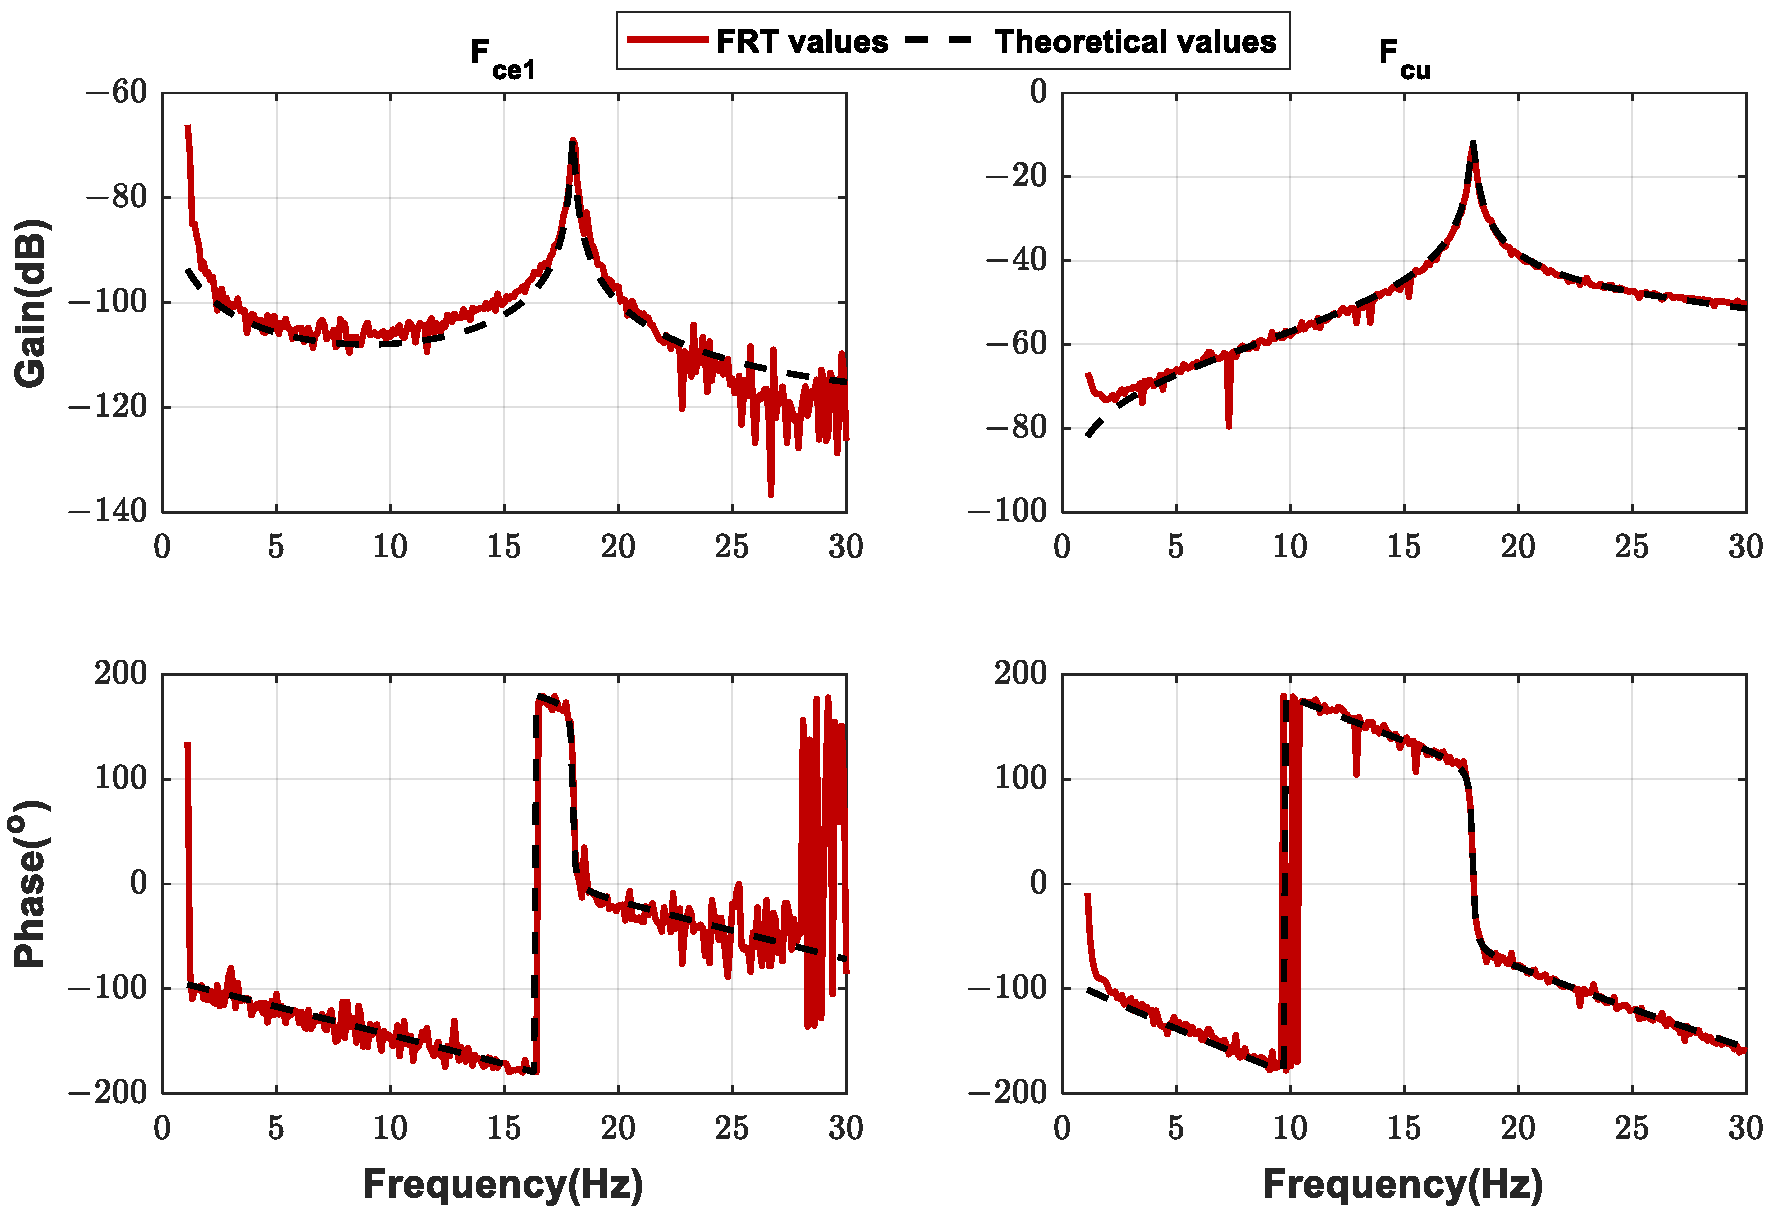
Taking a group of U1C1 test data as an example, we compare the FRFs identified by the test data with the theoretical FRFs. Figure 21 shows the FRFs of the excitation forces at the E1 excitation point to the displacements at the eight measurement points. Figure 22 shows the FRFs of the fin driving command signal to the displacements at the six measurement points of body. Figure 23 shows the FRFs of the E1 excitation forces and the fin driving command signal to the control law command signal. It can be seen that the FRFs obtained from the tests are of high quality and in good agreement with the theoretical values in the interest frequency range. Affected by the spring hanging, there is a certain deviation between the test values and the theoretical values in the low-frequency range (three times the hanging frequencies in general). There is obvious noisy interference in the FRFs close to the frequency boundaries of the excitation signal (1 Hz and 30 Hz). In general, the experimental values provide a more accurate reflection of the frequency characteristics of the real structure and servo control systems than the theoretical values.
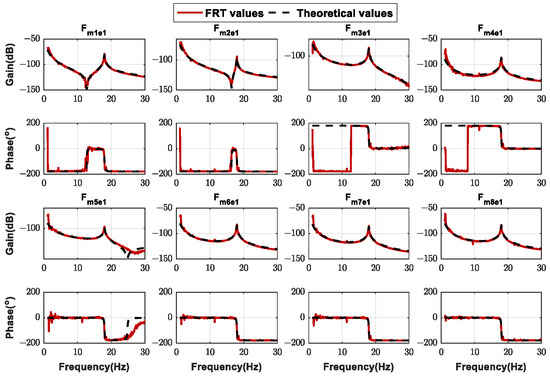
Figure 21.
Comparison of FRFs between FRT values and theoretical values: .

Figure 22.
Comparison of FRFs between FRT values and theoretical values: .
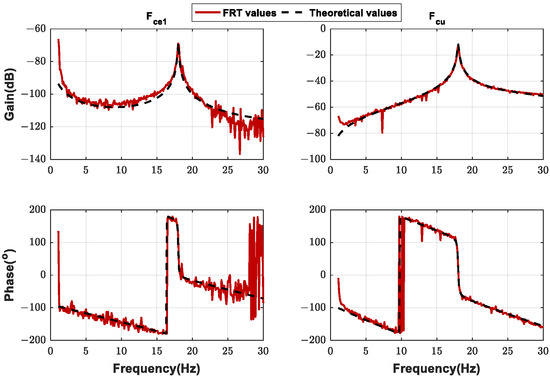
Figure 23.
Comparison of FRFs between FRT values and theoretical values: and .
5. Results and Discussion
5.1. Stability Results of Single Group Test Data
A group of test data of the four states is selected as an example, and the ASE open-loop FRF is calculated in combination with the aerodynamic FRFs at Ma = 1.5. For the open-loop FRF obtained from the test data, the upper envelope of the gain–frequency curve is constructed after removing obviously abnormal data and is then used to calculate the gain margin. The phase crossover frequency is calculated according to the Nyquist criterion, and the gain of the upper envelope at this frequency obtained by linear interpolation is regarded as the gain margin.
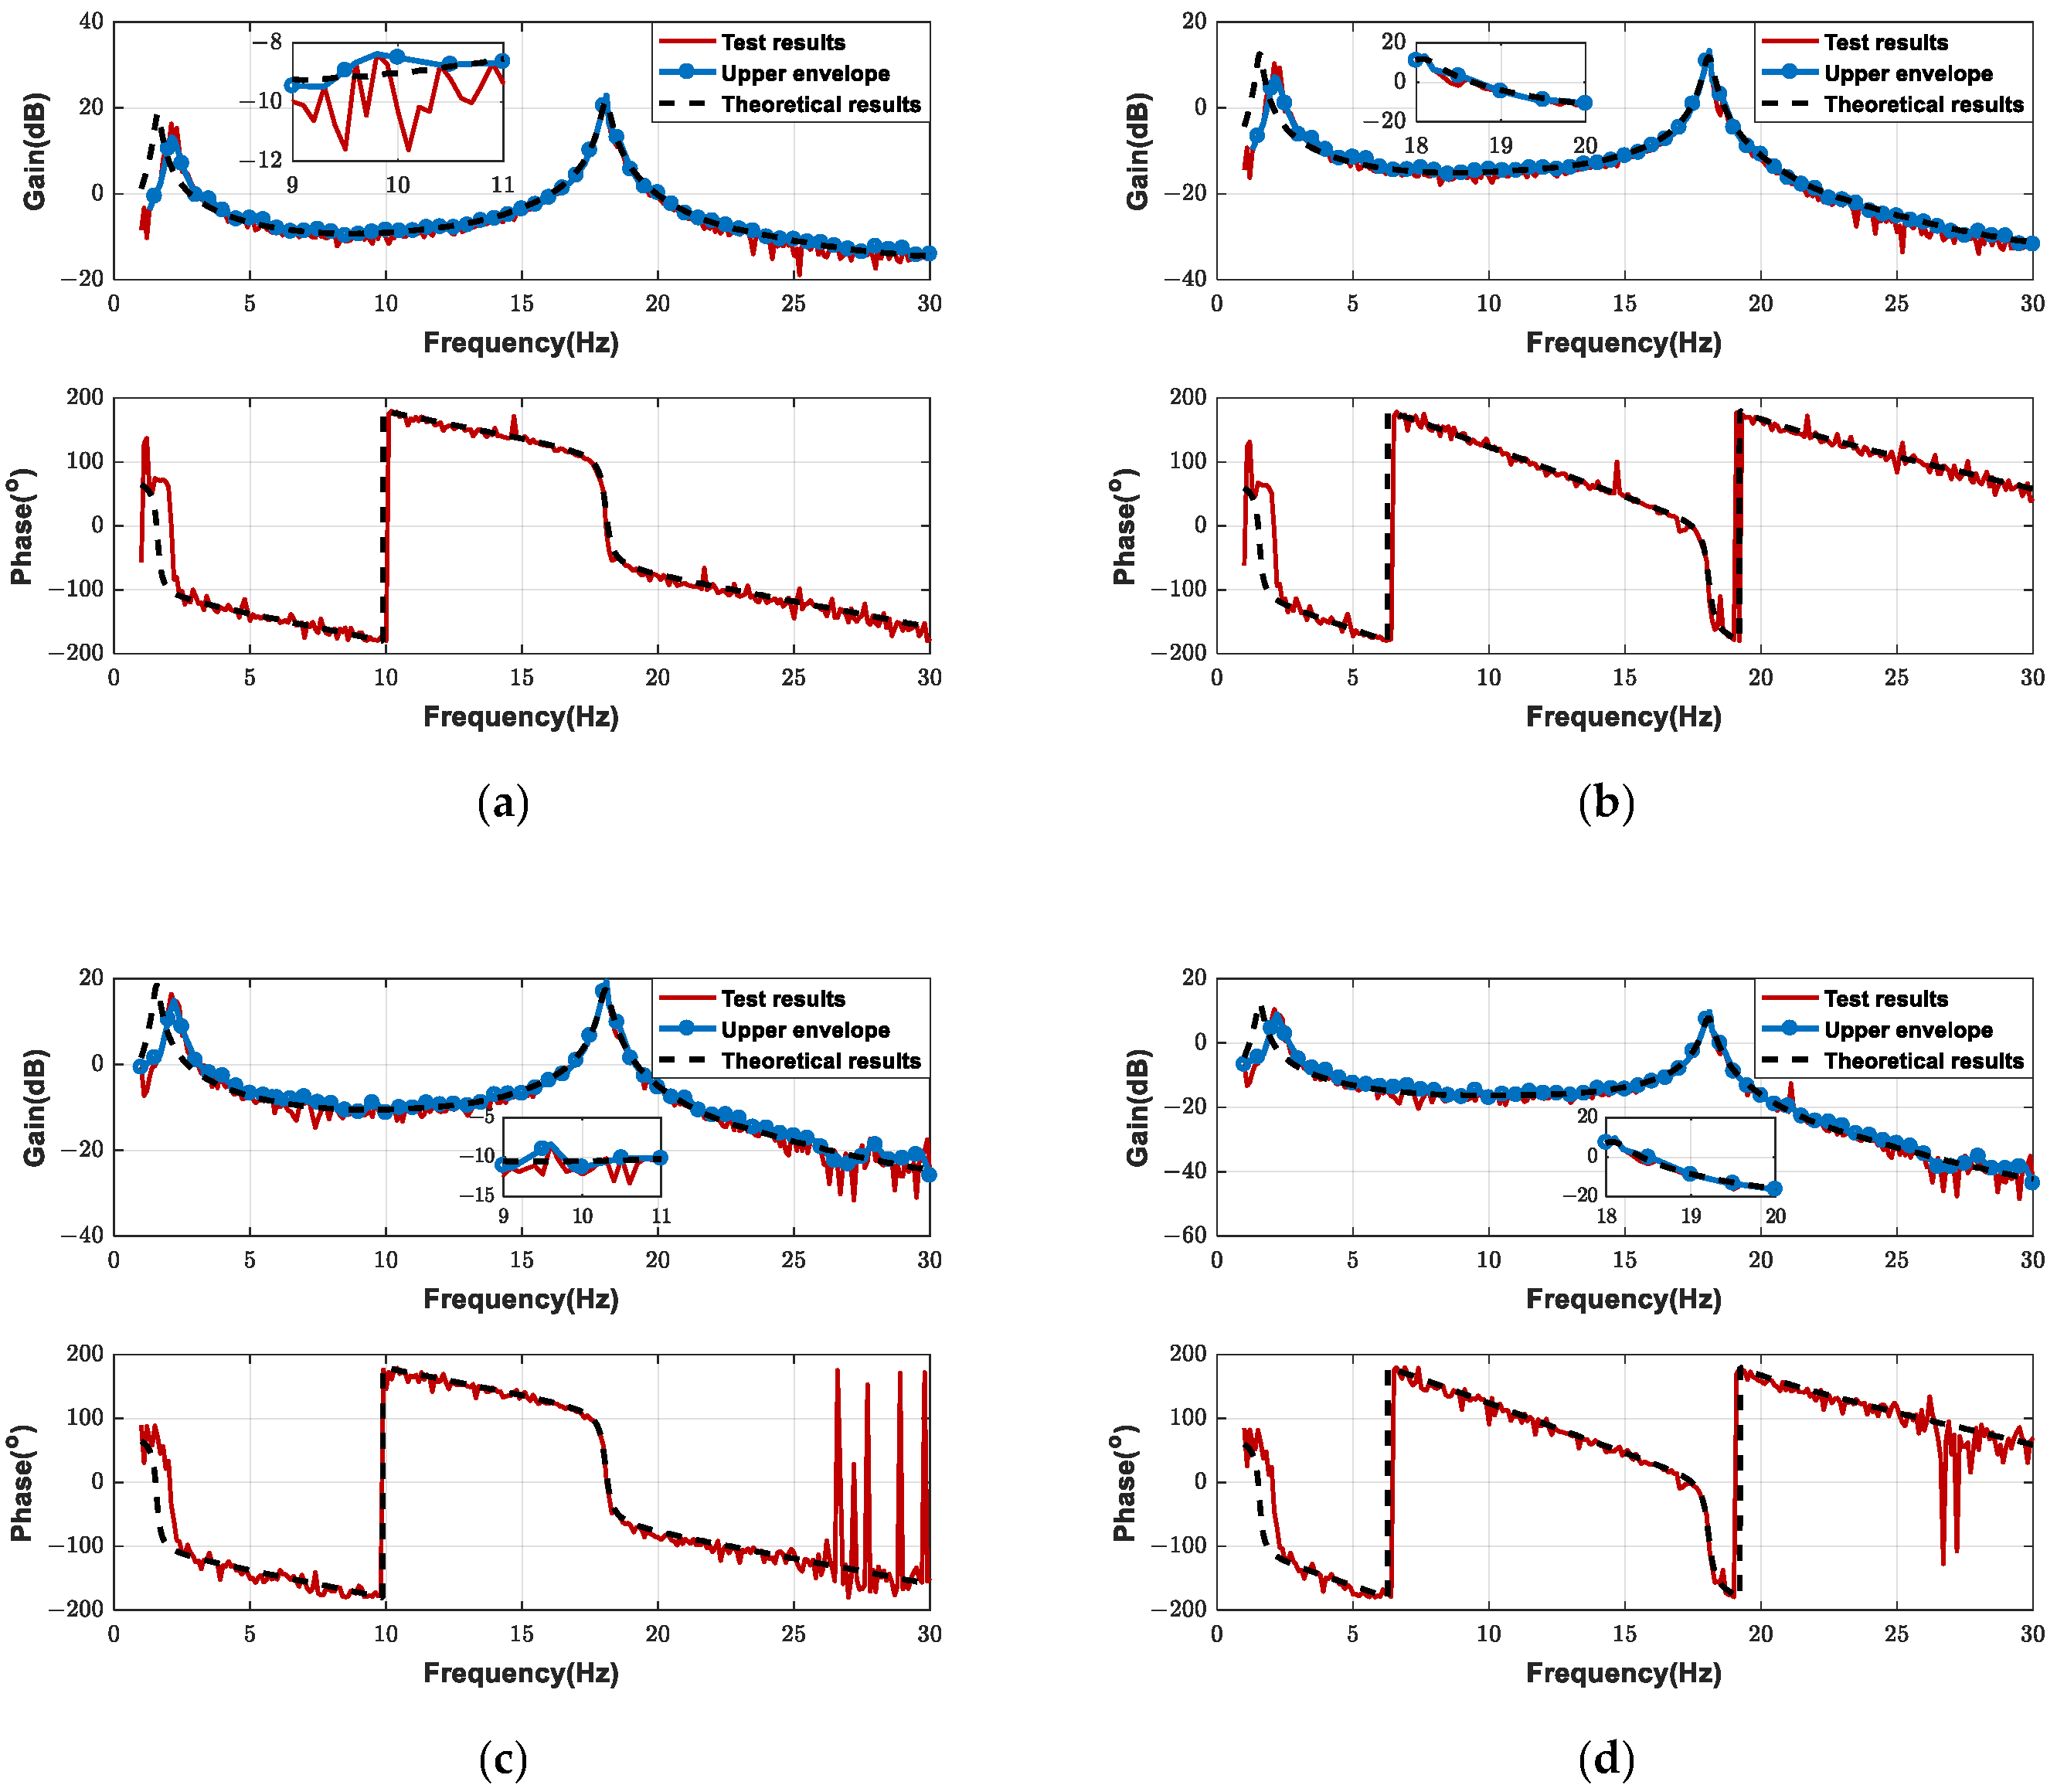
Comparisons between the test results and the theoretical results are shown in Figure 24. Local enlargements of the gain curves near the phase crossover frequency are shown in the insets. It can be seen that the test curves are in good agreement with the theoretical curves in most frequency ranges. The test curve fluctuates significantly, owing to noisy interference, so it is difficult to accurately judge the gain margin. Therefore, it is preferable to use the upper envelope.
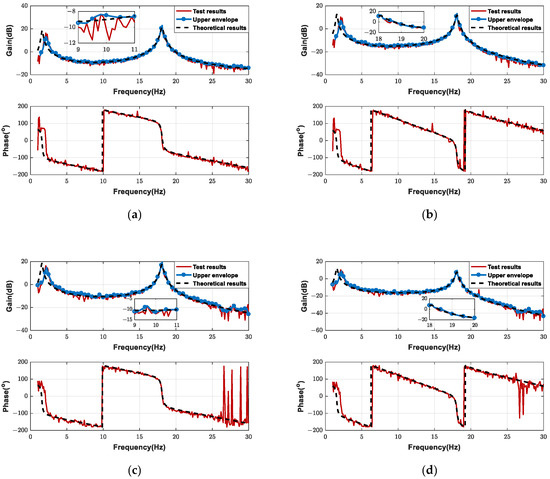
Figure 24.
Comparison of ASE open-loop FRF for the four states at Ma = 1.5. (a) U1C1 state. (b) U1C2 state. (c) U2C1 state. (d) U2C2 state.
Although the hanging frequencies are far lower than the first elastic mode frequency, the test data are still affected by the spring hanging in the low-frequency range. The test results in the low-frequency range are obviously different from the theoretical results under the free–free boundary conditions. Because the gain crossover frequency of this vehicle is located in the low-frequency range, it is not appropriate to analyze the phase margin directly via the test data. Therefore, the phase margin can be obtained only after the influence of hanging supports has been removed (as shown in Section 5.3).
5.2. Statistical Results of Stability Evaluation
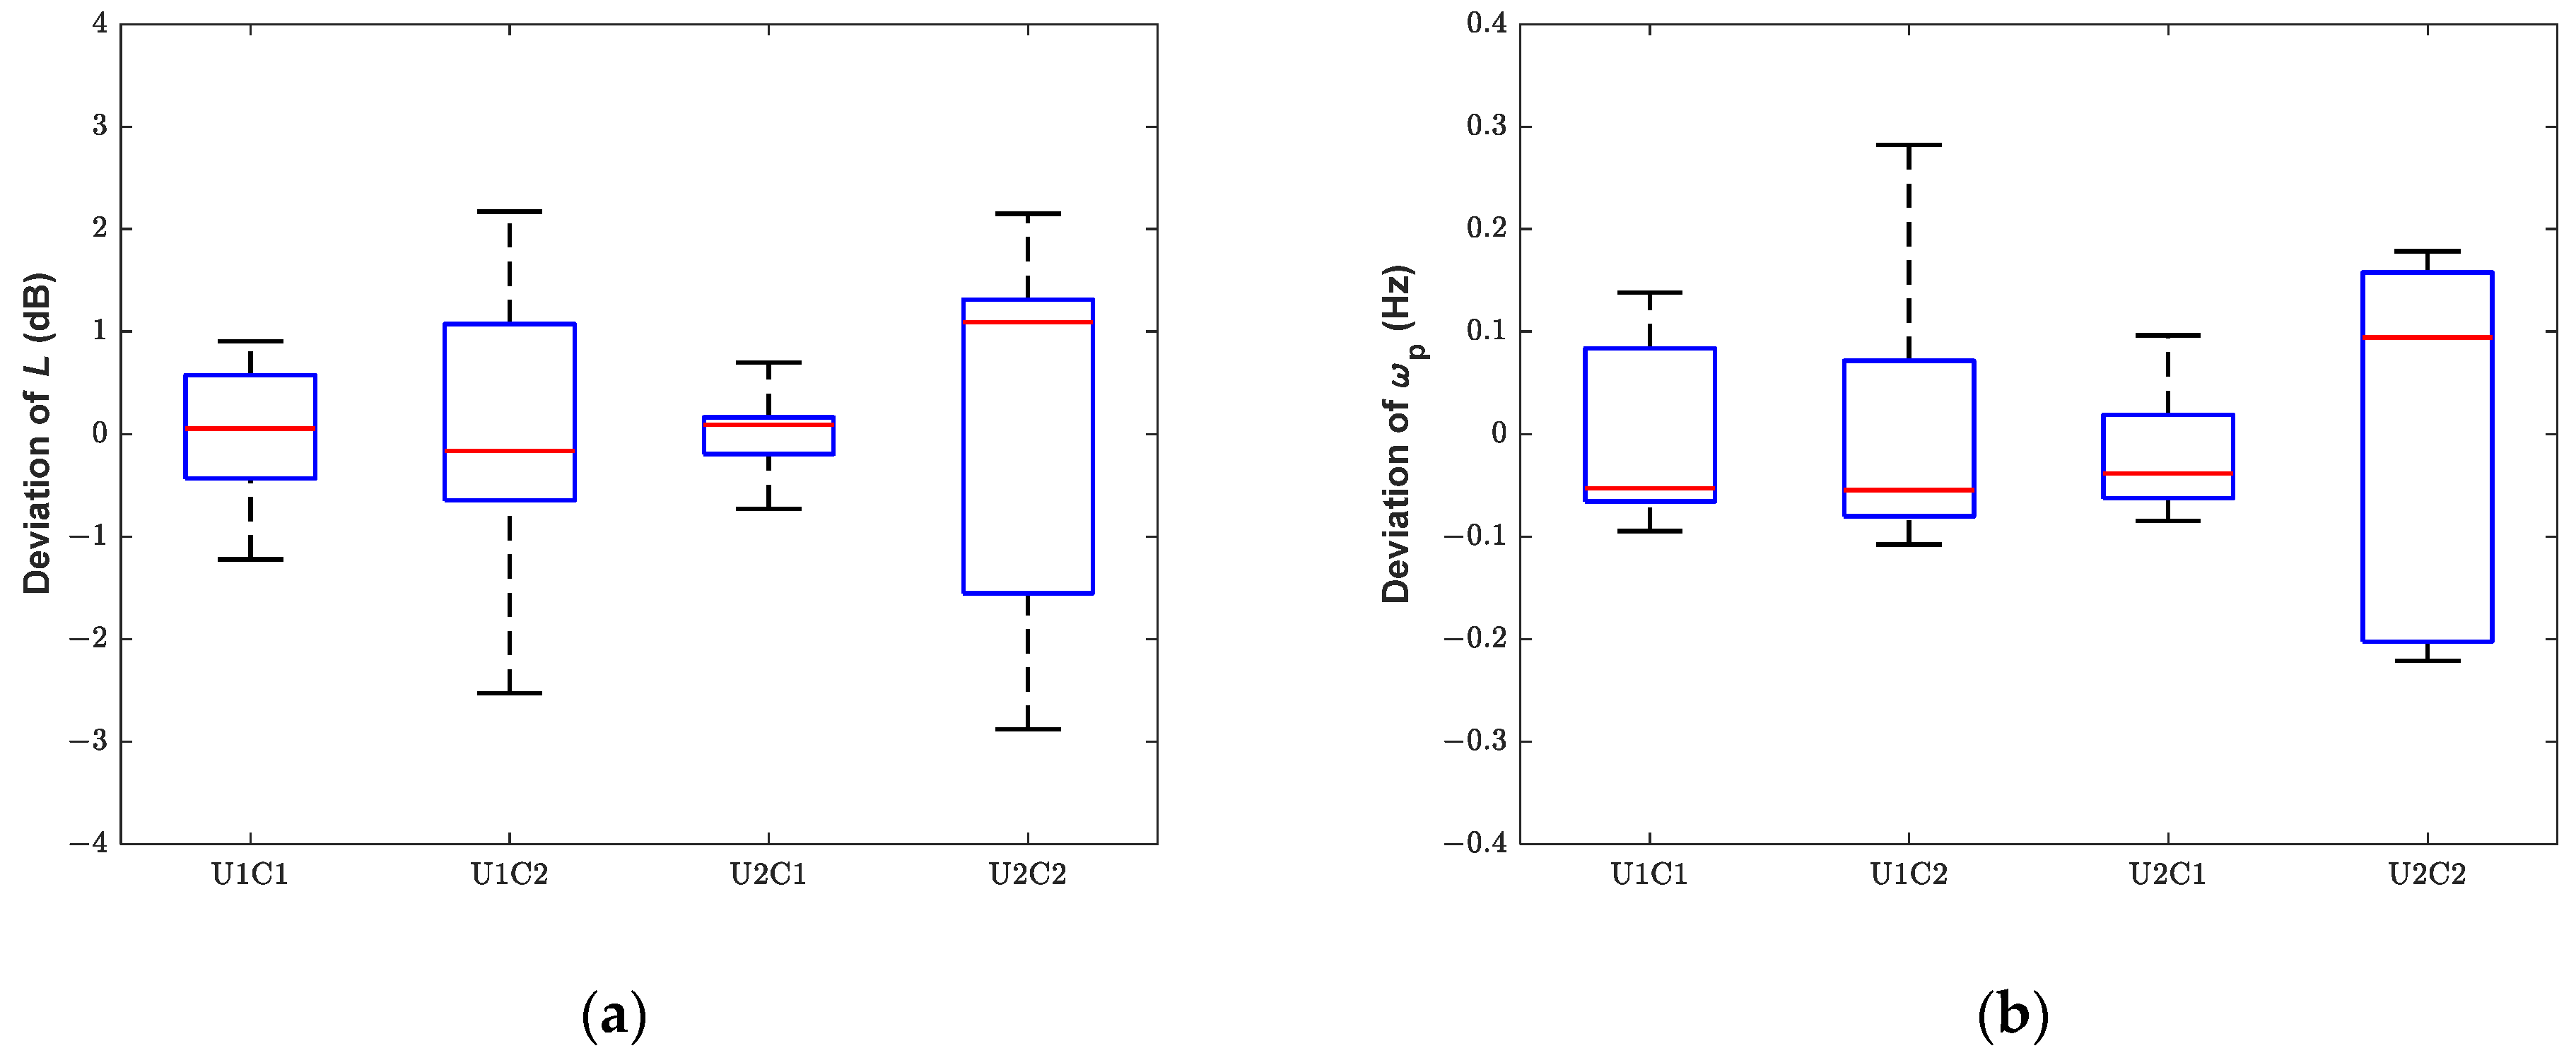
Using the six groups of shaker excitation data and two groups of fin excitation data, 2592 groups of ASE stability evaluation results at Ma = 1.5 are obtained. The mean values of the gain margin are listed in Table 2. It can be seen that the gain margins of the four states are close to the theoretical results. Figure 25 shows the deviations of the gain margin and phase crossover frequency from the mean values of all test results. It can be seen that for the U1C1 and U2C1 states, the phase crossover frequency is far from that of the first bending mode, and where the gain–frequency curve is relatively flat, the deviation of the gain margin is small. The deviations between the minimum gain margins and the mean values are no more than 1.3 dB. For the U1C2 and U2C2 states, the phase crossover frequency is close to that of the first bending mode, and where the slope of the gain–frequency curve is large, the deviation range of the gain margin is relatively large. The deviations of minimum gain margins are no more than 3.0 dB.

Table 2.
Stability margin of the slender vehicle at Ma = 1.5.

Figure 25.
Deviations of gain margin and phase crossover frequency from their mean values for different states at Ma = 1.5. (a) Gain margin. (b) Phase crossover frequency.
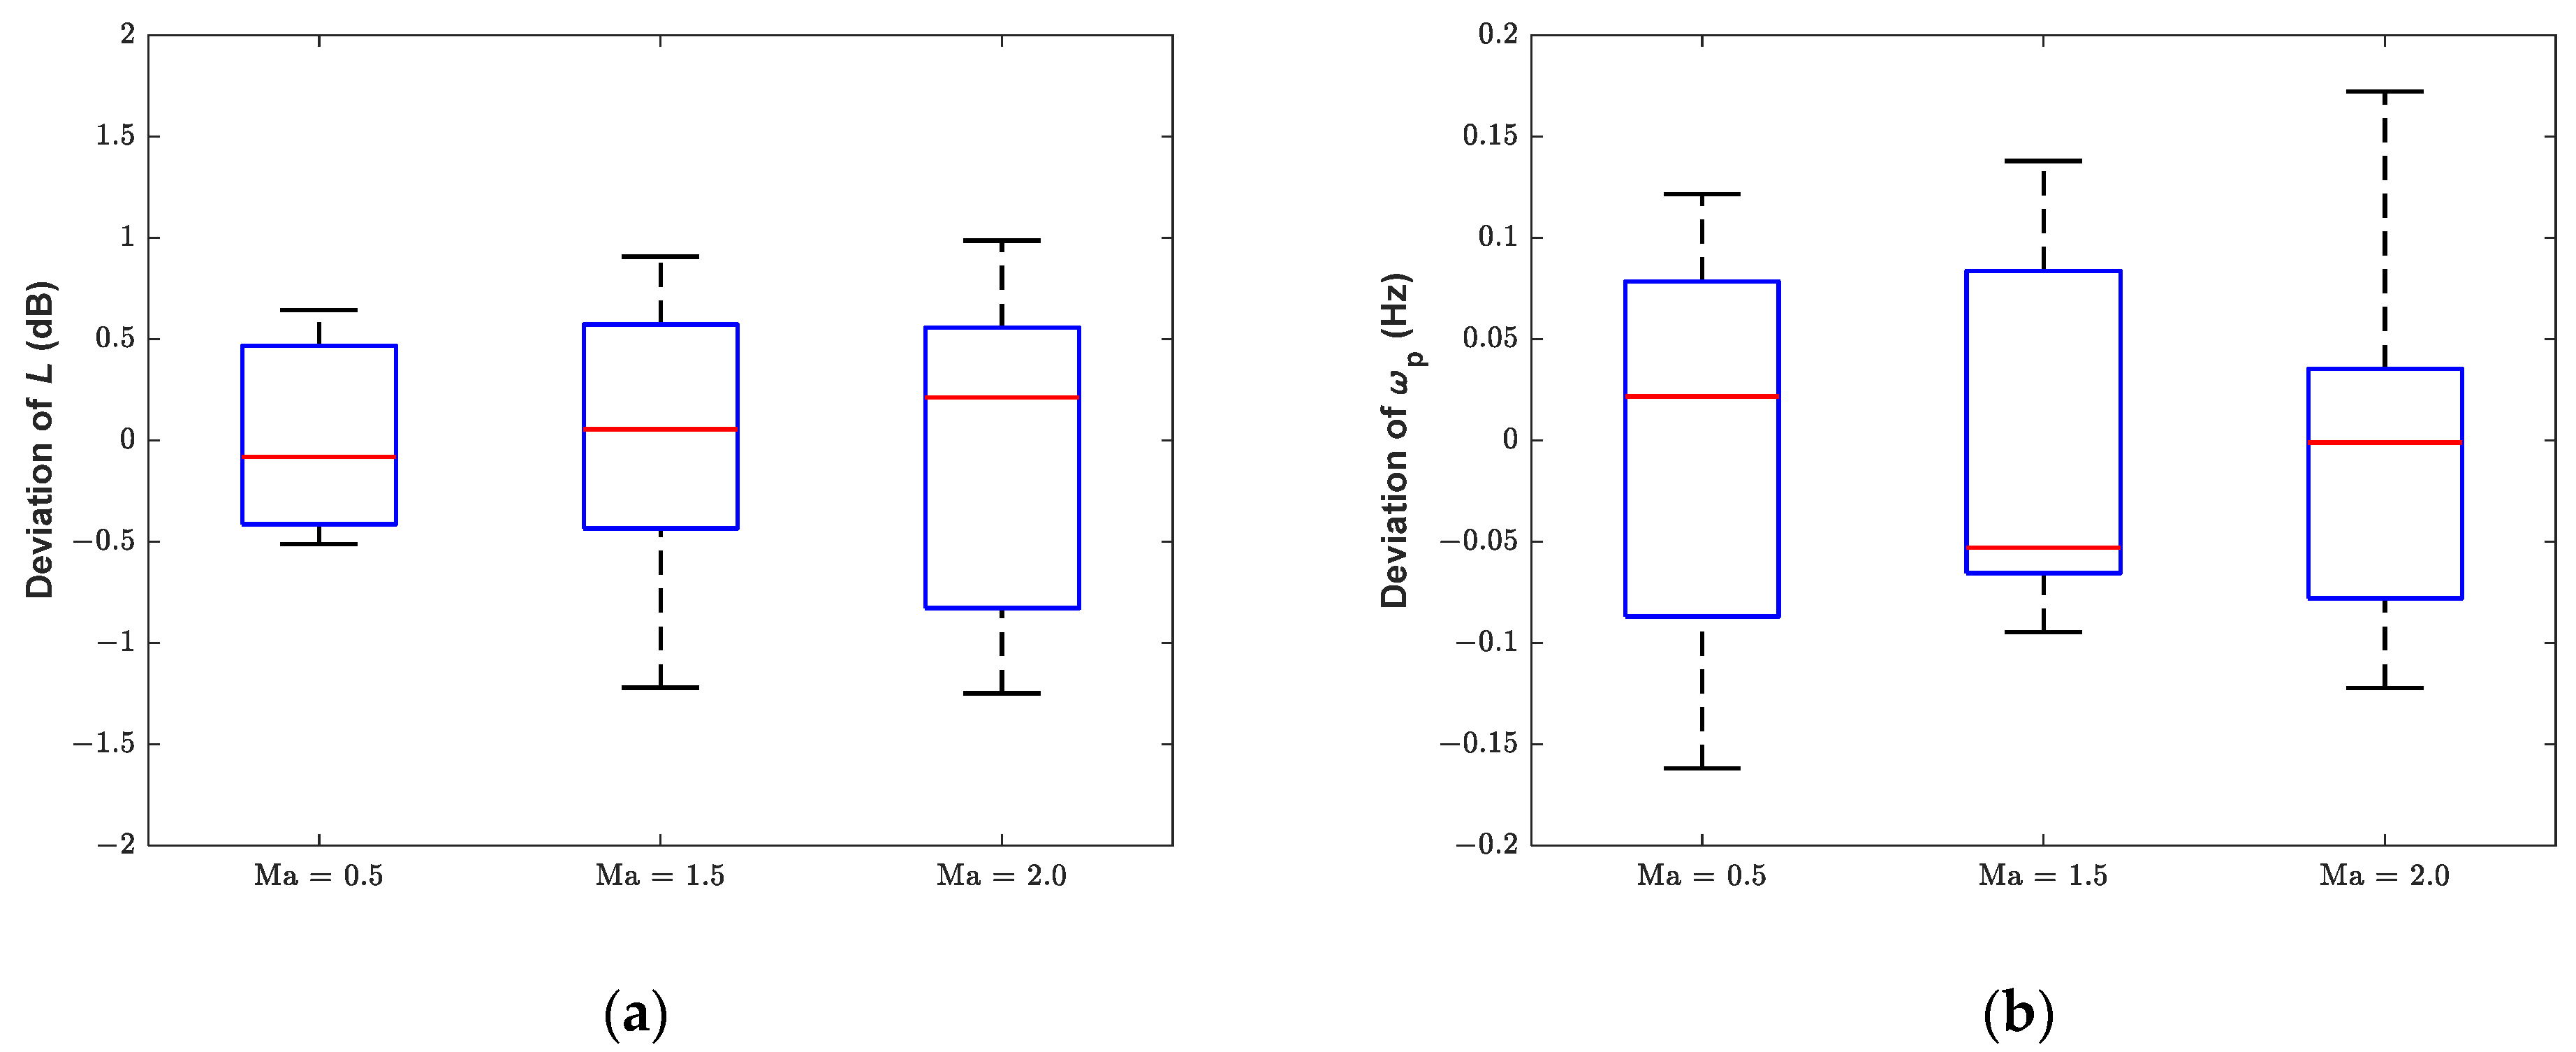
Using the test data of the U1C1 state, the ASE stability evaluation results at different Mach numbers (0.5, 1.5, and 2.0) are determined. The mean values of the stability margins are listed in Table 3. Box diagrams of the deviation between the results of all the test data and the mean values are shown in Figure 26. Compared with the theoretical results, the results of the proposed method are accurate, and the deviation of the minimum gain margins relative to the mean values are no more than 1.3 dB.

Table 3.
Stability margin of the slender vehicle at different Mach numbers (U1C1 state).
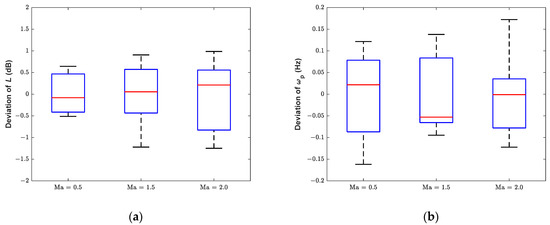
Figure 26.
Deviations of gain margin and phase crossover frequency from their mean values at different Mach numbers (U1C1 state). (a) Gain margin. (b) Phase crossover frequency.
The test results show that the proposed method can accurately evaluate ASE stability for different positions of IMU, different control laws, and different Mach numbers. In practical engineering applications, adopting a conservative approach and taking safety into account, it is preferable to take the lower bound of the gain margin from the test results as the final result of the ASE stability evaluation.
5.3. Removal of the Influence of Hanging Supports
Even if the hanging frequencies are much lower than the first elastic mode frequency, the hanging supports have little effect on the elastic modes (this needs to be achieved in the FRTs) but still influence the FRFs in the low-frequency range. For the FRFs acquired from the tests, the influence of hanging supports can be eliminated by curve fitting using the least-squares method, and the FRFs can be resynthesized under free–free boundary conditions. For a vehicle with hanging modes and elastic modes, the theoretical expression for the structural transfer function of excitation forces to vibrational displacements can be written as
The first term on the right-hand side is the transfer function of the hanging modes, the second term is the transfer function of the elastic modes within the frequency range of interest, and the third term is the transfer function of higher-order elastic modes outside this frequency range. and are the residue and conjugate residue of the th-order mode of the transfer function, respectively, and and are the pole and conjugate pole, respectively.
Without loss of generality, the FRF fitting and resynthesis method is derived by taking the test data presented in this paper as an example. Because the experimental FRFs include that for servo control systems, the theoretical model of these transfer functions for the slender vehicle considered in this paper can be expressed as
The higher-order modes beyond the frequency range of interest are difficult to identify from the test data, but they can be approximated using the FEM model and introduced as higher-order residuals. For the hanging-mode term, the mass, inertia, hanging stiffness, and hanging damping measured in the test and the rigid-body modes are brought into Equation (32) to calculate the coefficients , , , and . This can be written as
For the experimental FRFs, the least-squares method is used for curve fitting, and only in the hanging-mode term is retained for resynthesis of the FRFs with free–free boundary conditions, i.e.,
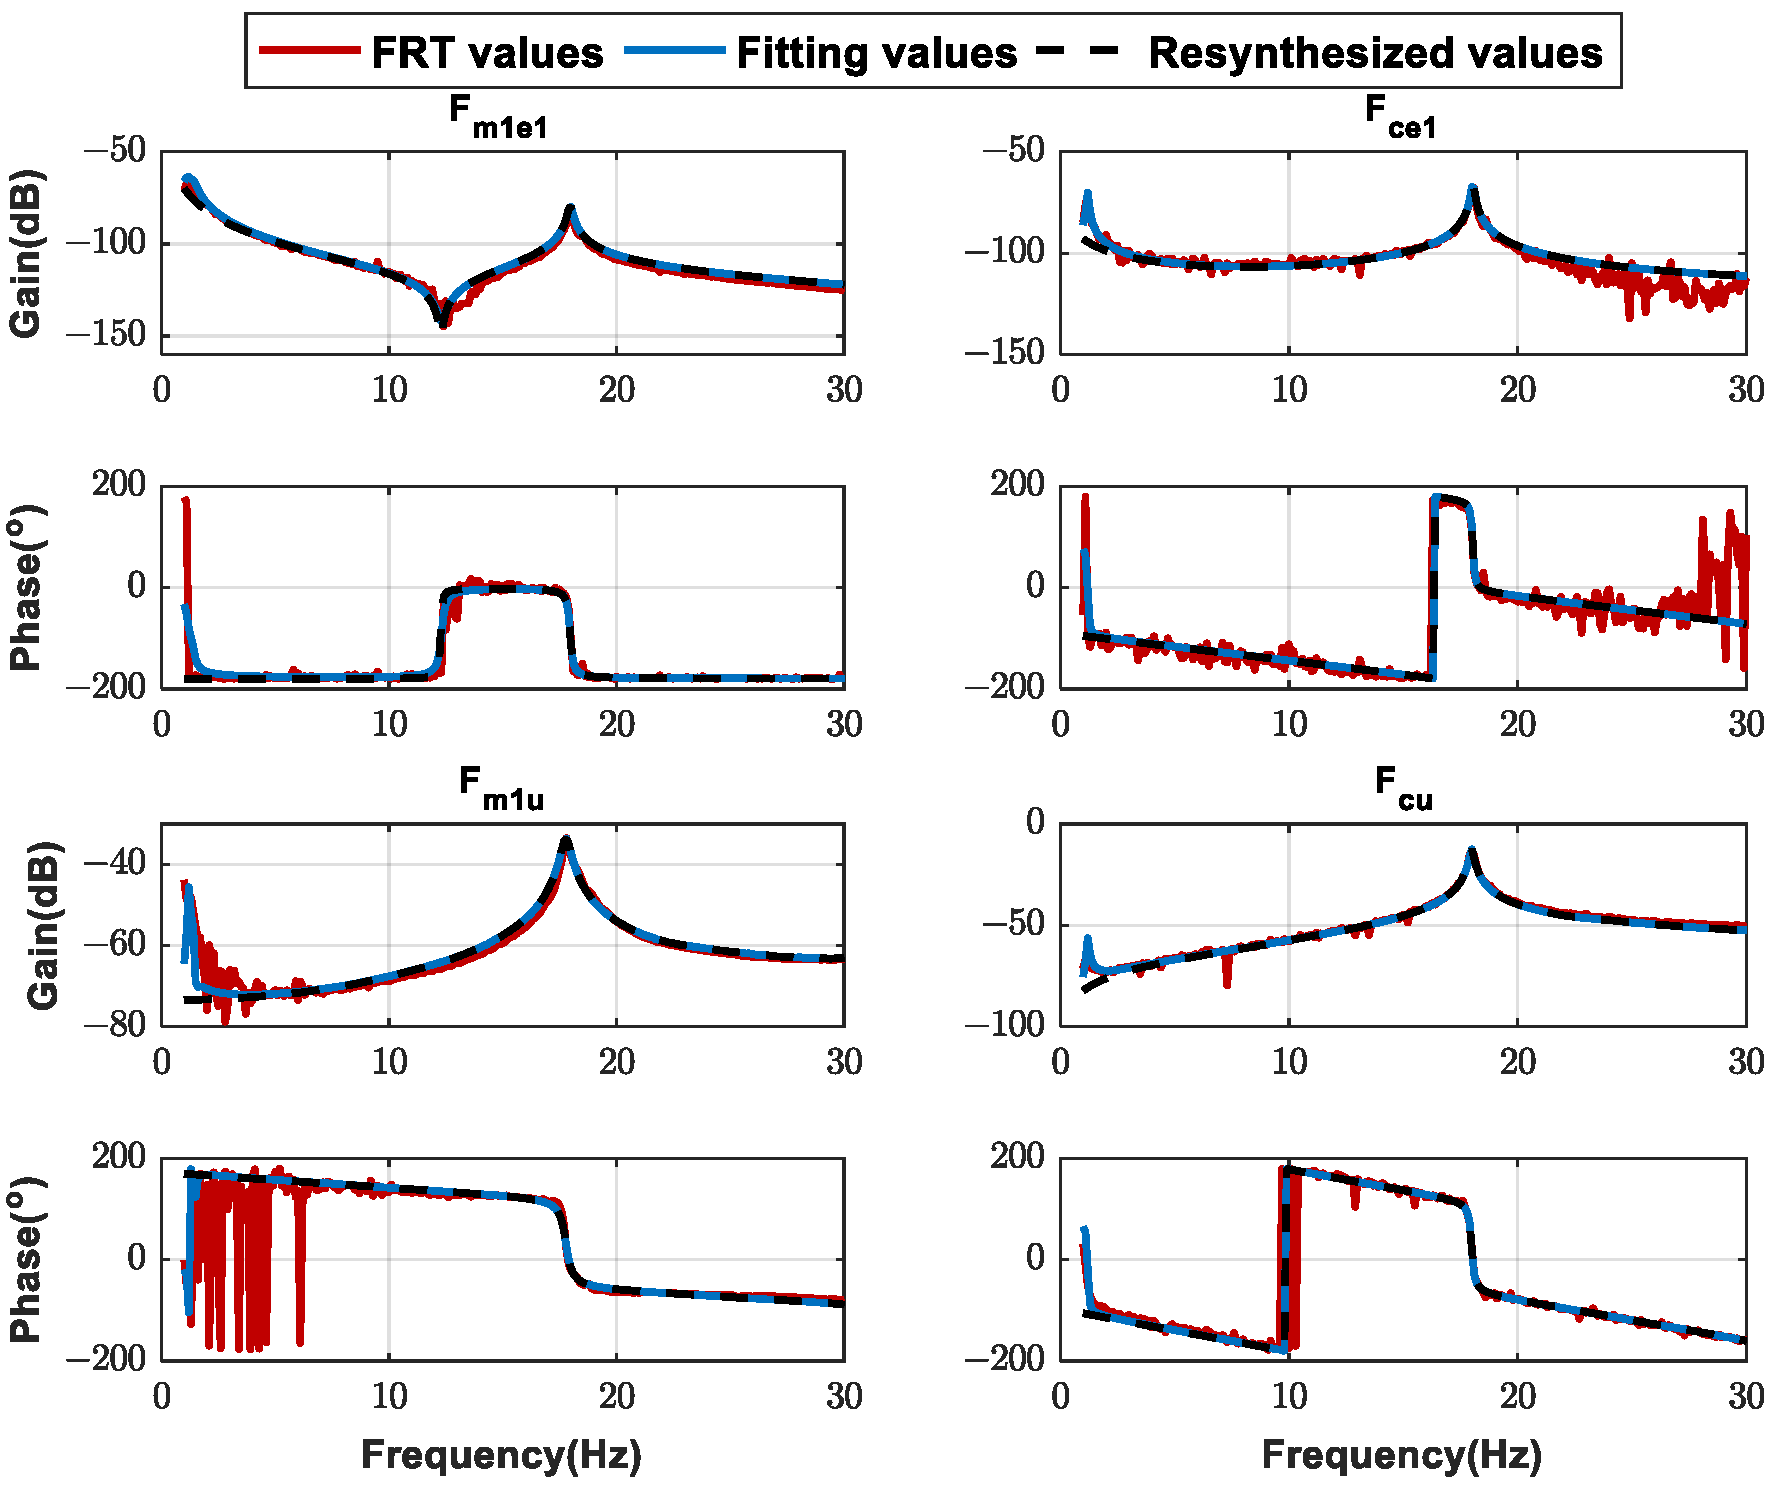
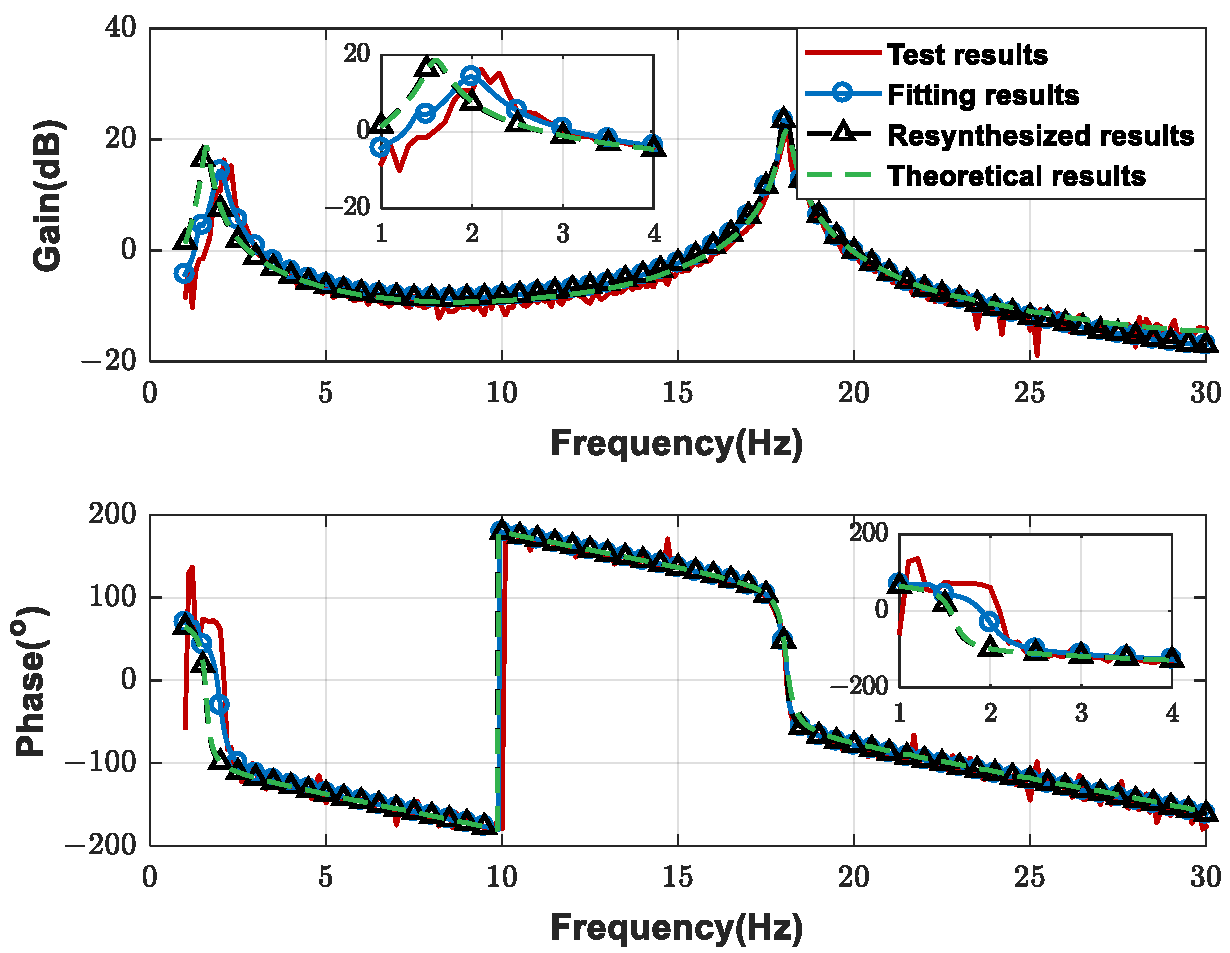
Taking a group of test data for the four types in Equation (33) as an example, the fitting and resynthesized results are shown in Figure 27, where fitting values are the results with hanging modes, and the resynthesized values are the results after removal of the hanging modes. It can be seen that the fitting values are in good agreement with the test values, which shows the accuracy of the fitting.
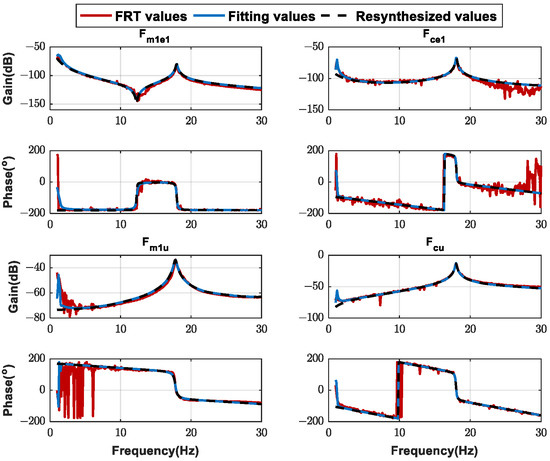
Figure 27.
Examples of FRF fitting and resynthesis.
Taking a group of test data of the U1C1 state as an example, the proposed method is used to fit and resynthesize the experimental FRFs, and the ASE open-loop FRF is obtained at Ma = 1.5, as shown in Figure 28. It can be seen that in the frequency range not affected by hanging modes, the fitting results and resynthesized results are in good agreement with the test results. In the frequency range affected by the hanging modes, the fitting results are in good agreement with the test results, which include the hanging modes, whereas the resynthesized results are in good agreement with the theoretical results, which are established with free–free boundary conditions. The gain margin and phase margin are listed in Table 4. For the phase margin, the resynthesized results are more consistent with the theoretical results than the test results and the fitting results, and the deviation of the phase margin from the theoretical results is reduced from 6.5° (test results) to 0.15° (resynthesized results). The data processing results show that the proposed FRF fitting and resynthesis method can effectively remove the hanging modes and obtain the ASE open-loop FRF with free–free boundary conditions.
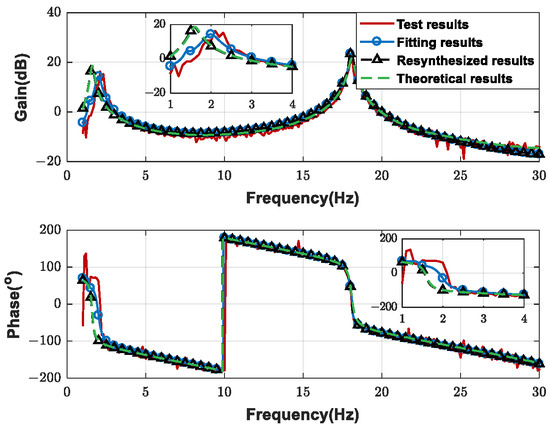
Figure 28.
Comparison of open-loop FRF for the U1C1 state at Ma = 1.5.

Table 4.
Comparison of stability margins for the U1C1 state at Ma = 1.5.
6. Conclusions
A novel ASE stability evaluation method for slender vehicles based on the ground FRT has been proposed in this paper. The FRFs of the real structure and servo control systems were obtained through the FRTs of a slender vehicle with shaker and fin excitation. Using a frequency-domain unsteady aerodynamic condensation method, low-order unsteady aerodynamic FRFs established in physical coordinates were obtained. The established ASE open-loop FRF was used for stability evaluation via the Nyquist criterion.
An experimental implementation of the proposed method was performed for the pitch channel of a slender vehicle. Accurate ASE stability evaluation results can be obtained by calculating the gain margin through the upper envelope of the gain–frequency curve and using the statistics of multiple groups of test results. The calculation method of gain margin represents a conservative approach with due emphasis on safety. The test results show that the proposed method is feasible and can provide accurate results for different IMU positions, different control laws, and different Mach numbers. To deal with the unavoidable influence of hanging supports in the test, an FRF fitting and resynthesis method was proposed. By resynthesizing the ASE open-loop FRF with free–free boundary conditions, an accurate result of the phase margin can be obtained. The feasibility and accuracy of the proposed method were verified through an experimental study of a slender vehicle. The application of the proposed method to other ASE stability evaluation problems is the objective of future work.
Author Contributions
Data curation, software, validation, visualization, and writing (original draft reparation) were conducted by C.Y. (Changkun Yu). Conceptualization, methodology, and project administration were conducted by Z.W. Writing (review and editing) was conducted by C.Y. (Changkun Yu) and Z.W. Resources and supervision were the responsibility of Z.W. and C.Y. (Chao Yang). All authors have read and agreed to the published version of the manuscript.
Funding
This research received no external funding.
Data Availability Statement
The data presented in this study are available upon request from the corresponding author.
Conflicts of Interest
The authors declare no conflict of interest.
References
- Felt, L.R.; Huttsell, L.J.; Noll, T.E.; Cooley, D.E. Aeroservoelastic encounters. J. Aircr. 1979, 16, 477–483. [Google Scholar] [CrossRef]
- Pak, C. Aeroservoelastic Stability Analysis of the X-43A Stack; Technical report, NASA-TM-2008-214635; NASA Dryden Flight Research Center: Edwards, CA, USA, 2008. [Google Scholar]
- Karpel, M. Procedures and models for aeroservoelastic analysis and design. Z. Angew. Math. Mech. 2001, 81, 579–592. [Google Scholar] [CrossRef]
- Botez, R.; Cotoi, I.; Doin, A.; Biskri, D. Method validation for aeroservoelastic analysis. In Proceedings of the 43rd AIAA/ASME/ASCE/AHS/ASC Structures, Structural Dynamics, and Materials Conference, Denver, CO, USA, 22–25 April 2002; p. 1481. [Google Scholar]
- Moulin, B. Modeling of aeroservoelastic systems with structural and aerodynamic variations. AIAA J. 2005, 43, 2503–2513. [Google Scholar] [CrossRef]
- Beal, T. Dynamic stability of a flexible missile under constant and pulsating thrusts. AIAA J. 1965, 3, 486–494. [Google Scholar] [CrossRef]
- Park, Y. Dynamic stability of a free Timoshenko beam under a controlled follower force. J. Sound Vib. 1987, 113, 407–415. [Google Scholar] [CrossRef]
- Gupta, K.K. Finite Element Multidisciplinary Analysis; American Institute of Aeronautics and Astronautics, Inc.: Reston, VA, USA, 2003. [Google Scholar]
- Zhang, C.; Ye, Z.; Zhang, W. Aeroservoelastic Analysis for Supersonic and Hypersonic Missiles. In Proceedings of the 45th AIAA Aerospace Sciences Meeting and Exhibit, Reno, NV, USA, 8–11 January 2007; p. 1073. [Google Scholar]
- Verhaegen, A.; Żbikowski, R. Aeroservoelastic modelling and control of a slender anti-air missile for active damping of longitudinal bending vibrations. Aerosp. Sci. Technol. 2017, 66, 20–27. [Google Scholar] [CrossRef][Green Version]
- Liu, Y.; Xie, C. Aeroservoelastic stability analysis for flexible aircraft based on a nonlinear coupled dynamic model. Chin. J. Aeronaut. 2018, 31, 2185–2198. [Google Scholar] [CrossRef]
- Dessena, G.; Ignatyev, D.I.; Whidborne, J.F.; Pontillo, A.; Zanotti Fragonara, L. Ground vibration testing of a flexible wing: A benchmark and case study. Aerospace 2022, 9, 438. [Google Scholar] [CrossRef]
- Zhang, R.; Wu, Z.; Yang, C. Ground Structural Coupling Testing and Data Processing Methods for Frequency Response Function Estimation. In Proceedings of the 54th AIAA/ASME/ASCE/AHS/ASC Structures, Structural Dynamics, and Materials Conference, Boston, MA, USA, 8–11 April 2013; p. 1776. [Google Scholar]
- Allen, M.; Pollock, S. AFTI/F-16 aeroservoelastic analyses and ground test with a digital flight control system. In Proceedings of the 24th Structures, Structural Dynamics and Materials Conference, Lake Tahoe, NV, USA, 2–4 May 1983; p. 994. [Google Scholar]
- Zislin, A.; Laurie, E.; Wilkinson, K.; Goldstein, R. X-29 Aeroservoelastic Analysis and Ground Test Validation Procedures. In Proceedings of the Aircraft Design Systems and Operations Meeting, Colorado Springs, CO, USA, 14–16 October 1985; p. 3091. [Google Scholar]
- Vaccaro, V.; Caldwell, B.; Becker, J. Ground Structural Coupling Testing Model Updating in the Aeroservoelastic Qualification of a Combat Aircraft; Technical report; Alenia Aeronautica Turin (Italy) Aircraft Engineering: Rome, Italy, 2000. [Google Scholar]
- Zeng, J.; Kingsbury, D.; Ritz, E.; Chen, P.C.; Lee, D.H.; Mignolet, M. GVT-based ground flutter test without wind tunnel. In Proceedings of the 52nd AIAA/ASME/ASCE/AHS/ASC Structures, Structural Dynamics and Materials Conference 19th AIAA/ASME/AHS Adaptive Structures Conference, Denver, CO, USA, 4–7 April 2011; p. 1942. [Google Scholar]
- Kearns, J.P. Flutter Simulation; Technical report; Johns Hopkins University Applied Physics Laboratory: Laurel, MD, USA, 1962. [Google Scholar]
- Wu, Z.G.; Ma, C.J.; Yang, C. New approach to the ground flutter simulation test. J. Aircr. 2016, 53, 1578–1580. [Google Scholar] [CrossRef]
- Wu, Z.G.; Zhang, R.J.; Ma, C.J.; Yang, C. Aeroelastic semiphysical simulation and wind-tunnel testing validation of a fin–actuator system. J. Aircr. 2017, 54, 235–245. [Google Scholar] [CrossRef]
- Wang, B.W.; Fan, X.L. Ground flutter simulation test based on reduced order modeling of aerodynamics by CFD/CSD coupling method. Int. J. Appl. Mech. 2019, 11, 1950008. [Google Scholar] [CrossRef]
- Yun, J.M.; Han, J.H. Development of ground vibration test based flutter emulation technique. Aeronaut. J. 2020, 124, 1436–1461. [Google Scholar] [CrossRef]
- Wu, Z.; Chu, L.; Yuan, R.; Yang, C.; Tang, C. Studies on aeroservoelasticity semi-physical simulation test for missiles. Sci. China Technol. Sci. 2012, 55, 2482–2488. [Google Scholar] [CrossRef]
- Rodden, W.P.; Giesing, J.P.; Kalman, T.P. Refinement of the nonplanar aspects of the subsonic doublet-lattice lifting surface method. J. Aircr. 1972, 9, 69–73. [Google Scholar] [CrossRef]
- Brock, B.; Griffin, J. The supersonic doublet-lattice method-A comparison of two approaches. In Proceedings of the 16th Structural Dynamics, and Materials Conference, Denver, CO, USA, 27–29 May 1975; p. 760. [Google Scholar]
- Zhang, W.W.; Ye, Z.Y.; Zhang, C.A. Supersonic flutter analysis based on a local piston theory. AIAA J. 2009, 47, 2321–2328. [Google Scholar] [CrossRef]
- Schmidt, D.K.; Raney, D.L. Modeling and simulation of flexible flight vehicles. J. Guid. Control. Dyn. 2001, 24, 539–546. [Google Scholar] [CrossRef]
- ZONA Technology. ZAERO Theoretical Manual Version 8.2; ZONA Technology: Scottsdale, AZ, USA, 2011. [Google Scholar]
- Harder, R.L.; Desmarais, R.N. Interpolation using surface splines. J. Aircr. 1972, 9, 189–191. [Google Scholar] [CrossRef]
- Duchon, J. Splines minimizing rotation-invariant semi-norms in Sobolev spaces. In Constructive Theory of Functions of Several Variables; Schempp, W., Zeller, K., Eds.; Springer: Berlin/Heidelberg, Germany, 1977; pp. 85–100. [Google Scholar]
- Xu, Y.T.; Wu, Z.G.; Yang, C. Simulation of the Unsteady Aerodynamic Forces for Ground Flutter Simulation Test. Acta Aeronaut. Astronaut. Sin. 2012, 33, 1947–1957. [Google Scholar]
- Wright, J.R.; Cooper, J.E. Introduction to Aircraft Aeroelasticity and Loads; John Wiley and Sons: Hoboken, NJ, USA, 2008; Volume 20, pp. 105–115. [Google Scholar]
- LMS. The LMS Test.Lab Modal Analysis Manual; LMS Test.Lab rev 9A; LMS International: Laredo, TX, USA, 2008. [Google Scholar]
- Schoukens, J.; Pintelon, R. Measurement of frequency response functions in noisy environments. IEEE Trans. Instrum. Meas. 1990, 39, 905–909. [Google Scholar] [CrossRef]
Publisher’s Note: MDPI stays neutral with regard to jurisdictional claims in published maps and institutional affiliations. |
© 2022 by the authors. Licensee MDPI, Basel, Switzerland. This article is an open access article distributed under the terms and conditions of the Creative Commons Attribution (CC BY) license (https://creativecommons.org/licenses/by/4.0/).

