1. Introduction
In the modern world of aviation, there are great requirements for flight safety [
1], as well as speed, manufacturability, and price in developing new and modernizing obsolete aircraft systems.
Aviation occupies an important role in the transport system, providing high-speed travel and safety for passenger flights and cargo delivery. Over the past century, there has been tremendous technological progress in the field of aviation [
2]. The emergence of new technologies makes it possible to further improve the safety of flights; however, the cost of developing new systems, as well as the time needed for their certification and implementation, are considerable. Therefore, great attention is paid to the use of advanced development tools and methods in the creation and operation of advanced aircraft systems [
3].
A key feature of modern aviation is the high degree of reliability and economic feasibility of using aircraft. Based on this, one of the strategic goals of the international civil aviation organization is to improve global flight safety. Airplanes must meet requirements for both cruising and low-speed maneuvers, such as takeoffs and landings [
4].
It is commonly known that the most difficult stages of a flight are takeoff and landing; they incur more than half of the total number of accidents [
5]. At this time, any failures in the operation of aircraft systems are unacceptable since they can cause a critical situation. One of the key systems during takeoff and landing is the mechanization of the wing, which allows one to adjust the bearing properties of the aircraft. Failure of mechanization at the initial or final stages of the flight can lead to catastrophic consequences.
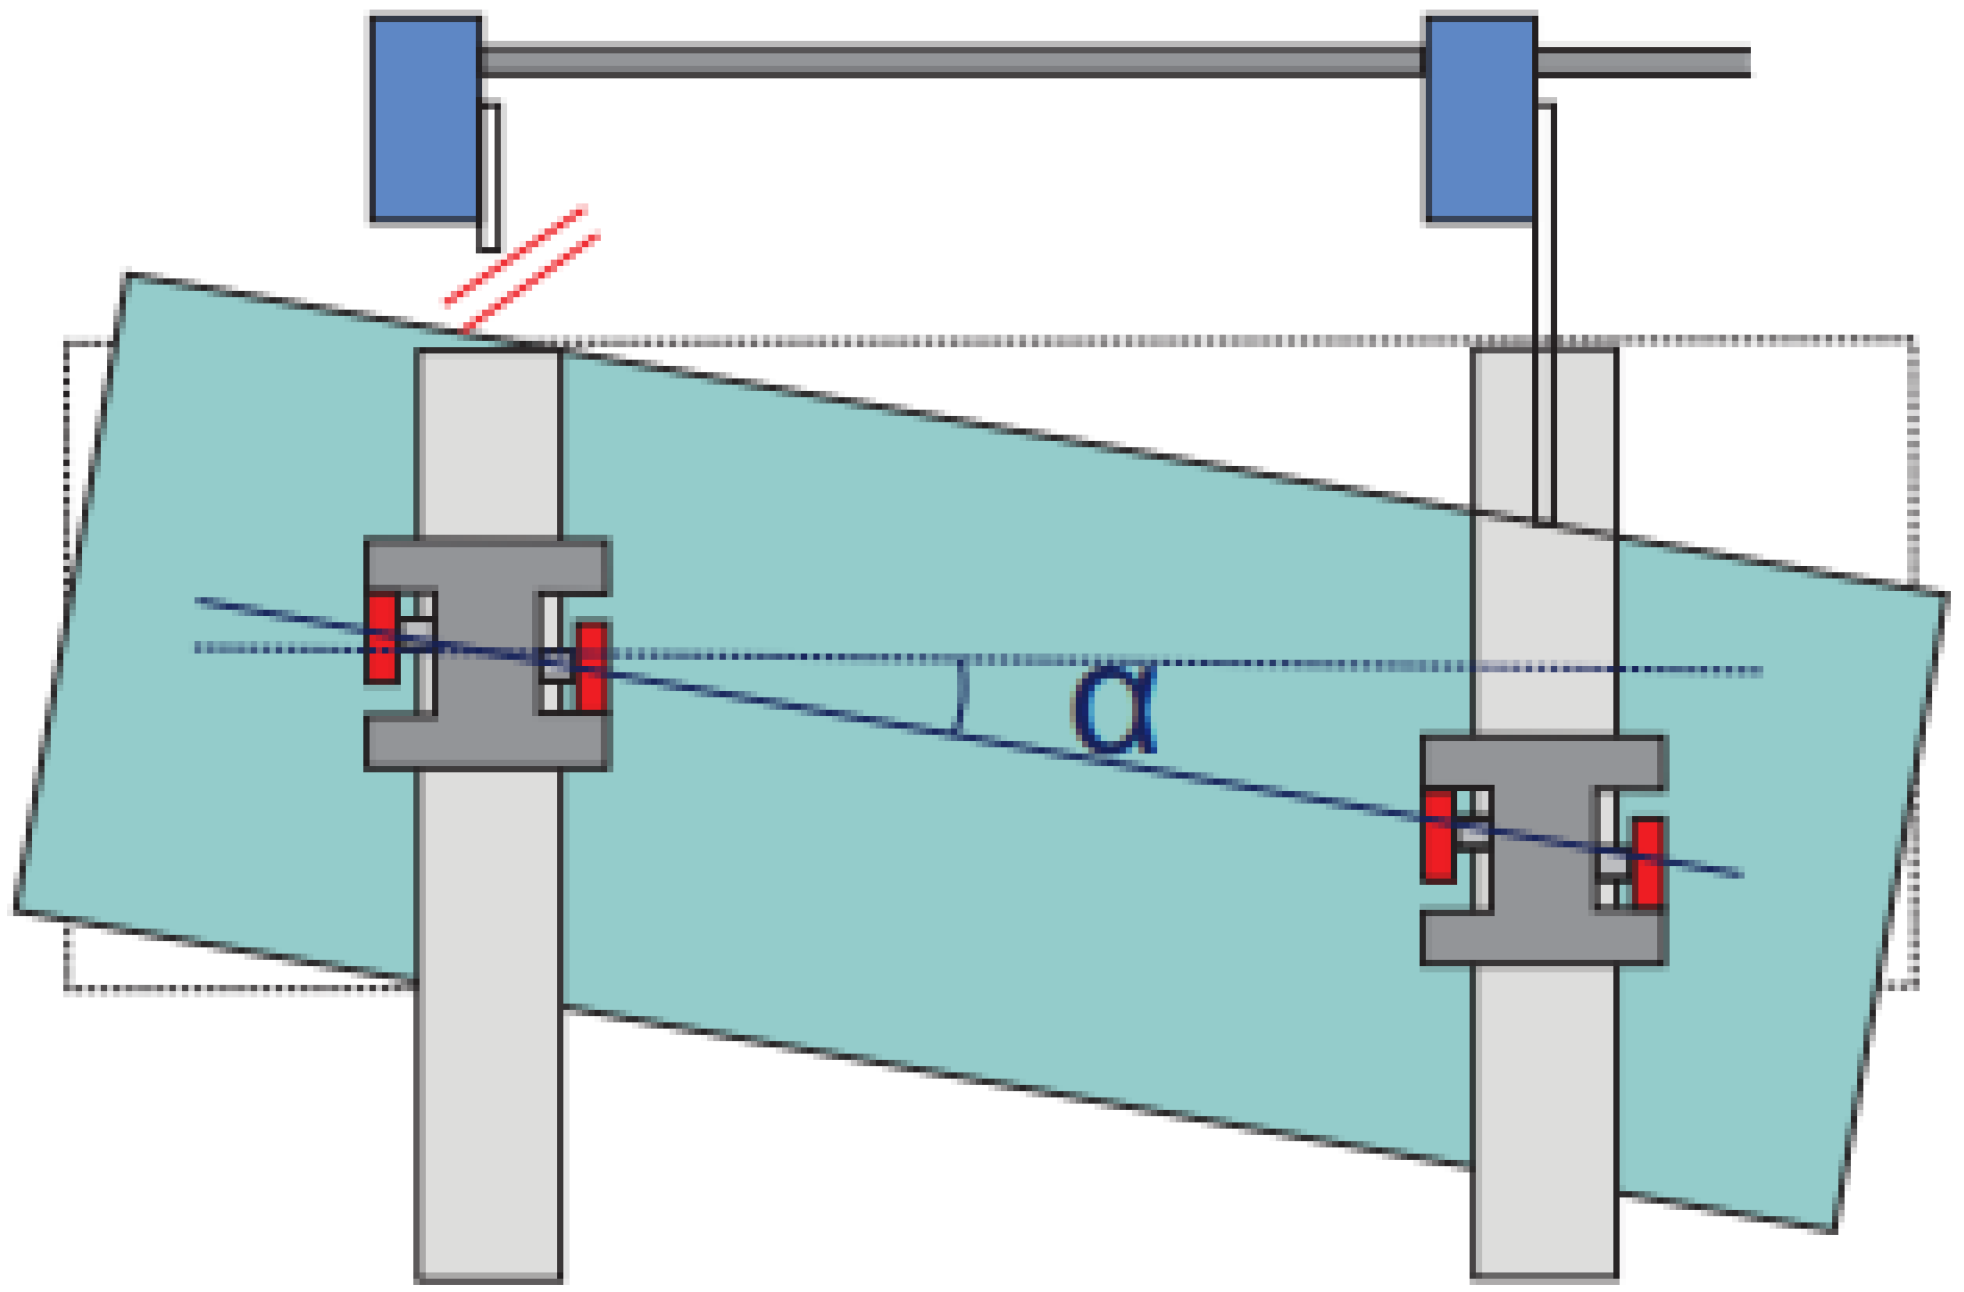
Based on the design of the wing mechanization, a tilt of the mechanization sections of more than three degrees must be prevented. Preventing this tilt precludes abnormal situations and reduces the load on the wing mechanism. In this regard, variations of the wing mechanization skew control system (hereinafter referred to as SCS) are used to prevent malfunctions in the wing mechanization system, and timely warn the pilot. Depending on the version, this system makes it possible to determine the occurrence of misalignment of the wing lift sections relative to each other or a separate lift section, as shown in
Figure 1. Timely detection of skew allows one to stop the release of mechanization in time, preventing the destruction of the bearing surfaces of the wing.
One of the implementation options for the skew control system for a separate wing mechanization section can be based on the use of inductive non-contact proximity sensors [
7,
8,
9,
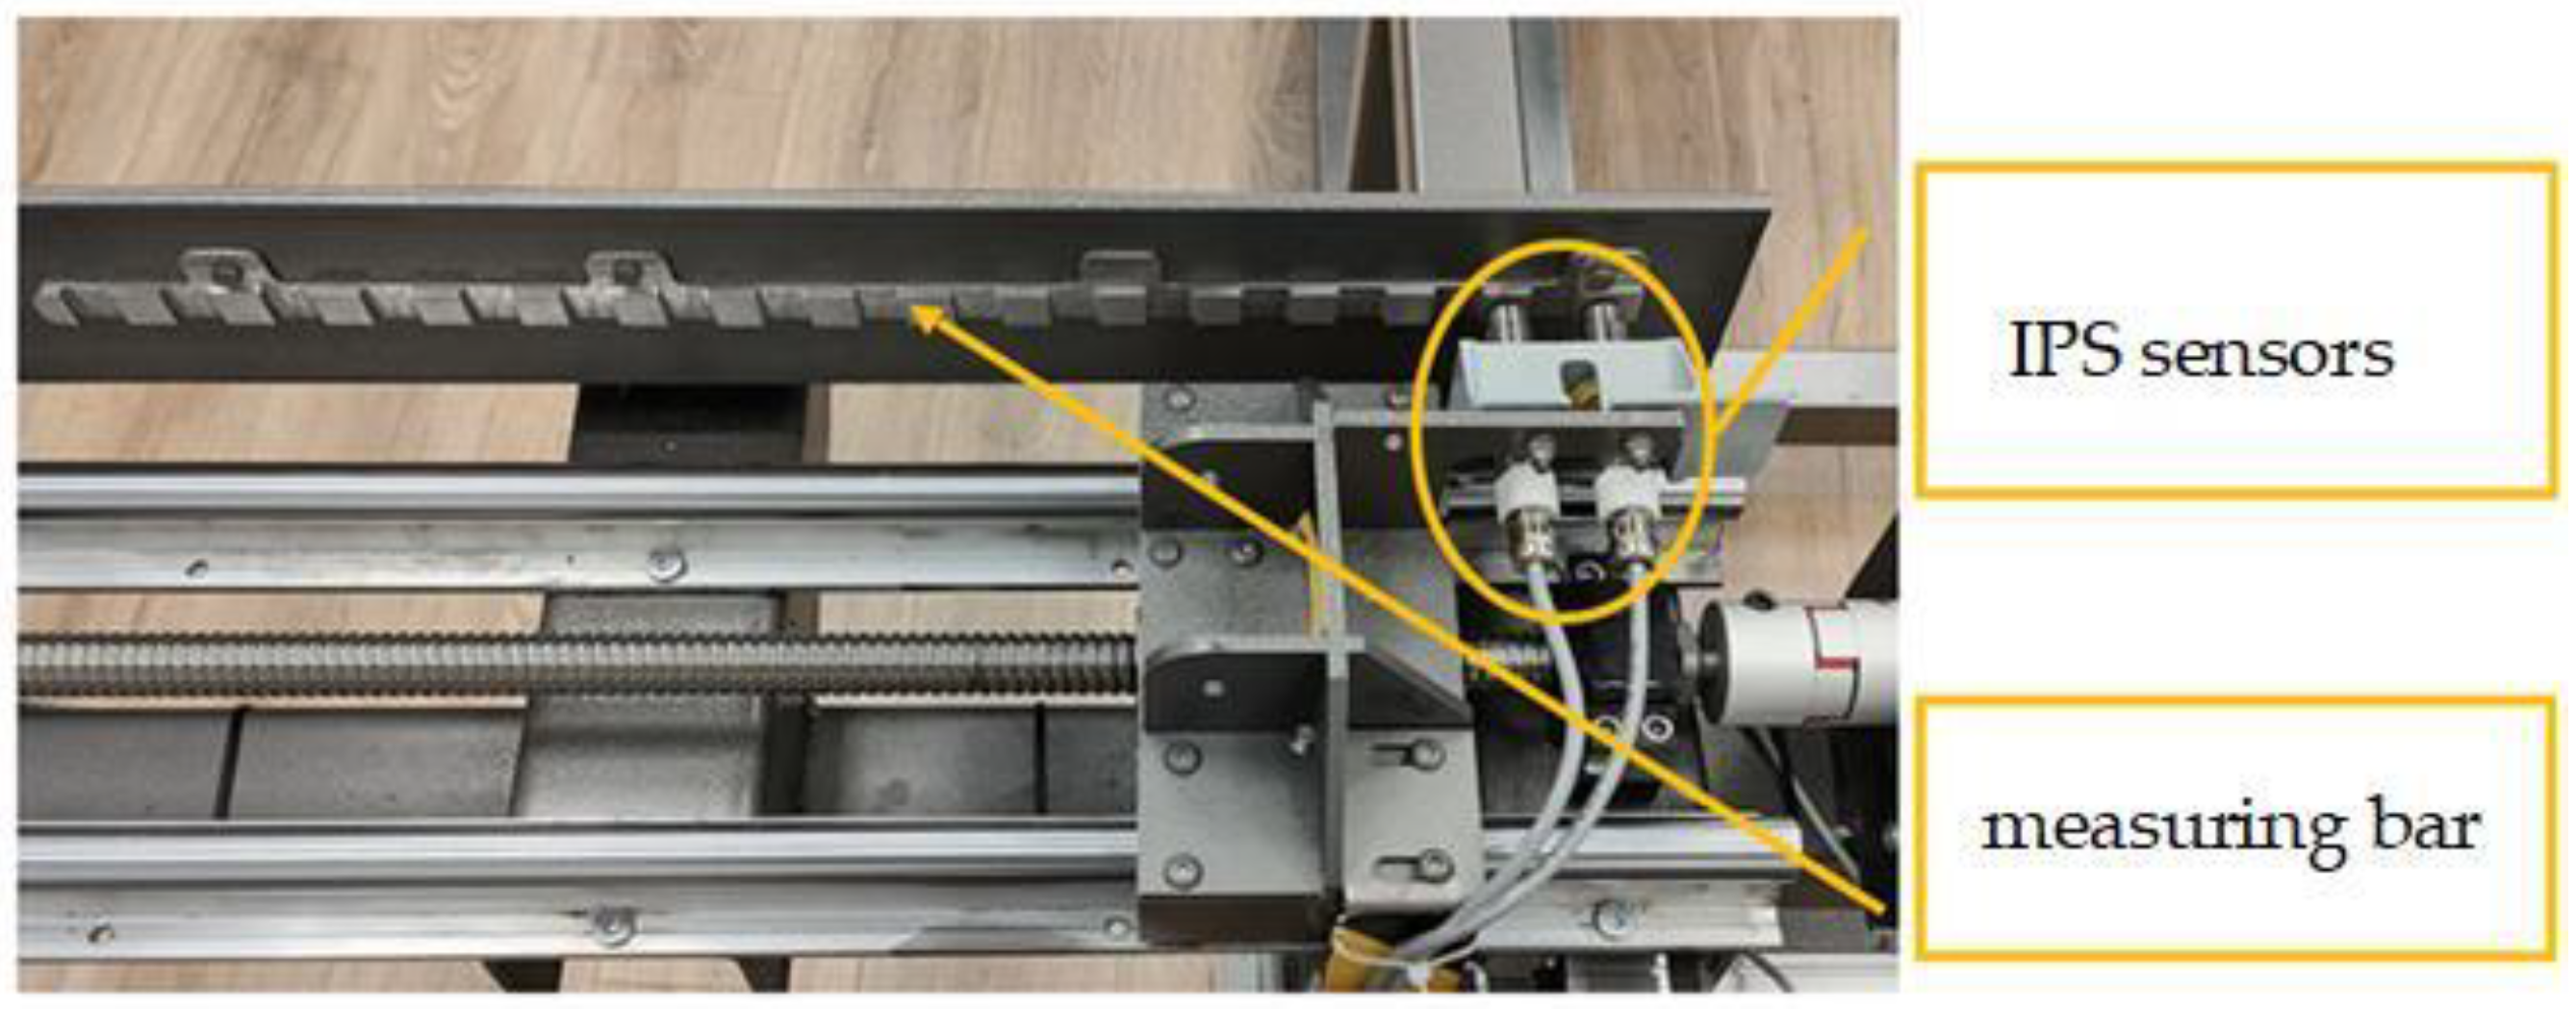
10]. Such an organization of the SCS makes it possible to detect the occurrence of a slew of each section of the mechanization of the wing (flap or slat) by the position of two guides controlled by inductive proximity sensors. The use of non-contact sensors allows one to increase the resource of the system due to the absence of friction.
The skew control system considered in this article for determining the position of the wing mechanization includes a measuring bar, opposite which inductive proximity sensors (IPS) are installed. Since the bar is a metal strip with formed protrusions separated by intervals, when installing such a system (measuring bar—IPS) on the opposite edges of the mechanization section, it becomes possible to determine their relative position. An outcome of this is the ability to detect the resulting skew.
During the development of the SCS, technologies and methods were used to reduce the time and economic cost while improving the quality of the system development and its reliability, thereby increasing flight safety. One such technology was the Hardware-in-the-Loop simulation, which involves the creation of a mathematical model for testing a real control unit. The mathematical model allowed us to simulate various control actions and record data reproducible by a real control system. In addition, using mathematical modeling at the initial stages of design significantly reduced future costs and time for finalizing the SCS [
11].
The purpose of this study was to create a complex mathematical and full-scale modeling that allowed for real-life tests of the components of the SCS due to a high degree of automation, test the algorithms of the operation of the SCS to determine the most optimal, and introduce various failures to and check the functionality of the system.
The relevance of this work lies in the reduction of time and material costs both at the development and testing stages due to the complexity of mathematics and HIL, which allows one to quickly change the system’s structure and the parameters of the control model.
To achieve this goal, it was necessary to develop complex mathematical and HIL models, including a mathematical model of the SCS, algorithms for detecting skew, and a bench for the HIL of the SCS. Several tests were carried out to confirm the high convergence of the mathematical model and the real test bench.
2. Literature Review
When developing this technique, similar solutions described in scientific publications were considered. Some of them are shown below.
In the article “Experimental verification of the results of simulation modeling of the stabilization system of the aircraft generator test bench” [
12], a model of the simulation stabilization system of the test bench for studying high-speed aircraft generators and an experimental test bench for verifying the simulation results were considered. To exclude ultra-high-speed moving parts from the model sample, the author used a model created in Matlab Simulink. The author did not implement a real circuit control system in the model, using a digital microcontroller instead. Thus, the author simplified the mathematical model, which led to an increase in speed and a decrease in development costs. However, it cannot be used separately from a specific test bench. The development of the stand, considering the design features of a real object, the use of physical components under study, and the implementation of the control system both in the model and on the stand, one to introduce the physical characteristics of the object and transient processes into the mathematical model, thereby increasing its accuracy and allowing one to use the resulting model in the description of other similar objects.
A similar solution was discussed in the article “RFlySim: Automatic test platform of AV autopilot systems with FPGA-based hardware-in-the-loop simulations” [
13], where the author described the process of creating an automatic test platform for the autopilot of various aircraft using a real-time machine based on FPGA. The author used real aircraft sensors connected to the physical control system, the role of which was performed by the autopilot system. The dynamics of the aircraft were modeled using a mathematical model of the aircraft running on a computer. Since the SCS was a part of the aircraft control system, there was no need to fully simulate the aircraft dynamics. It was enough to check the correctness of the output of control signals by the system being developed, which greatly simplified the model and increased the speed of development. With further refinement of the model by adding additional object properties, it will be possible to create a universal SCS model applicable to various aircraft designs.
The HIL method is actively used in aviation in developing new and debugging existing systems that improve flight safety. In the article “Hardware-in-the-loop simulator for research on fault tolerant control of electrohydraulic actuators in a flight control application” [
14], the author implemented a test bench to test the fault tolerance of electrohydraulic actuators. To use HIL modeling, a mathematical model of the aircraft was developed to provide plausible parameters during flight. By linking the stand for testing electro-hydraulic drives and the model, the author obtained a picture demonstrating the operation of the drives during the flight of a real aircraft. For clarity, additional computers were used to visualize the aircraft’s flight. The result of the work was a functional model, and transient processes in the control loop were also investigated.
This approach can be applied not only in the aircraft industry. For example, in the article “Hardware-in-the-loop simulation for the design and testing of engine control systems” [
15], the author used the HIL simulation method to create a mathematical model of a diesel engine using components of a real engine control unit. This method is called hardware-software simulation and is used when the dynamic parameters of the future system are known. Thus, it is possible to check the dynamic properties of the developed control system. However, with such modeling, there is no way to check the physical properties of the control object. Therefore, a bench for full-scale simulation was developed to increase accuracy in developing the skew control system. In addition, mathematical modeling of the control system was additionally carried out, which, when combined, makes it possible to increase the reliability of the complete SCS model.
Another example of the application of the HIL method was described in the article “The application of hardware-in-the-loop simulation for evaluation of active safety of vehicles equipped with electronic stability control systems” [
16]. It addressed the issue of using analog-to-digital or HIL modeling to evaluate the performance of a vehicle stabilization system. The author simulated the control system of a real block of the stabilization system to obtain a verified model of vehicle movement with ESC (electronic stability control). To improve the quality of the developed model, the author correlated the results of modeling and field tests, thereby obtaining an accurate model with which it was possible to debug the algorithms of the stabilization system.
A similar problem was solved by the author of the article “Hardware-in-the-loop test rig for integrated vehicle control systems” [
17]. Automation is increasingly affecting various areas of life, including cars. The author considered the process of developing a stand for modeling the built-in control systems of a car, one of which is the brake system. In this paper, a real electro-hydraulic braking system was controlled using the Matlab/Simulink mathematical model and the IPG CarMaker program. Due to the use of a large number of sensors, the author managed to create a model with many parameters, making it possible to accurately model a car. Thus, during the operation of the stand, the author monitored the work of all subsystems, which was displayed in the form of visual graphs, which allowed one to quickly assess the quality of the car’s control unit.
Increasingly, developers are faced with the problem of debugging embedded systems. In the article “Hardware in the Loop Simulation of Embedded Automotive Control Systems” [
18], the author described using a HIL simulation to test a car’s electronic control units. As part of the work, a mathematical model was created that described the longitudinal dynamics of the car, with the help of which the adaptive cruise control system was tested. Through the use of HIL, the test rig provided a realistic representation of the vehicle and embedded system data. This data allows us to explore various models of adaptive cruise control behavior, change its operation algorithms, and conduct testing without using a real vehicle, thereby significantly improving safety during development and reducing its cost.
One of the problems that designers of test equipment face is the communication between components from different manufacturers. The article “A flexible environment for rapid prototyping and analysis of disturbed real-time safety-critical systems” [
19] proposed a universal solution to this issue. The author considered the process of developing a flexible development environment for rapid prototyping and analysis of distributed critical real-time systems. This environment was designed to solve the problems associated with the limited openness of solutions available on the market and to facilitate the work of the system integrator. The author used specialized programs, such as IsaGraf, to communicate PLCs (programmable logic controllers) with Matlab/Simulink, as well as the ARTISAN toolkit, to interpret the results obtained in Matlab.
3. Research Methods
Hardware-in-the-Loop (HIL) is a type of real-time simulation. The essence of this method of system modeling is to check the system’s responses to influences applied using a mathematical model. This method allows for reduced time and material costs both at the development and testing stages due to the possibility of quick reconfiguration of the system and changing the control model’s parameters.
Usually, the HIL simulation is a complex in which an electronic computer (EC) running a mathematical model and a control unit under test are combined. The key features of the control system simulation are the ability to introduce any faults and register the system’s reaction under test and the rapid reconfiguration of the stand for the necessary conditions and tasks.
Considering the described features of the HIL modeling method, as well as its active application in various fields, when designing the wing misalignment control system, it was decided to apply the current and modern Hardware-in-the-Loop method to achieve the best results.
4. A Modeling Scheme for SCS
The first stage in the implementation of the HIL of the SCS was the development of the modeling scheme that simulated the operation of the aircraft control unit. CAD Matlab/Simulink was chosen for modeling due to its prevalence, clarity, and ease of use of the Simulink model in the HIL bench.
The modeling scheme allowed us to:
- —
Simulate the movement of the rail for retraction and release with stops in the given mechanization positions corresponding to a real aircraft;
- —
Simulate rack failures at any time, which led to the operation of the section skew control algorithm and the calculation of the response time of the SCS;
- —
Simulate failures of any of the IPS, which led to the operation of the built-in sensor control system and the exclusion of a pair with a failed sensor from the calculation;
- —
Save simulation results in the Matlab/Simulink format in the form of graphs and as a graphic file with specified graphs.
The modeling scheme consisted of two blocks imitating the “measuring bar—IPS” system of one edge of the mechanization section, a built-in section skew control block, and a model control panel. The modeling scheme of the “measuring bar—IPS” system is shown in
Figure 2. This block simulated the movement of the measuring bar relative to the IPS. When controlling the stand through a model, these blocks imitated the IPS readings when moving along a given measuring bar.
The skew detection algorithm was implemented within a separate block that received real IPS signals moving opposite the measuring bars.
5. Consideration of Skew Algorithms
In the mathematical model, two variants of the algorithm for determining the skew were implemented:
- —
Algorithm for determining the skew by the counter;
- —
Time skew detection algorithm.
Before SCS algorithms started, the discrete voltage signal from the IPS was converted into a digital signal [0,1], where 0 corresponds to a low voltage level and 1 to a high level.
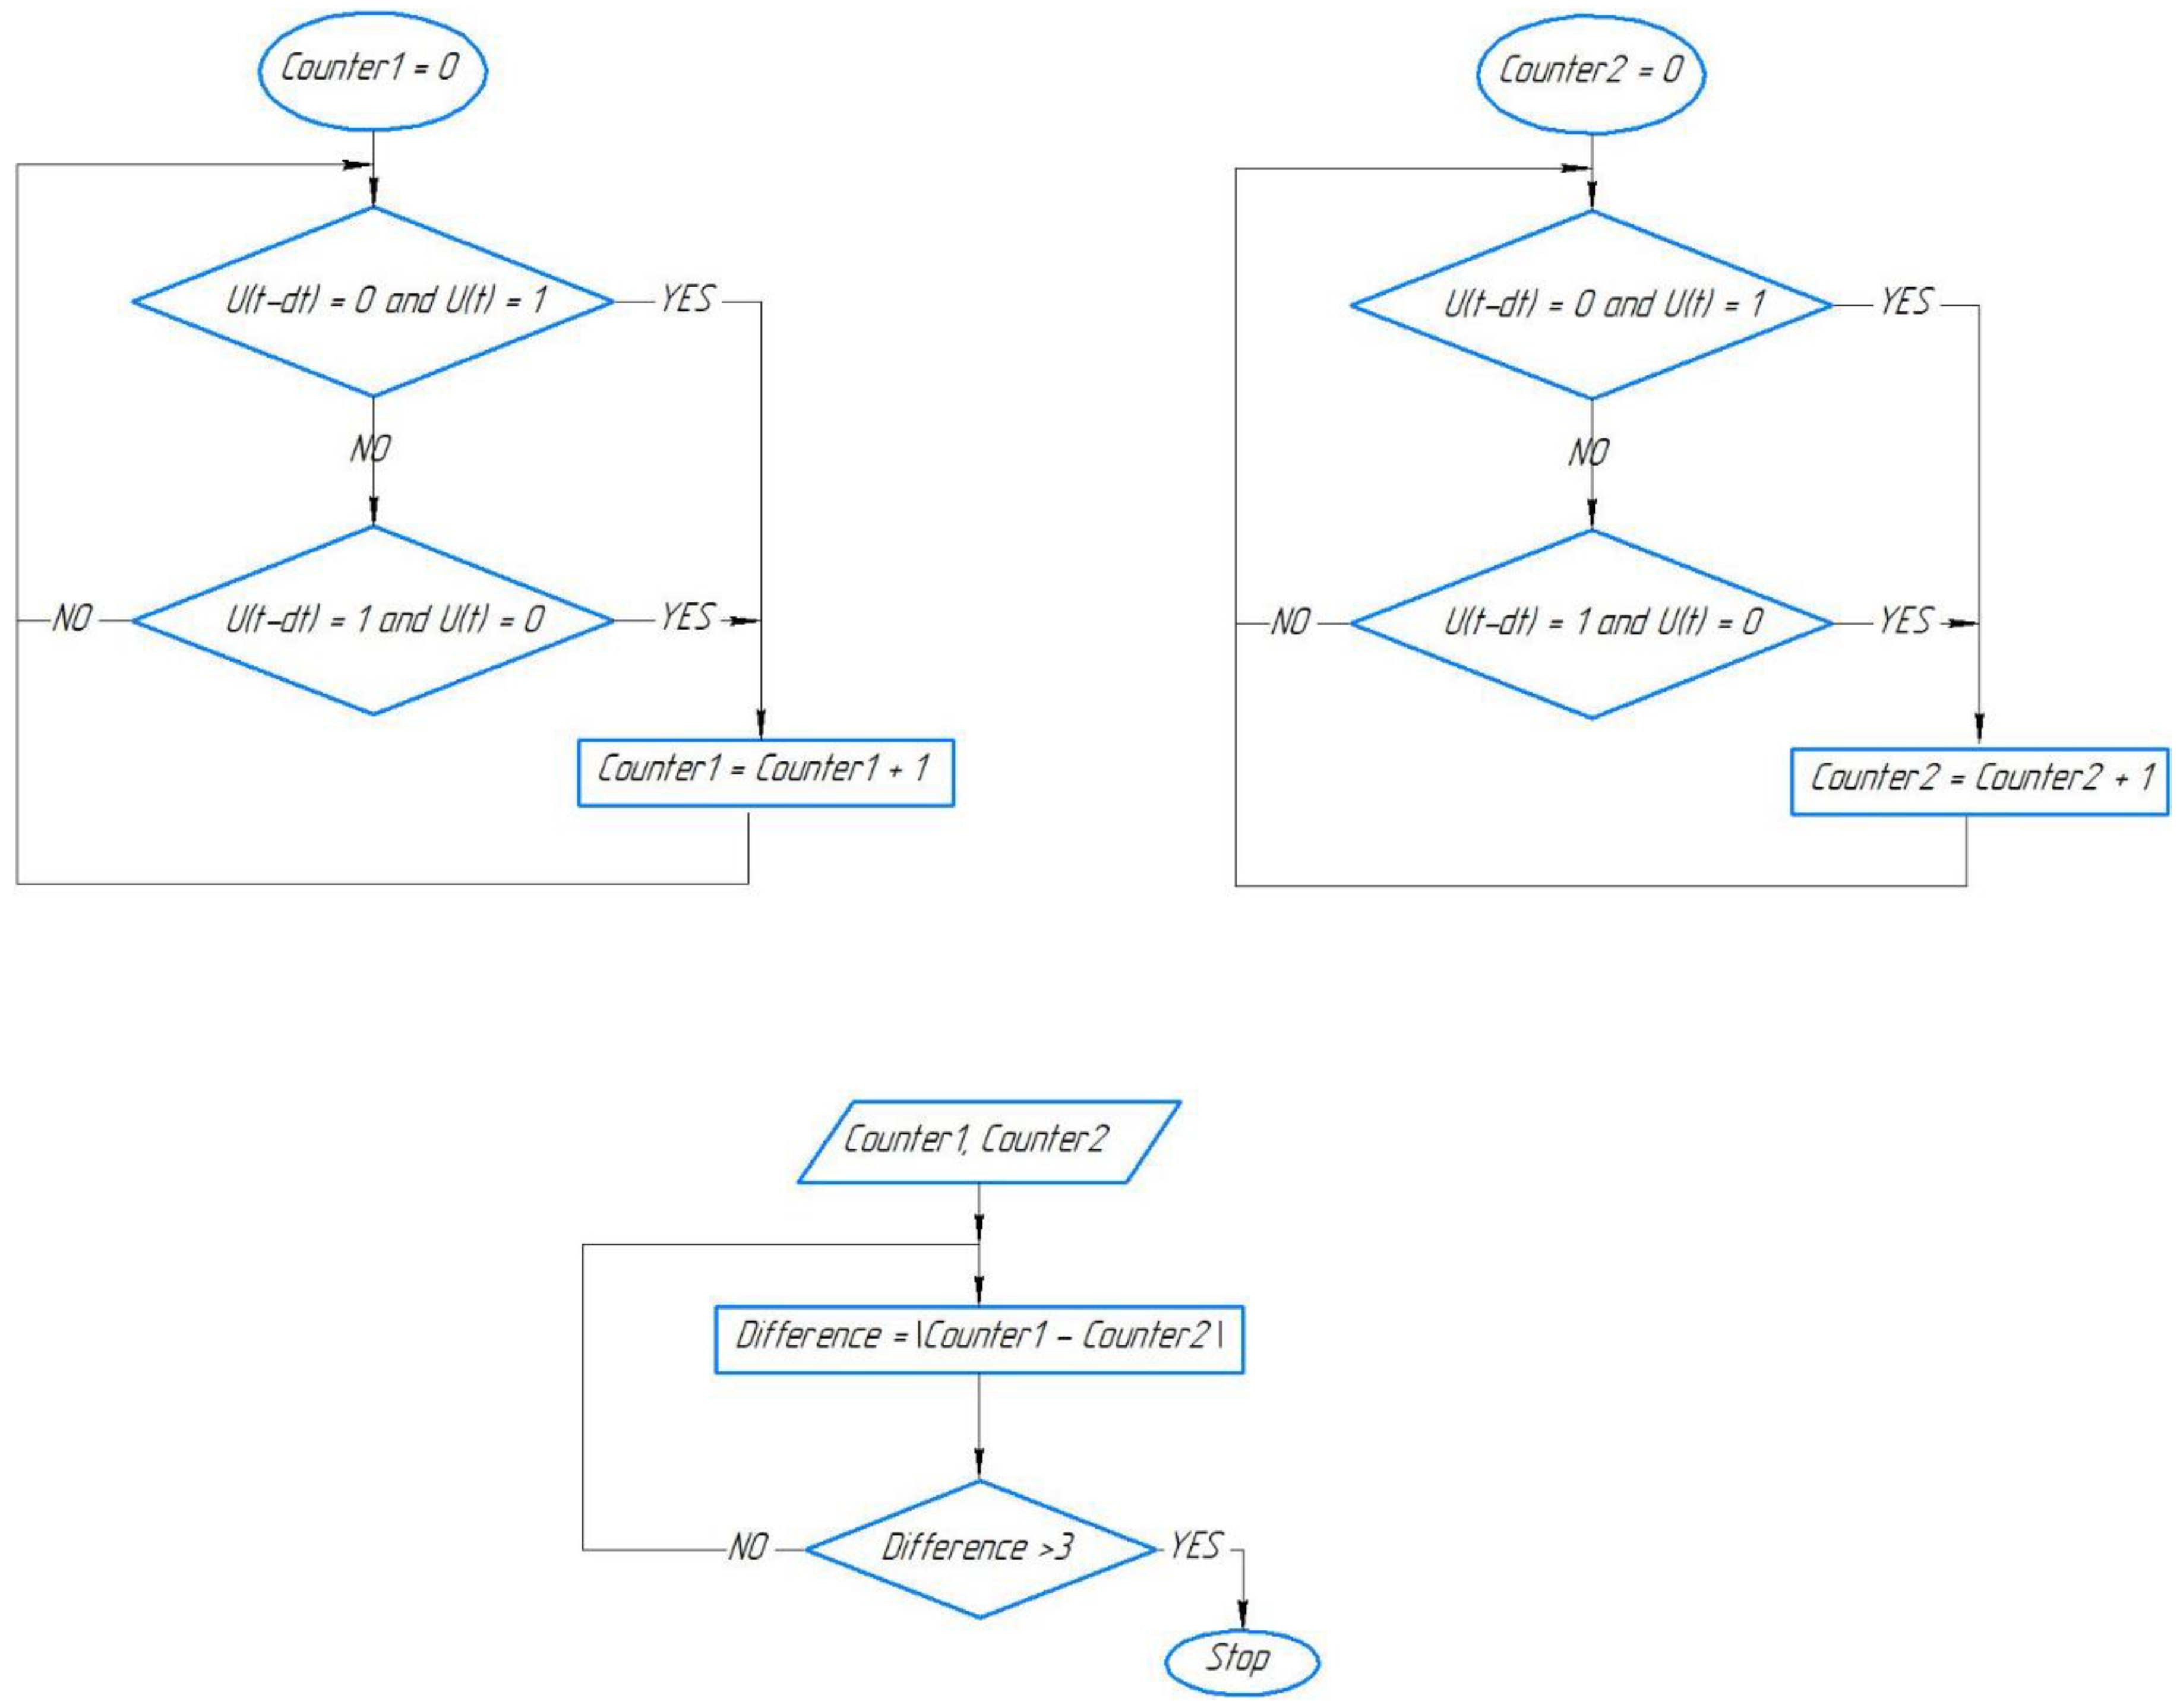
The algorithm for determining the skew by the counter consisted of counting the number of signal changes (from 0 to 1 or from 1 to 0) obtained when the IPS moved relative to the measuring bar. Section misalignment was therefore detected if the switch counters monitoring the movement on the two rails within one section differed by three counts corresponding to the sensor passing opposite one mark and trough within 0.3 s. The block diagram of the algorithm’s operation with the counter is shown in
Figure 3, where U is the signal from the sensor.
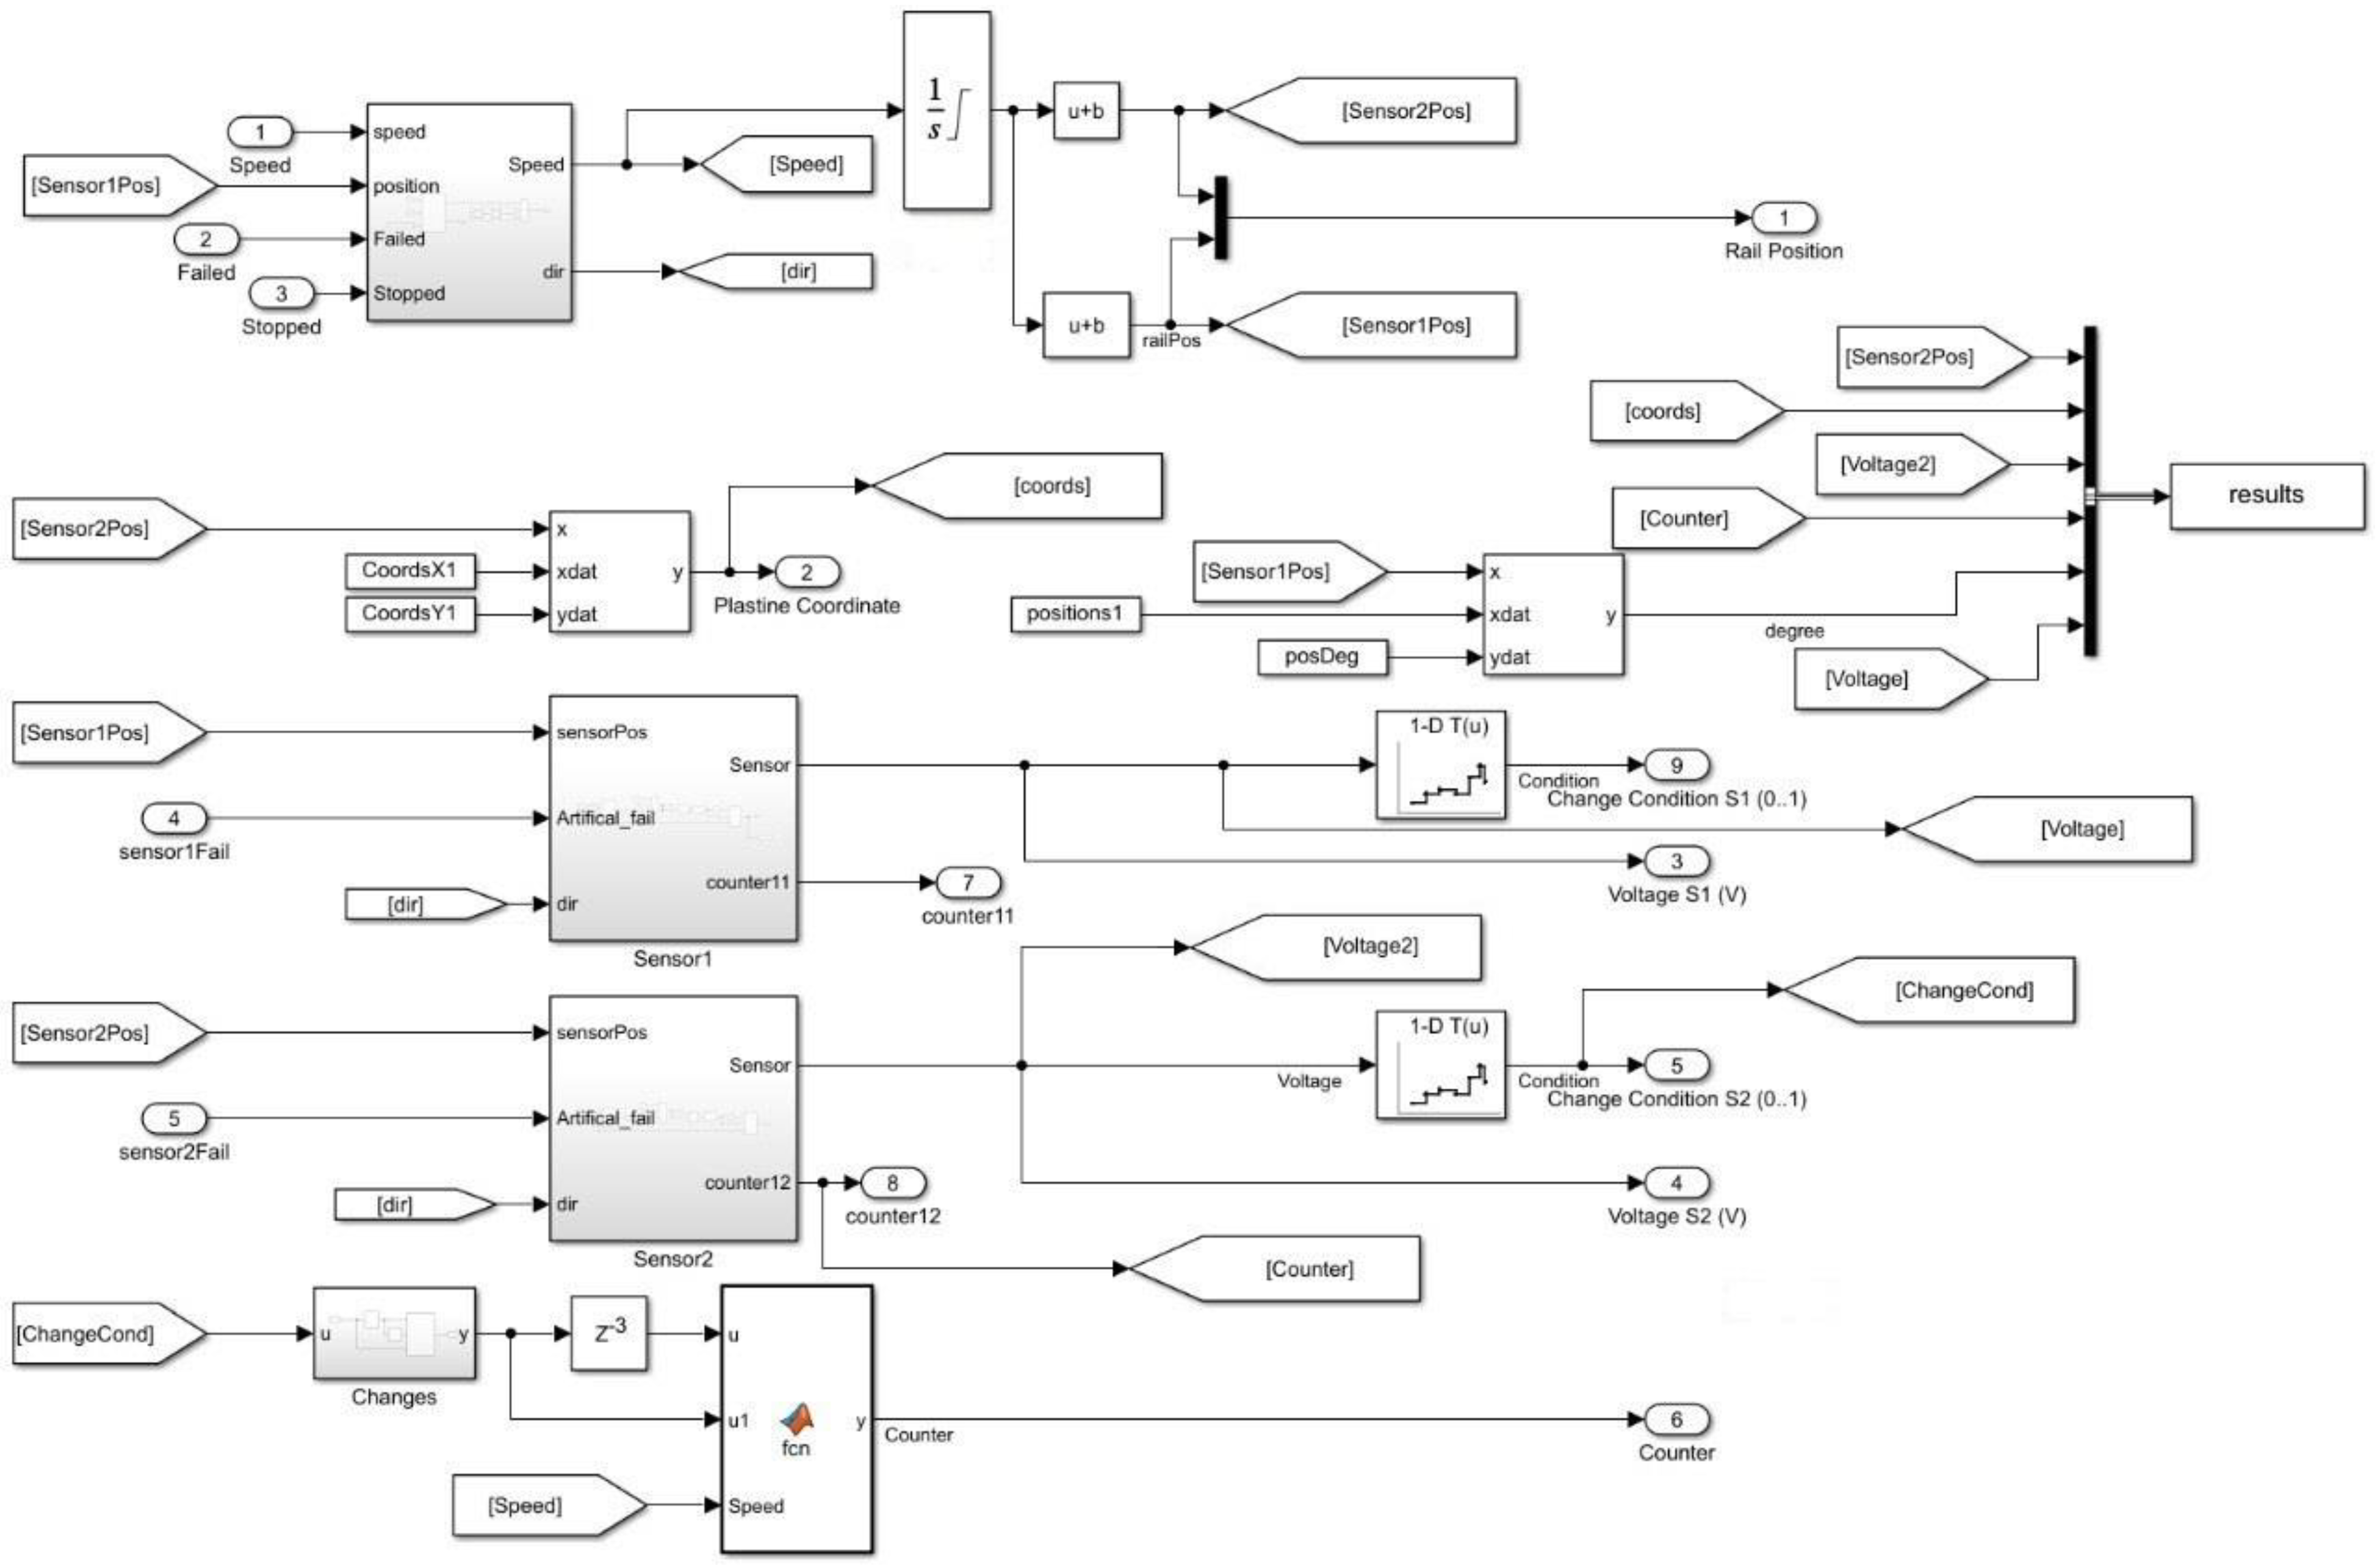
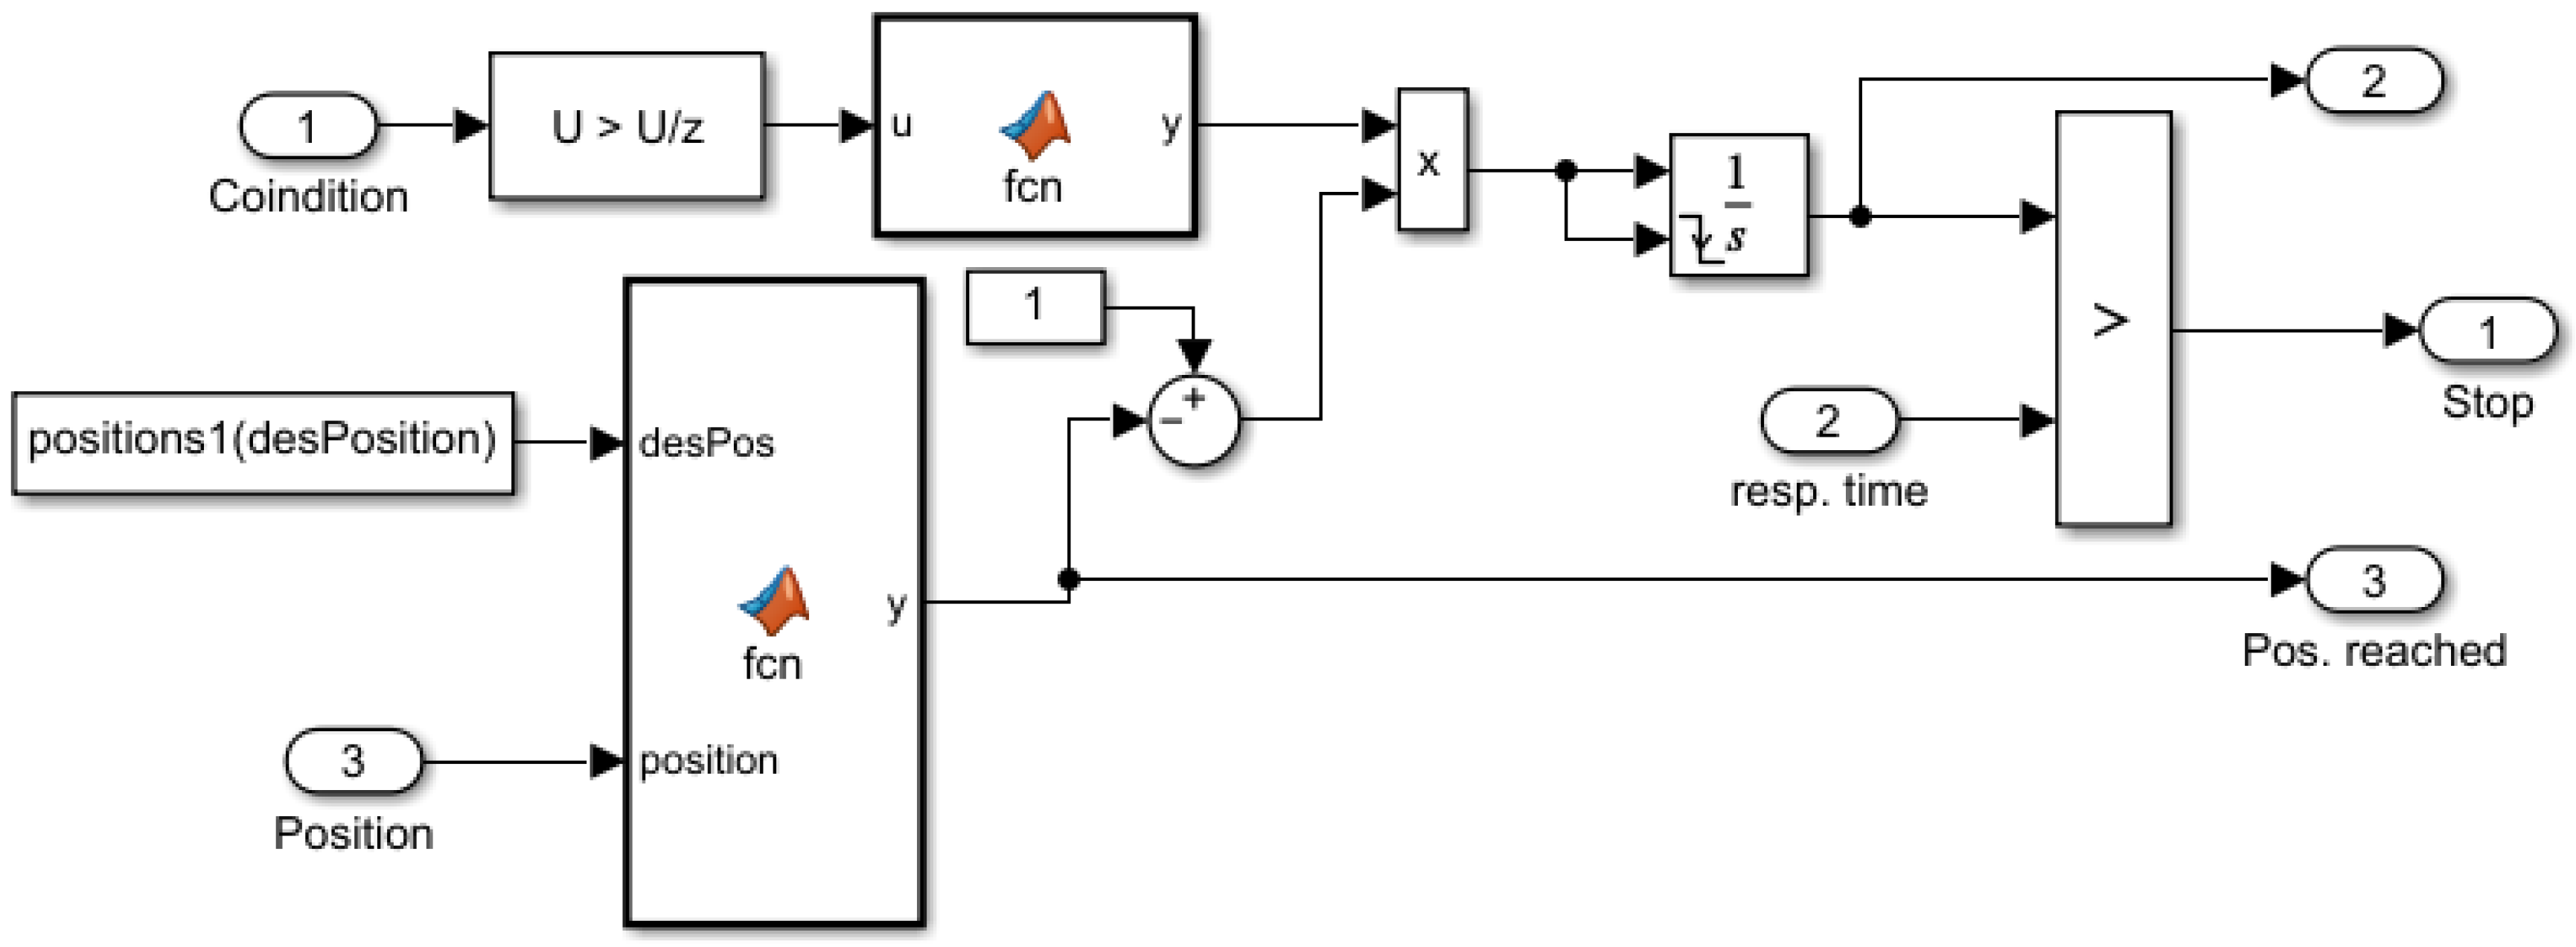
The simulation of the algorithm with a counter to control one section, considering signals from two sensors, is shown in
Figure 4.
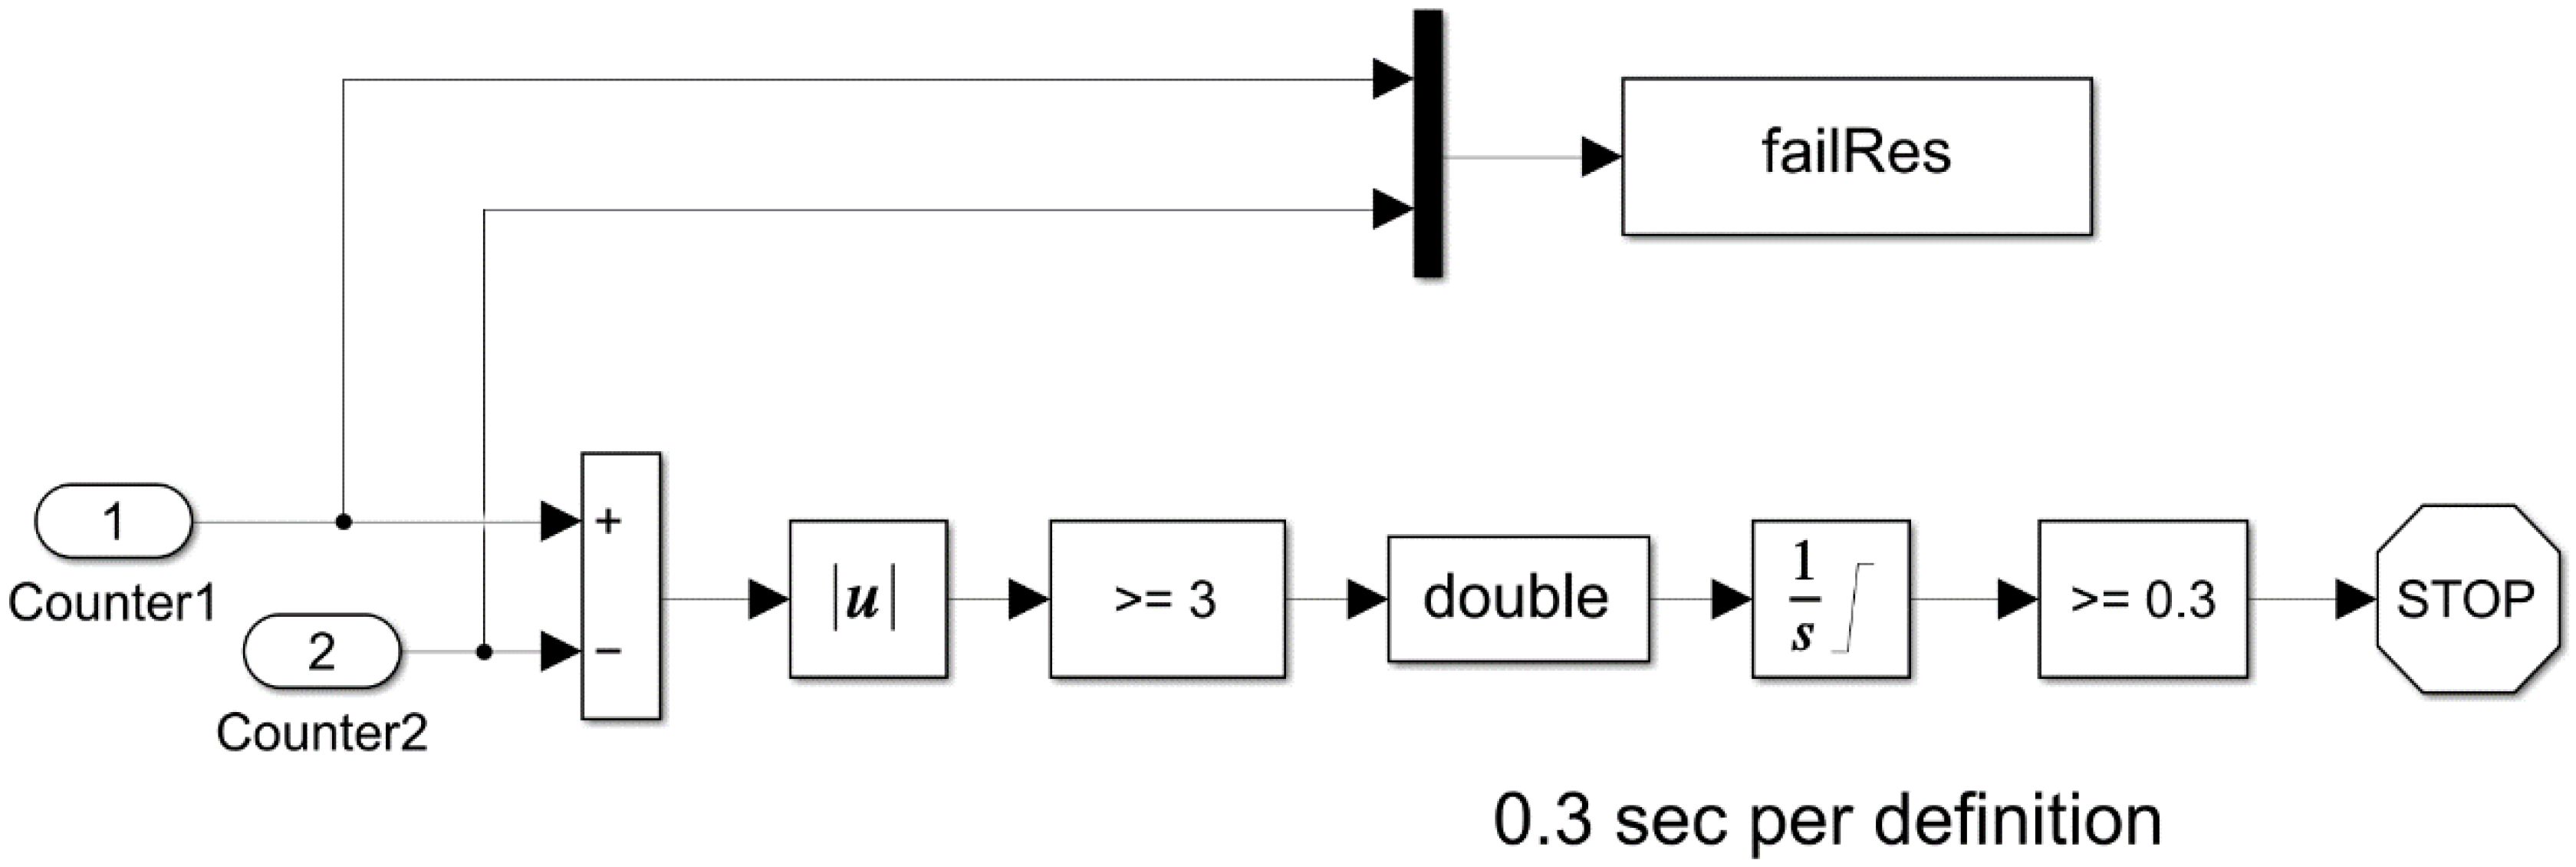
The simulation diagram (
Figure 4) compares the difference between the counter values of the number of switching operations of the IPS (from 0 to 1 or from 1 to 0) controlling the two measuring bars. The counter values must not differ by more than three tap-change operations. If the counters for changing the IPS signal from two bars diverge by more than 3, a stop signal was sent, which went through the delay unit for 0.3 s.
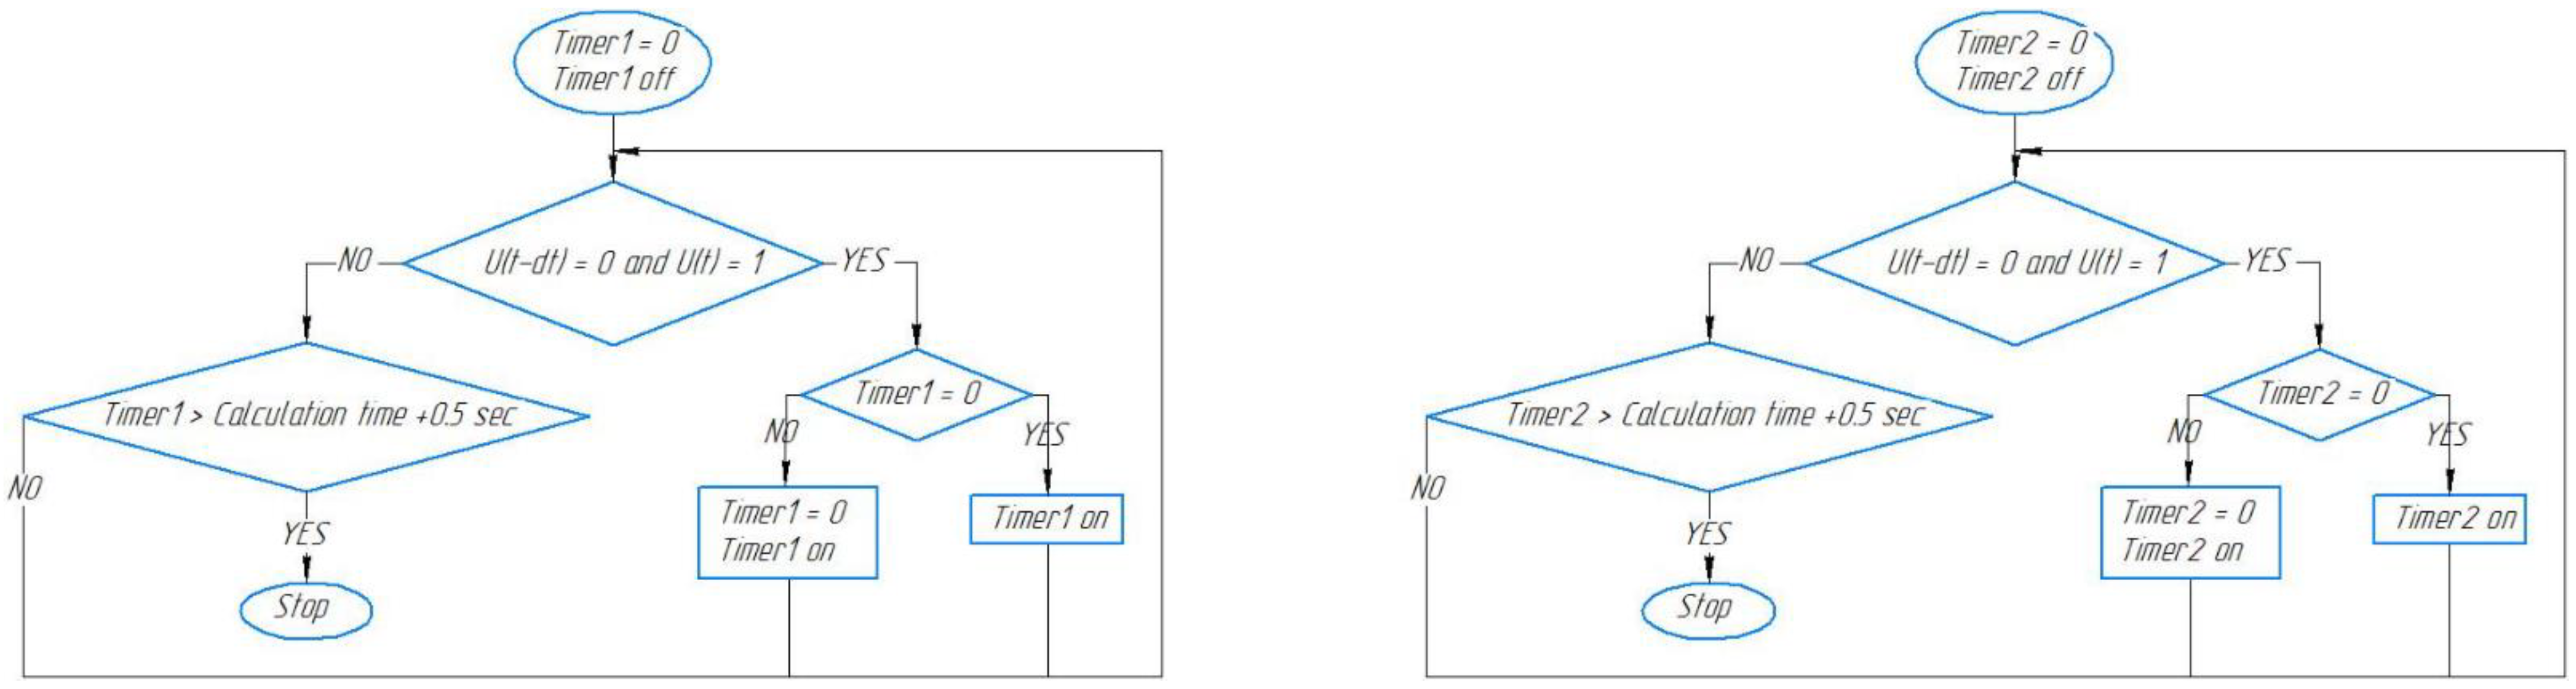
The algorithm’s principle of operation for the time skew is determined when switching the discrete voltage signal from the IPS from “0” to “1”. At that point, a timer was started, which counted the time until the next switching of the signal from “0” to “1”. After this, the timer reset and restarted. Thus, the algorithm measured the passage time of one ledge and one interval (the switching period of the IPS). If the current timer period exceeded the pre-calculated transit time of one ladder and one interval, increased by 0.5 s to prevent false alarms of SCS, a section skew was detected. The block diagram of the time algorithm is shown in
Figure 5, where
U is the signal from the sensor,
t is the current time, and
dt is the time step.
The block diagram (
Figure 5) checks each cycle of the system to see if the IPS signal has changed. If the IPS signal changed from 0 to 1, provided the timer had not been started, the timer is started. If the timer has already been started, it was reset and started again. If the IPS signal did not change, the timer continued to count until it reached the calculated time of one lap and one interval, increased by 0.5 s. When this value was reached, the skew was detected.
Figure 6 shows the simulation of timer 1 in MATLAB Simulink. The simulation of timer 1 was performed when implementing a time algorithm taking into account the signal from one sensor.
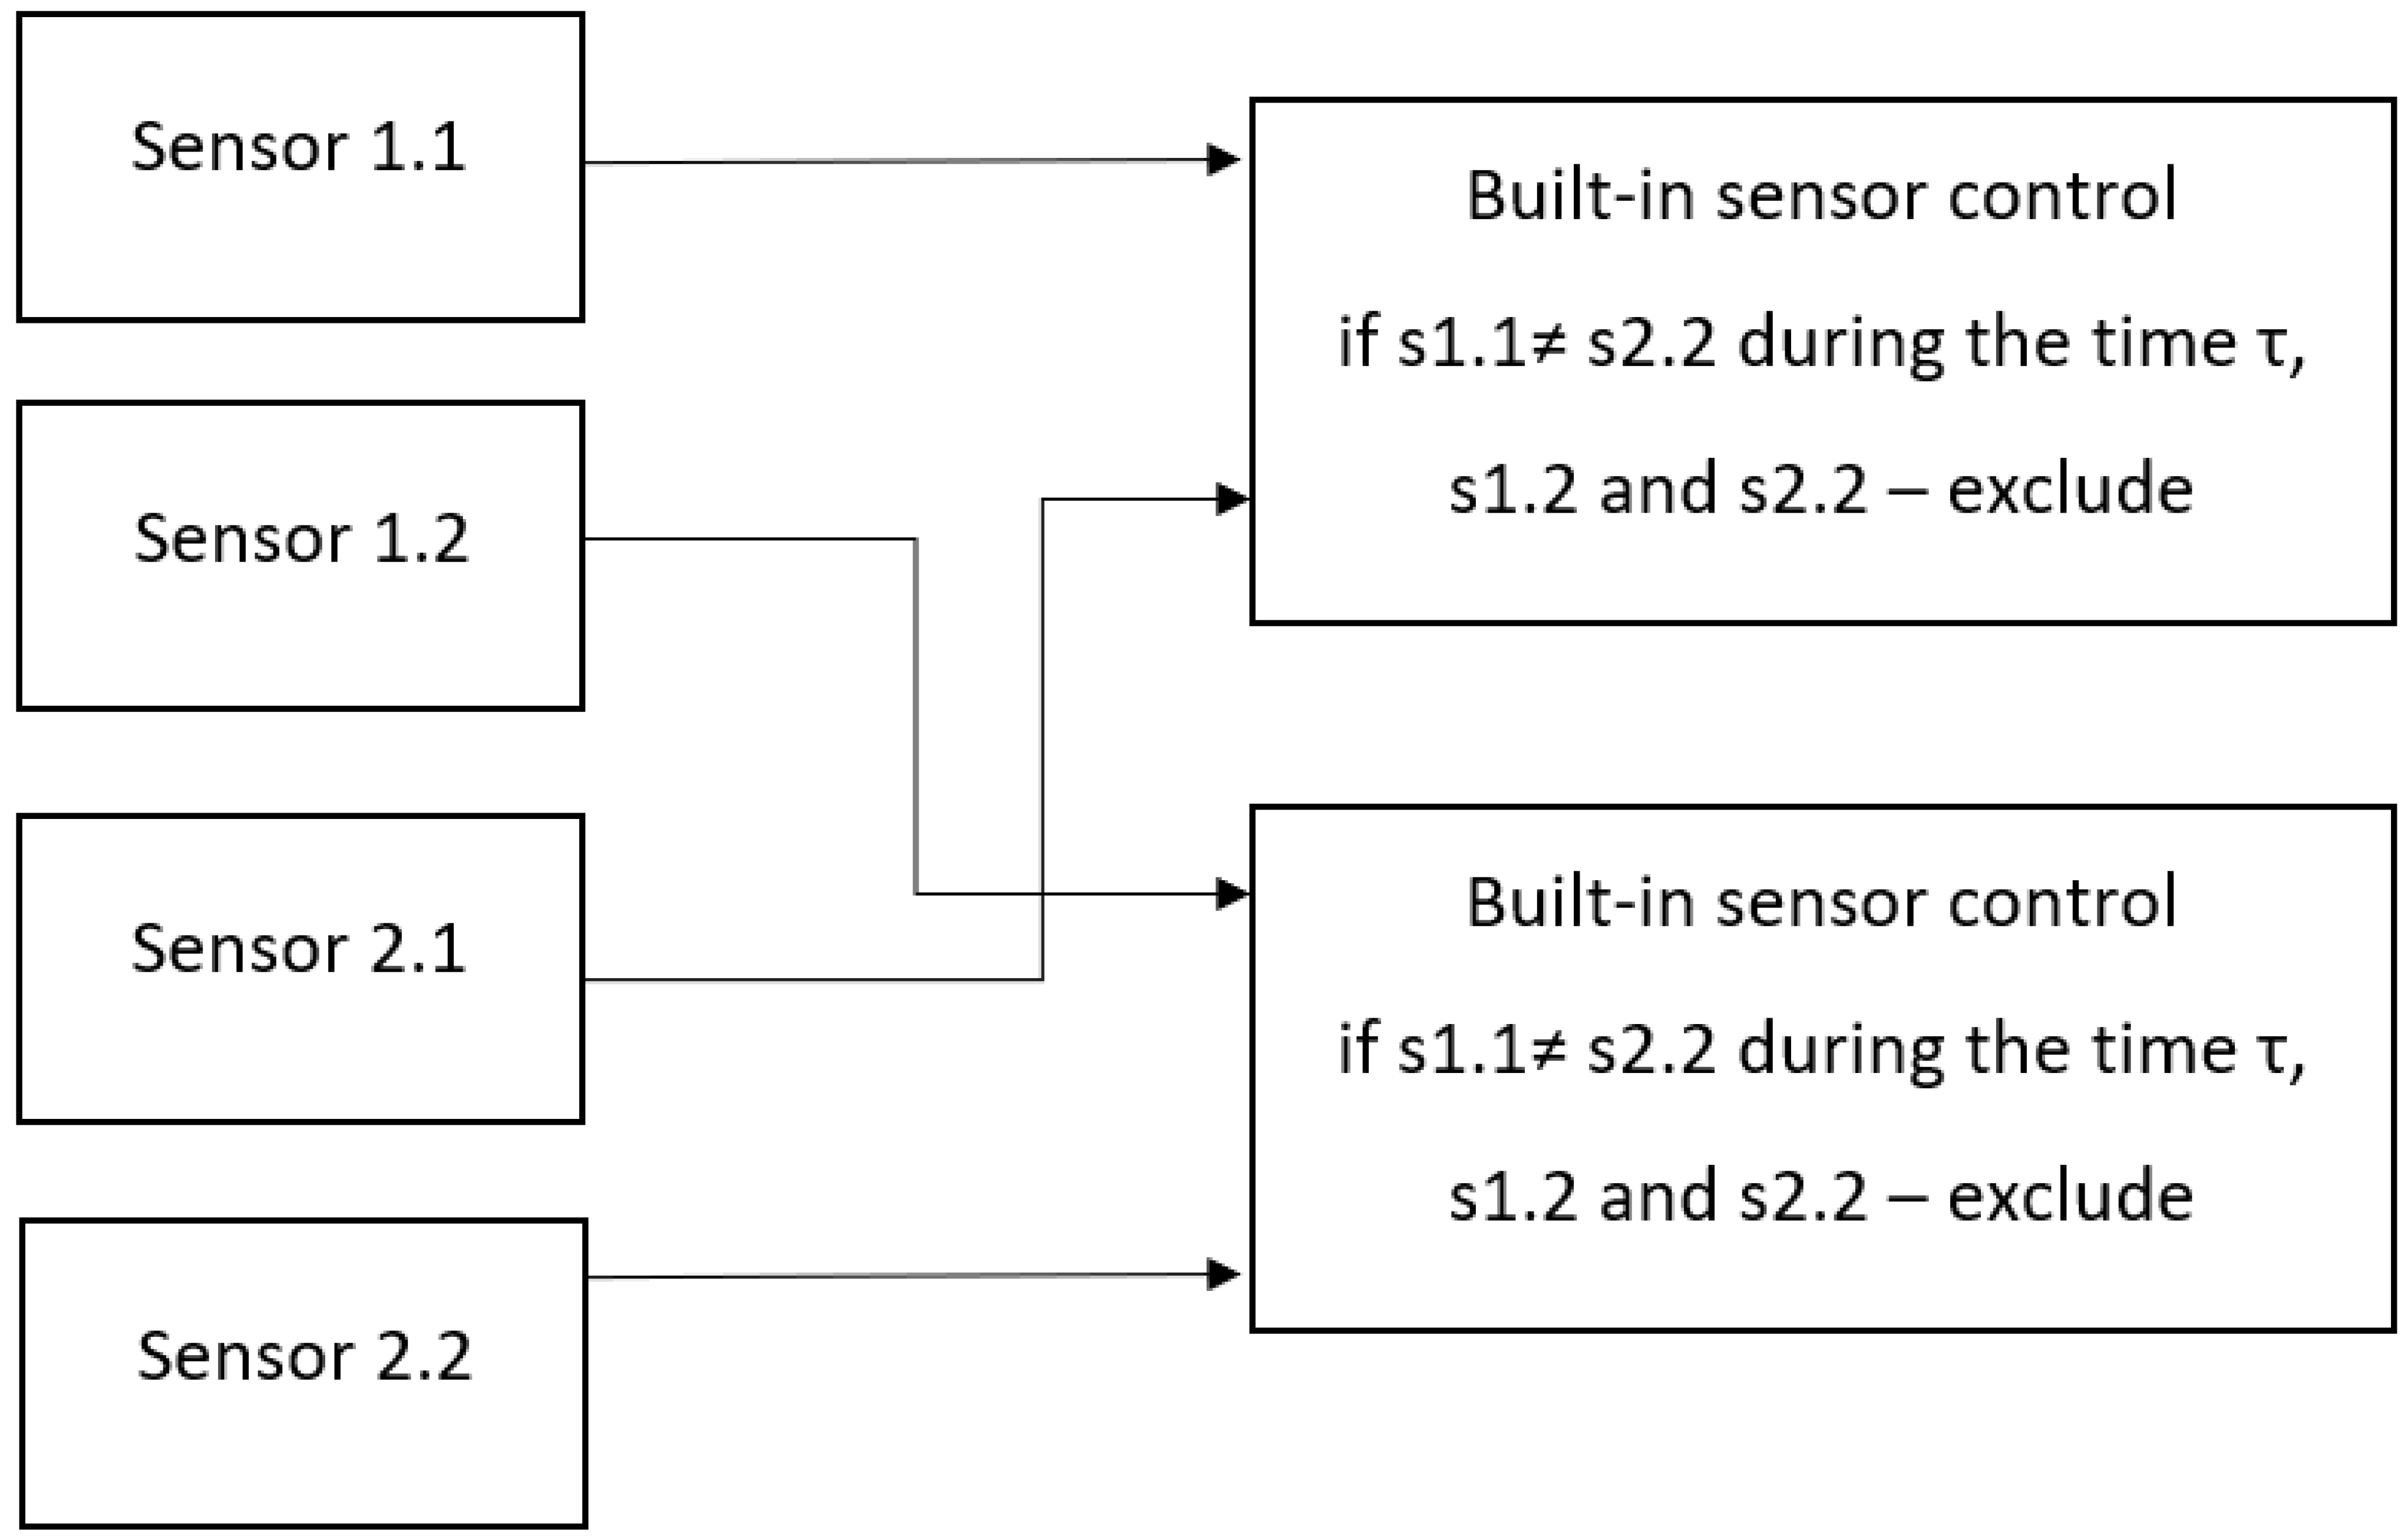
To ensure a fail-safe within the SCS, it installed two sensors opposite one rail. Thus, the SCS used four IPS sensors during operation, which allowed for built-in control of the sensors.
The principle of operation of the built-in control consisted of a pairwise comparison between the signals of the sensors opposite one rail and the signals of the IPS opposite those sensors. In the event of a discrepancy between readings for a certain time, a pair of sensors was considered faulty, and the signals from these IPS were excluded from the system. The block diagram of the built-in IPS control algorithm is shown in
Figure 7.
To model ideal readings of IPS when moving along a given measuring bar, as well as the possibility of working with different sections of wing mechanization in the mathematical model, the following parameters were set:
Based on the given characteristics, the model calculated the total length of the rail’s working part and the marks’ coordinates.
6. System Test Station (Test Stand)
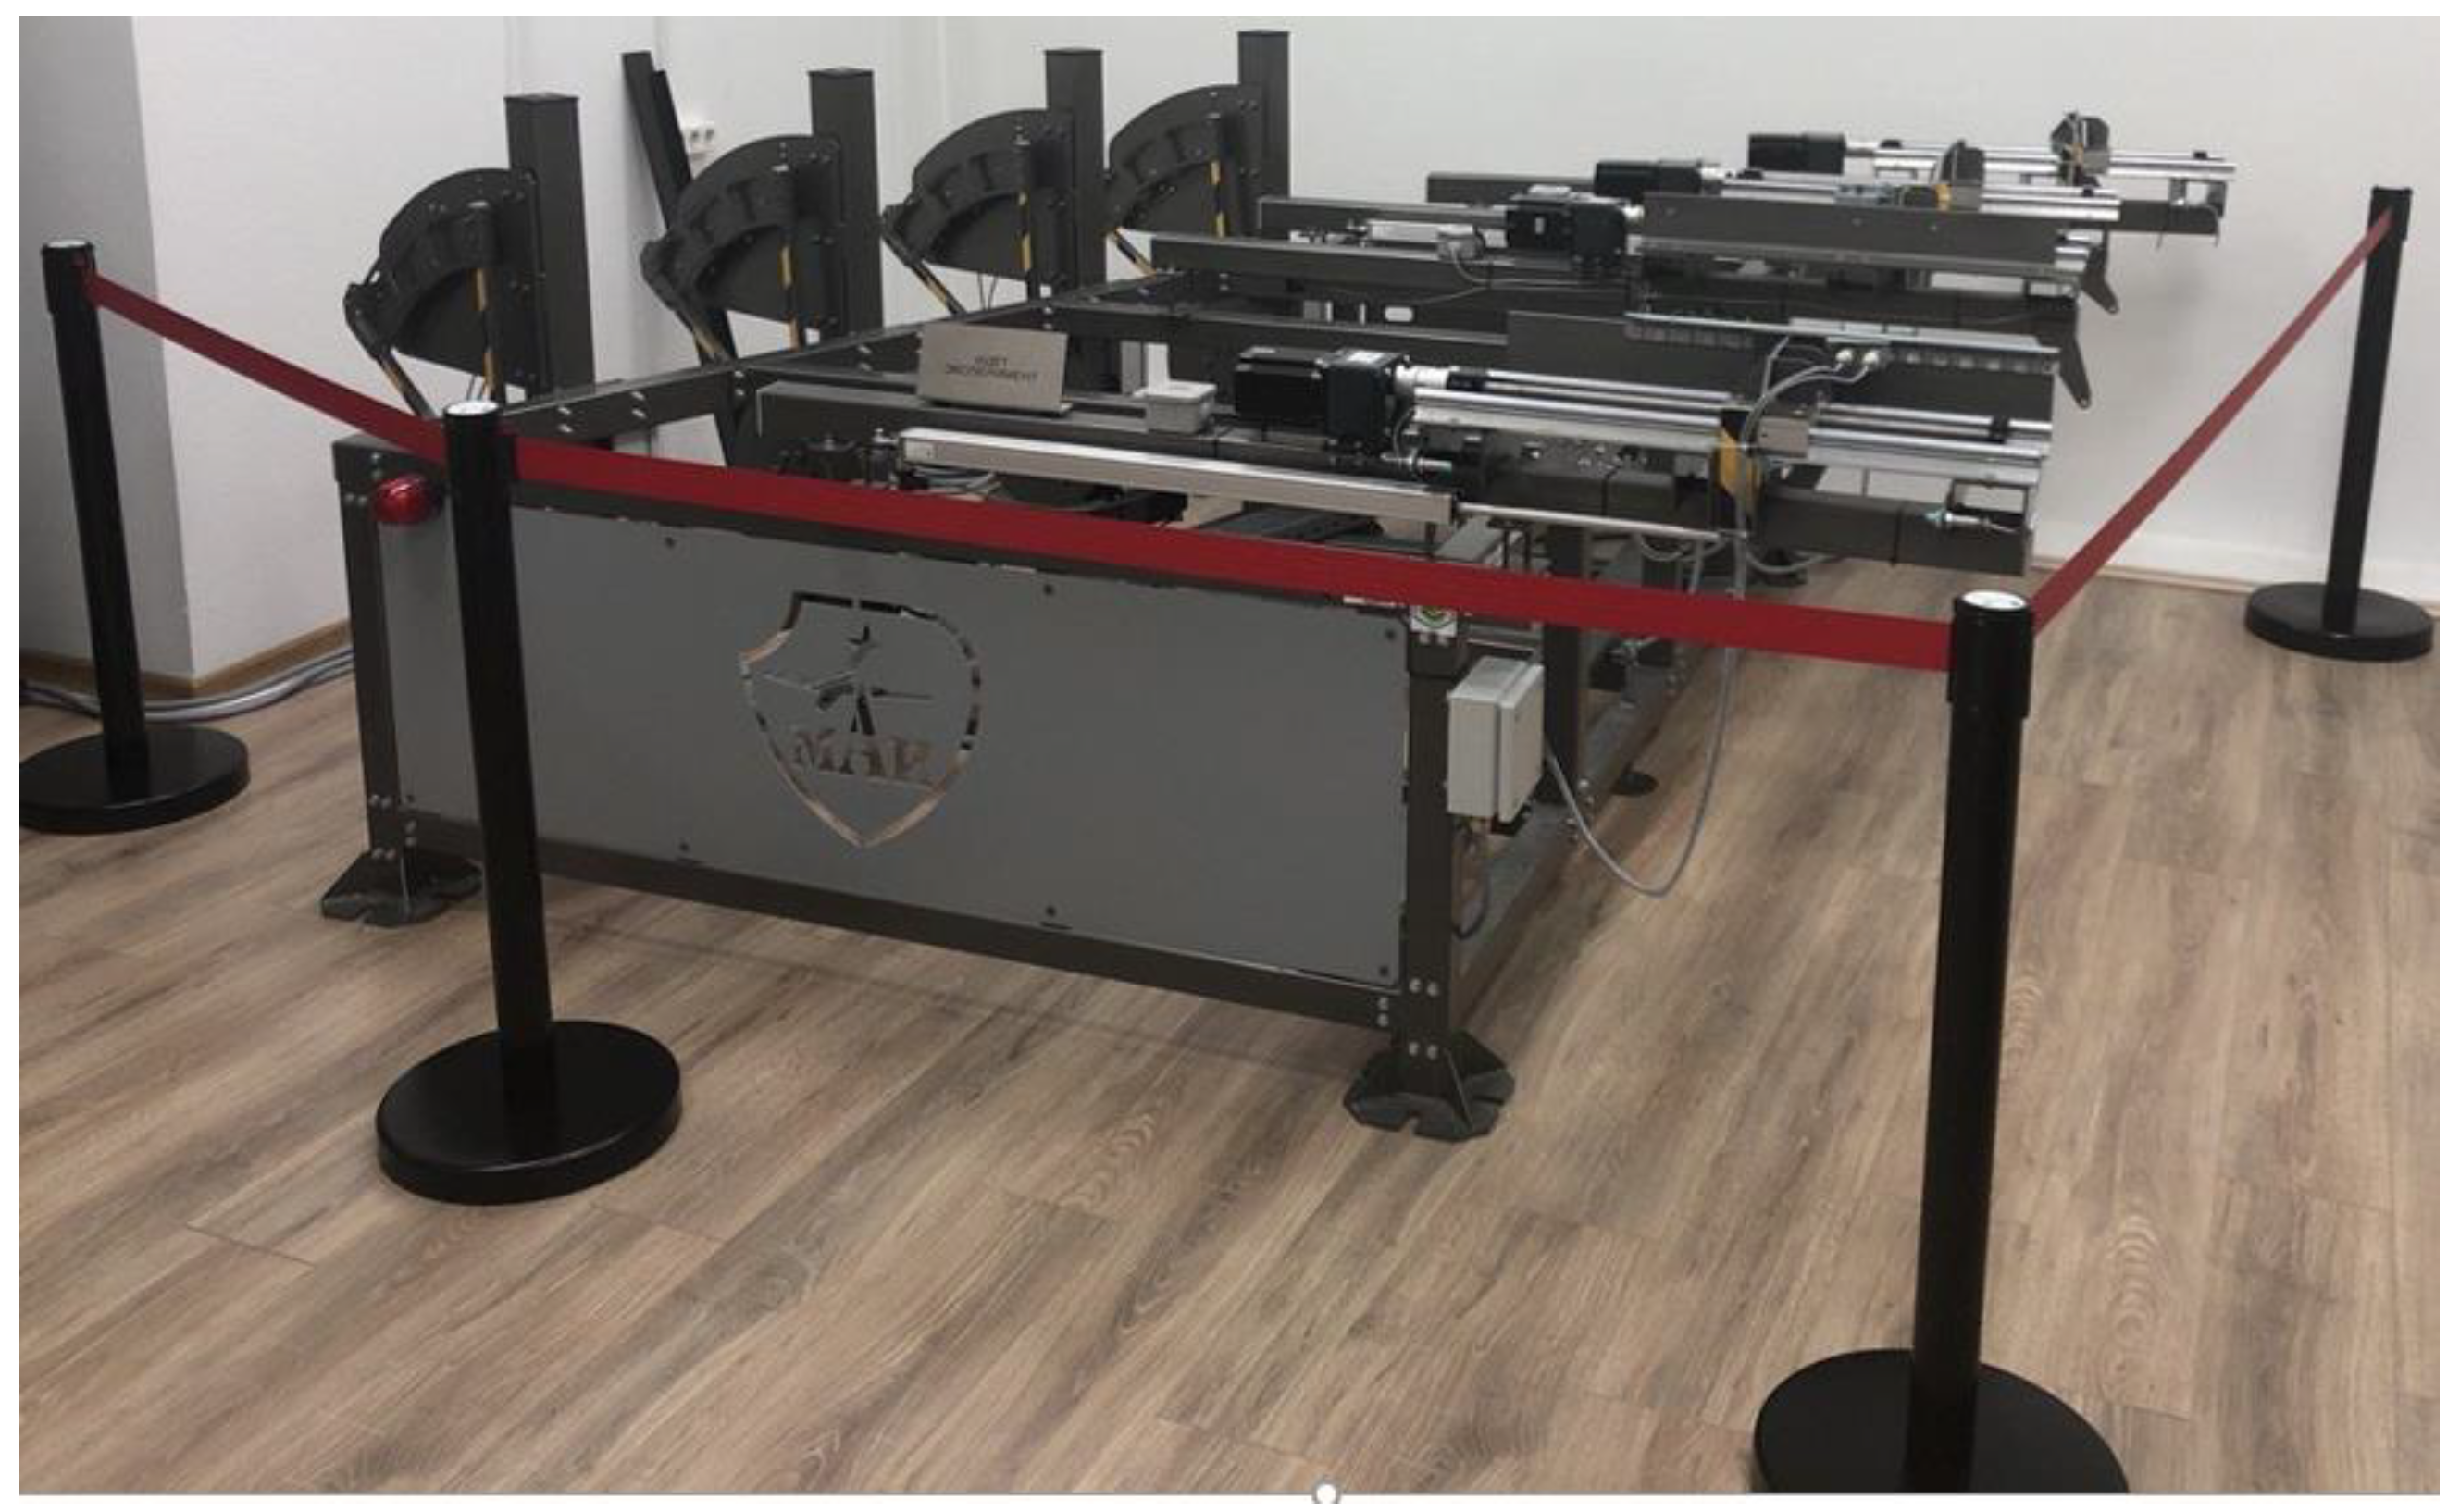
As part of developing the skew control system, it was necessary to test the components of the SCS, work algorithms, and conduct live tests. For these purposes, a bench of the wing skew control system was designed and implemented (
Figure 8). This test set was designed to test the components of the SCS system.
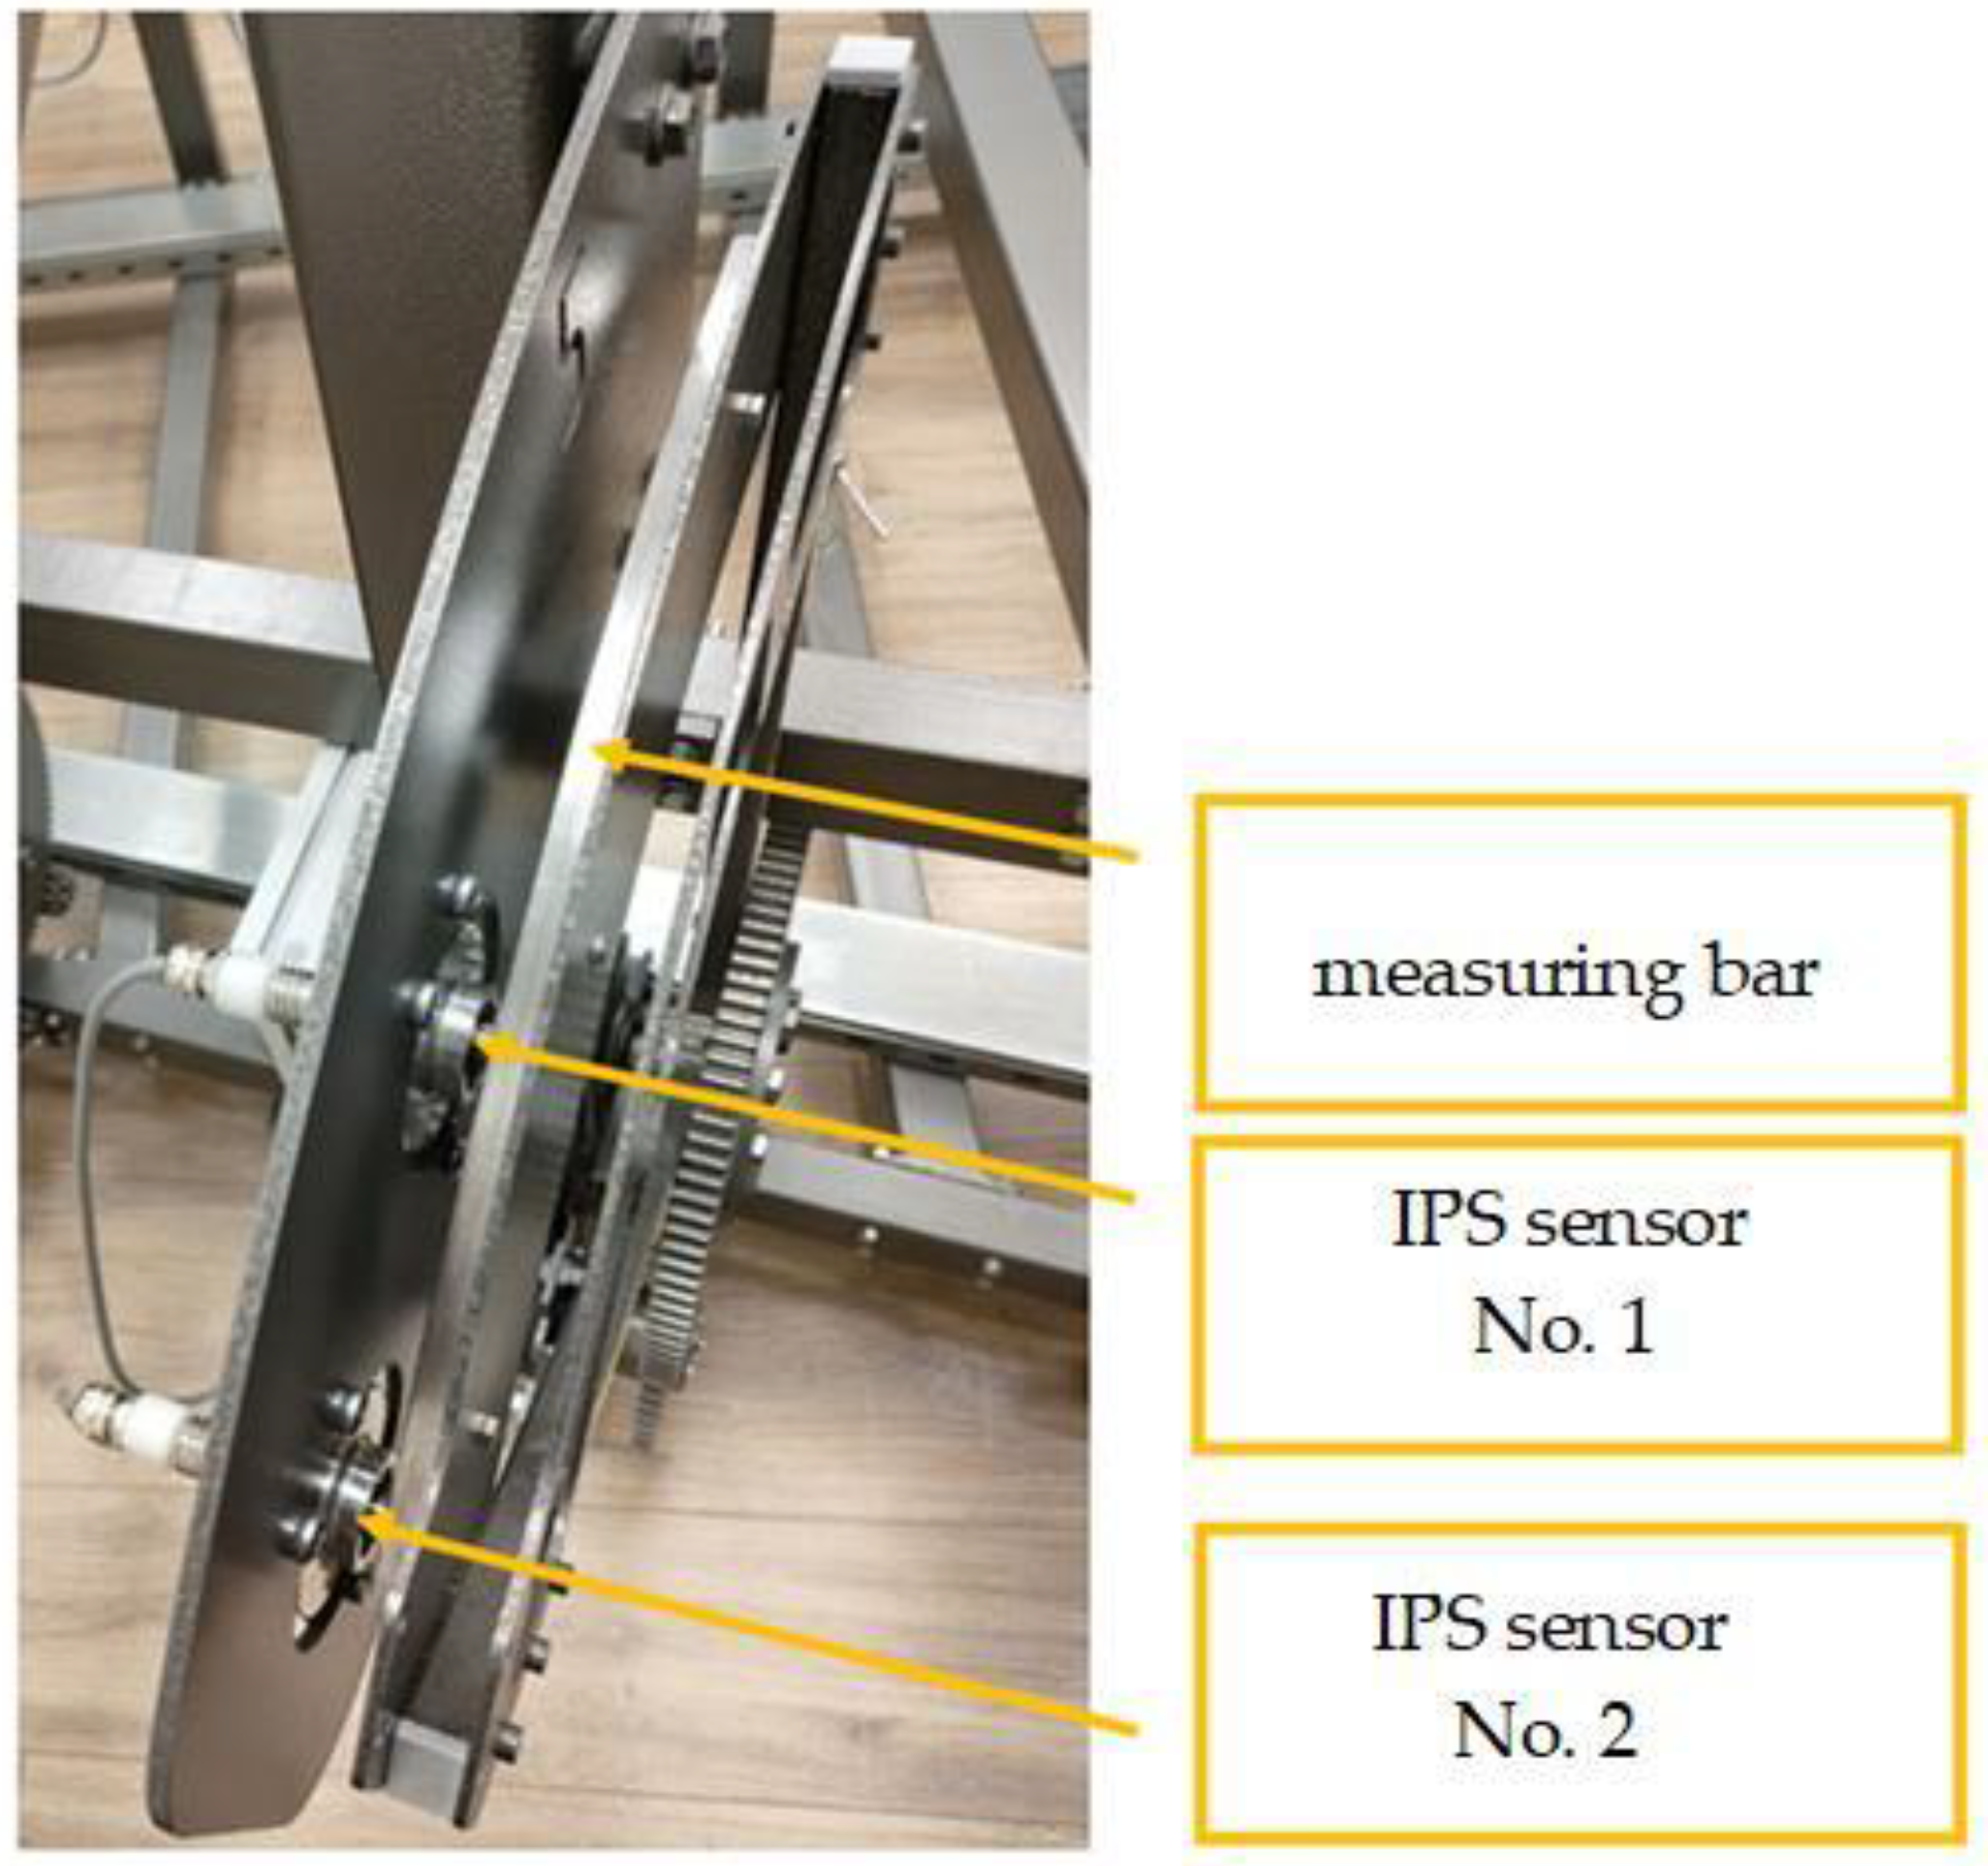
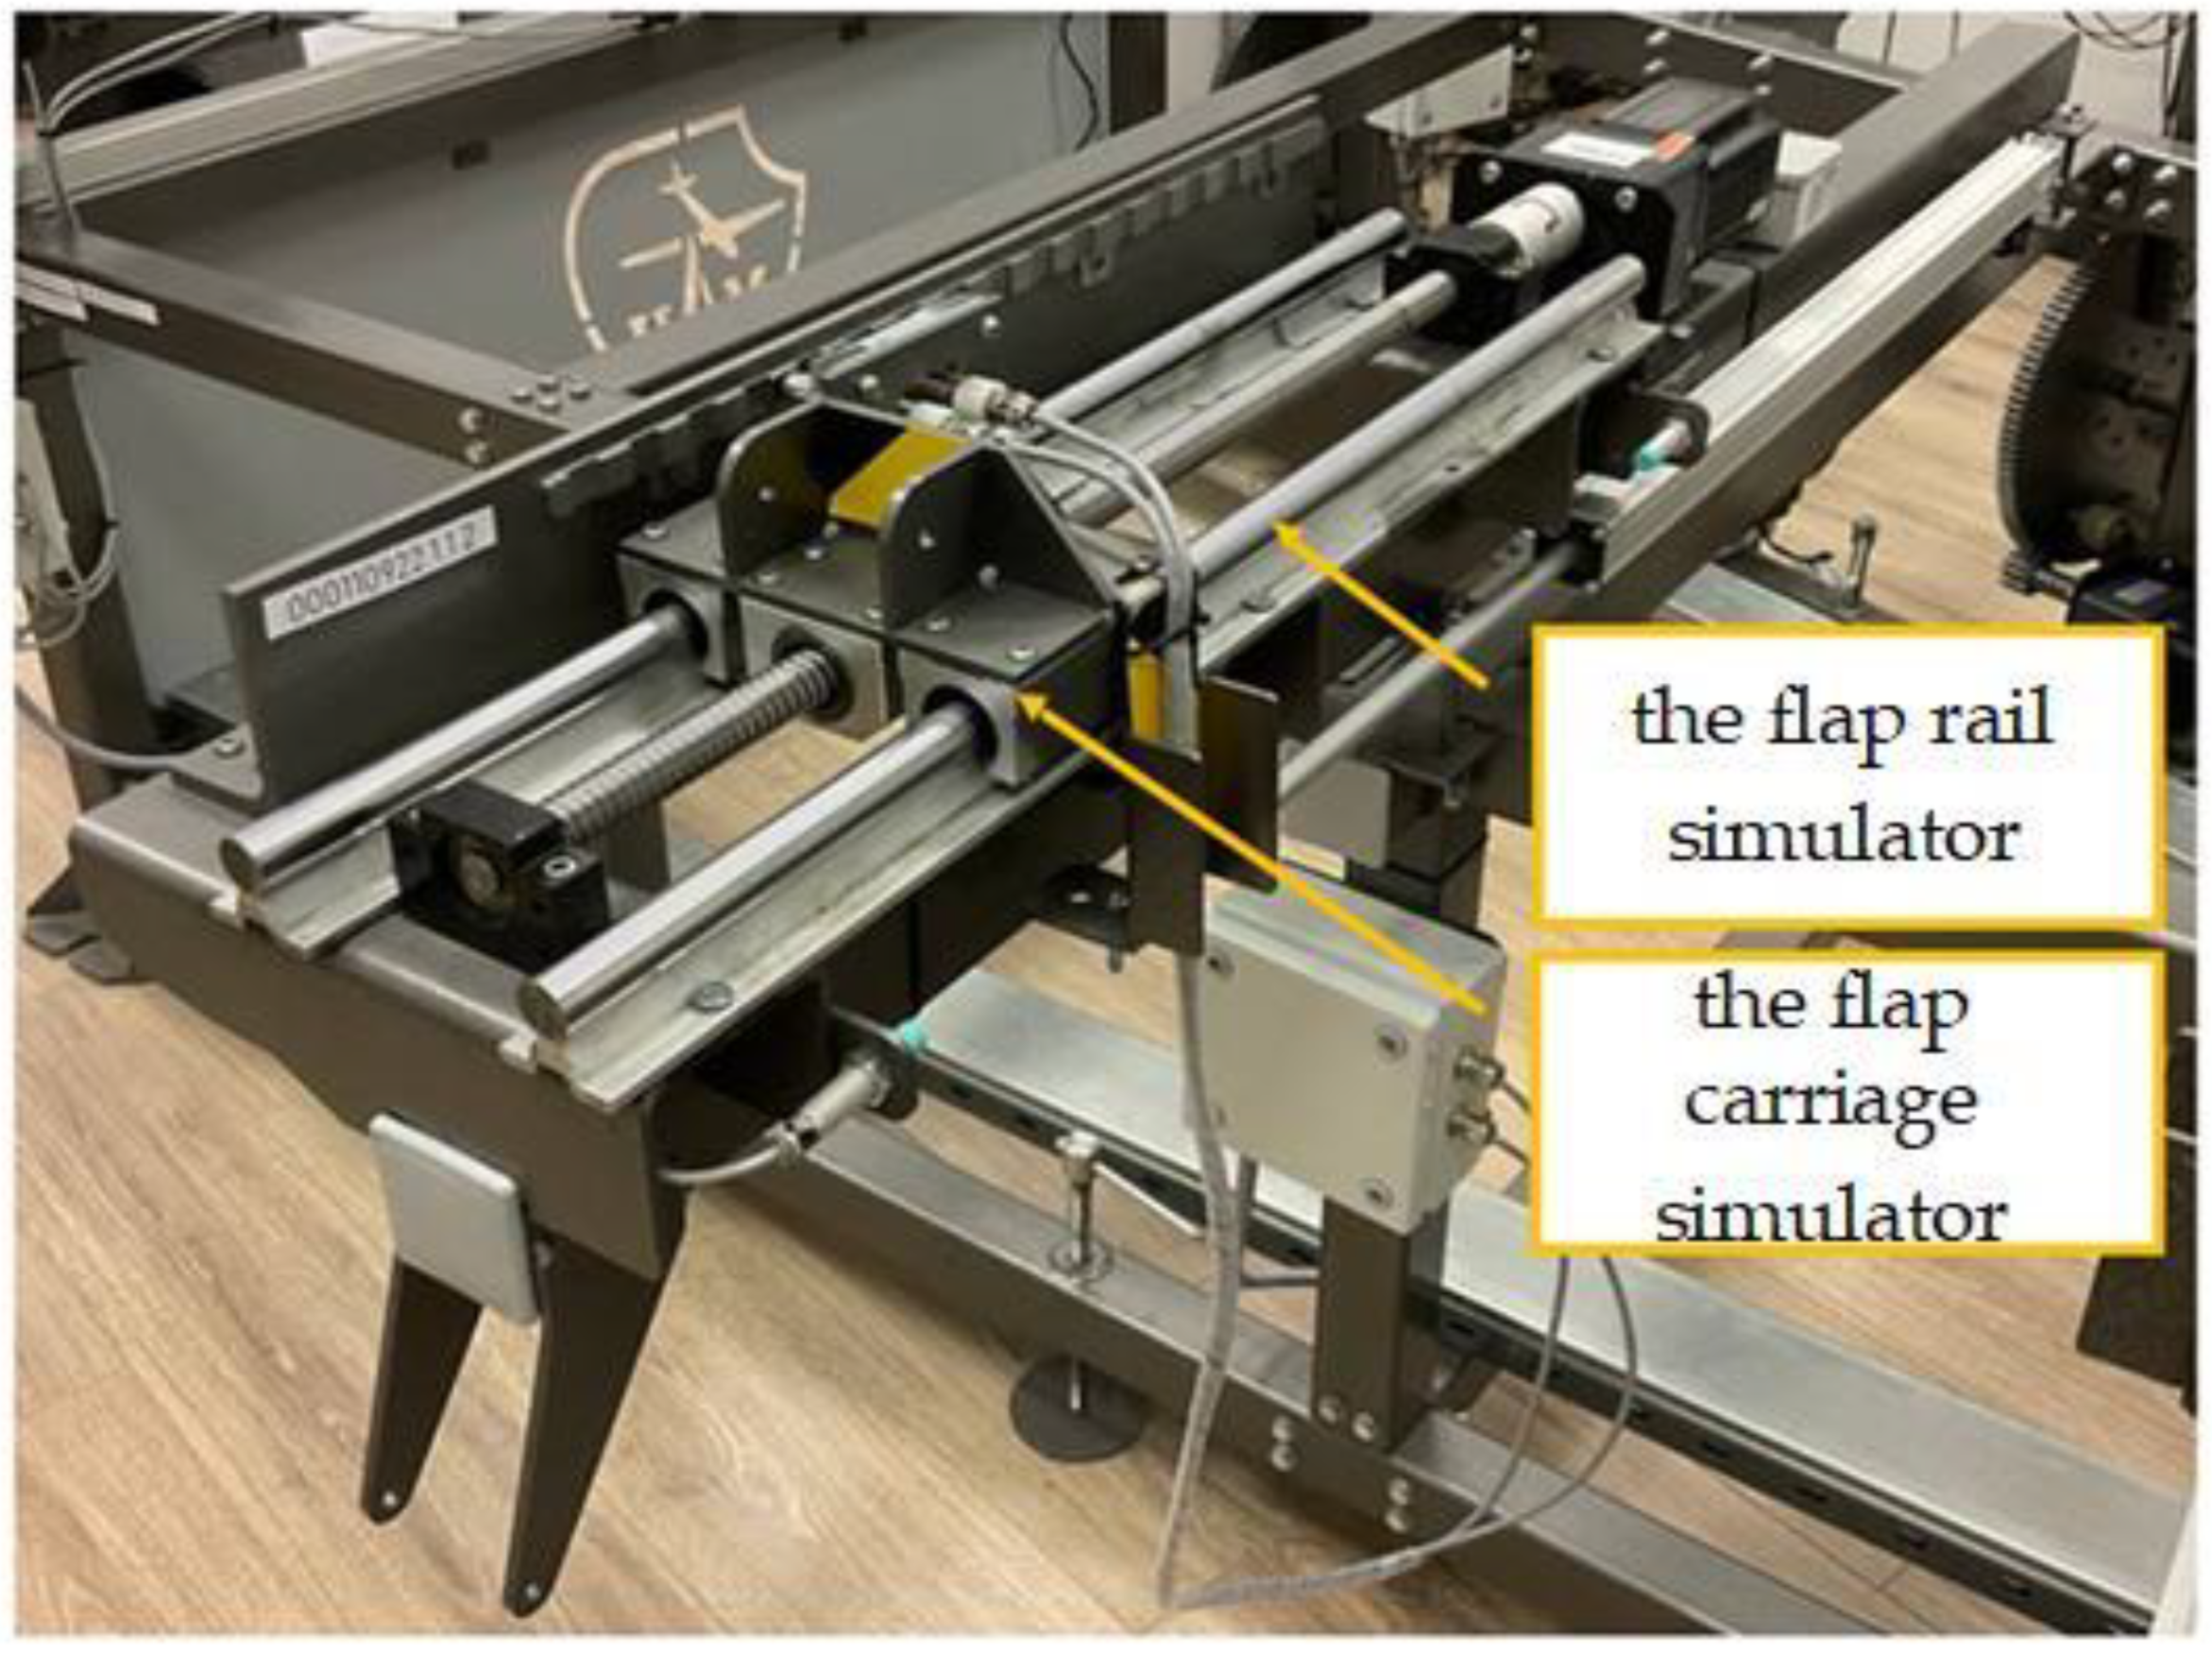
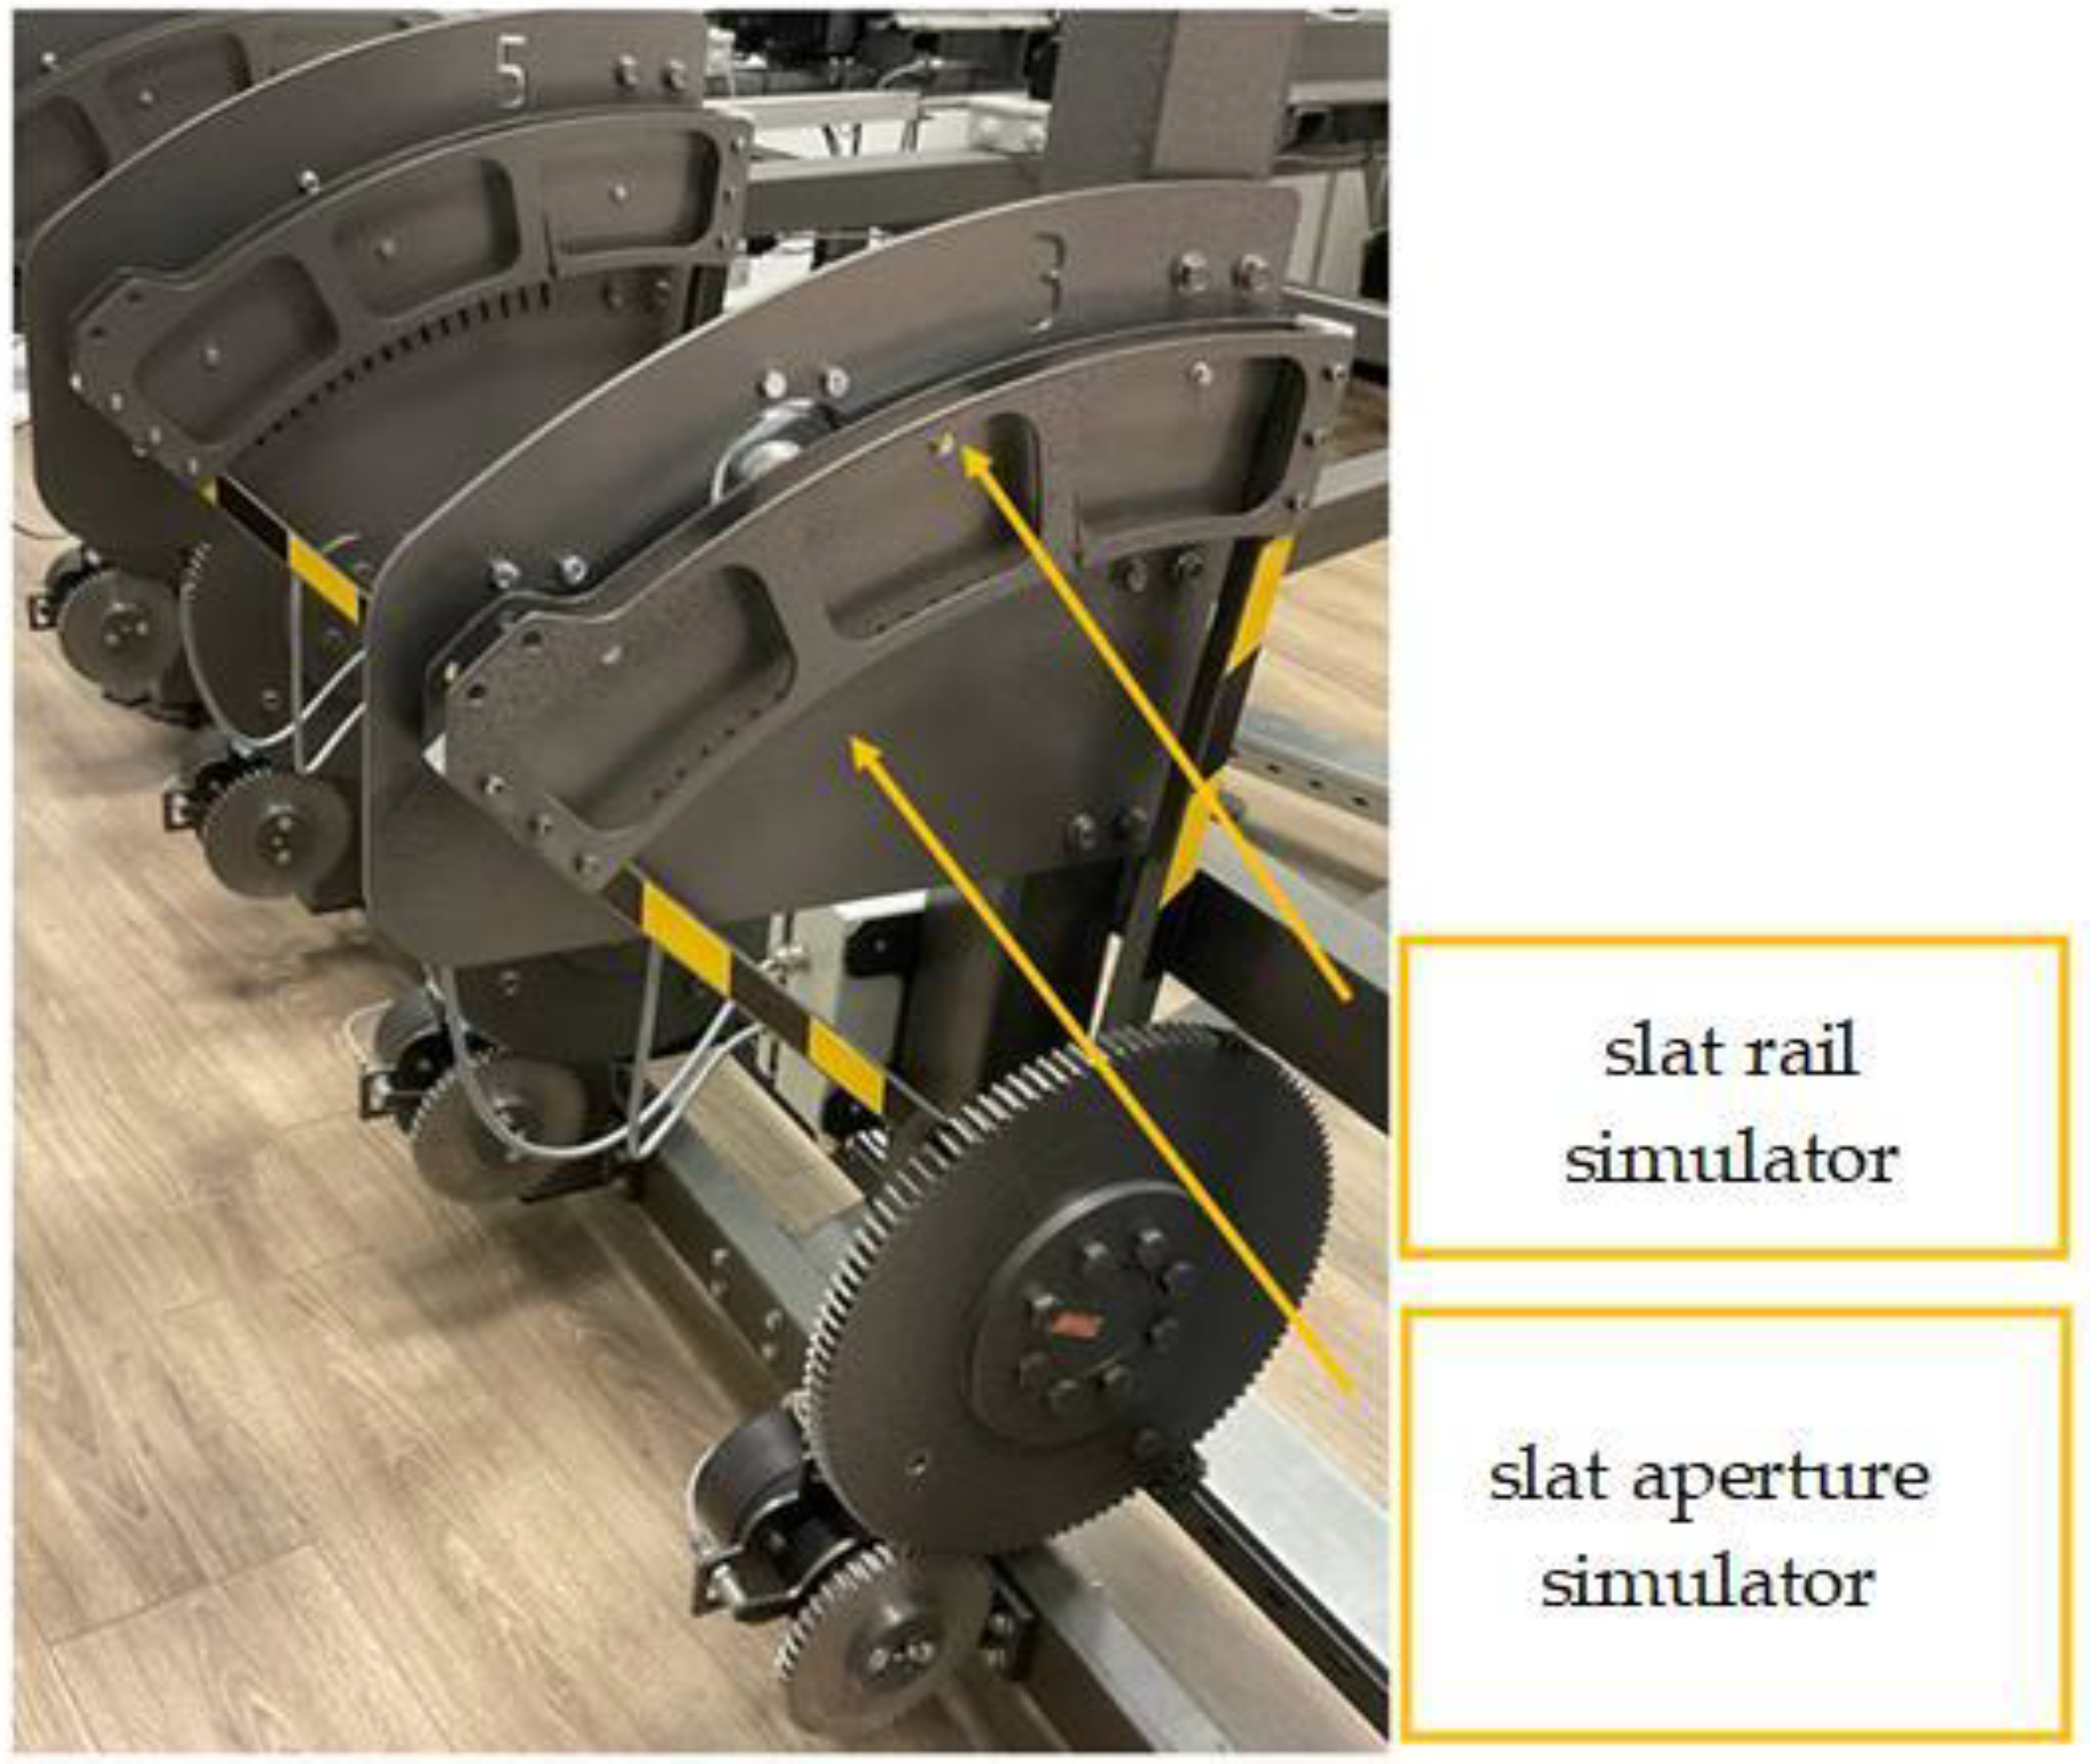
The stand was an automated complex for full-scale simulation of the operation of the SCS. The stand was based on a metal frame that replicated the shape of an aircraft wing part, on which eight simulators were fixed (4 flap simulators—
Figure 9 and
Figure 10, and 4 slats simulators—
Figure 11 and
Figure 12). In the slider simulator, the slat was attached to the rail simulator, and IPS was attached to the aperture simulator. The bar moved relative to the fixed sensors during the slat extending/retracting process. In the flap simulator, the bar was installed on the rail simulator, and the sensors were on the carriage simulator. During flap extending/retracting, the sensors moved along the fixed bar. In the event of a skew, the slat rail or flap carriage, fixed on one of the edges of the mechanization section, stopped while the mechanization section fixed on the other edge continued to move.
Each pair of simulators formed a complete mechanization section. The simulator consisted of a frame, a stepper motor, a coupling, and a ball screw (BS). A bracket for IPS sensors was installed on the ball screw, and a bracket for the measuring bar was fixed parallel to the screw. They provided places for fastening the components of the SCS to allow for testing of all sections of the aircraft’s wing mechanization, including those not presented on the stand. The stand was controlled using a programmable logic controller (PLC) and stepper motor drivers, which provided control of the movement of simulator carriages and registration of parameters issued by the stand.
The principle operation of the stand consisted of the controlled movement of each carriage of the mechanization section along the bar with marks. Throughout the entire period of movement, the readings of the IPS sensors were monitored, which helped determine the movement of the carriage relative to the starting point. By comparing the data obtained by the registration system of the stand with measurements taken using verified instruments, it was possible to assess the quality of the components of the SCS.
A feature of this stand was a flexible control system that allowed one to control the work of the stand not only from the operator panel but also using a mathematical model. The model allowed one to simulate the movement of the carriages, considering the algorithms of a real aircraft. Due to this, it was possible to check not only the components of the SCS but also the system’s algorithm, without using a real aircraft unit, and simulate failure conditions.
Since this system was supposed to verify the mathematical model using the stand, it was necessary to design test equipment that considered the possibility of installing real components of the SCS, as well as simulating transient processes as close as possible to the real system installed on the aircraft. Considering these requirements, a control system was chosen that allowed for controlled movement of the carriages with high accuracy. To register the parameters produced by the stand, certified control and measuring equipment was used, both electronic, which allowed entering of the measured parameters into the mathematical model, and analog, which controlled the operation of the stand by hand. Analog measuring instruments made it possible to confirm the readings of the electronic ones, thereby solving the issue of the correctness of the input data for the model.
7. Test Operation
The algorithm of work on the switching counter was chosen to test the operation of the complex mathematical and HIL models.
To verify the developed mathematical model, several tests were carried out that made it possible to verify the correct operation of the skew determination algorithm. The essence of the tests was to move the flaps and slats simulators along the measuring strips, and the data received from the IPS sensors were transferred to the model. In this case, the parameters were recorded not only in the model but also using external controls, such as an oscilloscope. External controls allowed us to confirm the correctness of data transmission and eliminate errors on the communication line. In addition to HIL modeling, a classical calculation of the expected IPS readings was made to analyze the quality of the created complex.
Thus, testing is reduced to solving three problems:
Testing using HIL simulation;
Tests with prototypes of IPS;
Mathematical calculation of expected readings.
The described tasks allowed us to check the operation of the algorithms, verify the correctness of the developed mathematical model, and compare the obtained readings to reference calculations. In this case, a real bar with marks was chosen as a reference sample for calculations and was installed on the bench of the HIL.
8. Test Results
In the course of the tests, the IPS switching schedule was obtained from the mathematical model of the SCS developed in the Matlab environment and the switching schedule of the IPS prototype. To analyze the quality of the created complex, in addition to HIL modeling, a classical calculation of the expected IPS readings was made.
For the convenience of analysis, the data obtained are summarized in one graph, with the results of the classical calculation superimposed. The switching schedule is shown in
Figure 13.
Based on the test results, the discrepancy between the data obtained using the computer simulation and the data from the real test bench is insignificant. A small discrepancy between the graphs is due to the presence of hysteresis in a real sensor, which depends on the frontal distance between the IPS sensing element and the mark on the bar.
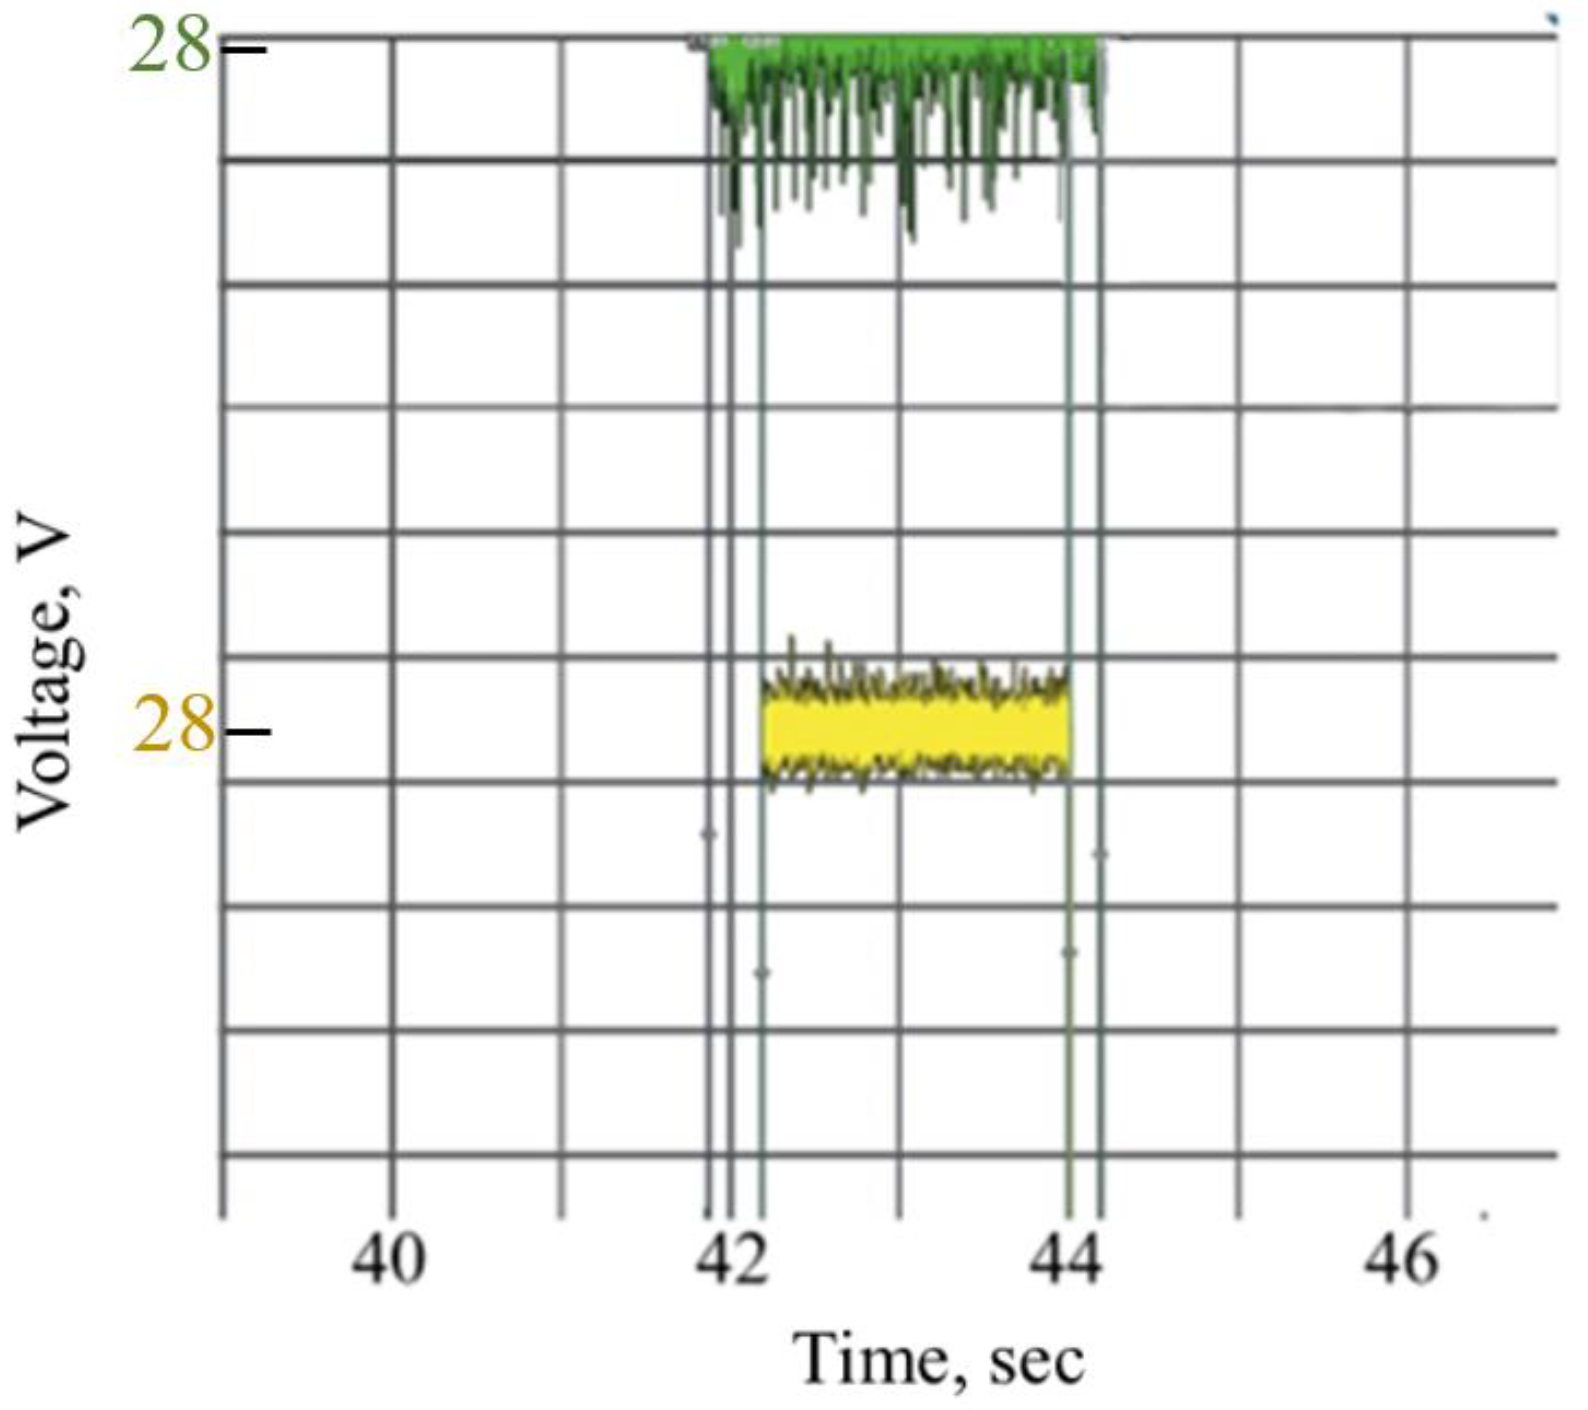
Figure 14 shows the data obtained from the oscilloscope during the passage opposite the signal mark of two IPSs installed at different frontal distances (2.5 mm and 3.5 mm). For clarity, the graphs have been spaced along the voltage axis. The green graph takes on a high level earlier since the sensing element is located closer to the mark. In this system, all sensors were set at a frontal distance of 3 mm with a tolerance of +/− 0.1 mm. In addition, the actual output characteristics of the IPS sensors may vary slightly within the same batch. It was decided not to consider the obtained hysteresis of the sensors in the model. Since its value is small and can vary from sensor to sensor, the developed algorithms exclude the influence of the switching delay on system performance.
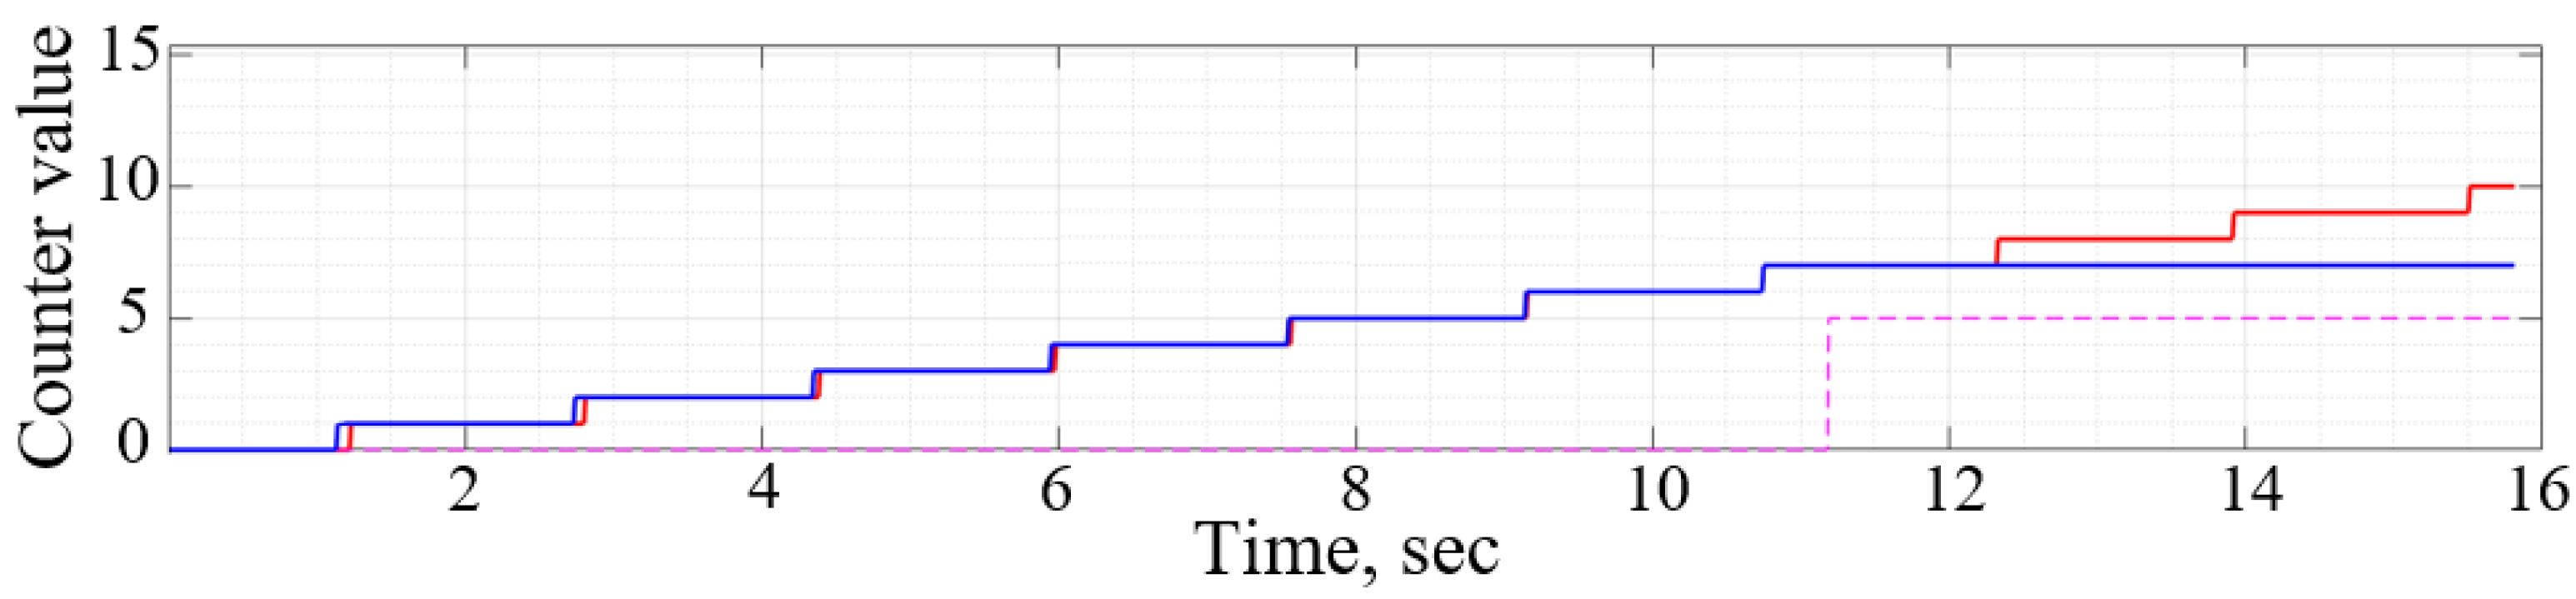
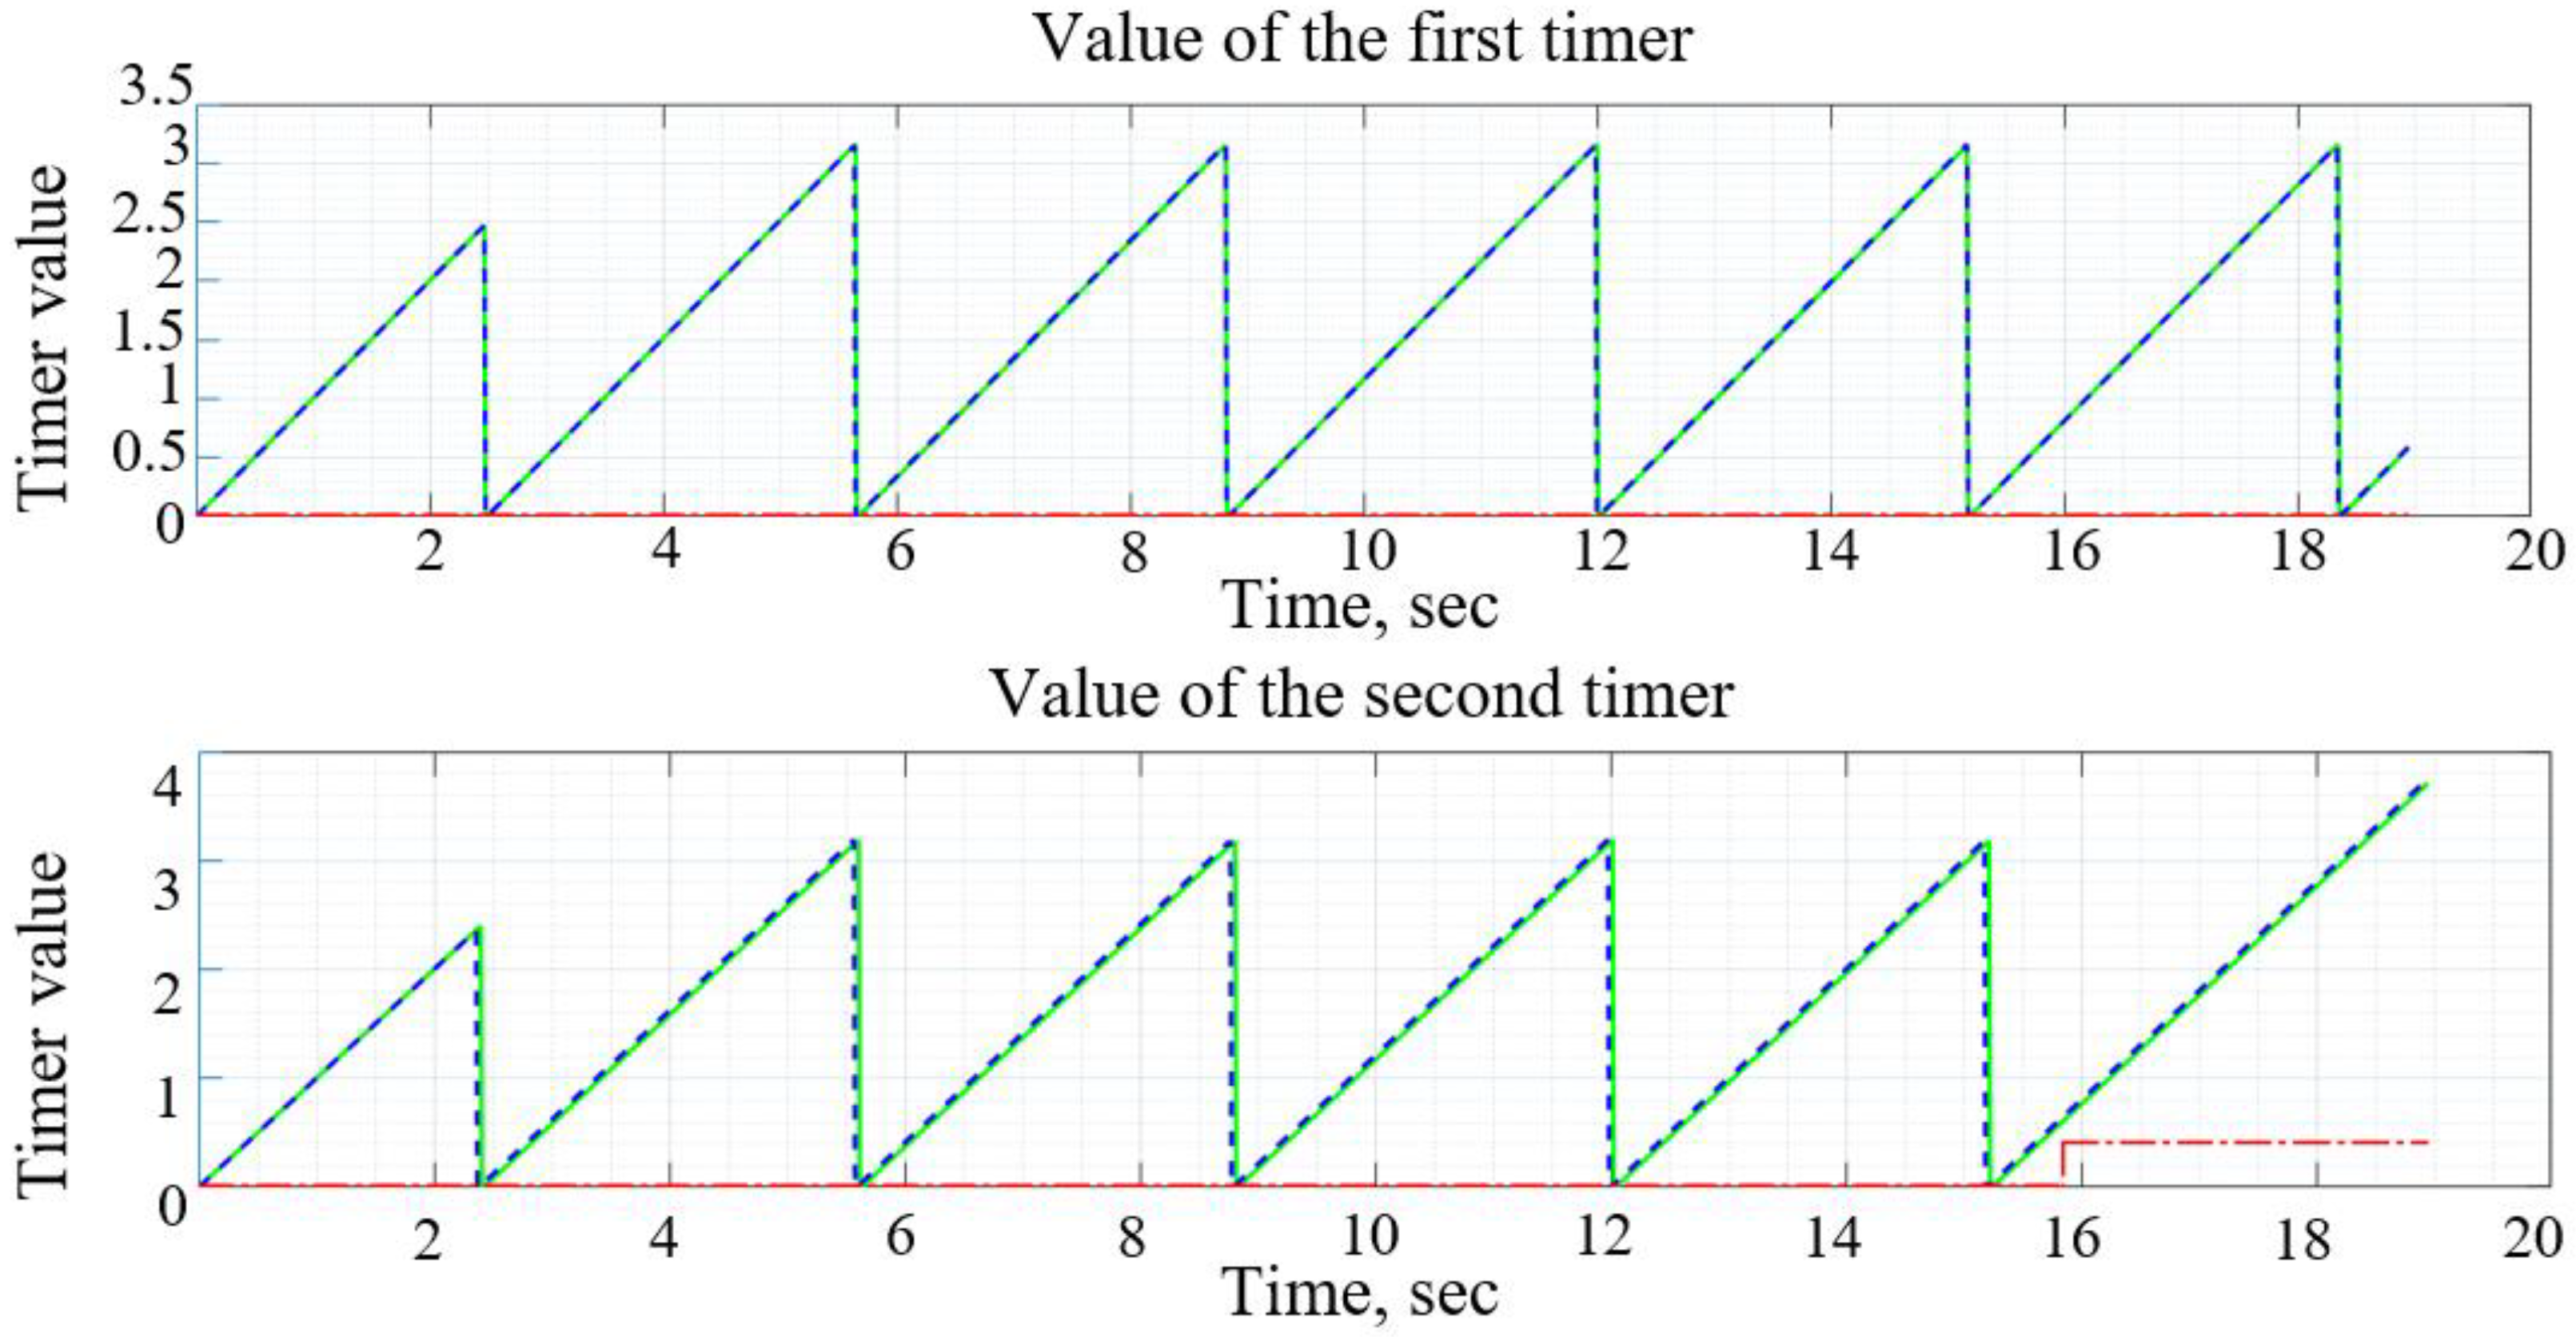
The results of the algorithms for determining the skew with a counter and by time are shown in
Figure 15 and
Figure 16, respectively. The readings of the IPS moving opposite the first measuring bar were taken from the stand. The second measuring bar and the readings of the sensors installed opposite it are modeled using a mathematical model. The occurrence of skew is also modeled using a mathematical model.
It can be seen from the graphs in
Figure 15 that the result of the operation of the algorithm for determining the skew by the counter was that the time from the moment the skew occurs to its detection (stopping the simulation) was 4.62 s. During this time, a skew of 1.21 degrees occurred. The misalignment that occurred when using this algorithm was less than 3°. Therefore, its use in the operation of the SCS allows for the timely prevention of the resulting misalignment of mechanization, thereby reducing abnormal loads on aircraft systems and preventing the occurrence of dangerous situations.
The time of the first reset of the timer is determined by the initial position of the sensor, if IPS at the initial moment is not before the beginning of the ledge, the first reset of the timer will come earlier than the subsequent ones.
The graphs of
Figure 16 show that a result of the algorithm for determining the time warp was that the time from the moment the warp occurred to its detection (stopping the simulation) was 3.39 s. During this time, a warp of 0.9 degrees occurred. This algorithm can detect emerging skews earlier than the counter algorithm, so it is preferred.
Thus, we can assume that the developed mathematical model is reliable and suitable for use to test the algorithms of wing mechanization. Accordingly, we can conclude that the mathematical model is sufficiently accurate for further operation.
9. Conclusions
As a result of the work performed, a complex of mathematical and semi-natural modeling was developed, which included the SCS simulation scheme with skew detection algorithms embedded in it and the SCS semi-natural simulation bench. In contrast to the standard methods of modeling Hardware-in-the-Loop, this article used a mathematical model that can be used both as part of a HIL simulation bench and as an independent element in the development and testing of SCS. Thus, the created complex combines the classical methods of mathematical and semi-natural modeling, integrating their advantages.
The tests during the study confirmed the high convergence of the mathematical model and the real test bench. As a result of testing the algorithms of the skew control system, the high speed and accuracy of determining the skew by each of the considered algorithms were confirmed, allowing for skew detection before reaching 3 degrees. Such early detection of warp allows for the prevention of accidents, improved conditions for take-off and landing of the aircraft, and prevention of damage to the mechanization of the wing. During the tests, it was found that the algorithm for determining the skew by the timer made it possible to detect skew at an earlier stage than the algorithm with a counter.
Due to the high degree of automation, the developed complex makes it possible to carry out live tests of the SCS components, test the operation algorithms of the SCS to identify shortcomings and determine the most optimal, simulate the behavior of the SCS in the event of various failures, and check the functionality of the system. In the future, by changing the initial data for the mathematical model, one can adapt it for use in the development of other aircraft.
Also, the SCS stand can be used for educational purposes or for a visual demonstration of the work of mechanization of the wing and SCS.


