Article

Compression and Deformation Behaviors of Hierarchical Circular-Cell Lattice Structure with Enhanced Mechanical Properties and Energy Absorption Capacity

1
School of Mechano-Electronic Engineering, Xidian University, Xi’an 710071, China
2
CityU-Xidian Joint Laboratory of Micro/Nano Manufacturing, Shenzhen 518057, China
3
Department of Mechanical Engineering, City University of Hong Kong, Kowloon, Hong Kong SAR 999077, China
*
Authors to whom correspondence should be addressed.
Aerospace 2022, 9(12), 786; https://doi.org/10.3390/aerospace9120786
Submission received: 1 November 2022 / Revised: 26 November 2022 / Accepted: 29 November 2022 / Published: 2 December 2022

Abstract

:
The design of lightweight lattice structures with excellent specific mechanical properties has received great attention in recent years. In this paper, inspired by the hierarchical structure of biological materials, a novel hierarchical circular-cell configuration of a lattice structure was proposed. The advantage of the new lattice configuration is that the use of a smooth circular cell is able to alleviate the stress concentration induced by the intersection of straight struts. Additionally, the consideration of structural hierarchy can bring improved mechanical properties of lattice structures. The hierarchical circular lattice structures with 5 × 5 × 5 unit cells were fabricated through a digital light processing (DLP) 3D printer, using the hard-tough resin. The mechanical properties of the lattice structures were investigated by a compression experiment and a numerical simulation. Results show that the interaction effect of structural hierarchy was the potential mechanism for the enhancement of mechanical properties. The designed hierarchical circular-cell lattice structure exhibits improved stress distribution uniformity, enhanced mechanical performance, and energy absorption capacity. The maximum improvement values are ~342.4% for specific stiffness, ~13% for specific strength, ~126.6% for specific energy absorption (SEA), and ~18% for crash load efficiency (CLE). The developed hierarchical circular-cell lattice configuration will enrich the present lattice systems and be useful for future multifunctional applications.

1. Introduction

Lattice structures have attracted tremendous interest in many industrial application fields because of their excellent mechanical properties, e.g., ultralight, high impact resistance, and exceptional energy absorption capacity [1,2,3,4]. The flexible forming capability of additive manufacturing (AM) has greatly promoted the development of novel lattice structures with unique physical and mechanical performance [5,6,7,8]. For example, it is of great significance to fabricate lattice structures with ultralight and high specific mechanical strength in the aerospace industrial fields [9,10,11,12].
In the past few years, a large number of research had been conducted, and various configurations of lattice structures were designed, fabricated, and evaluated, in order to satisfy the requirements of different fields. In those previous works [5,13,14,15,16,17,18,19,20,21,22,23,24], the body-centered cubic (BCC) [13,14], face-centered cubic (FCC) [15], rhombic dodecahedron (RD) [16,17], octet [18,19], as well as their corresponding derived configurations of unit cells [5,20,21], were widely investigated. Sun et al. [17] proposed a hybrid lattice structure by combining the octet and rhombic dodecahedron cells. The effect of geometrical hybrid on energy absorption of the lattice structures was investigated. The hybrid structure displayed high stiffness and strength comparable to the octet structure and showed stable post-yielding behaviors that were similar to the rhombic dodecahedron lattice structure. Qi et al. [20] investigated the lattice structures of octet-truss and truncated-octahedron, of which both the uniform and tapered beams were considered. It was shown that node enforcement can be used to improve the modulus and reduce the mechanical anisotropy. Li et al. [22] proposed a modified configuration of the BCC lattice, of which the deformation mode and energy absorption capacity can be optimized by adjusting the body center’s relative position. White et al. [23] proposed the concept of multi-body interpenetrating lattices, of which different lattices interlaced each other without direct connection. The energy transfer can be controlled by surface interactions, resulting in the improved energy absorption of interpenetrating structures. The design of the above configurations were essentially based on the modification of traditional lattice structures and the straight struts were widely adopted [5,13,14,15,16,17,18,19,20,21,22,23,24].
It has been reported in many works [21,25,26] that the intersection of straight struts easily forms sharp joints, which usually induces high-stress concentration. The potential yielding, damage, and failure behaviors can happen at high-stress concentration joints during the deformation processes of lattice structures. Those factors will cause a significant decrease in mechanical performance [26,27]. To solve this problem, some researchers resorted to curving design strategies [25,27]. Alomar et al. [25] designed a circular lattice. The configuration of the unit cell resembled two interlocked rings along perpendicular planes. Bai et al. [27] investigated the deformation behaviors of lattice structures with curving struts, of which the representative configurations of BCC, FCC, and their combined lattices were considered. Numerical and experimental results in those works [25,27] showed that the use of a circular-based unit cell is able to remove sharp edges, bring uniformly distributed stress, and stronger mechanical strength. The cellular materials also received great attention for their ultralow density, smooth curved shell, and excellent mechanical properties [21,28,29]. Novak et al. [28] investigated the quasi-static and dynamic compression properties of four triply periodical minimal surface (TPMS) lattices: diamond, gyroid, IWP, and primitive under different relative densities. Chen et al. [21] designed a new class of shell lattice (SL) with stretching-dominated mechanical properties and a high specific energy absorption capacity at low relative density. It still has vast space to explore the novel lattice structures, e.g., mimicking the biological structures of nature materials [30,31,32], which would bring surprising physical and mechanical performance.
In recent years, learning from nature has been regarded as one of the most attractive strategies to design structural materials [1,32,33]. In particular, the structural hierarchy is often observed for many natural materials with ultralight and excellent mechanical performance, such as spongy bones [1,34,35], tendons [36,37], graded structures in wheat [38,39], and so on. Over millions of years of evolution, those nature materials possessed complex phases arranged in hierarchical architectures across different length scales [32,40]. The special hierarchical structures of those natural materials and their excellent physical and mechanical properties have provided valuable inspiration to the design of man-made architected materials [31,36,39]. Inspired by the structural hierarchy of biological materials, researchers have designed different hierarchical cellular structures, such as hierarchical sheet design for TPMS lattices [41], hierarchical honeycombs with shape integrity [42], and self-similar hierarchical octet-truss lattices [43,44,45,46]. Their mechanical properties were compared with conventional structures. The designed hierarchical cellular structures exhibit excellent geometrical and mechanical performance and show a bright prospect for multifunctional application in the future. Therefore, it is of great significance to introduce the bio-inspired structural hierarchy into the design of circular-cell lattice configurations.
In this paper, the novel hierarchical circular-cell lattice configuration was developed based on the inspiration of biological structures. The use of circular cells will avoid the sharp joints caused by the intersection of straight struts, and alleviate the stress concentration during the deformation processes of lattice structures. Additionally, the mechanical performance and energy absorption capacity can be effectively improved because of the consideration of structural hierarchy in the designed novel circular-cell lattice structure. The mechanical properties and deformation mechanisms of the lattice structures were investigated through compression experiments and numerical simulations. The present work is organized as follows. The design strategy of the circular-cell lattice structure is described in Section 2. The manufacturing of lattice samples, compression experiments, and finite element simulations are described in Section 3. The results and discussion are presented in Section 4, and the conclusion is summarized in Section 5.

2. The Novel Circular-Base Configuration of Unit Cell with Structural Hierarchy

The design strategy for the novel circular-cell hierarchical lattice structure is shown in Figure 1. In the study, the evolution of circular-cell lattice is based on the conventional BCC lattice structure. The BCC lattice structure has received great attention for its smooth compression mechanical response and excellent energy absorption capacity [13,14]. In Figure 1a, another geometrical configuration of the BCC lattice from its periodic structure is shown, in order to utilize the inner geometry space and mechanical advantages. The four apexes on each cross plane of the BCC lattice, e.g., plane ACFD or plane BCED, are further shown in Figure 1a. The design of the circular-cell lattice (CirC) configuration is realized by introducing the elliptical rod to replace the original straight one on those cross planes. So, the elliptical rod will cross the four apex points, e.g., point ACFD, to form the circular lattice structure. In Figure 1a, the major and minor radius of the ellipse is denoted as a and b , respectively. So, a = 2 L / 2 , b = L / 2 , and L is the length of the unit cell.
In Figure 1b, the bio-inspired structural hierarchy is considered. The length of the minor radius of the CirC lattice configuration is scaled downward, and then it is assembled with the original CirC lattice to form a hierarchical circular-cell lattice structure. The novel circular-cell structure is denoted as HCirC. Figure 1c shows the planar view of the designed hierarchical circular-cell lattice structure. In Figure 1, the inner and outer cells of the hierarchical circular-cell lattice structure are denoted as the slave and master cells, respectively. This definition can also be found in the work of [47]. The slave/master cells are defined to better describe the deformation and interaction between inner and outer cells. For the typical BCC lattice structure, its relative density can be expressed as:
ρ BCC ¯ = 4 3 L L 3 × π d 2 2 = 3 π d L 2
where d is the rod diameter of the lattice structure.
For the CirC lattice structure, the length of the circular rod on each cross-plane (e.g., plane ACFD in Figure 1b) is denoted as S. So, S = 2 π b + 4 a b , according to the basic definition of the ellipse equation. Therefore, the relative density of the CirC lattice structure is expressed as:
  ρ CirC ¯ = 2 π + 2 2 1 L L 3 π d 2 2 δ CirC d L                       = π π + 2 2 1 2 d L 2 δ CirC d L
In Equation (2), the second term δ CirC is used to take account of the coincident volume at the joints of the lattice cell, so that the relative density can be accurately calculated. It is obtained by curve fitting using computer-aided design models, and it is expressed as: δ CirC d L = −2.7754 d L 2 + 0.8929 d L − 0.0482.
For the HCirC with an inner hierarchical structure, the major and minor radius of the elliptical rod are defined as a M and b M for the master cell. The parameters a S and b S are defined as the major and minor radius for the slave cell (see Figure 1c). According to the geometrical relationship for the unit cell of lattice HCirC, a M = a S = 2 L / 2 , and b M = L / 2 , the ratio between b S and b M is defined as m = b S / b M . The rod diameter value of the slave and master cells is defined as d S and d M , and its diameter ratio is defined as k , with k = d S / d M .
Therefore, the relative density of the HCirC lattice structure is expressed as:
  ρ HCirC ¯ = 2 π L + 2 2 1 L L 3 π d M 2 2 + 2 π m L + 2 2 m L L 3 π d S 2 2 δ HCirC d M L , k , m = π + 2 2 1 + k 2 π m + 2 2 m 2 π d M L 2 - δ HCirC d M L , k , m
Here, in Equation (3), the second term δ HCirC is also used to take account of the coincident volume at the joints of the lattice cell. It is obtained by curve fitting using computer-aided design. It is expressed as δ HCirC d M L = 15.76 d M L 2 − 2.4038 d M L + 0.1057, where k = 1 and m = 0.5.
Figure 2 shows the effect of parameters k and m on the geometrical configuration of HCirC. In Figure 2a, the parameter k is fixed at 1.0 and m is varied from 0.0 to 1.0. In Figure 2b, the parameter m is fixed at 0.5, and k is gradually changed from 0.0 to 1.0. As can be seen from Figure 2 that the geometry configuration of HCirC will change with the variation of parameters k and m . When k = 0.0 or m = 1.0, the lattice HCirC reduces to the configuration of CirC. When m is within a properly defined range and k 0 , the lattice HCirC will exhibit an obvious hierarchical structure. So, the geometrical parameters k and m can be used to tailor the relative density and mechanical properties of the lattice structure. In the study, the influence of parameters k and m on the relative density and compression mechanical properties of the HCirC lattice structure will be discussed in Section 4.2.

3. Experiment and Simulation

3.1. Fabrication of the Lattice Samples Using the 3D Printing Technique

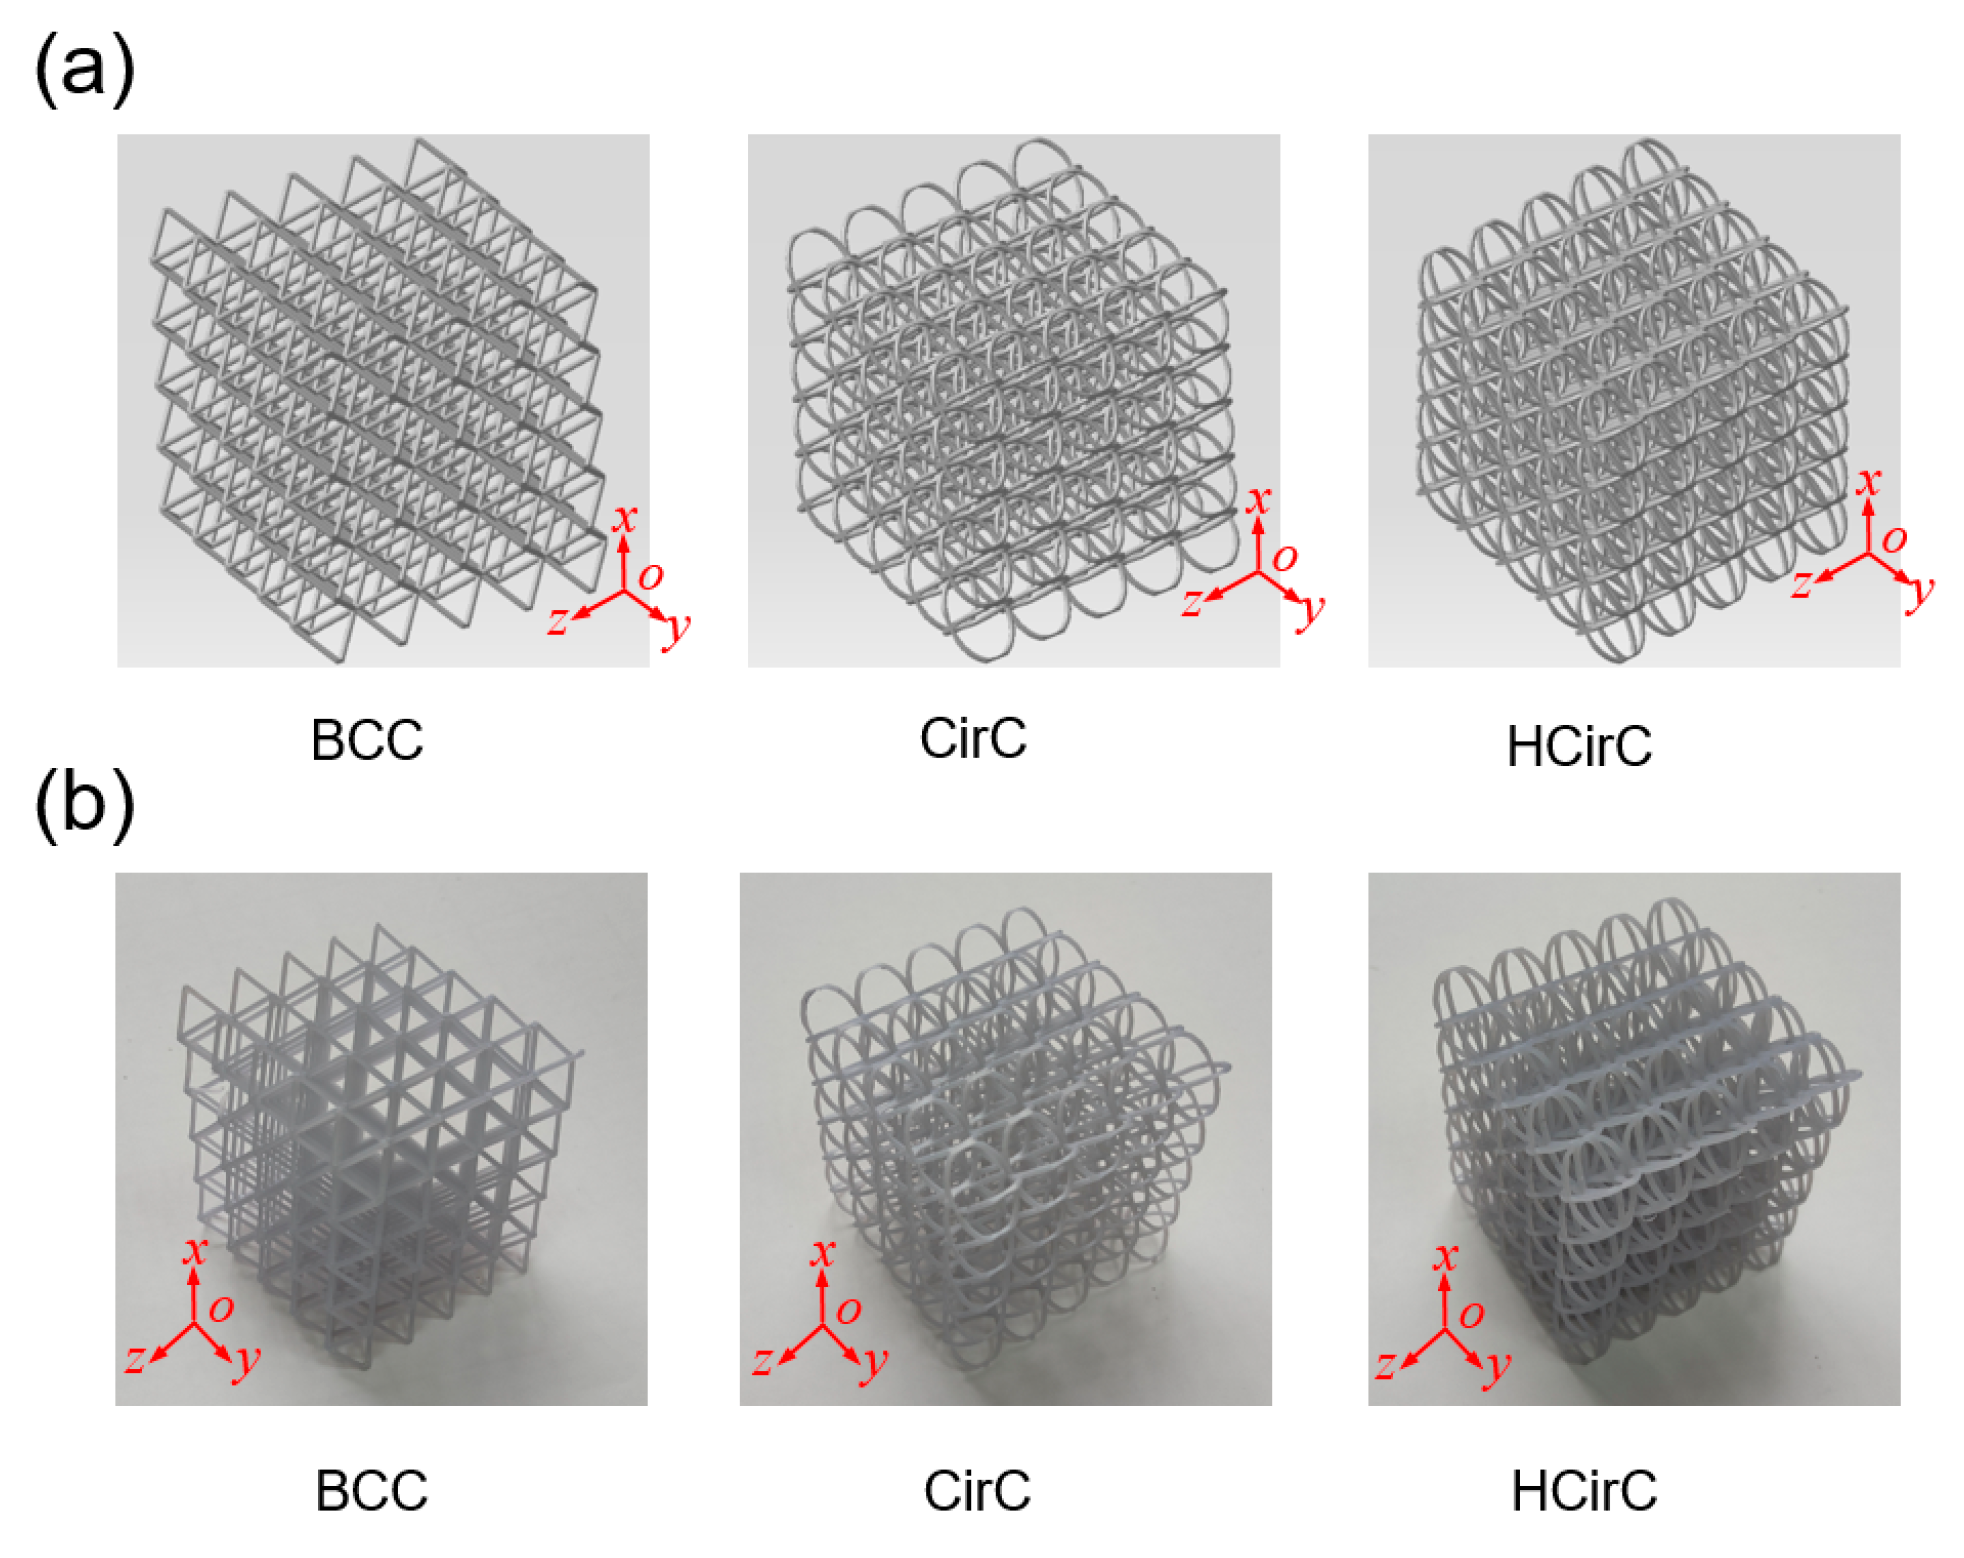
The commercial 3D printer (digital light processing, NOVA 3D Bene 4) was used to fabricate the lattice samples of the BCC, CirC, and HCirC. Figure 3a shows the designed CAD models, according to the geometry parameters defined in Table 1. Then, the geometry files of those lattice structures were sliced and inputted into the printer using the stereolithography (STL) format. In order to avoid the inconsistencies of the printed samples, a number of pre-printing experiments were performed to obtain the optimized printing parameters. The maximum printing speed of the printer was 55 mm/h, with a layer resolution within 0.025–0.01 mm. The bottom and normal exposure times were 15 s and 1.8 s, respectively. The printing layer thickness was 0.05 mm. When the printing task was finished, each sample was carefully washed by using isopropyl alcohol. Then, the samples would undergo the curing processes by using UV light, and the heating temperature was 60 °C. Figure 3a shows the CAD models of the designed lattice structures of the BCC, CirC, and HcirC. Figure 3b shows the fabricated lattice samples by using the DLP printing technique.
In the study, four groups of lattice samples with diameter values ranging from 0.60 mm to 0.75 mm were fabricated by using the 3D printing technique. Table 1 listed the geometry parameters of these four groups of samples. All those printed samples possess uniform dimensions of the cell, as L = 7.5 mm, and also 5 × 5 × 5 unit cells in each printing direction (e.g., the three orthogonal directions of the geometry coordinate). Here, the right-hand principle is considered the geometry coordinate. In the experiment, for the HCirC structure with inner hierarchy, the same rod diameter value was considered for both the slave and master cells (the value of k is 1.00), and the value of m is fixed at 0.50. The effect of parameters k and m on the mechanical performance of the HCirC lattice structure will be discussed in Section 4.2. The relative density obtained by Equations (2) and (3) are compared with the experiment-measured results, as shown in Table 1. The theoretical values are close to the experiment.
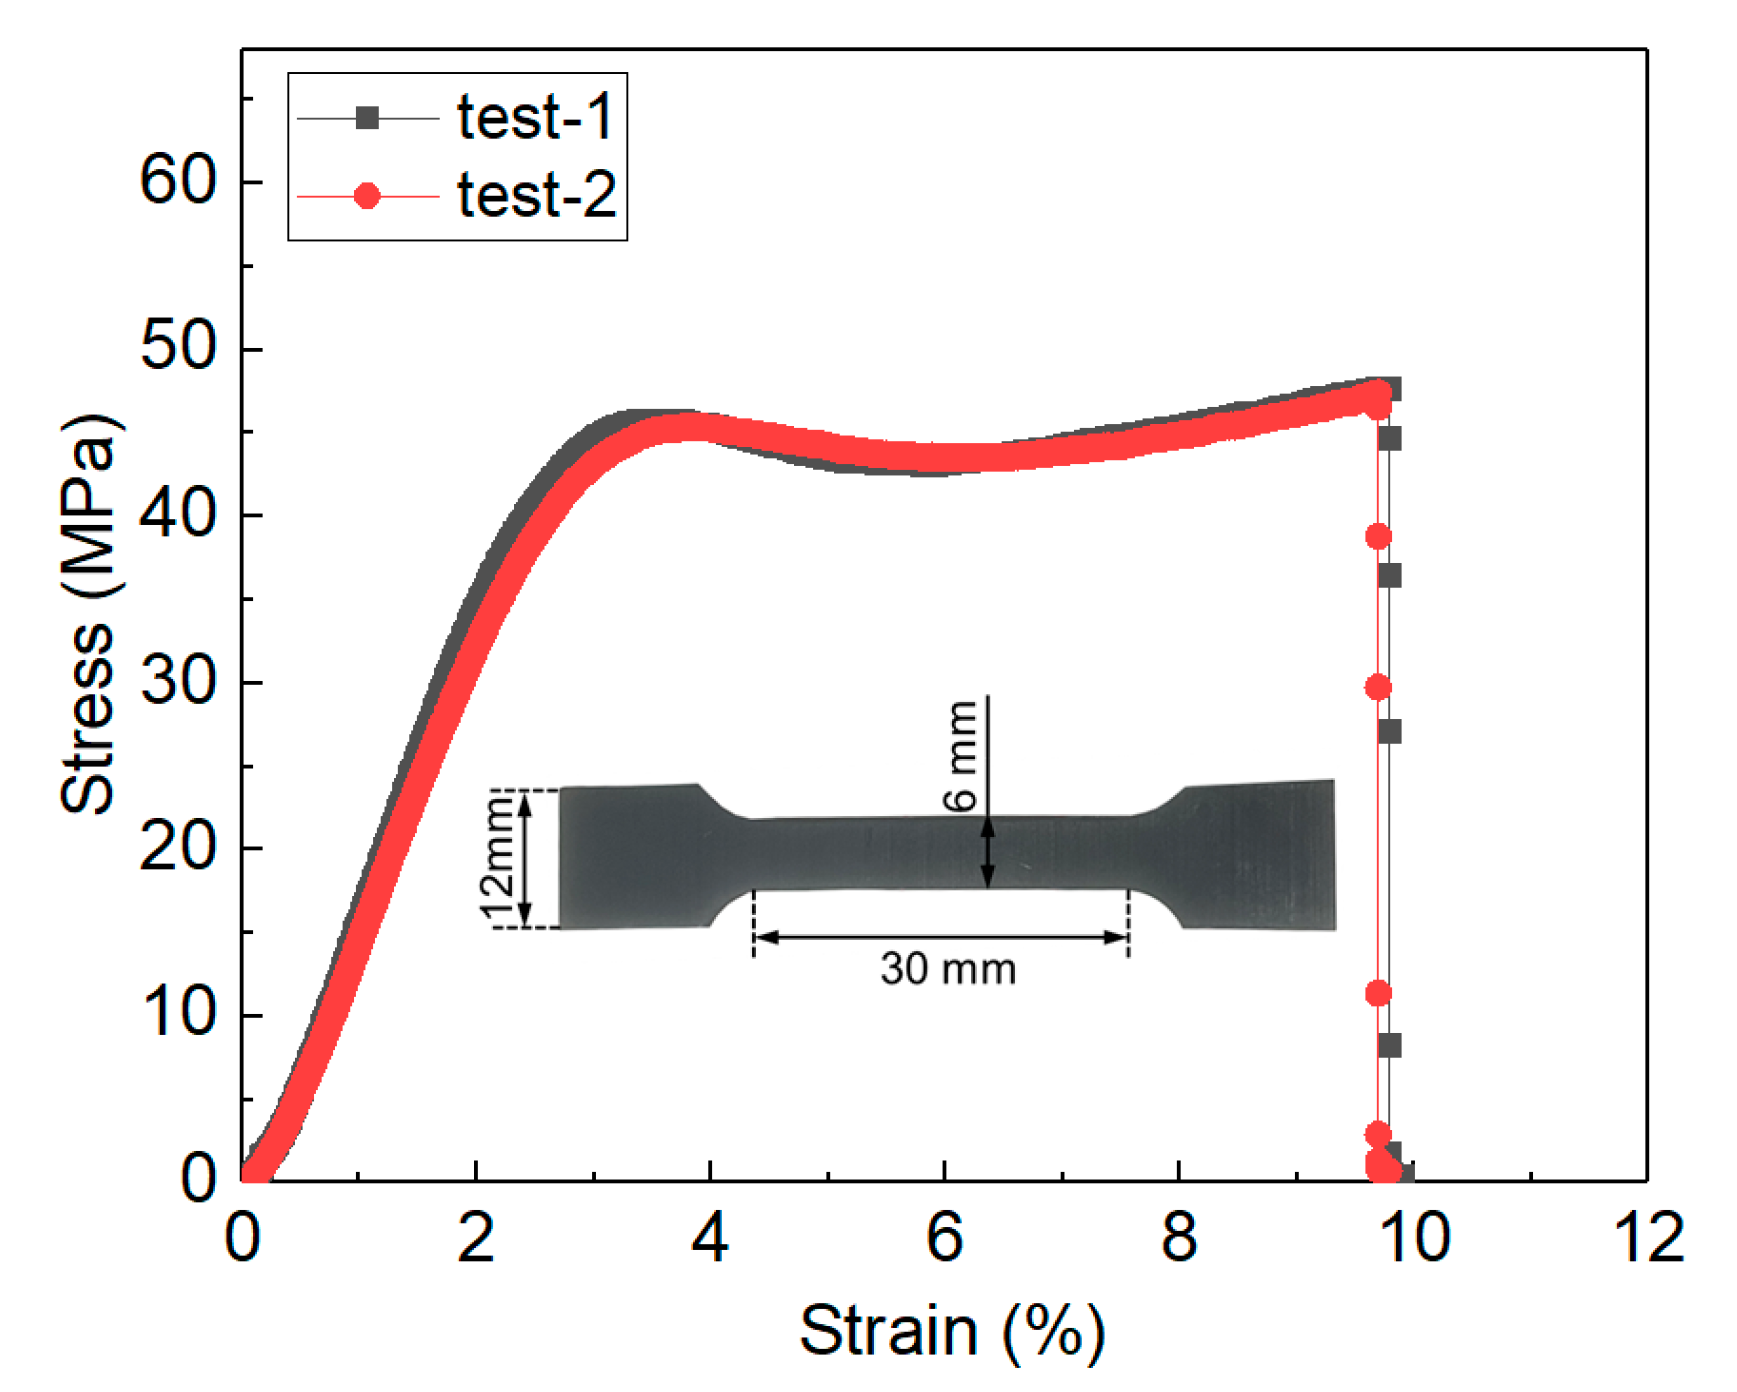
The hard-tough resin material (provided by Esun company, Shenzhen, China) was used in the 3D printing of lattice samples. This material belongs to the urethane acrylate photo-curable resin, which is very suitable for DLP printers. Its mechanical performance is comparable to the ABS filament, e.g., high toughness and impact strength. The measured density of the 3D-printed resin material is 1.232 g/cm3. The mechanical properties of the resin material were obtained by using the tensile experiment, and the results are 1649.7 MPa for elastic modulus and 45.4 MPa for yield strength (0.2% offset). Figure 4 shows the stress–strain curves of matrix material and the dimension of the tensile specimen.

3.2. Compression Experiment

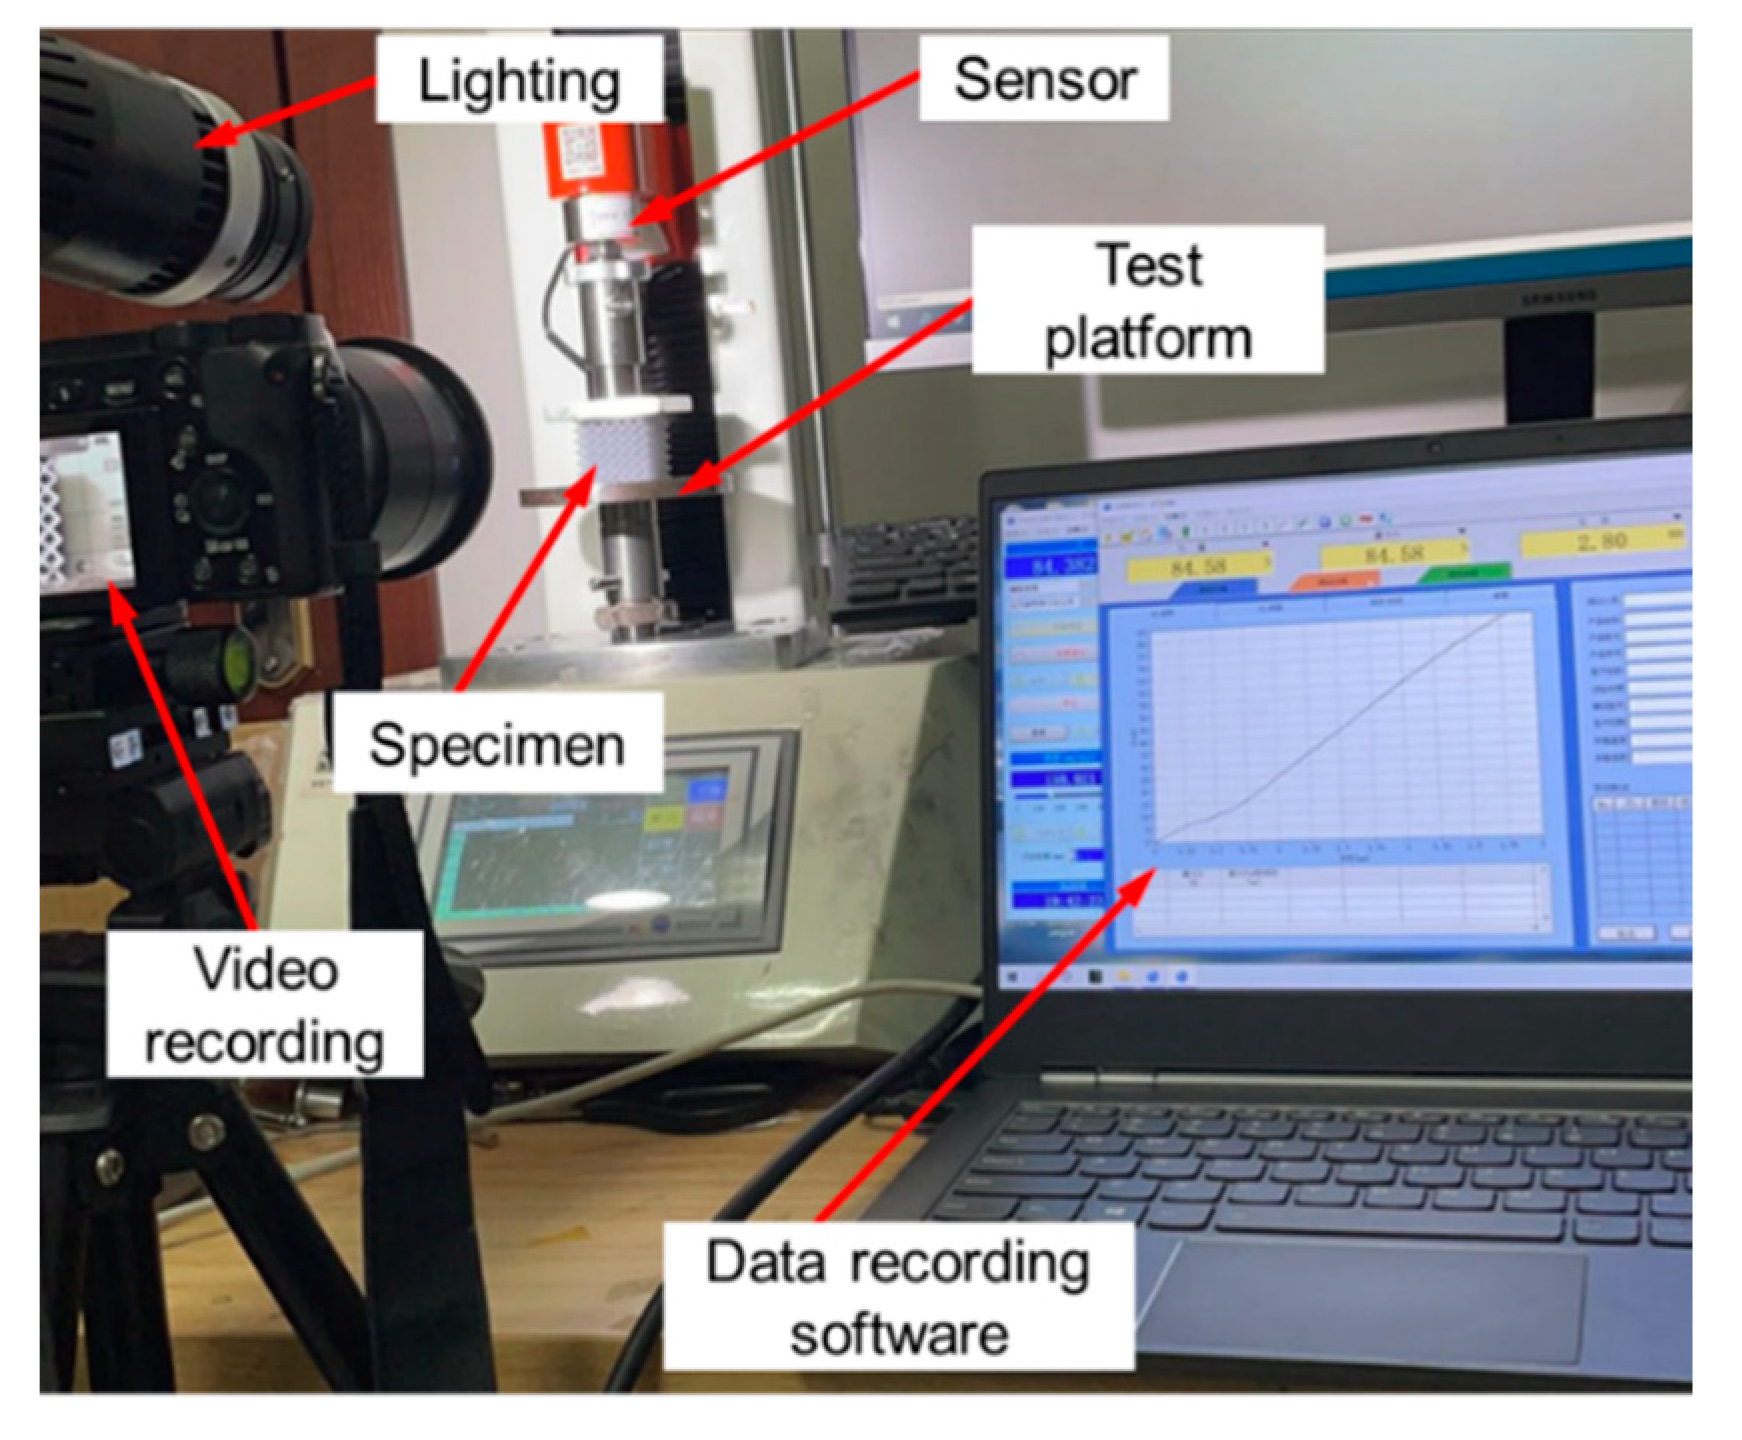
The compression experiment of the lattice samples was performed by using the in-situ electro-mechanical testing platform at room temperature, as shown in Figure 5. The bottom plate was fixed. The upper plate was used to compress the lattice samples until densification. The constant loading rate of 4 mm/min was used. Before the experiment, the surface of two plates was lubricated, in order to reduce friction and avoid lateral deformation.
In the experiment, a high-resolution video camera was used to record the deformation and collapse behaviors of the lattice samples during axial compression processes. The geometry of the BCC lattice is symmetric along the x, y and z coordinates. So, only one compression direction is needed to quantify the performance of the BCC lattice. It is noted that the manufacturing process (e.g., the 3D printing) of the lattice structure may induce slight anisotropy of the base material, such as the molding direction of the 3D printer, and the curing processes by using UV light. In the present study, the main attention was focused on the influence of geometry design on the mechanical anisotropy of the designed lattice structure. The BCC lattice is used as a reference to compare the mechanical properties of the CirC and HCirC lattice structures. So, the mechanical properties of the BCC lattice are assumed as isotropic along three orthogonal directions. In the experiment, the compression direction for the BCC lattice samples is along the x -axis, as the geometrical coordinate defined in Figure 3. The compression properties of the circular-cell lattice structures CirC and HCirC are anisotropic. According to the geometrical models in Figure 3, two different compression directions are needed for quantifying the mechanical properties of the CirC and HcirC lattice samples. In the experiment, two compression directions along the x and z axes were considered for the CirC and HCirC lattice samples.

3.3. Finite Element Models

The finite element (FE) method was widely adopted as an efficient protocol to capture the deformation behaviors of lattice structures [48,49,50]. In the study, compression behaviors of lattice structures were simulated by using the Abaqus/Explicit commercial codes [51]. The established FE model and geometrical coordinates are shown in Figure 6. Here, only the simulation model of the HcirC lattice structure along the z -axis compression direction is shown. The same boundary constraints were also applied to the BCC and CirC lattice samples. In the FE model, the compression direction can be changed by adjusting the lattice sample along the y -axis. The upper plate was vertically moved to compress the lattice sample until the lattice sample was densified. The lower plate of the model was fixed. The R3D4 element type was used for the rigid plate. The lattice sample was modeled by using the C3D4 element type. The convergence of the FE model was checked by varying the element size from 0.2 mm to 0.8 mm, and the global size of 0.2 mm was adopted to obtain more accurate simulation results, e.g., stress distribution. The actual density value of 1.232 g/cm3, as well as the elastic–plastic constitutive behavior of the matrix material, were used in the FE simulation. The general contact was considered in the modeling process with a friction coefficient of 0.3. The FE simulation is mainly used to reveal the deformation and interaction effects of the designed lattice structures. So, the friction coefficient is a minor factor in the simulation model [14,25]. The geometry parameters used in the FE simulation were the same as the CAD models in the 3D printing processes.
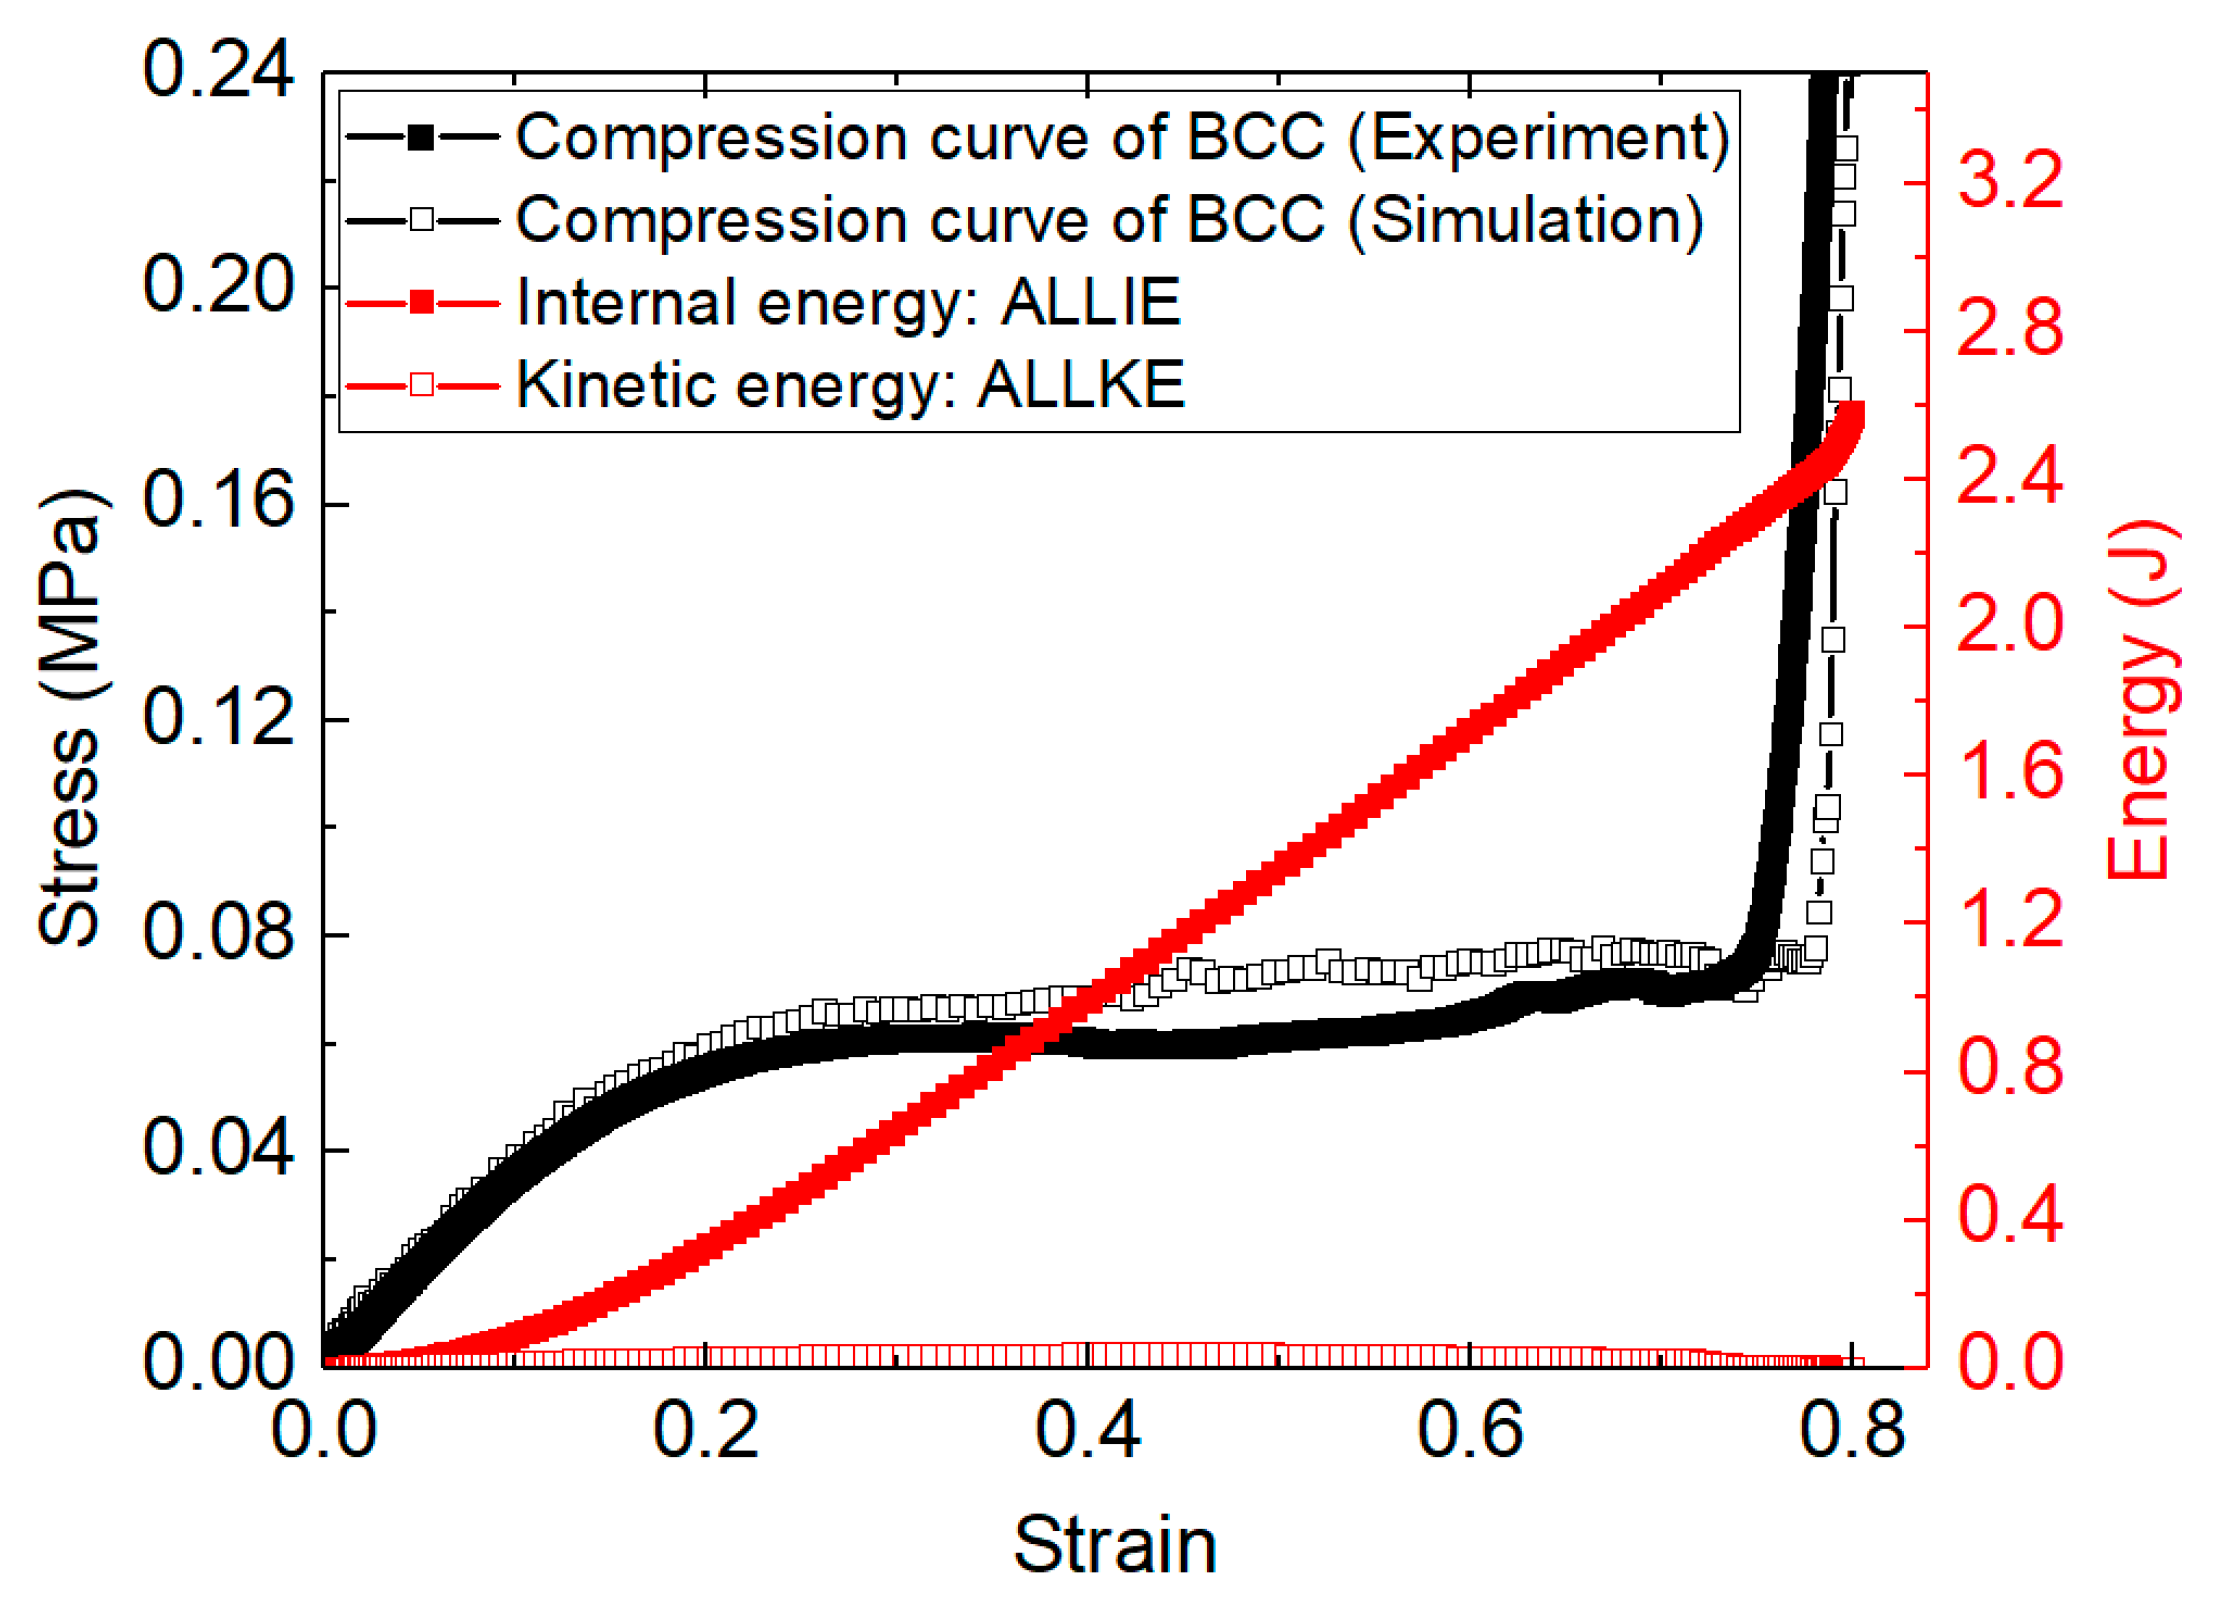
The stress–strain curves obtained from the FE simulation was compared with the experiment, as shown in Figure 7. Additionally, the kinetic energy (ALLKE) and internal energy (ALLIE) curves obtained from the FE simulation are also plotted together. In Figure 7, the experiment and simulation curves exhibit nearly the same evolution trend, with a very small discrepancy. This discrepancy may ascribe to the neglect of damage and failure behaviors of the resin material in the modeling process [14,48]. The kinetic energy is far less than the internal energy, which indicates the simulation can be regarded as a qua-static process [14,51]. So, the established simulation model is effective. The simulation model will be used to describe the compression and collapse behaviors of the BCC, CirC, and HCirC lattice structures.

4. Results and Discussion

4.1. Compression Behaviors and Mechanical Properties

The stress–strain curves of the BCC, CirC, and HcirC lattice structures obtained from the axial compression experiment are compared, as shown in Figure 8a for compression along the x -axis, and in Figure 8b for compression along the z -axis. In the experiment, two independent compression tests are performed for each lattice type, and the compression curves are plotted together. Here, the same rod diameter value, d = 0.65 mm was considered for the BCC, CirC, and HCirC lattice structures, with k = 1 and m = 0.5. In Figure 8, it is shown that the repeatability of the compression experiment is acceptable. The relative density values of BCC, CirC, and HCirC are also shown in Figure 8. It shows that HCirC exhibits the highest relative density and that the relative density of the CirC is larger than the BCC. In the study, the compression curves will be used to reflect the specific stiffness and strength of the lattice structures. Additionally, it is also used to quantify the energy absorption capacity, e.g., the enclosed area under the compression curve.
In Figure 8, the stress–strain curves of BCC, CirC, and HCirC show obviously three stages (they are denoted as I, II, and III in Figure 8), as the initial elastic loading, yield, and plastic plateau, as well as the densification stage. In the first stage, the compression stress will increase linearly with the increase in strain. Then, the compression stress deviates from its initial elastic stage and the yielding behavior occurs. In the second stage, relatively large compression deformation, progressive collapse, and failure behaviors can be observed. In the third stage, the rods of the lattice structure will contact each other, resulting a rapid increase in compression stress.
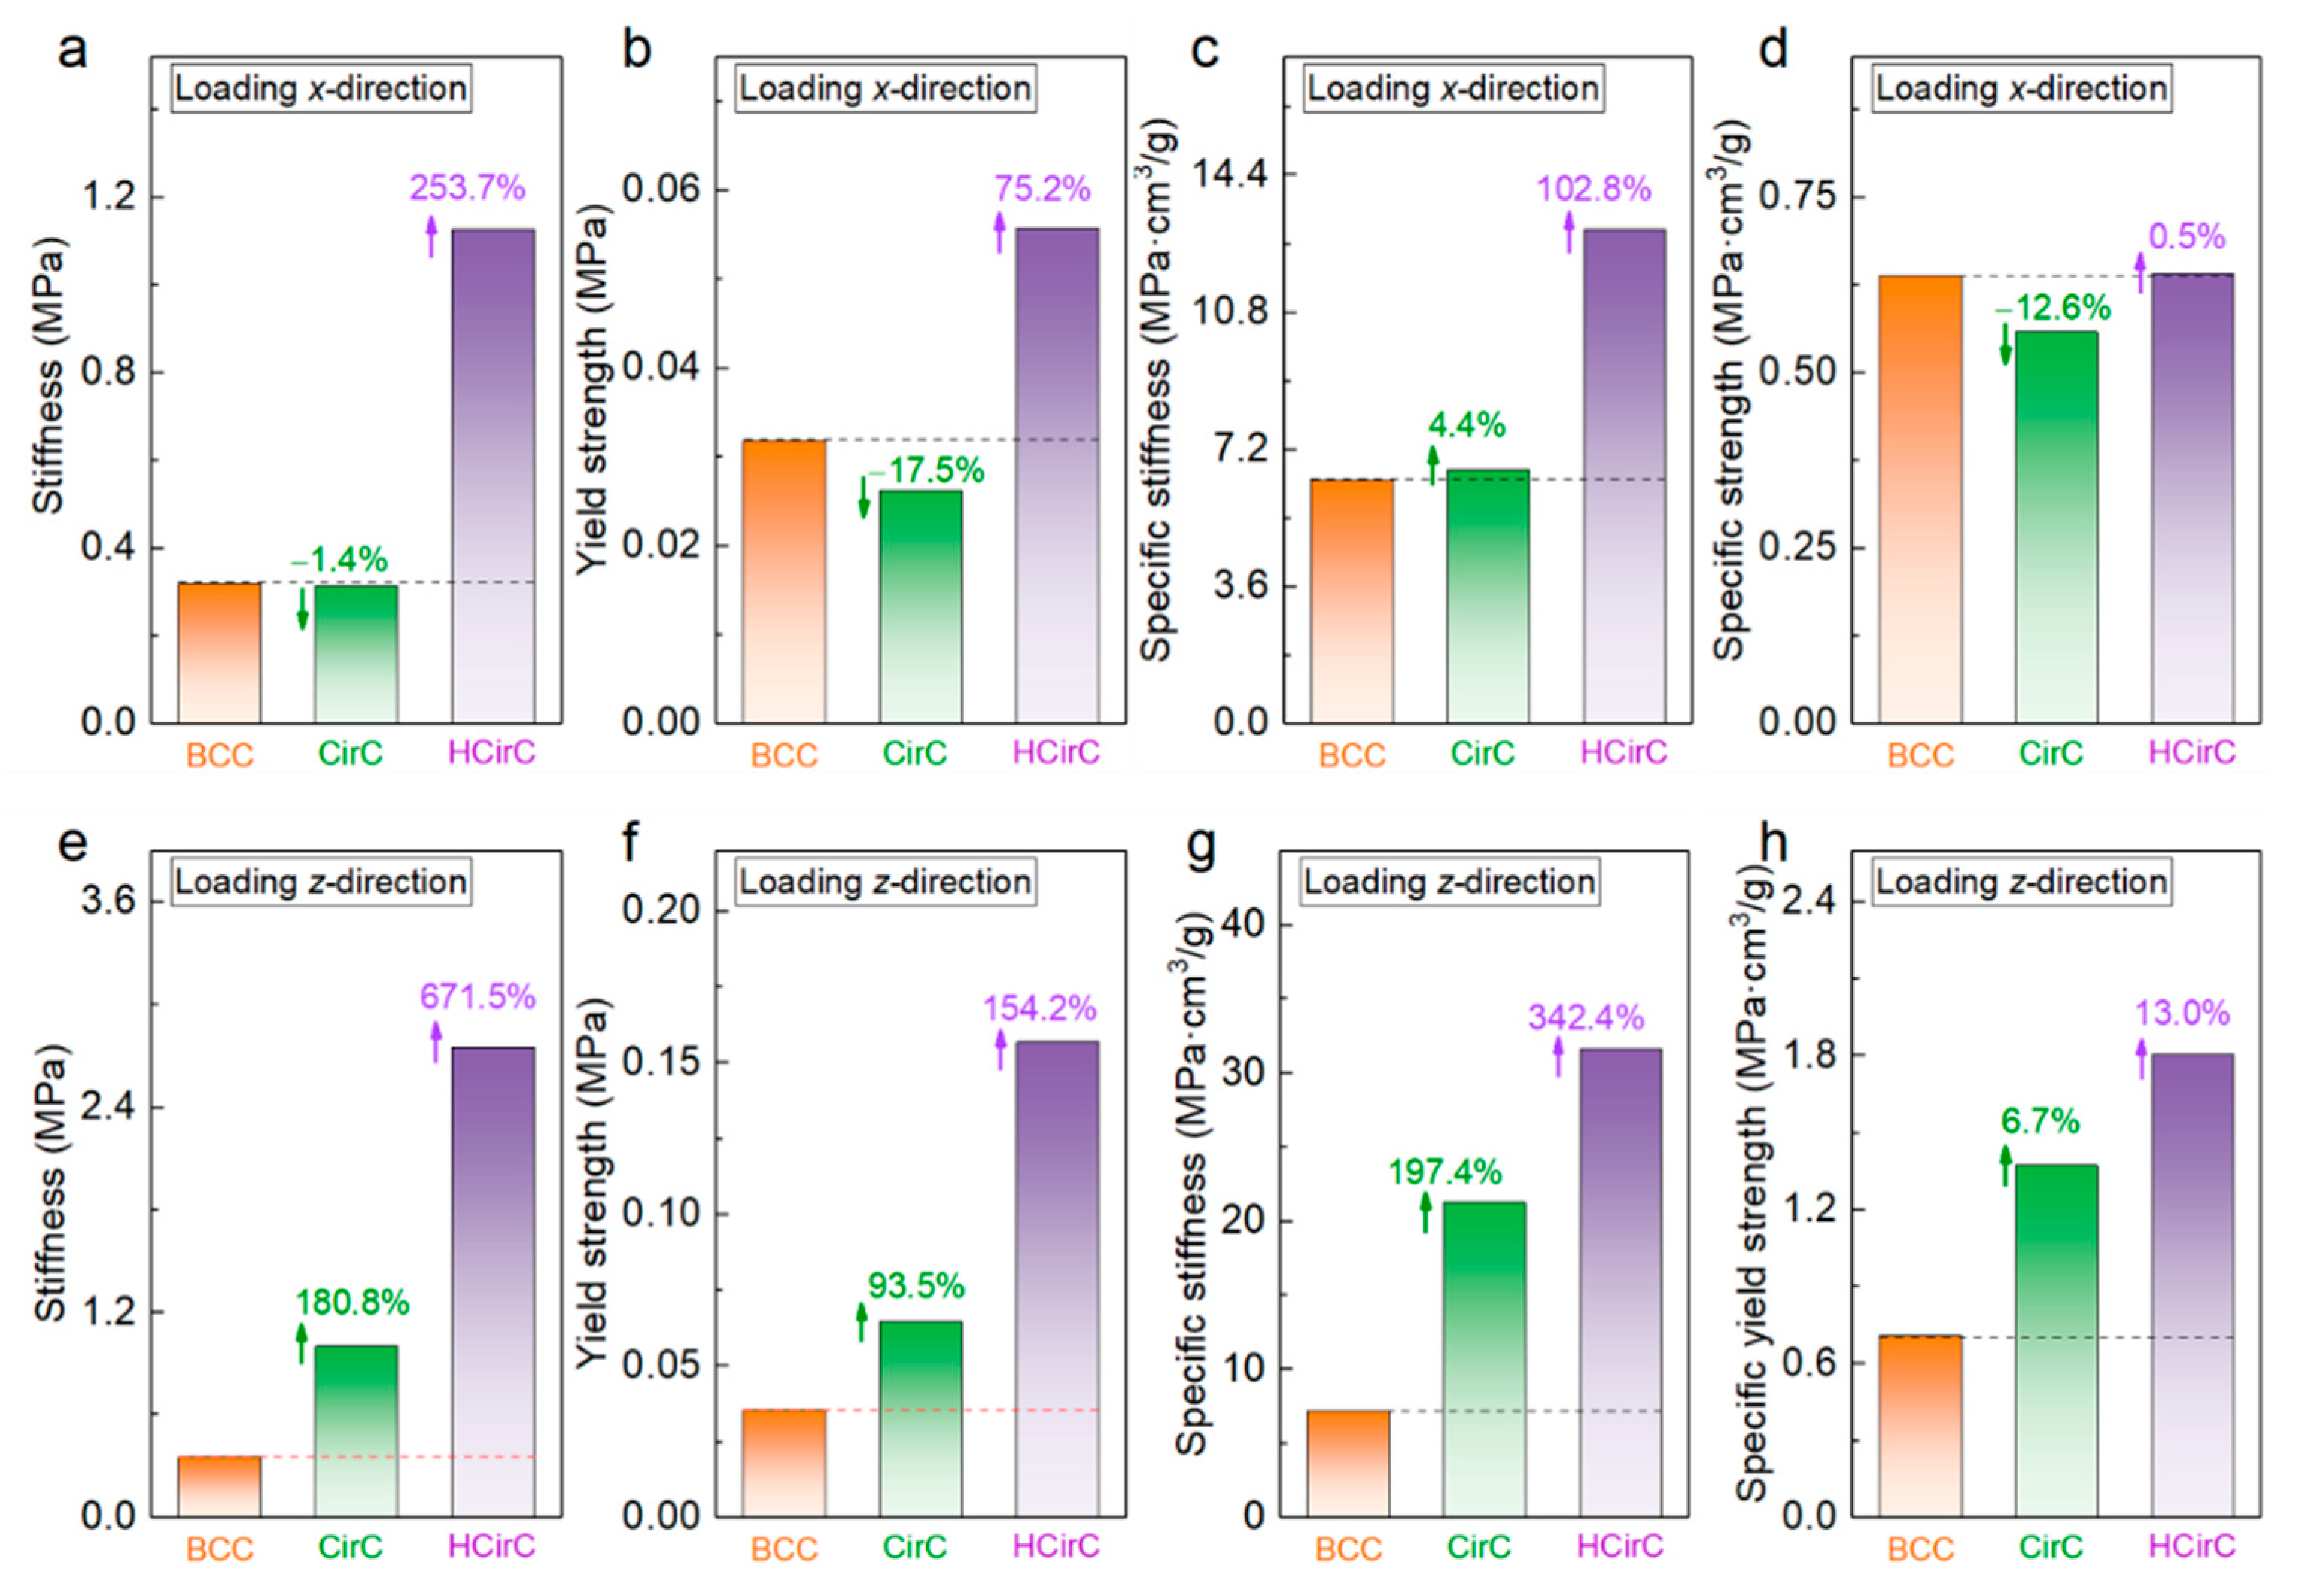
In Figure 8, all the compression stress curves of BCC, CirC, and HCirC show relatively long stress plateaus, and smooth yielding and stress transition processes. When the compression direction is along the x -axis, the compression curves of the BCC and CirC lattice structures are relatively smooth. Obvious stress oscillation behaviors are observed for CirC when compressing along the x -axis, and also for HcirC when compressing along two directions. Overall, the compression curves of HcirC exhibit the highest stress plateau (see stage II) than the BCC and CirC in both compression directions. The mechanical properties of BCC, CirC, and HCirC are extracted from the corresponding compression curves, and they are listed in Table 2. The specific mechanical properties are obtained by dividing the stiffness and strength values by relative density. The comparison of stiffness, strength, specific stiffness, and specific strength of the BCC, CirC, HCirC lattice structures is shown in Figure 9, respectively, in Figure 9a–d for compression along the x -axis, and in Figure 9e–h for compression along the z -axis.
As can be seen from Table 2 and Figure 9 that the HCirC lattice structure exhibits the highest mechanical performance in both x and z compression directions. When the compression direction is along the x -axis, the improvement values of mechanical properties are 253.7 % for stiffness and 75.2% for yield strength. When the compression direction is along the z -axis, the improvement values of mechanical properties are 671.5% for stiffness and 154.2% for yield strength.
In terms of the specific stiffness and strength values, the improvement of the HCirC lattice structure is also very obvious with respect to the BCC lattice. When the compression direction is along the x -axis, the improvement values of specific mechanical properties are 102.8% for specific stiffness and 0.5% for specific strength. When the compression direction is along the z -axis, the improvement values of specific mechanical properties are 342.4% for specific stiffness and 13.0% for specific strength. For the CirC lattice structure, the improvement of mechanical properties is not stronger than the HCirC, and even lower than the BCC lattice structure (e.g., see Figure 9b,d when the compression direction is along the x -axis). It is noted that in the designed configurations of unit cells, only the HCirC lattice possesses the bio-inspired structural hierarchy. Therefore, the bio-inspired hierarchical design is the factor that causes the improvement of mechanical properties of the HCirC lattice structure.

4.2. Deformation Mechanism and Failure Behaviors

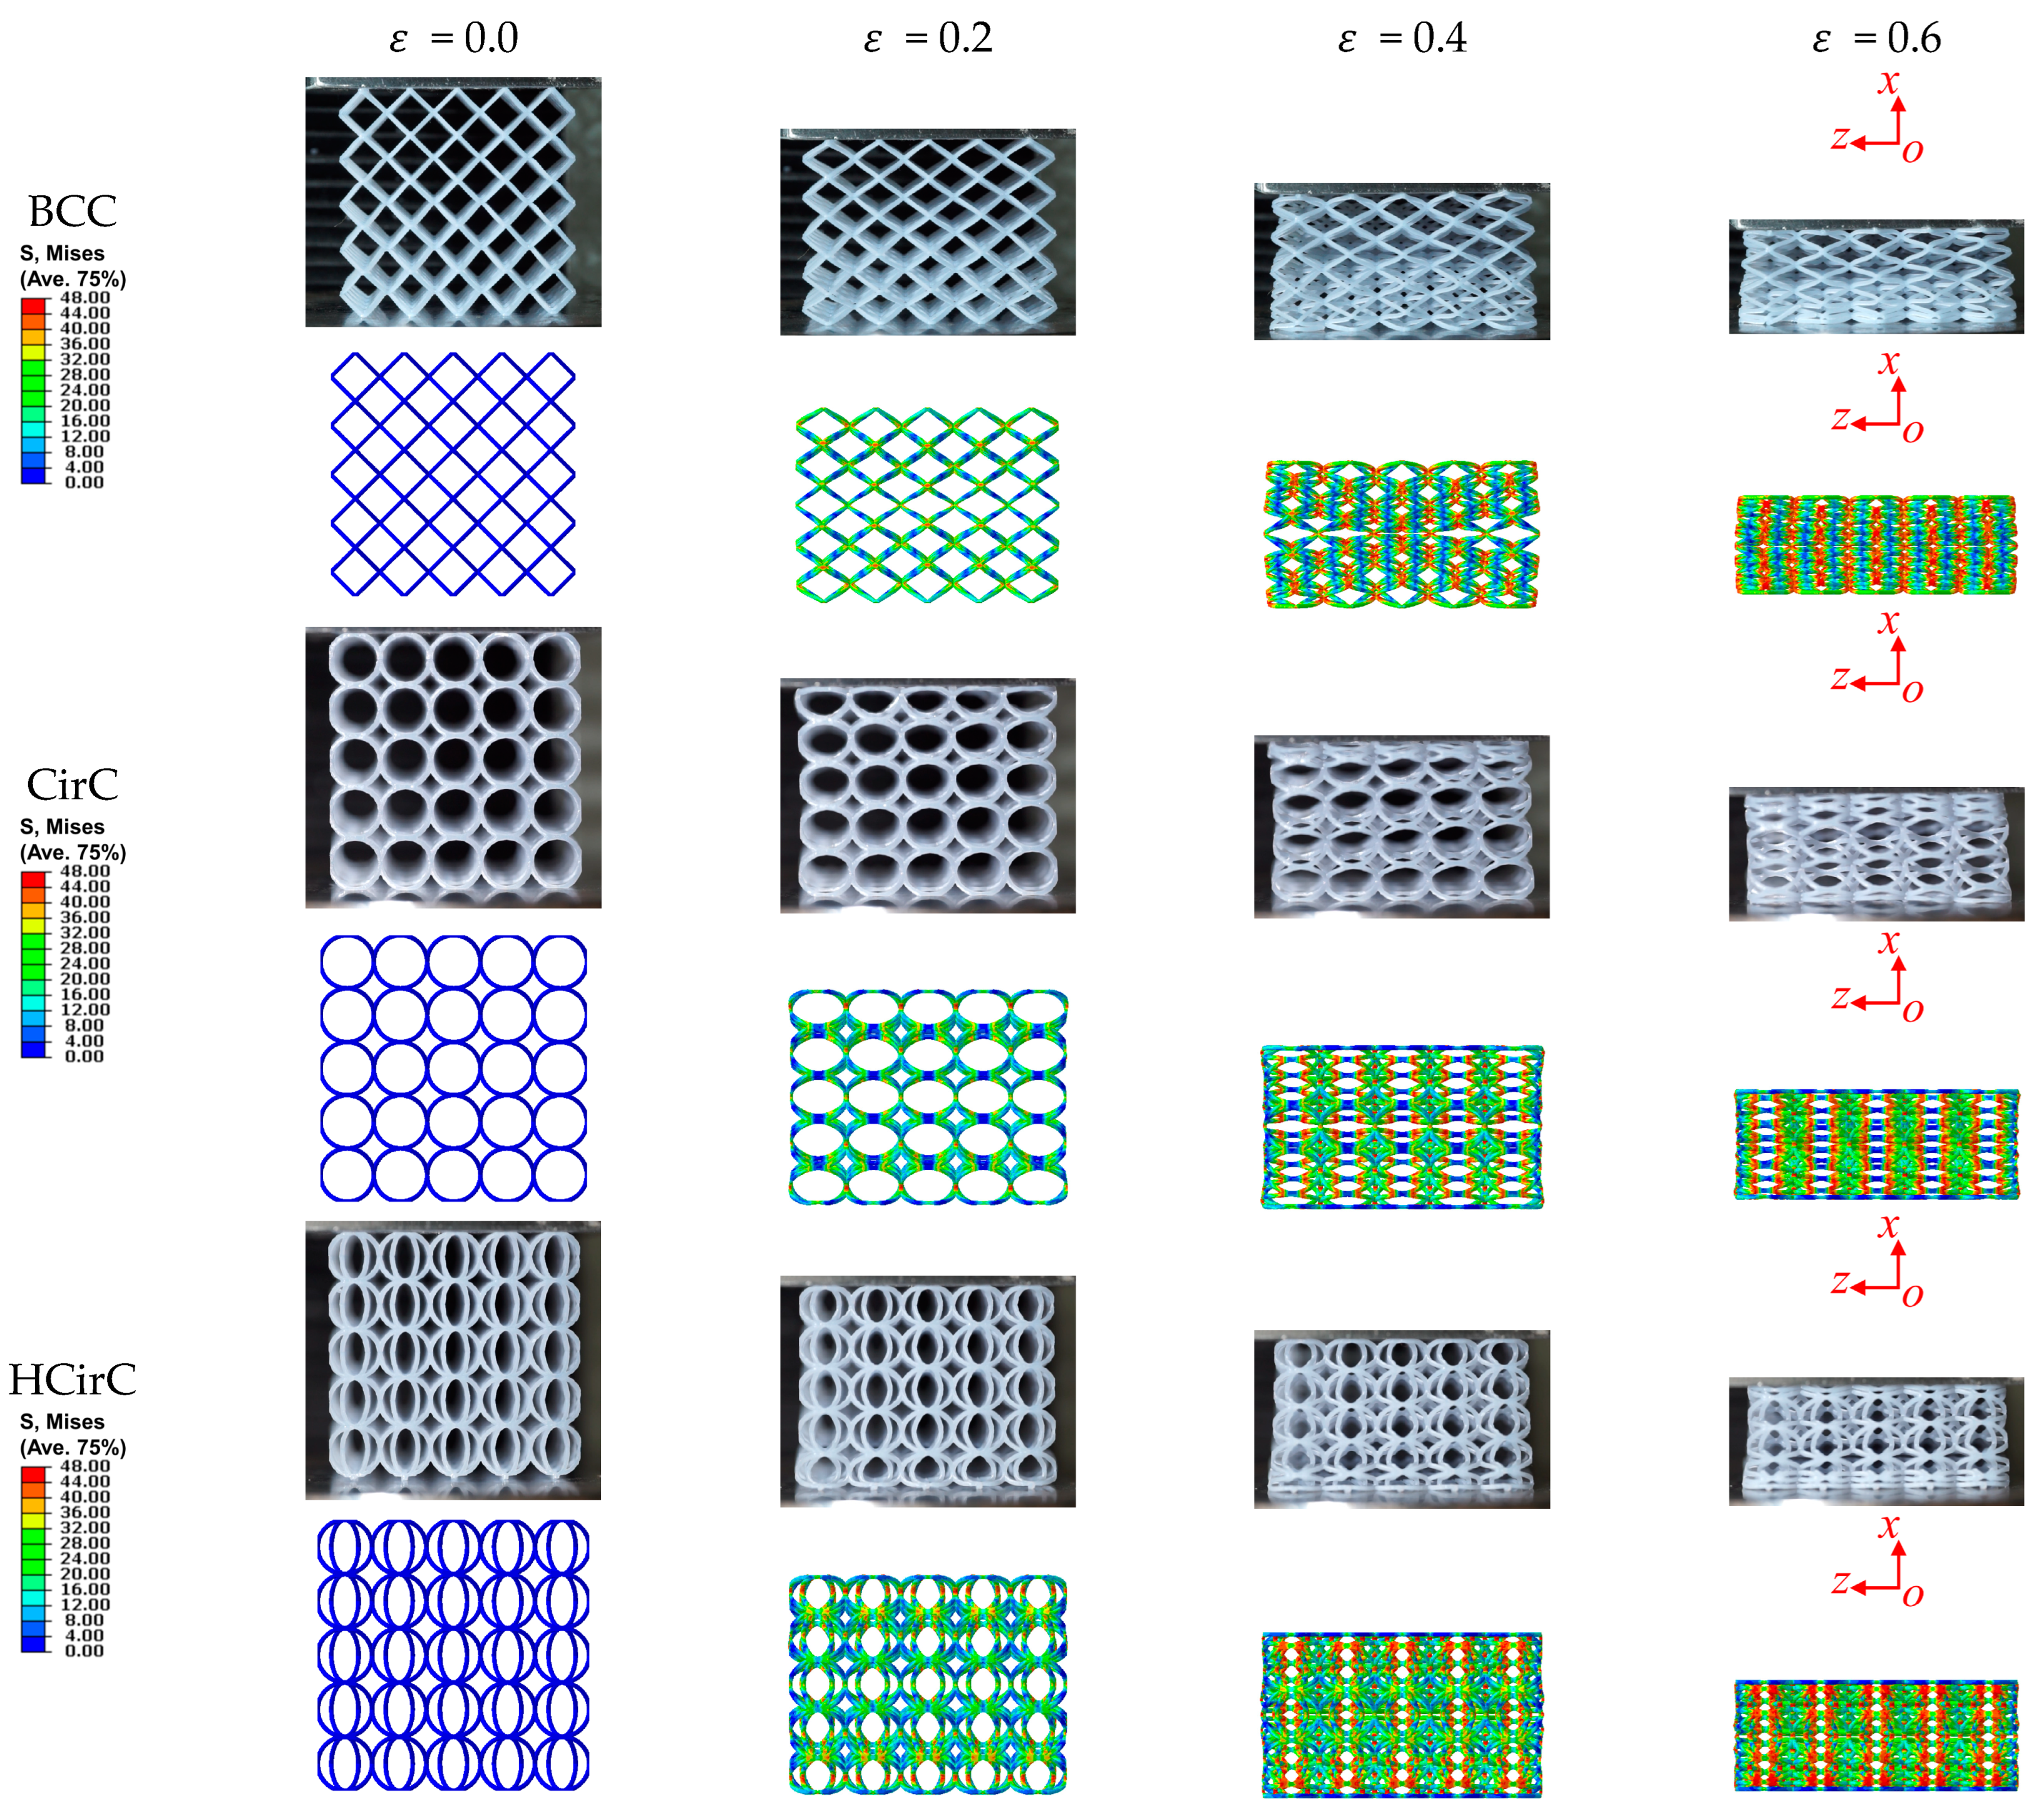
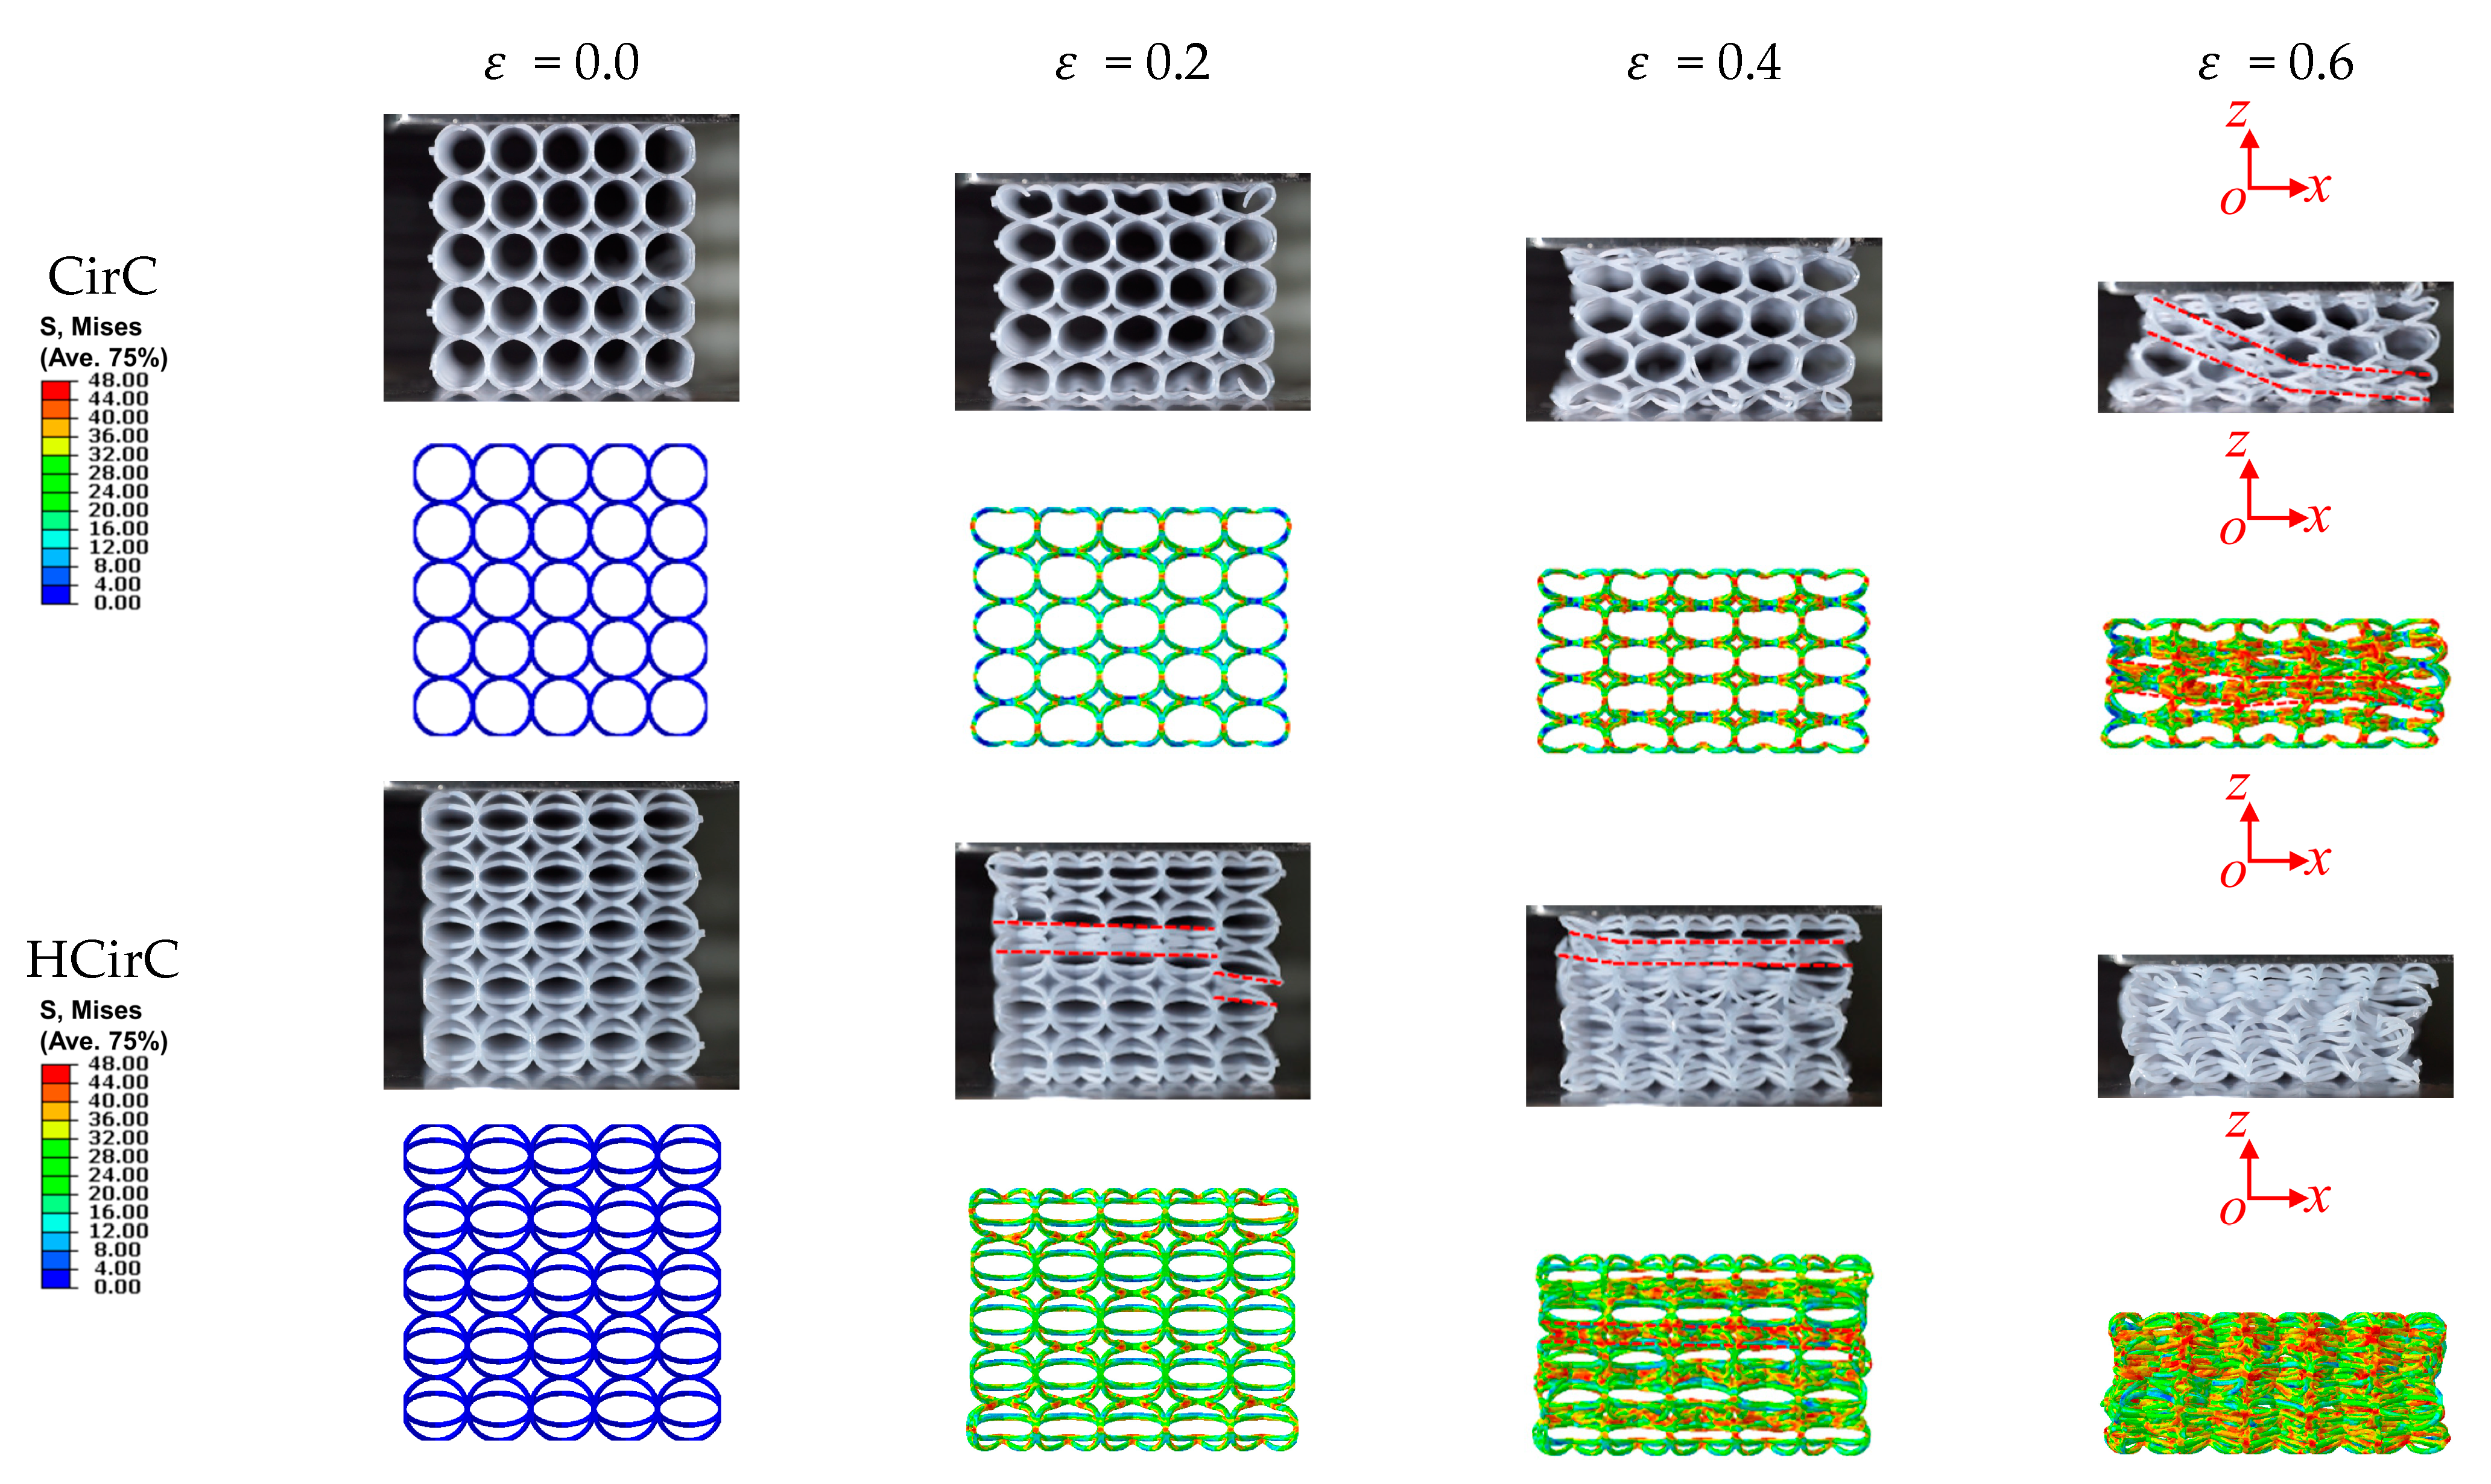
Figure 10, Figure 11 and Figure 12 show the compression behaviors of BCC, CirC, and HCirC, respectively, in Figure 10 (in XZ-view) and Figure 11 (in XY-view) for compression along the x -axis, and in Figure 12 (in XZ-view) for compression along the z -axis. The deformation behaviors of lattice structures obtained from FE simulations are also shown in Figure 10, Figure 11 and Figure 12, in order to reflect the deformation and collapse processes of the lattice structures. Additionally, the deformation processes of those lattice structures obtained from the FE simulation are close to the experiment. In Figure 10, Figure 11 and Figure 12, three distinct deformation stages can be observed for those lattice structures under axial compression. They are the initial bulking deformation, progressive collapse under relatively large compression strain, and the final densification stages.
In Figure 10 and Figure 11, when the compression direction is along the x -axis, the lattice structures of BCC, CirC, and HCirC exhibit very uniform deformation and progressive collapse behaviors. At the initial loading stage (e.g., ε = 0.2), the upper and bottom layers start to deform. Then, it is followed by successive collapse behaviors under relatively large compression strain (e.g., ε = 0.4), until the deformation reaches the final densification stage (e.g., ε is larger than 0.6). Those distinct deformation stages can also be observed in Figure 11 under the XY-views, and the deformation mode shows clearly the X-type shear band for the BCC, CirC, and HCirC lattice structures. Results indicate that the deformation mode of the BCC, CirC, and HCirC lattice structures is bending-dominated when the compression direction is along the x -axis. Here, in Figure 11, the experiment shows layer-wise failure that starts with the bottom layer. This may be because the experienced UV light is not very uniform (e.g., the UV light will easily be shaded by the lattice itself, as the bottom layer received less UV light than the first layer), thus causing the slight mechanical heterogeneity of the lattice sample.
Figure 12 shows the compression behaviors of CirC and HCirC lattice structures, and the compression direction is along the z -axis. In Figure 12, the deformation of the middle layers is relatively uniform at the initial stage (e.g., ε = 0.2), and bulking behaviors were observed for the upper and bottom layers. For the CirC lattice structure, the bulking of the upper and bottom layers corresponds to the first peak stress on the compression stress–strain curve (see Figure 8b). With the increase in compression strain, the bulking of the middle layers (e.g., ε = 0.4), as well as the local shear behaviors, was observed (e.g., ε = 0.6). For the HCirC lattice with structural hierarchy, the outer cell (e.g., master cell) of the upper and bottom layers will collapse first, bringing a short initial stress plateau, as shown by the compression curves in Figure 8b. Then, the further collapse of outer cells can be observed and they will be in contact with the inner cells, resulting a further increase in compression stress (see the stress peak in Figure 8b for the HCirC lattice structure). With the increase in compression strain (e.g., ε = 0.4) all the outer cells collapsed, then the inner cells (e.g., slave cells) began to deform (e.g., ε = 0.6), and the compression stress was increased accordingly (see Figure 8b, the strain around 0.5). The enhancement of mechanical properties of the HCirC lattice structure is ascribed to the structural hierarchy and interaction between inner and outer cells.
In the study, the Gibson–Ashby model [52,53] was used to describe the relationship between the relative density and relative stiffness of the lattice structures. This theoretical model is very popular in explaining the deformation mechanism and predicting the mechanical properties of porous structures [25,52]. Based on the classic theory of this model [52,53], the deformation mode is bending-dominated if the exponent is 2, and stretching-dominated if the exponent is 1 [52,53]. The Gibson–Ashby model can be expressed as:
E x E s = C x ρ ρ s n x   and   E z E s = C z ρ ρ s n z
where, E s and ρ s are the stiffness and density of the matrix material. ρ is the density of the lattice structure. E x and E z are the stiffness of lattice structure along the x and z directions, respectively. C x and n z are the fitting parameters obtained from the x direction, and C z and n z are the fitting parameters obtained from the z direction.
The fitting parameters of the Gibson–Ashby model [52,53] are listed in Table 3 for the BCC, CirC, and HCirC lattice structures. In Table 3, the exponent value is 2.120 for the BCC, which is coincident with the bending-dominated deformation behaviors of the BCC lattice structure. The exponent values of the HcirC lattice structure are 2.067 for compression along the x -axis, and 2.066 for compression along the the z -axis. The exponent values are very close to 2 for the BCC and HcirC in both compression directions, and their deformation mode is bending-dominated. For the CirC lattice structure, the values of the exponent are 2.537 for compression along the x -axis, and 2.909 for compression along the z -axis. According to the bulking and deformation processes of CirC lattice structures, the deformation mode of the CirC tends to be bending-dominated in two compression directions. The fitting results of the relationship between relative density and relative modulus are also compared, as shown in Figure 13a for compression along the x -axis, and in Figure 13b along the z -axis. In Figure 13, the relative stiffness is comparable at the same relative density for the BCC and HcirC when the compression is along the x -axis. The HCirC and CirC exhibit superior relative stiffness than the BCC at the same relative density when the loading direction is along the z -axis. When the rod diameter of the lattice structure is the same, the HCirC will have higher relative density and mechanical performance (in two loading directions) than the CirC and BCC, because of the more efficient space and volume utilization. The hierarchical design is helpful to enhance mechanical properties with respect to the conventional BCC lattice.
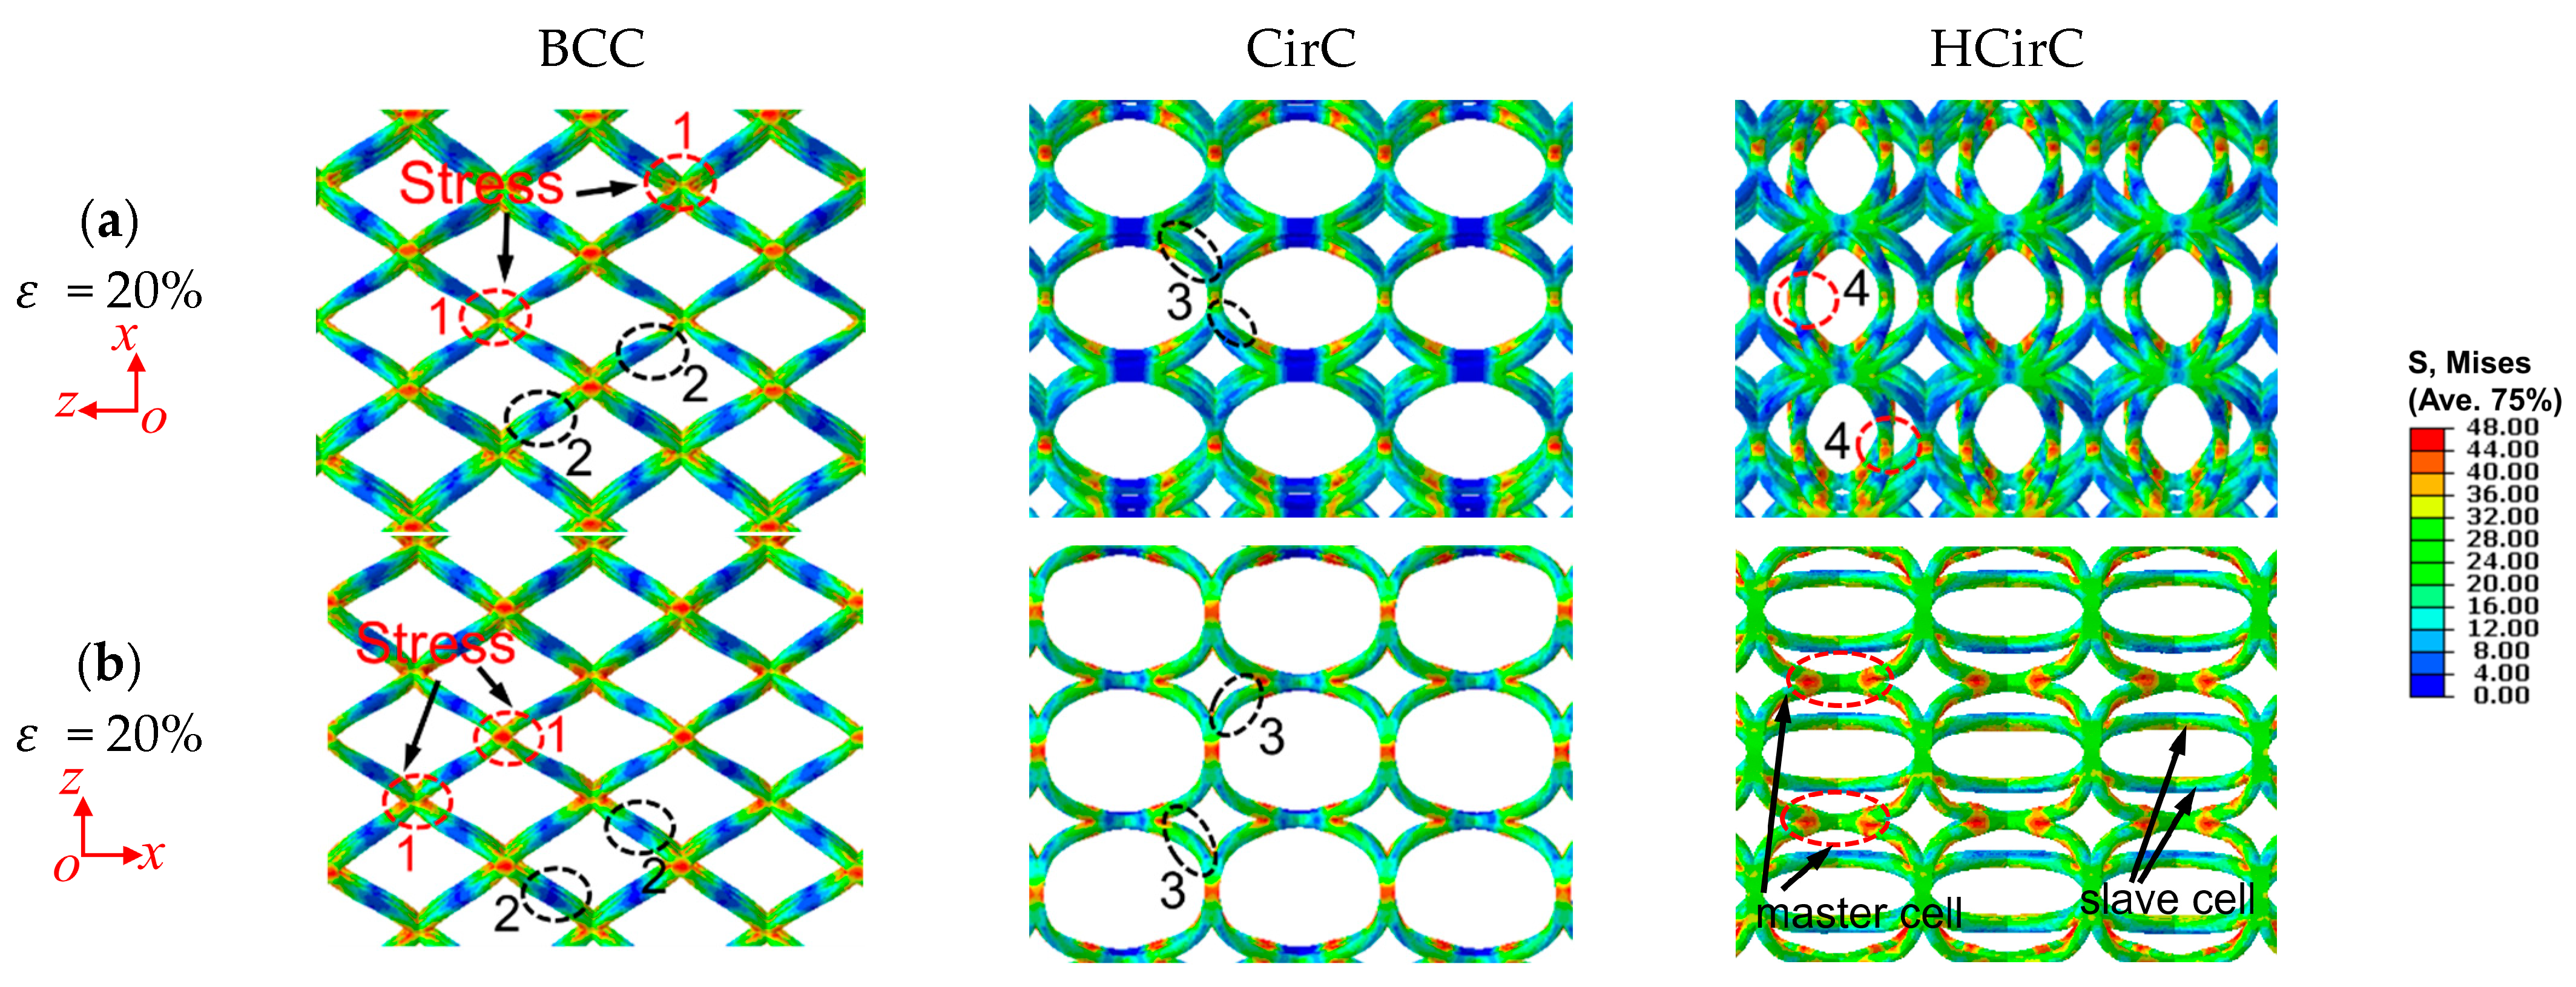
Figure 14 shows the comparison of stress distribution of lattice structures BCC, CirC, and HCirC under the same compression displacement (at strain value of 20%), respectively, in Figure 14a for compression along the x -axis, and in Figure 14b for compression along the z -axis. Here, the local views of unit cells located at the center of the 5 × 5 × 5 lattice structures were shown. In Figure 14, a very high-stress concentration can be observed on the nodes (e.g., see node 1) of the BCC lattice in both compression directions, while the stress on the center of the strut was relatively low (e.g., see node 2). The scale bar of the stress distribution is defined as the same range values so that the stress distribution situations on different lattice configurations can be compared. For the circular-based lattice structure CirC and HCirC, it shows obviously that the stress concentration on the joints of lattice structures can be reduced and nearly uniform stress distribution can be found on the center of the circular rods (e.g., see nodes 3 and 4). This phenomenon is especially obvious when the compression direction is along the z -axis, e.g., see Figure 14b. The stress concentration during compression processes should be an important consideration for the geometrical design of lattice structures. The sharp joints are easily formed by the straight struts, which usually induces a high-stress concentration and potential failure and damaging behaviors [26,27,54]. The uniform stress distribution of circular-cell-based lattice structures was also reported in the previous works [25,27]. In the geometrical design of lattice configurations, the bio-inspired structural hierarchy was not considered. In Figure 14b, for the hierarchical circular-cell-based lattice structure proposed in the present study, the outer cell (e.g., master cell) exhibits similar stress distribution of the CirC lattice structure, and it is better than the BCC lattice. Additionally, the stress distribution of the inner cell (e.g., slave cell) is very uniform, see Figure 14b, and lower than the outer cell (master cell). The consideration of structural hierarchy in the designed circular-cell lattice structure will be very helpful to alleviate the stress concentration and improve specific mechanical properties, which are very useful for the multifunctional application of lattice structures in the future.
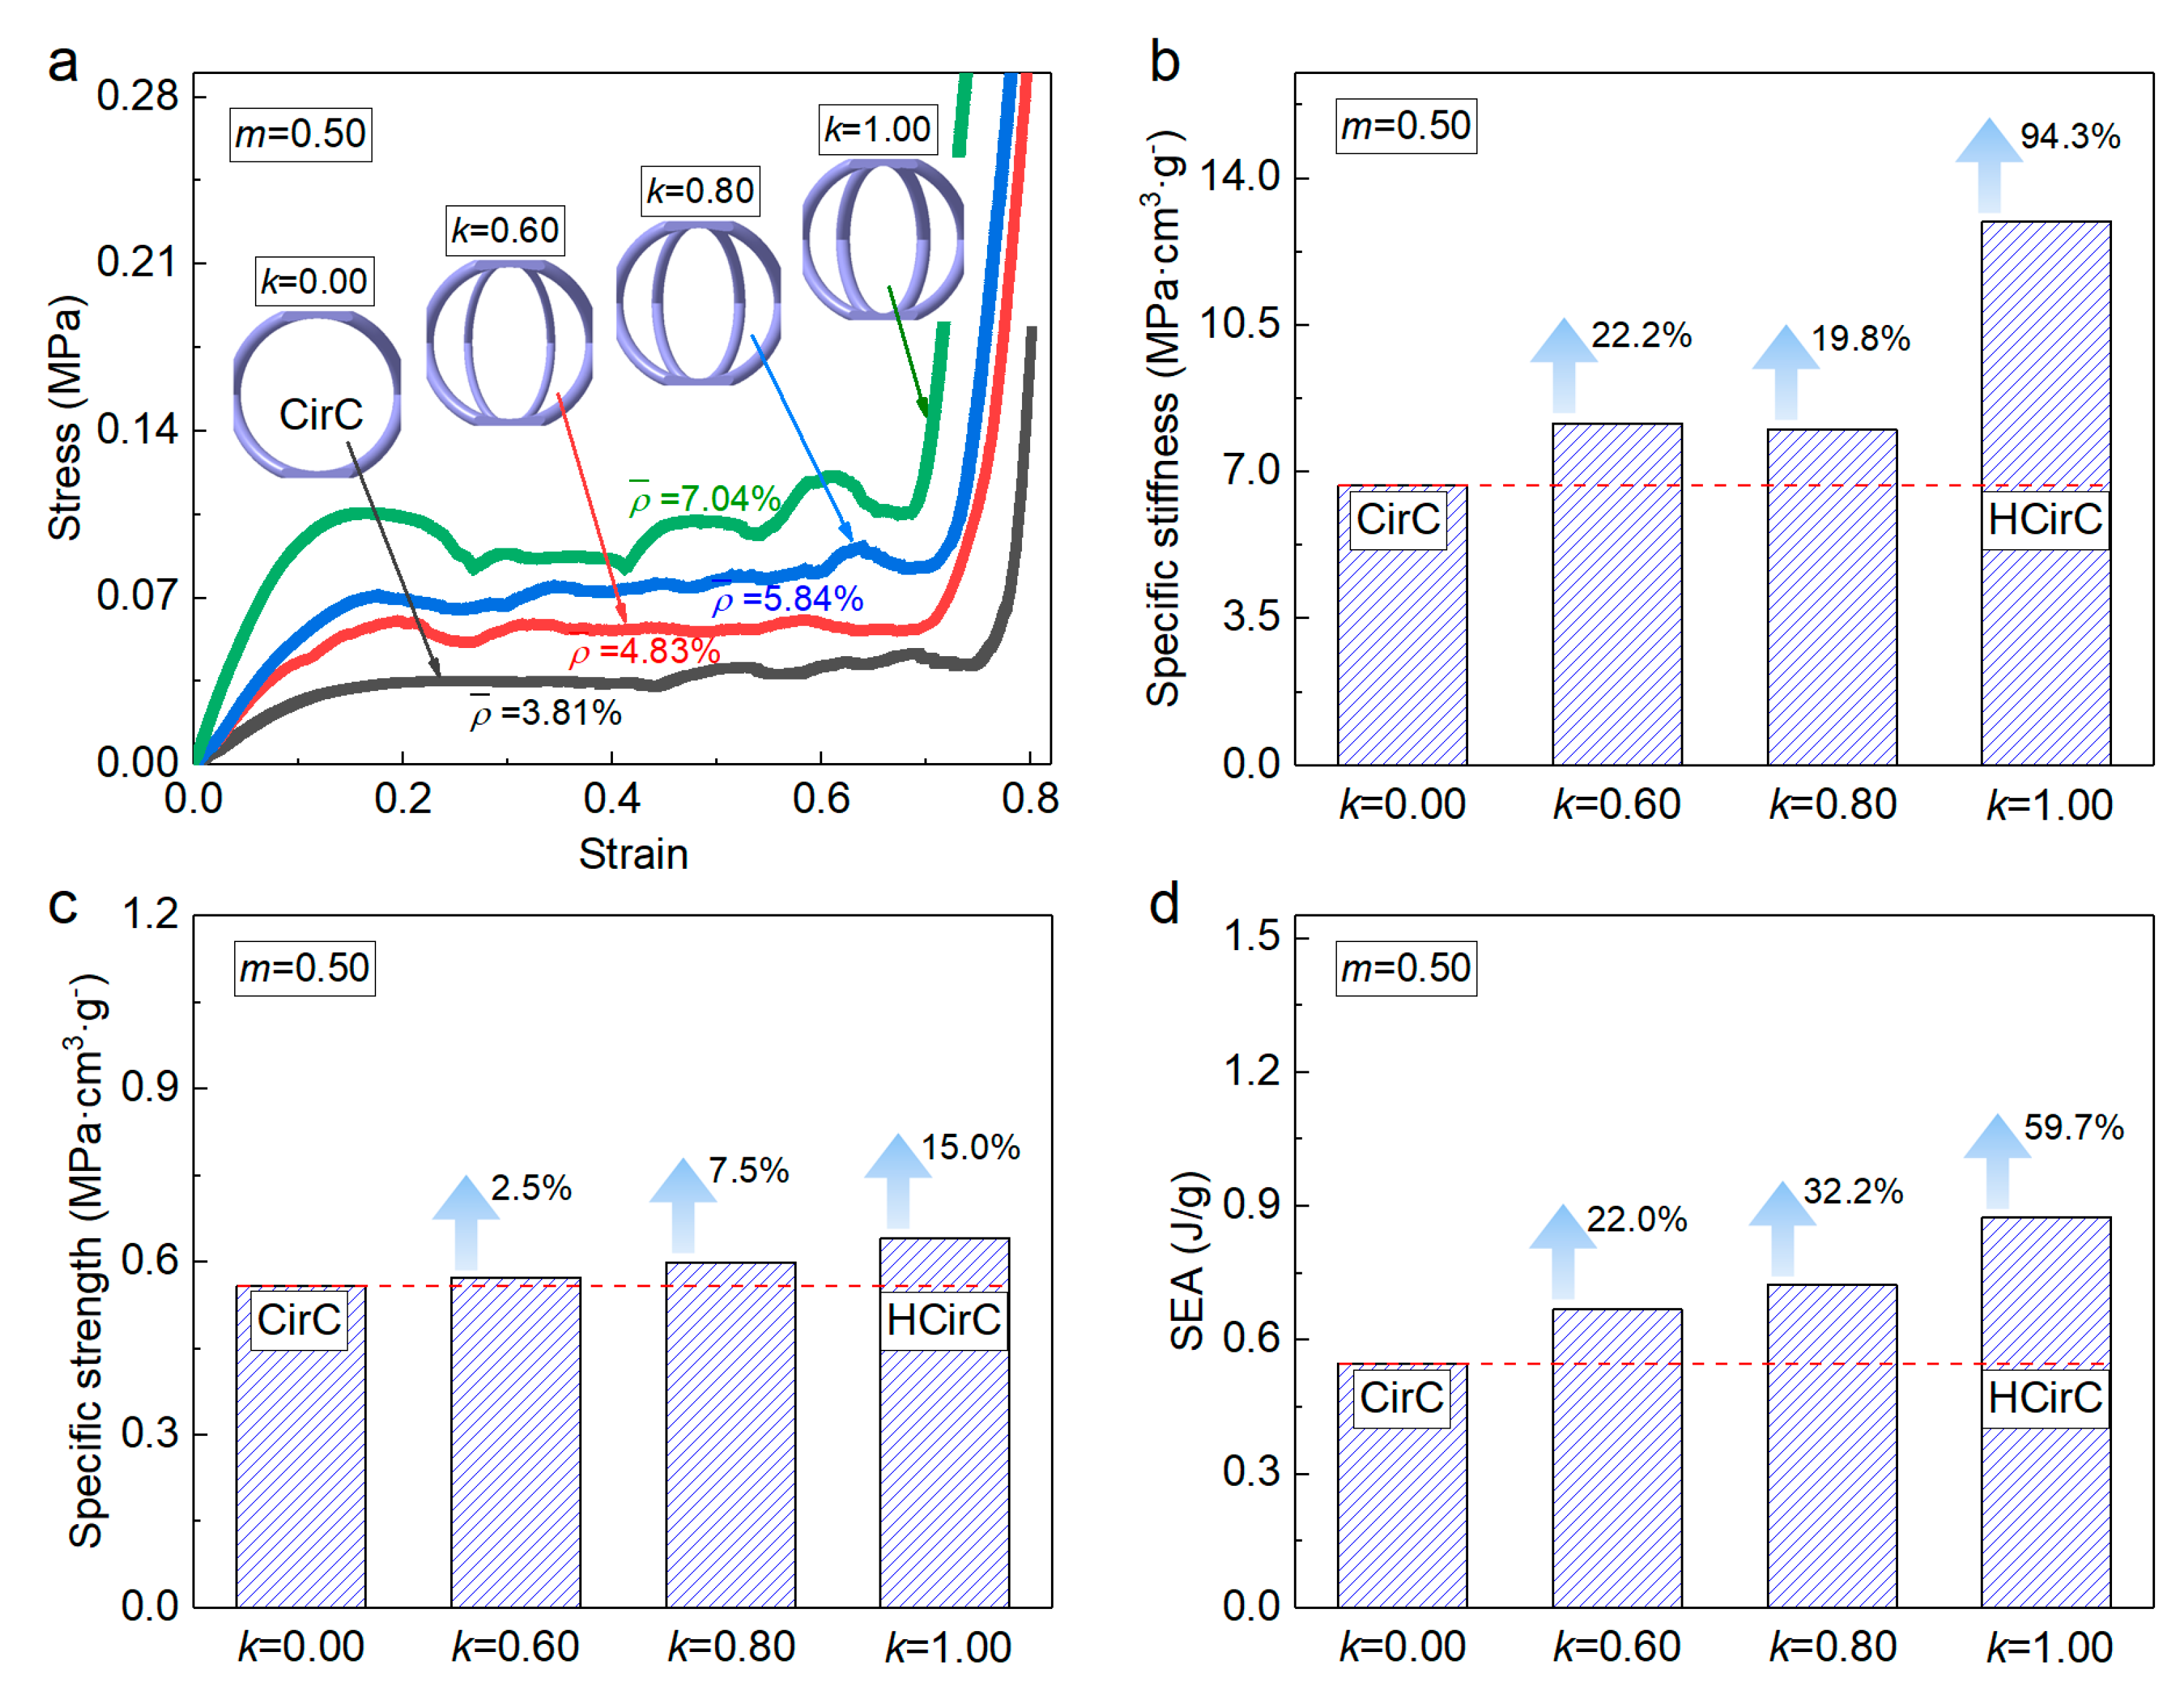
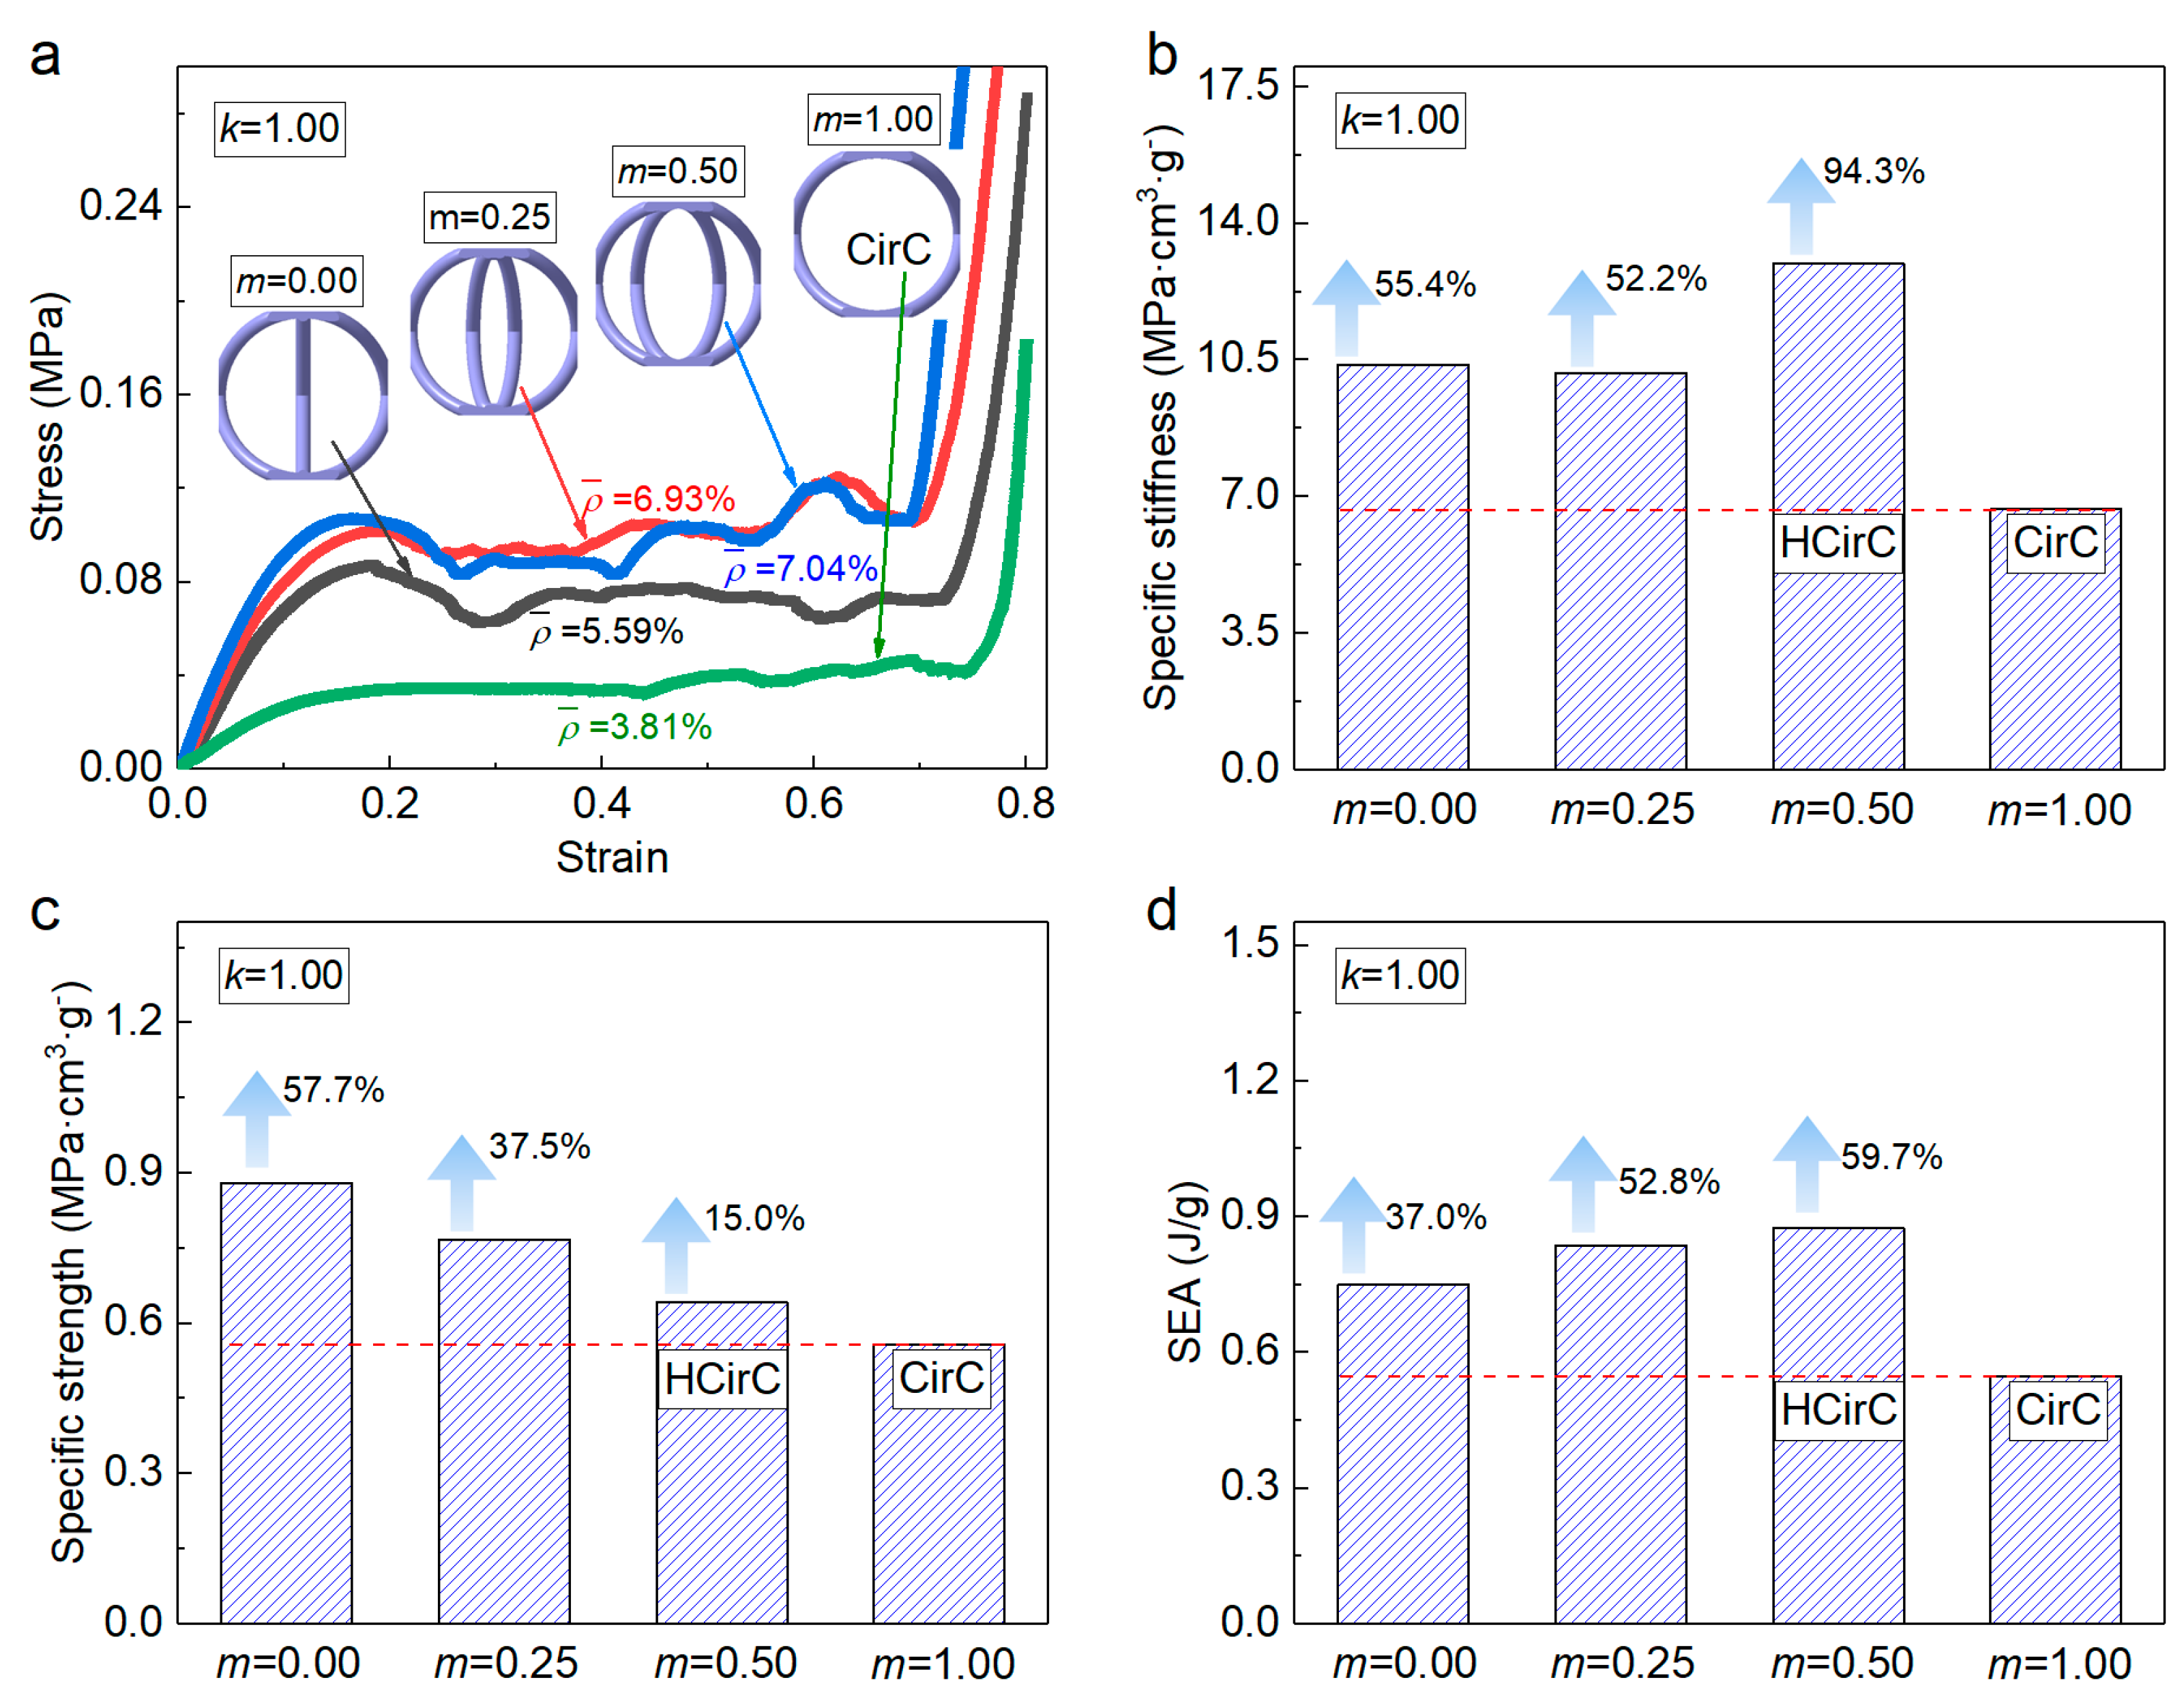
In the designed circular-cell lattice configuration of HCirC, the structural hierarchy is a factor that will cause the improvement of mechanical properties. As was discussed in Section 2, k and m are two geometry parameters that can be used to tailor the mechanical properties of the HCirC lattice structure. To investigate the enhanced effect of structural hierarchy and reveal the effect of parameters k and m on the mechanical properties of HCirC lattice structure, further compression experiments are performed. Table 4 listed the different combinations of parameters k and m in the 3D printing experiments and the relative density of the lattice samples. Figure 15 shows the effect of parameter k on the compression curves and mechanical properties of the HCirC lattice structure, and the relative density values are also presented. Figure 16 shows the effect of parameter m on the compression curves and mechanical properties of the HCirC lattice structure. The detailed definition of SEA will be presented in Section 4.3. Here, only the results from the x compression direction are shown, and the results obtained from the z -axis show similar hierarchical enhancement trends.
It can be seen in Figure 15 and Figure 16 that both the geometry parameters k and m have obvious effects on the mechanical properties and the energy absorption capacity of the HCirC lattice structure. In Figure 15, when the parameter m is fixed at 0.50, the stiffness, yield strength, and relative density will monotonously increase with the increase in parameter k , and all of those compression curves exhibit a relatively long stress plateau. It is noted that, when m is 0.50 and k is 0.00, the lattice structure will reduce to CirC. In Figure 15b–d, the mechanical improvement of the HCirC lattice structure with respect to CirC is also shown. The optimized enhancement effect can be achieved when k is 1.00 and m is 0.5, and the improvement values are 94.3% for specific stiffness, 15.0% for specific strength, and 59.7% for SEA. In Figure 16, the value of k is fixed at 1.00 and the value of m is varied from 0.00 to 1.00. It can be seen in Figure 16 that the stiffness, strength, and relative density will increase with the increase in m . The maximum enhancement effect is achieved when m is 0.5, and then the mechanical properties and relative density will decrease when m is 1.0. So, the optimized enhancement effect can be observed when m is 0.50. The maximum improvement values of mechanical properties are 94.3% for specific stiffness ( m is 0.50), 57.7% for specific yield strength ( m is 0.00), and 59.7% for SEA ( m is 0.50). Results in Figure 15 and Figure 16 further proved that the bio-inspired hierarchy design in the present study is effective, and it is beneficial for the improvement of mechanical properties of lattice structures.

4.3. Energy Absorption Capacity

Energy absorption has been widely used as a significant mechanical indicator of lattice structures [26,33,34]. The specific energy absorbed (SEA) is defined as the ratio between total energy absorbed (TEA) and the mass of the lattice structure [26,34], and it is expressed in Equation (5):
SEA = T E A M = 0 U P i d u M
where P i is the compression load, U the maximum compression displacement, and M the mass of lattice samples. The total energy absorbed (TEA) is defined as the integration of compression load with compression displacement, as T E A = 0 U P i d u , and u is the compression displacement.
The energy absorption efficiency is defined as the ratio of the absorbed energy of materials up to a given compression strain to the ideal energy absorber when they produced the same stress peak [26,34]. Energy absorption efficiency is defined as:
η = 0 ε σ ε d ε σ *
where σ ε and ε are the stress and strain values obtained from the axial compression experiment. σ * represents the peak stress at a given strain. η max is used to represent the maximum energy efficiency. Its corresponding compression strain is defined as the densification strain [26,55].
The plateau stress can be expressed as [26]:
σ p l = 0 ε σ ε d ε ε d
The ratio between plateau stress σ p l and initial peak stress σ p k is defined as the crash load efficiency (CLE). It is used to reflect the uniformity of the compression stress–strain curves. The higher CLE value usually indicates stronger energy efficiency under the same magnitude of transient loads. The crash load efficiency is defined as [26,34]:
CLE = σ p l σ p k
where σ p l represents the plateau stress and σ p k the initial peak stress.
Figure 17 shows the comparison of specific energy absorption, energy efficiency, and compression curves for BCC, CirC, and HCirC lattice structures, respectively, in Figure 17a for BCC, in Figure 17b,c for CirC, and in Figure 17d,e for HCirC. Additionally, the maximum value of energy efficiency and the densification strain are also shown in Figure 17. Here, the densification strain ε d corresponds to the strain value with maximum energy efficiency, according to the definition in the works [26,55]. As can be seen in Figure 17, this definition of densification strain is effective for the BCC and CirC lattice structures without structural hierarchy. For the HCirC lattice structures, when the compression direction is along the z -axis, the energy efficiency curve shows clearly two inflection points and their corresponding compression strains were defined as ε d 1 and ε d 2 , respectively. As was discussed in Section 4.2, in the designed hierarchical circular-cell lattice structure, the interaction effect between slave and master cells causes the increase in compression stress (see Figure 8b at a strain around 0.6). So, the energy efficiency curve will reach its maximum value much earlier than the simple lattice without structural hierarchy. Overall, the CirC lattice structure exhibits higher maximum energy efficiency and densification strain values than the BCC lattice. Additionally, the HCirC lattice structure also exhibits excellent energy absorption capacity, e.g., a higher maximum energy efficiency and a comparable densification strain (e.g., compression along the x -axis) with respect to the BCC lattice. Additionally, when the compression direction is along the z -axis, the HCirC lattice shows a higher densification strain and a comparable maximum energy efficiency with respect to the BCC lattice structure.
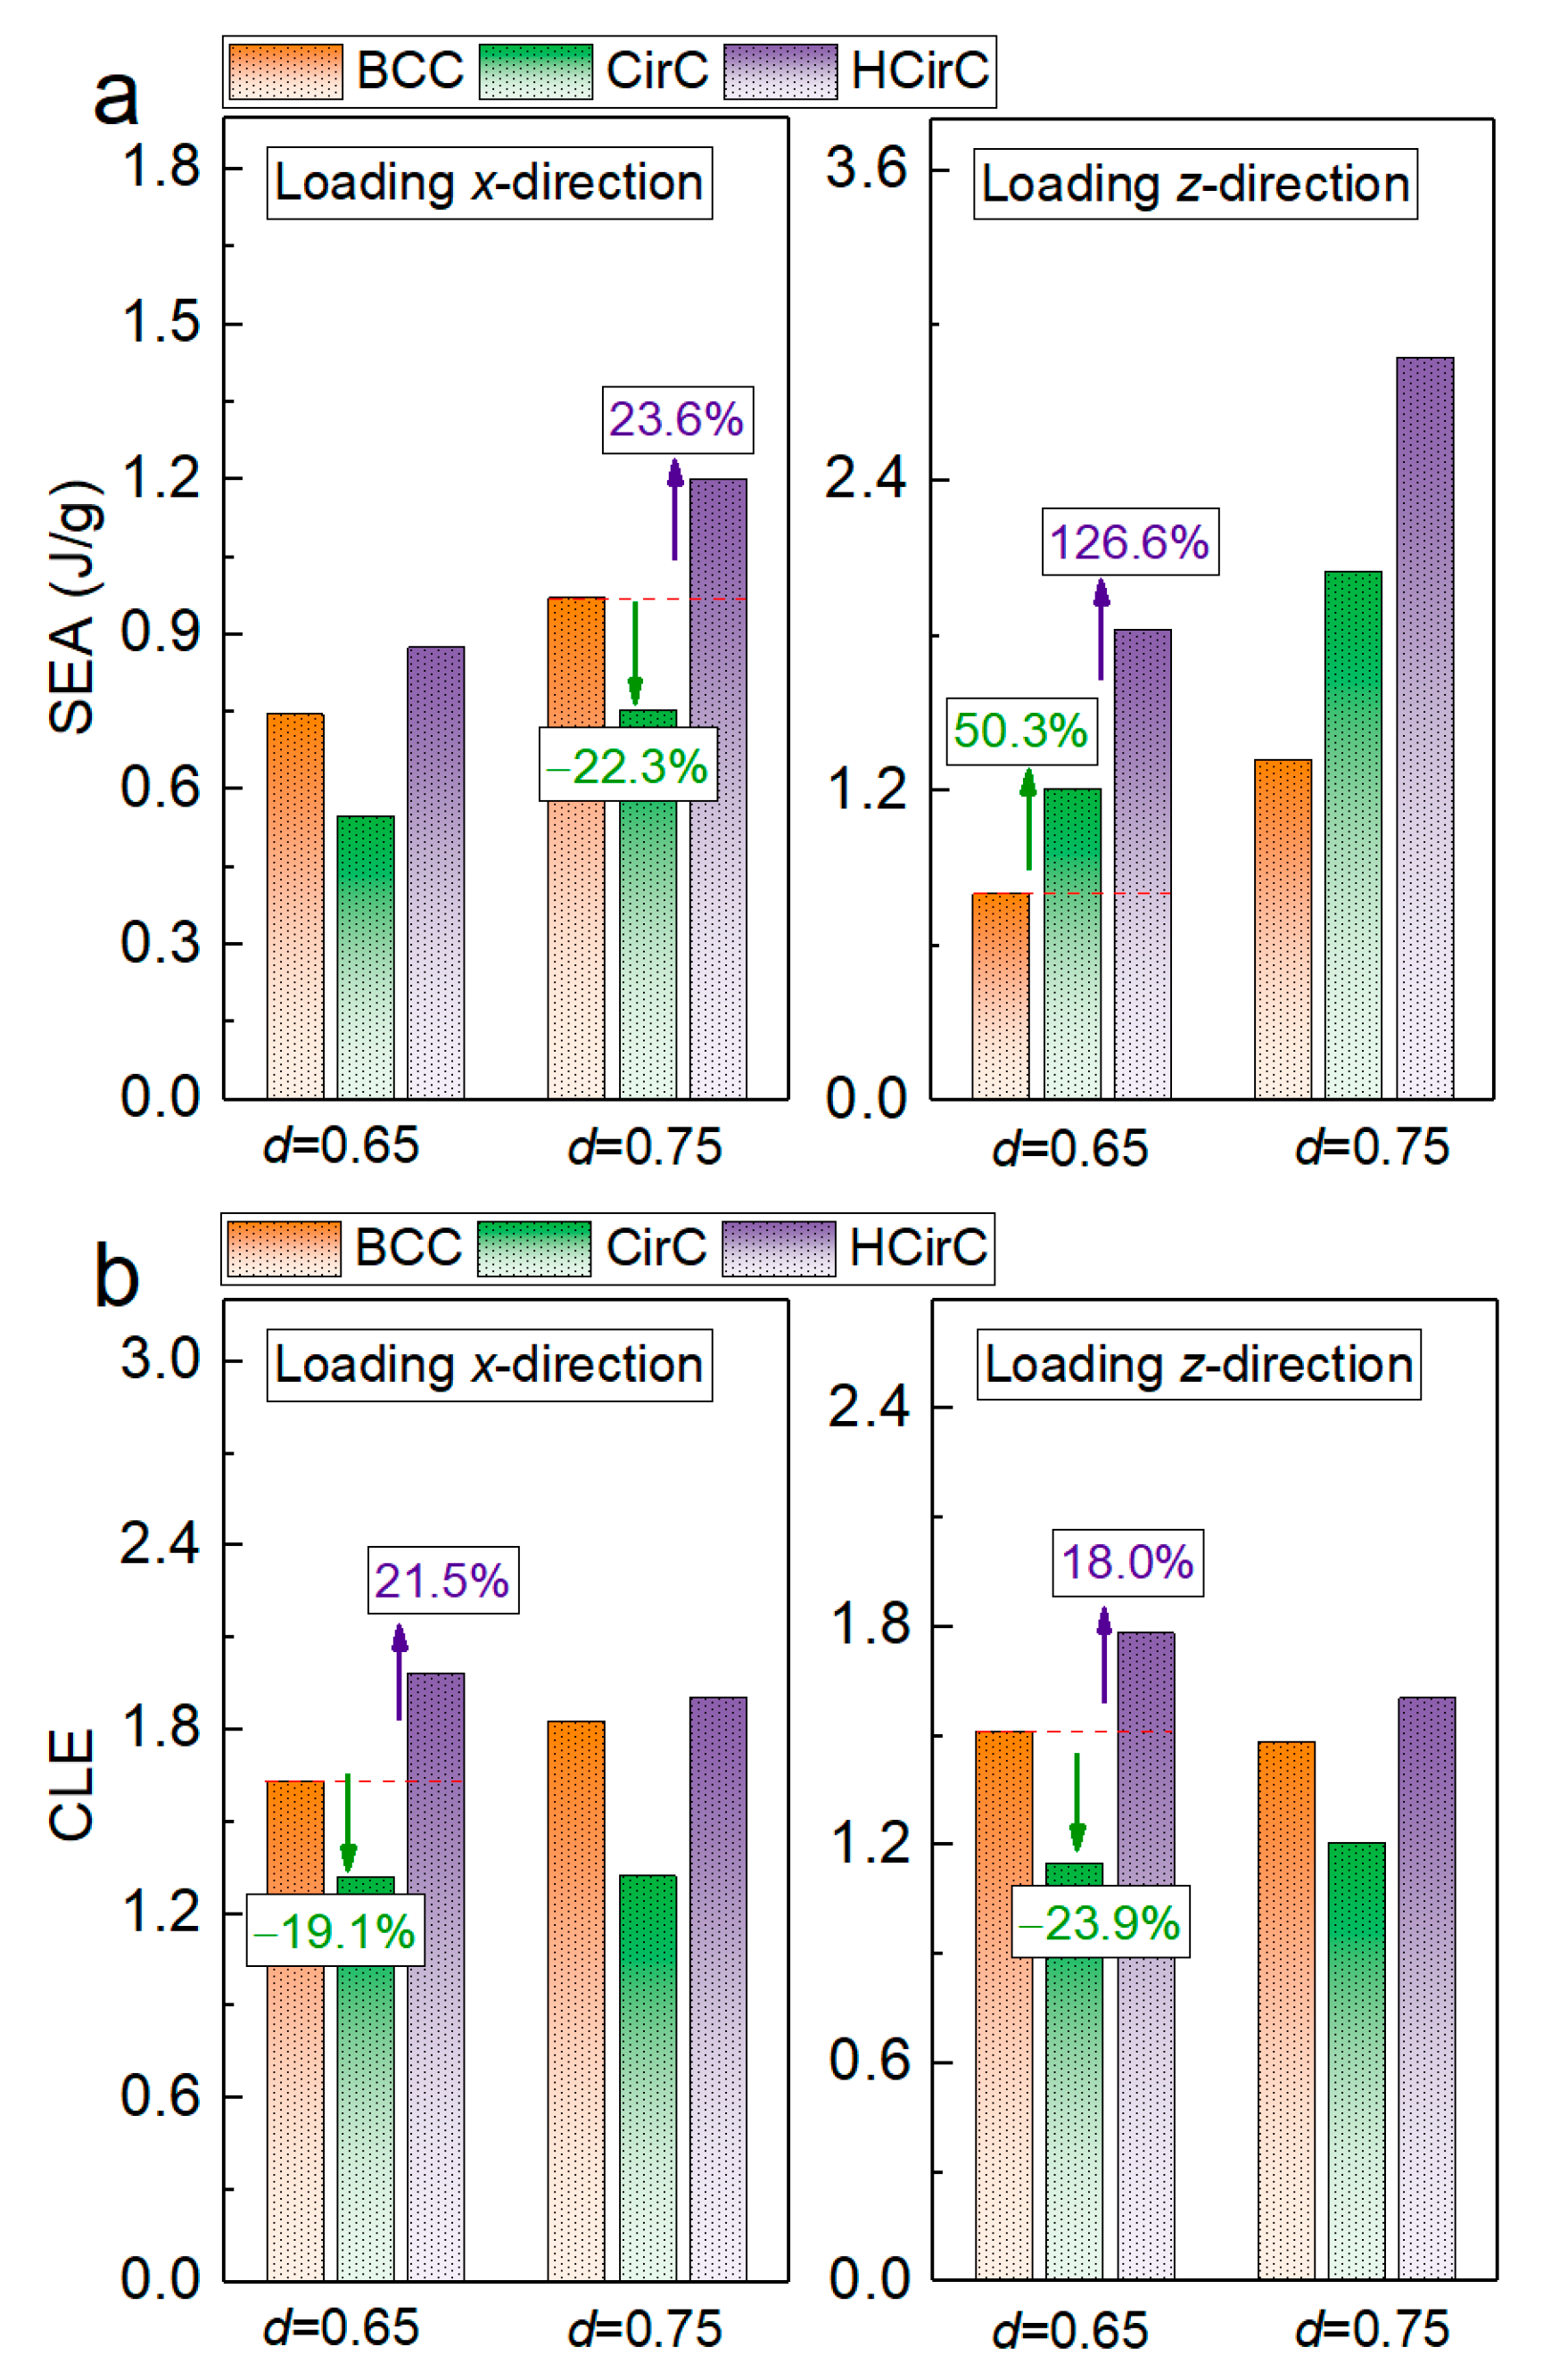
Table 5 listed the extracted SEA and CLE values of the BCC, CirC, and HCirC lattice structures. The results obtained from two different diameter values, 0.65 mm and 0.75 mm, are compared. Figure 18 shows the comparison of SEA and CLE values for the BCC, CirC, and HCirC lattice structures, respectively, in Figure 18a for SEA and in Figure 18b for CLE.
As can be seen in Table 5 and Figure 18 that the SEA and CLE values will increase with the increase in rod diameter. The HCirC lattice structure shows the highest SEA and CLE values compared to the CirC and BCC. For the HCirC lattice structure, the improvement values are 23.6% (along the x -axis) and 126.6% (along the z -axis) for SEA, and 21.5% (along the x -axis) and 18.0% (along the z-axis) for CLE, with respect to the BCC lattice. The SEA and CLE values of the CirC lattice structure are slightly lower than the BCC lattice, e.g., even a 22.3% decrease for SEA and 19.1% decrease for CLE with respect to the BCC lattice structure (when the compression direction is along the x -axis). Results indicate the hierarchical design of lattice structures will possess higher energy absorption capacity. In the study, the specific energy absorption values of different lattice structures were compared by dividing their mass values. The considered rod diameter values were relatively narrow. The comparison of the energy absorption capacity of different lattice structures with more wide mass ranges will be further investigated in our future work.

5. Conclusions

In this paper, the novel hierarchical circular-cell-based configuration of lattice structures was developed by taking inspiration from biological materials. The hierarchical circular lattice samples with 5 × 5 × 5 unit cells were fabricated through a DLP 3D printer, using the hard-tough resin material. The mechanical performance of the designed lattice structures was investigated by compression experiment and numerical analysis, and a potential mechanical enhancement mechanism was revealed. The main conclusions are summarized as follows: (1) the use of a circular-cell is able to alleviate the stress concentration induced by the intersection of straight struts; (2) the bio-inspired structural hierarchy and interaction between slave and master circular cells can improve the mechanical properties; (3) the parameters k and m are two geometrical variables that can be used to tailor the enhanced mechanical performance and energy absorption of the circular-cell lattices with structural hierarchy; (4) the optimized enhancement effect is achieved when k is 1.00 and m is 0.5, and the improvement values are 94.3% for specific stiffness, 15.0% for specific strength, and 59.7% for SEA, with respect to the CirC lattice with no structure hierarchy; (5) the designed hierarchical circular-cell lattice structure exhibits improved mechanical properties and energy absorption capacity with respect to the BCC lattice, and the maximum improvement values are 342.4% for specific stiffness, 13.0% for specific strength, 126.6% for specific energy absorption, and 18.0% for crash load efficiency.

Author Contributions

Conceptualization, M.W.; methodology, M.W.; software and validation, J.Z.; writing—original draft preparation, M.W.; writing—review and editing, W.W.; supervision, W.W.; project administration, W.W. All authors have read and agreed to the published version of the manuscript.

Funding

This project is supported by the Opening project fund of Materials Service Safety Assessment Facilities (No. MSAF-2021-107). The Key Research and Development Program of Shaanxi (Program Nos. 2020GY-252, 2021GY-277, 2022NY-211), the National Natural Science Foundation of China (No. 52005378), and the Fundamental Research Funds for the Central Universities (XJS210401). This work is supported by The Youth Innovation Team of Shaanxi Universities (Grant No. 2022-63).

Data Availability Statement

Not applicable.

Conflicts of Interest

The authors declare no conflict of interest.

References

  1. Fernandes, M.C.; Aizenberg, J.; Weaver, J.C.; Bertoldi, K. Mechanically robust lattices inspired by deep-sea glass sponges. Nat. Mater. 2021, 20, 237–241. [Google Scholar] [CrossRef] [PubMed]
  2. Surjadi, J.U.; Gao, L.; Du, H.; Li, X.; Xiong, X.; Fang, N.X.; Lu, Y. Mechanical Metamaterials and Their Engineering Applications. Adv. Eng. Mater. 2019, 21, 1800864. [Google Scholar] [CrossRef] [Green Version]
  3. Obadimu, S.O.; Kourousis, K.I. Compressive Behaviour of Additively Manufactured Lattice Structures: A Review. Aerospace 2021, 8, 207. [Google Scholar] [CrossRef]
  4. Di Caprio, F.; Acanfora, V.; Franchitti, S.; Sellitto, A.; Riccio, A. Hybrid Metal/Composite Lattice Structures: Design for Additive Manufacturing. Aerospace 2019, 6, 71. [Google Scholar] [CrossRef] [Green Version]
  5. Li, C.; Lei, H.; Liu, Y.; Zhang, X.; Xiong, J.; Zhou, H.; Fang, D. Crushing behavior of multi-layer metal lattice panel fabricated by selective laser melting. Int. J. Mech. Sci. 2018, 145, 389–399. [Google Scholar] [CrossRef]
  6. Sun, Z.P.; Guo, Y.B.; Shim, V.P.W. Characterisation and modeling of additively-manufactured polymeric hybrid lattice structures for energy absorption. Int. J. Mech. Sci. 2021, 191, 106101. [Google Scholar] [CrossRef]
  7. Tan, C.; Zou, J.; Li, S.; Jamshidi, P.; Abena, A.; Forsey, A.; Moat, R.J.; Essa, K.; Wang, M.; Zhou, K.; et al. Additive manufacturing of bio-inspired multi-scale hierarchically strengthened lattice structures. Int. J. Mach. Tools Manuf. 2021, 167, 103764. [Google Scholar] [CrossRef]
  8. Refai, K.; Montemurro, M.; Brugger, C.; Saintier, N. Determination of the effective elastic properties of titanium lattice structures. Mech. Adv. Mater. Struct. 2019, 27, 1966–1982. [Google Scholar] [CrossRef]
  9. Goh, G.D.; Agarwala, S.; Goh, G.L.; Dikshit, V.; Sing, S.L.; Yeong, W.Y. Additive manufacturing in unmanned aerial vehicles (UAVs): Challenges and potential. Aerosp. Sci. Technol. 2017, 63, 140–151. [Google Scholar] [CrossRef]
  10. Bici, M.; Brischetto, S.; Campana, F.; Ferro, C.G.; Seclì, C.; Varetti, S.; Maggiore, P.; Mazza, A. Development of a multifunctional panel for aerospace use through SLM additive manufacturing. Procedia CIRP 2018, 67, 215–220. [Google Scholar] [CrossRef]
  11. Alsaidi, B.; Joe, W.Y.; Akbar, M. Computational Analysis of 3D Lattice Structures for Skin in Real-Scale Camber Morphing Aircraft. Aerospace 2019, 6, 79. [Google Scholar] [CrossRef] [Green Version]
  12. Deng, H.; Zhao, J.; Wang, C. Leaf Vein-Inspired Bionic Design Method for Heat Exchanger Infilled with Graded Lattice Structure. Aerospace 2021, 8, 237. [Google Scholar] [CrossRef]
  13. Tancogne-Dejean, T.; Mohr, D. Stiffness and specific energy absorption of additively-manufactured metallic BCC metamaterials composed of tapered beams. Int. J. Mech. Sci. 2018, 141, 101–116. [Google Scholar] [CrossRef]
  14. Bai, L.; Gong, C.; Chen, X.; Sun, Y.; Xin, L.; Pu, H.; Peng, Y.; Luo, J. Mechanical properties and energy absorption capabilities of functionally graded lattice structures: Experiments and simulations. Int. J. Mech. Sci. 2020, 182, 105735. [Google Scholar] [CrossRef]
  15. Bonatti, C.; Mohr, D. Large deformation response of additively-manufactured FCC metamaterials: From octet truss lattices towards continuous shell mesostructures. Int. J. Plast. 2017, 92, 122–147. [Google Scholar] [CrossRef] [Green Version]
  16. Gorguluarslan, R.M.; Gungor, O.U.; Yıldız, S.; Erem, E. Energy absorption behavior of stiffness optimized graded lattice structures fabricated by material extrusion. Meccanica 2021, 56, 2825–2841. [Google Scholar] [CrossRef]
  17. Sun, Z.P.; Guo, Y.B.; Shim, V.P.W. Deformation and energy absorption characteristics of additively-manufactured polymeric lattice structures—Effects of cell topology and material anisotropy. Thin-Walled Struct. 2021, 169, 108420. [Google Scholar] [CrossRef]
  18. Osman, M.M.; Shazly, M.; El-Danaf, E.A.; Jamshidi, P.; Attallah, M.M. Compressive behavior of stretched and composite microlattice metamaterial for energy absorption applications. Compos. Part B Eng. 2020, 184, 107715. [Google Scholar] [CrossRef]
  19. Chen, X.Y.; Tan, H.F. An effective length model for octet lattice. Int. J. Mech. Sci. 2018, 140, 279–287. [Google Scholar] [CrossRef]
  20. Qi, D.; Yu, H.; Liu, M.; Huang, H.; Xu, S.; Xia, Y.; Qian, G.; Wu, W. Mechanical behaviors of SLM additive manufactured octet-truss and truncated-octahedron lattice structures with uniform and taper beams. Int. J. Mech. Sci. 2019, 163, 105091. [Google Scholar] [CrossRef]
  21. Chen, X.; Ji, Q.; Wei, J.; Tan, H.; Yu, J.; Zhang, P.; Laude, V.; Kadic, M. Light-weight shell-lattice metamaterials for mechanical shock absorption. Int. J. Mech. Sci. 2020, 169, 105288. [Google Scholar] [CrossRef]
  22. Li, P.; Yang, F.; Bian, Y.; Zhang, S.; Wang, L. Deformation pattern classification and energy absorption optimization of the eccentric body centered cubic lattice structures. Int. J. Mech. Sci. 2021, 212, 106813. [Google Scholar] [CrossRef]
  23. White, B.C.; Garland, A.; Alberdi, R.; Boyce, B.L. Interpenetrating lattices with enhanced mechanical functionality. Addit. Manuf. 2021, 38, 101741. [Google Scholar] [CrossRef]
  24. Zhou, H.; Cao, X.; Li, C.; Zhang, X.; Fan, H.; Lei, H.; Fang, D. Design of self-supporting lattices for additive manufacturing. J. Mech. Phys. Solids 2021, 148, 104298. [Google Scholar] [CrossRef]
  25. Alomar, Z.; Concli, F. Compressive behavior assessment of a newly developed circular cell-based lattice structure. Mater. Des. 2021, 205, 109716. [Google Scholar] [CrossRef]
  26. Lei, H.; Li, C.; Meng, J.; Zhou, H.; Liu, Y.; Zhang, X.; Wang, P.; Fang, D. Evaluation of compressive properties of SLM-fabricated multi-layer lattice structures by experimental test and μ-CT-based finite element analysis. Mater. Des. 2019, 169, 107685. [Google Scholar] [CrossRef]
  27. Bai, L.; Xu, Y.; Chen, X.; Xin, L.; Zhang, J.; Li, K.; Sun, Y. Improved mechanical properties and energy absorption of Ti6Al4V laser powder bed fusion lattice structures using curving lattice struts. Mater. Des. 2021, 211, 110140. [Google Scholar] [CrossRef]
  28. Novak, N.; Al-Ketan, O.; Krstulović-Opara, L.; Rowshan, R.; Abu Al-Rub, R.K.; Vesenjak, M.; Ren, Z. Quasi-static and dynamic compressive behaviour of sheet TPMS cellular structures. Compos. Struct. 2021, 266, 113801. [Google Scholar] [CrossRef]
  29. Sharma, D.; Hiremath, S.S. Additively manufactured mechanical metamaterials based on triply periodic minimal surfaces: Performance, challenges, and application. Mech. Adv. Mater. Struct. 2021, 1–31. [Google Scholar] [CrossRef]
  30. Ingrole, A.; Aguirre, T.G.; Fuller, L.; Donahue, S.W. Bioinspired energy absorbing material designs using additive manufacturing. J. Mech. Behav. Biomed. Mater. 2021, 119, 104518. [Google Scholar] [CrossRef]
  31. McKittrick, J.; Chen, P.Y.; Tombolato, L.; Novitskaya, E.E.; Trim, M.W.; Hirata, G.A.; Olevsky, E.A.; Horstemeyer, M.F.; Meyers, M.A. Energy absorbent natural materials and bioinspired design strategies: A review. Mater. Sci.Eng. C 2010, 30, 331–342. [Google Scholar] [CrossRef]
  32. Wegst, U.G.; Bai, H.; Saiz, E.; Tomsia, A.P.; Ritchie, R.O. Bioinspired structural materials. Nat. Mater. 2015, 14, 23–36. [Google Scholar] [CrossRef] [PubMed]
  33. Yin, S.; Guo, W.; Wang, H.; Huang, Y.; Yang, R.; Hu, Z.; Chen, D.; Xu, J.; Ritchie, R.O. Strong and Tough Bioinspired Additive-Manufactured Dual-Phase Mechanical Metamaterial Composites. J. Mech. Phys. Solids 2021, 149, 104341. [Google Scholar] [CrossRef]
  34. Wang, P.; Yang, F.; Lu, G.; Bian, Y.; Zhang, S.; Zheng, B.; Fan, H. Anisotropic compression behaviors of bio-inspired modified body-centered cubic lattices validated by additive manufacturing. Compos. Part B Eng. 2022, 234, 109724. [Google Scholar] [CrossRef]
  35. He, M.; Li, Y.; Yin, J.; Sun, Q.; Xiong, W.; Li, S.; Yang, L.; Hao, L. Compressive performance and fracture mechanism of bio-inspired heterogeneous glass sponge lattice structures manufactured by selective laser melting. Mater. Des. 2022, 214, 110396. [Google Scholar] [CrossRef]
  36. Tsang, H.H.; Tse, K.M.; Chan, K.Y.; Lu, G.; Lau, A.K.T. Energy absorption of muscle-inspired hierarchical structure: Experimental investigation. Compos. Struct. 2019, 226, 111250. [Google Scholar] [CrossRef]
  37. Duan, S.; Wu, S.; Hua, M.; Wu, D.; Yan, Y.; Zhu, X.; He, X. Tendon-inspired Anti-Freezing Tough Gels. iScience 2021, 24, 102989. [Google Scholar] [CrossRef]
  38. Kong, E.; Liu, D.; Guo, X.; Yang, W.; Sun, J.; Li, X.; Zhan, K.; Cui, D.; Lin, J.; Zhang, A. Anatomical and chemical characteristics associated with lodging resistance in wheat. Crop J. 2013, 1, 43–49. [Google Scholar] [CrossRef] [Green Version]
  39. Ha, N.S.; Pham, T.M.; Hao, H.; Lu, G. Energy absorption characteristics of bio-inspired hierarchical multi-cell square tubes under axial crushing. Int. J. Mech. Sci. 2021, 201, 106464. [Google Scholar] [CrossRef]
  40. Chen, Y.; Ma, Y.; Yin, Q.; Pan, F.; Cui, C.; Zhang, Z.; Liu, B. Advances in mechanics of hierarchical composite materials. Compos. Sci. Technol. 2021, 214, 108970. [Google Scholar] [CrossRef]
  41. Zhang, L.; Hu, Z.; Wang, M.Y.; Feih, S. Hierarchical sheet triply periodic minimal surface lattices: Design, geometric and mechanical performance. Mater. Des. 2021, 209, 109931. [Google Scholar] [CrossRef]
  42. Chen, Y.; Li, T.; Jia, Z.; Scarpa, F.; Yao, C.-W.; Wang, L. 3D printed hierarchical honeycombs with shape integrity under large compressive deformations. Mater. Des. 2018, 137, 226–234. [Google Scholar] [CrossRef] [Green Version]
  43. Yin, S.; Li, J.; Chen, H.; Ritchie, R.O.; Xu, J. Design and strengthening mechanisms in hierarchical architected materials processed using additive manufacturing. Int. J. Mech. Sci. 2018, 149, 150–163. [Google Scholar] [CrossRef]
  44. Yin, S.; Chen, H.; Li, J.; Yu, T.X.; Xu, J. Effects of architecture level on mechanical properties of hierarchical lattice materials. Int. J. Mech. Sci. 2019, 157–158, 282–292. [Google Scholar] [CrossRef]
  45. Gong, C.; Bai, Z.; Wang, Y.; Zhang, L. On the crashworthiness performance of novel hierarchical multi-cell tubes under axial loading. Int. J. Mech. Sci. 2021, 206, 106599. [Google Scholar] [CrossRef]
  46. Tsang, H.H.; Raza, S. Impact energy absorption of bio-inspired tubular sections with structural hierarchy. Compos. Struct. 2018, 195, 199–210. [Google Scholar] [CrossRef]
  47. Wang, Z.; Zhou, Y.; Wang, X.; Wei, K. Compression behavior of strut-reinforced hierarchical lattice—Experiment and simulation. Int. J. Mech. Sci. 2021, 210, 106749. [Google Scholar] [CrossRef]
  48. Lei, H.; Li, C.; Zhang, X.; Wang, P.; Zhou, H.; Zhao, Z.; Fang, D. Deformation behavior of heterogeneous multi-morphology lattice core hybrid structures. Addit. Manuf. 2021, 37, 101674. [Google Scholar] [CrossRef]
  49. Liu, C.; Lertthanasarn, J.; Pham, M.-S. The origin of the boundary strengthening in polycrystal-inspired architected materials. Nat. Commun. 2021, 12, 4600. [Google Scholar] [CrossRef]
  50. Yang, H.; Cao, X.; Liao, B.; Wang, G.; Huang, Z.; Li, Y. Mechanical properties of bio-molecular inspired MnL2n cage-lattices: Simulations & experiments. Mater. Sci.Eng. A 2021, 826, 141991. [Google Scholar] [CrossRef]
  51. ABAQUS. Analysis User’s Manual Version 6.9; Software for Finite Element Analysis and Computer-Aided Engineering; ABAQUS Inc.: Providence, RI, USA, 2009.
  52. Bai, L.; Gong, C.; Chen, X.; Zheng, J.; Yang, J.; Li, K.; Sun, Y. Heterogeneous compressive responses of additively manufactured Ti-6Al-4V lattice structures by varying geometric parameters of cells. Int. J. Mech. Sci. 2021, 214, 106922. [Google Scholar] [CrossRef]
  53. Gibson, L.J.; Ashby, M.F. Cellular solids: Structure & properties, Oxford: Pergamon Press. Adv. Polym. Technol. 1989, 9, 165–166. [Google Scholar]
  54. Wang, X.; Zhu, L.; Sun, L.; Li, N. Optimization of graded filleted lattice structures subject to yield and buckling constraints. Mater. Des. 2021, 206, 109746. [Google Scholar] [CrossRef]
  55. Li, Q.M.; Magkiriadis, I.; Harrigan, J.J. Compressive strain at the onset of densification of cellular solids. J. Cell. Plast. 2016, 42, 371–392. [Google Scholar] [CrossRef]
Figure 1. The basic design strategy for the hierarchical circular-cell lattice structure: (a) BCC and CirC; (b) HCirC; (c) front view of HCirC.
Aerospace 09 00786 g001
Figure 2. Effect of parameters k and m on the unit cell configuration of the hierarchical circular-cell lattice structure (HCirC): (a) k is fixed at 1.0, and m is varied from 0.0 to 1.0; (b) m is fixed at 0.5, and k is varied from 0.0 to 1.0.
Aerospace 09 00786 g002
Figure 3. The designed lattice structures of BCC, CirC, and HCirC: (a) geometrical models; (b) samples fabricated by the 3D printing technique.
Aerospace 09 00786 g003
Figure 4. The stress–strain curves of the resin material and dimension of the tensile specimen.
Aerospace 09 00786 g004
Figure 5. The in situ experiment platform for compression tests.
Aerospace 09 00786 g005
Figure 6. The FE model, geometry coordinates, boundary constraints, and local meshes.
Aerospace 09 00786 g006
Figure 7. Comparison of compression stress–strain curves between experiment and simulation, and the comparison between internal energy and kinetic energy during the simulation process.
Aerospace 09 00786 g007
Figure 8. The compression curves of lattice structures BCC, CirC, and HCirC: in (a) for compression along the x-axis; and in (b) for compression along the z-axis.
Aerospace 09 00786 g008
Figure 9. The compression mechanical properties of lattice structures BCC, CirC, and HCirC: (ad) compression along the x-axis; (eh) compression along the z-axis.
Aerospace 09 00786 g009
Figure 10. The compression behaviors of BCC, CirC, and HCirC (in XZ-views, and the compression direction is along the x-axis).
Aerospace 09 00786 g010
Figure 11. The compression behaviors of BCC, CirC, and HCirC (in XY-views, and the compression direction is along the x -axis).
Aerospace 09 00786 g011
Figure 12. The compression behaviors of BCC, CirC, and HCirC (in XZ-views, and the compression direction is along the z-axis).
Aerospace 09 00786 g012
Figure 13. The relationship between relative density and relative stiffness for the BCC, CirC, and HCirC is along two loading directions: (a) compression direction is along the x-axis; (b) compression direction is along the z-axis.
Aerospace 09 00786 g013
Figure 14. Local views of the stress distribution of lattice structures BCC, CirC, and HCirC: (a) compression along the x-axis; (b) compression along the z-axis.
Aerospace 09 00786 g014
Figure 15. Effect of parameter k on the mechanical performance of hierarchical lattice structure HCirC: (a) stress–strain curves; (b) specific stiffness; (c) specific strength; (d) SEA.
Aerospace 09 00786 g015
Figure 16. Effect of parameter m on the mechanical performance of the hierarchical lattice structure HCirC: (a) stress–strain curves; (b) specific stiffness; (c) specific strength; (d) SEA.
Aerospace 09 00786 g016
Figure 17. The comparison of compression stress, energy efficiency, and SEA curves along different compression directions: in (a) for BCC; in (b) and (c) for CirC; in (d) and (e) for HCirC.
Aerospace 09 00786 g017
Figure 18. The energy absorption capacity of lattice structures BCC, CirC, and HCirC: in (a) for SEA and in (b) for CLE.
Aerospace 09 00786 g018
Table 1. The geometrical parameters used in 3D printing and the relative density of the fabricated lattice structures BCC, CirC, and HCirC.
Group NumberSpecimenDimensionL (mm)d (mm)Relative Density
TheoreticalExperiment
1BCC5 × 5 × 57.50.600.034820.03461
CirC0.034440.03457
HCirC0.059820.06008
2BCC5 × 5 × 57.50.650.040870.04035
CirC0.038500.03811
HCirC0.071200.07037
3BCC5 × 5 × 57.50.700.047400.04659
CirC0.043360.04375
HCirC0.082200.08299
4BCC5 × 5 × 57.50.750.054410.05267
CirC0.049020.04889
HCirC0.092840.09255
Table 2. Compression mechanical properties of lattice structures BCC, CirC, and HCirC.
Lattice StructuresStiffness
(MPa)
Strength
(MPa)
Specific Stiffness (MPa·cm3/g)Specific Strength (MPa·cm3/g)
BCC0.31900.031836.40180.6387
Compression along x-direction
CirC0.31450.026276.68210.5582
HCirC1.12830.0557712.98240.6417
Compression along z-direction
CirC1.00190.0646921.28901.3746
HCirC2.75260.156931.67321.8054
Table 3. Fitting results of the relationship in Equation (4).
Lattice Structures C x n x C z n z
BCC0.1982.120--
CirC0.8372.5377.8422.909
HCirC0.1462.0670.4172.066
Table 4. The geometrical parameters of hierarchical lattice HCirC with different m and k values, and the mass of the fabricated samples.
Lattice Type m k DimensionL (mm) d M   ( mm ) Relative Density
HCirC0.500.005 × 5 × 5 7.50.650.03811
0.600.04833
0.800.05836
1.000.07037
HCirC0.001.005 × 5 × 5 7.50.650.05592
0.250.06931
0.500.07037
1.000.03811
Table 5. Comparison of the energy absorption properties of lattice structures BCC, CirC, and HCirC.
Lattice Structures d = 0.65 d = 0.75
SEA (J/g)BCC0.74620.9719
Compression along x-direction
CirC0.54780.7555
HCirC0.87511.2015
Compression along z-direction
CirC1.20932.0497
HCirC1.82372.8788
CLEBCC1.63411.8284
Compression along x-direction
CirC1.32231.3246
HCirC1.98591.9052
Compression along z-direction
CirC1.15111.2087
HCirC1.78431.6051
Publisher’s Note: MDPI stays neutral with regard to jurisdictional claims in published maps and institutional affiliations.