Article

A Leakage Rate Model for Metal-to-Metal Seals Based on the Fractal Theory of Porous Medium

1
College of Aeronautical Engineering, Civil Aviation University of China, Tianjin 300300, China
2
Engineering Techniques Training Center, Civil Aviation University of China, Tianjin 300300, China
3
Tianjin Bool Technology Co., Ltd., Tianjin 300392, China
*
Author to whom correspondence should be addressed.
Aerospace 2022, 9(12), 779; https://doi.org/10.3390/aerospace9120779
Submission received: 10 September 2022 / Revised: 24 November 2022 / Accepted: 29 November 2022 / Published: 1 December 2022
(This article belongs to the Special Issue State Monitoring and Health Management of Complex Equipment)

Abstract

:
Due to the complexity of sealing surface topography, it is difficult to take the surface topography into consideration when building a leakage rate model theoretically. Therefore, a theoretical model for estimating the leakage rate of metal-to-metal seals based on the fractal theory of porous medium, which can objectively reflect the influence of sealing surface topography from a microscopic perspective, is proposed in the present work. In the approach, fractal parameters are adopted to characterize the sealing surface. The sealing interface is supposed to be a porous medium space and the intrinsic parameters are obtained through rigorous theoretical derivation. The results show that the topography parameters of the sealing surface have a significant effect on the intrinsic parameters of the pore space and lead to a significant influence on the leakage rate of metal-to-metal seals. Specifically, the smoother the sealing surface, the lower the leakage rate of the metal-to-metal seal. Moreover, the leakage rate decreases with an increase in the contact pressure, and, if the fluid pressure difference is too large, the sealing performance will be seriously reduced. The proposed model provides a novel way to calculate the leakage rate of metal-to-metal seals.

1. Introduction

The aero-engine external piping system is mainly used for transmission of fuel, lubricating oil, hydraulic oil and air and is an important part of the external accessory device of the aero-engine [1,2]. Hundreds of pipelines are installed on an aero-engine. Due to their heat resistance and corrosion resistance, tube connectors in the form of metal-to-metal seals (i.e., no dedicated sealing component used) are often used for the connection between pipelines [3]. Tube connectors are the weakest link of the pipeline system’s sealing performance, and tube connector sealing failure has become one of the pipeline system’s main failure modes [3,4,5]. Once the metal-to-metal seals are out of work, leakage will be formed. Both stability and reliability of the aero-engine will be affected.
Metal-to-metal seals belong to static metal seals, which are typically used whenever the working conditions in terms of temperature and pressure are so severe that commonly used non-metal seals cannot be used [6,7]. This includes cryogenic applications, nuclear power, the petroleum industry as well as the aerospace industry [8,9,10,11,12]. Numerous studies were conducted to understand sealing and especially leakage [13,14]. However, a large number of practices have proved that leakage still exists with metal-to-metal seals in some industrial applications [11,15]. Leakage amount or leakage rate is an important index to evaluate the sealing performance of metal-to-metal seals [16]. In recent years, fundamental research about metal-to-metal seals has made considerable progress, one aspect being calculation of leakage rate from the metallic sealing interface, which is very important for their applications [7,17]. Predicting the leakage rate in the metal-to-metal sealing interface reasonably would not only be essential to ensure high product quality and reduce losses but also of great significance for the design of seal structures [11,12,18,19]. Thus, predicting the leakage rate has been the focus of extensive research by scholars on static metal seals [20]. However, the problem of leakage rate prediction remains [21].
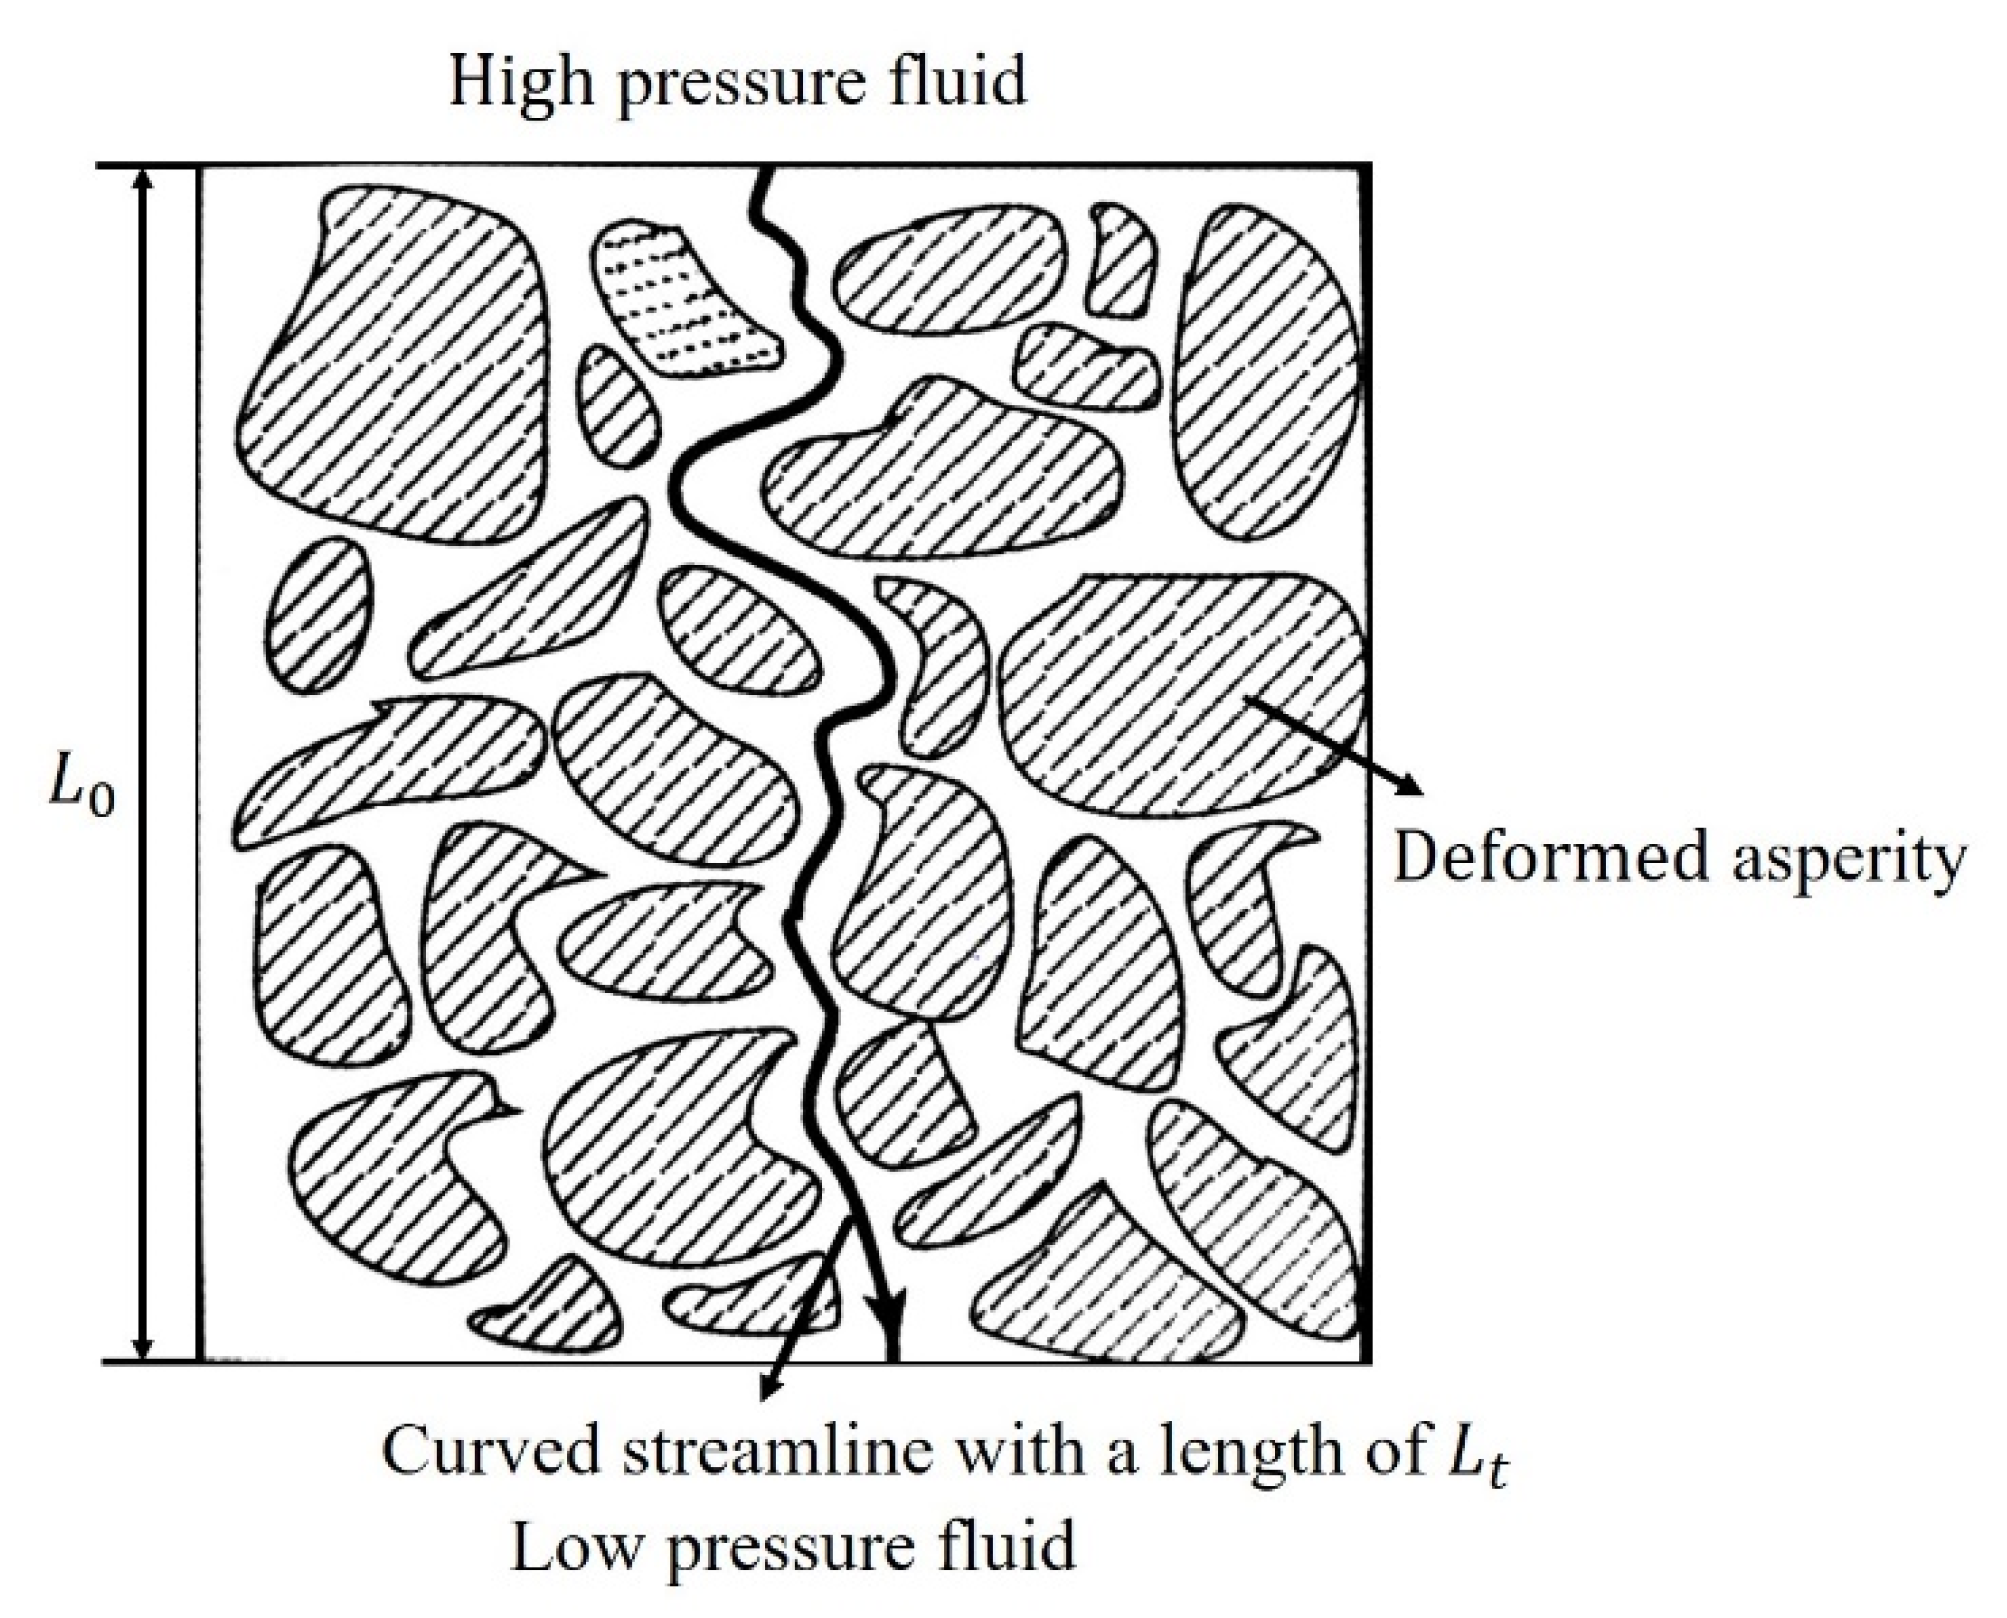
A metal-to-metal seal is performed by direct-metal/metal-tight contact of rough surfaces, as shown in Figure 1. Although simple in structure, the sealing behavior of a metal-to-metal seal is affected by a variety of factors [9,10,11,20,22], among which surface topography, which is usually produced by the machining process, is thought to be one of the most important factors that affect the leakage rate of metal-to-metal seals [23,24,25] and is the focus of research for leakage and sealing performance [11,15]. Therefore, surface topography requires significant focus in the study of the leakage rate model generally [12,17]. However, the accurate leakage rate is difficult to predict due to the complexity of sealing surface topography [6,7,15,22]. Some researchers have calculated the leakage rate of seals without considering the surface topography [7]. Although some scholars have considered the effect of surface topography on the research of leakage rate prediction, they tend to simplify greatly the characterizations of sealing surface topography [6,7,12], which results in a large difference between the real and the calculated leakage rates. Moreover, because of limitations in measurement technology, the interface topography after assembly is not directly measurable. Thus, with the limitations regarding surface characterization and measurement technology, the performance of surface topography on leakage rate prediction in a metal-to-metal seal is still in its infancy [11,15].
Since leakage rate prediction of metal-to-metal seals involves knowledge of the resulting geometry of contact between the two sealing surfaces, calculating the leakage rate from the metallic sealing interface of metal-to-metal seals involves two steps. First, the surface topography should be obtained and the elastoplastic deformation of the surfaces in contact under given preloads should be computed. Second, the intrinsic parameters of the sealing region that are determined by the contact behavior of the two surfaces should be obtained, and the leakage must be estimated by use of the correct flow model depending on the leaking fluid and the flow regime [26]. In terms of the first step, there are many ways to study the contact behavior of two rough surfaces. These methods mainly include the numerical contact model, statistical contact model, and fractal contact model. The advantage of the numerical contact model is that it can obtain simulation results that are closer to the actual situation. However, it might require, in general, a large and dense grid, and the computational efficiency might be unacceptable [6]. The GW contact model proposed by Greenwood and Williamson [27] in 1966 is a typical representative of the statistical contact model, and subsequent scholars have improved the GW model from different aspects [28,29]. The advantage of the statistical contact model is that its expression is simple and clear, which greatly simplifies the derivation of the contact equation between rough surfaces and is conducive to rapid contact analysis between rough surfaces. The MB model established by Majumdar and Bhushan [30] in 1991 is representative of the fractal contact model, which replaces the traditional statistical parameters with fractal parameters so that the multi-scale characteristics of rough surfaces can be preserved. Subsequent contact models based on fractal theory are mostly developed based on the MB model [31,32,33].
In terms of the second step, there have been some previous attempts to construct formulas to predict leakage rates. For example, Robbe-Valloire and Prat [26] proposed a waviness-motifs-based model to analyze the surface and to calculate the leak rate. Pérez-Ràfols et al. [6] proposed a numerical model to calculate the leakage on metal-to-metal seals. However, they all simplified the characterizations of the sealing surface topography and the leakage channels to various degrees, which consequently caused large error between the calculated and the actual leak rates. Some researchers establish the leakage rate model based on homogenization theory. In this kind of model, by considering the influence of rough peaks on the fluid in the gap, the flow transport equation was modified by introducing flow factors. Vallet et al. [34] described the microscopic flow field by the Stokes and Fick equations and calculated the macroscopic permeability and diffusion by the volume-average method. Etsion and Front [35] calculated the leak rate of the static sealing surface by introducing a flow factor method. Moreover, Sahlin et al. [36,37] presented a model where the contact was treated as elastic–perfectly plastic and the flow was computed in a smaller cell using the homogenization technique. However, the gaps and leakage were small in the static sealing system, which failed to form a complete flow state. Therefore, the calculation by introduction of the flow factor was inaccurate.
From the percolation theory point of view, the contact of two rough surfaces is incomplete. Noncontact areas communicate with each other to form leakage channels. The leakage trend is determined by the parameter called percolation threshold. Bottiglione et al. [38,39] presented a theoretical approach to estimate the fluid leakage mechanism in flat seals by making use of percolation theory and the theory of contact mechanics. Sun et al. [40] developed a leakage channel model from the point of asperity contact of the sealing interface based on percolation theory. Establishment of the leakage channel model based on percolation theory makes it possible to study the fluid flow in the disordered interface of the metallic surface. However, calculation of the leakage rate is mainly focused on the leakage at a single percolation point, while the actual leakage passage may have multiple percolation points and different bifurcation forms, so the calculated results were usually smaller than the measured value [41].
In recent years, fractal correlation theory of porous medium has received the attention of researchers because it can effectively deal with the random disordered flow in complex objects [24,41,42]. In the field of porous medium theory, the sealing interface was treated as a porous medium space. The contact interface of a graphite seal was modeled by Jolly and Marchand as a thin porous region that allows the flow of fluid [21]. This model was used to compare leaks of different gases through the contact interface at a given contact load. Kambhammettu et al. [24] obtained a model to estimate the flow of fluids through metal–elastomer interfaces using porous medium theory in conjunction with Darcy’s law. By studying the structure of the seal-on-seal structure and the micromorphology characteristics of seal contact faces, a leakage model is presented by Liao et al. [42] based on the porous medium theory. Lin et al. [19] built a sealing micro-leakage mechanism model based on porous medium theory that can predict the leakage rate quantitatively. However, most of the existing leakage rate prediction models based on porous medium theory are aimed at non-metallic sealing materials, such as rubber and graphite. Little work based on porous medium theory is found regarding metal-to-metal seals. Moreover, contact pressure and surface topography affect the leakage rate in the metal-to-metal seals significantly, but there is a lack of theoretical explanation for the relationship between contact pressure and leakage rate, as well as the relationship between surface topography and leakage rate.
The key problem is that there is no appropriate leakage mechanism model for metal-to-metal seals. Most of the existing leakage rate models of metal-to-metal seals are semiempirical; that is, there are regression coefficients in the model that have unclear physical meanings and need to be fitted with experimental or numerical simulation results. The purpose of this paper is to introduce a leakage rate model for metal-to-metal seals based on the fractal theory of porous medium in combination with the rough surface contact model [43] previously published by the authors. The most significant difference between the proposed model and the existing models based on the fractal theory of porous medium is that the sealing surface topography parameters are contained in the proposed model; that is, the influence of sealing surface topography on the leakage rate of the metal-to-metal seals is considered by the proposed model. Moreover, novel methods for calculating porosity and maximum and minimum leakage microchannel diameters are proposed in the present work. All the formulas in the proposed model are obtained by theoretical derivation so that the leakage rate prediction and calculation method are independent of experimental regression parameters. Therefore, the proposed model can be used for theoretical analysis of the effect of contact pressure and surface topography on the intrinsic parameters of the porous medium (fractal dimension of pore space, porosity, maximum and minimum leakage microchannel diameters, tortuosity, etc.) and then the effect of contact pressure and surface topography on the leakage rate. Thus, the proposed leakage rate model can reflect the influence of surface topography and contact pressure on the sealing performance of metal-to-metal seals more reasonably. It is expected that the present work can provide a new method to estimate and predict the leakage rate of metal-to-metal seals quantificationally and reveal the leakage mechanism effectively.

2. Materials and Methods

The porous medium refers to the solid medium containing a large number of irregular pores or voids [41]. According to its structural characteristics, the sealing interface of the metal-to-metal seal can be regarded as a porous medium space [44,45,46]. Therefore, the vital step in establishing the leakage rate model based on the fractal theory of porous medium is to estimate the intrinsic parameters of the porous medium space. Since the formation of the porous medium space (i.e., the sealing interface) mainly depends on the topography and the contact state of the sealing surfaces, as a matter of course, before estimating the microstructural parameters of the porous medium space, the sealing surface topography should be quantitatively described, and the contact model of the sealing surfaces should be established to determine its contact state.

2.1. Simulation of Rough Surfaces

In the present work, the fractal parameters are adopted to describe the sealing surface and the Weierstrass–Mandelbrot (WM) function is used to reconstruct the sealing surface. The WM function is widely used to generate rough surface contours due to its inherent properties, which include continuity, non-differentiation and statistical self-affinity [30,47]. The expression of the WM function is as follows [48,49]
z ( x ) = G D 1 n = n min n max cos ( 2 π γ n x ) γ ( 2 D ) n , 1 < D < 2 , γ > 1
where z ( x ) denotes the rough surface’s profile height. The rough surface measurement coordinate is denoted by the letter x . The fractal dimension is denoted by the symbol D . G is the characteristic length scale of the rough surface. γ n determines the discrete frequency spectrum of the surface roughness and corresponds to the reciprocal of the roughness wavelength as γ n = 1 / λ n . n min and n max correspond to the low cut-off frequency level and the high cut-off frequency level of the profile, respectively. It is found that γ = 1.5 is a suitable value for high spectral density and phase randomization [30]. The expression of the 3D WM function is [32]
z ( x , y ) = L ( G L ) D s 2 ( ln γ M ) 1 2 m = 1 M n = n min n max γ ( D s 3 ) n × { cos ϕ m , n cos [ 2 π γ n ( x 2 + y 2 ) 1 2 L × cos ( arctan ( y x ) π m M ) + ϕ m , n ] }
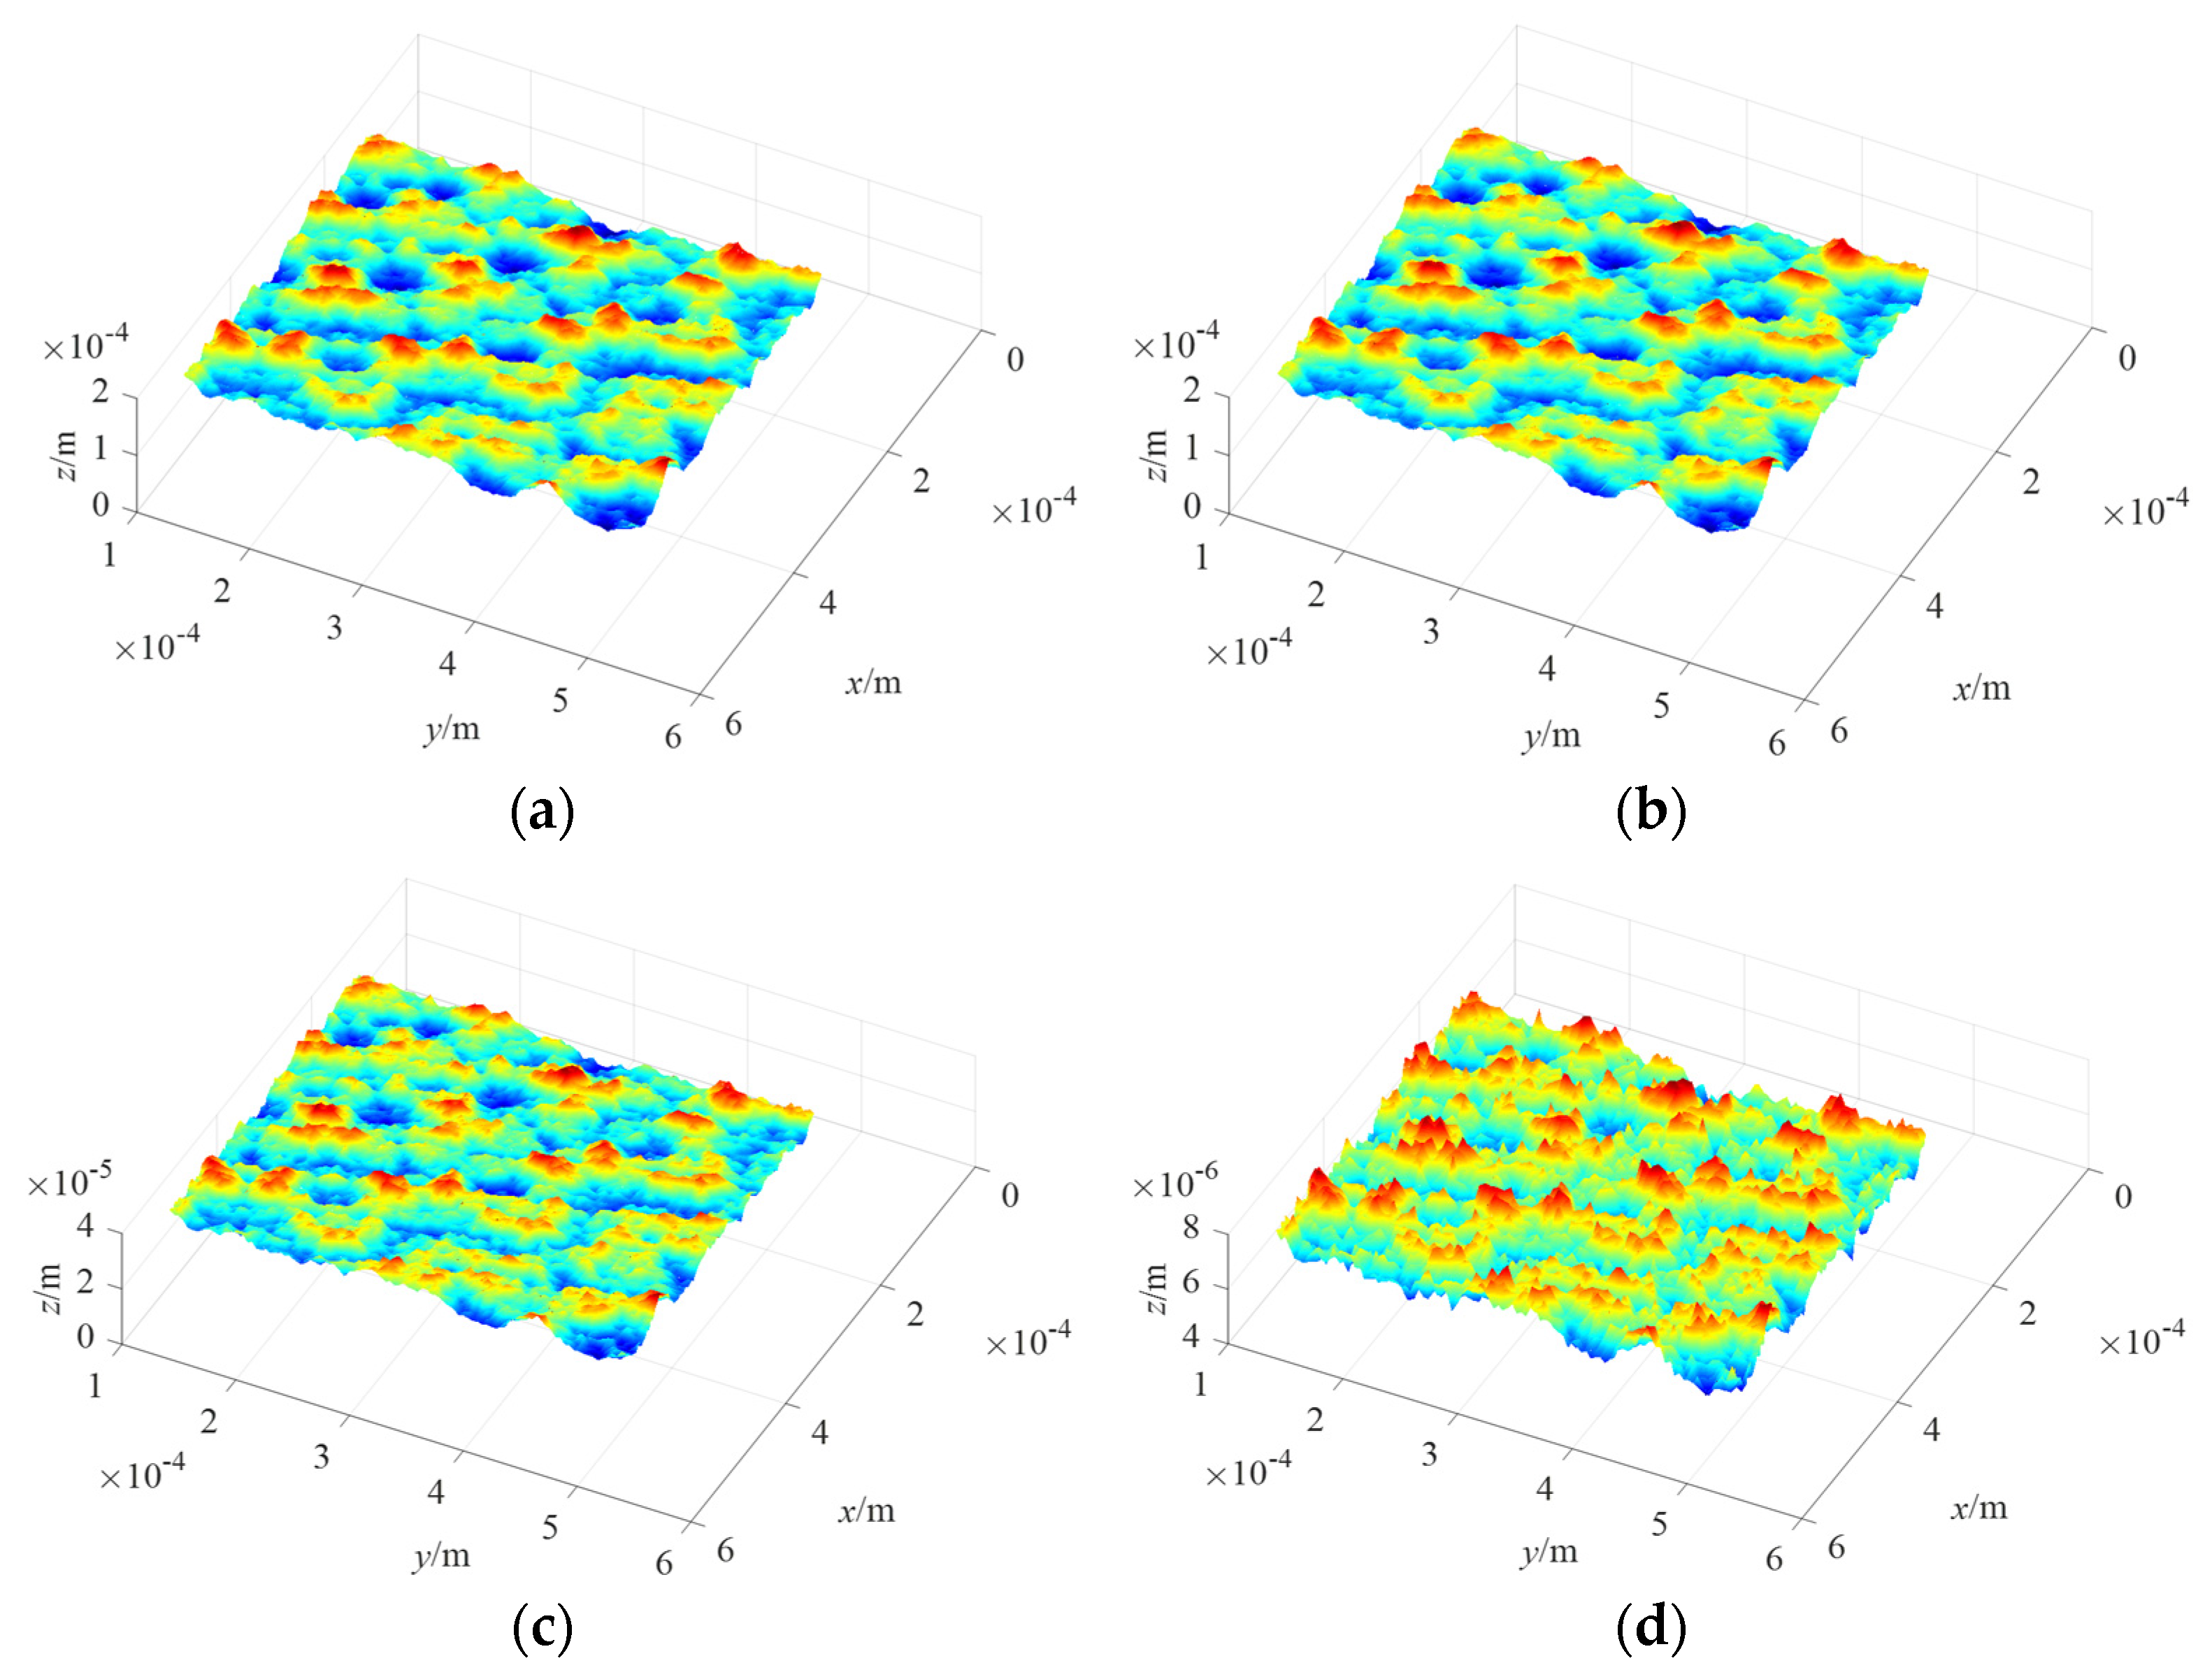
where D s represents the fractal dimension value of the 3D rough surface. L is the sampling length. M is the number of superposed ridges used to simulate the surfaces. ϕ m , n is the random phase with a value range of [0, 2 π ]. The rough surfaces generated by the 3D WM function are shown in Figure 2, and the parameters are as follows: D s = 2.2, 2.4, 2.6, 2.8, G = 1 × 10 8 m, γ = 1.5 , L = 1 × 10 4 m, L s = 1 × 10 8 m, M = 10 . It can be seen from Figure 2 that the structural complexity and the richness of details of the surface topography increase with the increase in D s value. Moreover, the larger the D s value, the smaller the fluctuation of the surface height.
Figure 3 depicts the generated rough surfaces with varying G values. The parameters are set as: D s = 2.6, G = 1 × 10 8 m, 1 × 10 7 m, 1 × 10 6 m, 1 × 10 5 m, γ = 1.5 , L = 1 × 10 4 m, L s = 1 × 10 8 m, M = 10 . Figure 3 indicates that the value of G only affects the undulation degree of the rough surface, and the height of the asperities on the rough surface increases with the increase in G ; i.e., the larger the G value, the rougher the surface.
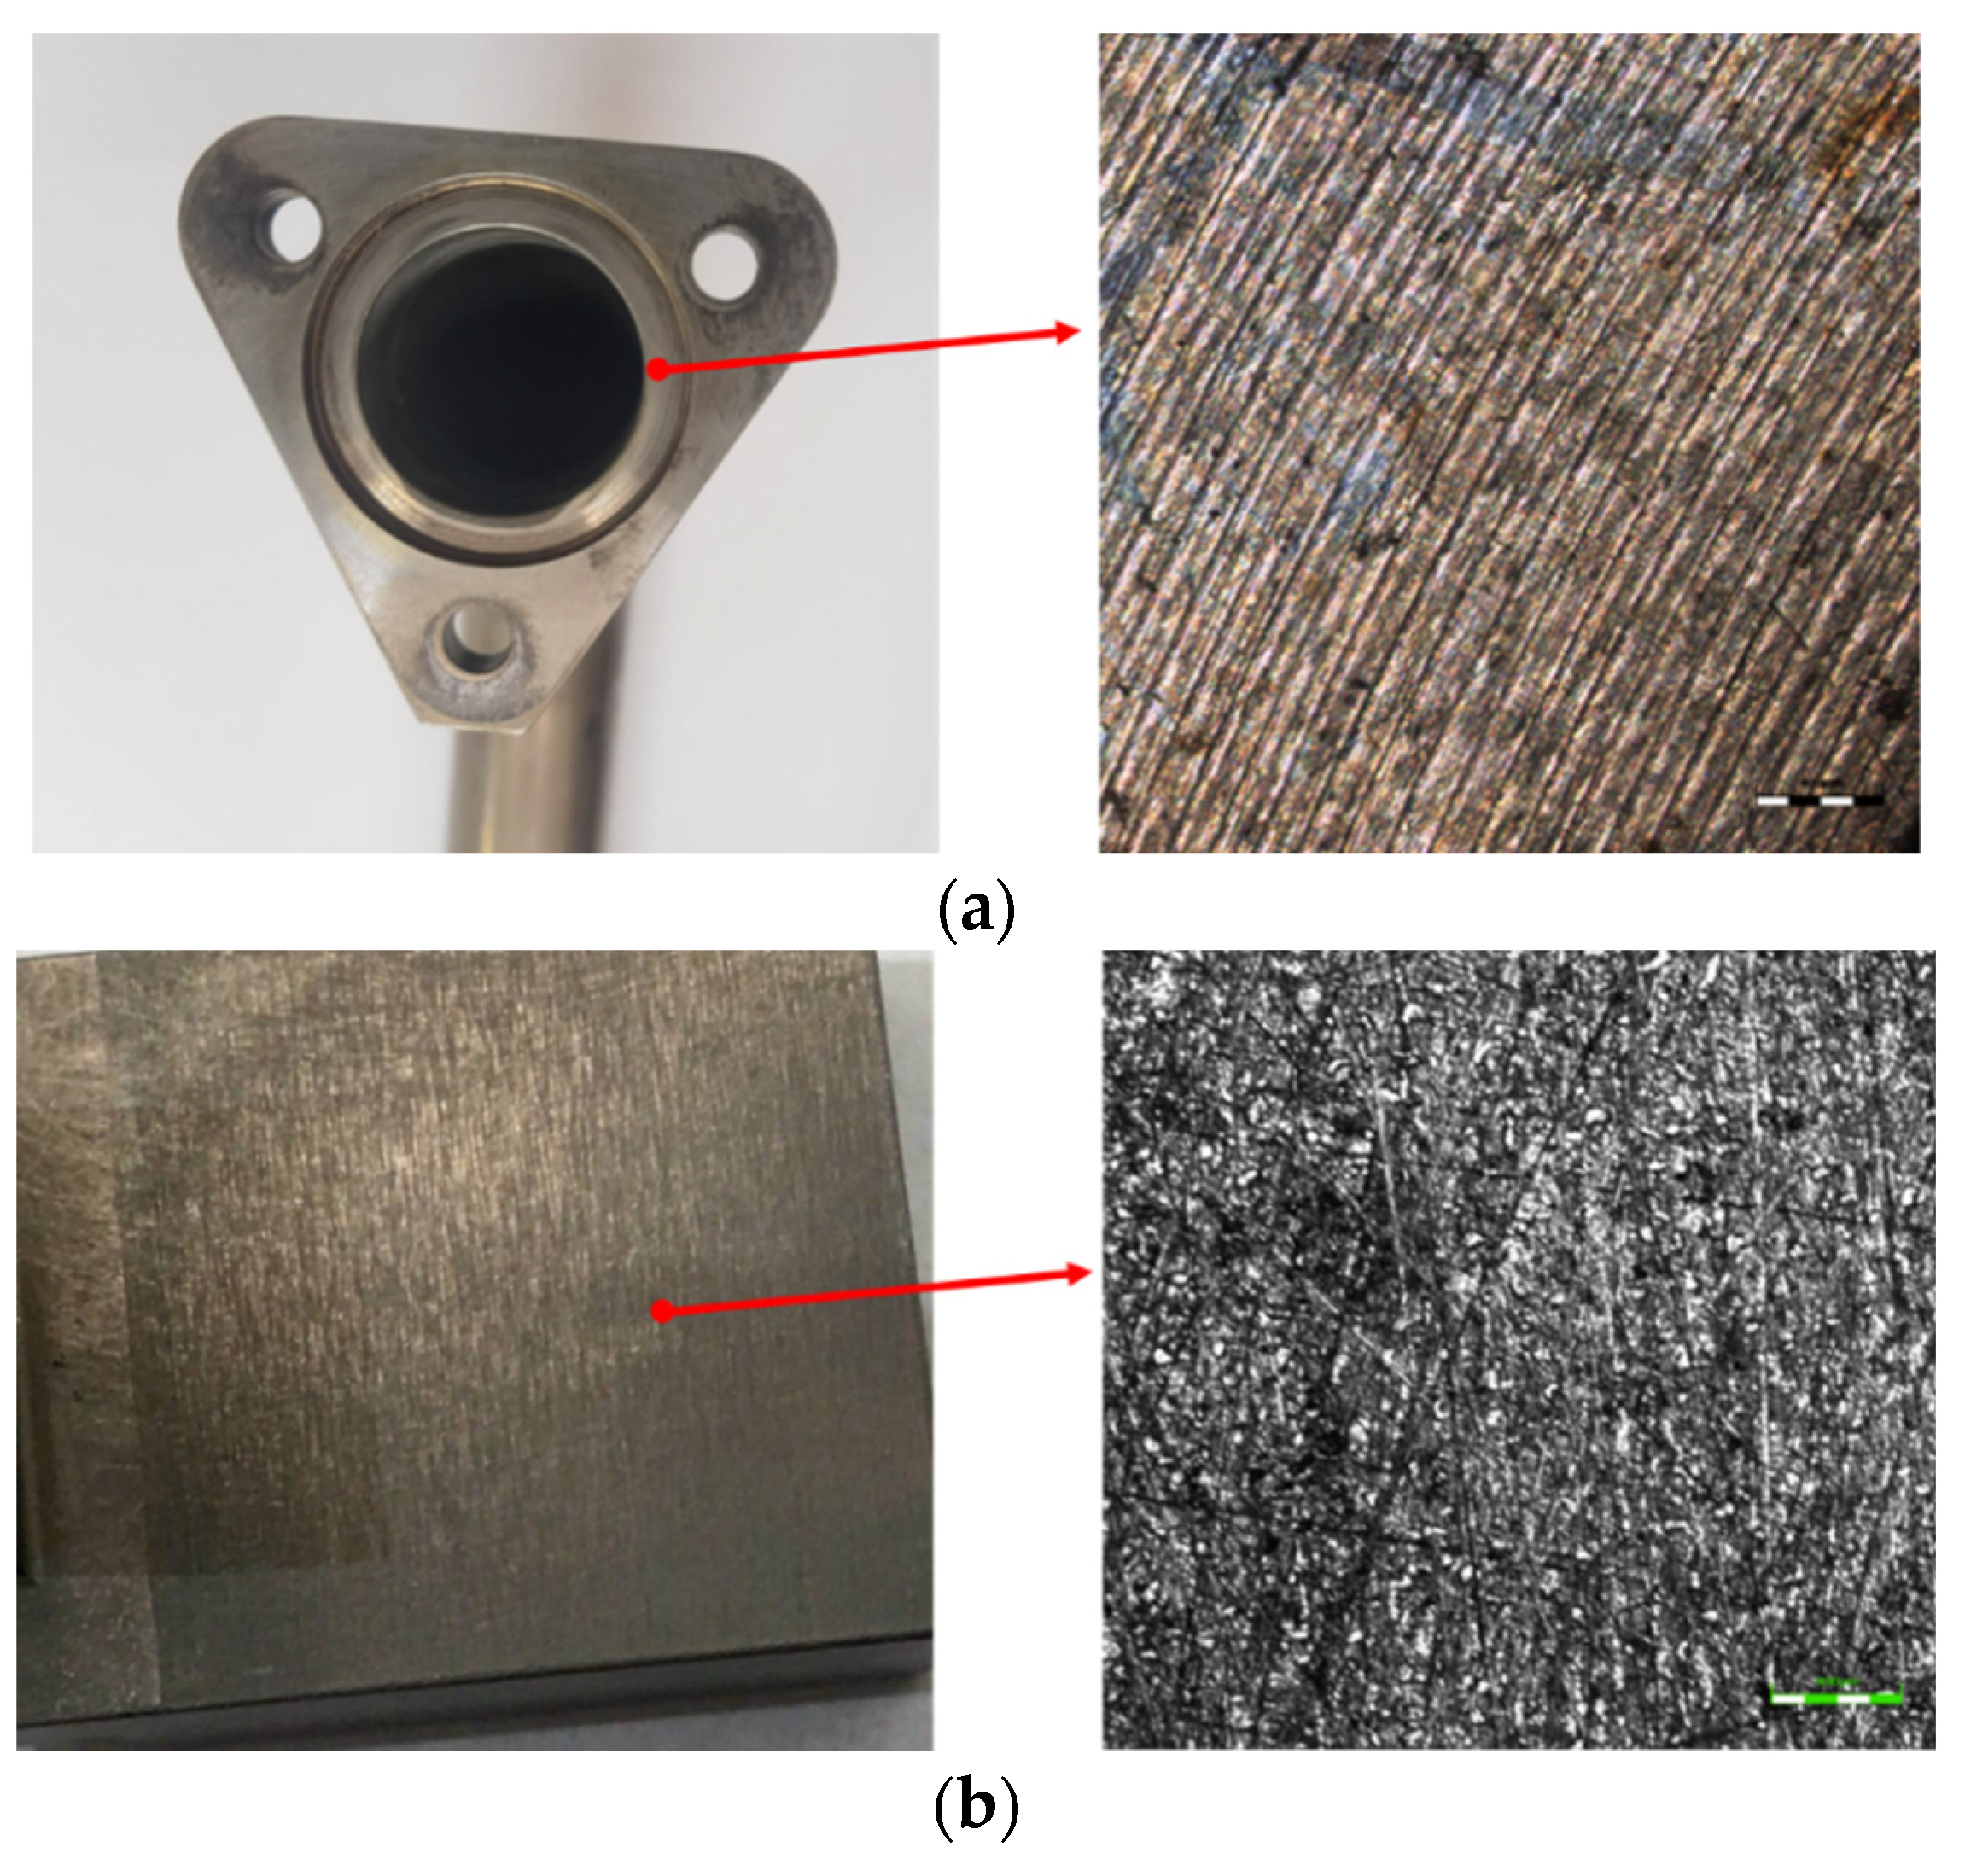
Figure 4 shows two examples of real surface topography. Figure 4a is the topography of the sealing surface of the external pipeline used in an aero-engine. The surface is obtained by turning, and the fractal parameters of this surface obtained by the structural function method are D = 1.420, G = 6.073 × 10 7 m. Figure 4b is the topography of a grinding surface, and the fractal parameters obtained by the structural function method are D = 1.129, G = 3.212 × 10 8 m.

2.2. Contact Model of Rough Surface

Engineering materials are known to have rough surfaces that lead to roughness. The full control of surface topography at all scales during manufacturing processes is still out of reach [10]. In order to obtain the intrinsic parameters of the porous medium space, it is necessary to establish the contact model of the two rough sealing surfaces.
In our recently published research paper [43], a contact model for rough surfaces based on fractal theory is proposed. The proposed model, whose feasibility and credibility are verified by comparison with other contact models and experimental data, is a modification and improvement of the existing fractal contact models, which can lead to a more accurate calculating result. In our recently proposed contact model of rough surfaces, the contact of two real rough surfaces is equivalent to the contact of a rigid flat surface and a rough surface. It is should be noted that parameters D and G refer to the fractal parameters of the equivalent rough surface, which can be calculated from the topography parameters of the two contact surfaces (the detailed procedure can be found in Appendix B of [43]). The modeling process for this contact model consists of four steps:
  • Step 1: The deformation law of a single asperity on a rough surface is obtained. The deformation of asperities is divided into four stages: the elastic deformation stage, the first elastic-plastic deformation stage, the second elastic-plastic deformation stage and the plastic deformation stage. Based on contact mechanics and fractal theory, the relationship between the contact area and the contact load of a single asperity in each deformation stage is deduced and obtained, and the change in material hardness with the interference is considered when analyzing the contact characteristics of a single asperity within the first and second elastoplastic deformation stages. The diagram of the deformation law of a single asperity is shown in Figure 5. a n e c , a n e p c and a n p c are the elastic critical contact area, the first elastoplastic critical contact area and the second elastoplastic critical contact area, respectively. f n e ( a n ) , f n e p 1 ( a n ) , f n e p 2 ( a n ) and f n p ( a n ) are the contact loads of a single asperity at different deformation stages.
  • Step 2: The size distribution function of contact spots at different frequency levels is derived. We assume that asperities at each frequency level have their own distribution. By theoretical derivation, the total real contact area of asperities at each frequency level and the largest contact area of the asperity at each frequency level are obtained.
  • Step 3: The expressions of asperity critical frequency levels are re-derived. We assume that all the contact asperities deform elastically if the largest interference of the asperity ω n l is not greater than its critical interference ω n e c , i.e., ω n l ω n e c . Based on this assumption, the elastic critical frequency level n e c , the first elastoplastic critical frequency level n e p c and the second elastoplastic critical frequency level n p c are obtained.
  • Step 4: The relationship between the real contact area and the contact load of the rough surface is obtained. The “contact area–contact load” relationship of the entire rough surface is obtained through integration based on the “contact area–contact load” relationship of a single asperity.
The contact model presented in reference [43] will be adopted to obtain the relevant parameters (separation distance between two sealing surfaces, etc.) required by the leakage rate modeling of metal-to-metal seals.

2.3. Intrinsic Parameters of the Porous Medium

2.3.1. The Existing Calculation Procedure for the Number of Pores and Fractal Dimension of Pore Space

Yu et al. [44,45] compared islands on Earth and rough spots or bumps on the engineering surface to the pores of the porous medium and obtained the number of pores with a pore diameter equal to or greater than λ , which is
N ( l λ ) = ( λ max λ ) D f
where l is the measurement scale. λ max represents the pore size of the largest leakage microchannel. D f denotes the fractal dimension of the pore space. If the cross-sectional diameter of the smallest leakage microchannel λ min ( λ min λ max ) is used in Equation (3), the total number of leakage microchannels can be obtained as [50]
N t = ( λ max λ min ) D f
Treating Equation (3) as a continuously differentiable function, we can obtain the derivative of Equation (3) to λ [45]
d N = D f λ max D f λ ( D f + 1 ) d λ
Equation (5) gives the number of voids in the range of λ and λ + d λ . The negative sign indicates that the number of voids is inversely related to the pore size. According to Equations (4) and (5), we can get the following relationship [45]
d N N t = D f λ min D f λ ( D f + 1 ) d λ = f ( λ ) d λ
Equation (6) gives the ratio of the pore number within λ + d λ to the total pore number. The expression of f ( λ ) is f ( λ ) = D f λ min D f λ ( D f + 1 ) , and f ( λ ) is the probability density function of the pore distribution, which satisfies the following equation [45]
λ min λ max f ( λ ) d λ = 1 ( λ min λ max ) D f 1
Which means
( λ min λ max ) D f 0
The above equation indicates that the fractal theory can be used to study porous medium only when the value of ( λ min / λ max ) D f approaches 0. Most porous medium in practical applications, including sealing interfaces, satisfies λ min / λ max < 10 2 [41,50]. Therefore, it is reasonable to study the transport characteristics of porous medium based on the fractal theory.
As a result of the WM function’s symmetry with regard to the average plane, the shape of the pore space is the same as the contour of the sealing surface when the contact pressure is zero, i.e., D f = D . When the contact pressure is larger than zero, however, the contour of the pore space changes due to the deformation of the rough surface asperities, and D f no longer equals D .
Assume that the pore size of the leakage microchannel has only one distribution between the smallest leakage microchannel λ min and the largest leakage microchannel λ max ; i.e., the sealing region has only one fractal dimension. Based on this assumption, Yuan et al. [51] constructed a unified relationship between the fractal dimension of the sealing region D f and the porosity ε accordingly
D f = D E ln ( ε ) ln ( λ min / λ max )
where D E in the fractal dimension of Euclidean space, and the values of D E in two-dimensional and three-dimensional space are 2 and 3, respectively. According to the above equation, the fractal dimension of the pore structure D f can be estimated after the porosity ε , the smallest leakage microchannel size λ min and the largest leakage microchannel size λ max are obtained.

2.3.2. The Novel Method for Calculating the Porosity

Porosity includes volume porosity ε V and surface porosity ε A . Once the structure of a certain material or medium is given, its porosity is also determined [44,52]. The volume porosity ε V represents the ratio of the pore volume that can provide effective circulation to the total volume in the porous structure, i.e., ε V = V p / V t . V p is the pore volume, V t is the total volume. The surface porosity represents the ratio of the pore area that can provide effective circulation to the total area in the porous structure, i.e., ε A = A p / A t . A p is the pore area, and A t is the total area. Unless otherwise specified, the porosity ε uniformly indicates the volume porosity ε V in the present work.
Ni et al. [41] established a contact model of rough surfaces using finite element numerical simulation method. Based on this contact model, the porosity and the relationship between the porosity and the contact pressure were obtained. Different from the method in [41], and different from any existing method, the present work proposes a new theoretical method that can consider the influence of surface topography parameters to calculate the porosity based on the principle that the volume of asperity remains unchanged before and after compression. The method is as follows.
Assume that the volume of each asperity before and after loading is the same for a machined rough surface. If the total asperity volume V s of a rough surface (i.e., solid skeleton volume of the porous medium space) can be determined before loading, this total asperity volume is also the total solid volume in the porous medium after loading. Thus, the total volume of the pores after loading is V p = V t V s , and the porosity can be calculated as
ε = V t V s V t = 1 V s V t
1.
Calculation of total asperity volume V s
According to the WM function, the geometric structure of each asperity before deformation can be expressed in mathematical expression as [30]
z n ( x ) = G D 1 l n 2 D cos ( π x l n ) , l n 2 < x < l n 2
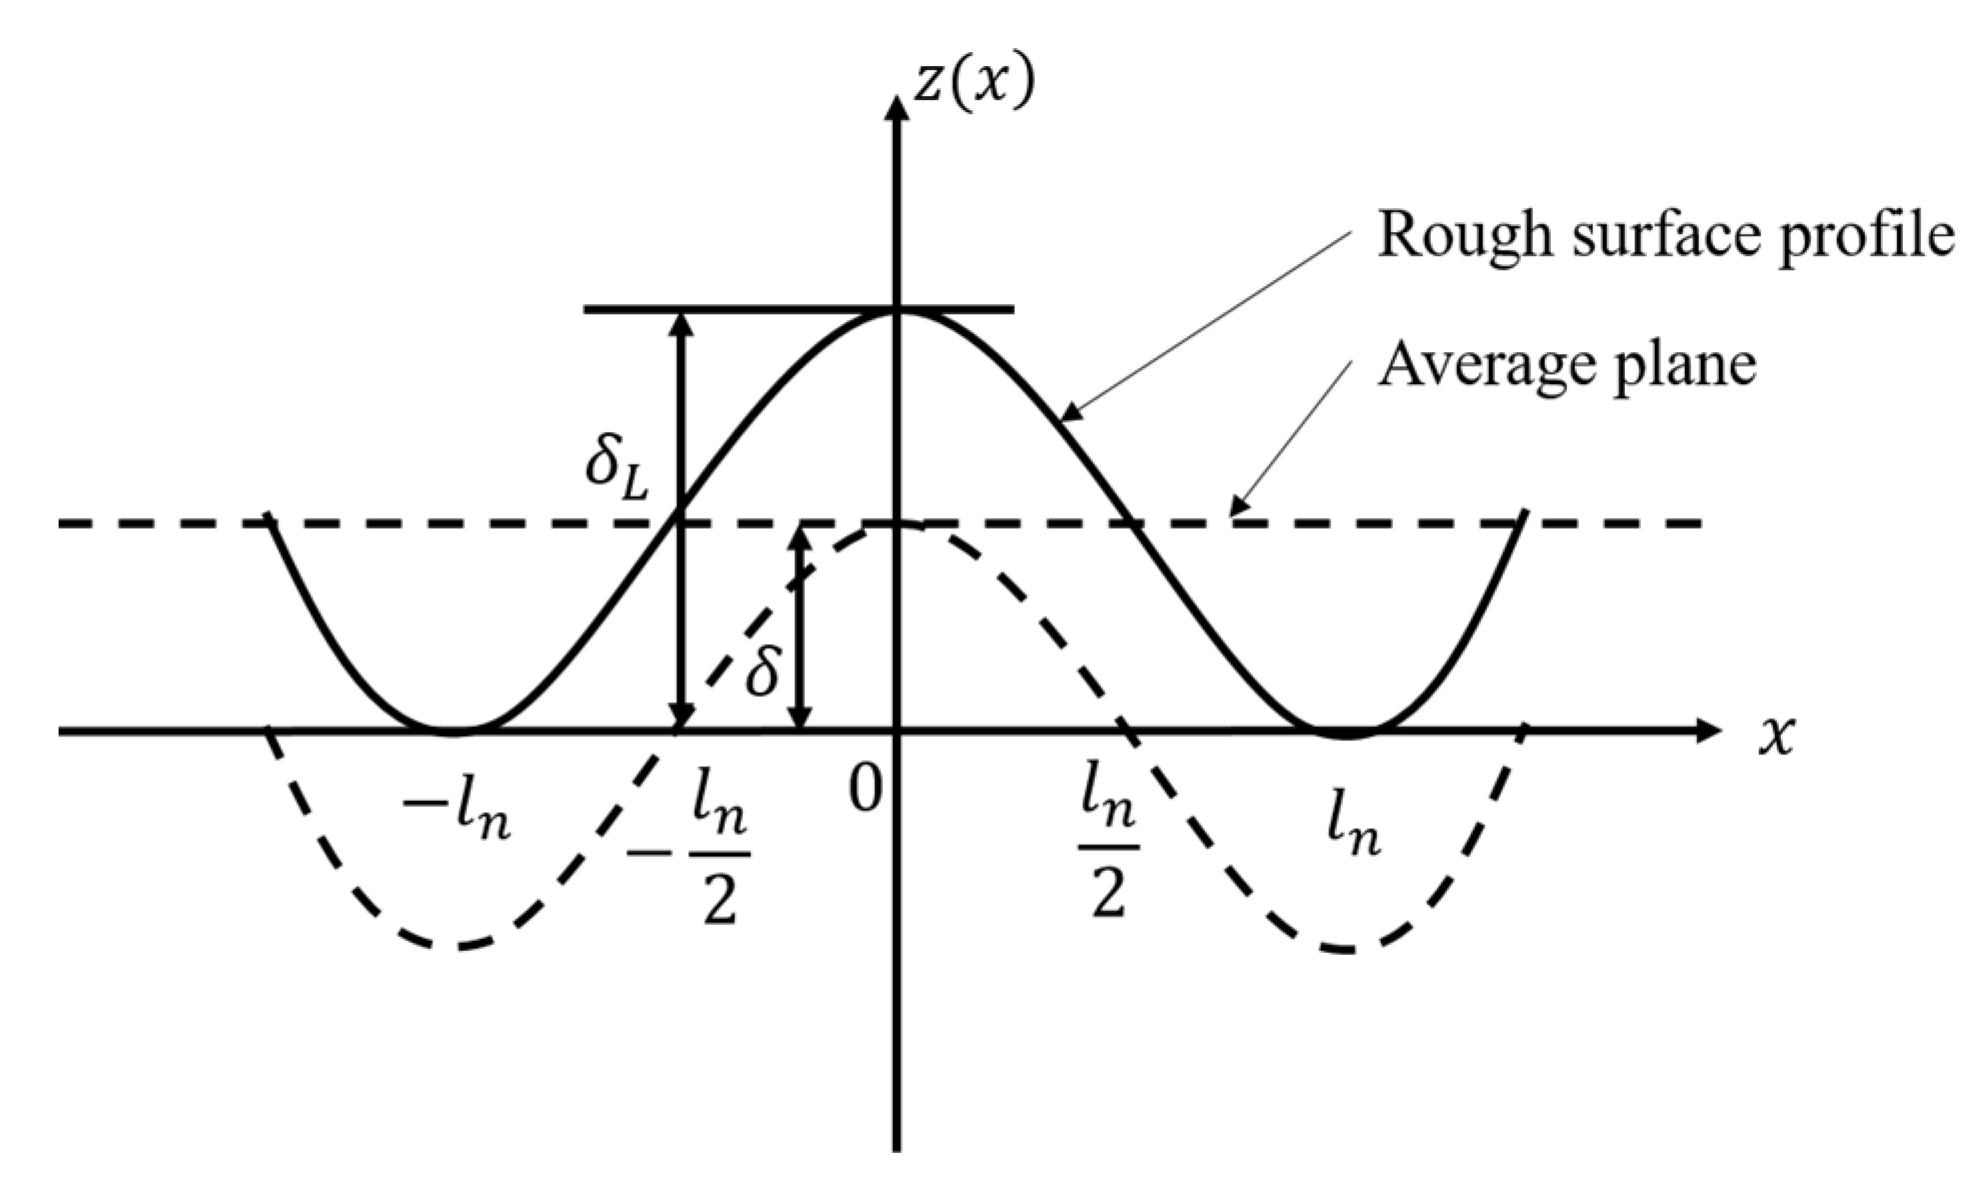
where l n is the base diameter of the asperity on the frequency level n , l n = 1 / γ n . The above expression is obtained by establishing a coordinate system based on the average plane as the abscissa. When the rough surface is in contact, the real height of the solid asperity is the distance from its “valley peak” to the “valley bottom”. Therefore, in order to obtain the proportion of solids in the effective pore space, the coordinate system of the asperity is moved up by a distance of the asperity height to obtain the longitudinal section coordinate system, as shown in Figure 6. δ L = 2 δ , which represents the maximum longitudinal height of the leakage channel.
Thus, the profile expression of a single asperity can be obtained as
z L n ( x ) = G D 1 l n 2 D cos ( π x l n ) + G D 1 l n 2 D , l n < x < l n
And the volume of a single asperity is
V n = 2 π 0 l n x z L n ( x ) d x
Substituting Equation (12) into Equation (13) and integrating it, the asperity volume can be obtained as
V n = ( π 4 π ) G D 1 l n 4 D
Substituting l n = 1 / γ n into the above formula, the volume of the largest and smallest asperity can be obtained as
V max = ( π 4 π ) G D 1 1 γ n min ( 4 D )
V min = ( π 4 π ) G D 1 1 γ n max ( 4 D )
Majumdar and Bhushan use the fractal scaling law to express the relationship between the contact area and the number of asperities on the engineering surface [48]
N ( A a ) = ( a max a ) D 2
where a max = g l max 2 , a = g l 2 , g is a geometric constant. Yu et al. [44,45] use the fractal scaling law to express the relationship between the pore size and the pore number, as shown in Equation (3). Inspired by the work of Yu et al. [44,45], the presented work uses the fractal scaling law to express the relationship between the asperity volume and the asperity number on a machined rough surface, which is
N V ( V V ) = ( V max V ) D 4 D
where N V represents the number of asperities per unit area with a volume larger than V . Thus, we can obtain the volume distribution function as
n ( V ) = D 4 D V max D 4 D V D 4 D 1
And the total solid volume V s can be obtained as
V s = V min V max n ( V ) V d V
Substituting Equation (19) into the above equation, we can obtain
V s = D 4 2 D V max [ 1 ( V min V max ) 4 2 D 4 D ]
Substituting Equations (15) and (16) into the above equation yields
V s = D 4 2 D [ ( π 4 π ) G D 1 1 γ n min ( 4 D ) ] [ 1 1 γ ( n max n min ) ( 4 2 D ) ]
2.
Calculation of total volume of porous medium space V t
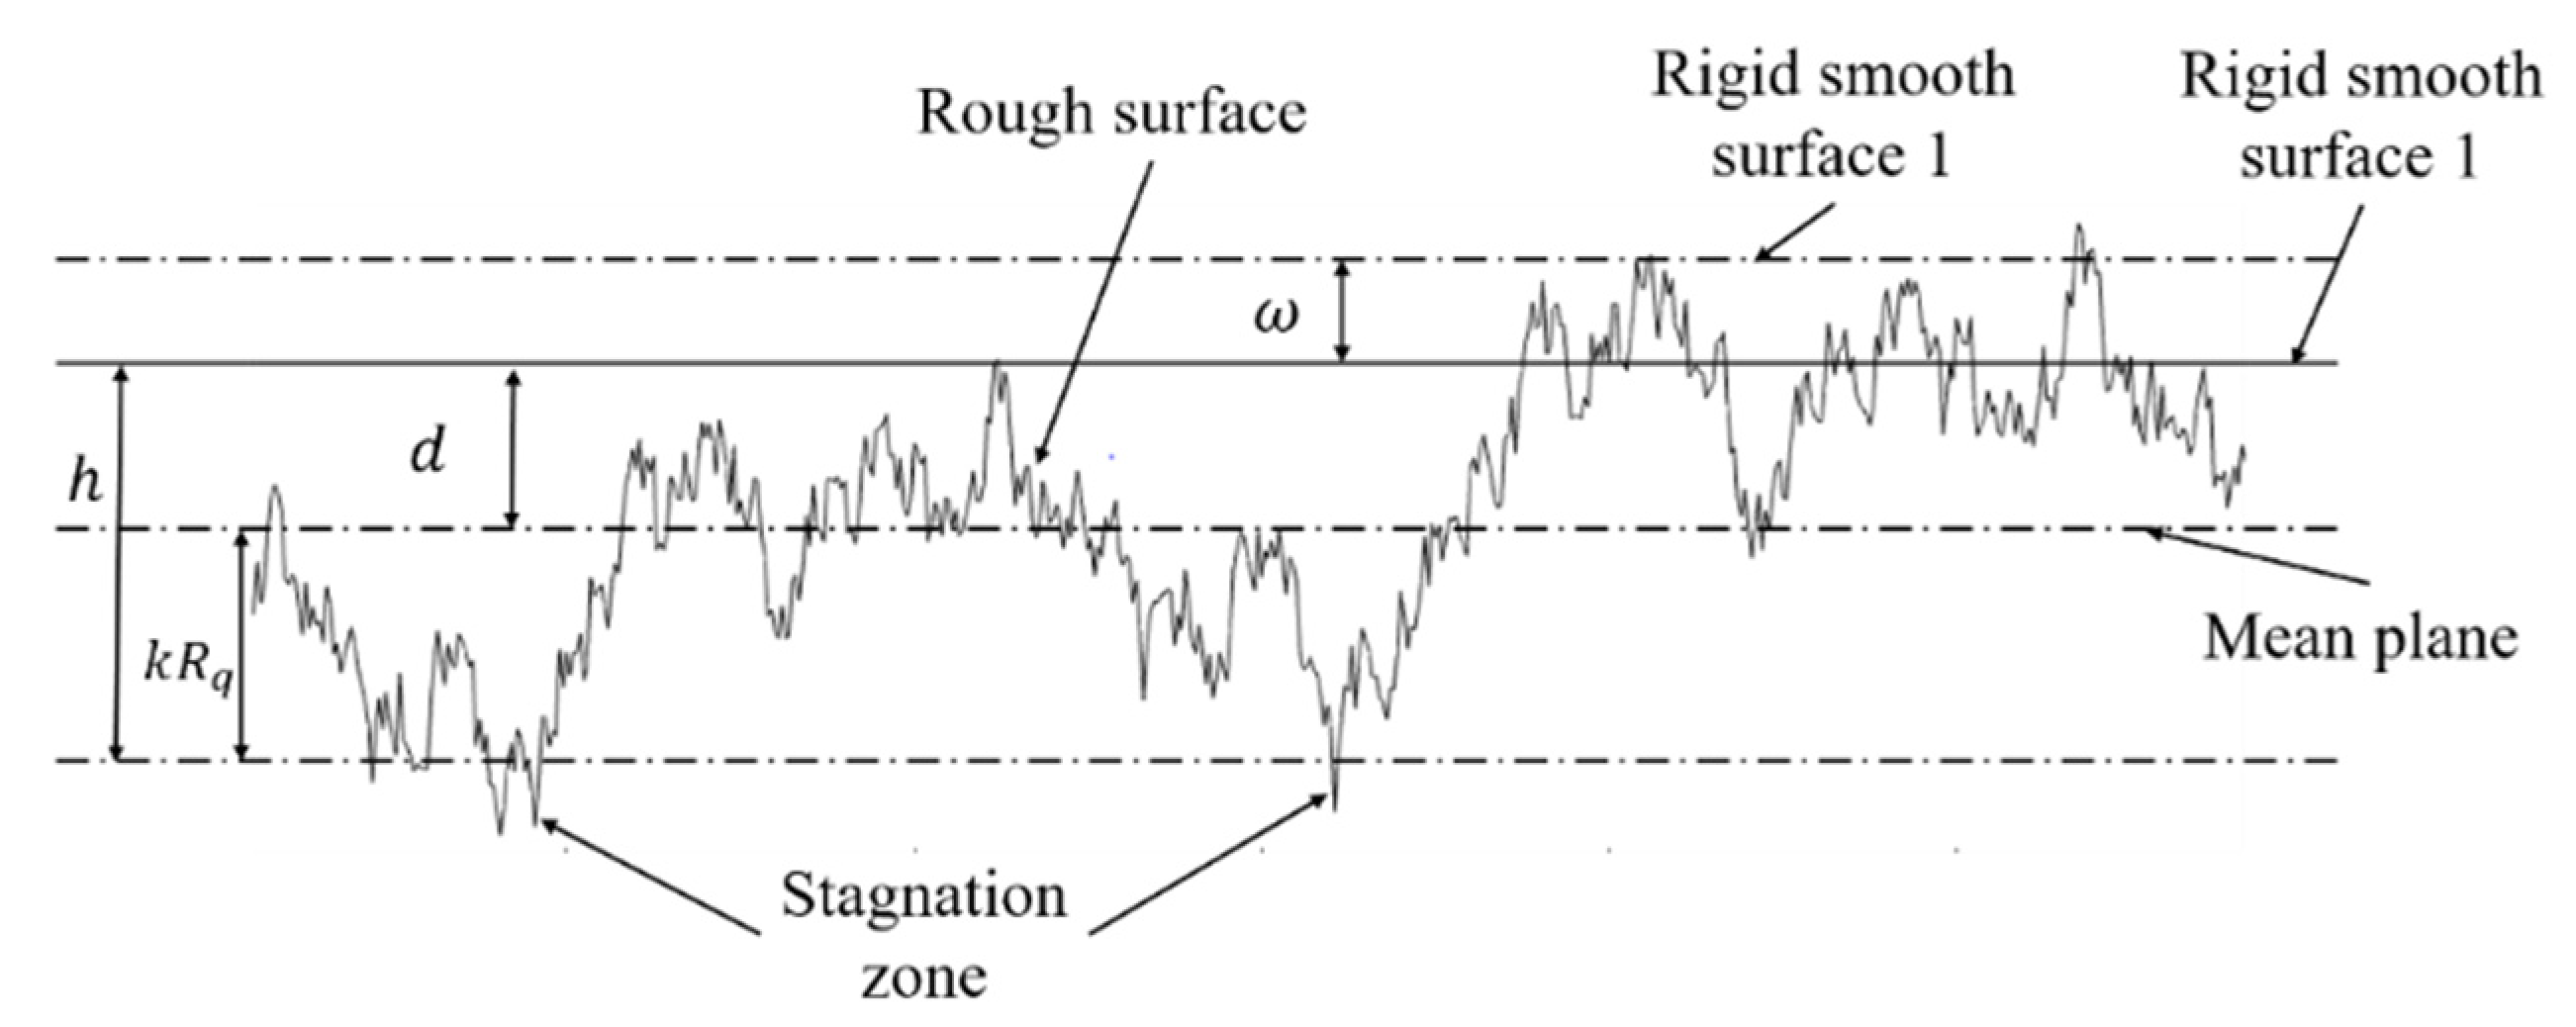
Figure 7 shows the two-dimensional schematic diagram of the microporous area of the rough sealing interface. The contact of two real rough surfaces can be equivalent to the contact of a rigid flat surface and a rough surface. ω is the contact interference. d is the separation distance between the rigid flat plane and the mean plane. h is the effective height that can provide an effective channel for the leakage of the sealing medium. During the loading process, there will be a stagnation zone in the microporous structure area, which cannot provide an effective channel for the leakage of the sealing medium.
The profile height distribution of the rough surface z ( x ) characterized by the WM function obeys the independent Gaussian distribution with an expectation of z ( x ) ~ N ( 0 , R q 2 ) [30], where R q is the root mean square deviation of the rough surface profile. It can be seen from this expression that z ( x ) is mainly concentrated in the range where the average plane is ± k R q , where k is a constant value between 1 and 3 and can be selected according to different processing forms. Therefore, the effective height h can be obtained as
h = k R q + d
When the sampling length is L , the total volume of the microporous structure can be obtained as
V t = h L 2
3.
Expression of porosity
Therefore, the porosity ε can be estimated by substituting Equations (22) and (24) into Equation (10), which is
ε = V t V s V t = 1 D ( 4 2 D ) ( k R q + d ) L 2 [ ( π 4 π ) G D 1 1 γ n min ( 4 D ) ] [ 1 1 γ ( n max n min ) ( 4 2 D ) ]
According to Equation (25), porosity is a function of sealing surface topography parameters D and G , so we can analyze the influence of sealing surface topography on porosity based on Equation (25).

2.3.3. The Novel Method for Calculating the Maximum and Minimum Leakage Microchannel Diameters

The capillary bundle model [50] is employed in this study to describe the leakage microchannel; i.e., curved capillaries with varying tube diameters are used to represent the sealing interface’s leakage microchannels. It is already known that the WM function is the superposition of multiple cosine functions. The expression of a single leakage microchannel is shown in Equation (11). Thus, the cross-sectional area of the leakage microchannel can be obtained by integrating Equation (11), which is a c s = ( 2 G D 1 l n 3 D ) / π . Further, the cross-sectional area of the smallest leakage microchannel can be obtained as a c s , min = ( 2 G D 1 ) / ( π γ n max ( 3 D ) ) . Ignoring the change in the equivalent cross-sectional diameter (equivalent to a circular section) of the smallest leakage microchannel before and after the sealing surface is compressed, we can obtain another expression for the cross-sectional area of the smallest leakage microchannel, i.e., a c s , min = π ( λ min / 2 ) 2 . Therefore, the equivalent diameter of the smallest leakage microchannel can be obtained by
λ min = 2 2 G ( D 1 ) / 2 π γ n max ( 3 D ) / 2
Take the largest pore height as the diameter of the largest leakage micro-channel, which is
λ max = h = k R q + d
Then, the aperture ratio can be obtained as
λ max λ min = π γ n max ( 3 D ) / 2 ( k R q + d ) 2 2 G ( D 1 ) / 2
According to Equations (27) and (28), as with the porosity ε , the diameter of the largest leakage microchannel λ max and the aperture ratio λ max / λ min are also functions of the sealing surface fractal parameters, and they are also functions of the separation distance d between the rigid flat plane and the mean plane. In addition, after the maximum and minimum diameters of the leakage microchannel are given, the fractal dimension of the pore space D f can be obtained by substituting Equations (25) and (28) into Equation (9). Therefore, the effect of sealing surface topography on the aperture ratio and fractal dimension of pore space can be analyzed theoretically.

2.3.4. The Existing Calculation Procedure for the Tortuosity and the Tortuosity Fractal Dimension of the Leakage Microchannel

As mentioned above, the leakage microchannel can be assumed to be a bunch of capillary tubes with different cross-sectional sizes. Figure 8 shows the schematic diagram of the sealing medium flowing through the porous medium. L 0 is the linear length or characteristic length along the direction of the macroscopic pressure gradient of the fluid, and L t is the curved streamline length, L t L 0 . The definition of tortuosity is [41]
τ t = L t L 0
Wheatcraft and Tyler [53] proposed a fractal scale relationship when fluid flows through random and complex porous structures, which is L t ( ξ ) = ξ 1 D t L D t , where ξ is the measuring length scale and D t is the tortuosity fractal dimension of the leakage microchannel. Professor Yu Boming’s team [54] at Huazhong University of Science and Technology promoted the following formula by replacing the measuring length scale with the diameter of the capillary tube (leakage microchannel)
L t ( λ ) = λ 1 D t L 0 D t
It is can be seen from the above equation that the length of the leakage microchannel L t is a function of its cross-sectional diameter λ . In a two-dimensional space, D t = 2 means that the leakage microchannel is so curved that it fills the entire plane. In three-dimensional space, D t = 3 means that the leakage microchannel is so curved that it fills the entire space.
According to the definition of tortuosity and Equation (30), the tortuosity of the leakage microchannel can be re-expressed as [50,54]
τ t = ( L 0 λ ) D t 1
According to the above equation, the value of D t can be obtained as [50]
D t = 1 + ln τ t ln ( L 0 / λ )
For the sealing characteristics of the metal-to-metal seal, we are more concerned about its average leakage. Therefore, the above equation can be approximated as follows
D t = 1 + ln τ a v ln ( L 0 / λ a v )
where λ a v is the average diameter of the cross-section of the leakage microchannels and can be estimated by [50]
λ a v = λ min λ max λ f ( λ ) d λ = D f λ max D f 1 [ λ min λ max ( λ min λ max ) D f ]
Noting that ( λ max / λ min ) D f 0 , the above expression can be simplified to
λ a v = D f D f 1 λ min
where τ a v is the average tortuosity of the leakage microchannels and can be obtained according to [50]
τ a v = λ min λ max τ ( λ ) f ( λ ) d λ = λ min λ max L 0 D t 1 λ 1 D t f ( λ ) d λ = L 0 D t 1 D f λ min 1 D t ( D f + D t ) 1 [ 1 ( λ min λ max ) D f + D t 1 ]
Substituting ( λ max / λ min ) D f 0 into Equation (36) yields
τ a v = D f D f + D t 1 ( L 0 λ min ) D t 1
Therefore, D t can be estimated as [41,50]
D t = 1 + ln { [ τ a v ( D f + D t 1 ) ] / D f } ln ( L 0 / λ min )
When solving the tortuosity fractal dimension in Equation (38), the expression τ a v = 1 2 [ 1 + 1 2 1 ε + 1 ε ( 1 / 1 ε 1 ) 2 + 1 4 / ( 1 1 ε ) ] can be substituted into the right side of the above equation as the average tortuosity [50], and the iterative method can be adopted to obtain D t . Since the porosity ε , the diameter of the smallest leakage microchannel λ min , and the fractal dimension of pore space D f are all functions of sealing surface topography parameters D and G , according to Equation (38), the fractal dimension of tortuosity D t is also the function of D and G . Therefore, the theoretical analysis of the influence of sealing surface topography on D t can be realized.

2.4. Leakage Rate Model

The total fluid flow through a unit with a cross-section Q is [41,50]
Q = λ min λ max q ( λ ) d N
where q ( λ ) is the flow rate of the sealing medium through a single leakage microchannel (a capillary) with a diameter of λ . For a typical porous medium, such as a sealing interface, q ( λ ) can be estimated by the Hagen–Poiseulle equation if the following assumptions are met: ① the fluid is isothermal and incompressible Newtonian fluid; ② the fluid is 100% saturated and single fluid; ③ the porous medium does not deform due to the action of fluid, i.e., fluid pressure is not larger than contact pressure; ④ surface effects such as surface tension, adsorption and resistance are ignored; ⑤ sealing interfaces have fractal characteristics and satisfy λ min / λ max < 10 2 [41,45,55]. Further, q ( λ ) can be expressed as
q ( λ ) = π λ 4 128 μ Δ p L t ( λ )
where μ is the viscosity coefficient of the sealing medium. Δ p is the pressure difference of the sealing medium. According to the definition of tortuosity, τ t = L t ( λ ) / L 0 , and the tortuosity can also be expressed as τ t = ( L 0 / λ ) D t 1 according to Equation (31). The above expression thus can be re-expressed as
q ( λ ) = π λ 4 128 μ Δ p λ 1 D t L 0 D t
Substituting Equations (5) and (41) into Equation (39) yields [50]
Q = π Δ p D f λ max 3 + D t 128 μ L 0 D t ( 3 + D t D f )
The above expression is the leakage prediction formula for metal-to-metal seals. The formula does not contain any empirical constants, and all parameters have clear physical meanings and are obtained through rigorous theoretical derivation. According to the previous analysis, some parameters in Equation (42), such as D f and D t , are functions of the sealing surface topography parameters D and G , so the leakage rate obtained by Equation (42) is also a function of the sealing surface topography parameters, and the influence of sealing surface topography on leakage rate can be analyzed theoretically according to Equation (42).
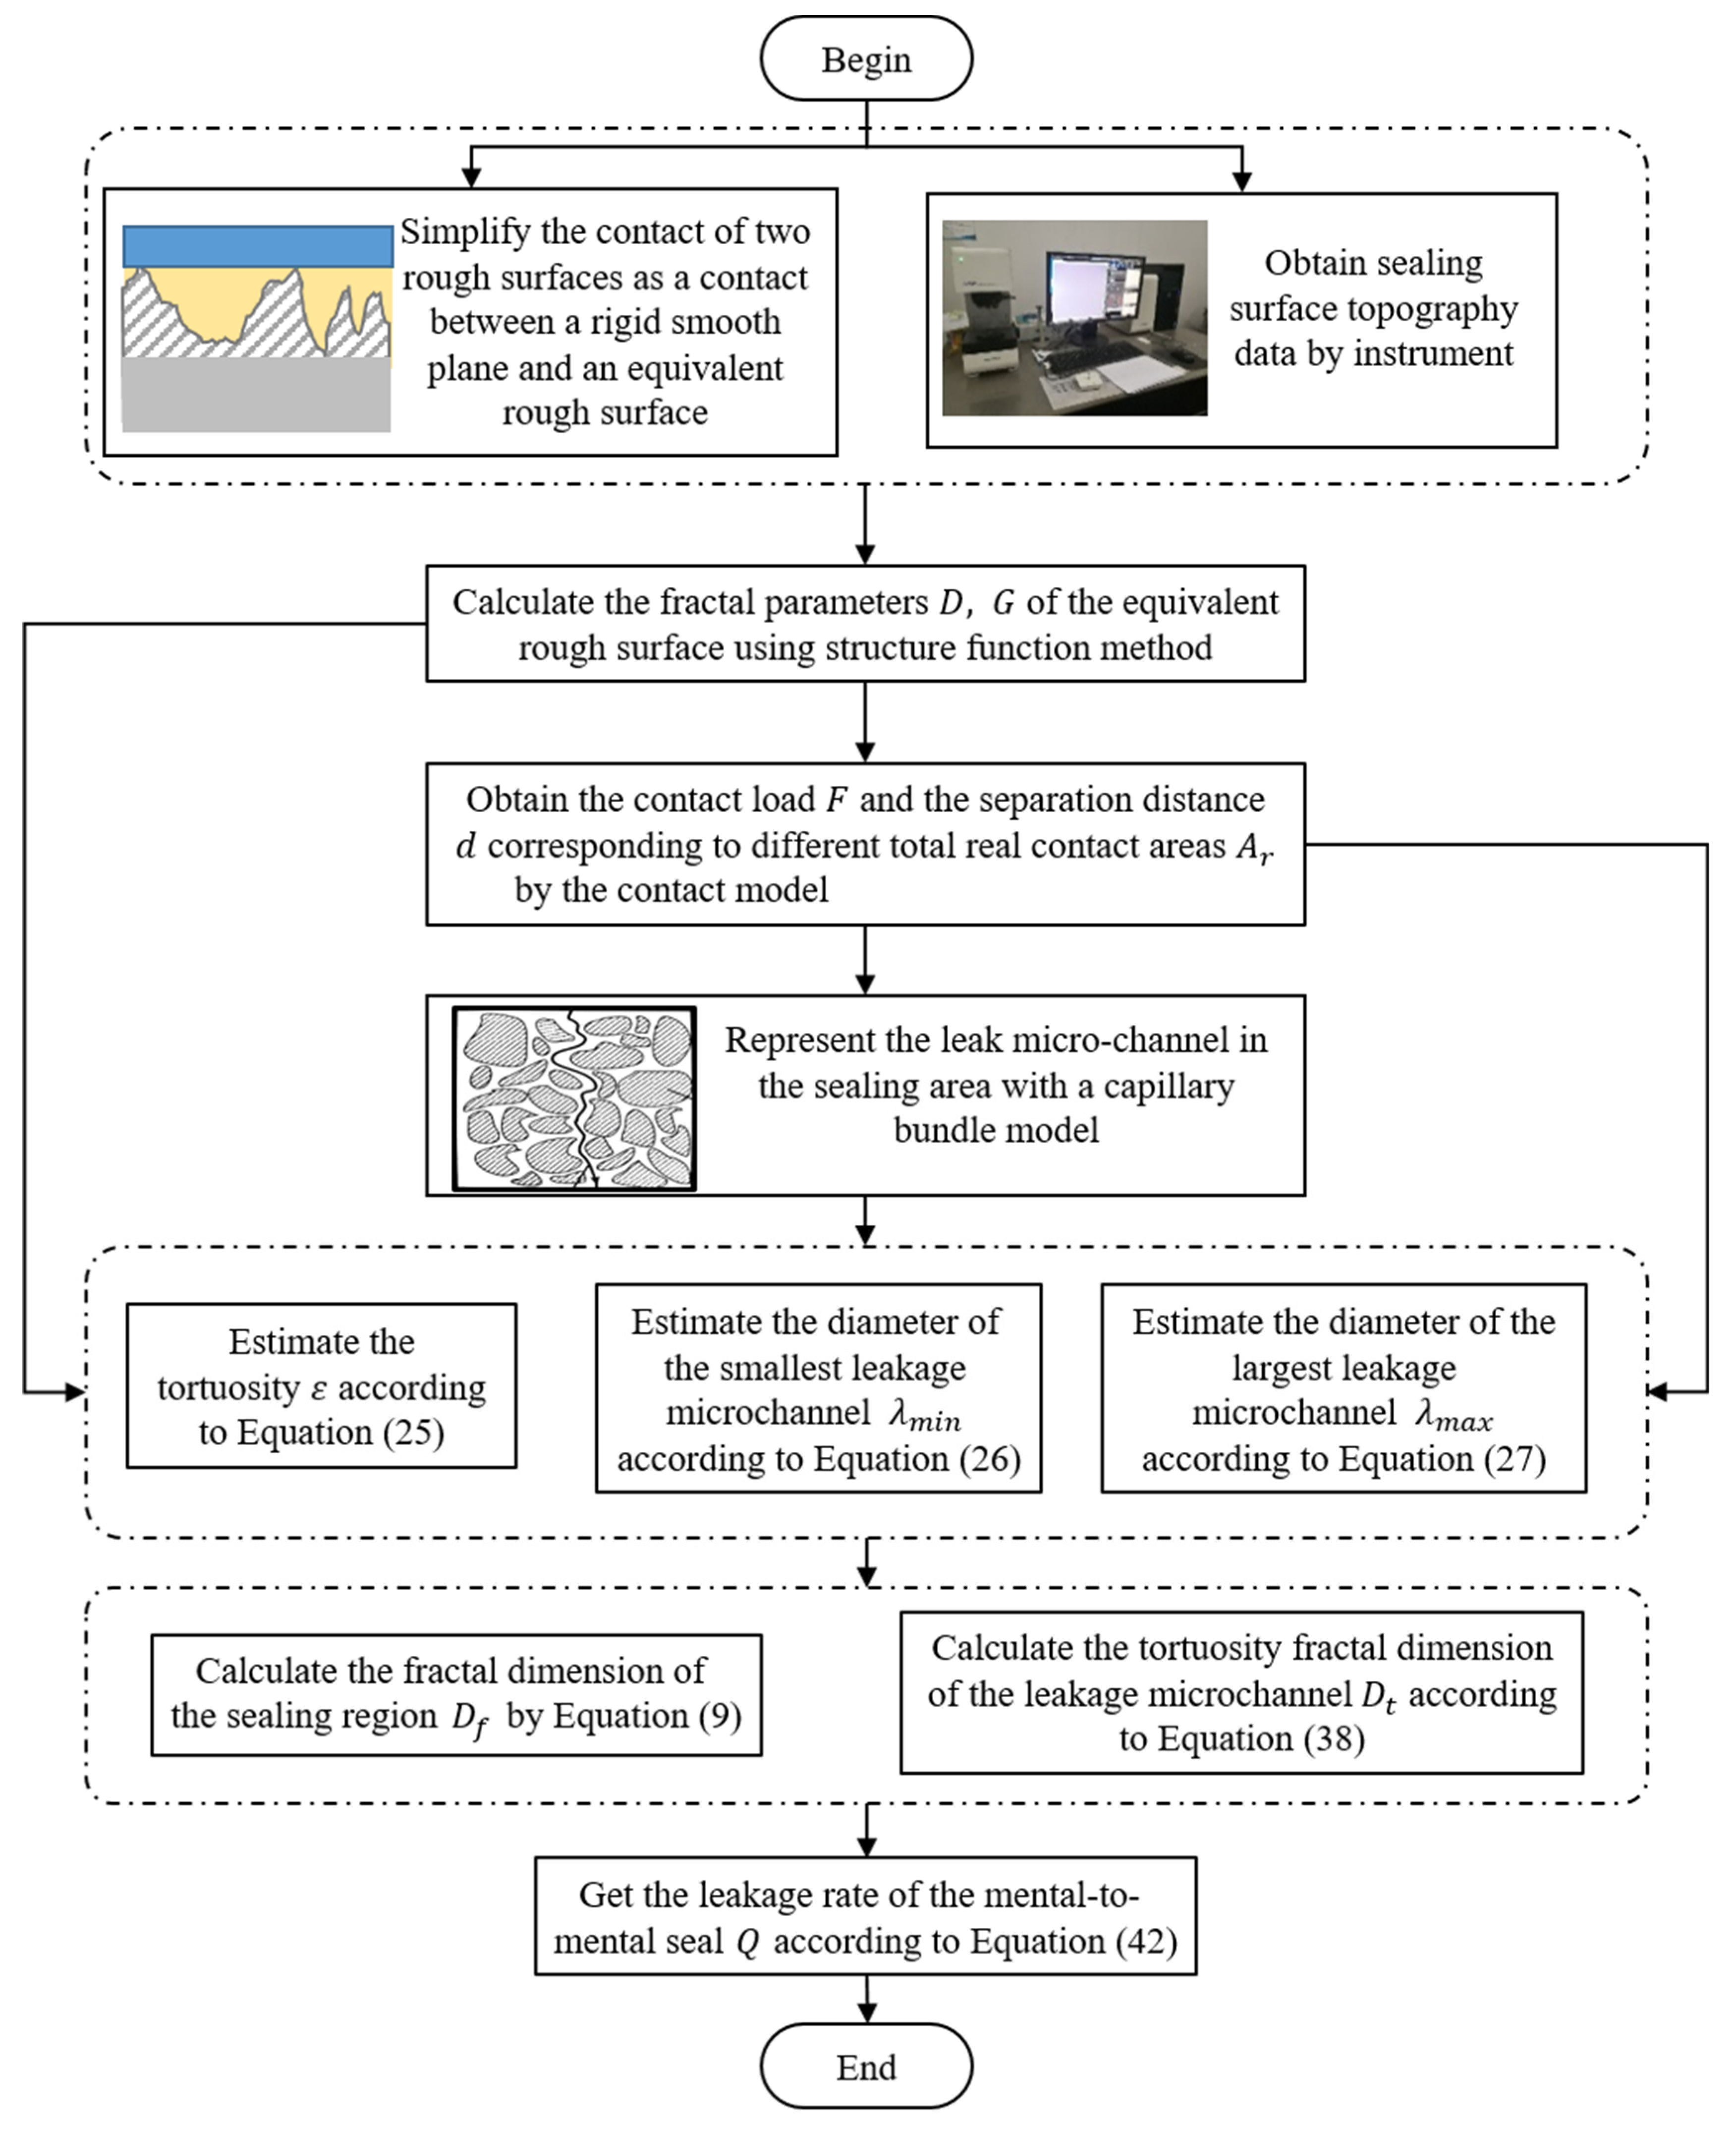
For the sake of clarity, the whole flow chart for the calculation of the flow rate of the porous medium in a metal-to-metal seal is demonstrated in Figure 9.

3. Results

Marie and Lasseux [22] designed a test device for the leakage rate of metal-to-metal seals and conducted test measurements in 2007. In the test, one of the circular ring sealing surfaces is obtained by turning, with an inner radius and outer radius of 19.85 mm and 20.15 mm, respectively, and the material is 316 L stainless steel. The other sealing surface is a cross-section of a cylinder made of sapphire, which has been polished. The mechanical performance parameters of the two sealing surfaces are shown in Table 1.
According to Table 1, the hardness of sapphire is about 10 times that of 316 L stainless steel, and its elasticity modulus is about twice that of 316 L stainless steel. The sapphire thus can be regarded as a rigid flat plane. Therefore, the topological and mechanical characteristics of the two sealing surfaces in contact are only the characteristics of the metal sealing surface. In the present work, the contact between two rough sealing surfaces is equivalent to the contact between a rigid flat plane and a rough surface. Therefore, the experimental results of Marie and Lasseux can be used to verify the feasibility and credibility of the leakage rate model proposed in the present work.
Ref. [22] does not provide the fractal parameters of the metal surface, but the processing parameters of the rough surface are given, which are shown in Table 2. Therefore, we can process the same metal surface according to the processing parameters and then obtain the fractal parameters of the metal surface according to its surface topography data. The measuring instrument (OLYMPUS 4100) and the measuring locations are shown in Figure 10a,b, respectively. The measurement direction is perpendicular to the texture direction. In order to ensure accuracy of the measuring results, three different locations of the rough surface are selected to measure their topography data. One portion of the measuring topography data is shown in Figure 10c. The scanning length is 2500 μm and the sampling interval is 0.625 μm. The fractal parameters are the equivalent results of the topography data of the three measurement locations. The fractal parameters, estimated by the method introduced in Appendix B of [43], are D = 1.4575 , G = 1.3182 × 10 8 m.
In the experiments of Marie and Lasseux [22], the solvent and solute used were ethanol and butanol (leakage liquid), respectively. The range of the applied load is 3.8 kN~30.4 kN; thus, the nominal contact pressure P c a with this load range is 100 MPa~800 MPa. In addition, the fluid pressure difference Δ P between the sealing medium and the external environment in this experiment ranges from 1 bar to 30 bar (0.1 MPa~3 MPa), and Δ P is measured by a pressure sensor. Leakage rate measurements were carried out every contact pressure P c a increment of 100 MPa from low to high preload. For different contact pressure, after pressure was applied in the solute during pressure-driven experiments, the resulting force exerted on the sealing interface, which tends to unload the contact, was corrected by increasing the preload of the corresponding value. Once both pressures in the fluid phase and tightening reached stabilized values, a micro-injector was used to extract a sample of the solvent, and the sample was analyzed by gas phase chromatography at regular intervals of time. The relationship between the amount of solute (i.e., the sealing medium) in the sample and time should be a straight line, the slope of which is the leakage rate of the contact seals at a given contact pressure and fluid pressure difference.
It is known that the dynamic viscosity and density of butanol at 20 °C are μ = 2.95 × 10 3 Pa·s and ρ = 810 kg/m3, respectively. In order to obtain a reliable comparison result, the fluid pressure difference range used in the presented model is consistent with that of the test. Since the solute leaks through the radial distance of the entire metal ring, L 0 = r e r i = 0.3 mm, the test examines the leakage rate of the solute flowing through the outermost side of the metal ring, r = r e = 20.15 mm. The comparison result is shown in Figure 11. It should be noted that, since the unit of the leakage rate obtained by the leakage rate model established in the present work is m3/s and the unit of the test results of Marie and Lasseux is mg/min, for the convenience of comparison, the units of the calculation results in this paper are converted to mg/min.
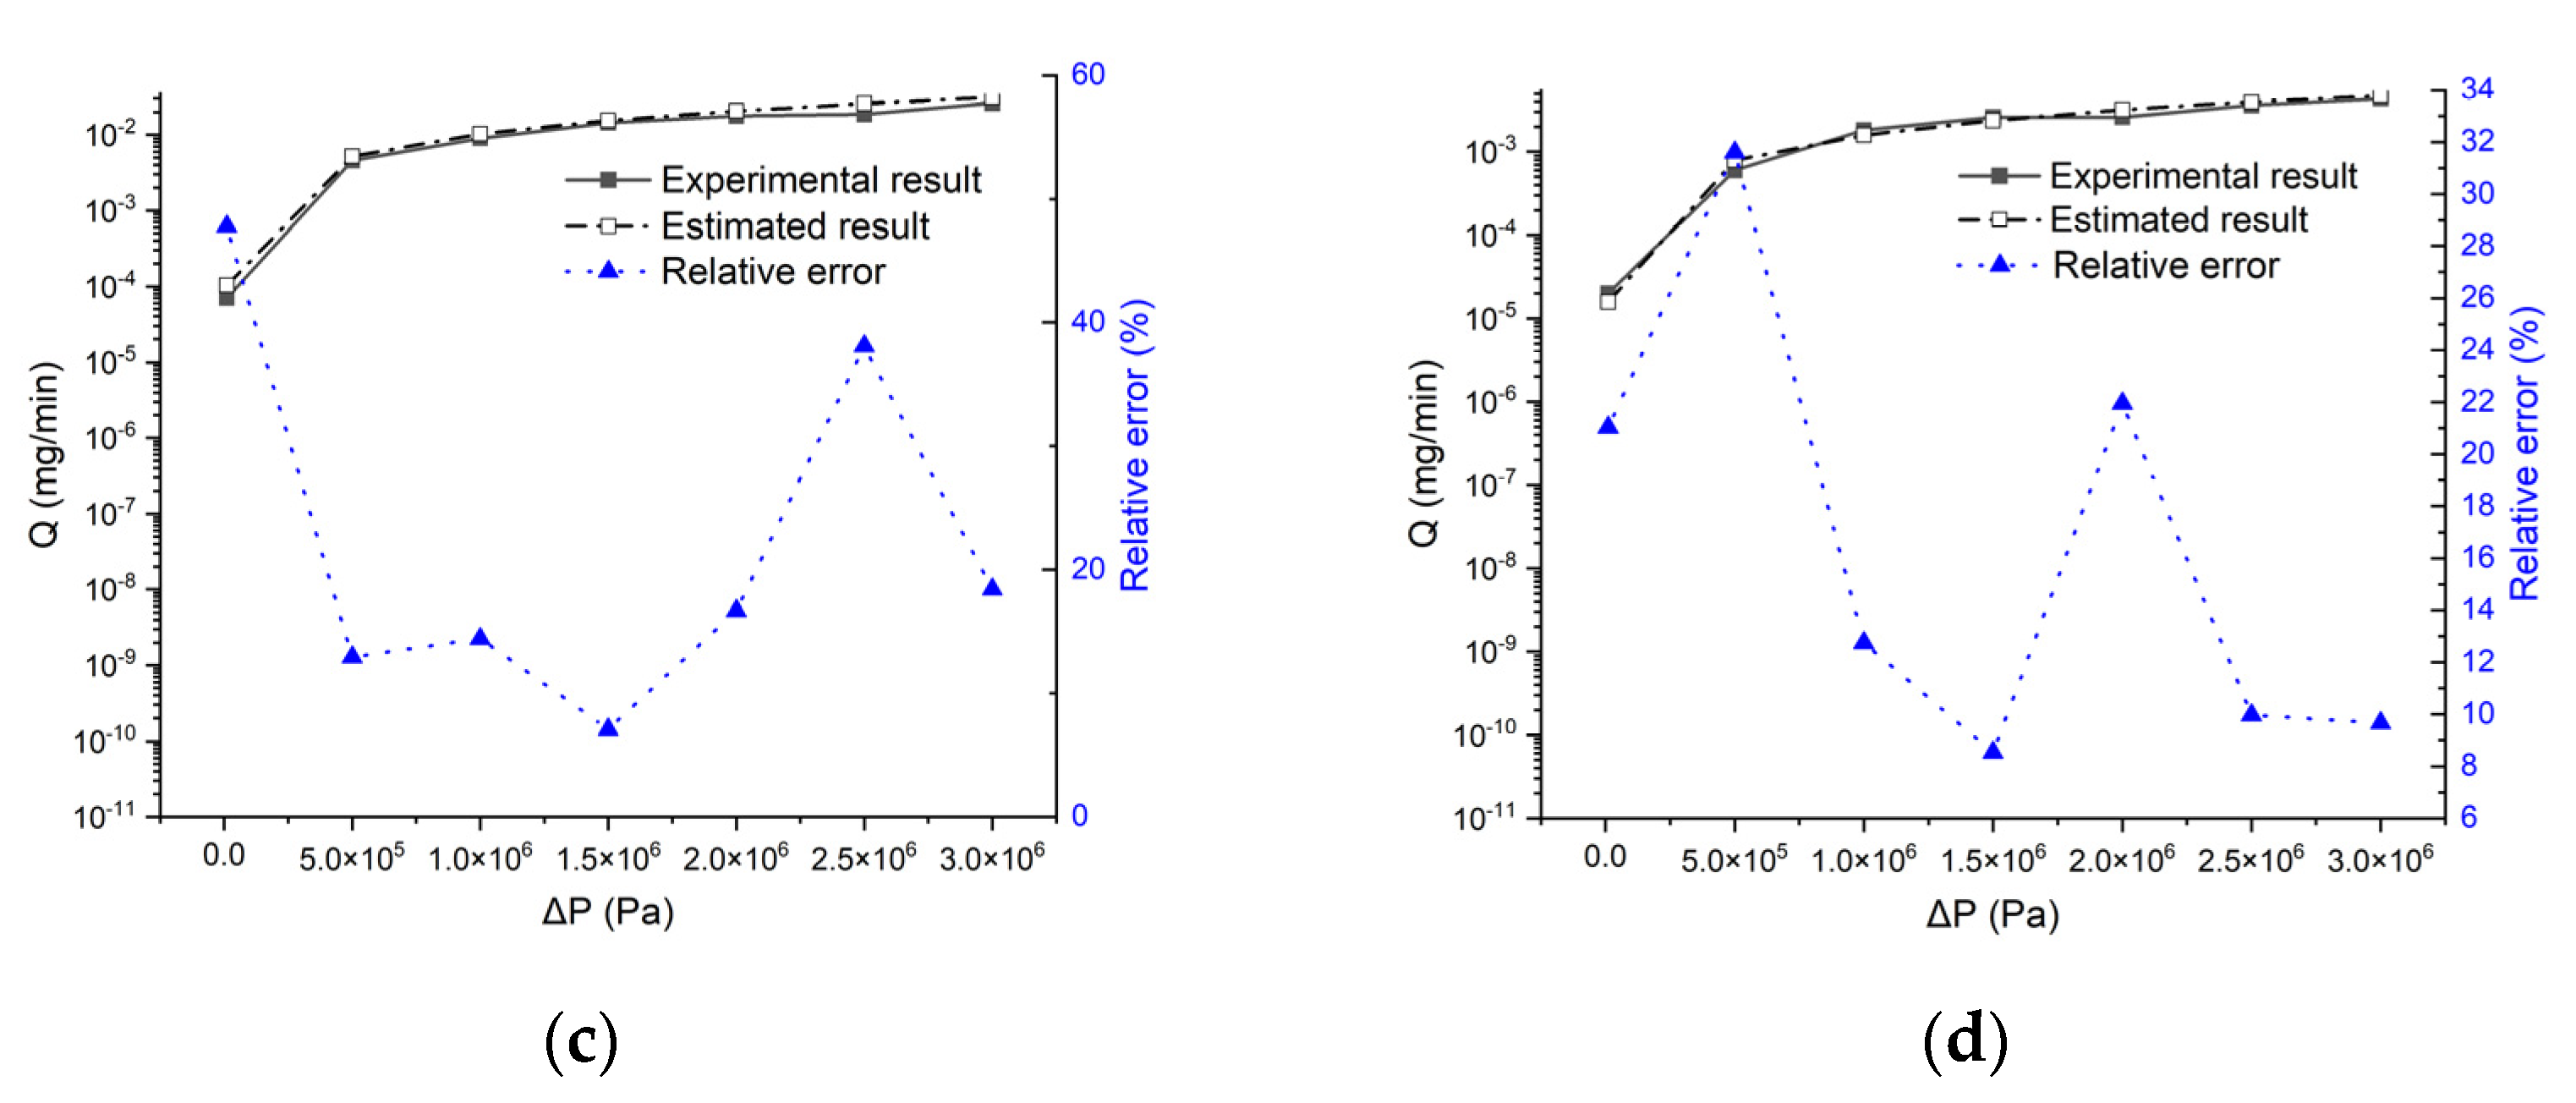
It can be seen from Figure 11 that the changing trend of the leakage rate with the fluid pressure difference calculated by the proposed model is in good agreement with the test results of Marie and Lasseux. The leakage rate Q increases with the increase in the fluid pressure difference Δ P . Especially when the contact pressure is 400 MPa and 500 Mpa, the theoretical calculation results are in good agreement with the experimental test results. When the contact force P c a is small ( P c a 300 Mpa), the calculation results of the proposed model have a large deviation from the test results. The reason for the large deviation may be that, when the contact pressure is small, the average separation distance between the two sealing surfaces is large. At this time, most of the micro-asperities on the metal sealing surface are still in a free state, and the sealing surface does not form an effective seal. However, the existence of the deviation does not affect the good trend consistency between the calculated values and the test values, which proves the feasibility and credibility of the metal-to-metal seal leakage rate model established in the present work.

4. Discussion

In order to investigate the influence of fractal parameters of sealing surface and contact pressure on intrinsic parameters of porous medium space, the material parameters used in this section are Young’s modulus E = 99.2342 × 10 9 N/m2, Poisson’s ratio υ = 0.27 and hardness H = 0.546 × 10 9 N/m2, and this material is exactly the material used for a 74° cone tube connector, which is used to connect and seal the oil drain pipeline of the emergency oil drain accessory of a certain type of aero-engine. The sampling length and the cut-off length are L = 0.8 × 10 3 m and L s = 1 × 10 9 m, respectively.

4.1. Influence of Fractal Parameters of Sealing Surface on the Intrinsic Parameters of the Porous Medium

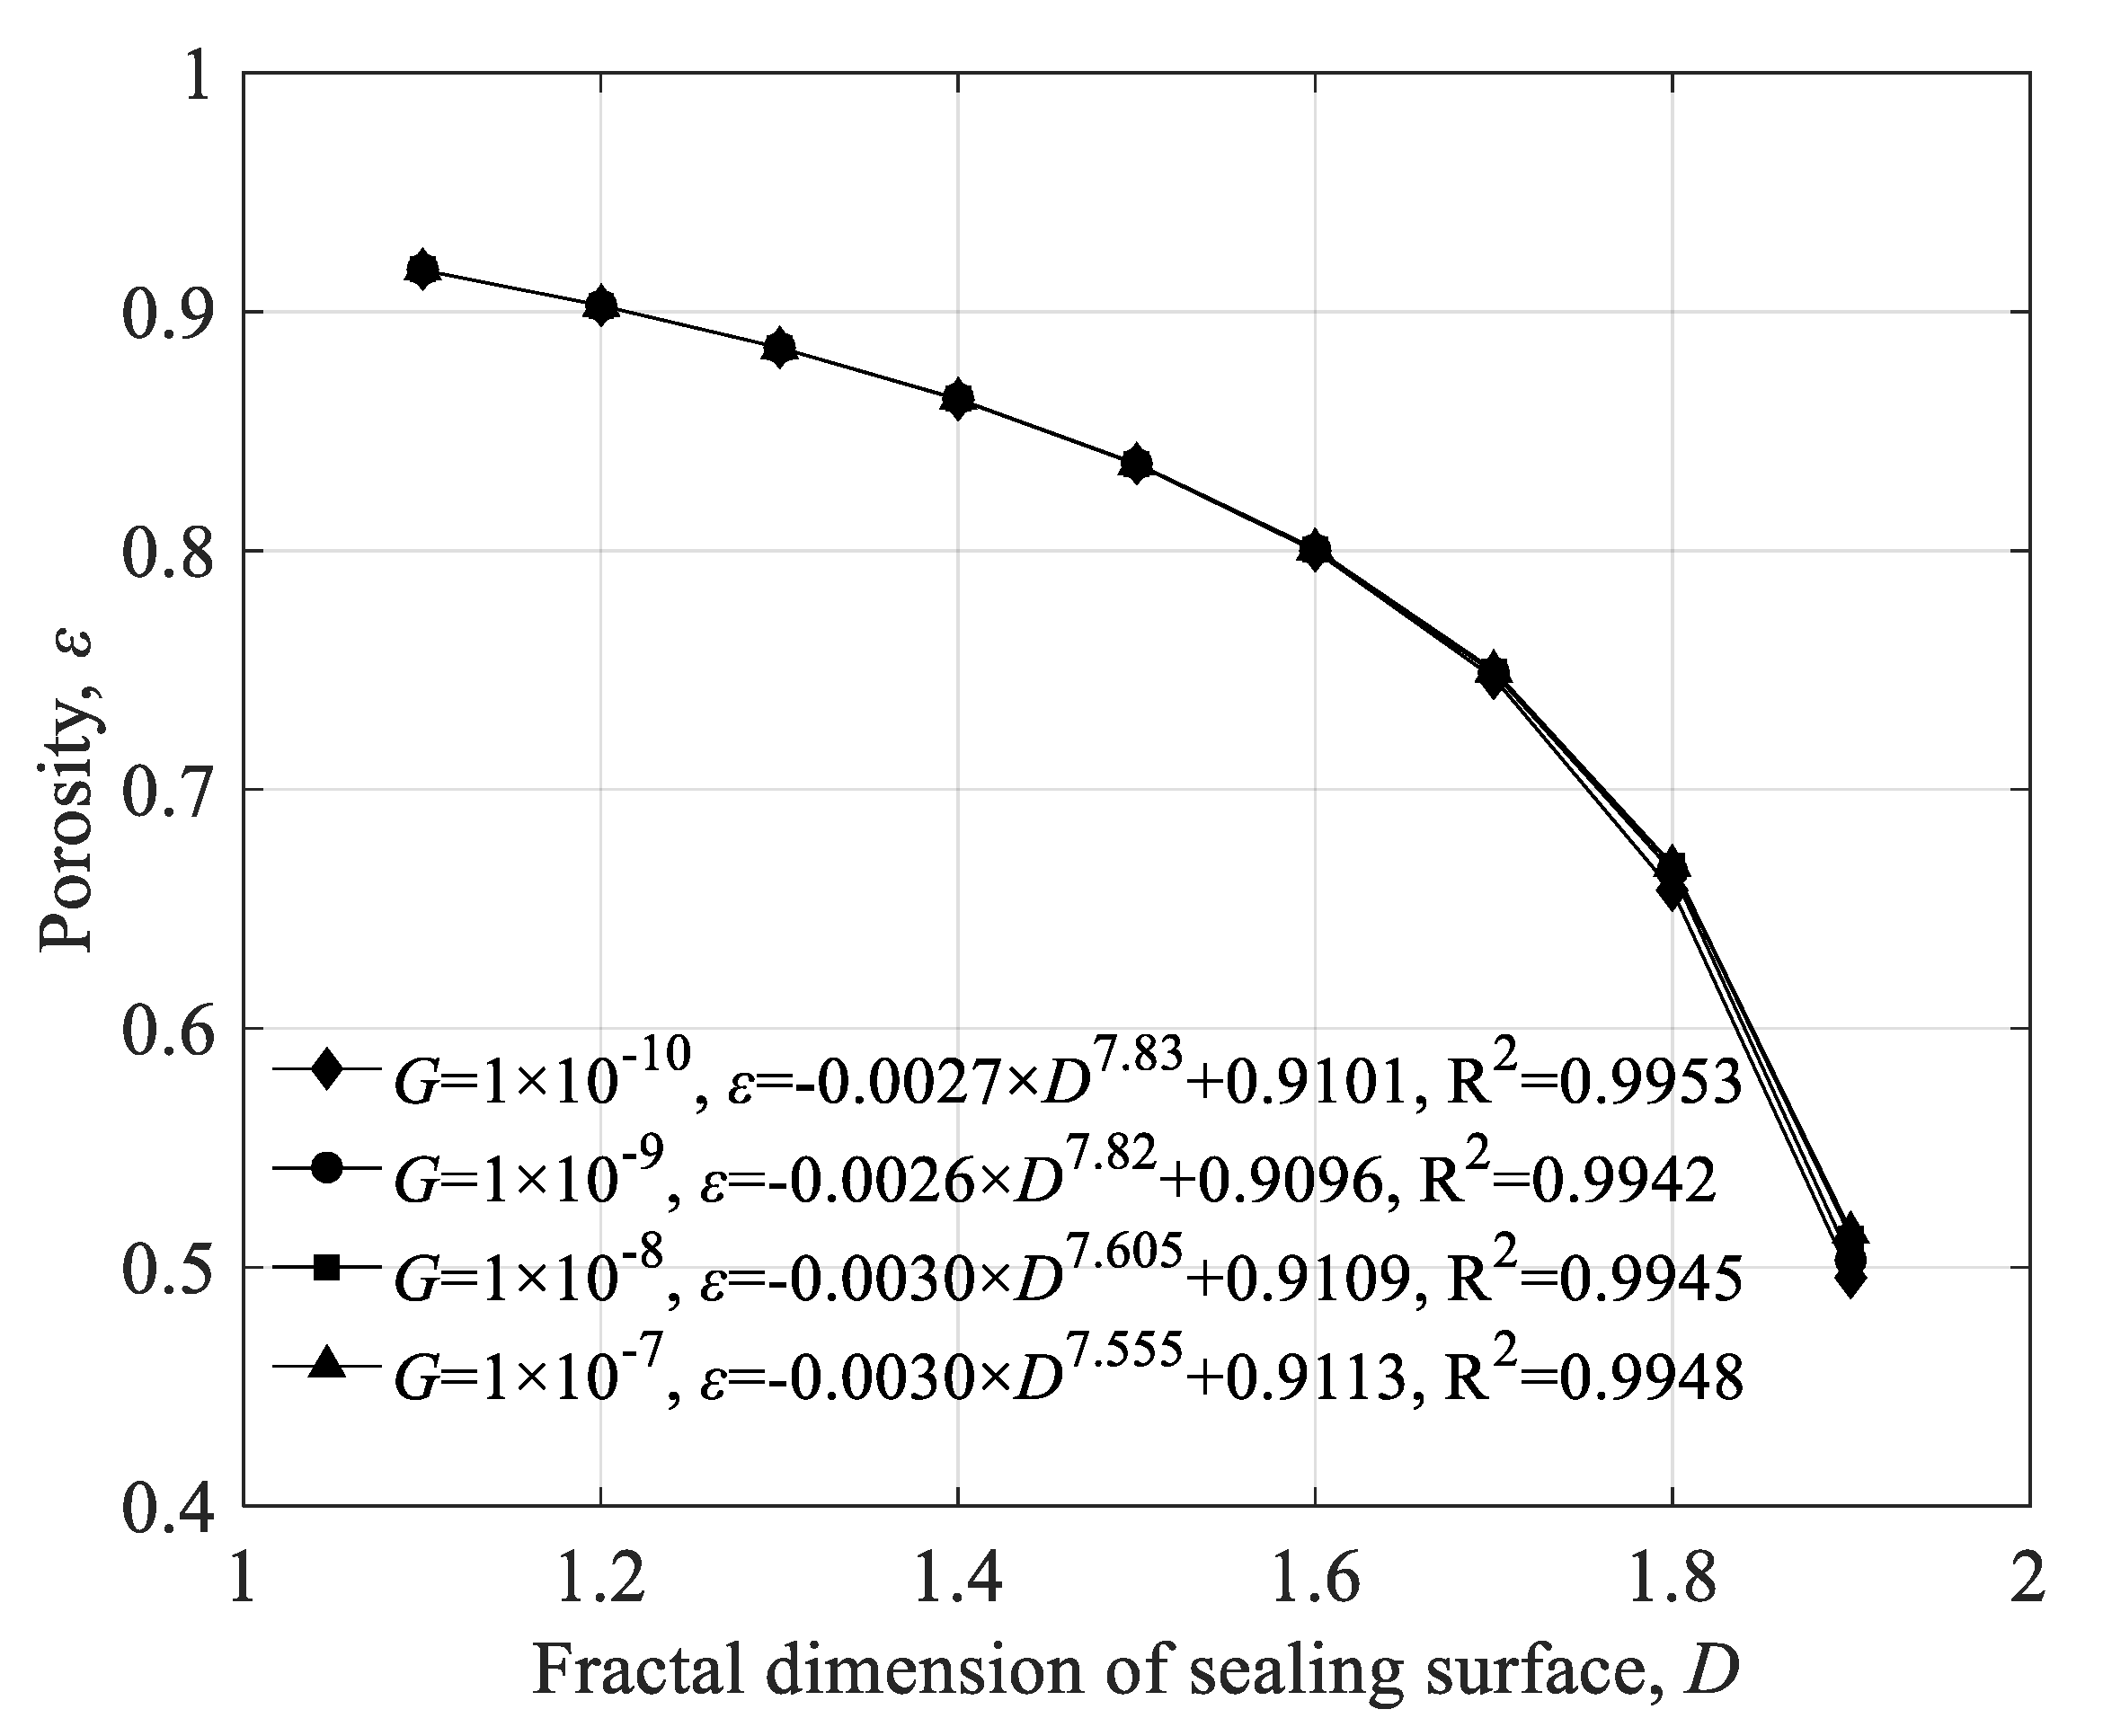
According to the previous analysis results, the topological morphology of the sealing surface has an important influence on the intrinsic parameters of the porous medium space. Figure 12 shows the variation in porosity ε with the fractal parameters of the sealing surface. It can be seen from Figure 12 that ε gradually decreases as the fractal dimension D increases. This is because, the larger the fractal dimension D , the more complex the contour structure of the sealing surface. An increase in the complexity of the rough surface profile implies an increase in the number of asperities at different scales, and the solid volume in the porous medium space accounts for a larger proportion of the total volume. Therefore, ε decreases as D increases. When the characteristic length scale G takes different values, the porosity ε corresponding to the same fractal dimension D is almost the same, indicating that the influence of G on the porosity ε is not obvious.
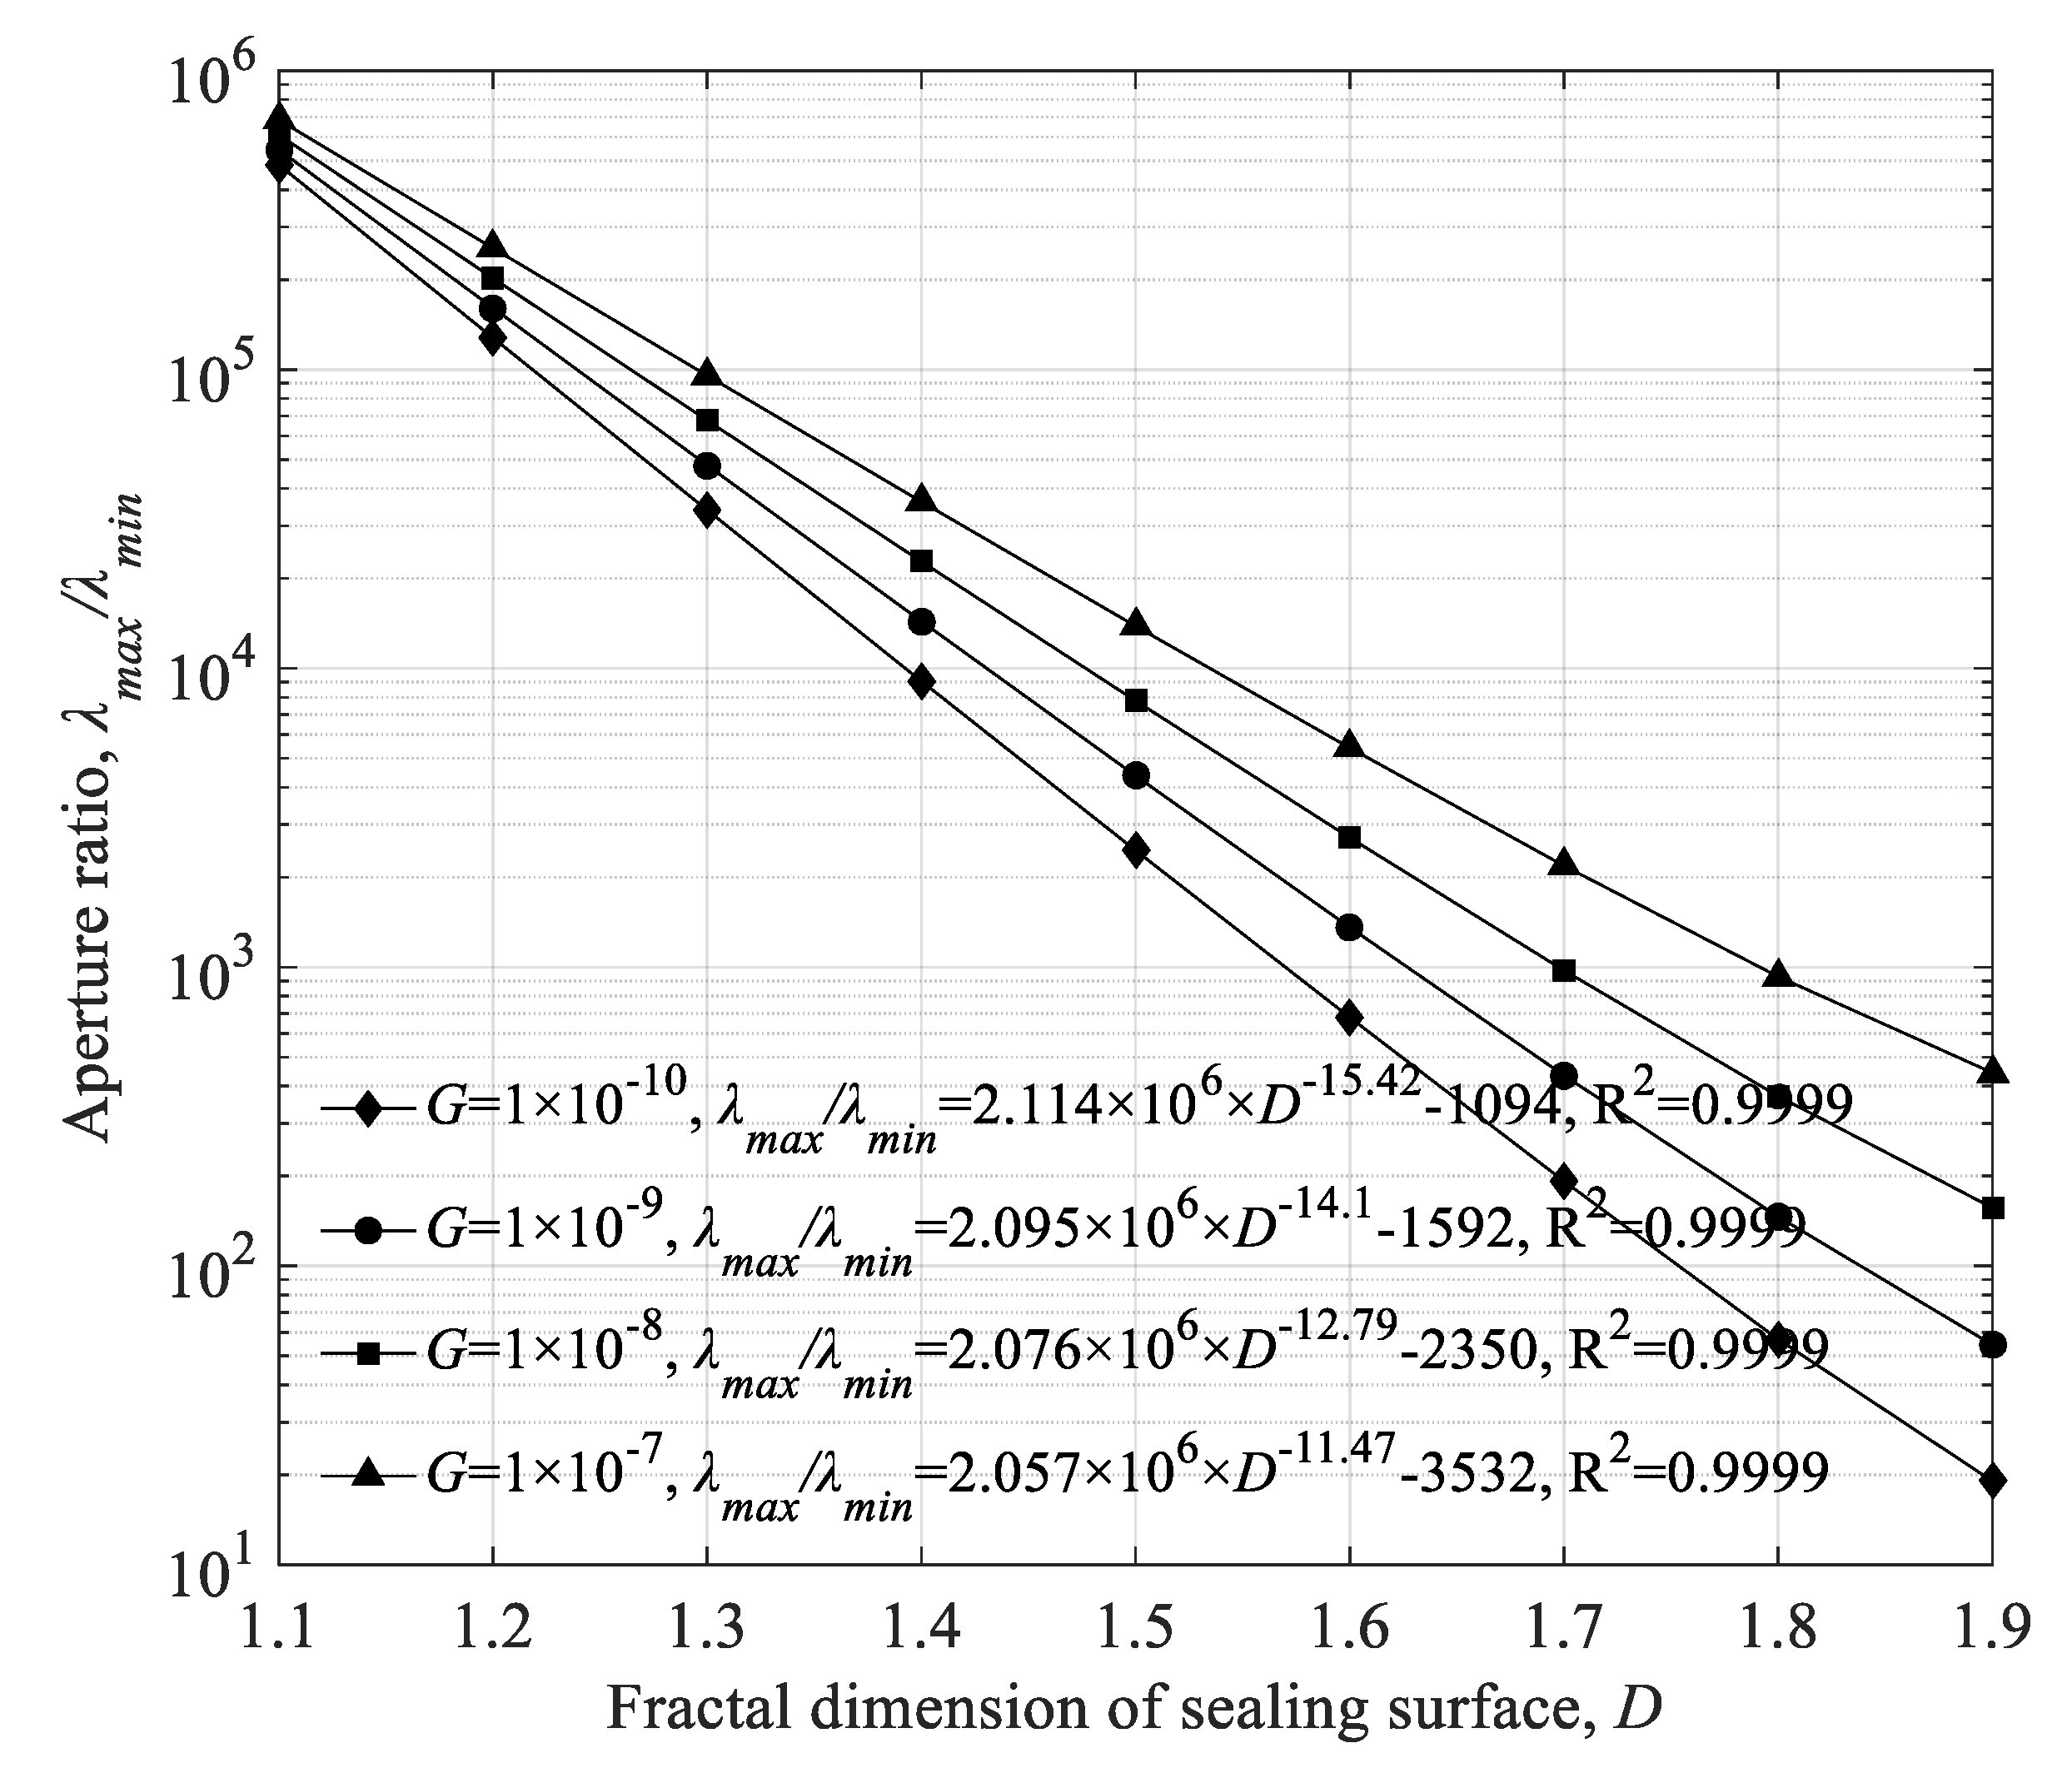
Figure 13 shows the influence of the sealing surface fractal parameters on the aperture ratio λ max / λ min of the porous medium space. From Figure 13, we can see that the aperture ratio λ max / λ min decreases with the increase in D . This is because, the larger the fractal dimension of the rough sealing surface, the flatter the sealing surface, resulting in a reduction in the maximum aperture λ max under the same load. Moreover, the minimum aperture λ min remains almost unchanged. The value of λ max / λ min thus decreases with the increase in D . Moreover, Figure 13 also indicates that the value of λ max / λ min increases as the G value increases. This is because, the larger the value of G , the more severe the fluctuation of the sealing surface profile and the larger the value of λ max , while the value of λ min is almost unchanged. Therefore, the value of λ max / λ min increases with the increase in G . In addition, according to Figure 13, it can be seen that D and G have a significant impact on λ max / λ min . When D and G take different values, the corresponding λ max / λ min spans nearly six orders of magnitude, which will undoubtedly have a very large impact on the porous medium space.
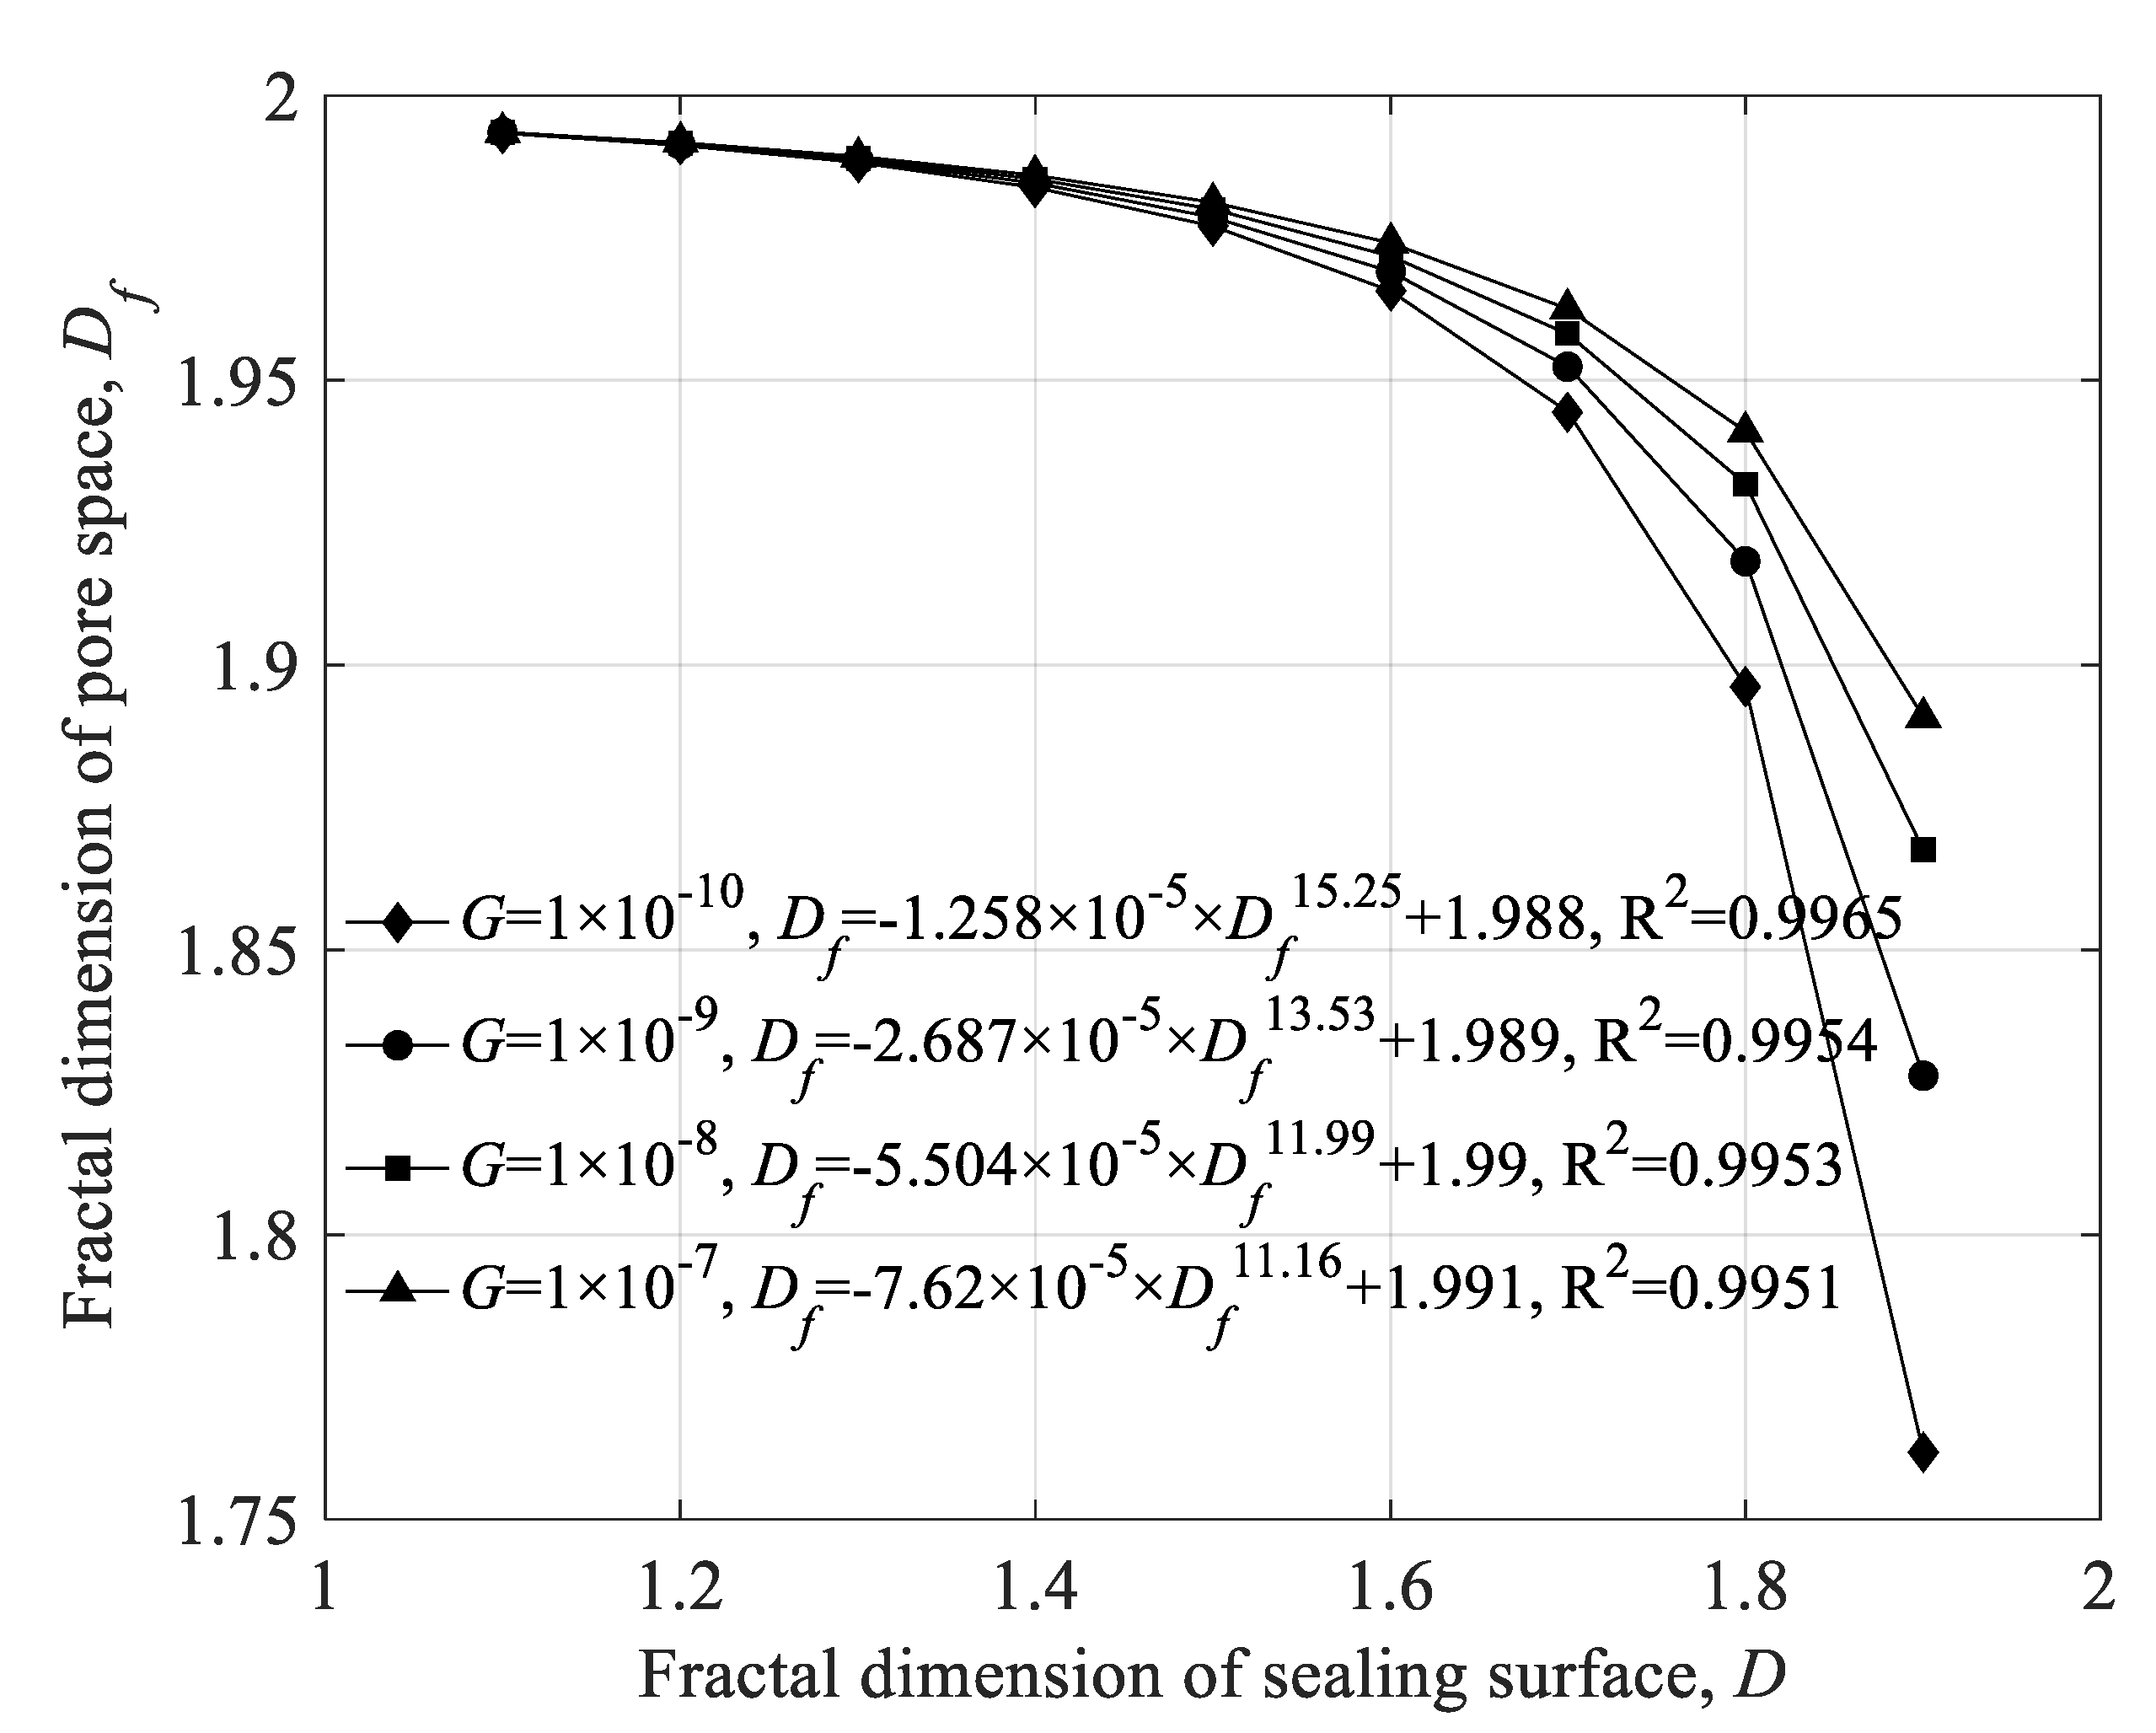
The influence of the sealing surface parameters on the fractal dimension of the porous medium space D f is shown in Figure 14. It can be seen that, when G is constant, D f decreases with the increase in D , and the decrease rate of D f gradually increases. Moreover, when D is constant, G has no obvious influence on the fractal dimension of pore space D f . However, when D > 1.6, the influence of G on D f is significantly higher than the influence of G on D f when D < 1.6.
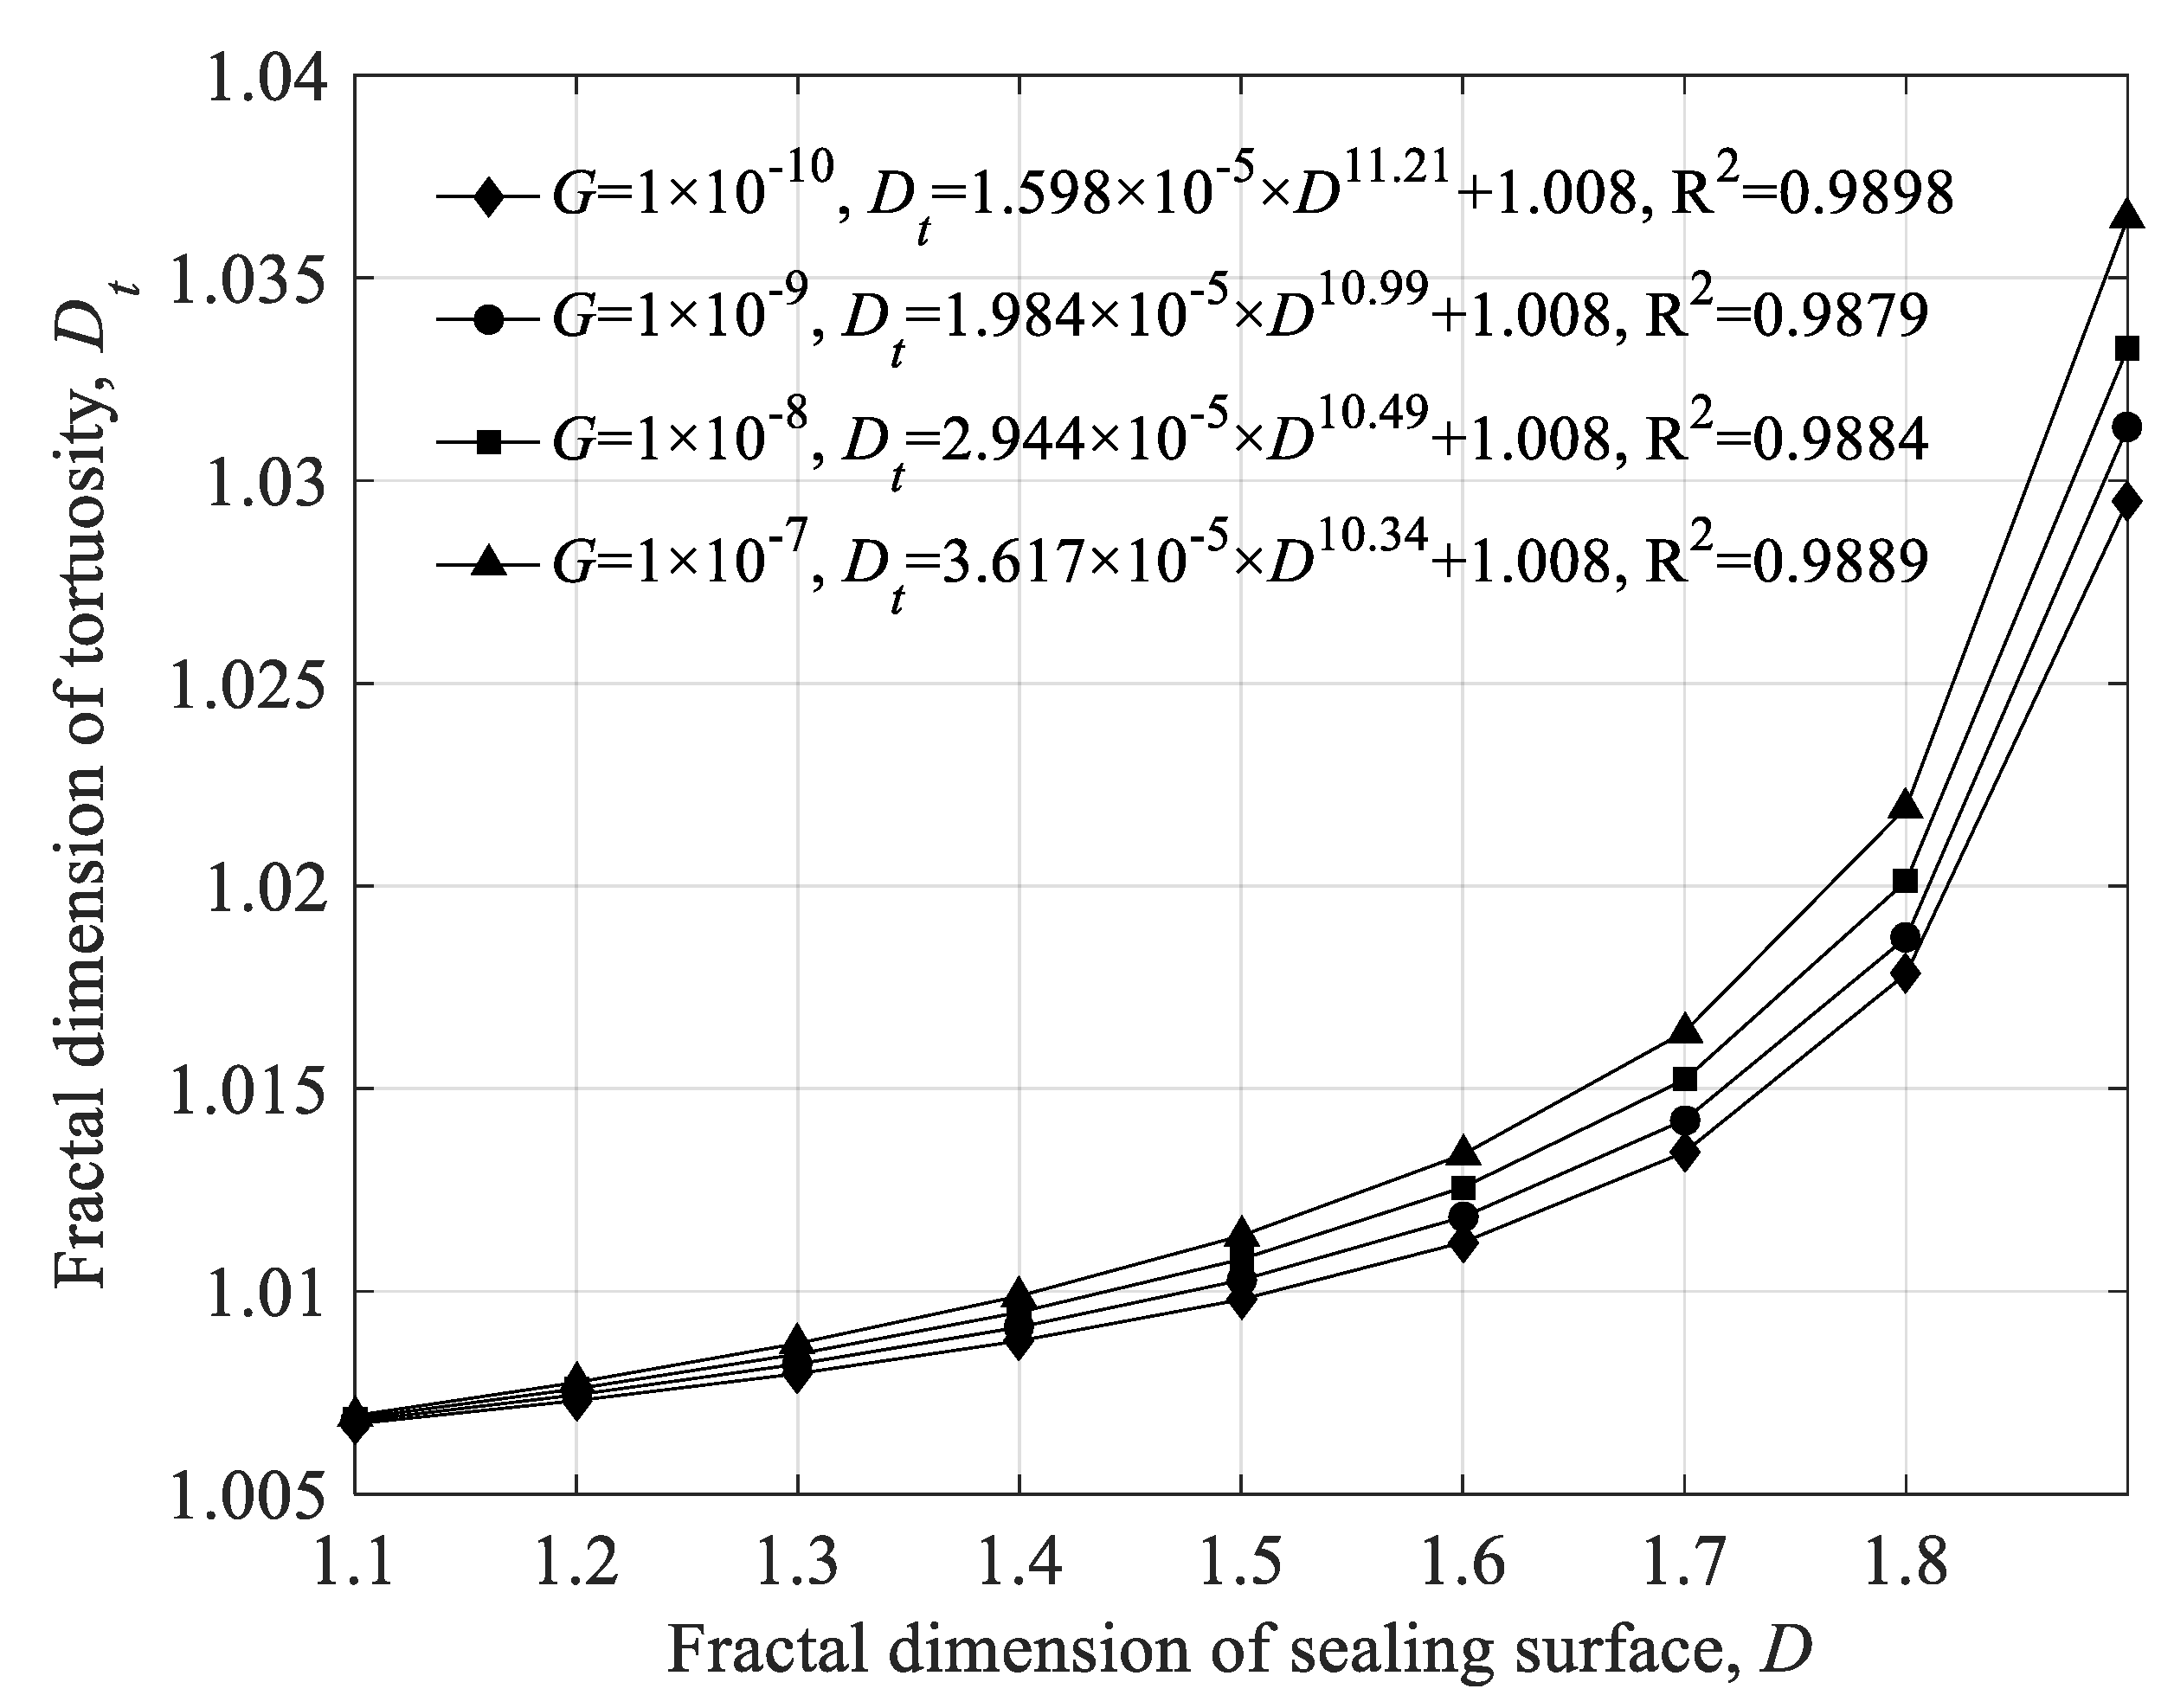
Figure 15 denotes the influence of sealing surface fractal parameters on the value of tortuosity fractal dimension D t . It can be seen from Figure 15 that D t . increases with the increase in D , and the increase rate of D t gradually increases. This is because, the larger the value of D , the more complex the contour structure of the sealing surface and the richer the details. The real length of the leakage of the sealing medium along the leakage microchannel will increase, while the linear length of the leakage of the sealing medium stays unchanged. Therefore, the tortuosity D t will increase, resulting in an increase in D t . In addition, according to Figure 15, when D is a constant value, the larger the value of G , the larger the value of D t . In the whole value range, the change in D t value caused by the change in D and G does not exceed 3.2%. Therefore, it can be considered that the fractal parameters of the sealing surface have a significant effect on the tortuosity fractal dimension of the microporous structure.

4.2. Influence of Contact Pressure on the Intrinsic Parameters of the Porous Medium

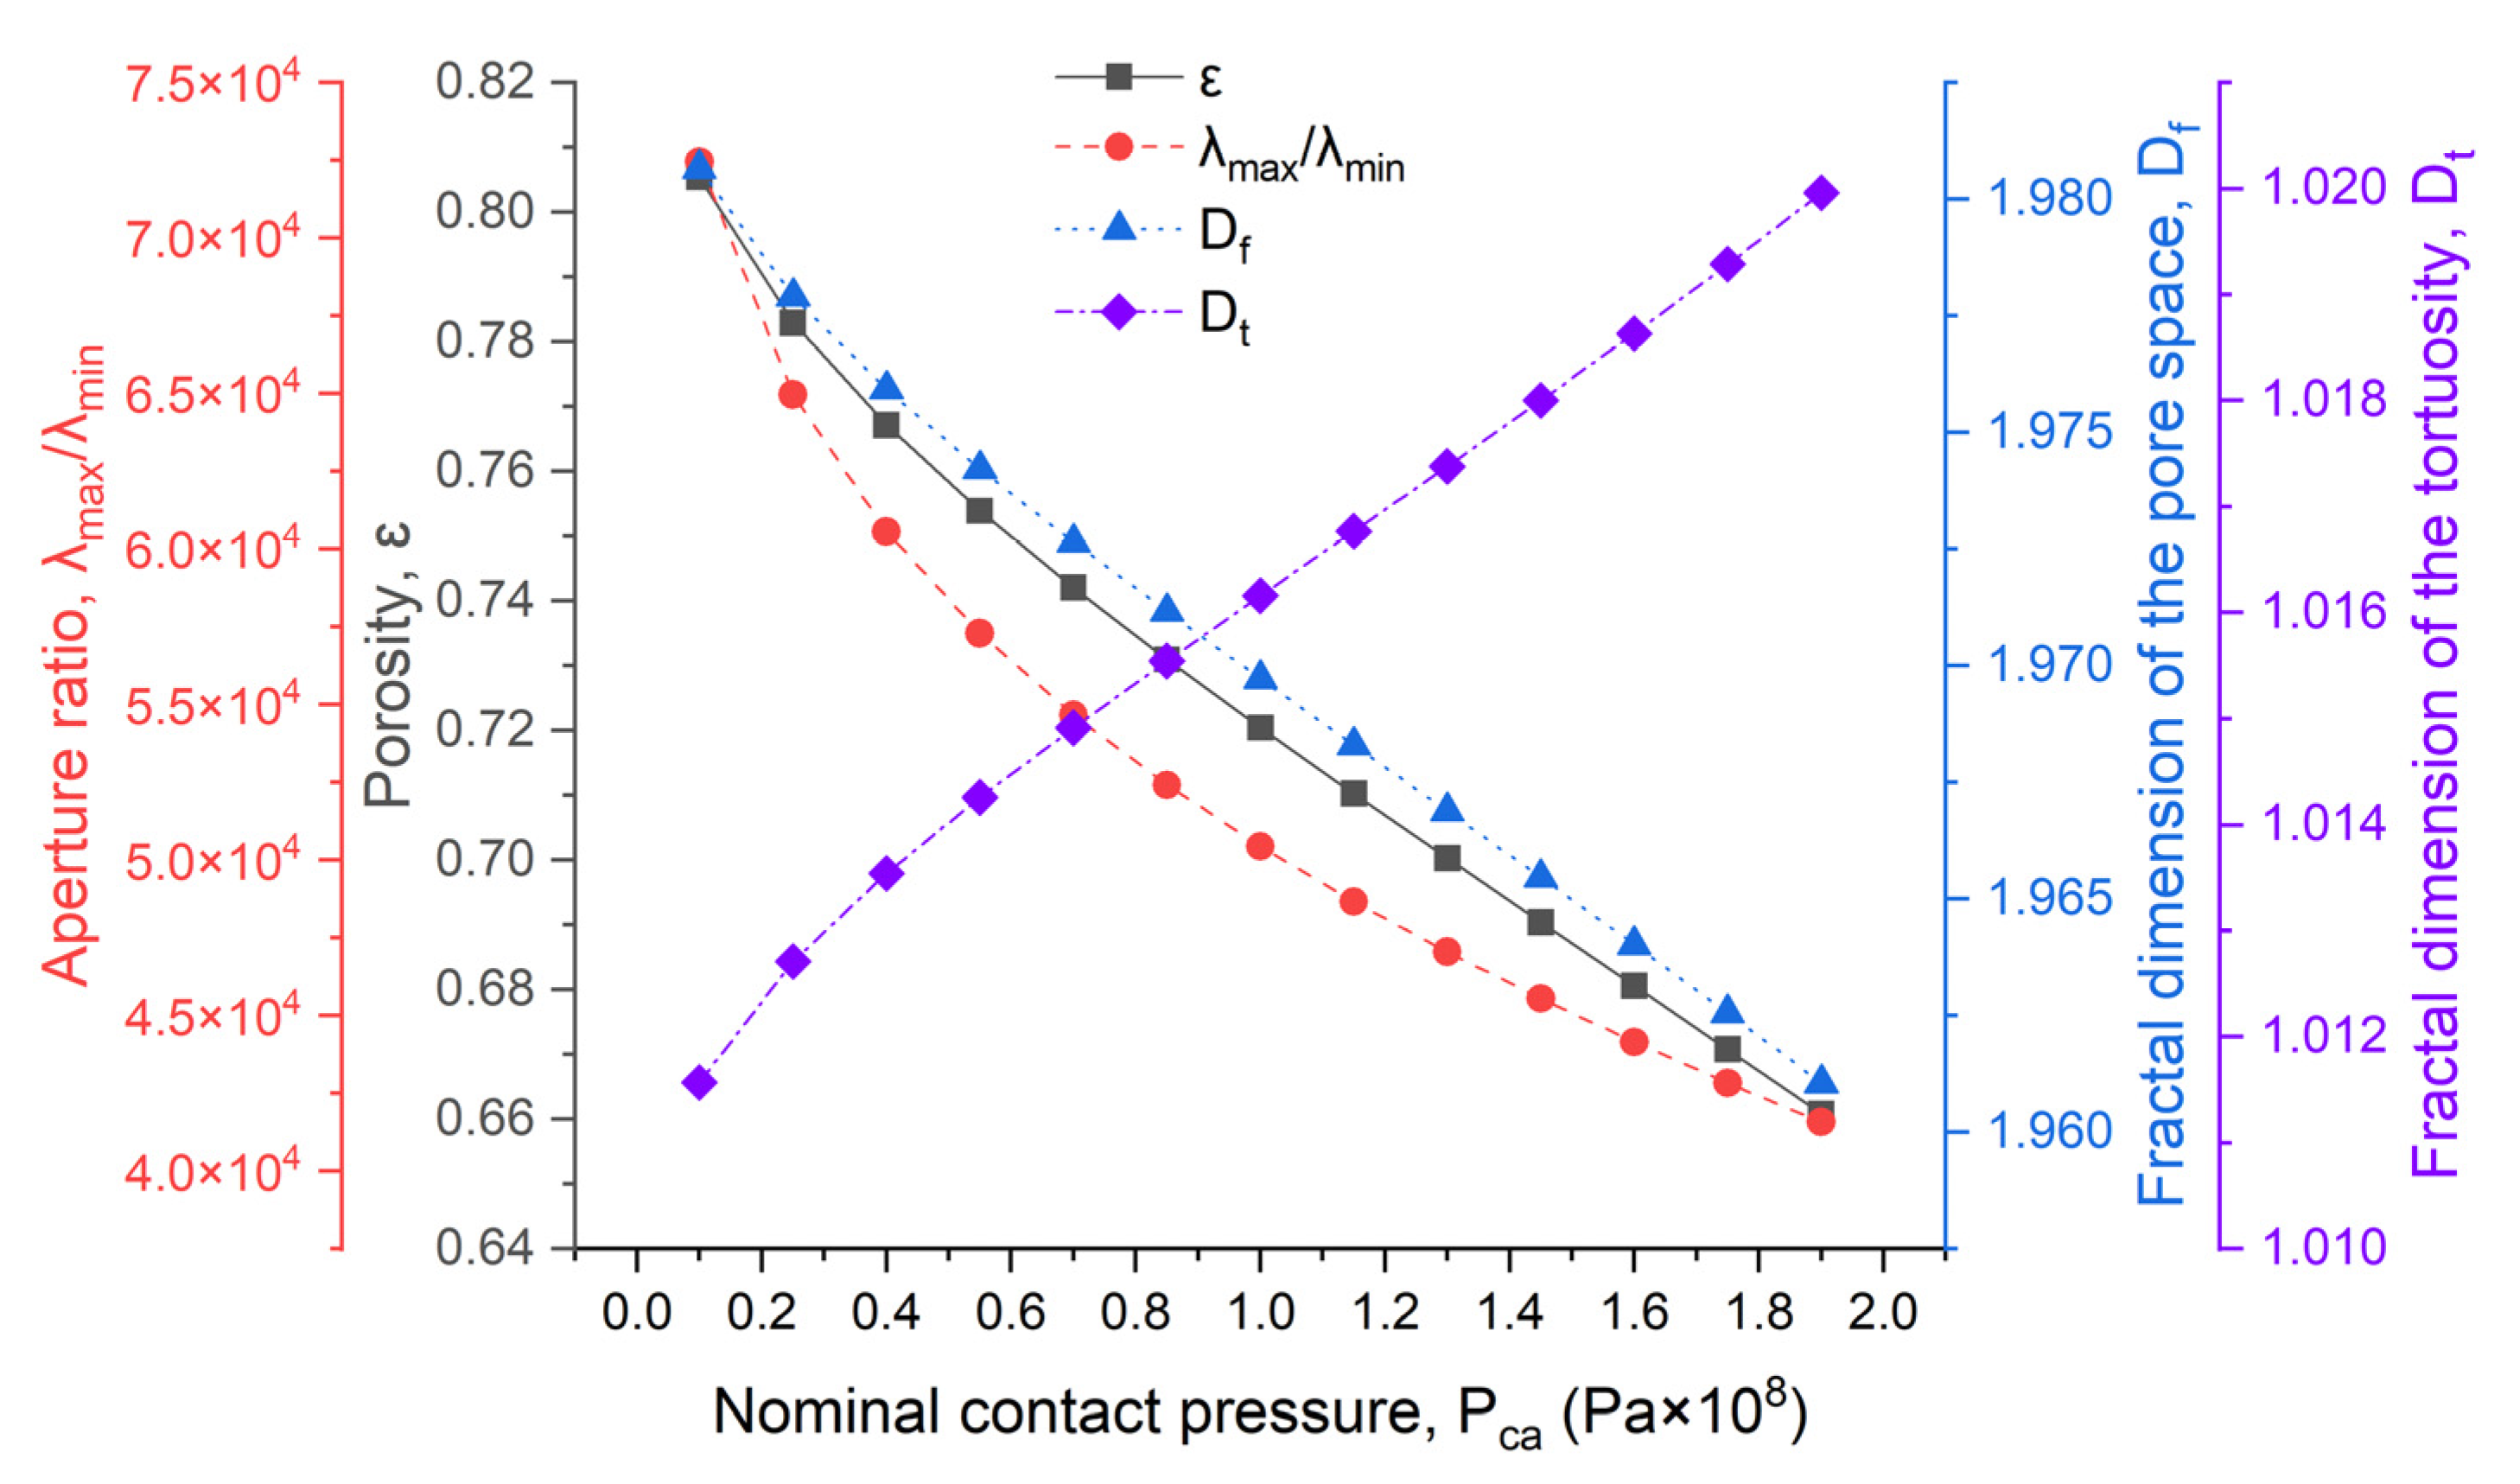
The influence of contact pressure on the intrinsic parameters of the porous medium is shown in Figure 16. According to Figure 16, the porosity ε of the porous medium space gradually decreases with the increase in the contact pressure P c a . This is because, as the contact pressure increases, the deformation of the asperities on the sealing surface increases, and the number of asperities in contact also increases. Therefore, the volume of the pores in the porous medium space gradually shrinks. As a result, the porosity gradually decreases.
According to Figure 16, the aperture ratio gradually decreases when the contact pressure increases. When the contact pressure increases, the deformation of the asperities on the sealing surface will increase, thereby reducing the effective height of the pore space h . The proposed model in the present work assumes that the effective height of the pore space is equal to the maximum pore size. Therefore, as the contact pressure increases, the maximum aperture λ max will decrease. Moreover, the present work assumes that the capillary cross-sectional area determined by the minimum aperture λ min of the porous medium space is equal to the longitudinal cross-sectional area of the smallest asperity before deformation. Further, the longitudinal cross-sectional area of the smallest asperity does not change with the change in the contact pressure. Thus, the change in the contact pressure will not affect the minimum aperture λ min . This assumption is reasonable because there will always be some minimal leakage microchannels that will not be obstructed caused by the asperity deformation no matter how large the contact load P c a is and no matter how much deformation of the asperity occurs if the fractal characteristics of the sealing surface are strong enough. Therefore, as the contact pressure increases, the maximum aperture λ min decreases and the minimum aperture λ min remains unchanged, resulting in a decrease in the aperture ratio λ max / λ min as the contact pressure increases.
Figure 16 also reveals that there will be a gradual drop in the fractal dimension D f of the porous medium space when the nominal contact pressure P c a increases. This is because, when the contact pressure increases, the number of asperities in contact will increase. This process will gradually reduce the whole volume of the porous medium space and the number of leakage microchannels with different diameters. Therefore, the complexity and the richness of details of the topography will decrease with an increase in contact pressure. Thus, D f will decrease with the increase in contact pressure P c a .
Moreover, it can be seen from Figure 16 that the value of D t increases with the increase in nominal contact pressure P c a . This is because contact, interpenetration and mating will occur between more asperities at the sealing interface with the increase in nominal contact pressure. This change process will bring about two results: one is to block some leakage microchannels; the second is that the leakage microchannel will not be blocked but will become more curved than before. From the definition of tortuosity, it can be seen that, the more curved the leakage microchannel is, the greater the value of D t will be. Therefore, the value of D t increases with the increase in P c a .

4.3. Influence of Fractal Parameters of Sealing Surface and Contact Pressure on the Leakage Rate

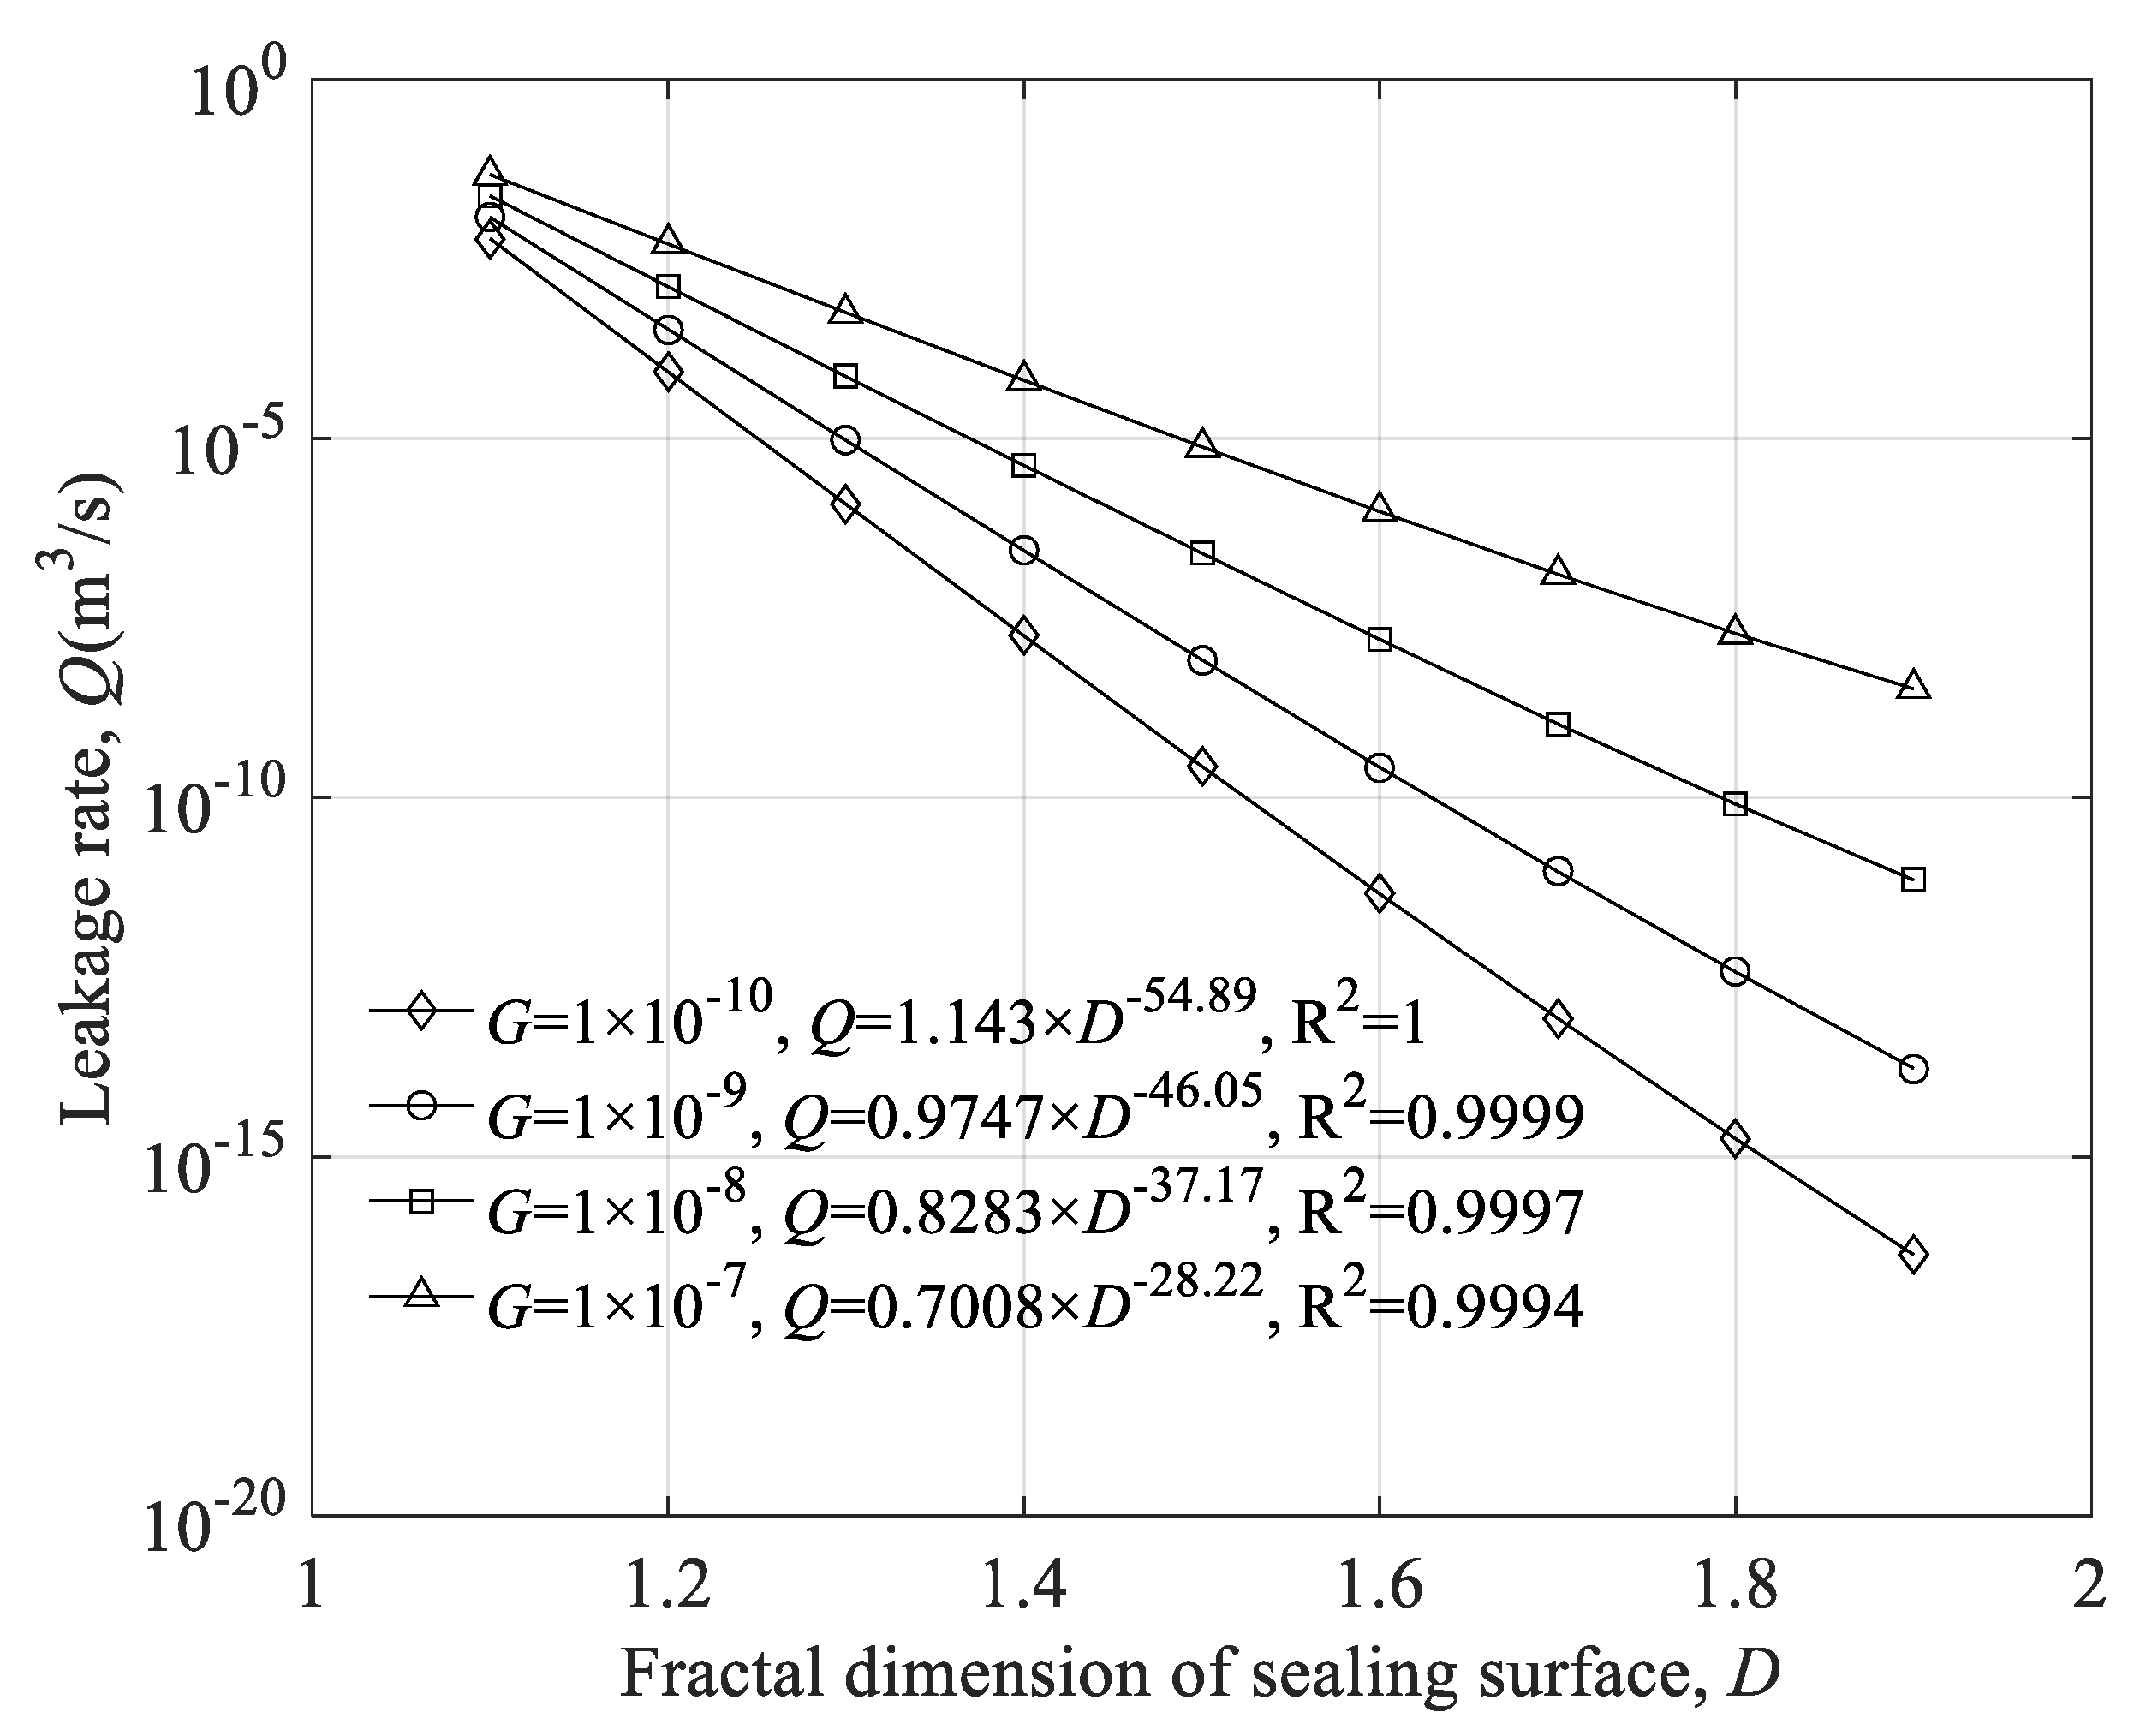
Figure 17 shows the relationship between the leakage rate Q and the fractal parameters D and G of the sealing surface under contact pressure P c a = 71.249 MPa. Further, the pressure difference of the sealing medium is Δ p = 10 MPa. The sealing medium used here is #3 aviation kerosene in China National Standard, whose dynamic viscosity is μ = 9.6875 × 10 4 kg/(m·s). According to Figure 17, the leakage rate decreases with the increase in fractal dimension D , and, when D is constant, the smaller the value of G , the smaller the leakage rate. This is because, when other conditions remain unchanged, the leakage rate of the metal-to-metal seal is primarily affected by the processing morphology of the sealing surface. According to the previous analysis, when the value of D increases and/or the value of G decreases, the undulation degree of the sealing surface decreases and the pore volume of the microporous structure of the sealing surface also decreases; i.e., the porosity decreases. Therefore, the leakage rate of the sealing medium decreases as the value of D increases and it decreases as the value of G decreases. According to the analysis above, the larger the value of D and/or the smaller the value of G , the smoother the sealing surface. That is, reducing the roughness of the sealing surface helps to improve the sealing performance of the metal-to-metal seal.
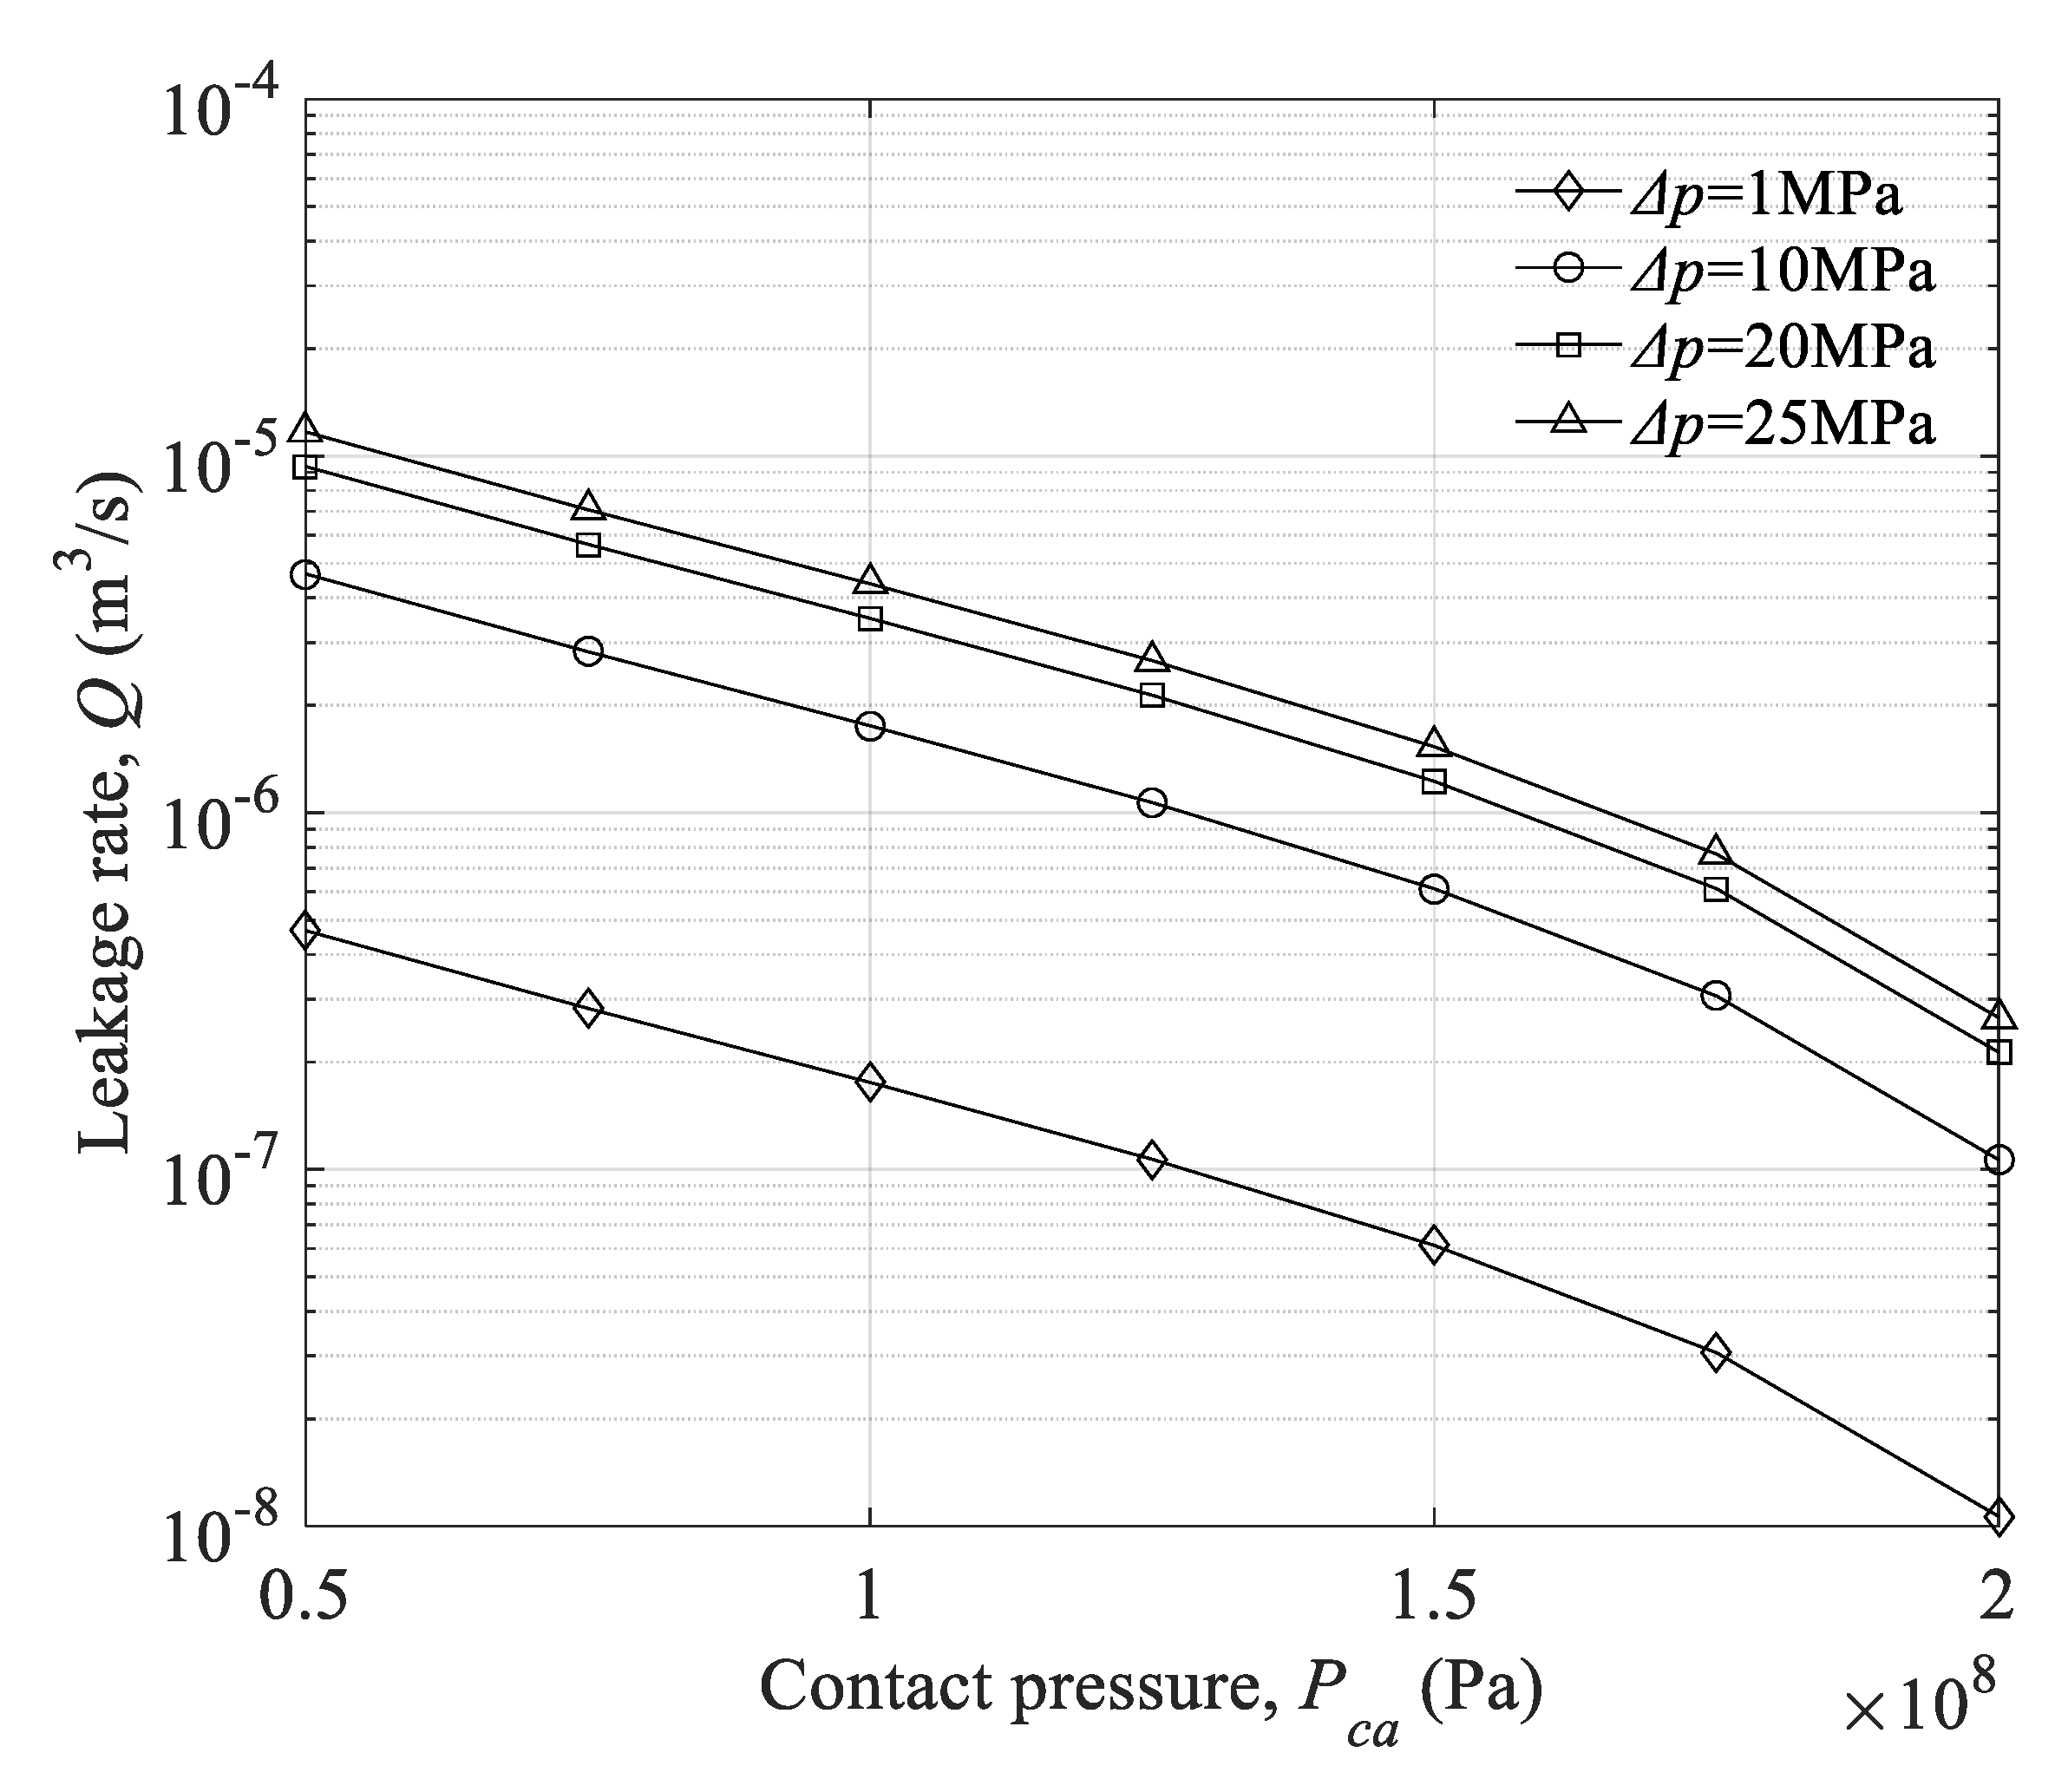
Figure 18 shows the influence of contact pressure on leakage rate. The topography parameters are D = 1.4622, G = 7.0866 × 10 8 m. It is evident from Figure 18 that the leakage rate decreases with the increase in contact pressure. In addition, the leakage rate will increase when the fluid pressure difference Δ p increases, and, the greater the fluid pressure difference of the sealing medium, the more significant its influence on the leakage rate.

5. Conclusions

In the present work, based on the fractal theory of porous medium, a leakage rate model for metal-to-metal seals considering the influence of sealing surface topography is established. The establishment of this model makes it possible to quantitatively analyze the influence of sealing surface topography and contact pressure on the intrinsic parameters of the sealing area and the leakage rate for metal-to-metal seals. It should be noted that the proposed leakage rate model assumes that the contact pressure on the sealing surface is uniform. This assumption is applicable when the size of the metal-to-metal seal is small. If the size of the metal-to-metal seal is too large, it is difficult to ensure that the contact load is uniformly applied on the sealing surface. For example, the non-uniformity of the preload, the deformation of the sealing surface and the possible wear of the sealing surface may affect the uniformity of the contact pressure. These factors are not considered in the proposed model. Therefore, if the size of the metal-to-metal seal is too large, satisfactory results may not be obtained.
The main achievements and conclusions of the present work are as follows:
(1)
The topography parameters of the sealing surface have a significant influence on the porosity, aperture ratio and fractal dimension of pore space among the intrinsic parameters of the sealing area, especially considering that the effect on the aperture ratio spans nearly six orders of magnitude, while the surface structure parameters have no significant effect on the fractal dimension of tortuosity.
(2)
Porosity, aperture ratio and fractal dimension of pore space decrease with an increase in contact pressure, while the fractal dimension of tortuosity increases with an increase in contact pressure.
(3)
The sealing surface topography parameters have an important influence on the leakage rate of metal-to-metal seals, and, the smoother the sealing surface, the lower the leakage rate of the metal-to-metal seal.
(4)
The leakage rate of the metal-to-metal seal decreases with an increase in the contact pressure of the sealing surface, and, if the fluid pressure difference of the sealing medium is too large, the sealing performance of the metal-to-metal seal will be seriously reduced.

Author Contributions

Conceptualization, Y.L. and H.D.; methodology, Y.L. and X.R.; software, X.R.; validation, B.L., J.Q. and F.Y.; formal analysis, Y.L. and B.L.; investigation, H.D. and J.Q.; resources, X.R.; data curation, H.D. and X.R.; writing—original draft preparation, Y.L.; writing—review and editing, H.D.; visualization, Y.L., H.D. and X.R.; supervision, F.Y.; project administration, Y.L.; funding acquisition, Y.L. All authors have read and agreed to the published version of the manuscript.

Funding

This research was co-funded by the Scientific Research Project of Tianjin Municipal Education Commission (No. 2020KJ017) and the Fundamental Research Funds for the Central Universities of the Civil Aviation University of China (No. 3122019093).

Data Availability Statement

The data used to support the findings of this study are included within the article.

Conflicts of Interest

The authors declare no conflict of interest.

Nomenclature

d /(m)Separation distance between the rigid flat plane and the mean plane
D Fractal dimension of the 2D rough surface
D E Fractal dimension of Euclidean space
D f Fractal dimension of the pore space
D s Fractal dimension of the 3D rough surface
D t Tortuosity fractal dimension of the leakage microchannel
E /(Pa)Young’s modulus
f ( λ ) Probability density function of the pore distribution
G /(m)Characteristic length scale of the rough surface
h /(m)effective height that can provide an effective channel for the leakage of the sealing medium
H /(Pa)Material hardness
L 0 /(m)Linear length or characteristic length along the direction of the macroscopic pressure gradient of the fluid
l n /(m)Base diameter of the asperity on the frequency level n
L /(m)Sampling length
L s /(m)Length scale of the asperity or contact spot at frequency level n max
L t /(m)Curved streamline length
M Number of superposed ridges used to simulate the surfaces
n min Low cut-off frequency level
n max High cut-off frequency level
n ( V ) Volume distribution function
N t Total number of leakage microchannels
N V Number of asperities per unit area with a volume larger than
Δ P /(Pa)Fluid pressure difference
P c a /(Pa)Contact force
q ( λ ) /(mg/min)Flow rate of the sealing medium through a single leakage microchannel with a diameter of λ
Q /(mg/min)Leakage rate
R q /(m)Root mean square deviation of the rough surface profile
V max /(m3)Volume of the largest asperity
V min /(m3)Volume of the smallest asperity
V n /(m3)Volume of a single asperity on the frequency level n
V p /(m3)Pore volume of a group of pores
V s /(m3)Total asperity volume of a rough surface
V t /(m3)Total volume of a group of pores
ε Porosity
ϕ m , n Random phase
γ Scaling parameters for the Weierstrass–Mandelbrot function
λ /(m)Pore size or cross-sectional diameter of the leakage microchannel
λ a v /(m)Average diameter of the cross-section of the leakage microchannels
λ max /(m)Pore size of the largest leakage microchannel
λ min /(m)Pore size of the smallest leakage microchannel
μ /(Pa·s)Dynamic viscosity
ρ /(Kg/m3)Fluid density
τ a v Average tortuosity
τ t Tortuosity
υ Poisson’s ratio
ω /(m)contact interference

References

  1. Zhai, J.; Li, J.; Wei, D.; Gao, P.; Yan, Y.; Han, Q. Vibration Control of an Aero Pipeline System with Active Constraint Layer Damping Treatment. Appl. Sci. 2019, 9, 2094. [Google Scholar] [CrossRef] [Green Version]
  2. Li, Z.; Gao, P.; Zhao, D.; Liu, J. Fault diagnosis and location of the aero-engine hydraulic pipeline based on Kalman filter. Adv. Mech. Eng. 2017, 9. [Google Scholar] [CrossRef]
  3. Chen, Z.; Liu, Y.; Zhou, P. A Novel Method to Identify the Scaling Region of Rough Surface Profile. Fractals 2019, 27, 1950011. [Google Scholar] [CrossRef]
  4. Yan, Y.; Chai, M. Sealing failure and fretting fatigue behavior of fittings induced by pipeline vibration. Int. J. Fatigue 2020, 136, 105602. [Google Scholar] [CrossRef]
  5. Yan, Y.; Zhai, J.; Gao, P.; Han, Q. A multi-scale finite element contact model for seal and assembly of twin ferrule pipeline fittings. Tribol. Int. 2018, 125, 100–109. [Google Scholar] [CrossRef]
  6. Pérez-Ràfols, F.; Larsson, R.; Almqvist, A. Modelling of leakage on metal-to-metal seals. Tribol. Int. 2016, 94, 421–427. [Google Scholar] [CrossRef] [Green Version]
  7. Nitta, I.; Matsuzaki, Y. Experimental Study of the Performance of Static Seals Based on Measurements of Real Contact Area Using Thin Polycarbonate Films. J. Tribol. 2010, 132, 022202. [Google Scholar] [CrossRef]
  8. Abid, M.; Nash, D.H. A parametric study of metal-to-metal contact flanges with optimised geometry for safe stress and no-leak conditions. Int. J. Press. Vessel. Pip. 2004, 81, 67–74. [Google Scholar] [CrossRef] [Green Version]
  9. Murtagian, G.R.; Fanelli, V.; Villasante, J.A.; Johnson, D.H.; Ernst, H.A. Sealability of Stationary Metal-to-Metal Seals. J. Tribol. 2004, 126, 591–596. [Google Scholar] [CrossRef]
  10. Ledoux, Y.; Lasseux, D.; Favreliere, H.; Samper, S.; Grandjean, J. On the dependence of static flat seal efficiency to surface defects. Int. J. Press. Vessel. Pip. 2011, 88, 518–529. [Google Scholar] [CrossRef]
  11. Shao, Y.; Yin, Y.; Du, S.; Xi, L. A Surface Connectivity-Based Approach for Leakage Channel Prediction in Static Sealing Interface. J. Tribol. 2019, 141, 062201. [Google Scholar] [CrossRef]
  12. Zhang, Q.; Chen, X.; Huang, Y.; Zhang, X. An Experimental Study of the Leakage Mechanism in Static Seals. Appl. Sci. 2018, 8, 1404. [Google Scholar] [CrossRef] [Green Version]
  13. Zhao, M.J.; Zhu, P.C.; Li, Z.; Liu, Z.; Kang, C. Stress analysis of self-tightness metal sealing against ultrahigh pressure medium. Strength Mater. 2022, 54, 108–116. [Google Scholar] [CrossRef]
  14. Van Rensselar, J. Introduction to static seals. Tribol. Lubr. Technol. 2017, 73, 38–44. [Google Scholar]
  15. Shao, Y.; Yin, Y.; Du, S.; Xia, T.; Xi, L. Leakage Monitoring in Static Sealing Interface Based on Three Dimensional Surface Topography Indicator. J. Manuf. Sci. Eng. 2018, 140, 101003. [Google Scholar] [CrossRef]
  16. Li, X.; Peng, G. Research on leakage prediction calculation method for static seal ring in underground equipments. J. Mech. Sci. Technol. 2016, 30, 2635–2641. [Google Scholar] [CrossRef]
  17. Liao, C.; Xu, X.; Fang, H.; Wang, H.; Man, M. A leakage model of metallic static seals based on micromorphology characteristics of turning flange surface. Ind. Lubr. Tribol. 2015, 67, 572–581. [Google Scholar] [CrossRef]
  18. Arzanfudi, M.M.; Al-Khoury, R.; Sluys, L.J. A computational model for fluid leakage in heterogeneous layered porous media. Adv. Water Resour. 2014, 73, 214–226. [Google Scholar] [CrossRef] [Green Version]
  19. Lin, X.; Du, Z.; Rana, M.A. Study on Leakage Model of Typical Penetration of Closed Structures Based on Porous Media Seepage Theory. Math. Probl. Eng. 2022, 2022, 6901534. [Google Scholar] [CrossRef]
  20. Wen, T.; Guo, F.; Huang, Y.; Zhu, S.; Jia, X. Analysis of static sealing rules of foamed silicone rubber based on a porous media model. Cell. Polym. 2019, 39, 101–116. [Google Scholar] [CrossRef]
  21. Jolly, P.; Marchand, L. Leakage Predictions for Static Gasket Based on the Porous Media Theory. J. Press. Vessel Technol. 2009, 131, 021203. [Google Scholar] [CrossRef]
  22. Marie, C.; Lasseux, D. Experimental Leak-Rate Measurement Through a Static Metal Seal. J. Fluids Eng. 2007, 129, 799–805. [Google Scholar] [CrossRef]
  23. Beghini, M.; Bertini, L.; Santus, C.; Guglielmo, A.; Mariotti, G. Partially open crack model for leakage pressure analysis of bolted metal-to-metal flange. Eng. Fract. Mech. 2015, 144, 16–31. [Google Scholar] [CrossRef]
  24. Kambhammettu, S.K.S.; Deshpande, A.P.; Chebolu, L.R. A Compressible Porous Media Model to Estimate Fluid Leak Through a Metal-Elastomer Interface. Transp. Porous Media 2021, 136, 191–215. [Google Scholar] [CrossRef]
  25. Pérez-Ràfols, F.; Larsson, R.; van Riet, E.J.; Almqvist, A. On the loading and unloading of metal-to-metal seals: A two-scale stochastic approach. Proc. Inst. Mech. Eng. Part J J. Eng. Tribol. 2018, 232, 1525–1537. [Google Scholar] [CrossRef] [Green Version]
  26. Robbe-Valloire, F.; Prat, M. A model for face-turned surface microgeometry. Wear 2008, 264, 980–989. [Google Scholar] [CrossRef]
  27. Greenwood, J.A.; Williamson, J.B.P. Contact of nominally flat surfaces. Proc. R. Soc. London Ser. A Math. Phys. Sci. 1966, 295, 300–319. [Google Scholar] [CrossRef]
  28. Zhao, G.; Li, S.-x.; Xiong, Z.-l.; Gao, W.-d.; Han, Q.-k. A statistical model of elastic-plastic contact between rough surfaces. Trans. Can. Soc. Mech. Eng. 2019, 43, 38–46. [Google Scholar] [CrossRef]
  29. Jackson, R.L.; Streator, J.L. A multi-scale model for contact between rough surfaces. Wear 2006, 261, 1337–1347. [Google Scholar] [CrossRef]
  30. Majumdar, A.; Bhushan, B. Fractal Model of Elastic-Plastic Contact Between Rough Surfaces. J. Tribol. 1991, 113, 1–11. [Google Scholar] [CrossRef]
  31. Morag, Y.; Etsion, I. Resolving the contradiction of asperities plastic to elastic mode transition in current contact models of fractal rough surfaces. Wear 2007, 262, 624–629. [Google Scholar] [CrossRef]
  32. Komvopoulos, K.; Ye, N. Three-Dimensional Contact Analysis of Elastic-Plastic Layered Media With Fractal Surface Topographies. J. Tribol. 2001, 123, 632–640. [Google Scholar] [CrossRef]
  33. Yuan, Y.; Cheng, Y.; Liu, K.; Gan, L. A revised Majumdar and Bushan model of elastoplastic contact between rough surfaces. Appl. Surf. Sci. 2017, 425, 1138–1157. [Google Scholar] [CrossRef]
  34. Vallet, C.; Lasseux, D.; Sainsot, P.; Zahouani, H. Real versus synthesized fractal surfaces: Contact mechanics and transport properties. Tribol. Int. 2009, 42, 250–259. [Google Scholar] [CrossRef] [Green Version]
  35. Etsion, I.; Front, I. A model for static sealing performance of end face seals. Tribol. Trans. 1994, 37, 111–119. [Google Scholar] [CrossRef]
  36. Sahlin, F.; Larsson, R.; Almqvist, A.; Lugt, P.M.; Marklund, P. A mixed lubrication model incorporating measured surface topography. Part 1: Theory of flow factors. Proc. Inst. Mech. Eng. Part J-J. Eng. Tribol. 2010, 224, 335–351. [Google Scholar] [CrossRef] [Green Version]
  37. Sahlin, F.; Larsoon, R.; Marklund, P.; Almqvist, A.; Lugt, P.M. A mixed lubrication model incorporating measured surface topography. Part 2: Roughness treatment, model validation, and simulation. Proc. Inst. Mech. Eng. Part J-J. Eng. Tribol. 2009, 224, 353–365. [Google Scholar] [CrossRef]
  38. Bottiglione, F.; Carbone, G.; Mangialardi, L.; Mantriota, G. Leakage mechanism in flat seals. J. Appl. Phys. 2009, 106, 104902. [Google Scholar] [CrossRef]
  39. Bottiglione, F.; Carbone, G.; Mantriota, G. Fluid leakage in seals: An approach based on percolation theory. Tribol. Int. 2009, 42, 731–737. [Google Scholar] [CrossRef]
  40. Sun, J.; Ma, C.; Lu, J.; Yu, Q. A leakage channel model for sealing interface of mechanical face seals based on percolation theory. Tribol. Int. 2018, 118, 108–119. [Google Scholar] [CrossRef]
  41. Ni, X.; Ma, C.; Sun, J.; Zhang, Y.; Yu, Q. A Leakage Model of Contact Mechanical Seals Based on the Fractal Theory of Porous Medium. Coatings 2020, 11, 20. [Google Scholar] [CrossRef]
  42. Liao, C.; Chen, H.; Lu, H.; Dong, R.; Sun, H.; Chang, X. A leakage model for a seal-on-seal structure based on porous media method. Int. J. Press. Vessel. Pip. 2020, 188, 104227. [Google Scholar] [CrossRef]
  43. Liu, Y.; Guo, H.; Chen, Z.; Ding, K.; Dan, M.; Li, B.; Yan, F. A Fractal Contact Model for Rough Surfaces considering the Variation of Critical Asperity Levels. Adv. Mater. Sci. Eng. 2022, 2022, 2985674. [Google Scholar] [CrossRef]
  44. Yu, B.; Li, J. Some Fractal Characters of Porous Media. Fractals 2001, 09, 365–372. [Google Scholar] [CrossRef]
  45. Yu, B.; Ping, C. A fractal permeability model for bi-dispersed porous media. Int. J. Heat Mass Transf. 2002, 45, 2983–2993. [Google Scholar] [CrossRef]
  46. Dapp, W.B.; Lucke, A.; Persson, B.N.; Muser, M.H. Self-affine elastic contacts: Percolation and leakage. Phys. Rev. Lett. 2012, 108, 244301. [Google Scholar] [CrossRef] [Green Version]
  47. Chen, Z.; Liu, Y.; Zhou, P. A comparative study of fractal dimension calculation methods for rough surface profiles. Chaos Solitons Fractals 2018, 112, 24–30. [Google Scholar] [CrossRef]
  48. Majumdar, A.; Tien, C.L. Fractal characterization and simulation of rough surfaces. Wear 1990, 136, 313–327. [Google Scholar] [CrossRef]
  49. Majumdar, A.; Bhushn, B. Role of Fractal Geometry in Roughness Characterization and Contact Mechanics of Surfaces. J. Tribol. 1990, 112, 205–216. [Google Scholar] [CrossRef]
  50. Yu, B.M.; Xu, P.; Zou, M.Q.; Cai, J.C.; Zheng, Q. Transport Physics of Fractal Porous Media; Science Press: Beijing, China, 2014. [Google Scholar]
  51. Yuan, Y.; Yang, B.; Xiao, Z.; Liu, X. Numerical and Experimental Fractal Pore Network Study on the Drying of Porous Media. In Proceedings of the 5th Asia-Pacific Drying Conference, Hong Kong, China, 13–15 August 2007. [Google Scholar]
  52. Yang, S.; Fu, H.; Yu, B. Fractal Analysis of Flow Resistance in Tree-Like Branching Networks with Roughened Microchannels. Fractals 2017, 25, 1750008. [Google Scholar] [CrossRef]
  53. Wheatcraft, S.W.; Tyler, S.W. An explanation of scale-dependent dispersivity in heterogeneous aquifers using concepts of fractal geometry. Water Resour. Res. 1988, 24, 566–578. [Google Scholar] [CrossRef]
  54. Yun, M.; Yu, B.; Xu, P.; Wu, J. Geometrical Models for Tortuosity of Streamlines in Three-Dimensional Porous Media. Can. J. Chem. Eng. 2006, 84, 301–309. [Google Scholar] [CrossRef]
  55. Patel, H.; Hariharan, H.; Bailey, G.; Jung, G. Advanced Computer Modelling for Metal-to-Metal Seal in API Flanges. In Proceedings of the Society of Petroleum Engineers Annual Technical Conference and Exhibition, Dallas, TX, USA, 7–10 May 2018. [Google Scholar]
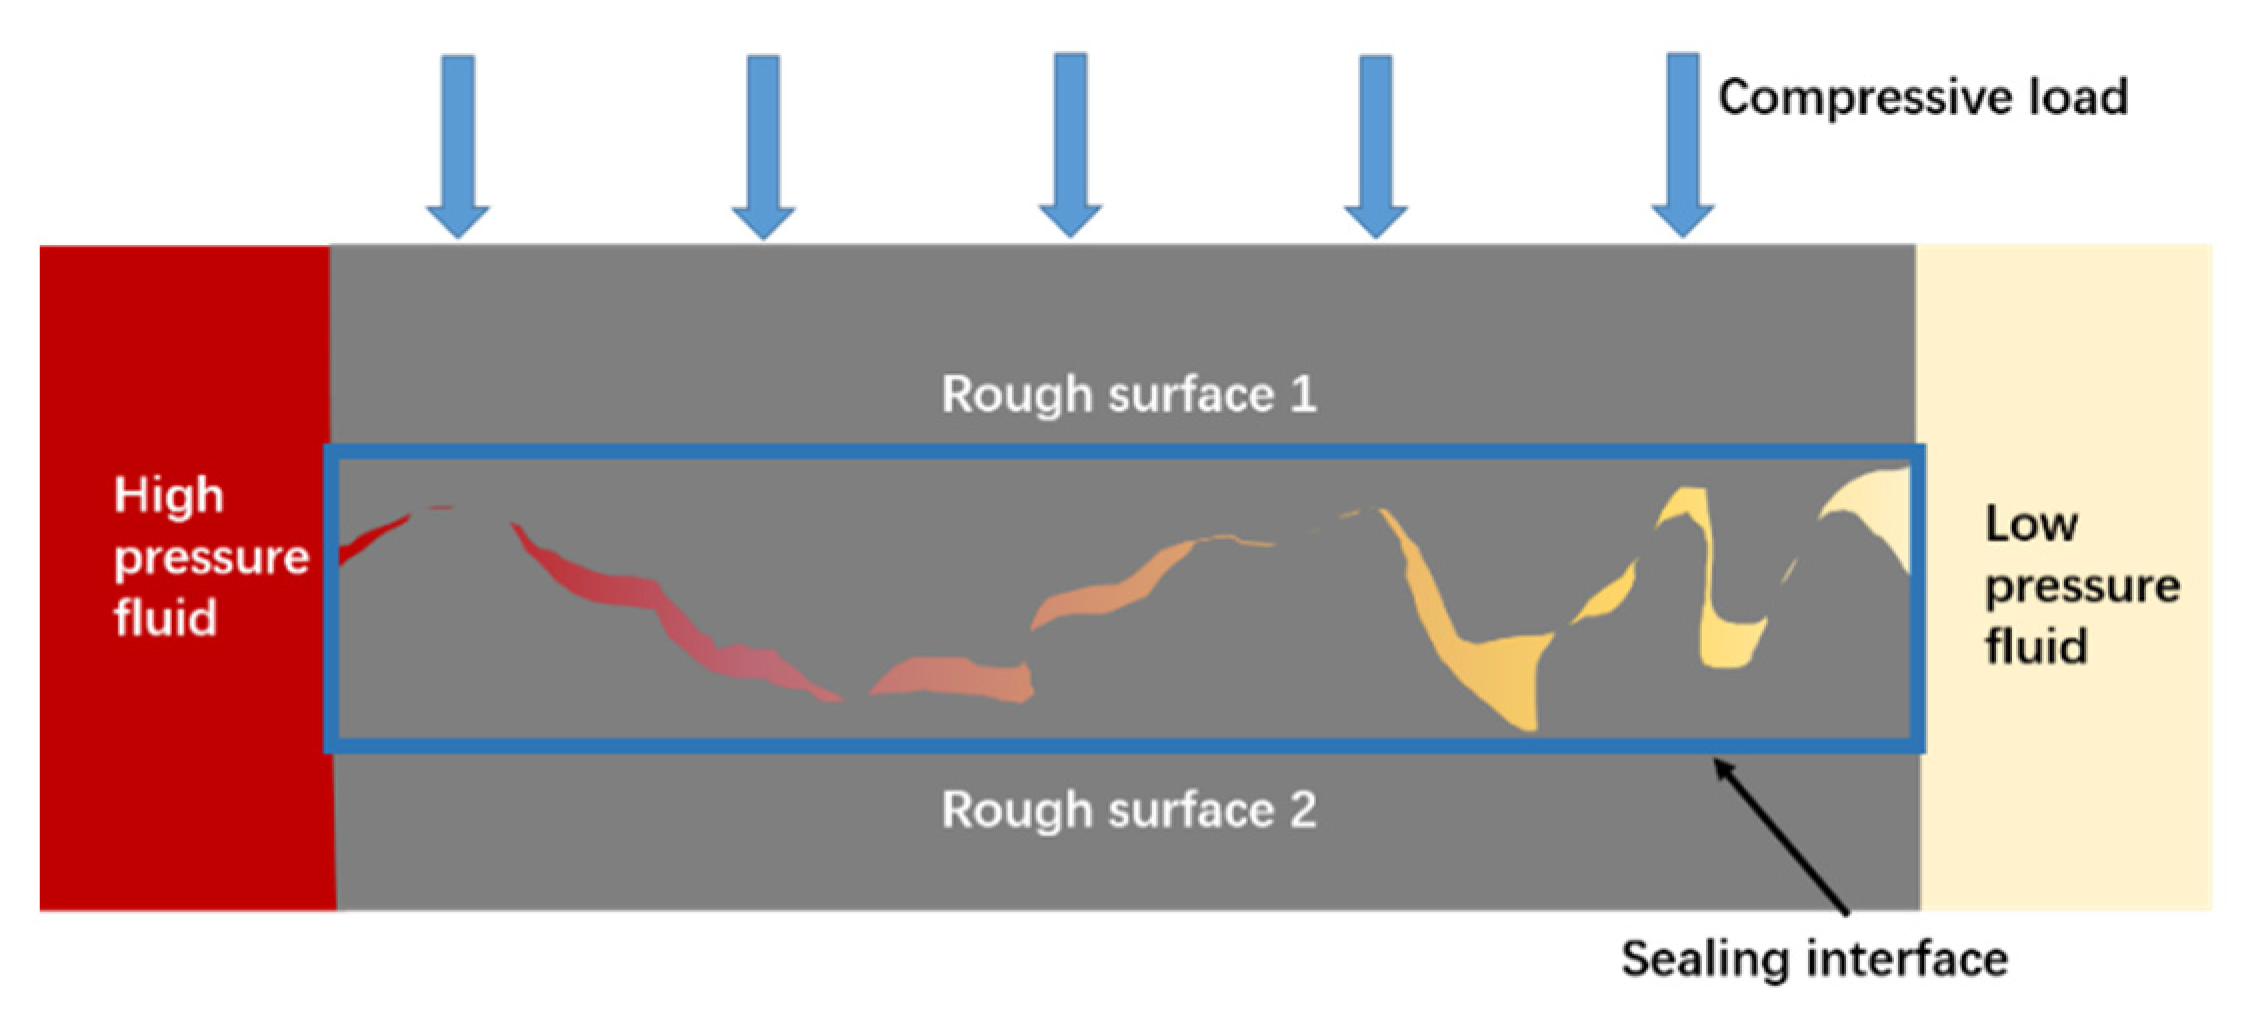
Figure 1. A schematic showing the sealing medium through the sealing interface of a metal-to-metal seal.
Aerospace 09 00779 g001
Figure 2. Generated rough surfaces with different D s values: (a) D s = 2.2; (b) D s = 2.4; (c) D s = 2.6; (d) D s = 2.8.
Aerospace 09 00779 g002
Figure 3. Generated rough surfaces with different G values: (a) G = 1 × 10 8 m; (b) G = 1 × 10 7 m; (c) G = 1 × 10 6 m; (d) G = 1 × 10 5 m.
Aerospace 09 00779 g003
Figure 4. Examples of surface topography of the real surfaces: (a) turning; (b) grinding.
Aerospace 09 00779 g004
Figure 5. The diagram of the deformation law of a single asperity.
Aerospace 09 00779 g005
Figure 6. Longitudinal section of the leakage microchannel.
Aerospace 09 00779 g006
Figure 7. The contact between a rigid flat surface and a rough surface.
Aerospace 09 00779 g007
Figure 8. Schematic diagram of the sealing medium flowing through the leakage micro-channel (capillary tube) on the sealing interface.
Aerospace 09 00779 g008
Figure 9. Flowchart for the calculation of the flow rate of the porous medium [43].
Aerospace 09 00779 g009
Figure 10. The measurement instrument and the measuring surface topography: (a) sealing surface measuring instrument (OLYMPUS OLS4100); (b) test specimen and measuring locations; (c) original profile of the sealing surface.
Aerospace 09 00779 g010
Figure 11. Comparison of the proposed leakage rate model and test results: (a) P c a = 200 MPa; (b) P c a = 300 MPa; (c) P c a = 400 MPa; (d) P c a = 500 MPa.
Aerospace 09 00779 g011aAerospace 09 00779 g011b
Figure 12. The influence of sealing surface fractal parameters on porosity.
Aerospace 09 00779 g012
Figure 13. The influence of the sealing surface fractal parameters on the aperture ratio.
Aerospace 09 00779 g013
Figure 14. The influence of fractal parameters of sealing surface on the fractal dimension of pore space.
Aerospace 09 00779 g014
Figure 15. The influence of sealing surface fractal parameters on tortuosity fractal dimension.
Aerospace 09 00779 g015
Figure 16. The influence of contact pressure on the intrinsic parameters of the porous medium.
Aerospace 09 00779 g016
Figure 17. The influence of fractal parameters on the leakage rate.
Aerospace 09 00779 g017
Figure 18. The influence of the contact pressure on the leakage rate.
Aerospace 09 00779 g018
Table 1. The mechanical properties of stainless steel and sapphire used in the test.
Hardness HYoung’s Modulus E/MPaTensile Strength/MPaPoisson’s RatioCompressive Strength/MPa
316 L stainless steel155–1901.9 × 105–2.1 × 105460–8600.3
sapphire1570–17504.4 × 1051900.32100
Table 2. Turning processing parameters of the metal surface.
Speed/rpmAdvance by Turn/mmDepth of Cut/mmTurning Tool/DegTool Radius/mm
12,0000.050.02450.2
Publisher’s Note: MDPI stays neutral with regard to jurisdictional claims in published maps and institutional affiliations.