Article

Modeling and Simulation of Flight Profile and Power Spectrum for Near-Space Solar-Powered UAV

School of Aeronautic Science and Engineering, Beihang University, Beijing 100191, China
*
Author to whom correspondence should be addressed.
Aerospace 2022, 9(11), 672; https://doi.org/10.3390/aerospace9110672
Submission received: 31 August 2022 / Revised: 25 October 2022 / Accepted: 27 October 2022 / Published: 30 October 2022

Abstract

:
Currently, several solar-powered unmanned aerial vehicles (UAVs) have achieved 24 h uninterrupted cruise. However, models that can cruise for weeks or even months without interruption are in the minority. The technological progress requires the improvement of subsystems and also depends on the accurate planning of flight profile and power spectrum in a long working cycle. Combined with the test data obtained during the development of a solar-powered UAV, this paper establishes systematic mathematical and physical models of aerodynamic, energy, and propulsion systems, which can reflect the change in performance parameters with flight conditions and the performance attenuation with time. Further, a track control strategy based on the principle of maximum energy utilization is proposed, and the energy balance model of each flight stage is established. On the basis of the strategy, the typical flight profile and power spectrum of a solar-powered UAV are analyzed. Finally, the input parameters are decomposed into task parameters (takeoff time window, flight season, flight latitude, takeoff weight) and performance parameters (lift–drag ratio, secondary battery density), and their effects on mission feasibility are studied respectively. The research methods and conclusions of this paper have reference significance for the mission and track planning of solar-powered UAVs.

1. Introduction

Near-space solar-powered unmanned aerial vehicles (UAVs) have attracted extensive attention due to their uninterrupted cruise capability and have become a research hotspot in recent years [1,2,3]. With the improvement of flight duration, the importance of flight profile and power spectrum simulation has become increasingly prominent.
Nowadays, the near-space solar-powered UAV has broken through the 24 h uninterrupted cruise technology. In 2005, the “Solong” UAV (the U.S.) became the first solar-powered UAV to achieve continuous flight for more than 24 h. However, the flight process is manually controlled, and thus it has no ability to carry out ultra-long flight time reconnaissance tasks [4]. The “Zephyr-6” UAV (the UK) achieved 82 h and 37 min of continuous flight in 2007, creating a world record for the sustained flight time of a UAV [5]. It conducted route planning through the navigation system and reduced the dependence on secondary batteries by using a gravity energy storage strategy. In 2016, the “Atlantisolar” UAV (Switzerland) carried out a 26 h continuous refugee search and rescue mission [6]. Through a scientific route planning strategy, it conducted the task with maximum efficiency and provided a series of useful information for the rescue team. The “Owl” UAV (Russia) completed a 50 h non-stop flight test at an altitude of 9000 m in 2016, and its mission objective was to provide relay communications for the Arctic region [7]. In 2022, Airbus’s “Zephyr-S” UAV extended the continuous flight duration record of solar-powered UAVs to 64 days. However, an accident that occurred during the final stage of the flight destroyed the aircraft. [8] In addition, there is a large number of solar-powered UAVs in the research stage, such as the “Phase-35” UAV (the UK), the “Swift HALE” UAV (the U.S.), the “Sunglider” UAV (Japan), and the “Createv” UAV (Canada), all of which completed their first flight in 2020 [9]. Although their scales are different, they all aim to achieve a longer flight time. The further extension of cruise time requires both high-precision subsystem modeling and flight profile simulation in a long working cycle.
Systematic mathematical and physical models are the basis for flight profile and power spectrum simulation. Noth [10] first established the mathematical models of each subsystem of the solar-powered UAV, providing a reference for subsequent scholars to carry out the overall design of the solar-powered UAV. Colas et al. [11,12] developed a conceptual multidisciplinary design framework for high-altitude long-endurance aircraft. In this framework, first-order physical models are widely used, and the reliance on historical empirical data is minimized. The simulation results have an appropriate level of fidelity while maintaining computational efficiency. Wang XY et al. [13] built systematic mathematical and physical models for the modular solar-powered aircraft (M-SPA), including the energy model, the aerodynamic model, and flight environment settings. On this basis, the multi-phase flight mission strategy is designed by analyzing the energy consumption of flight mode.
The energy acquisition and consumption model of solar-powered UAVs is the core of mathematical and physical models. Wang CY et al. [14] established a comprehensive energy acquisition model of solar-powered UAVs by combining the clear sky radiation model and the relationship between attitude, sun orientation, and the earth and built the energy consumption model of the steering gear and the propulsion system through experiments. On this basis, they compared the differences between aileron control and differential control in the aspects of operating efficiency and energy consumption. Dwivedi et al. [15] developed the mathematical model for the available radiation at a specific geographical location on a given date and time in order to optimize the selection of battery and flight trajectory for a solar-powered aircraft. Wu et al. [16] developed an optimal flight control approach for planning the flight path of sun-tracking solar aircraft within a mission region and derived the solar insolation model, power conversion model, power consumption model, and flight speed model of the Λ-shape solar-powered UAV. However, the above models all consider the performance indicators as fixed values and do not reflect the performance degradation under ultra-long task cycles.
Another important part of the mathematical and physical model is the performance attenuation model, which reflects the degradation of photovoltaic (PV) cell performance and the decline of secondary battery capacity. Ma DY et al. [17] pointed out that the reason for the degradation of PV cell efficiency is that space radiation will introduce defects to the cell, leading to a reduction in the minority carrier’s life and changes in the electrical performance. Hu et al. [18] combined the electron and proton energy spectrum and relative damage coefficient, equivalented the radiation effect of space-charged particles to the radiation of 1 MeV single energy particles, and predicted the performance change of triple-junction GaAs cells in the radiation environment of geosynchronous orbit. Yan et al. [19] systematically studied the radiation damage law of triple-junction GaAs cells by means of spectral response, fluorescence spectrum, and other analysis methods and established the attenuation degradation model of this type of cells in different orbits. Moreover, the influence of the capacity attenuation of the secondary battery on mission feasibility also cannot be ignored. Liu et al. [20] conducted a 0.5 C cycle discharge test on Li(NiCoMn)O2 soft pack lithium battery under the approximate vacuum pressure and found that the capacity decreased to 80% after 10 cycles. Mussa et al. [21] studied the effect of external pressure on the cycle life of lithium-ion batteries and found that the pressure had little effect on the initial capacity but had a significant impact on the impedance and cycle life.
Based on the mathematical and physical model, the researchers developed the optimal flight path design of the solar-powered UAV, which is a special research content different from conventional aircraft [22] and is also the basis of flight profile and power spectrum simulation. Klesh et al. [23] introduced the concept of a power ratio (the ratio of absorbed power to consumed power) and studied the optimal trajectory of point-to-point missions. Wang et al. [24] established the flight strategy optimization for high-altitude long-endurance solar-powered aircraft based on the Gauss pseudo-spectral method. The results indicate that proper changes in the attitude angle contribute to increasing the energy gained by PV cells, and the utilization of gravitational potential energy can partly take the role of a battery pack. The introduction of the gravity energy storage strategy [14] reduced the dependence of the solar-powered UAV on the secondary battery and also brought uncertainty to the flight profile. Gao et al. [25] ignored the influence of wind and propeller thrust and established the motion equation of the descending process of high-altitude solar-powered UAVs. The motion is limited in the longitudinal profile, and the optimal trajectory is obtained by using the Gauss pseudo-spectral method with the optimization goal of the longest gliding time in the unit height difference. By introducing the EFF parameter (flight time/total solar energy), the equivalence of gravity energy storage and electric energy storage was compared [26], and the effects of solar radiation time, charging ratio of battery, energy storage density, and initial height on the equivalence were analyzed. Sachs et al. [27] studied the minimum energy storage flight trajectory of solar-powered UAVs. The results show that by climbing in the daytime and gliding at night, it could theoretically achieve 24 h uninterrupted flight without secondary batteries. However, the maximum climb height during the day is more than 20 km, and the minimum glide height at night is only about 1 km.
On the basis of the optimal path planning theory, scholars have simulated the flight profile and power spectrum of solar-powered UAVs in a long mission period. Zhang et al. [28] established an energy model of the solar aircraft in each flight stage and classified and discussed various flight situations in the evening glide stage. This research shows the typical flight profile and power spectrum shape of the solar-powered UAV on the two-dimensional plane, which is of engineering reference significance. Ma JC et al. [29] developed a flight strategy for a solar-powered UAV and established a simulation model by using the Simulink toolbox. Finally, the flight profile within 72 h was obtained, and the results show that the strategy controlling the UAV to fly in a height range can optimize the efficiency of the solar power as well as save energy and enhance the long-flight stability of the UAV. Ma DL et al. [30] studied the varied-height flight paths for solar-powered aircraft and their application based on the theory of gravity energy reservation and introduced the overall design method for a solar-powered UAV with varied-height paths. Huang et al. [31] focused on the deployment problem of solar-powered UAVs used for communication services and proposed a nearest-neighbor-based navigation method to guide the movements of the UAVs.
There is still space for improvement on mathematical and physical models of subsystems, energy utilization, flight path programming, and mission profiles despite existing extensive studies. In this paper, the above space is explored and filled through modeling, simulation, experiment, and analysis. In Section 2, the study object is introduced, and based on the test data obtained from a solar-powered UAV, the systematic mathematical and physical models of aerodynamic, energy, propulsion, and other subsystems are constructed. In Section 3, on the basis of the principle of maximizing the utilization of light and minimizing electric energy consumption, the flight profile control strategy is proposed, and the energy balance equations of each flight stage are established. In Section 4, the typical flight profile and power spectrum of solar-powered UAVs are obtained through simulation, and the key events in each stage are discussed. In Section 5, the input parameters are decomposed into task indicators and performance indicators, and the effects of different indicators on flight profile and mission feasibility are studied respectively. The research methods and conclusions of this paper provide a theoretical basis and technical support for the overall design, route planning, and flight test of solar-powered UAVs.

2. Mathematical Physical Model

The study of this paper is based on a solar-powered UAV with a takeoff weight of 60 kg (in Figure 1). The mission goal of this UAV is to complete a 30-day uninterrupted cruise with infrared detection equipment. The mission goal is achieving 7-day continuous cruising with a 3 kg infrared detection equipment at 41° N latitude on the spring equinox. The overall design method mentioned in [9] is used to solve the overall parameters of the UAV. The core of this method is to solve two balance functions and finally obtain the two unknown parameters of wing area S and mass m.
{ f E ( m , S ) = E req , d + E bat + E climb E avi 0 f M ( m , S ) = m bat + m sc + m MPPT + m dis + m dyn + m str + m cab + m equ m 0
where fE(m,S) is the energy balance function, fM(m,S) is the mass balance function, and other symbols are defined in [9].
The overall parameters are: m = 60 kg, S = 21.5 m2, and W/S is 2.8 kg/m2, which is within the reasonable range of the solar-powered UAV according to the statistical data in [32]. In addition, according to the energy balance equation, 12 m2 PV cells are enough to provide the energy required for 24 h continuous flight. As shown in Figure 2, part of the solar energy absorbed during the day is used for cruising, part is converted into gravitational potential energy through climbing, and the rest is stored in secondary batteries. At night, the UAV converts gravitational potential energy and electric energy into mechanical energy, thus completing 24 h uninterrupted flight.

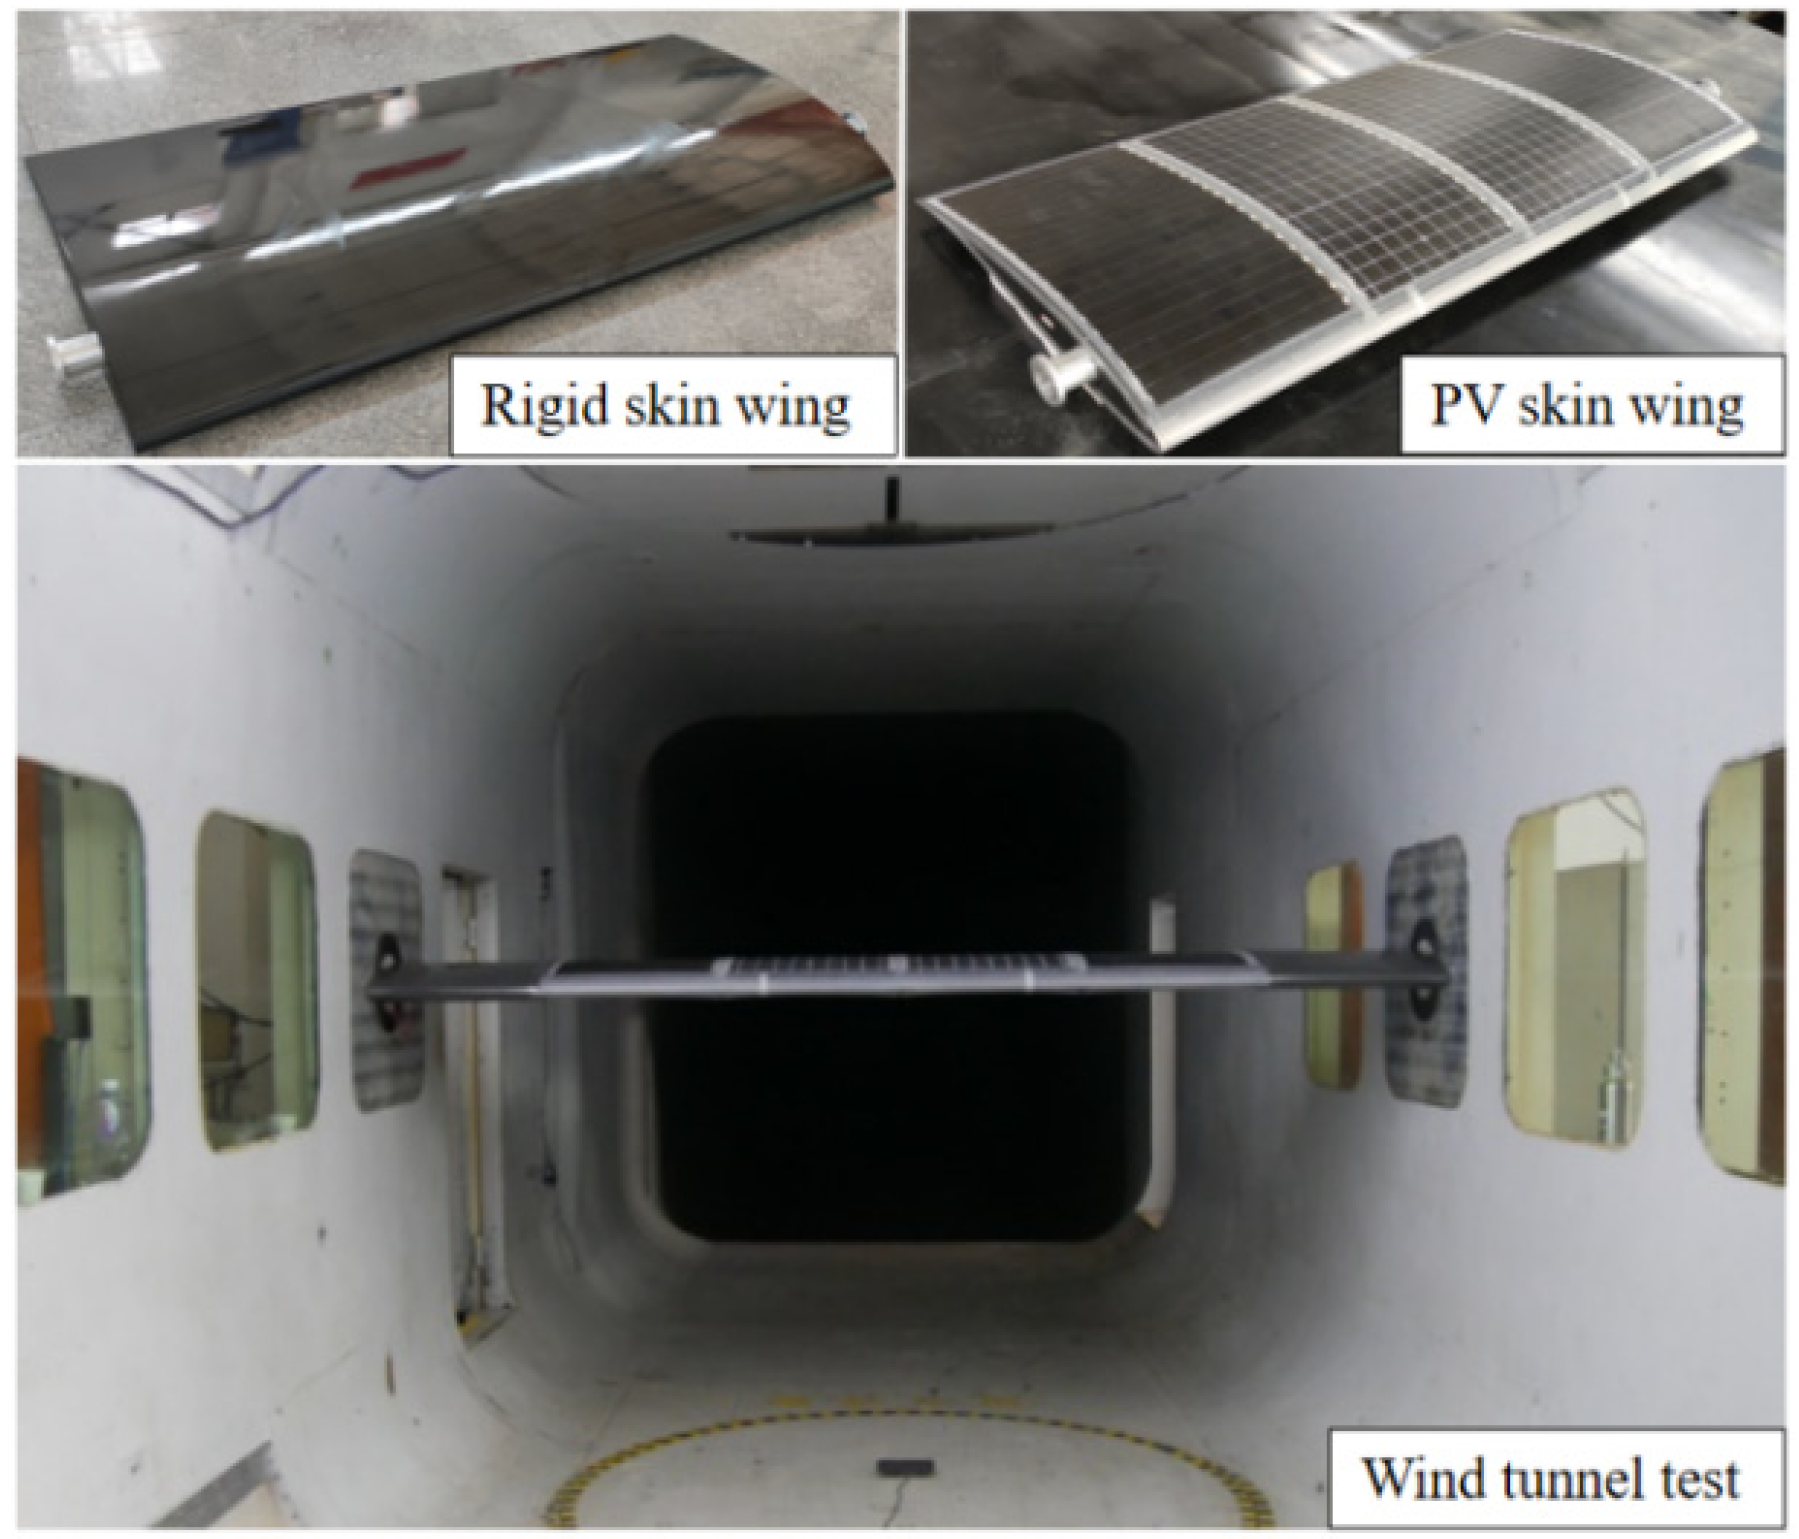
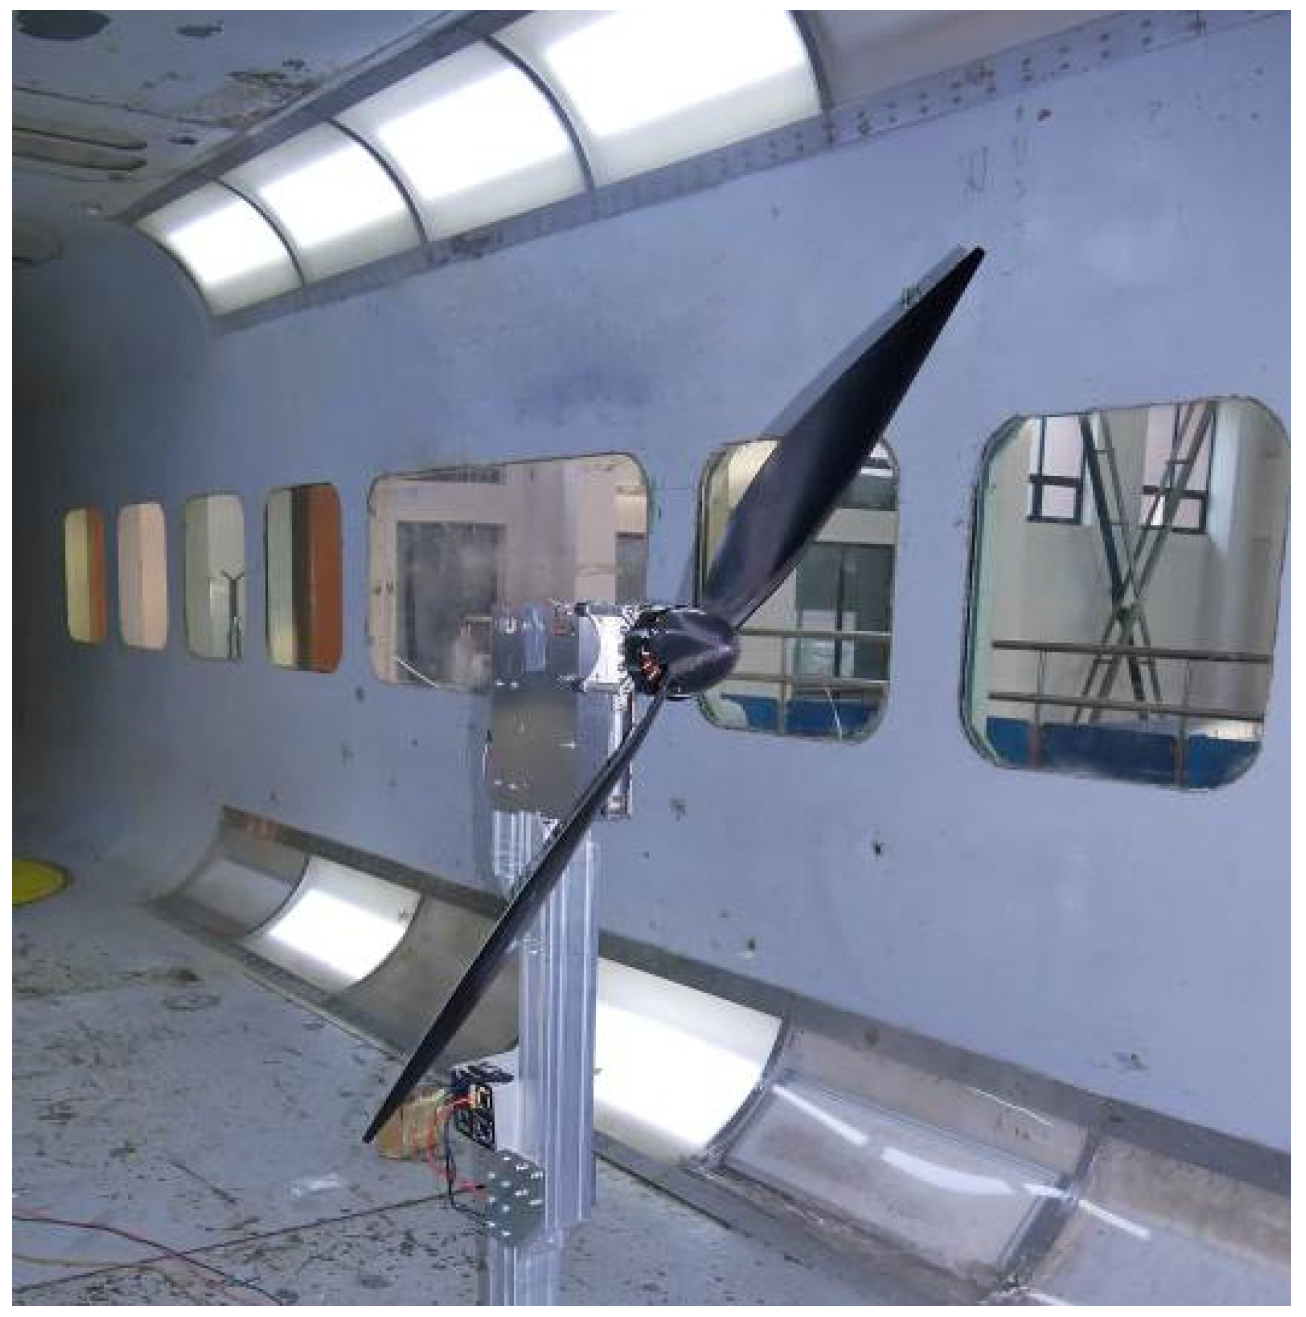
2.1. Aerodynamic Model

Compared with conventional UAVs, the aerodynamic model of solar-powered UAVs mainly shows two aspects of differences. One is that the flight altitude and attitude vary widely, and the aerodynamic characteristics of a low Reynolds number also change significantly. The second is that solar-powered UAVs are usually equipped with flexible PV cell skin, and the elastic deformation will have an uncertain impact on the aerodynamic characteristics.
Firstly, the lift and drag of solar-powered UAVs are expressed as functions that can reflect the change in the flight altitude and attitude. The lift L and drag D are respectively expressed as:
{ L = 1 2 ρ V 2 S C L D = 1 2 ρ V 2 S C D
where ρ is the air density, S is the wing area, and CL and CD are the lift coefficient and drag coefficient, respectively.
CL and CD are mainly affected by the airfoil, angle of attack α, and Reynolds number Re and are expressed by the following equations:
{ C L = f L ( α , R e ) = j = 0 2 i = 0 2 ( A i j α i ( R e / 10 5 ) j ) C D = f D ( α , R e ) = j = 0 2 i = 0 2 ( B i j α i ( R e / 10 5 ) j )
Secondly, the numerical simulation of the whole aircraft and the wind tunnel test of the flexible photovoltaic skin wing are carried out, and the test results are used to modify the numerical model. As shown in Figure 3, wind tunnel tests were carried out on two different wings: rigid skin wing and photovoltaic skin wing. As shown in Figure 4, the use of flexible photovoltaic skin hardly brings a change in the lift coefficient but leads to a significant increase in the drag coefficient. On the one hand, the elastic deformation of the skin brings lateral disturbance to the flow field. On the other hand, the roughness of the solar PV cell surface increases the turbulence of the nearby flow and the frictional drag. Our recent work confirmed the two reasons for the additional drag of photovoltaic cells [33].
Through numerical simulation and test methods, the database of lift and drag coefficients of the solar-powered UAV with respect to different Reynolds numbers and angles of attack is built, and then their relationships are fitted to quadratic polynomials shown as Equation (3). The values of fitted coefficients Aij and Bij (shown in Table 1 and Table 2) are determined through the least squares method (LSM).

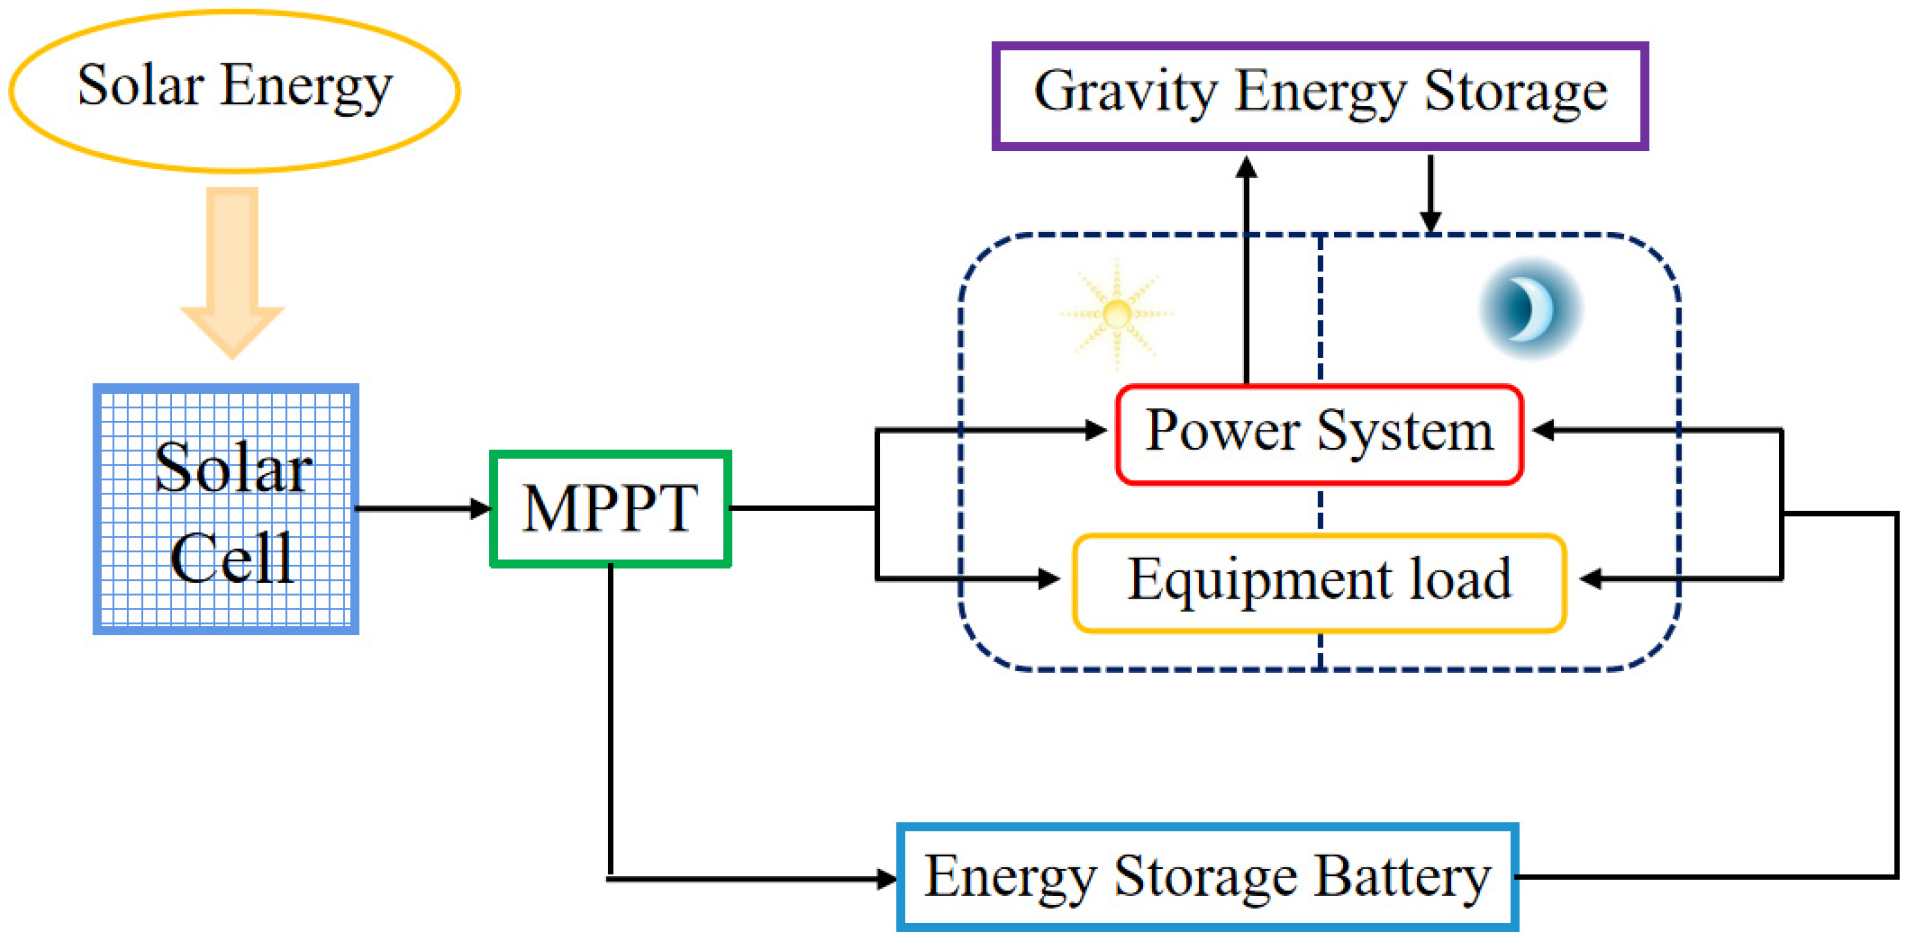
2.2. Energy System Model

The energy system includes PV cells, secondary batteries, and energy management modules. The main parameters are shown in Table 3.

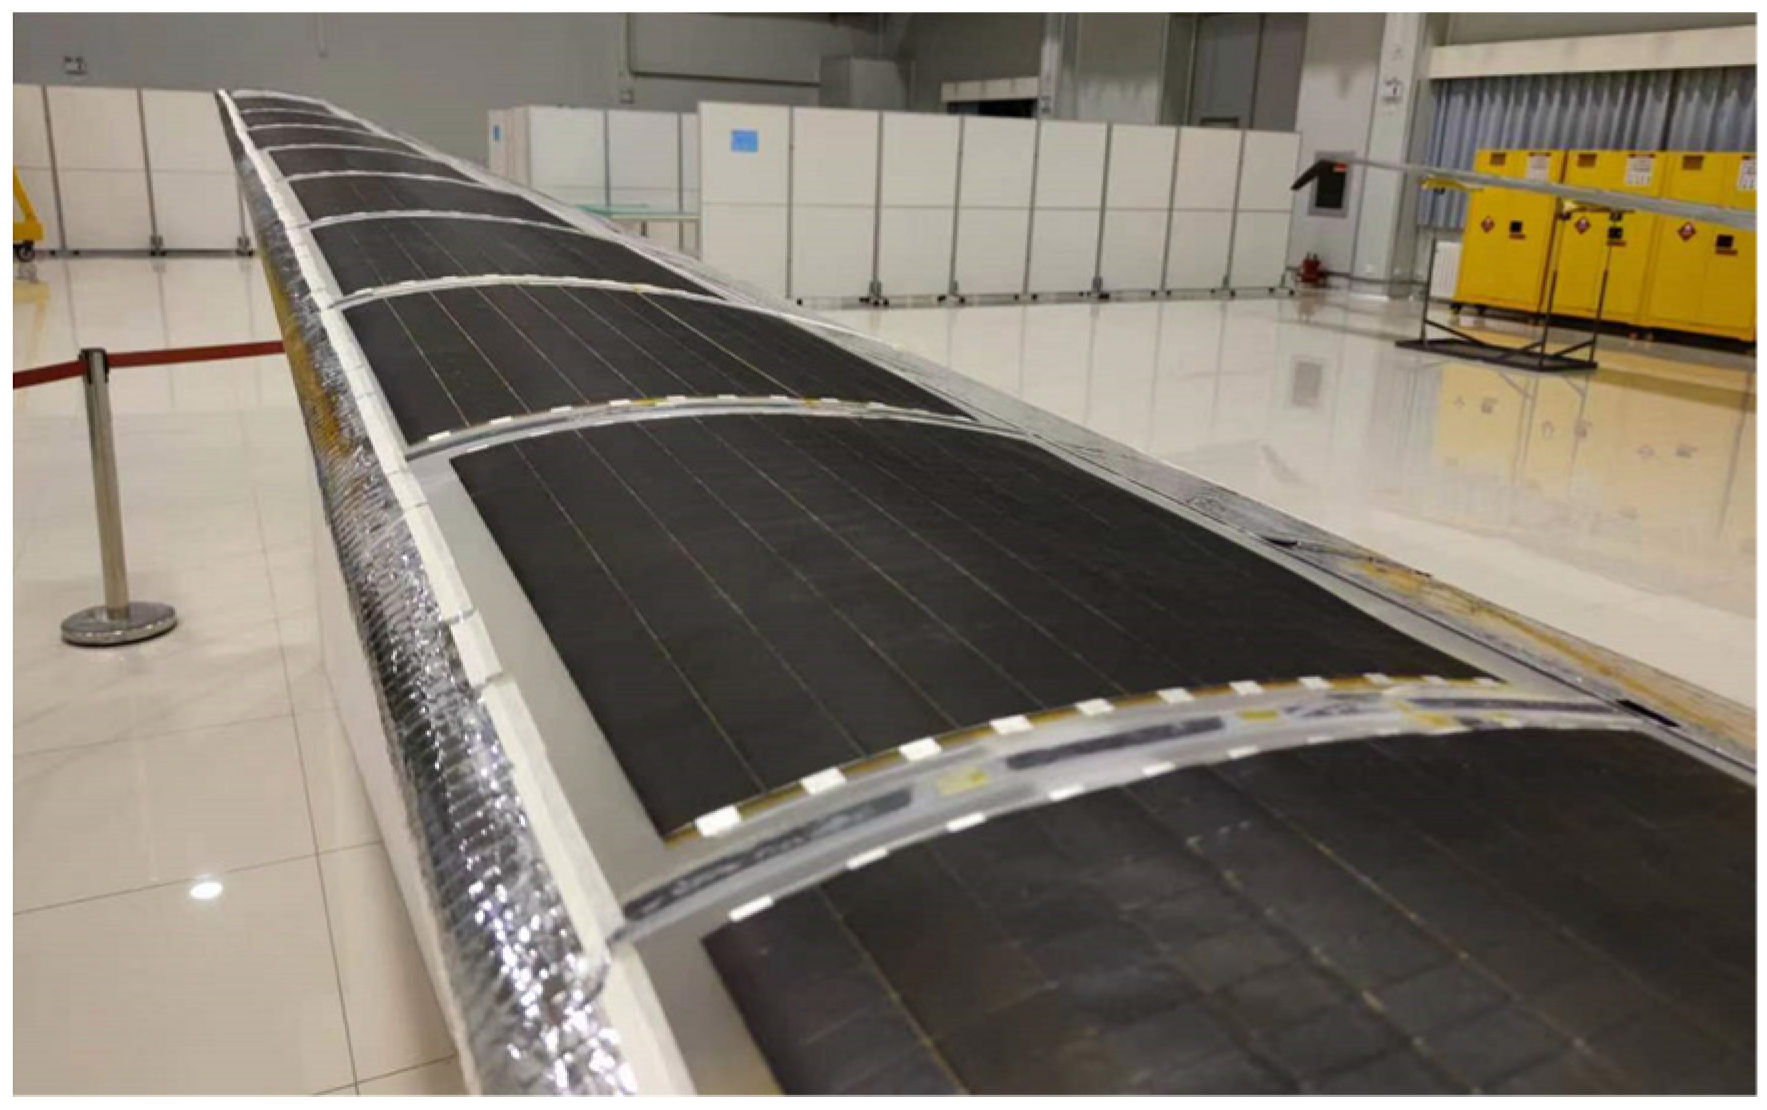
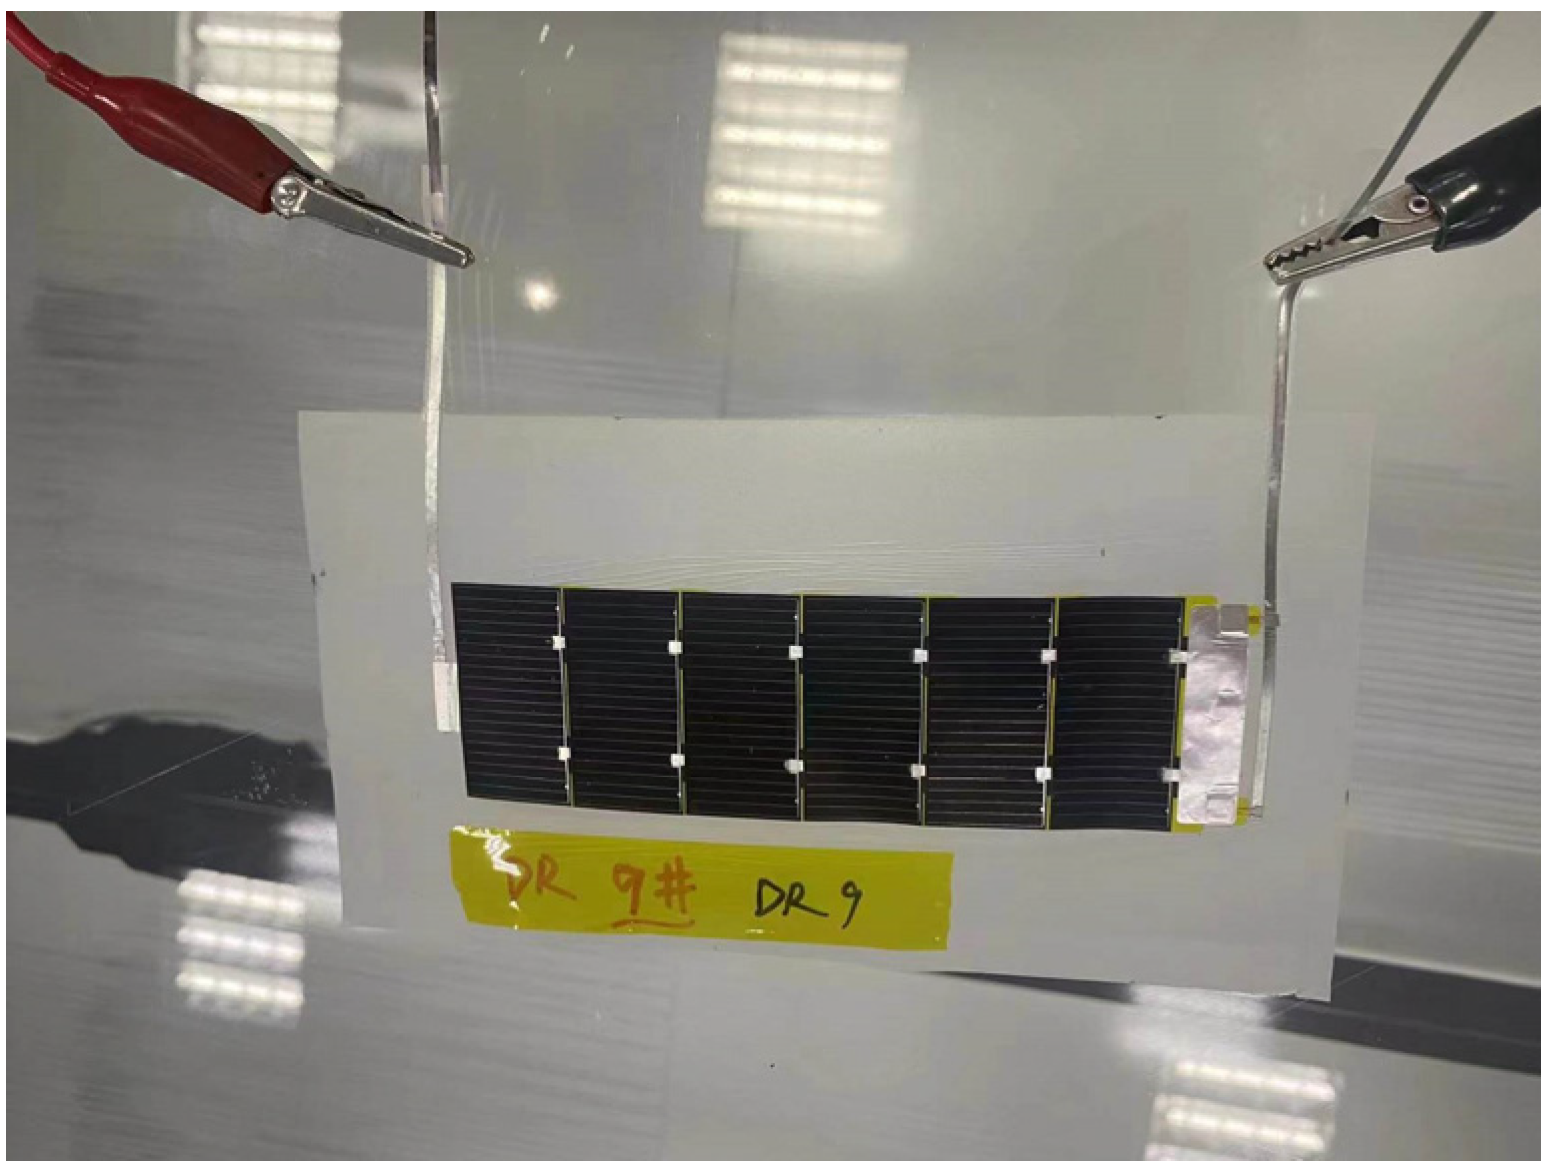
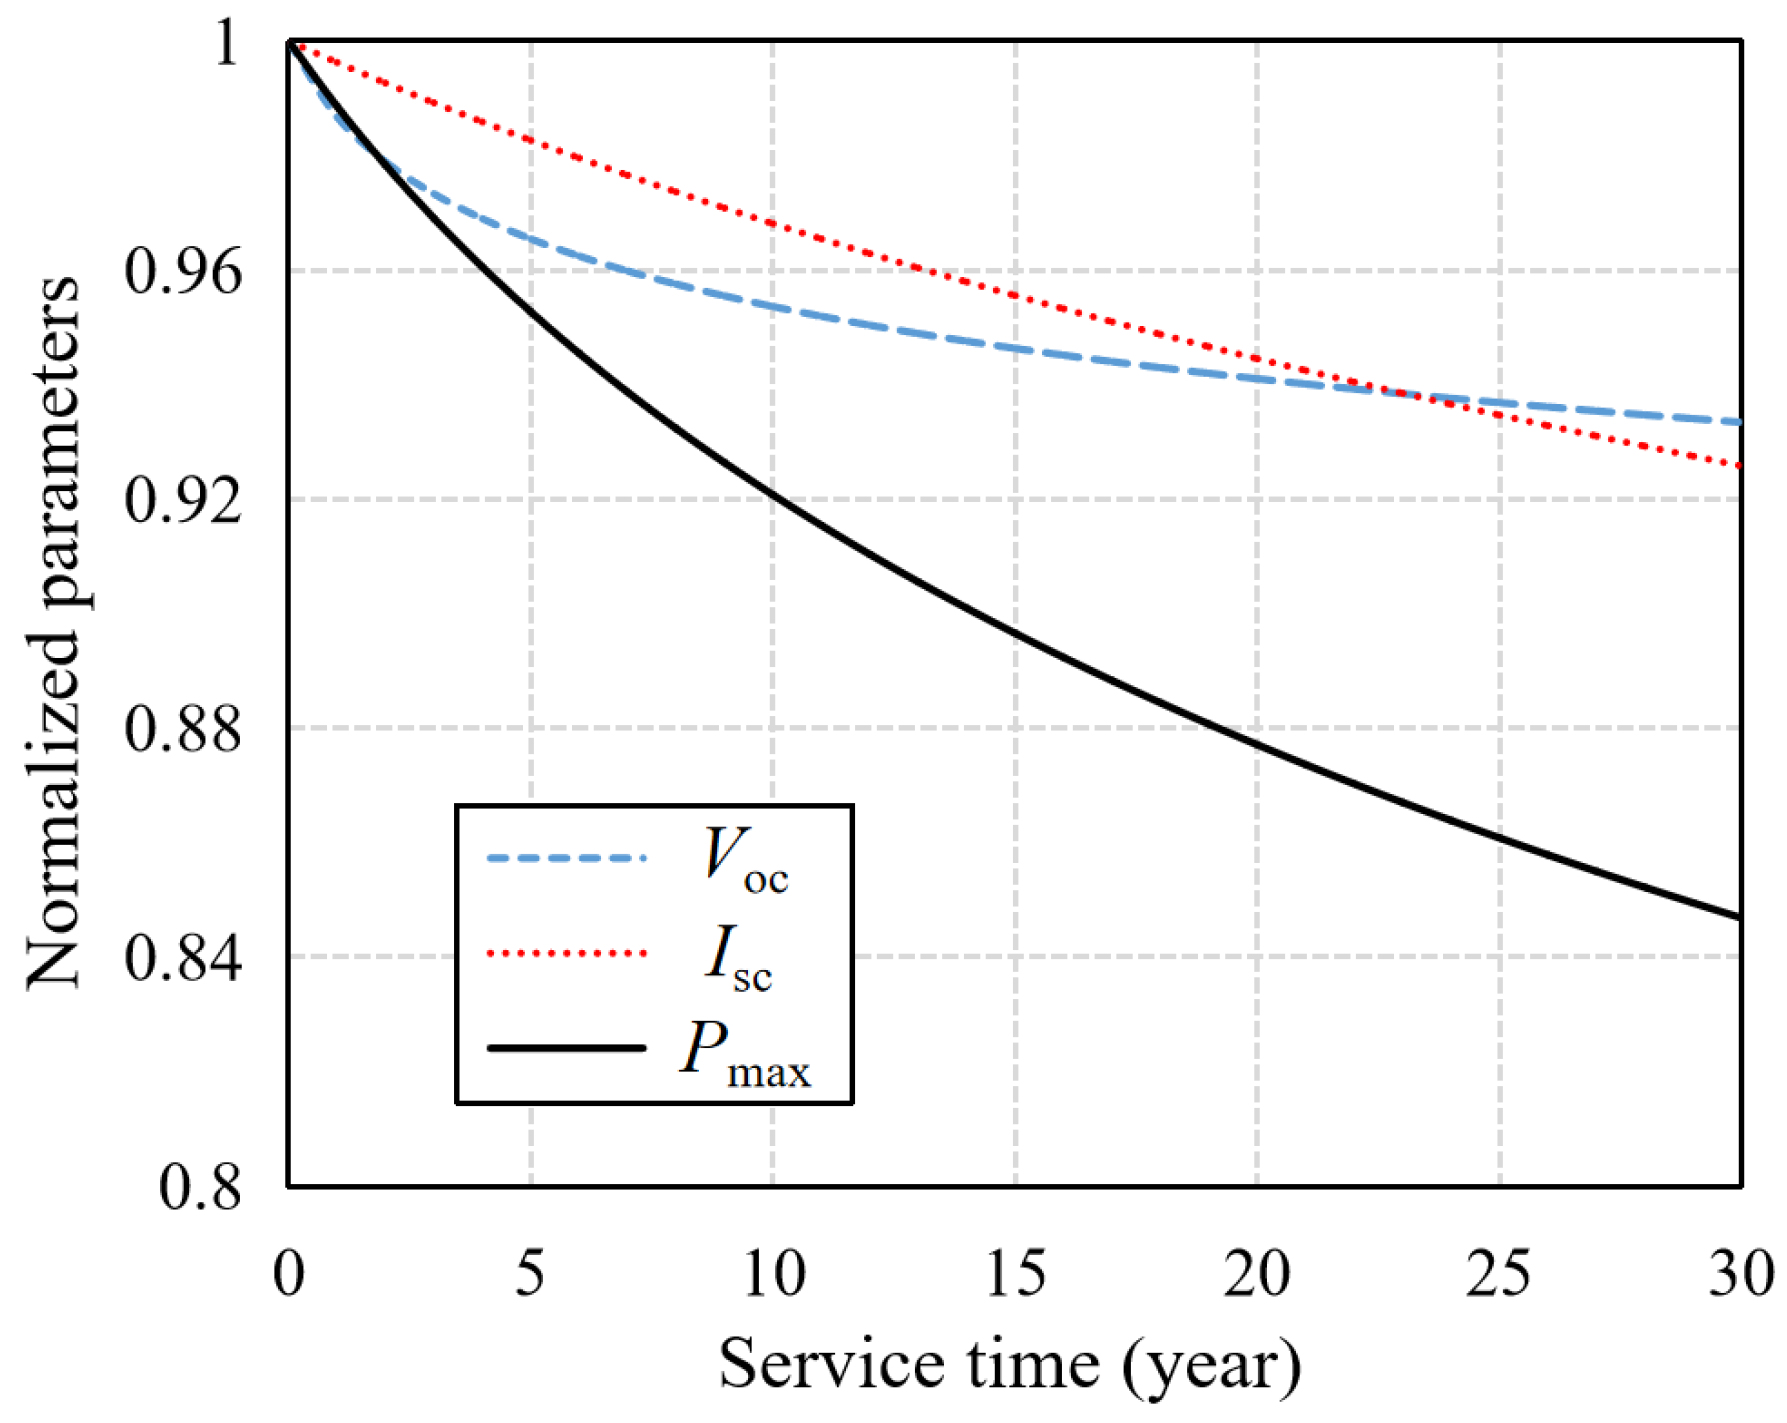
2.2.1. Photovoltaic Cells

As shown in Figure 5, the solar-powered UAV is equipped with flexible gallium arsenide (GaAs) PV cells, which can provide sufficient and stable energy input for the UAV. The output power of PV cells is:
P sc = P sun ( t ) S sc η sc η MPPT cos κ
where Psun(t) is the solar spectral density, Ssc is the power generation area of PV cells, ηsc is the conversion efficiency of PV cells, ηMPPT is the efficiency of MPPT modules, and κ is the solar incidence angle.
The solar incidence angle κ is expressed as
cos κ = V sc g V lr g
where V sc g the unit normal vector of PV cells in the ground coordinate system, and V lr g is the unit vector of incident light in the ground coordinate system.
V sc g = L bg V sc b = L bg [ 0 0 1 ] T
V lr g = [ cos α e sin α a cos α e cos α a sin α e ]
where L bg is the transformation matrix from the ground coordinate system to the body coordinate system, V sc b is the expression of the unit normal vector of PV cells in the body coordinate system, and αe and αa are the solar altitude angle and the solar azimuth (Figure 6), respectively, which are expressed as
{ sin α e = sin Φ sin δ + cos Φ cos δ cos ω t cos α a = sin α e sin Φ sin δ cos α e cos Φ δ = 0.1303 π sin ( 2 π ( 284 + n d ) / 365 ) ω t = π ( t h 12 ) / 12
where Φ is the local latitude, δ is the solar declination, ωt is the solar time angle, nd is the ordinal number of the date, and th is the true solar time.
Among many types of GaAs cells, the GaInP/GaAs/Ge triple-junction PV cells are chosen, which have stable performance and have been widely used in solar-powered UAVs in recent years, such as the “Zephyr-S” UAV, which has completed 64 days of non-stop cruising. The structure of this type of cell is shown in Figure 7. Compared with the traditional silicon cell, this type of cell has thinner thickness and lower surface density and can well adapt to the wing surface. Cooperating with the Near Space Laboratory (NSL) of China Electronics Technology Group Corporation (CETGT) No.18 Institute, we conducted performance tests on these cells (shown in Figure 8). The tests showed that although the single-cell efficiency exceeded 32%, the packaged-cell efficiency was stable at about 28% due to external factors. These factors include the weakening effect of wing protective film on light, as well as the radiation loss caused by wing curvature.
The efficiency of PV cells will decline with the extension of irradiation time. Because there is no special model to describe the degradation process in the near-space environment, this paper uses the geosynchronous orbit PV cell attenuation model to simulate. This model cannot consider the weakening effect of the atmosphere on radiation, and the design results will be conservative. The degradation of the cell’s open circuit voltage Voc, short circuit current Isc, and maximum power Pmax with time is expressed by the following equation [18]:
{ V oc V 0 = 1 0.045 log ( 1 + ϕ 3.64 × 10 13 ) I sc I 0 = 1 0.21 log ( 1 + ϕ 3.63 × 10 14 ) P max P 0 = 1 0.23 log ( 1 + ϕ 1.94 × 10 14 )
where V0, I0, and P0 are, respectively, the open circuit voltage, short circuit current, and maximum power of PV cells before irradiation, and ϕ is the electron fluence.
The annual equivalent fluence of charged particles in geosynchronous orbit is calculated by combining the energy spectrum of electrons, solar protons, and the relative damage coefficient, as shown in Table 4.
The annual equivalent damage fluence of space charged particles is substituted into Equation (9), and the performance degradation characteristic curve of GaInP/GaAs/Ge PV cells is obtained. As shown in Figure 9, the maximum power of the cell first decreases by a large margin and then decreases slowly.
The theoretical energy conversion efficiency of the PV cell is expressed as the ratio of the maximum output power and the solar incident light power under specific light and temperature, expressed as:
η sc = I sc V oc FF P in
where Pin is the input power under specific radiation intensity, and FF is the filling factor of PV cells, which is about 0.8.
According to Equation (10), the normalized Pmax change curve in Figure 9 can also characterize the attenuation of the PV cell conversion efficiency. The performance retention rate of PV cells in the first 30 days is 99.9%, and the loss is almost negligible. However, the solar-powered UAV is oriented to non-stop flight for months or even years, so this model cannot be ignored in the simulation.

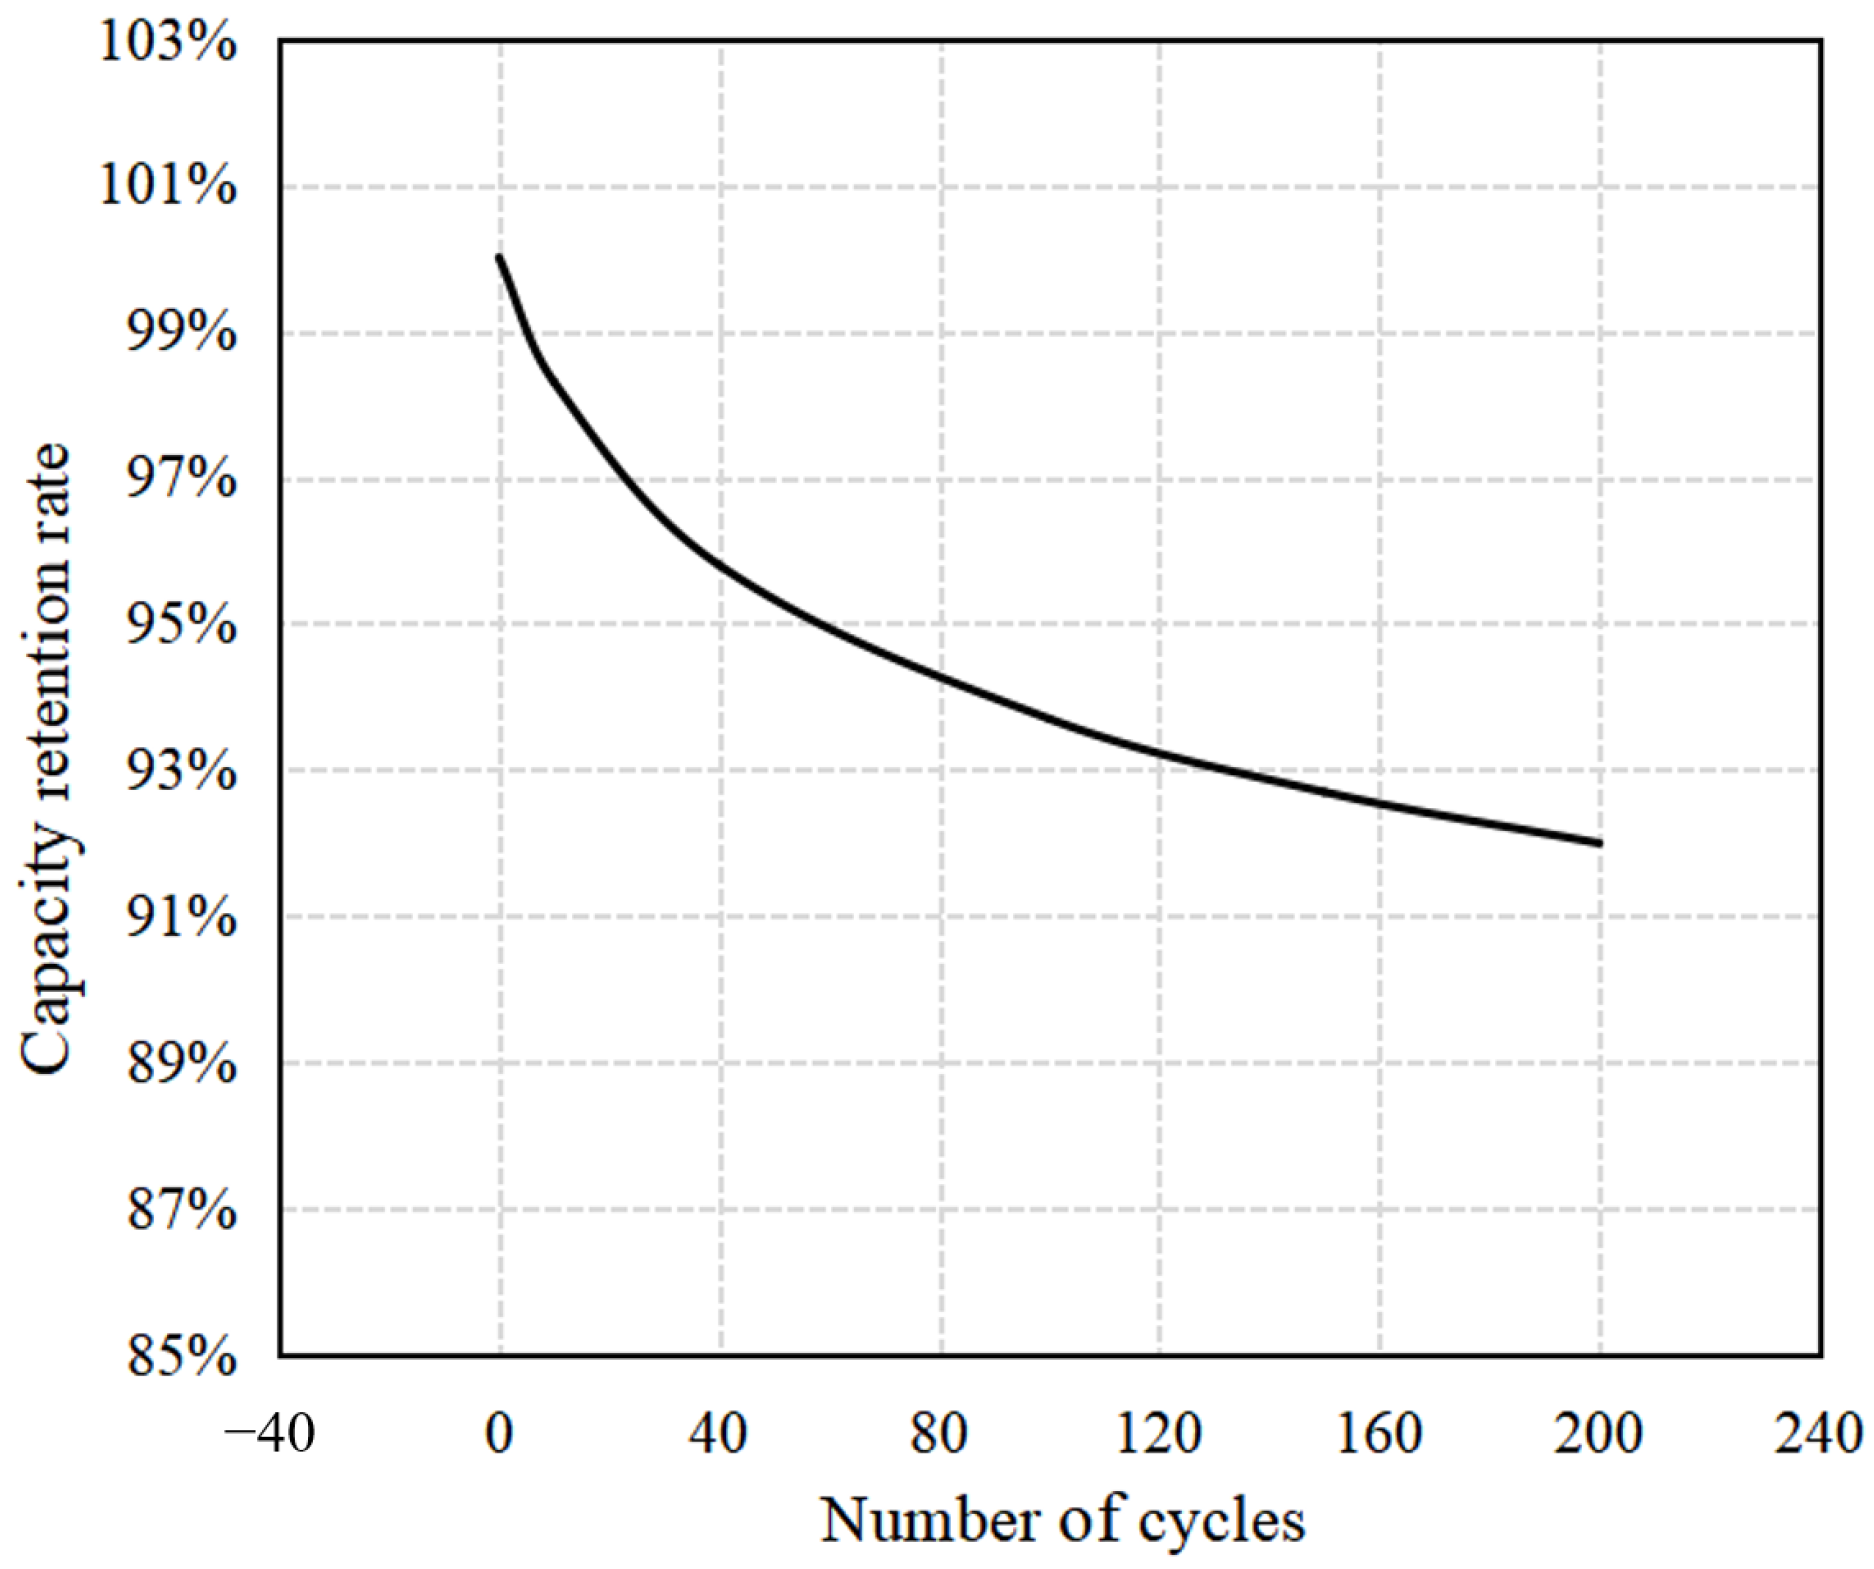
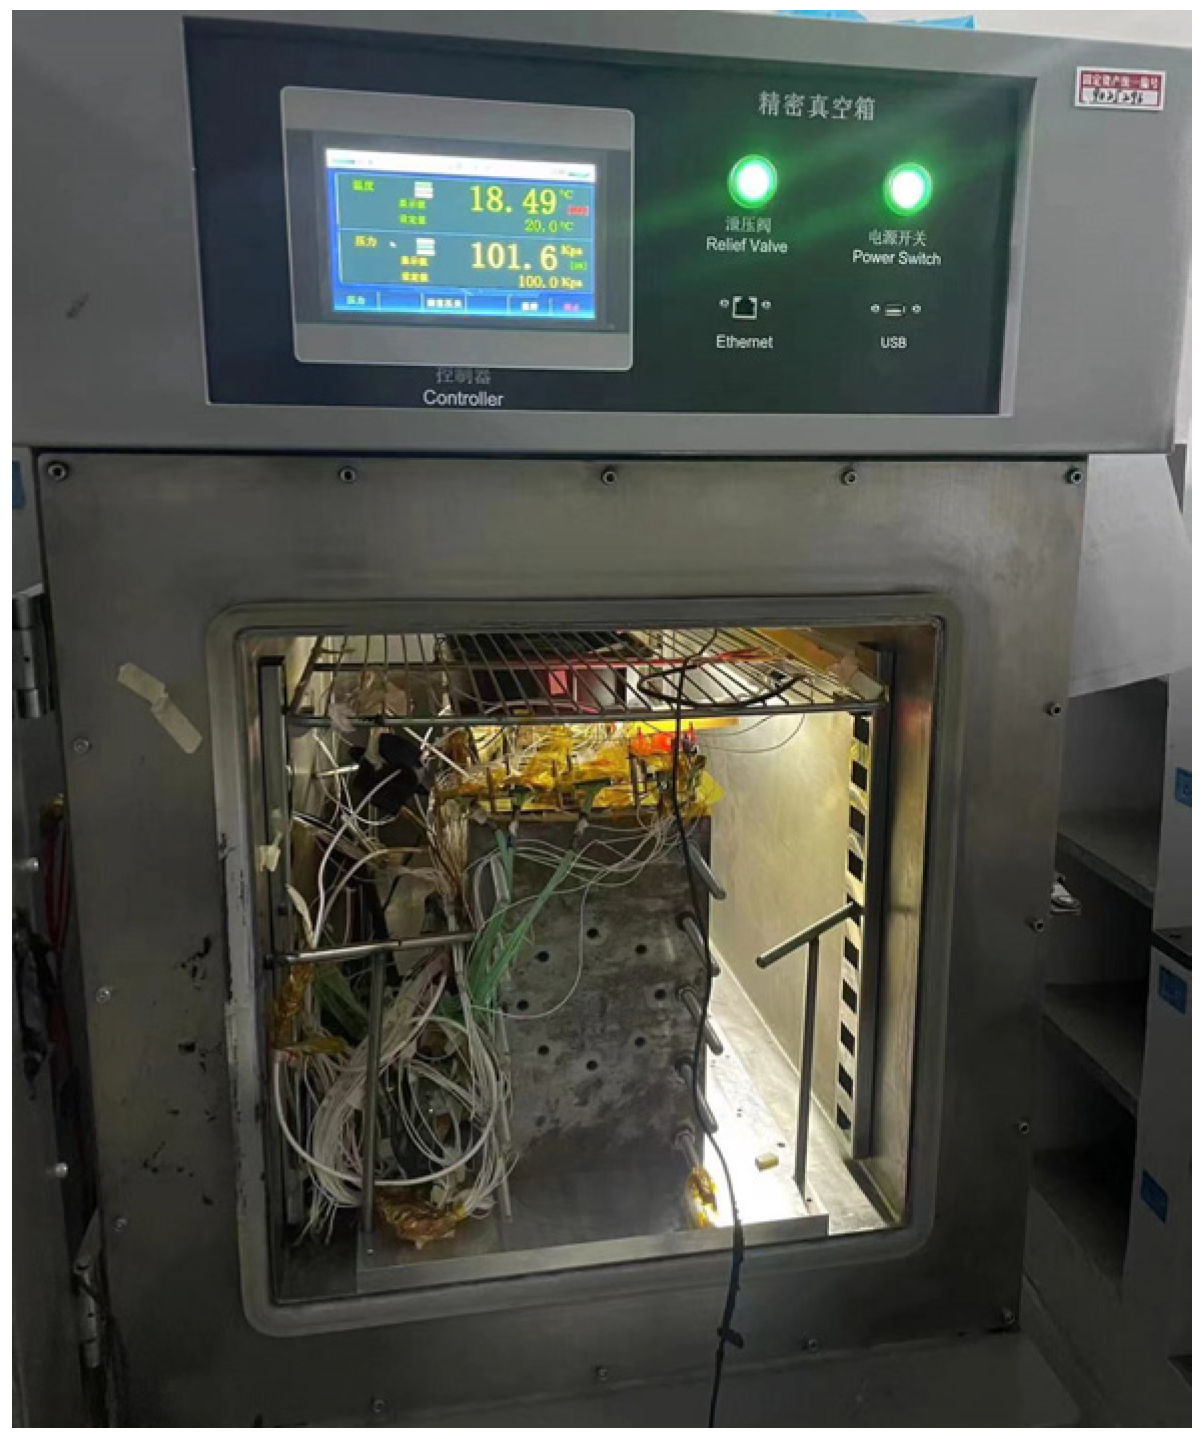
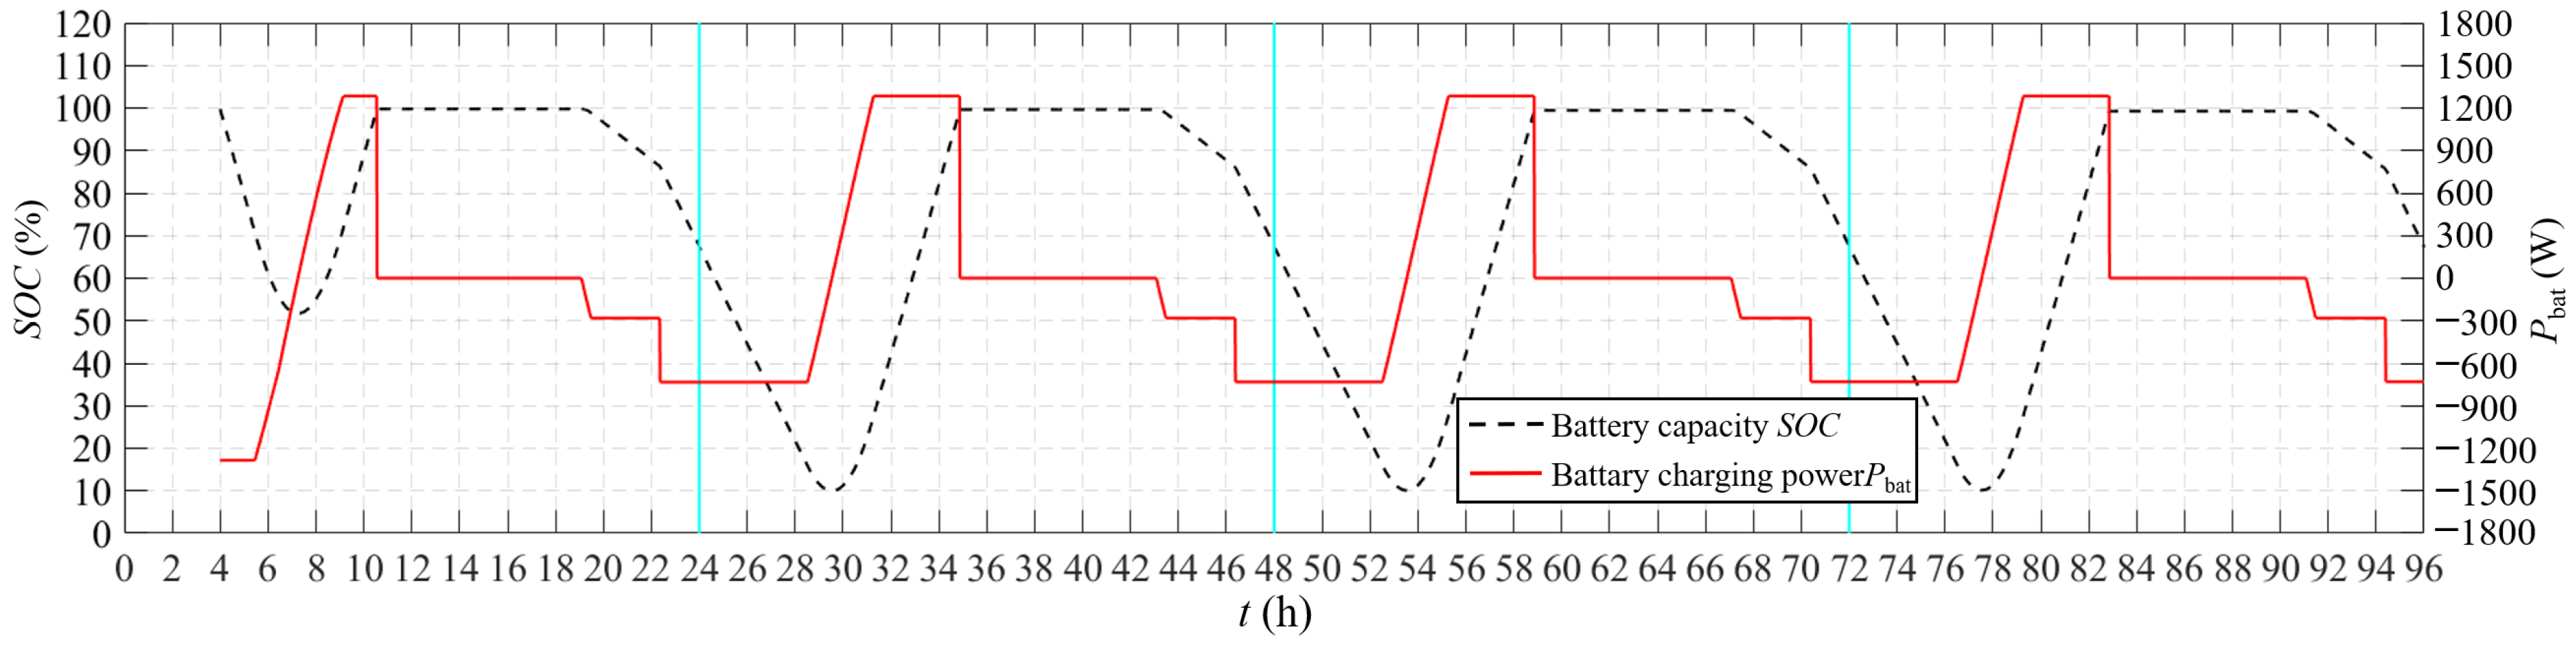
2.2.2. Secondary Battery

SOC is defined as the ratio of the current capacitance to the maximum capacitance of the secondary battery. The charging rate of the battery is related to battery type, open circuit voltage, internal resistance, temperature, and other factors. The test shows that the linear model can be used as a general expression of the change rate of SOC, expressed as:
S O · C = P B Q B
where QB is the battery capacity, and PB is the discharge power. In addition, in order to make the secondary battery have a higher cycle life, the discharge depth is set to 90%, which means that the SOC value is not allowed to be lower than 10%.
Furthermore, the secondary battery of the solar-powered UAV has high energy density and a small discharge rate. With the increase in the number of cycles, the actual capacity will decline, and this is the key reason why it is difficult for the continuous flight time of such aircraft to exceed several weeks or months. As shown in Figure 10, the actual capacity of the lithium-ion battery carried by the aircraft will decay with the number of cycles, and the decay rate of the first 30 cycles is faster. Lithium-ion battery decay test is shown in Figure 11, which was also conducted by our group and the NSL of CETGT No.18 Institute. The capacity decay curve of the battery is fitted as the following equation:
Q B = 1.9605 e 10 c 4 9.7854 e 8 c 3 + 1.7846 e 5 c 2 1.6186 e 3 c + 9.9906 e 1
where c is the number of cycles of the battery.

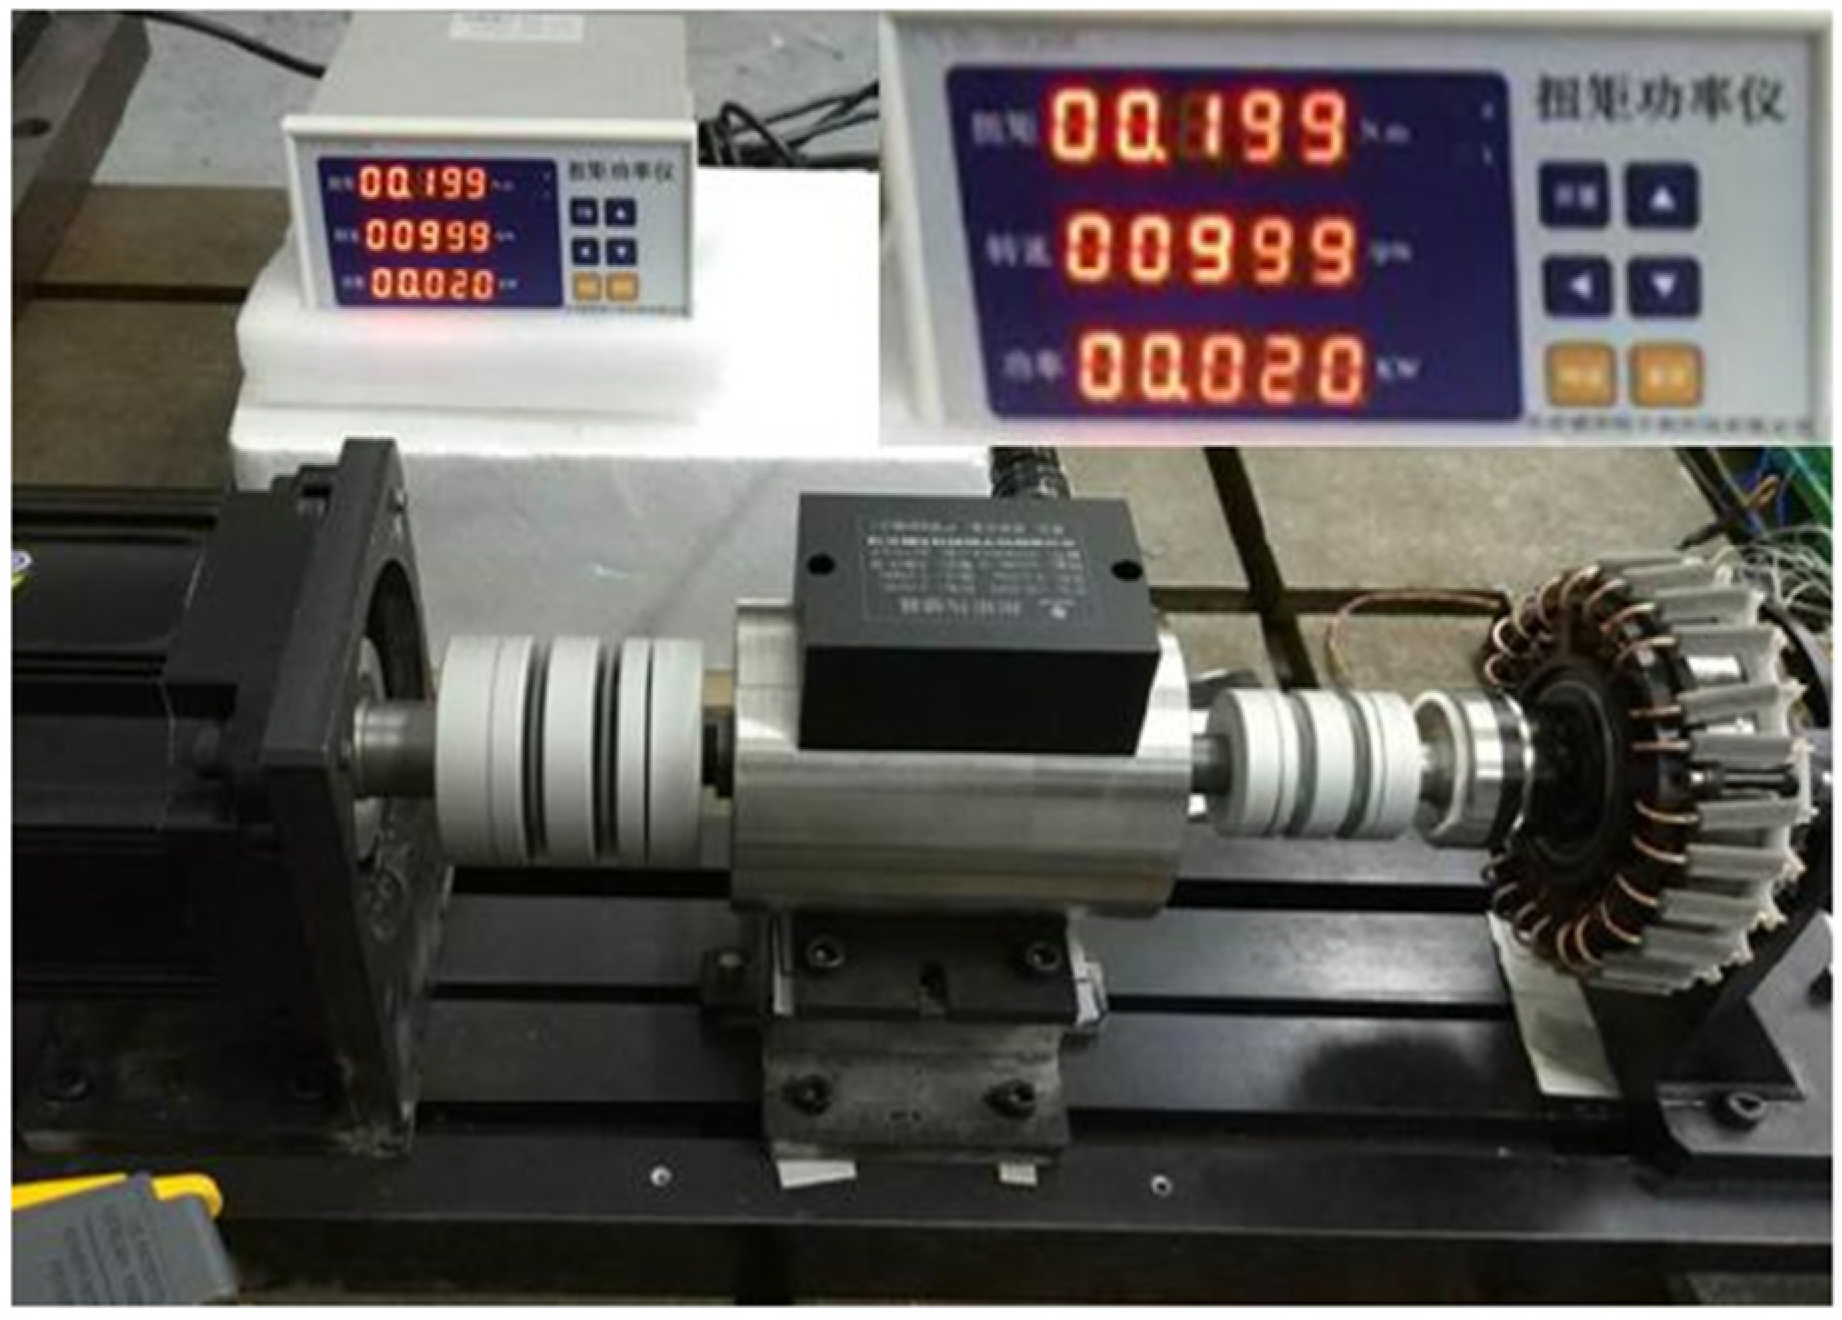
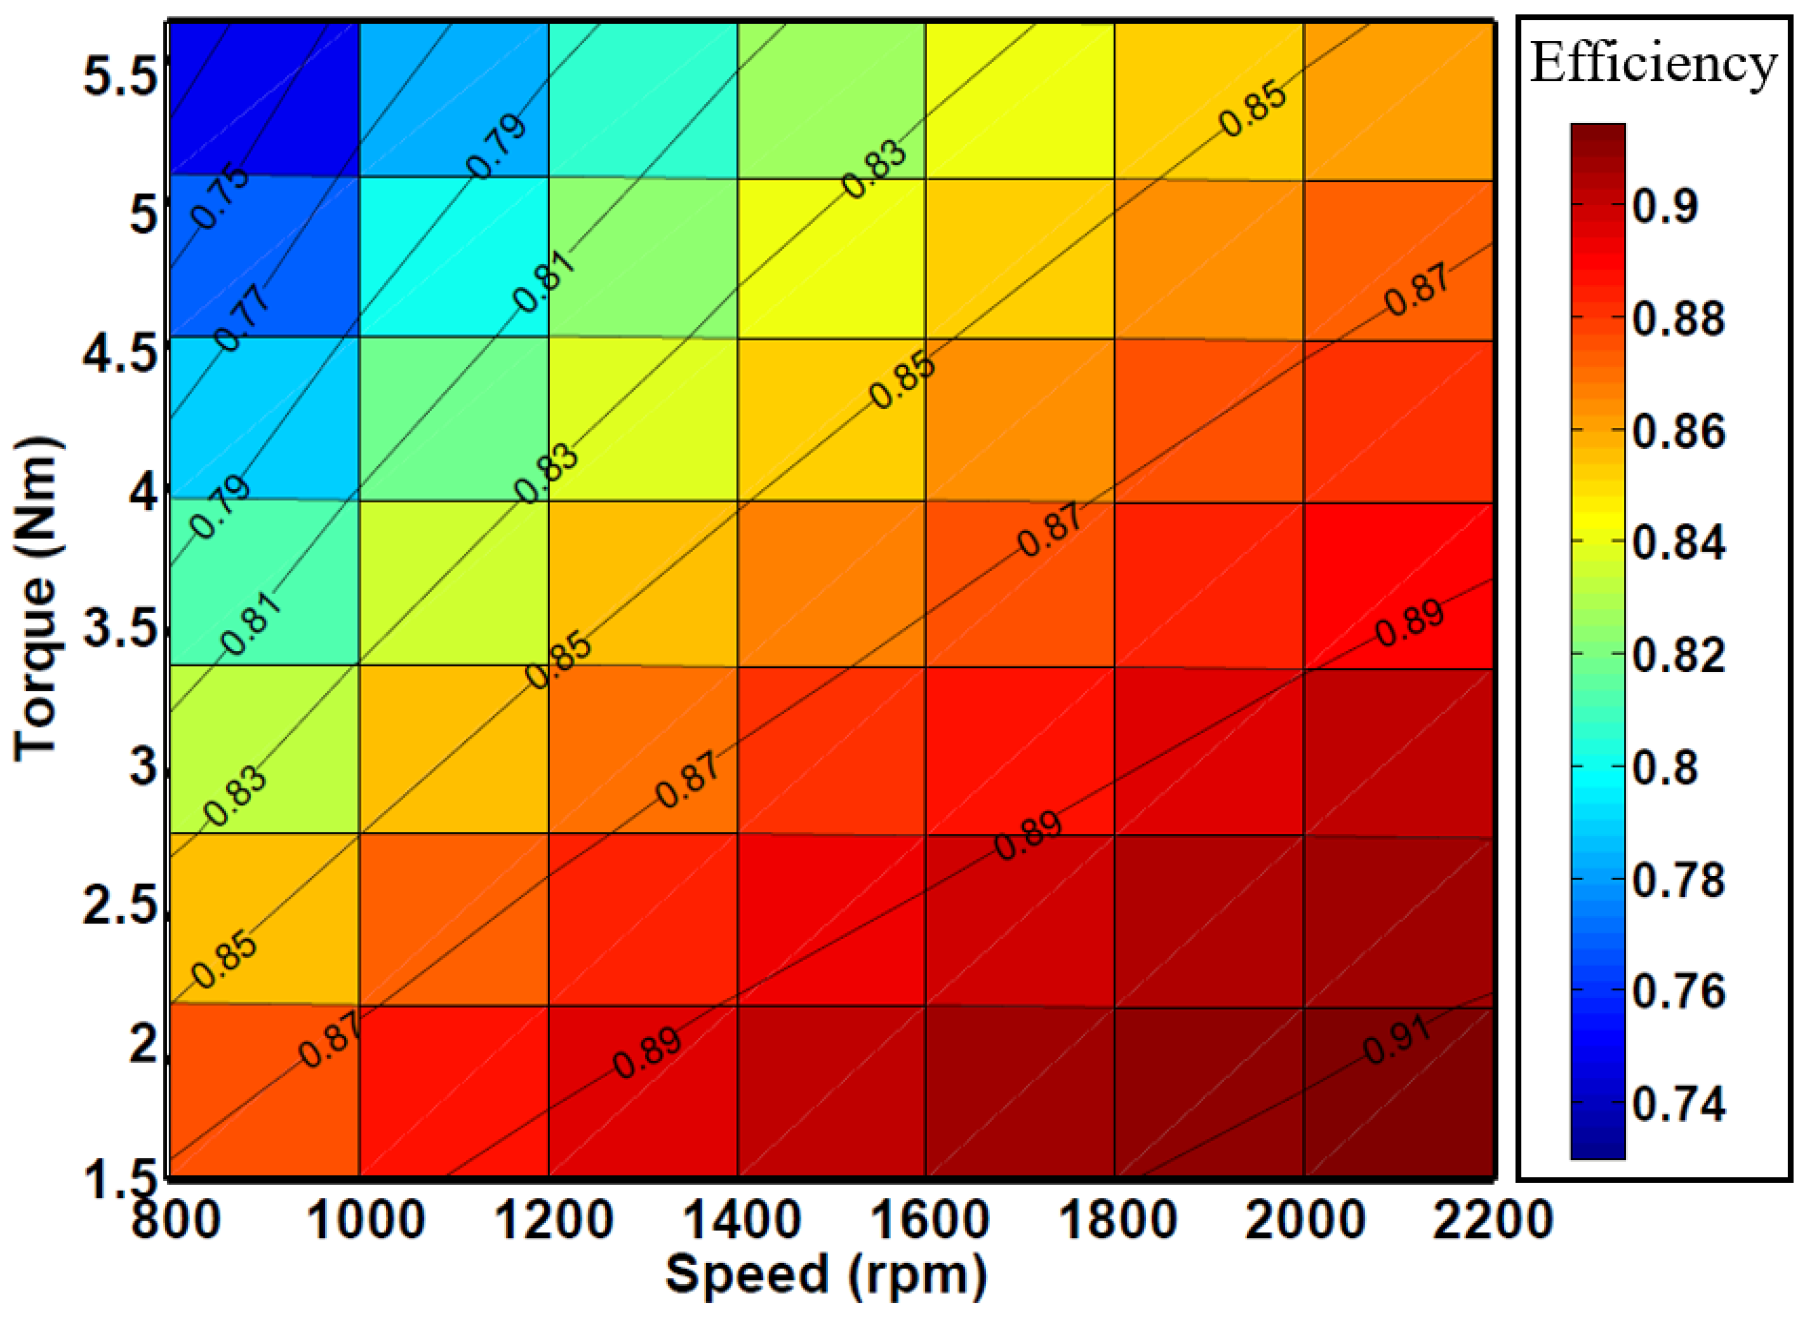
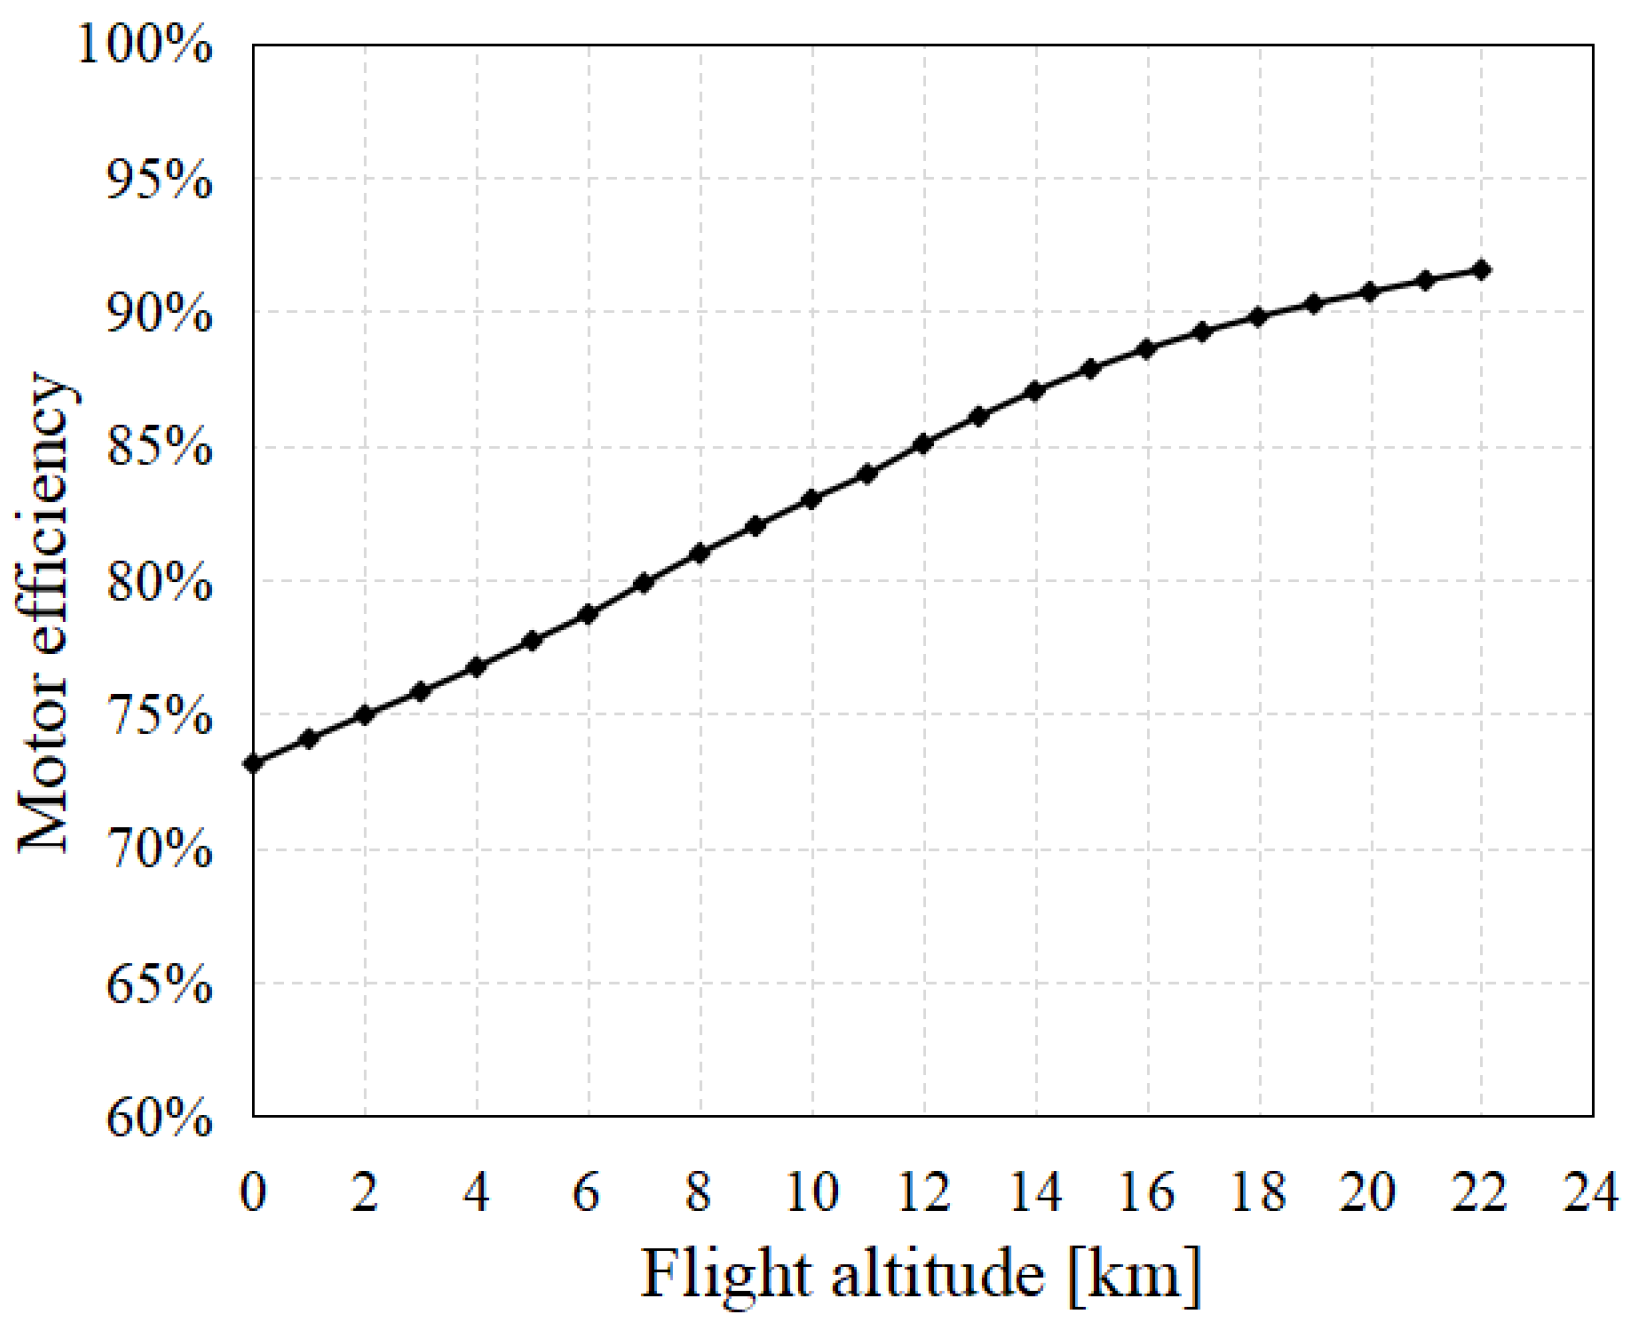
2.3. Dynamic System Model

The dynamic system of a solar-powered UAV is composed of a motor and propeller, and the parameters of the system are shown in Table 5. The efficiency of the system depends not only on their respective efficiency but also on whether they are properly matched. As shown in Figure 12 and Figure 13, the motor torque test and the propeller wind tunnel test were carried out, and the characteristics of the dynamic system under different working conditions were obtained.
The efficiency coefficients of the motor under different working conditions are shown in Figure 14. When designing the flight profile, interpolation calculation will be carried out according to the data in the figure. When the UAV is at a lower flying altitude, the propeller speed is also lower, indicating that the motor torque under the same power is larger, and the efficiency of the motor in the maximum power state is lower. The variation curve of the motor efficiency with the flight height under the maximum continuous state is shown in Figure 15.
The propeller efficiency np is affected by the forward ratio λ and the characteristic Reynolds number Rep and is calculated by the following equation:
η p = f η ( λ , R e p ) = j = 0 2 i = 0 2 ( C i j λ i ( R e p / 10 5 ) j )
where the coefficient Cij is obtained by the CFD method and corrected by the wind tunnel test data. The values of Cij are shown in Table 6.
The definitions of λ and Rep are expressed as:
λ = V n D p
R e p = ρ c 0.75 R μ V 2 + ( 0.75 π n D p ) 2
where Dp is the propeller diameter, n is the propeller speed, c0.75R is the local chord length at 75% radius of the blade, and μ is the aerodynamic viscosity coefficient.

3. Flight Profile and Power Spectrum Design

3.1. Flight Profile Design

As shown in Figure 16, the solar-powered UAV experiences the four stages of climbing, powered gliding, unpowered gliding, and level flight on the first day and repeats the five stages of level flight, climbing, powered gliding, unpowered gliding, and level flight on subsequent days.
In Figure 16, sections t1 to t4 cover all kinds of flight states of the solar-powered UAV, and the power consumption model is built based on this. There is a main DC bus connecting the batteries and all the subsystems including motors and equipment. Subsystems obtain electricity from the nearest location of the main DC bus, which means most of the energy loss is produced in the main DC bus; thus, the transfer efficiency from the battery to motors ηb-m is very close to that from the battery to equipment ηb-e. We use one symbol ηl to represent them. The electrical equipment of the solar-powered UAV includes motor and airborne equipment, and the total power required is
P req = P m + P eq / η DC η l
where Peq is the power of airborne equipment, ηDC is the efficiency of the DC/DC voltage conversion module, ηl is the cable transmission efficiency, and the required power of the motor is
P m = T V η m η p
where ηm is the motor efficiency, and ηp is the propeller efficiency.
(a)
Level flight phase
There is a balance between the lift and the total weight of the solar-powered UAV, which is expressed as
W G = ( P P , h 1 C L 3 / 2 / C D ) 2 / 3 ( 1 / 2 ρ h 1 S w ) 1 / 3
where PP,h1 is the required power for level flight at h1 altitude, CL3/2/CD is the aircraft endurance factor, and ρh1 is the atmospheric density at h1 altitude.
At time t1, the available power of the system is equal to the total required power of the solar-powered UAV, expressed as
P m ( h 1 ) = P sc ( t 1 ) η l P eq / η DC
The above equation is further expressed as
t 1 = P sc 1 ( P m ( h 1 ) + P eq / η DC η l )
(b)
Climbing phase
In the climbing phase, the solar-powered UAV has the following force balance relationship:
{ F = D + W G sin γ = L K + W G sin γ L = W G cos γ
where F is the propeller pull, L is the lift, D is the drag, γ is the track inclination, and K is the lift–drag ratio.
From the above equations, the following relationship is obtained:
sin γ = F D W G
Therefore, the rising rate at time t is
V v ( h , t ) = V sin γ = V F V D W G = ( P sc ( t ) η l P req ( h ) ) η m η p W G
In the climbing phase, the climbing rate keeps decreasing. One reason is that the light is gradually weaker, and the other one is that the higher altitude means more energy is needed for climbing. When the climb rate is 0, the aircraft reaches the highest altitude h2, and the time t2 is expressed as
t 2 = V v 1 ( 0 )
The climbing is coupled with time and height. In order to facilitate analysis, the time period from t1 to t2 is divided into M equal-difference finite elements:
t ( i ) = t 1 + i ( t 2 t 1 M )
where i is an integer, and 0 ≤ iM. The initial value and control equation are expressed as
{ h ( 0 ) = h 1 h ( i + 1 ) = h ( i ) V v ( h ( i ) , t ( i ) ) t 2 t 1 M V v ( h ( i ) , t ( i ) ) = ( P sc ( t i ) η l P req ( h i ) ) η m η p W G
The highest altitude h2 is expressed as
h 2 = h ( M + 1 )
(c)
Powered gliding phase
At time t3, the required power of the airborne equipment and the available power are balanced, expressed as
t 3 = P sc 1 ( P eq / η DC )
The force balance during the phase is similar to that during the climbing phase, except that the track inclination γ changes from positive to negative. The falling rate is
V v ( h , t ) = ( P sc ( t ) η l P req ( h ) ) η m η p W G
The gliding phase is coupled with time and height. In order to facilitate analysis, the time period from t2 to t3 is divided into N equal-difference finite elements:
t ( i ) = t 1 + i ( t 3 t 2 N )
where i is an integer, and 0 ≤ iN. The initial value and control equation are expressed as
{ h ( 0 ) = h 2 h ( i + 1 ) = h ( i ) + V v ( h ( i ) , t ( i ) ) t 3 t 2 M V v ( h ( i ) , t ( i ) ) = ( P sc ( t i ) η l P req ( h i ) ) η m η p W G
The height h3 is finally expressed as
h 3 = h ( N + 1 )
(d)
Unpowered gliding phase
In this process, the solar-powered UAV glides completely on the gravitational potential energy, and the descent rate is
V v ( h ) = P P , h W G
where PP, h is the required power for level flight at h altitude.
The period of the unpowered gliding phase is
t g = h 1 h 3 1 V v ( h ) d h = h 1 h 3 W G P P , h d h
Finally, the time t4 is expressed as
t 4 = t 3 + t g
It should be noted that the dynamic models at different stages proposed in this section are idealized, and the flight profile is limited within the two-dimensional profile, without considering the effects of crosswind, sudden engine failure, asymmetrically placed load, and other factors. In fact, solar-powered UAVs are low-speed aircraft, and the flight speed and wind speed are of the same magnitude, so these factors can very easily affect flight safety [34,35]. Therefore, when using the model mentioned in this section, the weather and equipment conditions should also be combined to limit the flight speed of the solar UAV at each stage.

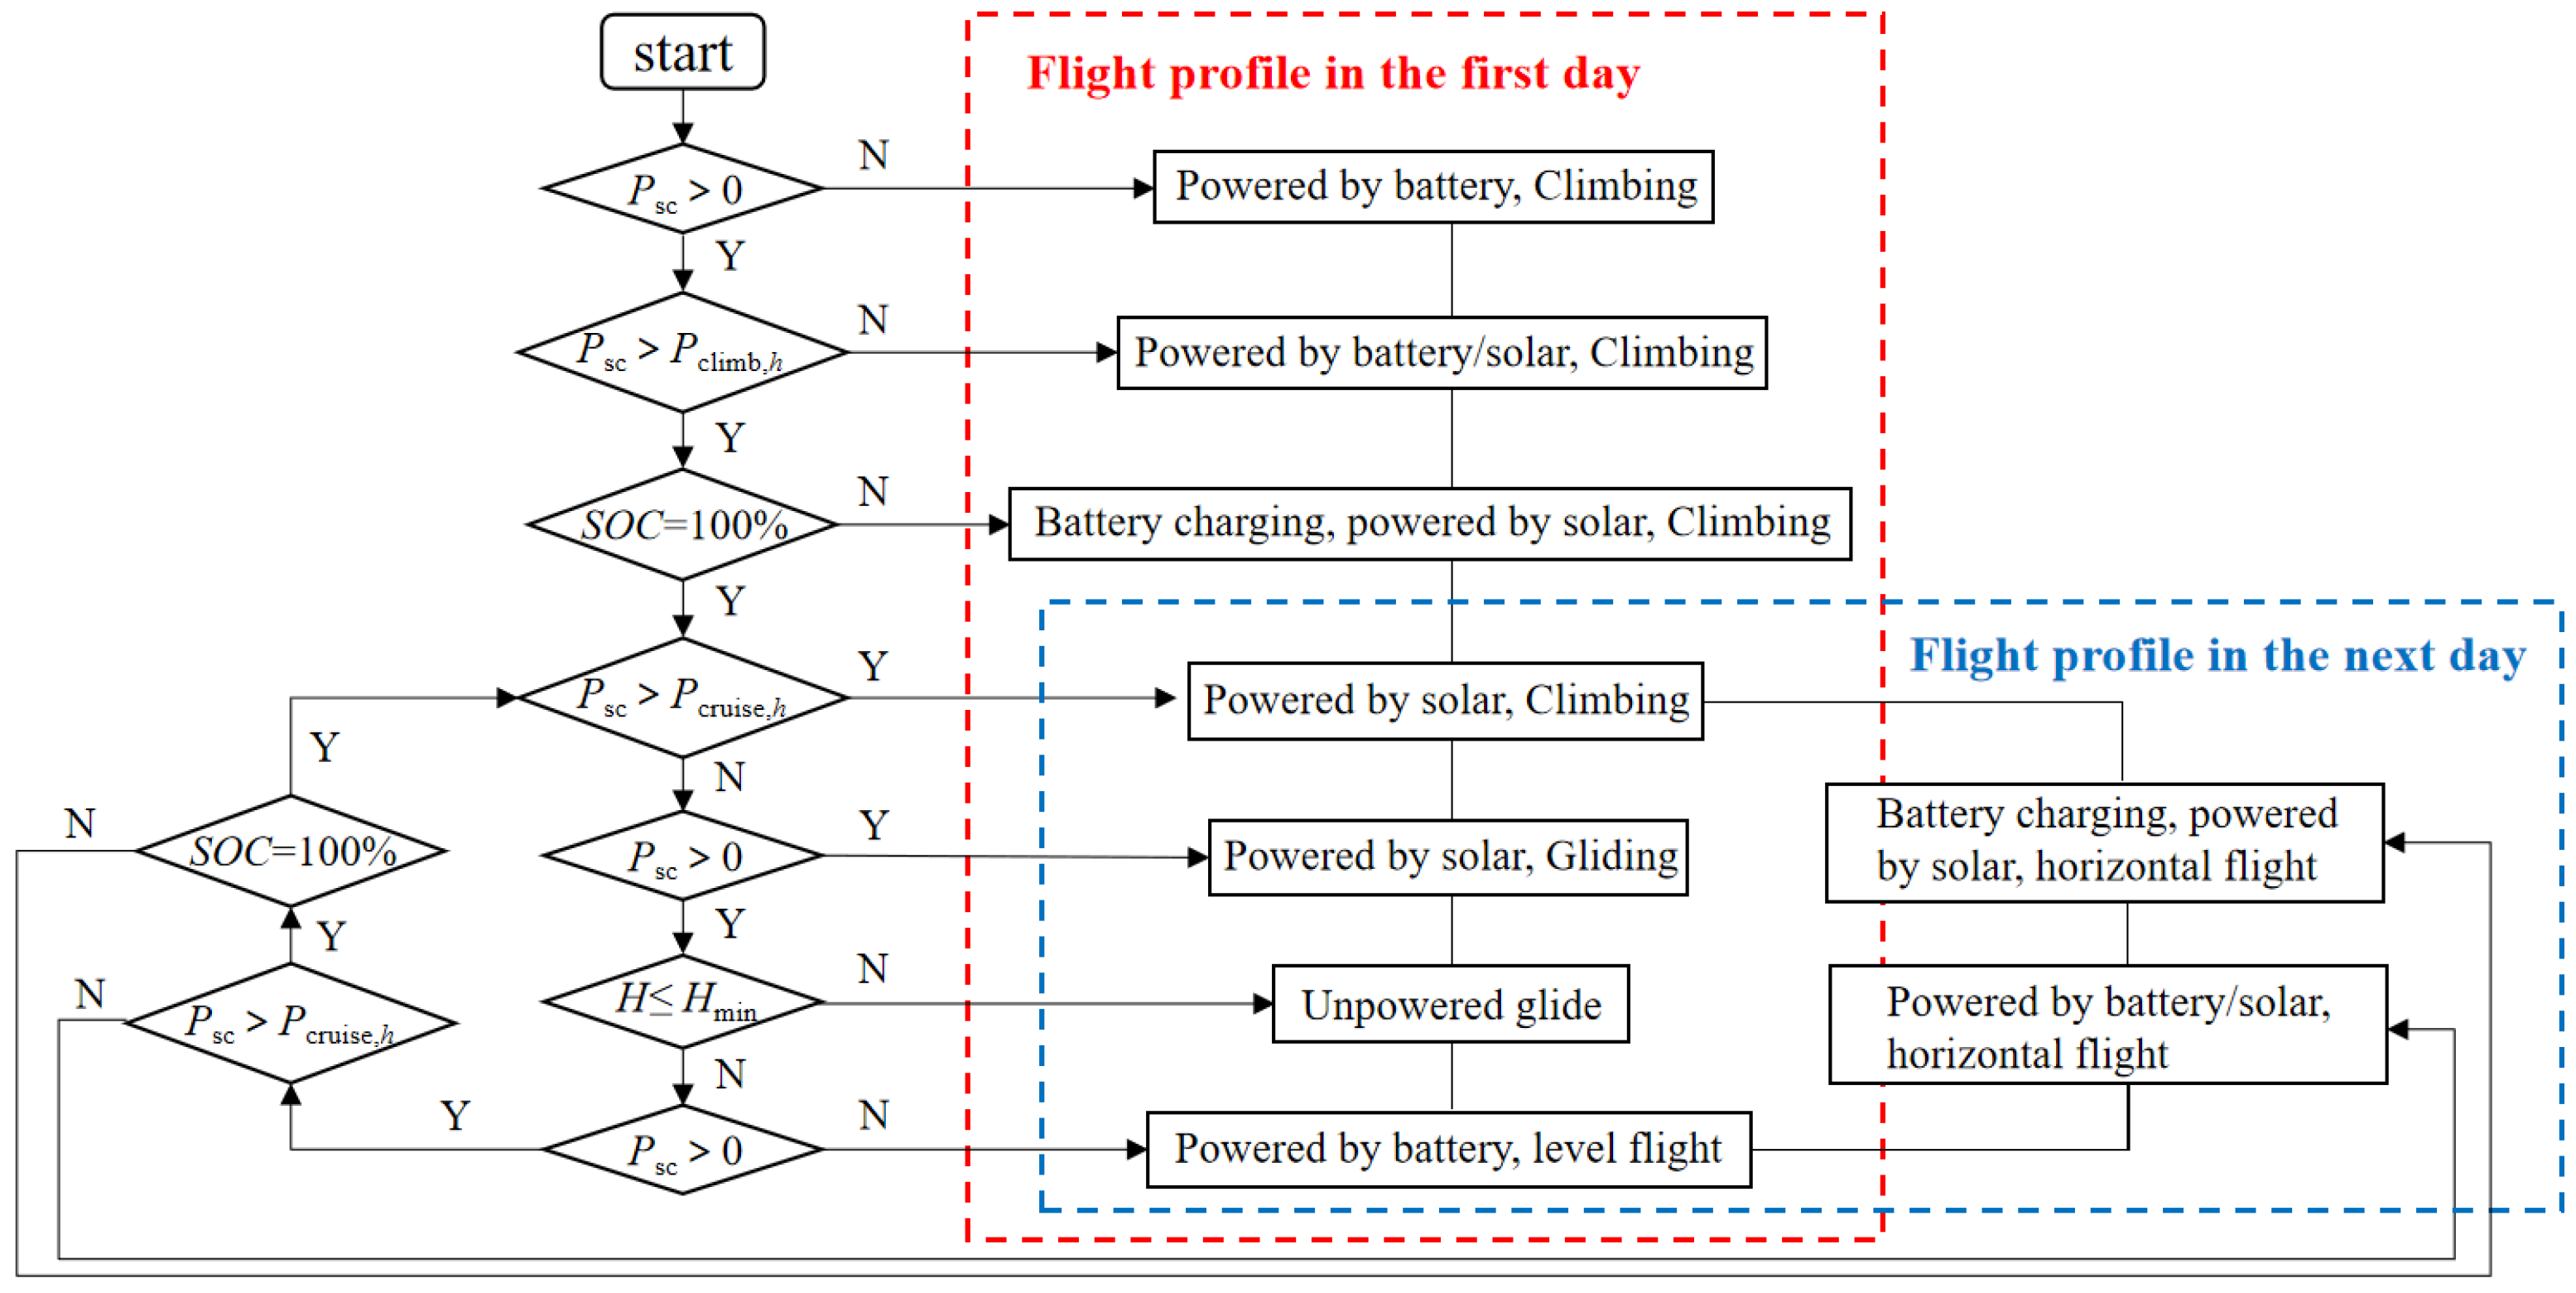
3.2. Flight Strategy

As shown in Figure 17, the flight state control flow is established, and the flight condition of the UAV is determined through the criteria of each link. The parameters used as criteria include the PV cell output power PSC, the secondary battery capacity SOC, and the flight height H. Compared with the flight strategy of the solar-powered UAV proposed in the literature [27,28], the strategy shown in Figure 17 has the following advantages:
(1)
Maximizes solar energy utilization, which means the UAV will use the solar energy to climb as high as possible before dusk, instead of maintaining level flight after climbing to a certain height;
(2)
Tries to avoid cruising in the higher airspace, which means the UAV will use the gravitational potential energy to glide to the night flight altitude at the first time after dusk, instead of starting to slide at a fixed moment.
In addition, when executing the flight strategy, the constraint conditions to be met include:
(1)
The remaining capacity of the secondary battery shall not be less than 10%;
(2)
Always meet the power demand of airborne equipment (including data link, flight control, navigation, etc.);
(3)
The charging and discharging power of each piece of equipment shall not exceed the allowable value.

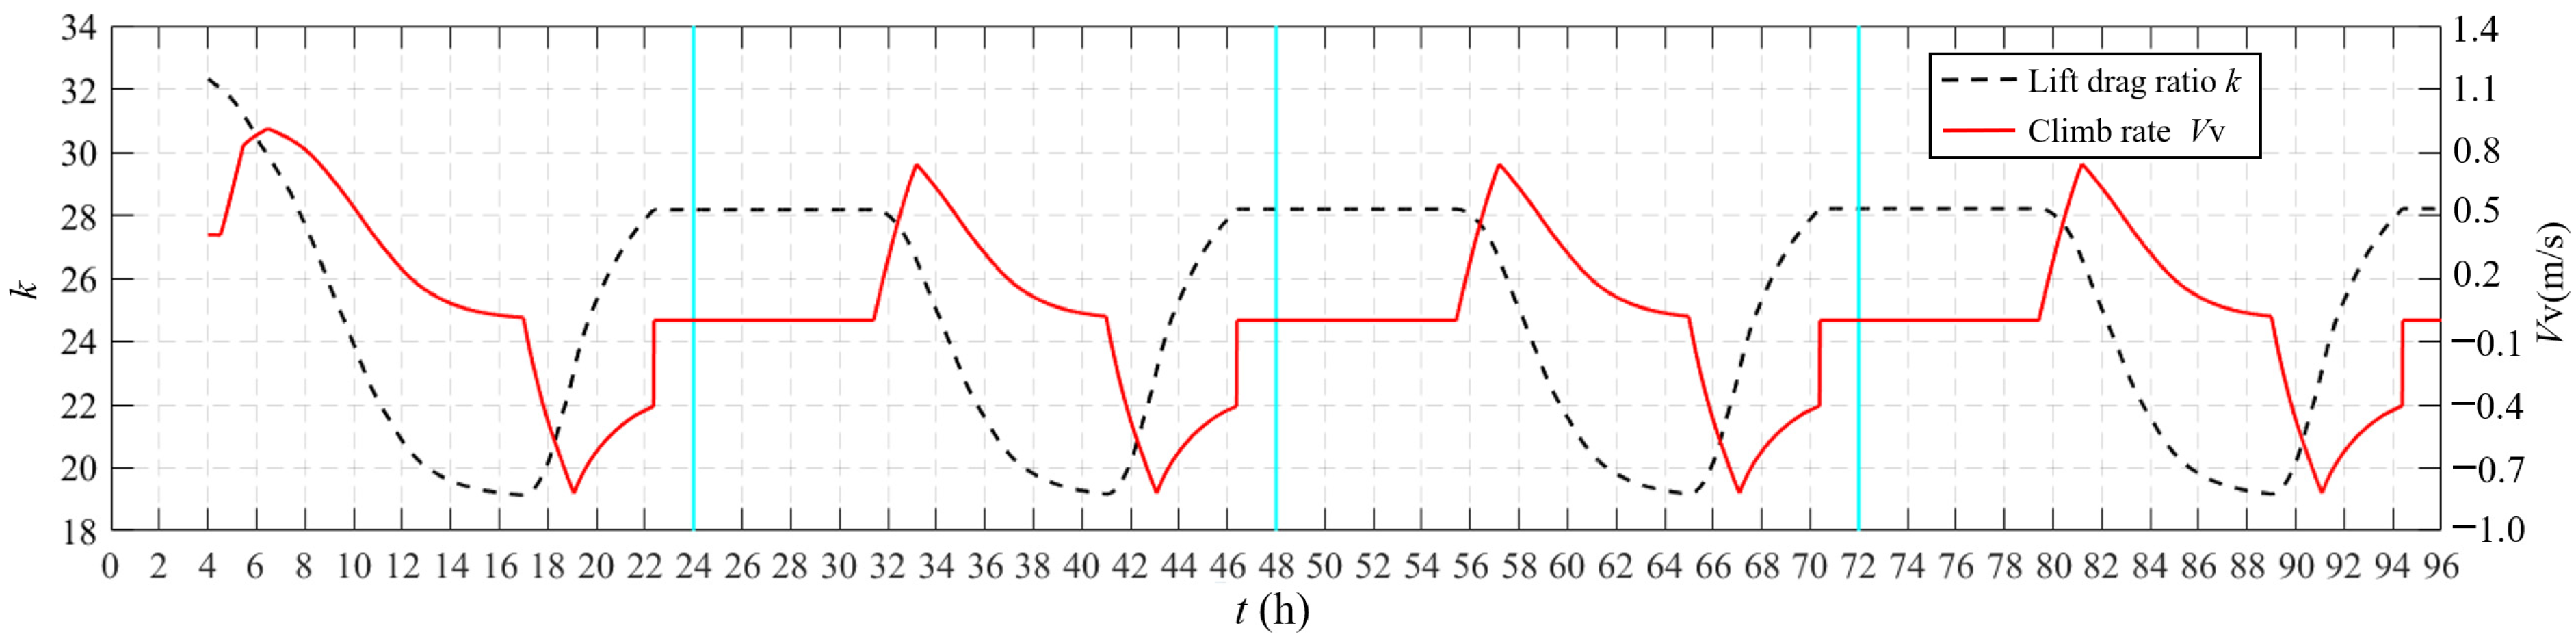
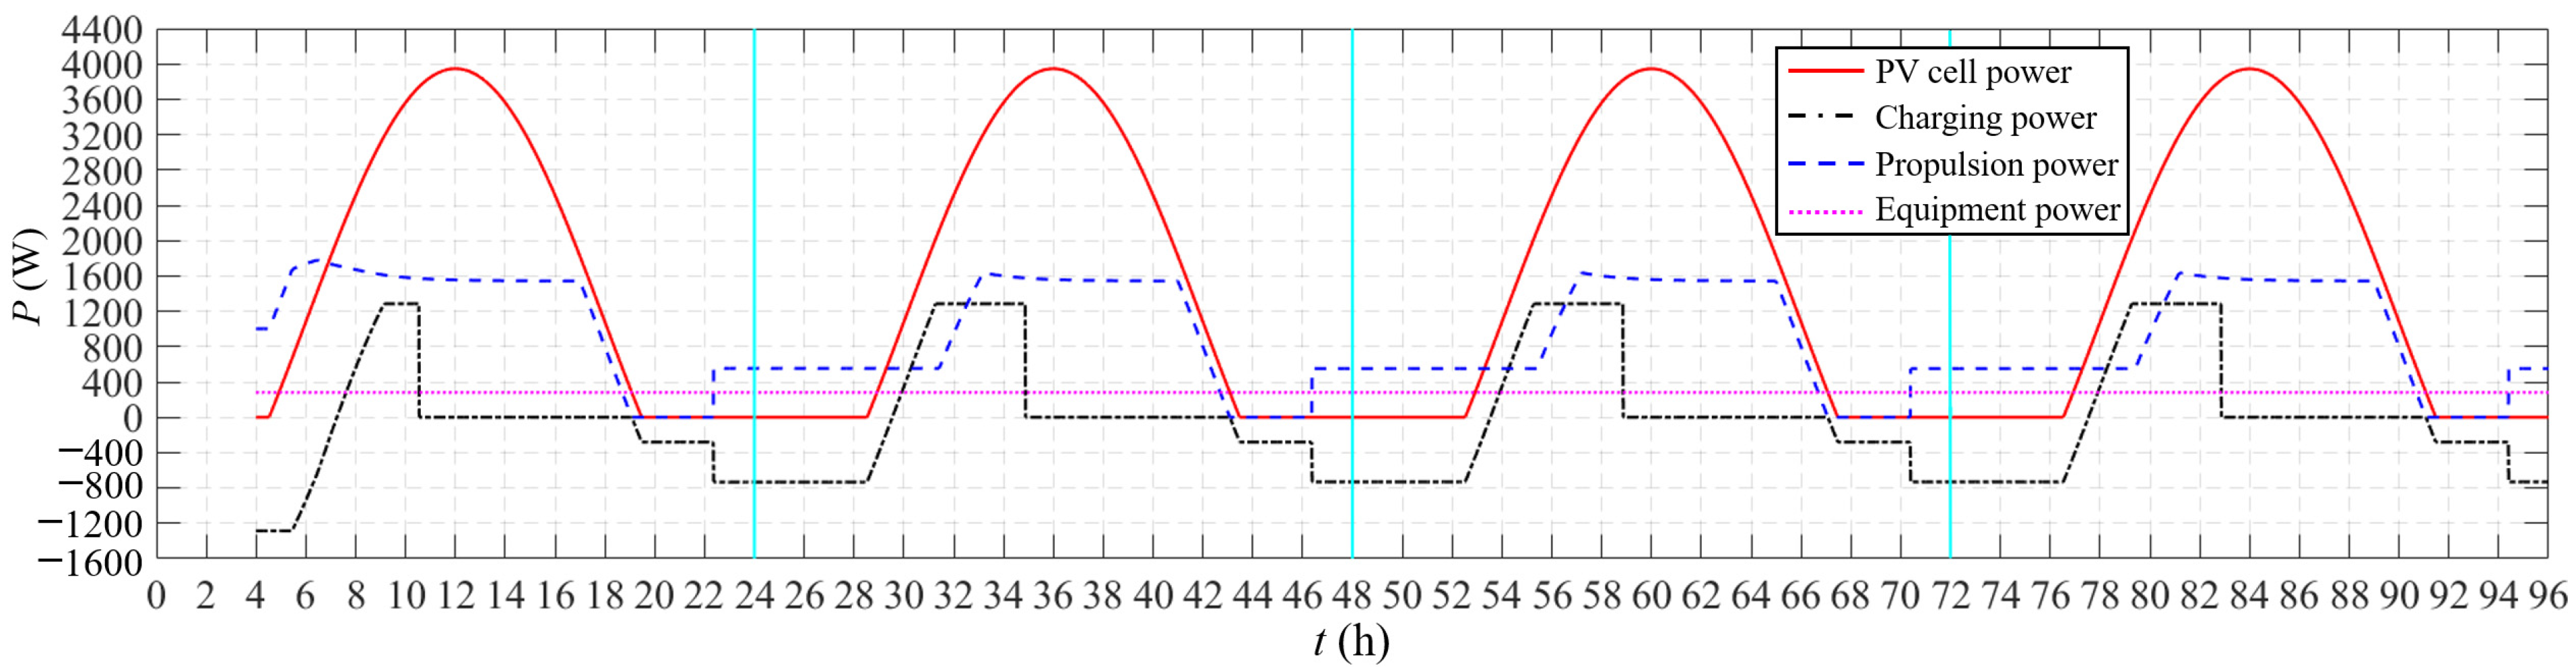
4. Typical Flight Profile and Power Spectrum

Based on the mathematical and physical model in Section 2 and the flight strategy in Section 3, the flight simulation is carried out, and the typical flight profile and power spectrum are obtained. During the simulation, the latitude of the solar-powered UAV is 41° N, and the flight date is 21 June. Figure 18 shows the flight altitude and speed of a typical flight profile. Figure 19 shows the climb rate at different times. The positive climb rate means that the UAV climbs upward. Figure 20 shows the charging and discharging curve of the secondary battery in the typical flight profile. The positive power indicates the battery charging. Figure 21 shows the power spectrum of a typical flight profile. At any time, the total required power of the UAV is not higher than the available power, and the power of the motor is not higher than its maximum continuous power.
On the first day, the solar-powered UAV takes off in the early morning. It is in the climbing phase from 4:00 to 17:10, and the climbing increases first and then decreases. This is because the radiation power is 0 when taking off, and the UAV climbs by fully using the energy of the secondary battery. At this moment, the power of the motor does not reach the maximum value. With the increase in the available solar power, the motor reaches the maximum power, and the UAV starts to climb at the maximum rate. At this moment, there is still available solar power, and the secondary battery is in a charged state until the SOC = 100%. Subsequently, the UAV is powered directly by PV cells to climb. As the altitude continues to increase, the required power for climbing increases and the illumination power decreases, so the climb rate decreases significantly and the UAV reaches the maximum altitude of 20 km at dusk.
From 17:10 to 19:40, the UAV is in the powered gliding phase. During this stage, the energy stored in the secondary battery is not used, and the PV cells directly power the motor, which is an important means to maximize the utilization of light energy. At this phase, the residual light is not enough to maintain the UAV in level flight. Therefore, although the propeller is still rotating, the altitude is falling. At 19:40, the light intensity is only enough to maintain the energy required for the airborne equipment, and the UAV stops the powered gliding phase.
From 19:40 to 22:20, the UAV is in the unpowered gliding phase, and it glides by relying on gravitational potential energy. At 19:40, the secondary battery begins to intervene in the flight, providing the power required by the equipment together with the remaining light. However, the secondary battery does not supply power to the motor at this stage. At 22:20, the UAV reaches the night flight altitude of 10,000 m, and it does not continue to glide. The lower altitude means a significantly enhanced wind field, so the solar-powered UAV usually does not conduct night flight below 10,000 m.
From 22:20 to 7:30 the next day, the UAV is in level flight. Before sunrise, the UAV completely relies on secondary battery power for level flight. After sunrise, with the increase in illumination power, the discharge power of the secondary battery gradually decreases until the illumination power can fully support level flight, and the discharge power of the battery decreases to 0. Subsequently, the remaining illumination power is used to charge the secondary battery until 7:30, when the battery charging power has reached the maximum value, while the illumination is still surplus. Then, the UAV climbs with the remaining light and begins the cycle flight of the new day.
As shown in Figure 20, from the first day to the fourth day, the maximum value of SOC decreased from 99.79% to 99.29%. Since the specified minimum SOC value is not allowed to be lower than 10%, in order to ensure sufficient energy supply at night, the loss of secondary battery capacity can only be compensated by gravitational potential energy. As shown in Figure 18, from the first day to the fourth day, the night cruise altitudes decreased from 10,000 m to 9911 m. It can be predicted that with the increase in the cycle number, the altitude of night flight will further decrease.

5. Analysis

During flight profile design, the input parameters are further divided into task indicators and performance indicators. The task indicators are related to the specific mission performed by the UAV, including takeoff time window, flight season, flight latitude, and takeoff weight. The performance indicators, including lift–drag ratio and secondary battery density, characterize the advanced performance of the UAV. This section studies the sensitivity of the flight profile to these parameters. Other environmental factors also have impacts on the profile design. For example, the wind field can change the absolute aerodynamic forces and moments which have a great impact on the optimal flight path.

5.1. Task Indicators

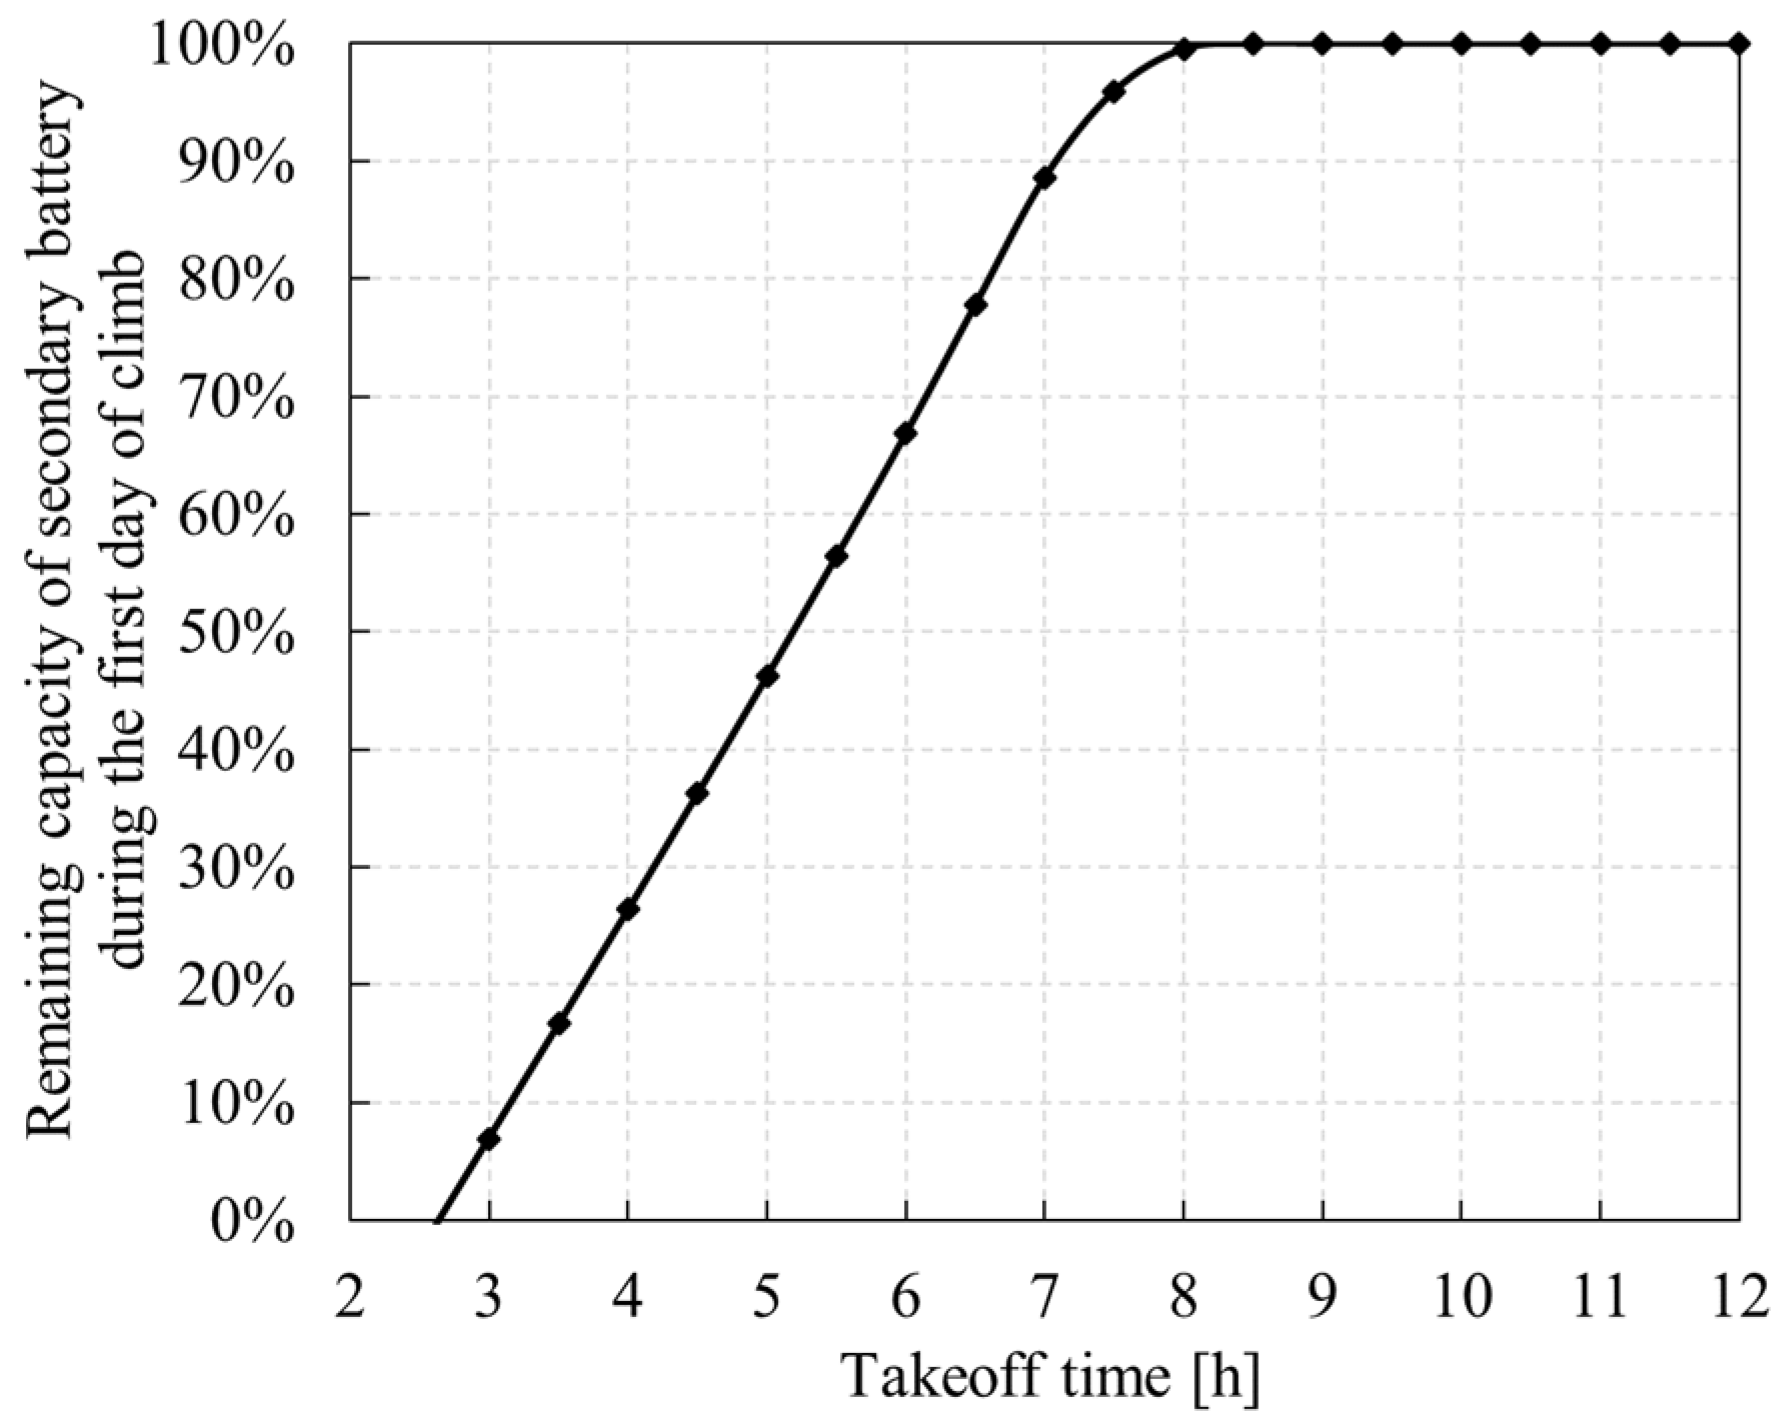
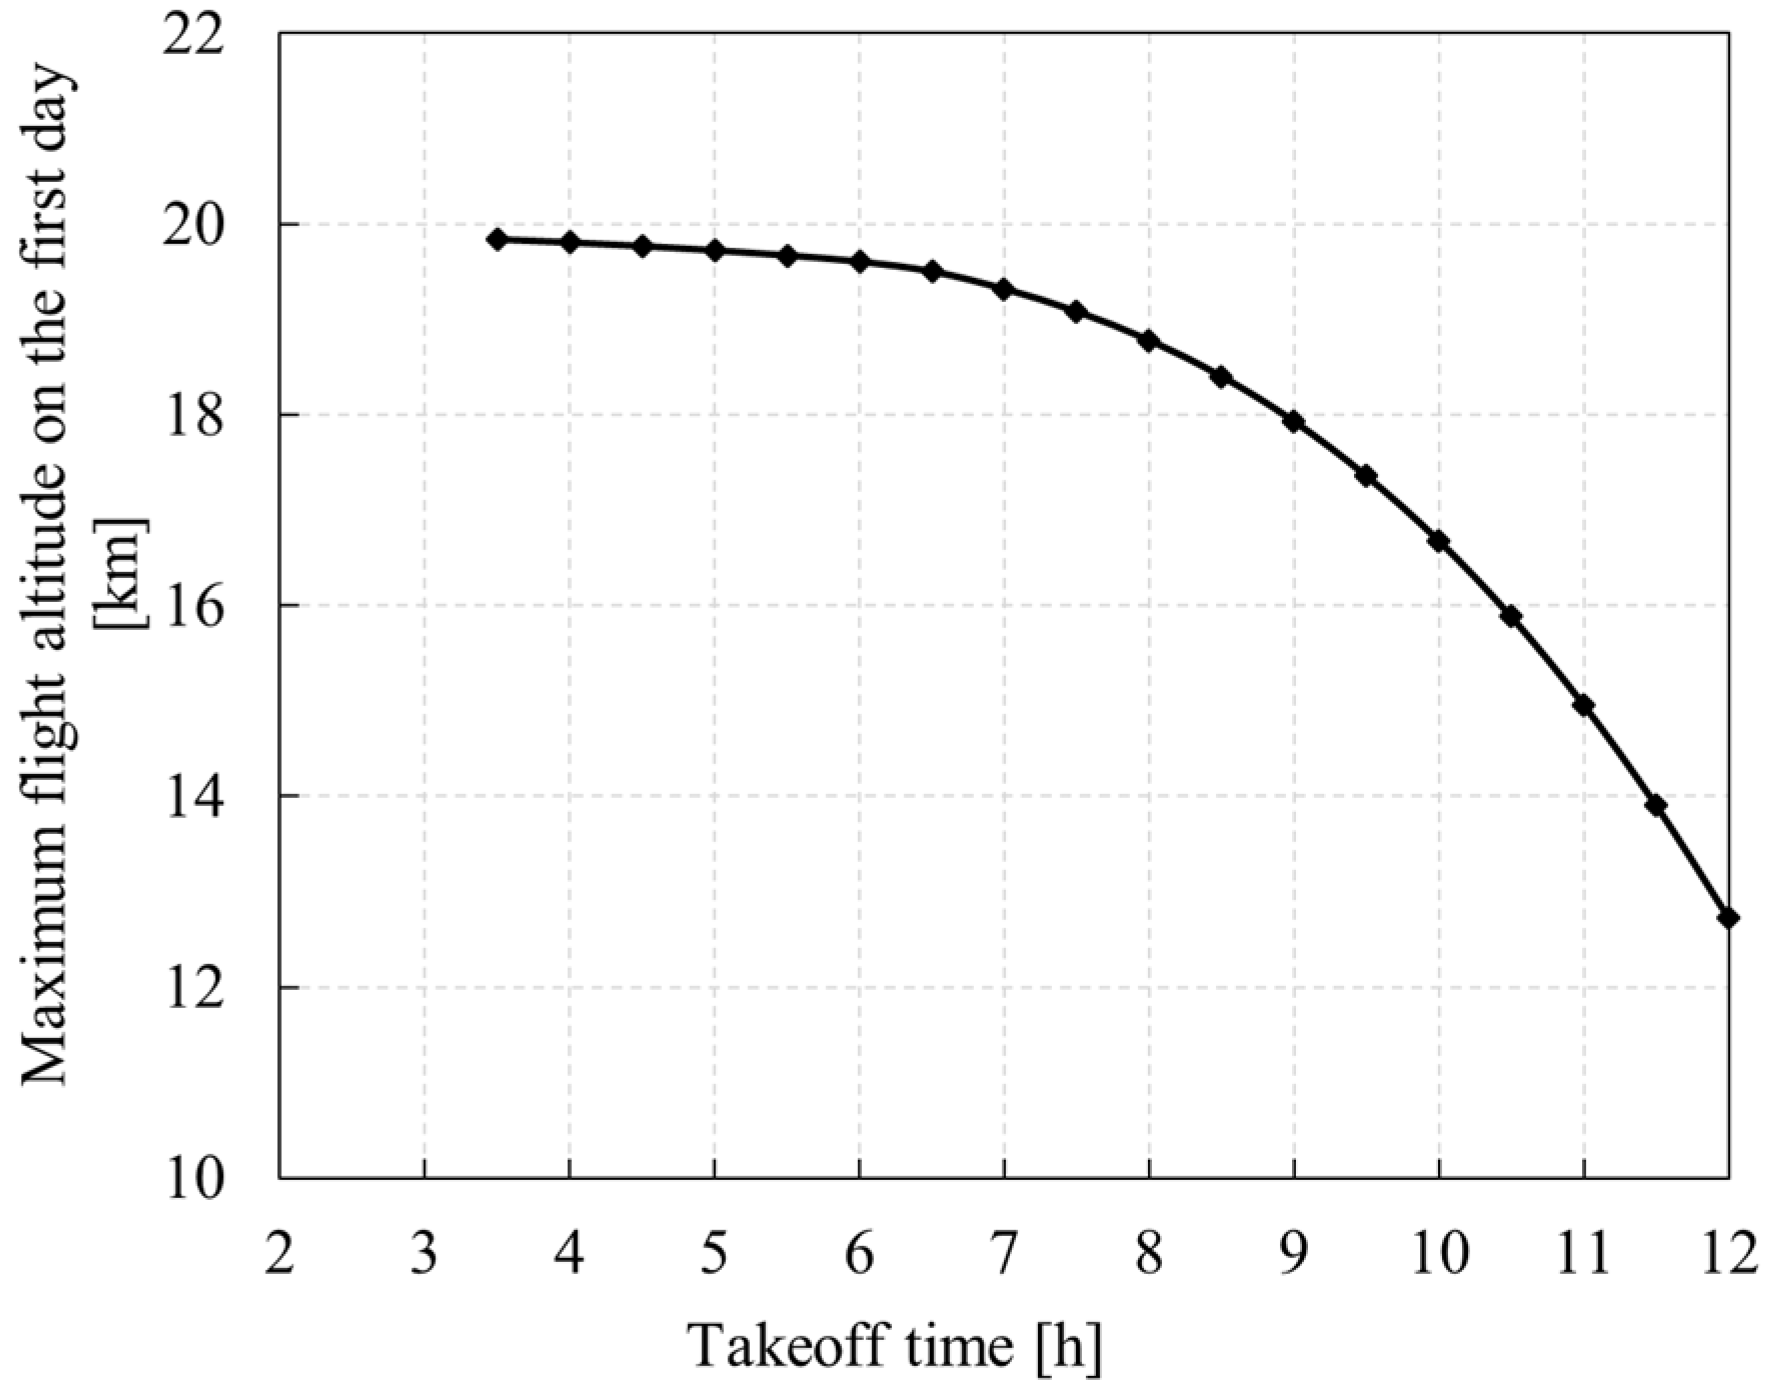
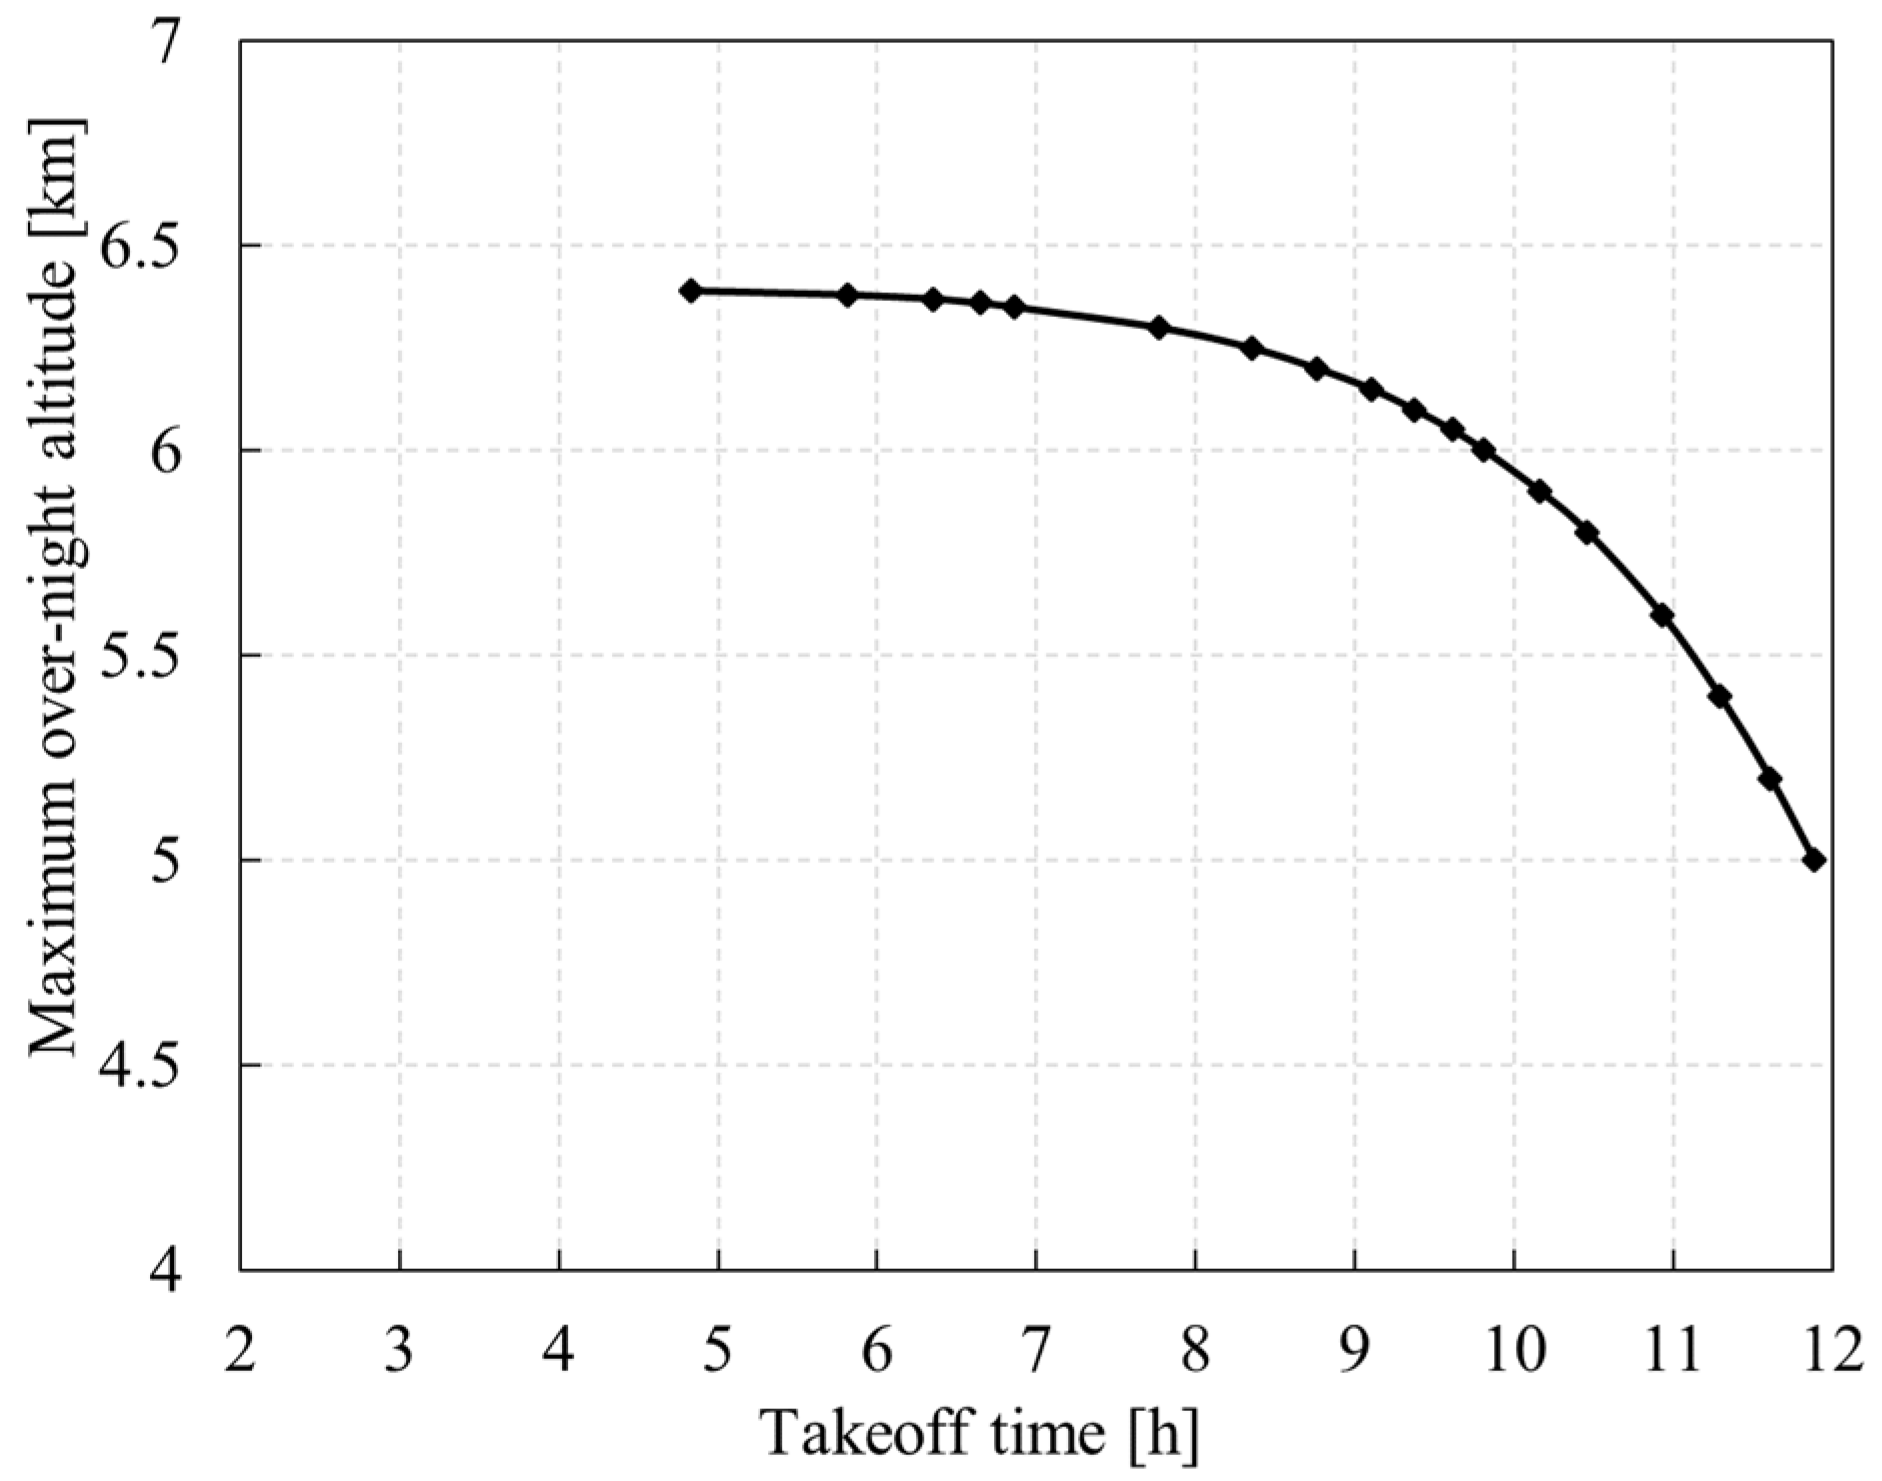
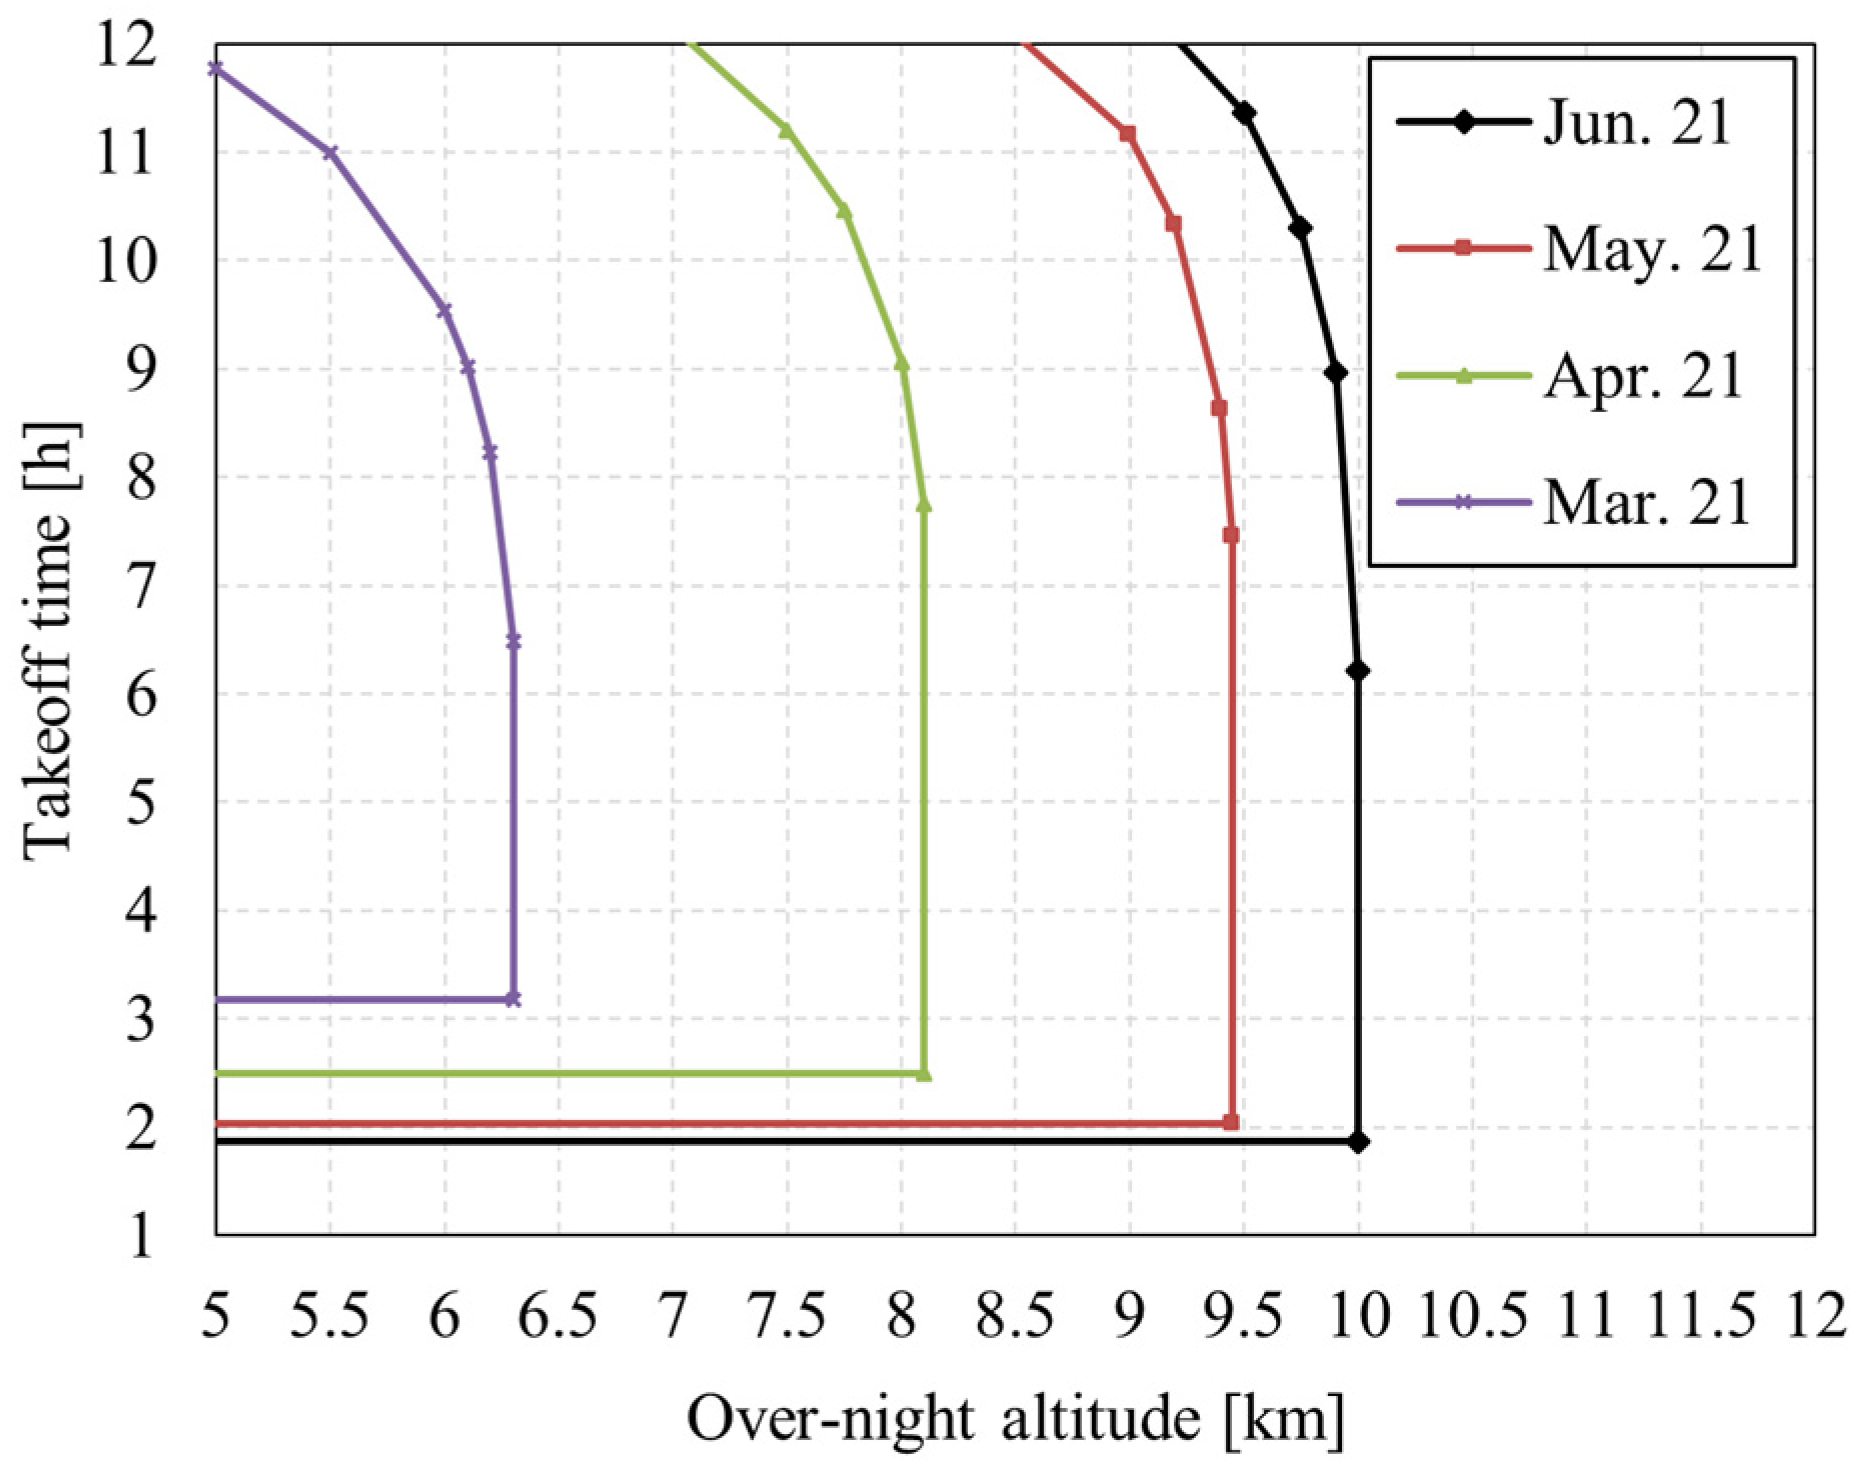
5.1.1. Takeoff Time Window

The solar-powered UAV should reach the fixed altitude at the predetermined time on the first day, which is the prerequisite for the subsequent closed-loop continuous long-endurance flight, so it is necessary to determine the takeoff time. In this study, the takeoff date and flight latitude are fixed as March 21 and 41° N, respectively.
If the takeoff time is earlier than sunrise, the UAV will first use the secondary battery to climb, while if the takeoff time is later than sunrise, the UAV will be powered by PV cells alone or by a combination of PV cells and secondary batteries. As shown in Figure 22, Figure 23 and Figure 24, the earlier the takeoff time, the longer the discharge time of the secondary battery on the first day, and the smaller the minimum power of the battery during the climbing process. However, if the UAV takes off too early, the sun will not rise before the secondary battery reaches its lowest allowed level, preventing the UAV from continuing its climb. The later the UAV takes off, the smaller the maximum altitude it can reach, and the lower the maximum overnight altitude the next day.

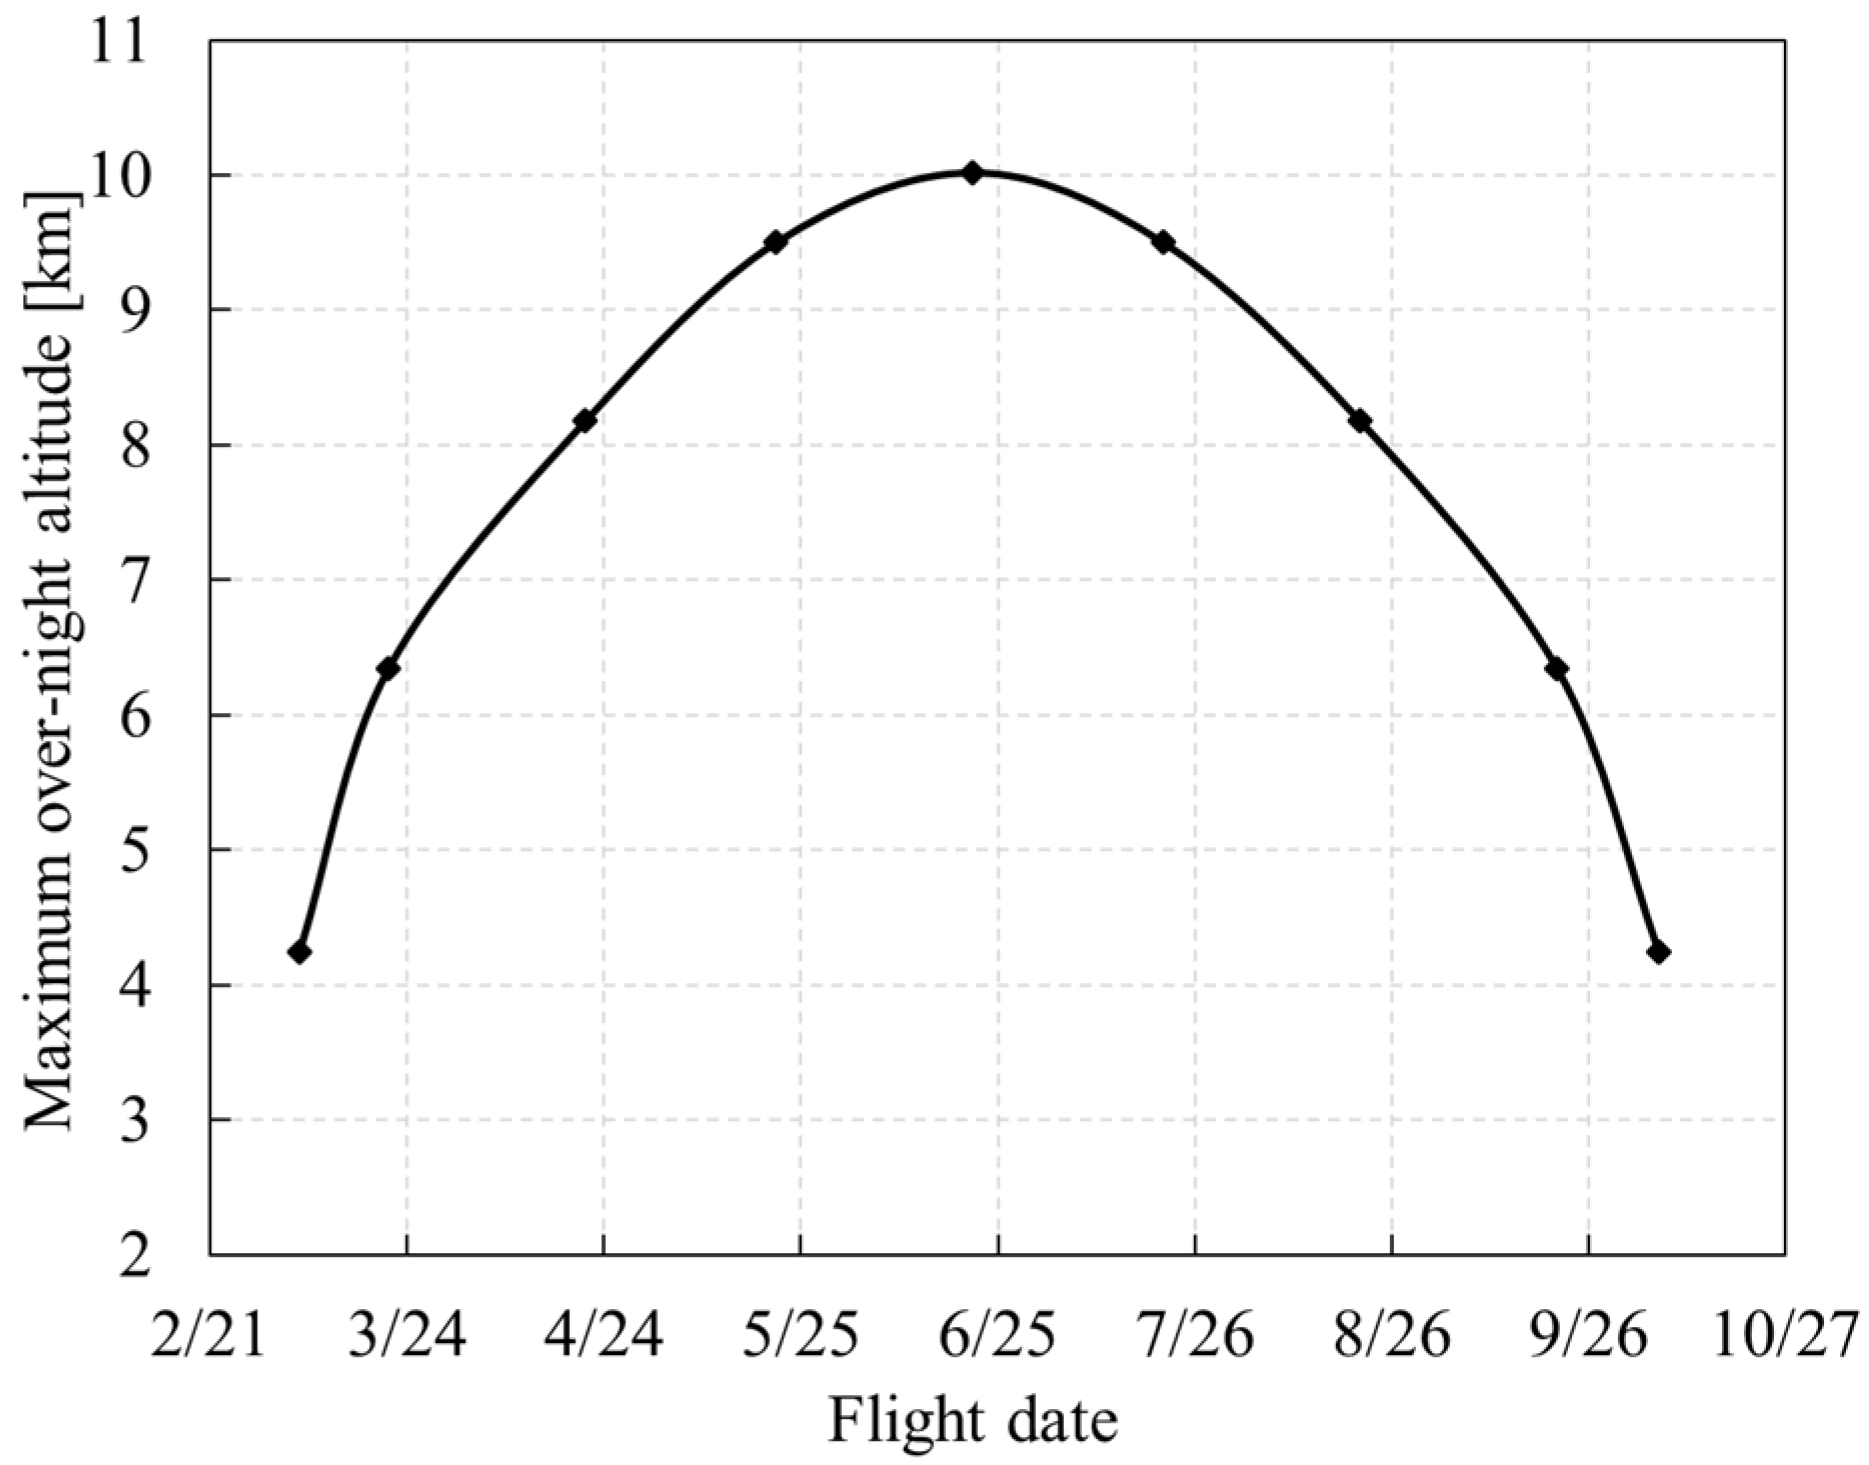
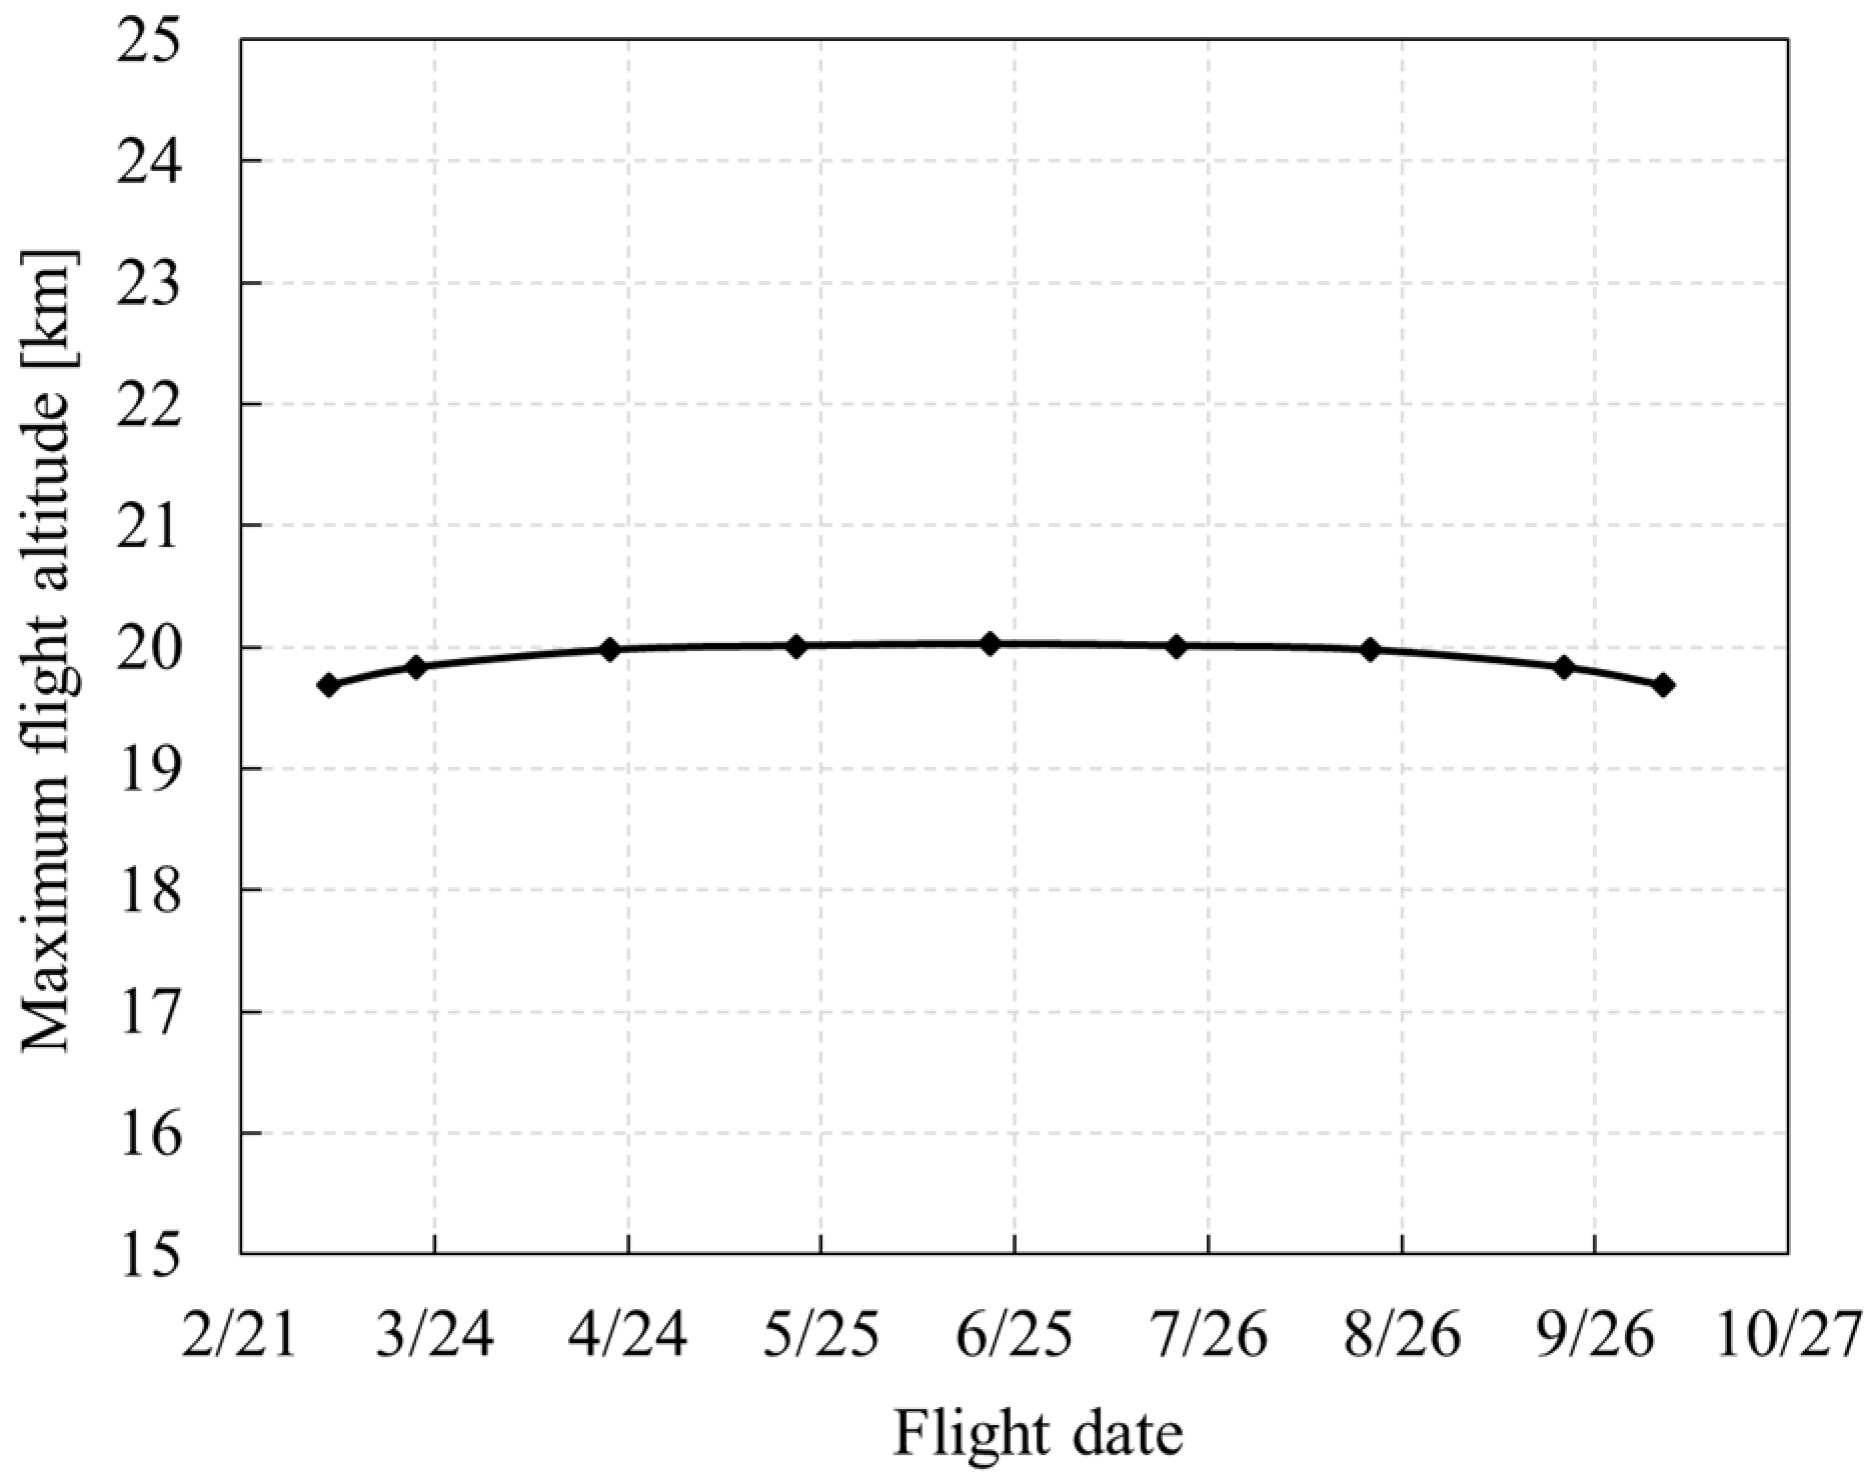
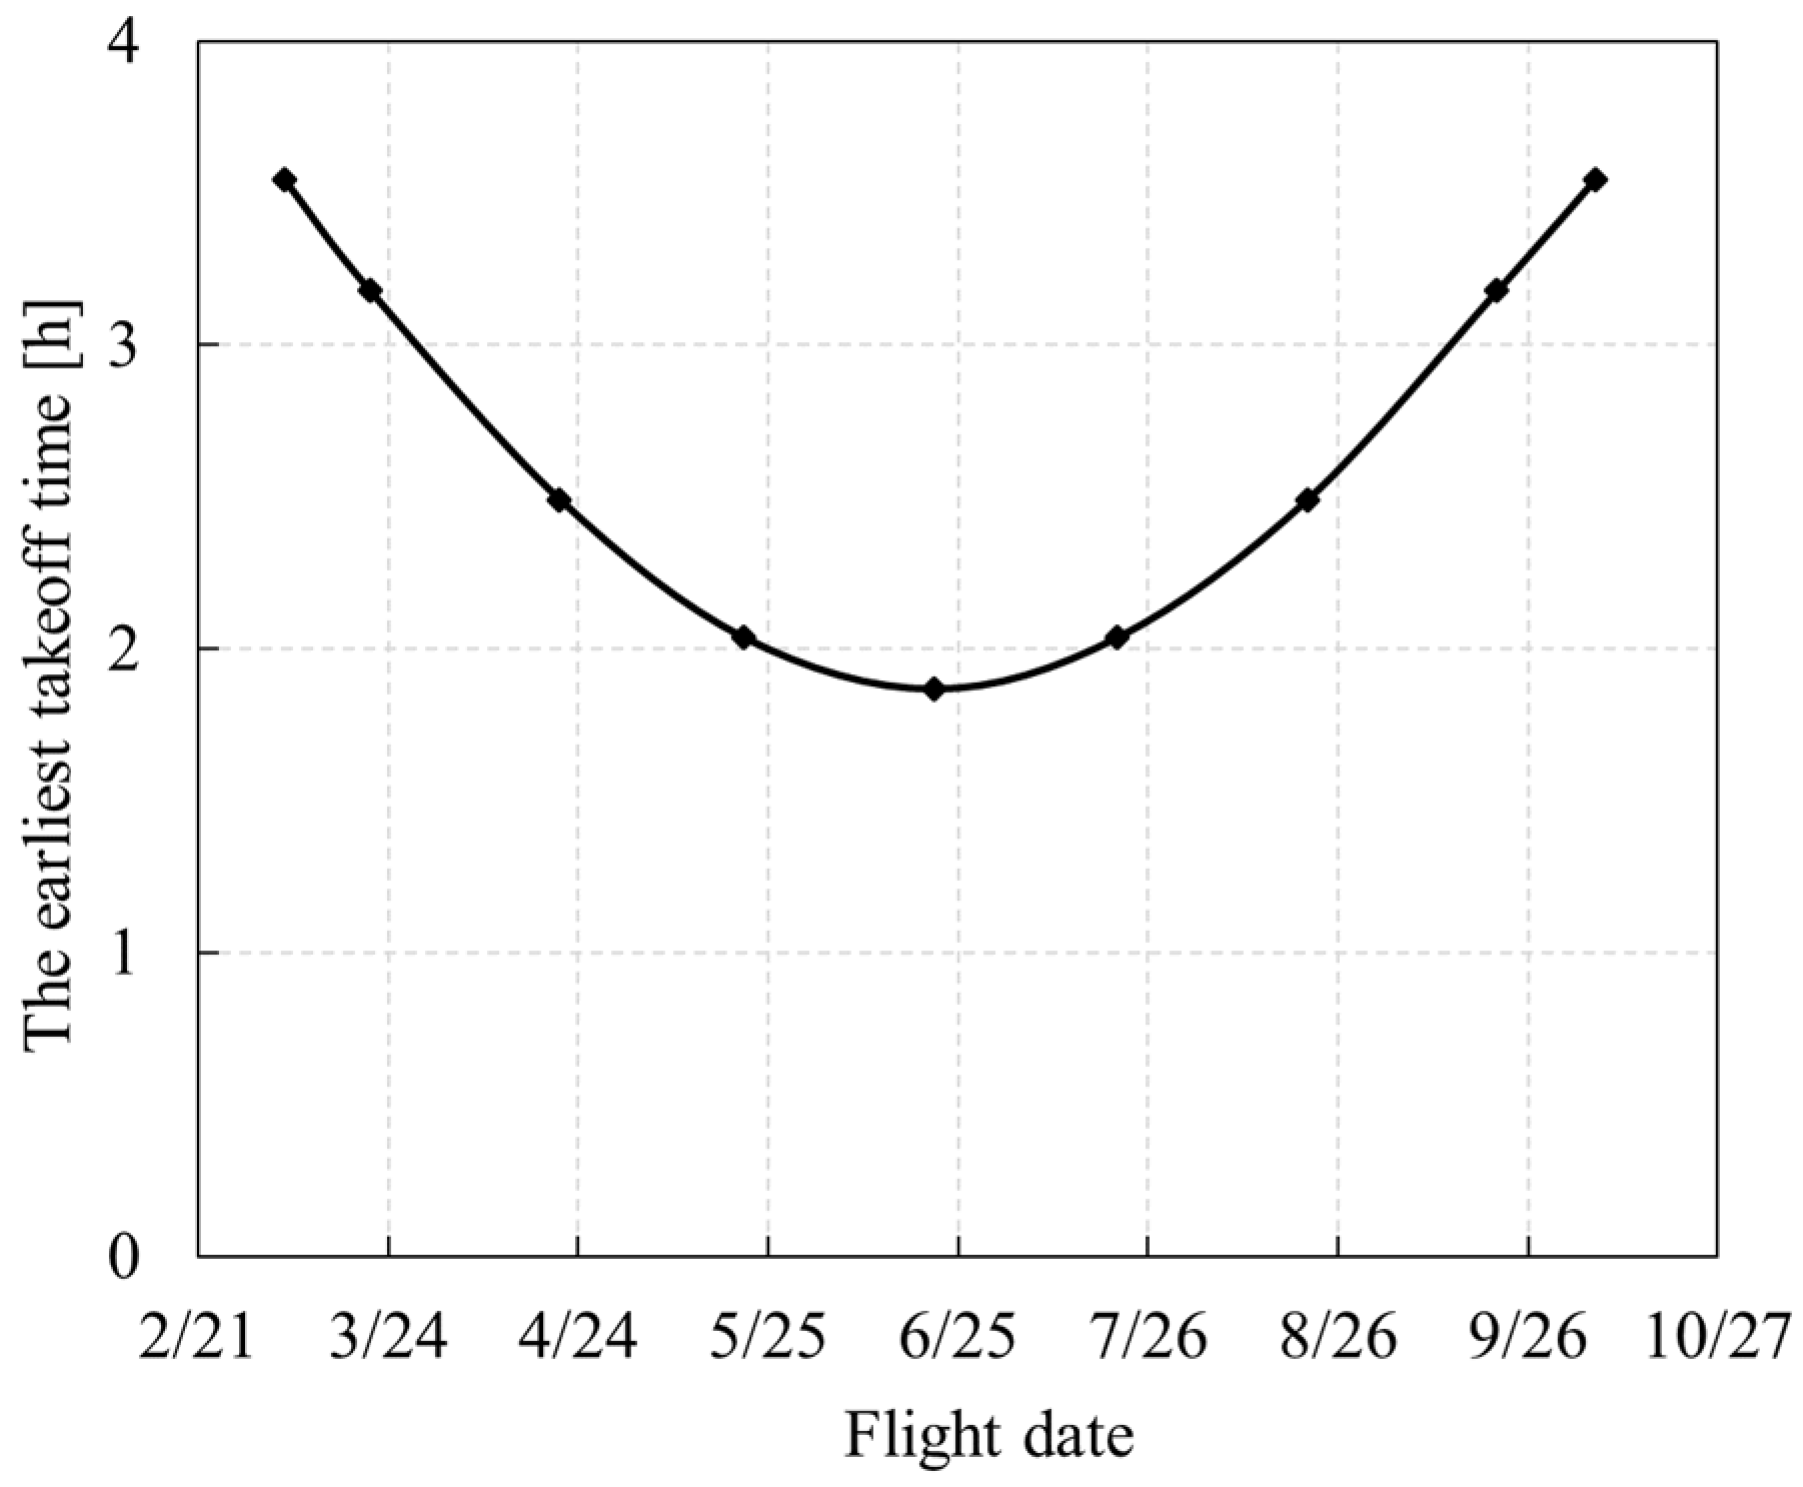
5.1.2. Flying Season

At present, due to the limit of solar radiation intensity, most solar-powered UAVs’ flight time is concentrated in the half year between the spring equinox and the autumn equinox. With the improvement of the performance of subsystems, the realization of uninterrupted flight in the whole season span will become the final goal of solar-powered UAVs. Therefore, it is necessary to study the influence of flight season on flight profile. In this study, the flight latitude is fixed as 41° N.
As shown in Figure 25 and Figure 26, the flight season has a significant effect on the maximum overnight altitude. Near the summer solstice, the duration of daylight increases while the duration of the night shortens, and the maximum overnight altitude increases, which reaches 10 km at the summer solstice. Away from the summer solstice, the duration of daylight shortens while the duration of night increases, and the maximum overnight altitude reduces, which is only 6.4 km in the vernal or autumnal equinox. The maximum overnight altitude decreases sharply before and after the spring and autumn equinoxes. In autumn and winter between October 15 and February 28, it is not even possible to fly day and night in a closed loop. For the solar-powered UAV studied in this paper, the energy conversion efficiency of PV cells is high, and the output power is relatively surplus. The maximum flight altitude is mainly restricted by the maximum continuous power of the motor, which varies little with the flight season and is around 20 km.
When the flight date is closer to the summer solstice, sunrise is earlier, which allows the UAV to take off at an earlier time. The earliest takeoff time varies with the flight season, as shown in Figure 27. When the flight date is closer to the summer solstice, the drone can take off at a later time with the same overnight altitude. The influence of flight season on the takeoff time window at different altitudes is shown in Figure 28.

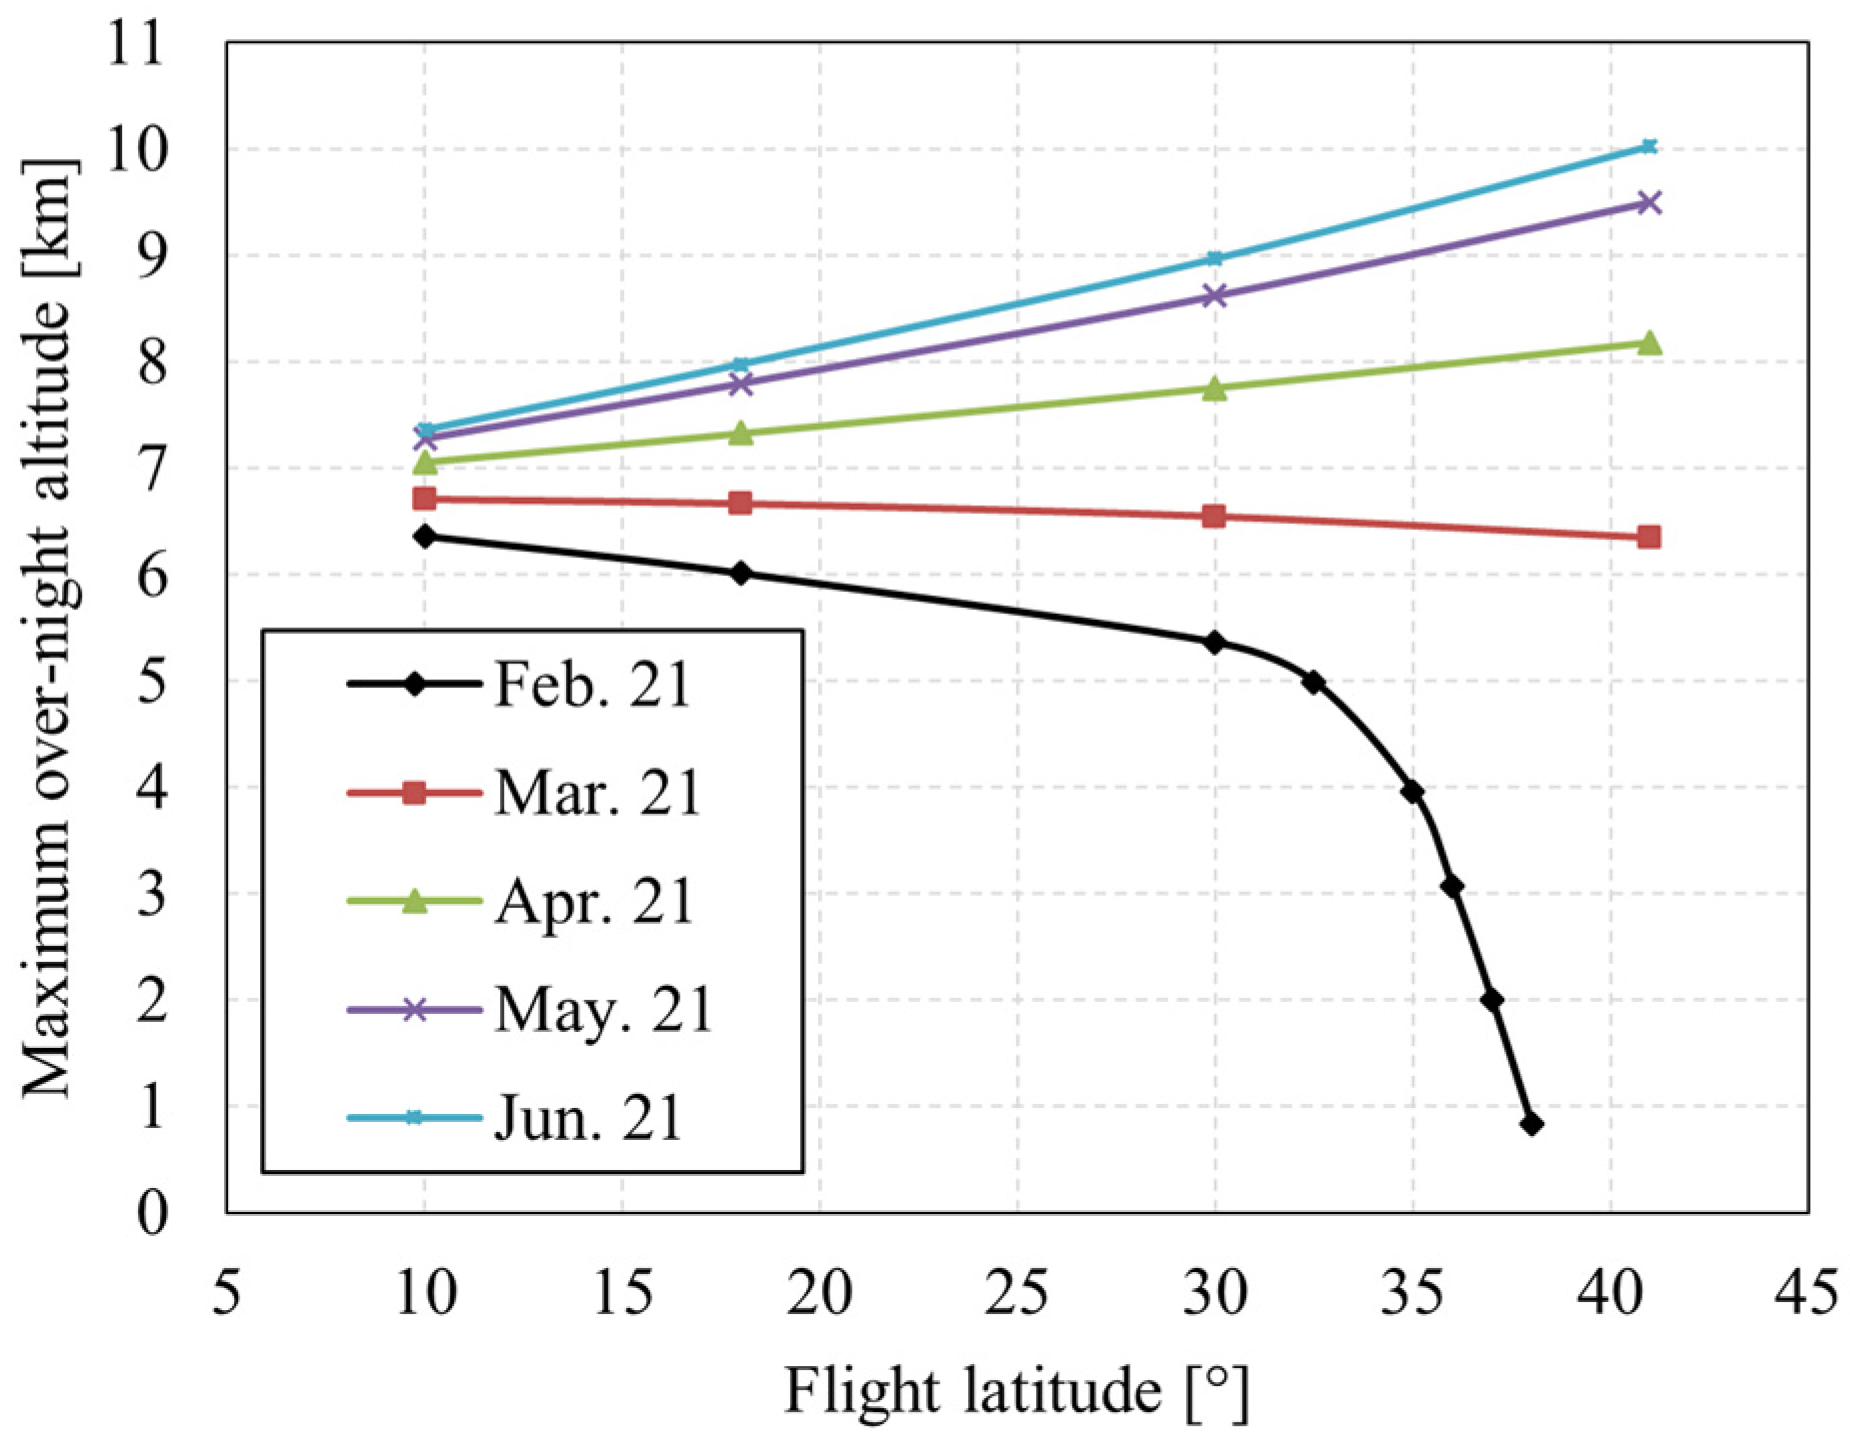
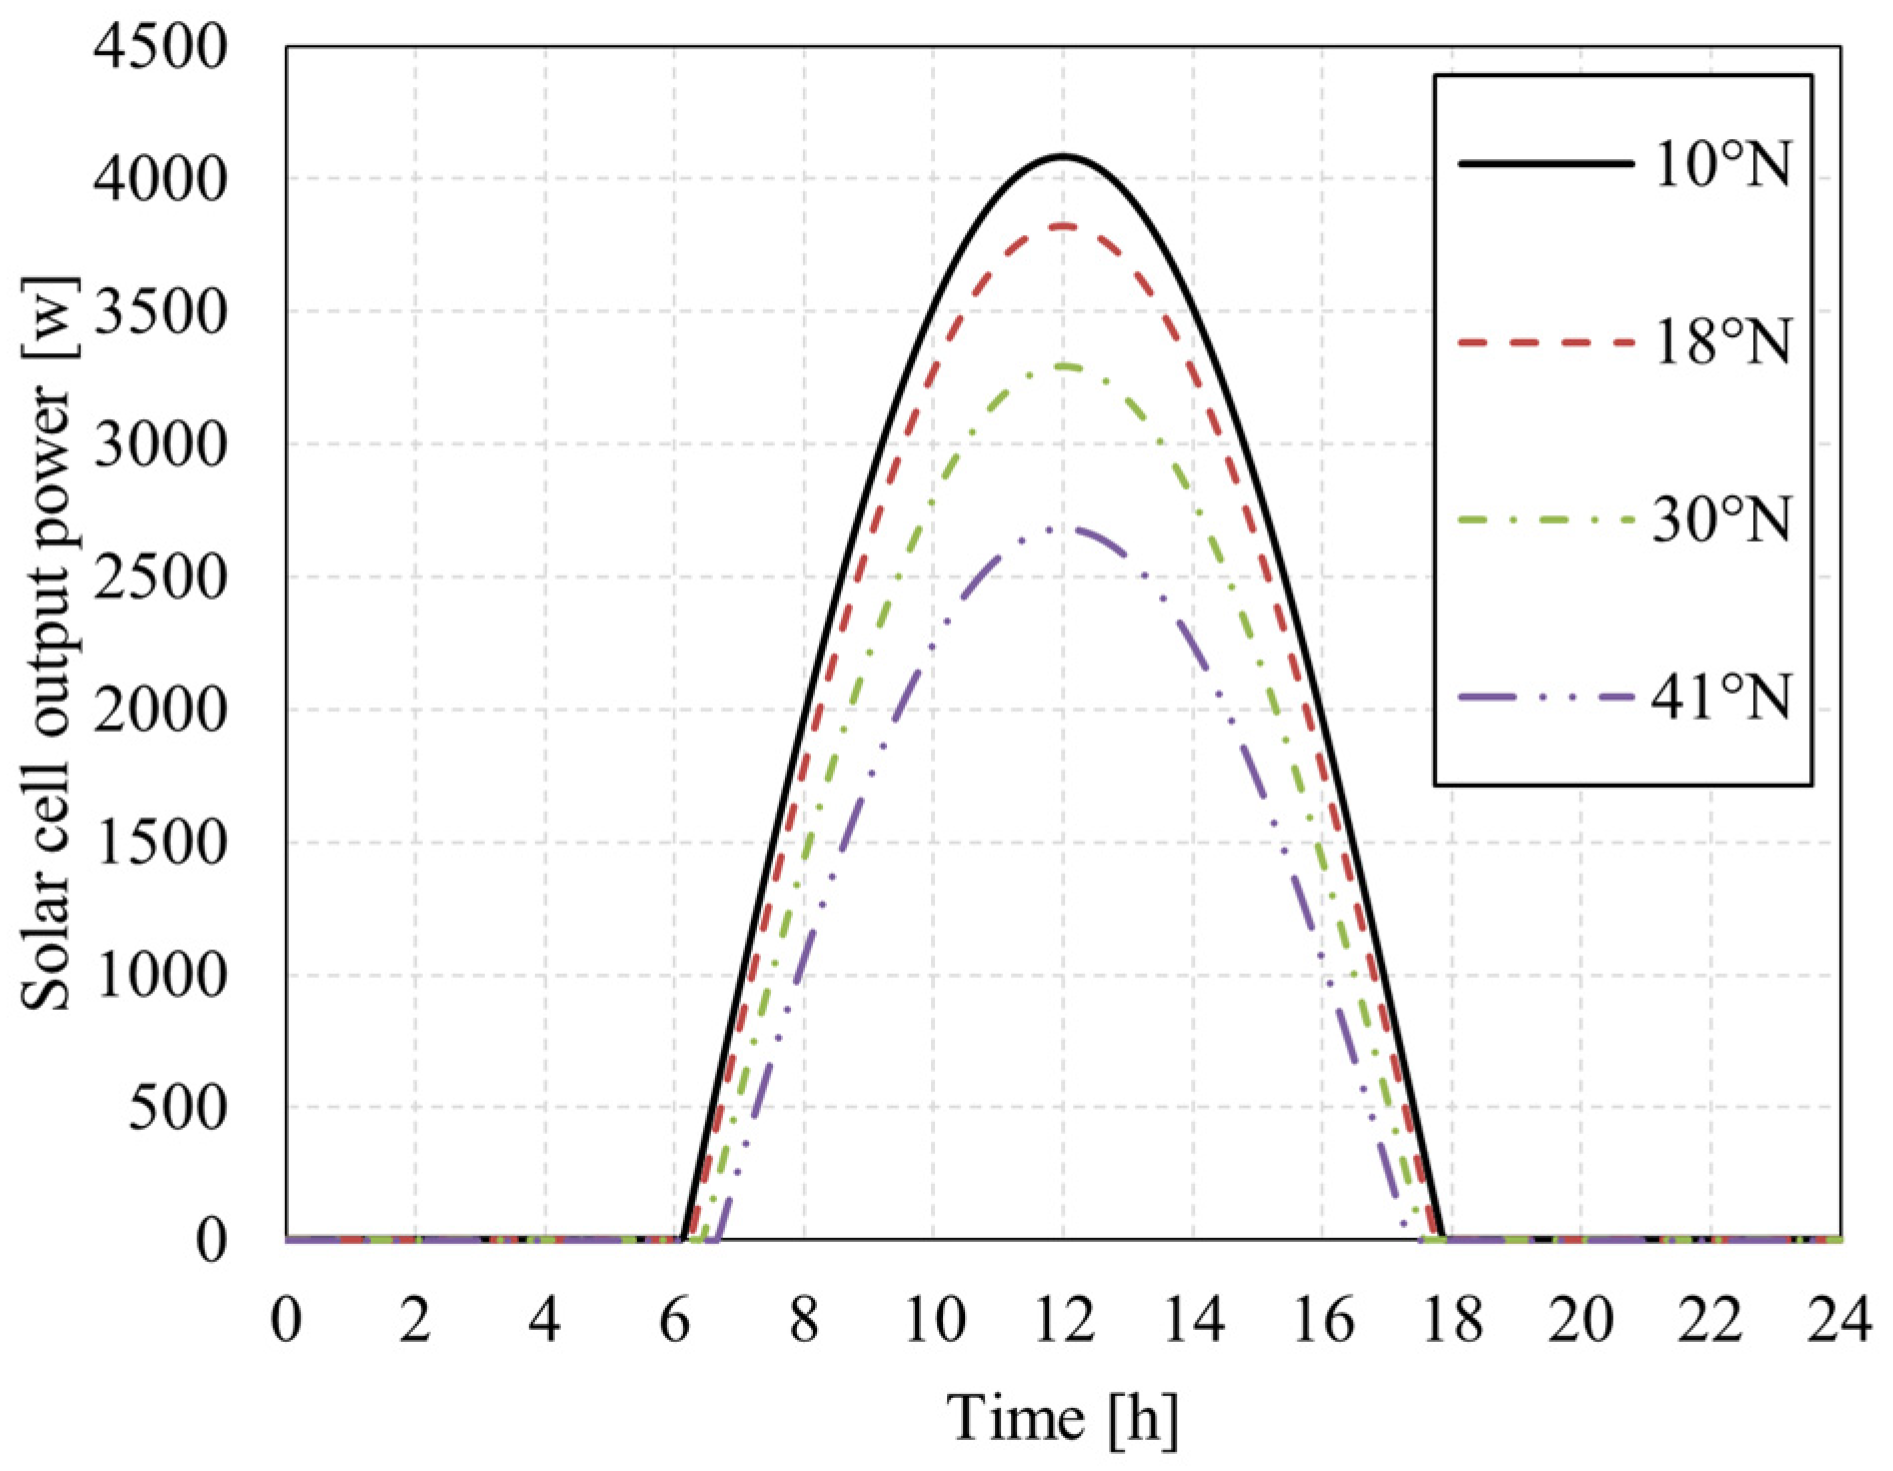
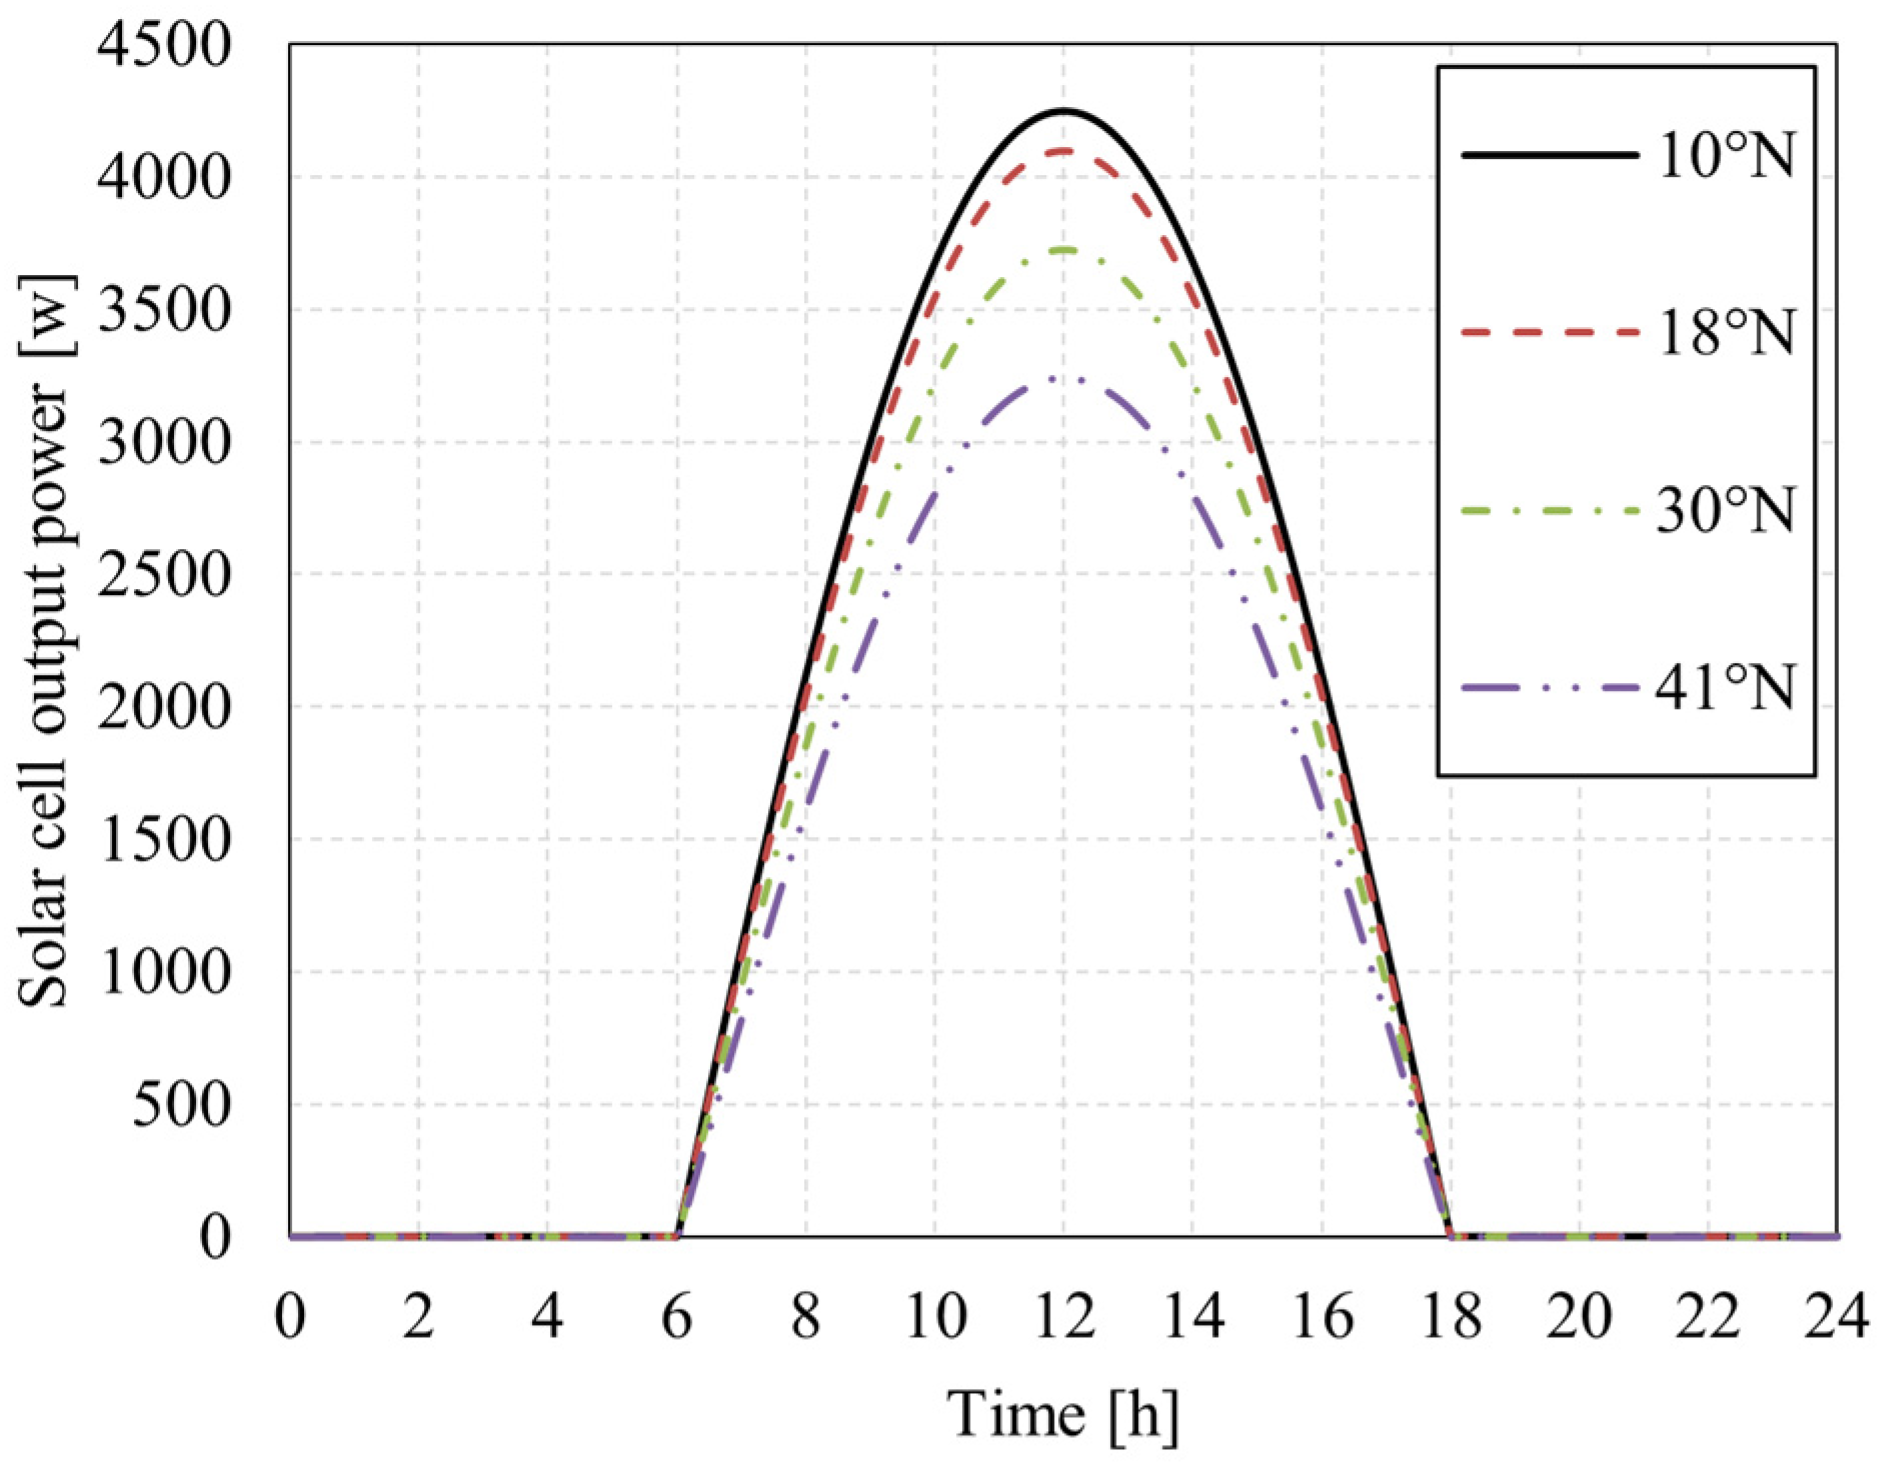
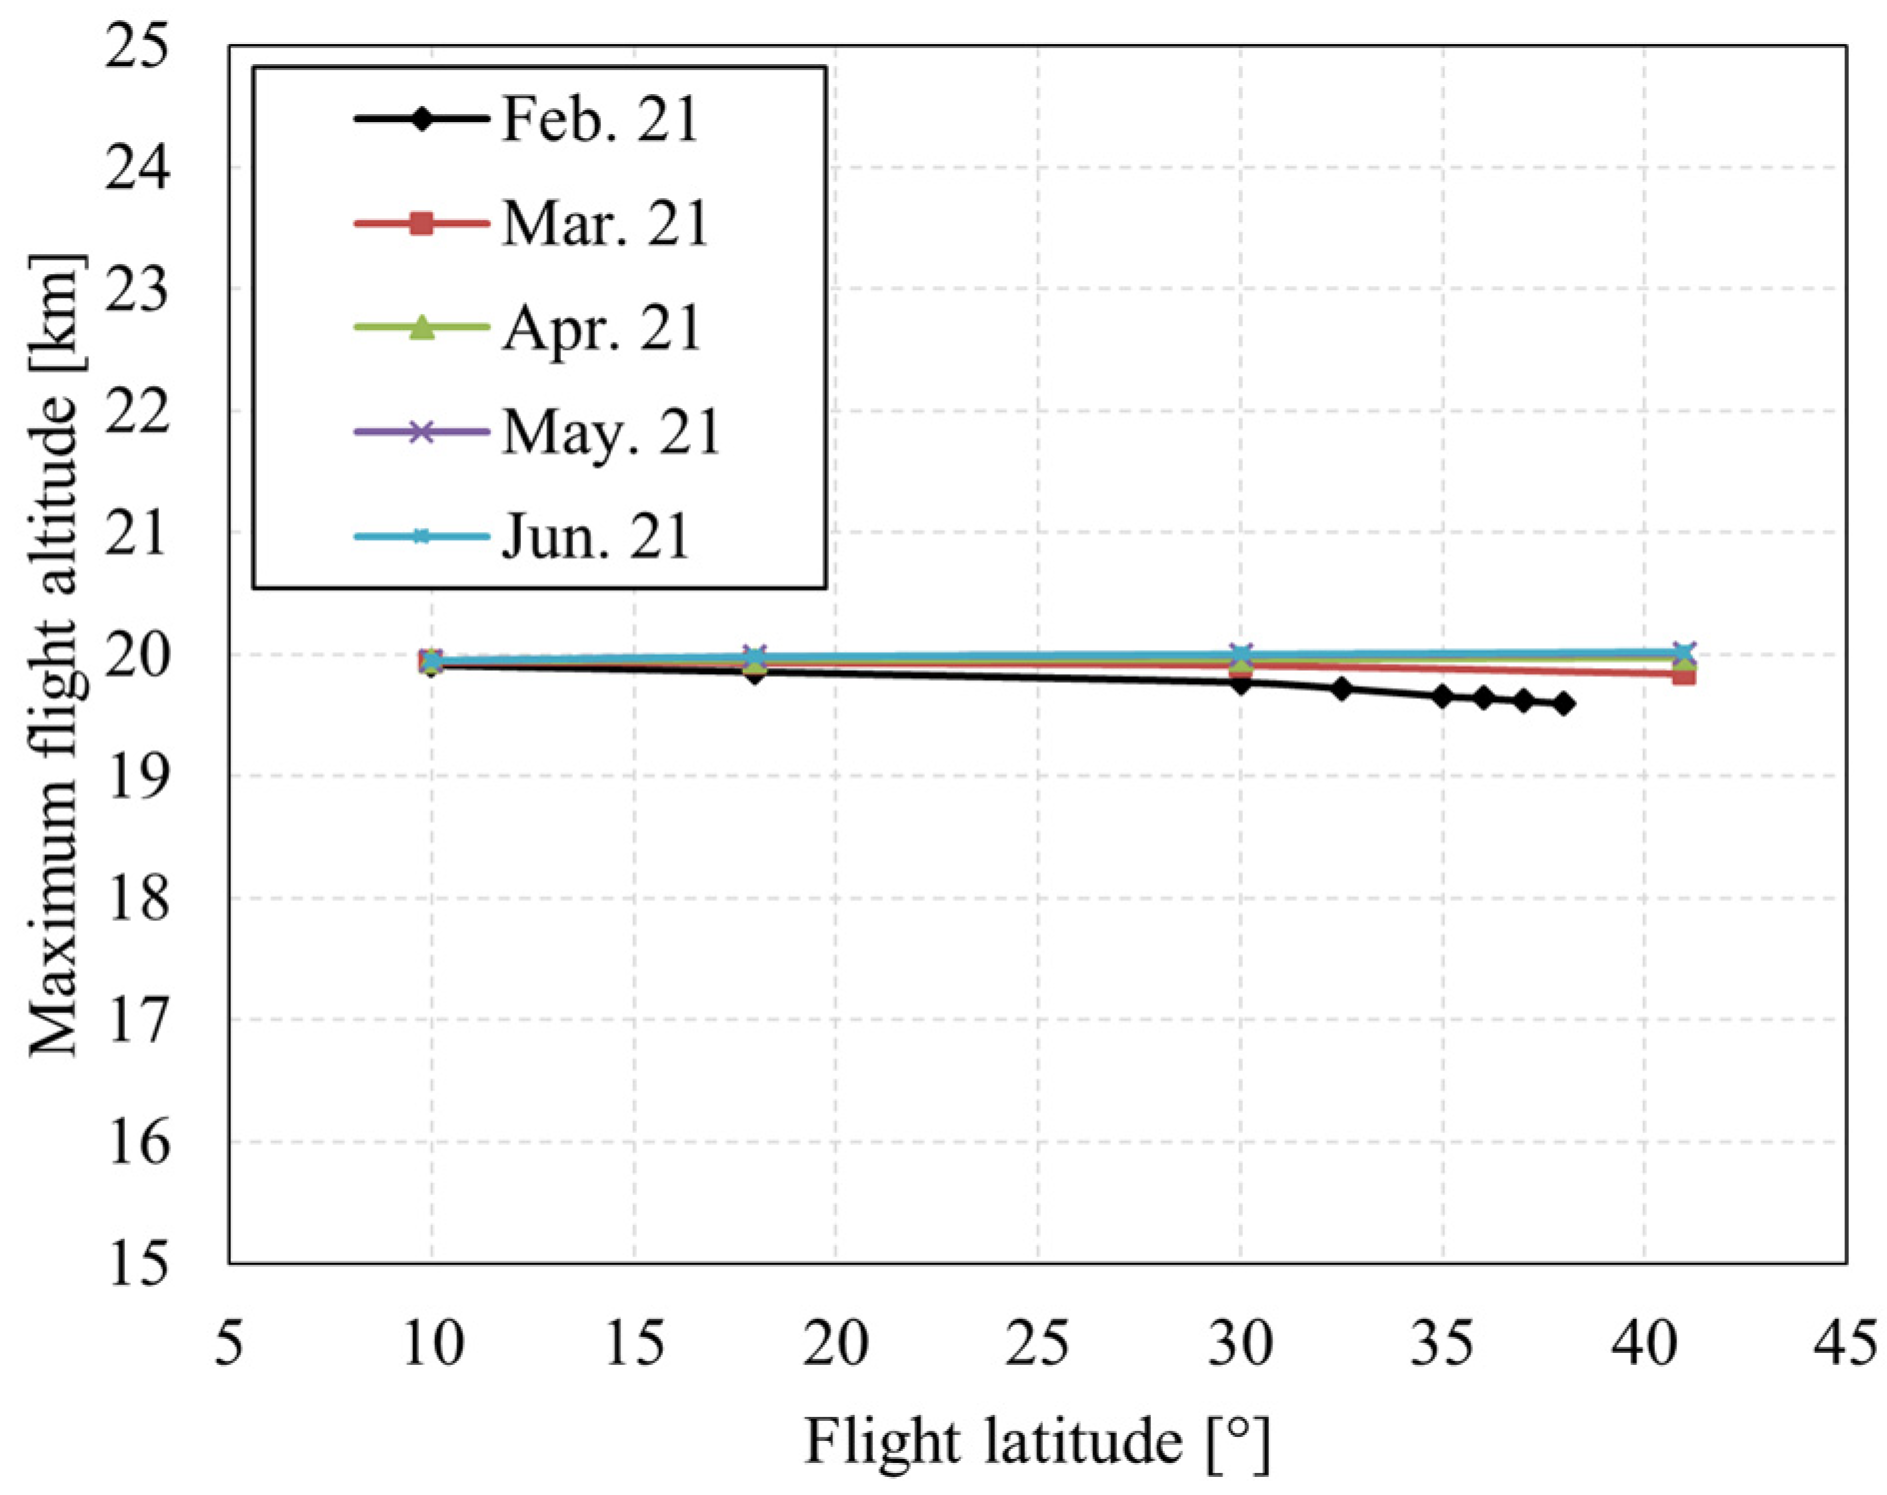
5.1.3. Flight Latitude

As shown in Figure 29, the flight latitude has a significant effect on the overnight altitude, and the effect varies in different seasons.
As shown in Figure 30 and Figure 31, in the Northern Hemisphere, flying at low latitudes in winter can achieve higher overnight altitudes, because there is not only high radiation intensity but also long sunshine duration in low latitudes. In summer, choosing the appropriate high latitude (such as 30° N–40° N) to fly is conducive to the increase in the overnight altitude. Because there are longer hours of sunshine and shorter nights at higher latitudes, there is less time to rely on energy storage batteries for power. Of course, that is only true if PV cells have enough power to spare. The PV cells laid by the UAV studied in this paper have high energy conversion efficiency, which conforms to that premise.
As shown in Figure 32, for the solar-powered UAV studied in this paper, during the vernal equinox and autumnal equinox, the maximum flight altitude is mainly restricted by the maximum continuous power of the motor and varies little with the flight latitude, which is about 20 km.

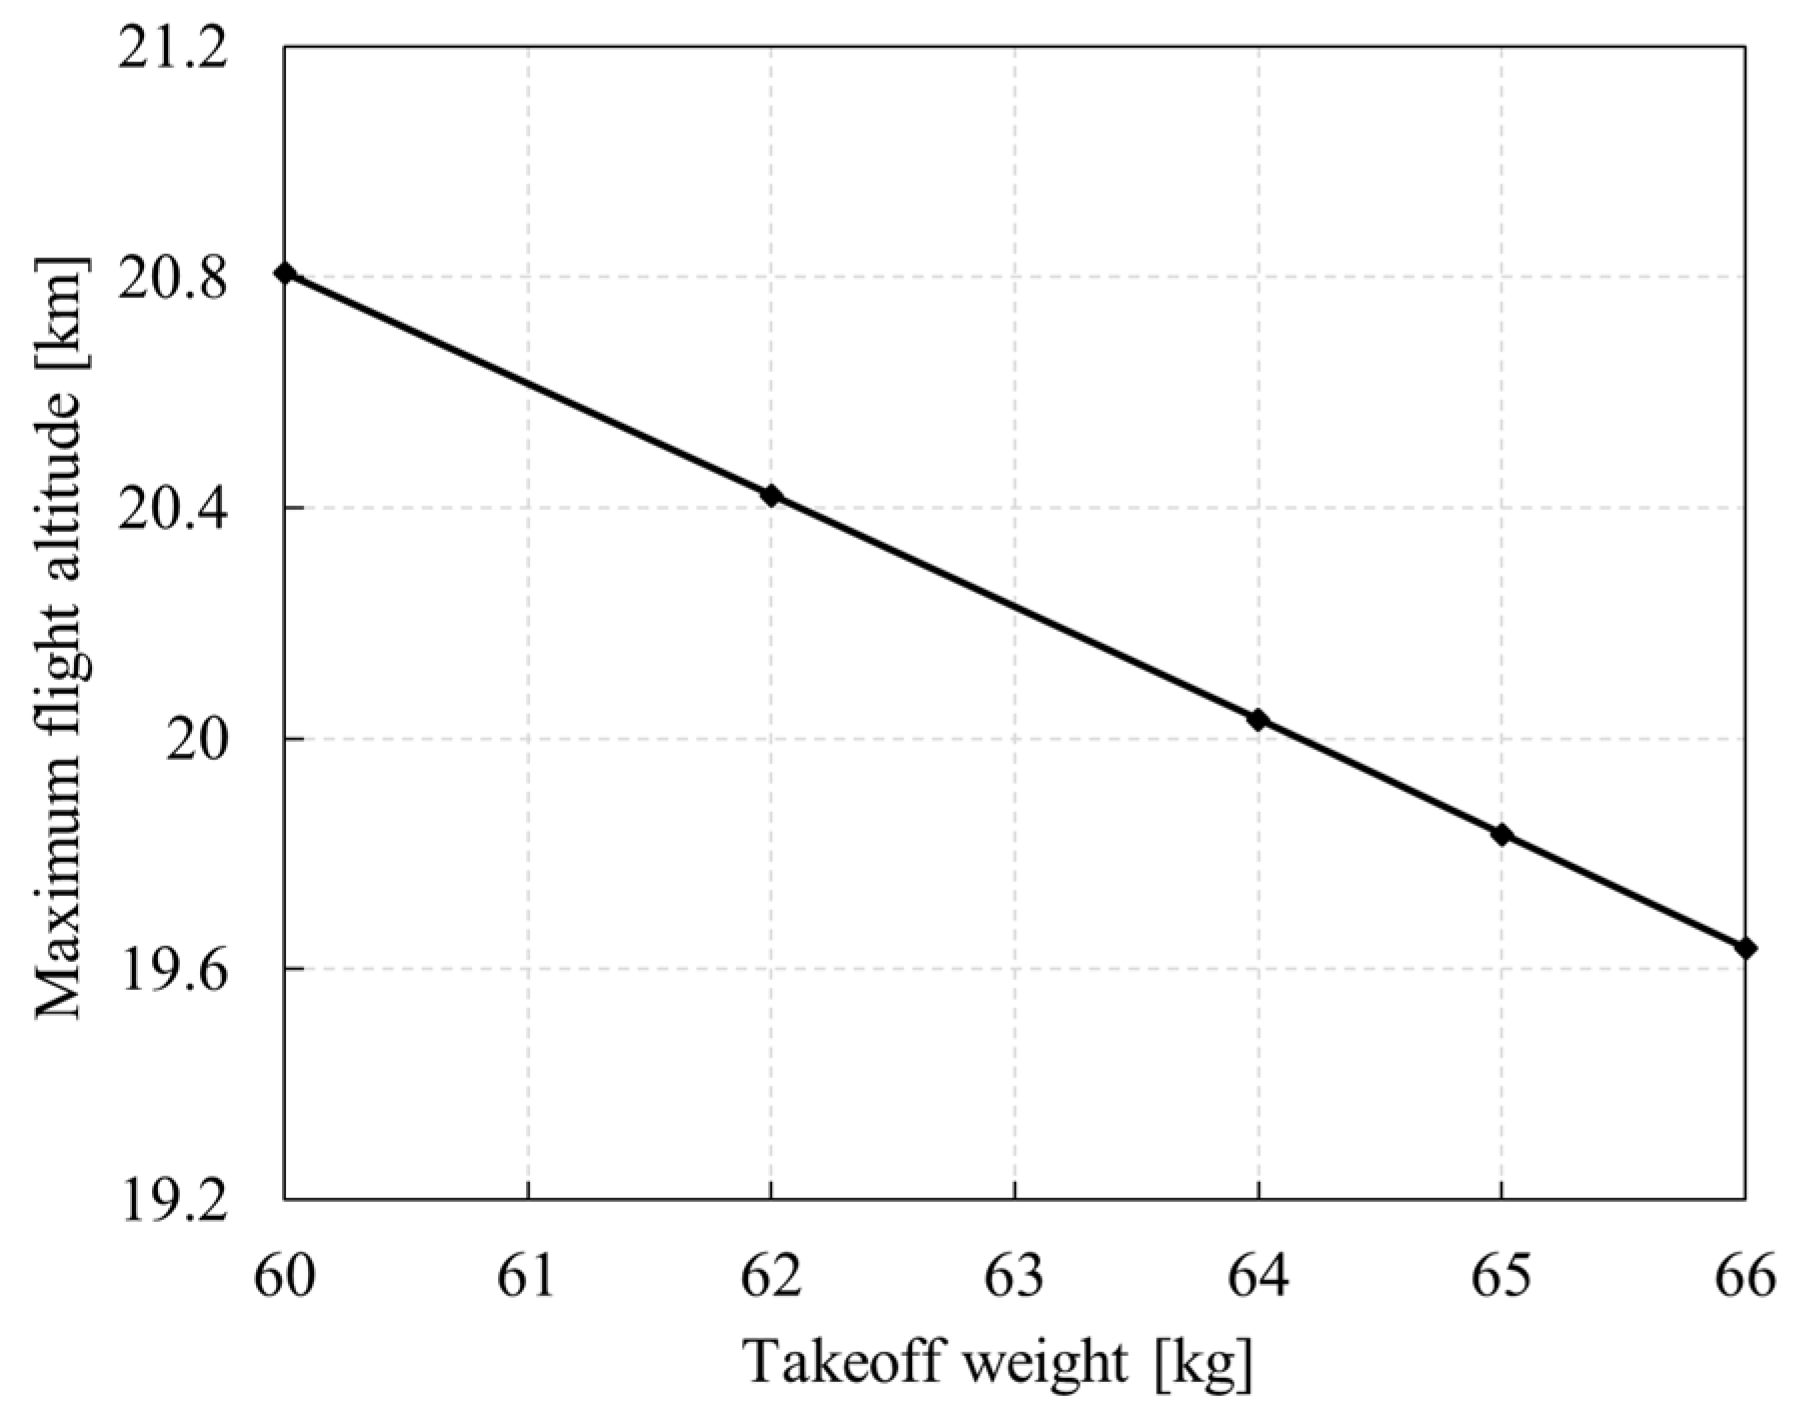
5.1.4. Takeoff Weight

In this subsection, the flight latitude is fixed as 41° N, and the takeoff date is 21 March.
As shown in Figure 33, the greater the takeoff weight, the greater the power required for flight, the greater the discharge power of the secondary battery at night, and the lower the allowable overnight altitude. When the takeoff weight is 60 kg, the maximum overnight altitude is 7.3 km. For every 1 kg increase in the takeoff weight, the overnight altitude decreases by 0.2 km. When the takeoff weight is more than 10% higher than the design value, the whole aircraft deviates from the design point, the power system efficiency decreases, and structure safety challenges are faced. The ability to fly under such conditions needs to be further demonstrated.
As shown in Figure 34, the greater the takeoff weight, the greater the power required for flight, and the smaller the climb rate under the condition of limited motor power, the smaller the maximum altitude that the UAV can reach. For every 1 kg increase in takeoff weight, the maximum flight altitude will decrease by 0.2 km.

5.2. Performance Indicators

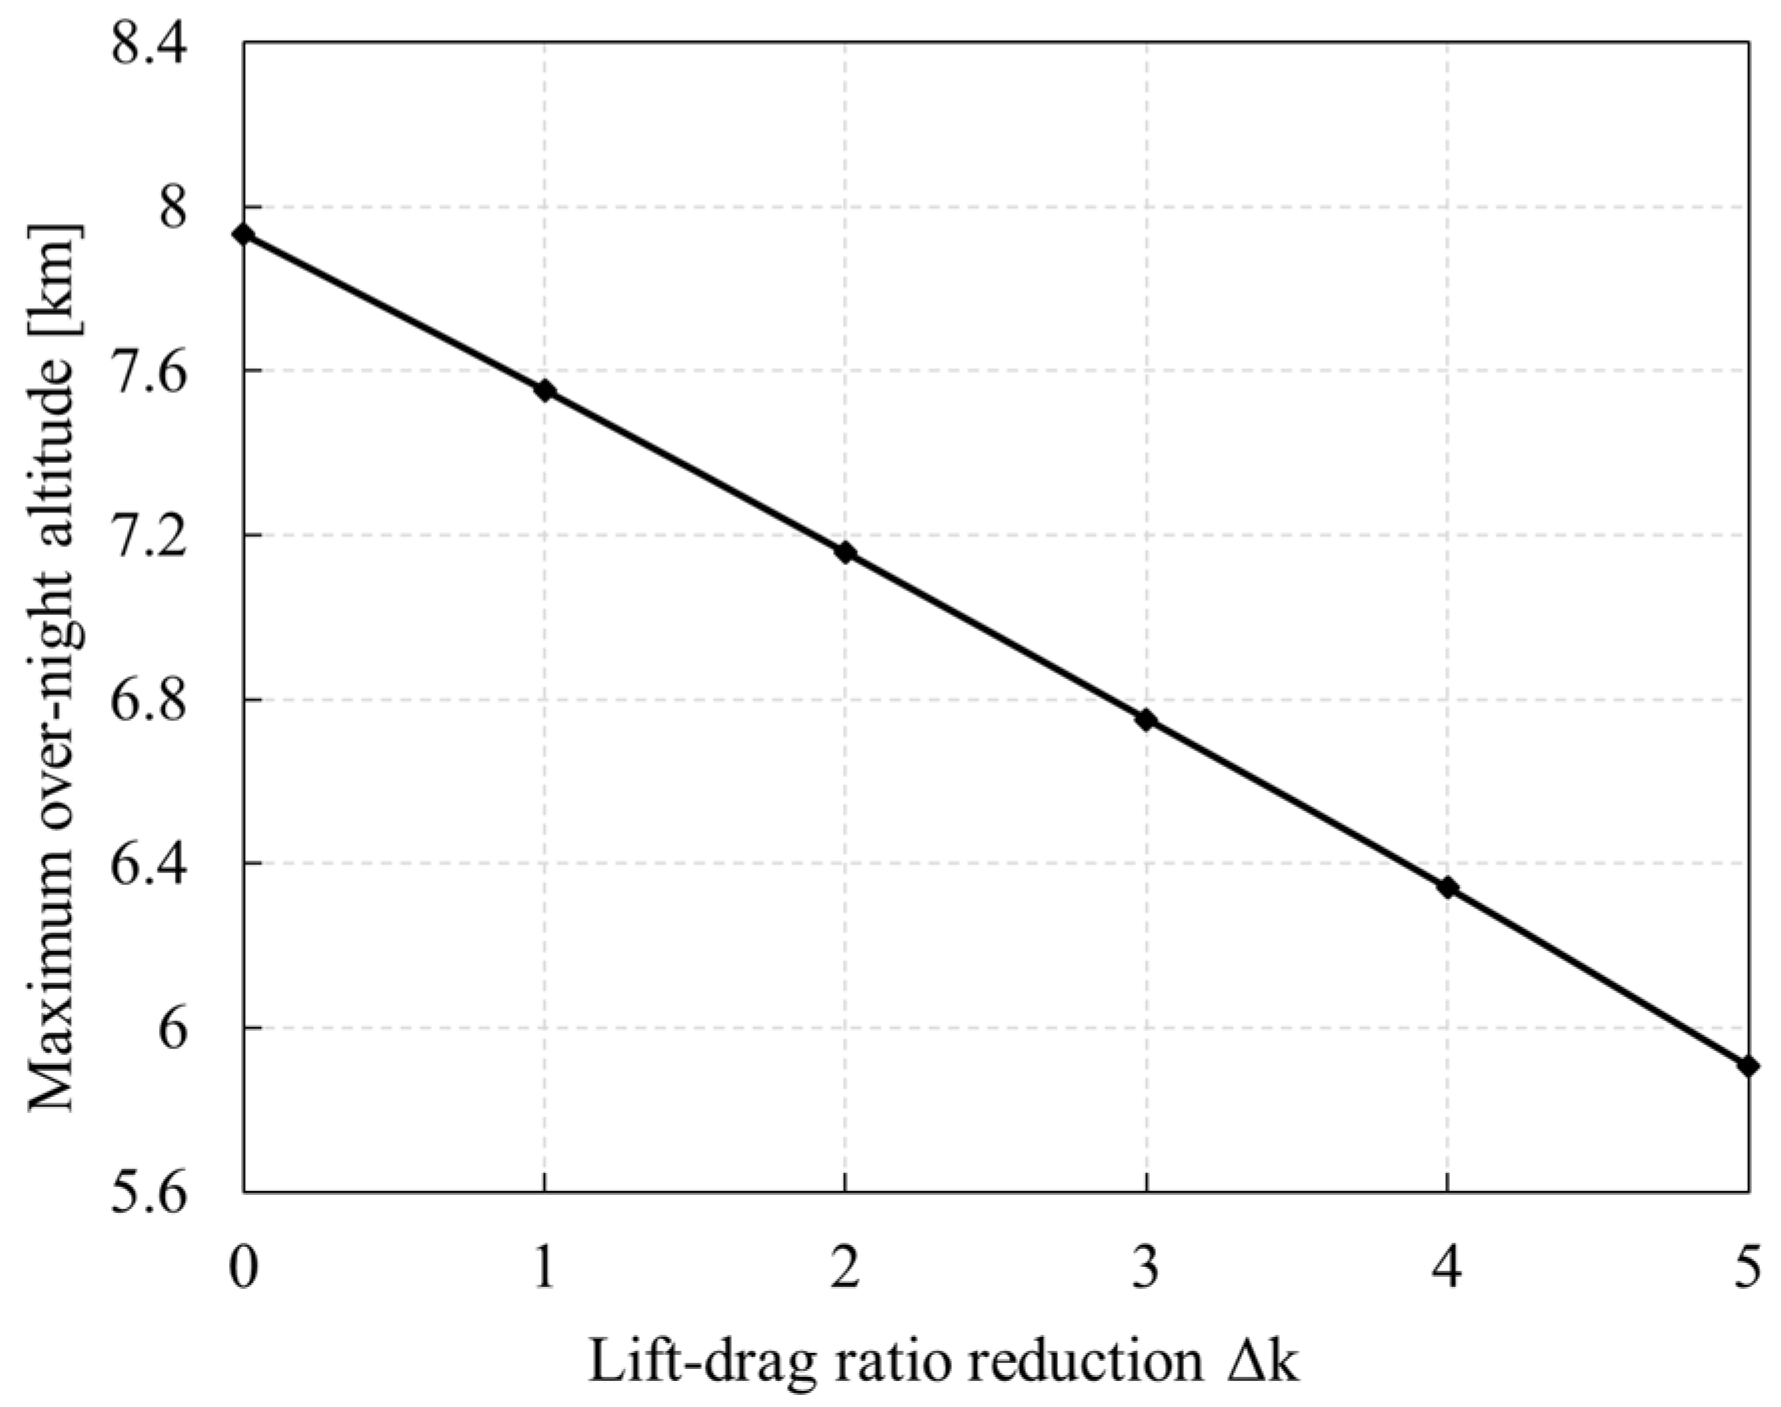
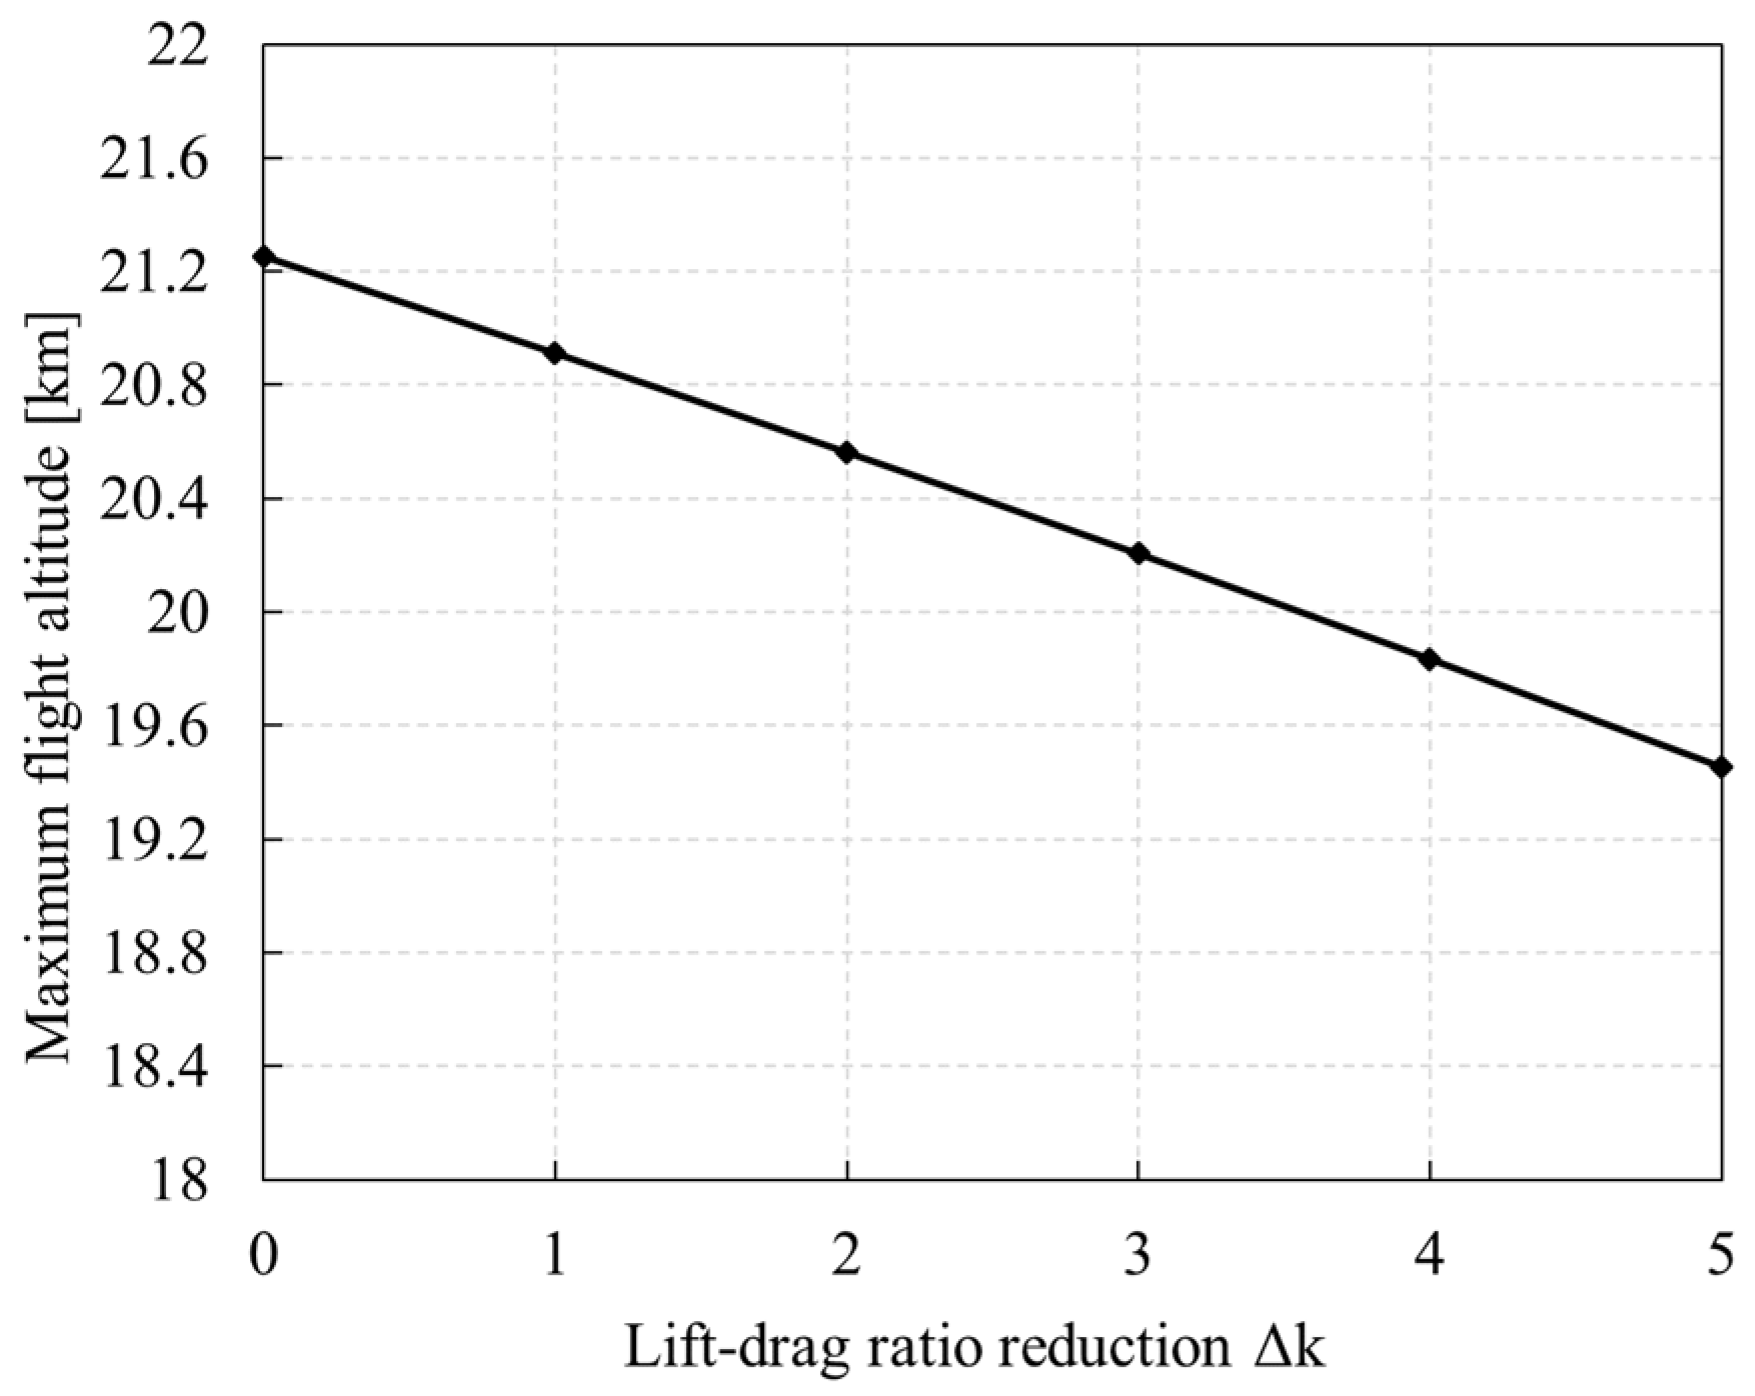
5.2.1. Lift–Drag Ratio

As shown in Figure 35, the higher the lift–drag ratio, the lower the power required for flight, the lower the discharge power of the secondary battery at night, and the higher the allowable overnight altitude. The lift–drag ratio reduction refers to the difference between the actual lift–drag ratio curve and the calculated lift–drag ratio curve. For each drop in the lift–drag ratio, the overnight altitude decreases by 0.4 km.
As shown in Figure 36, the higher the lift–drag ratio, the lower the power required for flight, and the larger the residual climb rate under the condition of limited motor power, the larger the maximum altitude that the UAV can reach. For each drop in the lift–drag ratio, the maximum flight altitude decreases by 0.4 km.

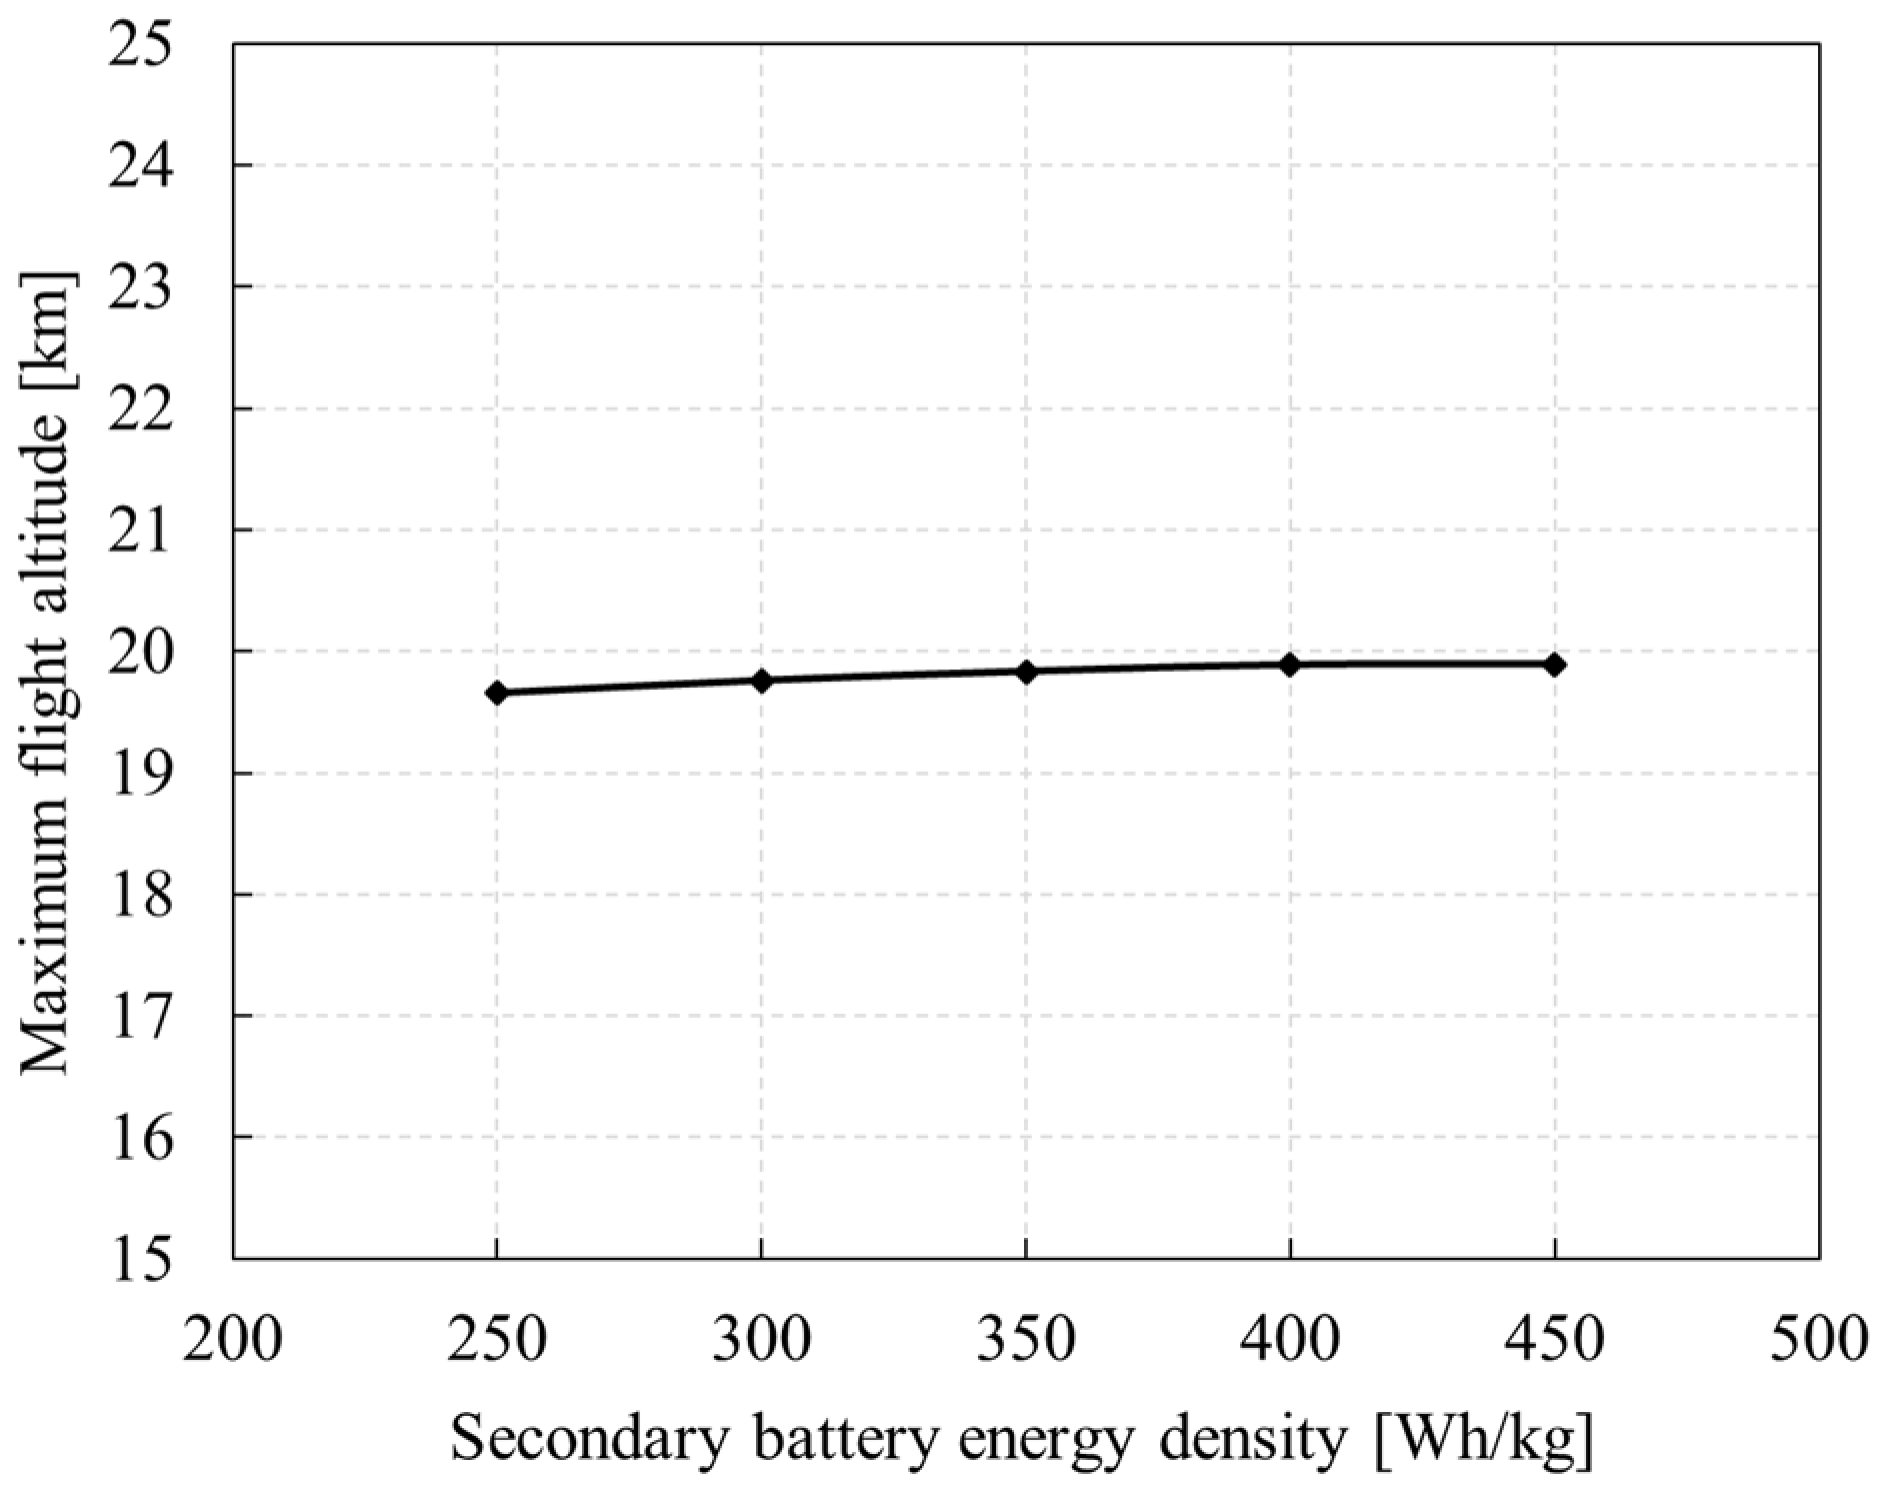
5.2.2. Secondary Battery Energy Density

As shown in Figure 37, the energy density of the secondary battery directly affects the overnight altitude. When the density is 250 Wh/kg, the overnight altitude is only 2.2 km. However, when the density reaches 450 Wh/kg, the overnight altitude can reach 9.4 km. In general, when the density increases by 10 Wh/kg, the overnight altitude increases by 0.33 km.
As shown in Figure 38, at the same discharge rate, the higher the energy density, the higher the discharge power, and the higher the power that the motor can achieve in the climbing stage, and accordingly, the higher the climbing rate. Therefore, the maximum flight altitude is slightly increased with the improvement of secondary battery energy density, but it is mainly limited by the maximum power of the motor, which is around 20 km with little change.

6. Conclusions

1)
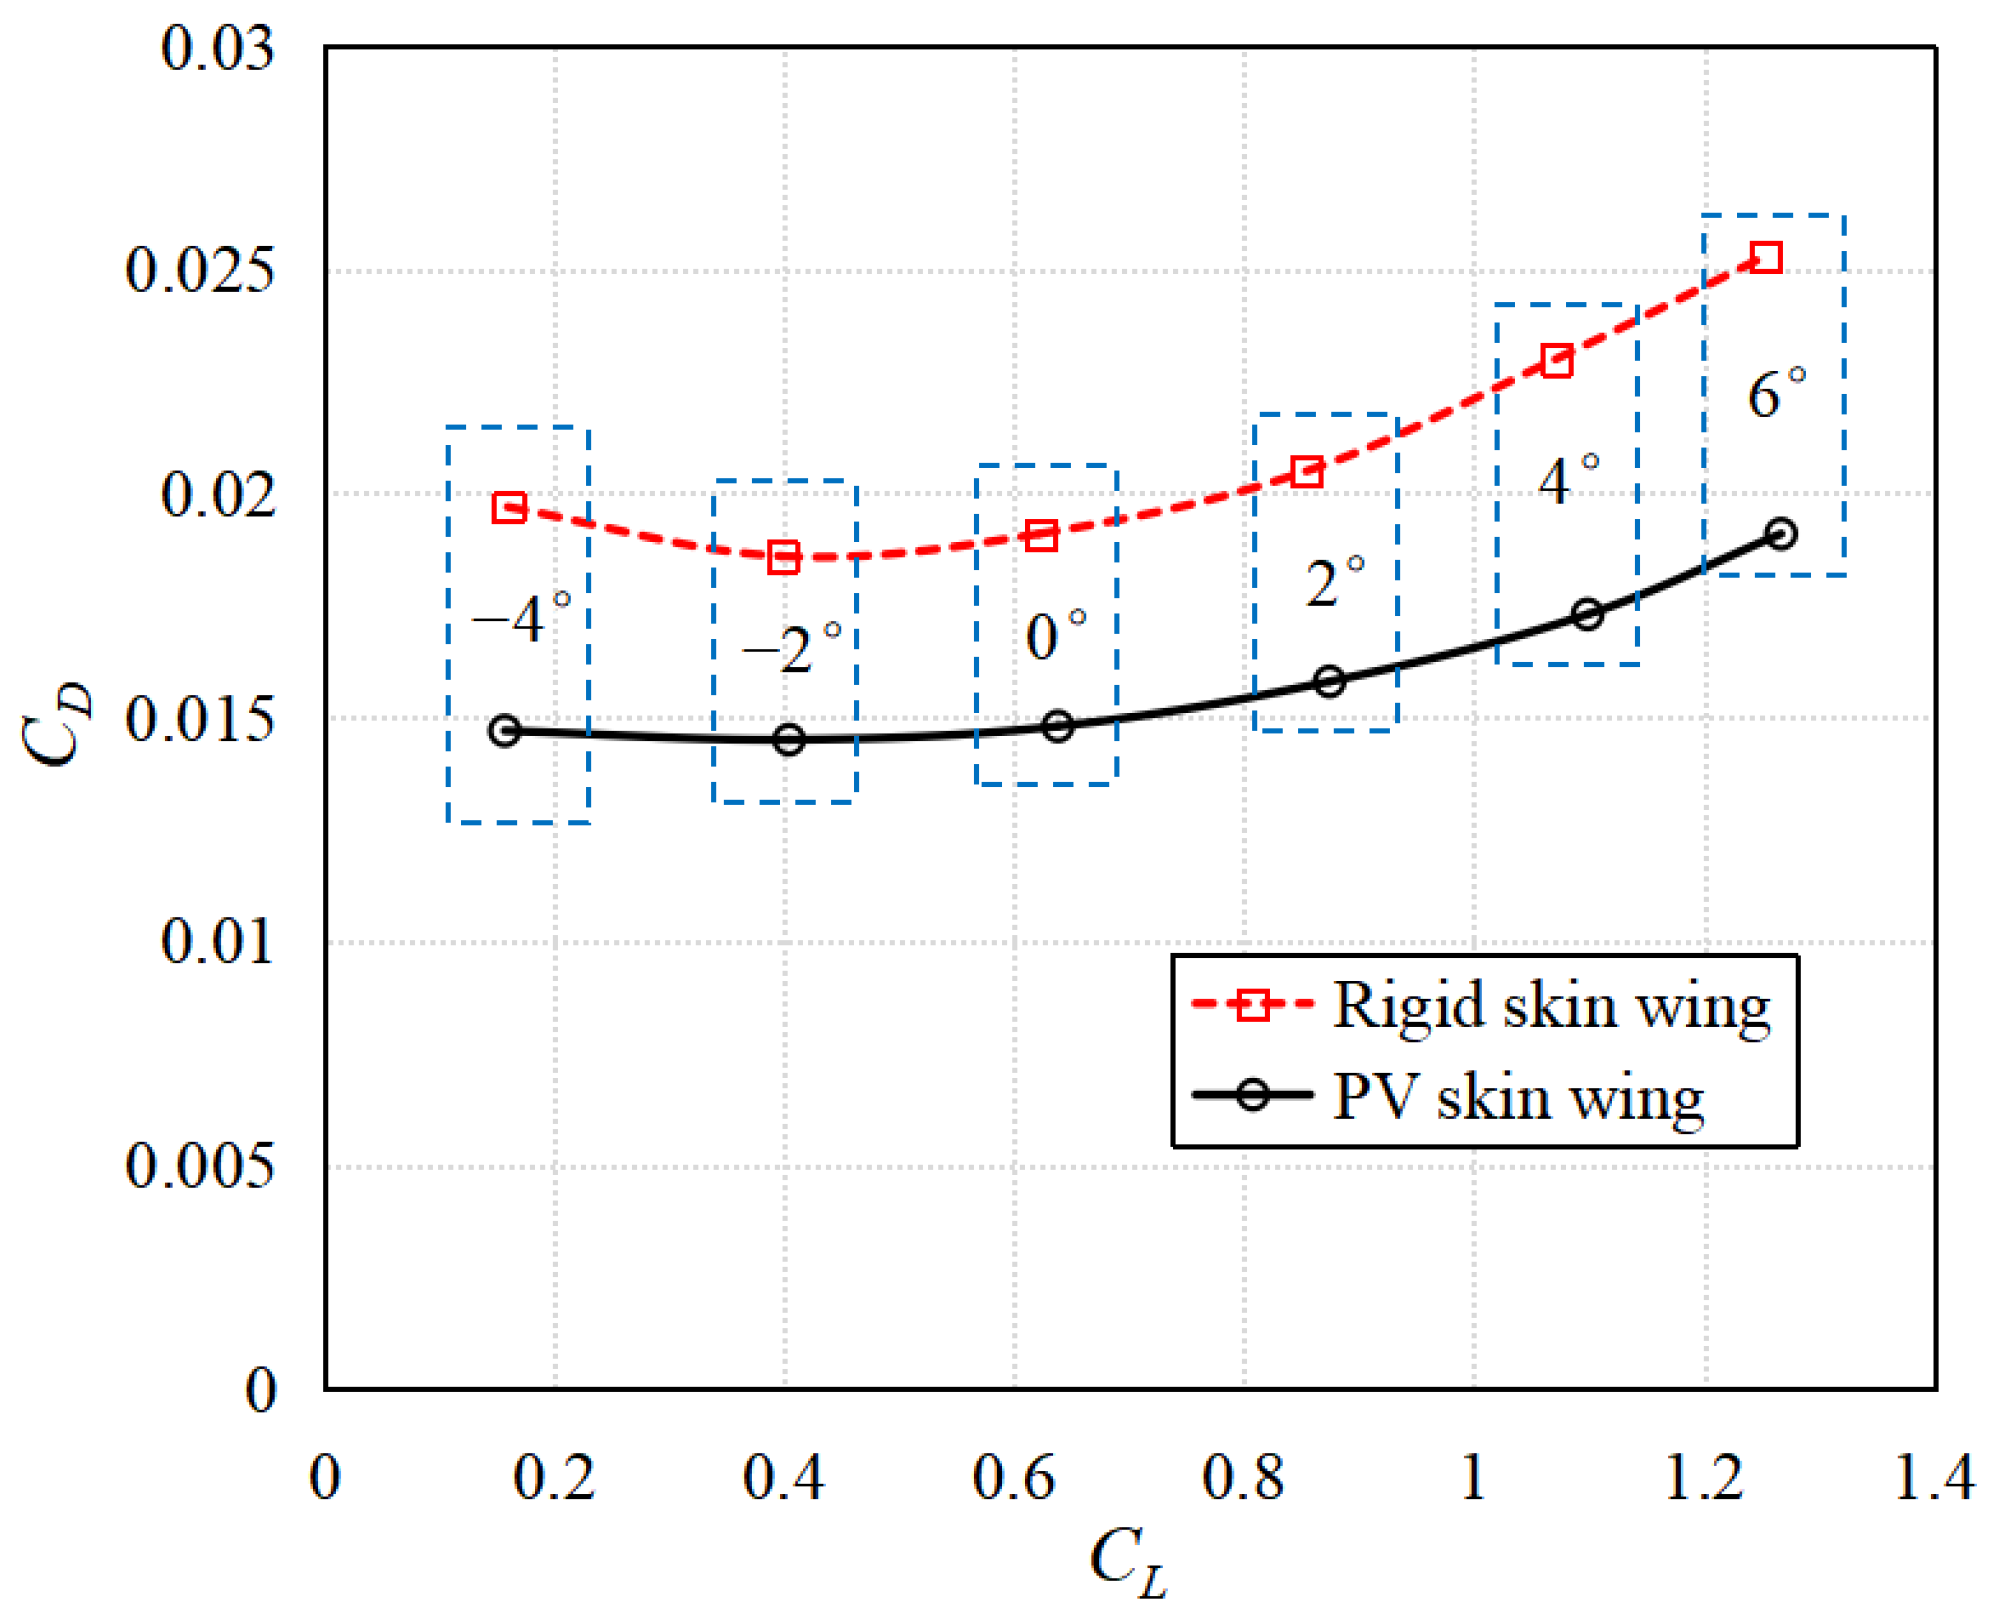
When building the aerodynamic model, the influence of flexible photovoltaic film on the aerodynamic characteristics should be considered. The deformation of the film has little effect on the lift coefficient but will lead to a significant increase in the drag coefficient.
2)
When establishing the flight strategy, the solar-powered UAV shall use light energy to climb to the highest possible height before sunset, and it shall avoid cruising at high altitude at night. These are the core means to maximize light utilization.
3)
Too-early takeoff time will cause the secondary battery to be exhausted before the sun rises. Too-late takeoff time will lead to failure to climb to the specified altitude on the first day, thus affecting the night flight. The closer to the summer solstice, the wider the takeoff window.
4)
In the Northern Hemisphere, in order to achieve a higher altitude, the solar-powered UAV should fly at a low latitude in winter and fly at an appropriate high latitude (30° N–45° N) in summer.
5)
For every 1 kg increase in the total takeoff weight, the night height and the maximum flight height will decrease by about 0.2 km. When the total takeoff weight is more than 10% overweight, the whole aircraft will deviate from the design point more, and the efficiency of the power system will decrease.
6)
Each time the lift-to-drag ratio decreases by 1, the night flight altitude decreases and the maximum flight altitude decreases by about 0.4 km. When the energy density of the secondary battery increases by 10 Wh/kg, the altitude will increase by 0.33 km.

Author Contributions

Conceptualization, L.Z. and M.Y.; Data curation, D.M. and M.Y.; Formal analysis, L.Z. and Y.Y.; Investigation, M.Y. and X.Y.; Methodology, L.Z. and X.Y.; Project administration, D.M. and M.Y.; Resources, L.Z. and X.Y.; Software, X.Y. and Y.Y.; Supervision, M.Y. and Y.Y.; Validation, L.Z. and X.Y.; Visualization, X.Y. and Y.Y.; Writing—original draft, L.Z.; Writing—review and editing, D.M. and M.Y. All authors have read and agreed to the published version of the manuscript.

Funding

This research received no external funding.

Data Availability Statement

Not applicable.

Conflicts of Interest

The authors declare no conflict of interest.

References

  1. Rajendran, P.; Smith, H. Future trend analysis on the design and performance of solar-powered electric unmanned aerial vehicles. Adv. Mater. Res. 2015, 1125, 635–640. [Google Scholar] [CrossRef]
  2. Fazelpour, F.; Vafaeipour, M.; Rahbari, O.; Shirmohammadi, R. Considerable parameters of using PV cells for solar-powered aircrafts. Renew. Sustain. Energy Rev. 2013, 22, 81–91. [Google Scholar] [CrossRef]
  3. Cestino, E. Design of solar high altitude long endurance aircraft for multi payload & operations. Aerosp. Sci. Technol. 2006, 10, 541–550. [Google Scholar]
  4. Cocconi, A. AC Propulsion SoLong UAV Flies for 48 Hours on Sunlight Two Nights Aloft Opens New Era of Sustainable Flight; AC Propulsion: San Dimas, CA, USA, 2005. [Google Scholar]
  5. QinetiQ. Solar aircraft achieves longest unmanned flight. Reinf. Plast. 2010, 54, 9. [Google Scholar] [CrossRef]
  6. Oettershagen, P.; Melzer, A.; Mantel, T.; Rudin, K.; Stastny, T.; Wawrzacz, B.; Hinzmann, T.; Leutenegger, S.; Alexis, K.; Siegwart, R. Design of small hand-launched solar-powered UAVs: From concept study to a multi-day world endurance record flight. J. Field Robot. 2017, 34, 1337–1352. [Google Scholar] [CrossRef] [Green Version]
  7. Global UAV: Russia pre Equipped Solar UAV to Replace Low Earth Orbit Satellite. 2017. Available online: https://baijiahao.baidu.com/s?id=1563977586208199&wfr=spider&for=pc (accessed on 7 April 2017).
  8. Catherine Buchaniec: Airbus’ Zephyr Drone Test Unexpectedly Halted after Two Months Aloft. 2022. Available online: https://www.c4isrnet.com/newsletters/2022/08/23/airbus-zephyr-drone-test-unexpectedly-halted-after-two-months-aloft/ (accessed on 24 August 2022).
  9. Zhang, L. Research on Overall Design of Ultra-Long Endurance Solar Unmanned Aerial Vehicle. Ph.D. Thesis, Beihang University, Beijing, China, 2021. [Google Scholar]
  10. Noth, A. Design of Solar Powered Airplanes for Continuous Flight. Ph.D. Thesis, ETH Zurich, Zurich, Switzerland, 2008. [Google Scholar]
  11. Colas, D.; Roberts, N.H.; Suryakumar, V.S. HALE Multidisciplinary Design Optimization Part I: Solar-Powered Single and Multiple-Boom Aircraft. In Proceedings of the 2018 Aviation Technology, Integration, and Operations Conference, Atlanta, GE, USA, 25–29 June 2018; p. 3028. [Google Scholar]
  12. Colas, D.; Roberts, N.H.; Suryakumar, V.S. HALE Multidisciplinary Design Optimization Part II: Solar-Powered Flying-Wing Aircraft. In Proceedings of the 2018 Aviation Technology, Integration, and Operations Conference, Atlanta, GE, USA, 25–29 June 2018; p. 3029. [Google Scholar]
  13. Wang, X.; Yang, Y.; Wang, D.; Zhang, Z. Mission-oriented cooperative 3D path planning for modular solar-powered aircraft with energy optimization. Chin. J. Aeronaut 2021, 35, 98–109. [Google Scholar] [CrossRef]
  14. Wang, C.Y.; Zhou, Z.; Wang, R. Study on operation strategy of solar-powered UAV based on longest endurance. J. Northwestern Polytech. Univ. 2020, 38, 75–83. [Google Scholar] [CrossRef]
  15. Dwivedi, V.S.; Kumar, P.; Ghosh, A.K.; Kamath, G.S. Selection of size of battery for solar powered aircraft. IFAC-PapersOnLine 2018, 51, 424–430. [Google Scholar] [CrossRef]
  16. Wu, M.; Shi, Z.; Xiao, T.; Ang, H. Flight trajectory optimization of sun-tracking solar aircraft under the constraint of mission region. Chin. J. Aeronaut 2021, 31, 140–153. [Google Scholar] [CrossRef]
  17. Ma, D.Y.; Chen, N.F.; Tao, Q.L.; Zhao, H.Y.; Liu, H.; Bai, Y.M.; Chen, J.K. Radiation resistance and degradation mechanism of space GaInP/GaAs/Ge triple-junction solar cell. Mater. Rep. 2017, 31, 12–16. [Google Scholar]
  18. Hu, J.M. Radiation Effects of Space Charged Particles and Method of Predicting Degradation of Performance in Orbit for GaAs Solar Cells. Ph.D. Thesis, Harbin Industrial University, Harbin, China, 2009. [Google Scholar]
  19. Yan, Y.Y. Radiation Damage Analysis of GaInP/GaAs/Ge Solar Cells. M.D. Thesis, Nanjing University of Aeronautics and Astronautics, Nanjing, China, 2019. [Google Scholar]
  20. Liu, H.X.; Chen, X.T.; Sun, Q.; Zhao, C. Cycle performance characteristics of soft pack lithium-ion batteries under vacuum environment. Energy Storage Sci. Technol. 2022, 11, 1806–1815. [Google Scholar]
  21. Mussa, A.S.; Klett, M.; Lindbergh, G.; Lindström, R.W. Effects of external pressure on the performance and ageing of single-layer lithium-ion pouch cells. J. Power Sources 2018, 385, 18–26. [Google Scholar] [CrossRef]
  22. Wang, S.Q.; Ma, D.L.; Yang, M.Q.; Zhang, L. Three-dimensional optimal path planning for high-altitude solar-powered UAV. J. Beijing Univ. Aeronaut. Astronaut. 2019, 45, 936–943. [Google Scholar]
  23. Klesh, A.T.; Kabamba, P.T. Solar-powered aircraft: Energy-optimal path planning and perpetual endurance. J. Guid. Control Dynam. 2009, 32, 1320–1329. [Google Scholar] [CrossRef]
  24. Wang, S.; Ma, D.; Yang, M.; Zhang, L.; Li, G. Flight strategy optimization for high-altitude long-endurance solar-powered aircraft based on Gauss pseudo-spectral method. Chin. J. Aeronaut 2019, 32, 2286–2298. [Google Scholar] [CrossRef]
  25. Gao, X.Z.; Hou, Z.X.; Guo, Z.; Wang, P.; Zhang, J.T. Research on characteristics of gravitational gliding for high-altitude solar-powered unmanned aerial vehicles. Proc. Inst. Mech. Eng. Part G J. Aerosp. Eng. 2012, 227, 1911–1923. [Google Scholar] [CrossRef]
  26. Gao, X.-Z.; Hou, Z.-X.; Guo, Z.; Fan, R.-F.; Chen, X.-Q. The equivalence of gravitational potential and rechargeable battery for high-altitude long-endurance solar-powered aircraft on energy storage. Energy Convers. Manag. 2013, 76 (Suppl. C), 986–995. [Google Scholar] [CrossRef]
  27. Sachs, G.; Lenz, J.; Holzapfel, F. Unlimited endurance performance of solar UAVs with minimal or zero electric energy storage. In Proceedings of the AIAA Guidence, Navigation and Control Conference, Chicago, IL, USA, 10–13 August 2009; p. 6013. [Google Scholar]
  28. Zhang, D.H.; Zhang, J.; Li, J.F. Energy balance modeling for solar powered aircrafts. Acta Aeronaut. Astronaut. Sin. 2014, 37, 16–23. [Google Scholar]
  29. Ma, J.C.; Zhao, X.Y.; Zhou, R. Control strategy research for long-flight UAV and establishment of simulation platform. Aircr. Des. 2016, 37 (Suppl. S1), S16–S23. [Google Scholar]
  30. Ma, D.L.; Bao, W.Z.; Qiao, Y.H. Study of right path for solar-powered aircraft based on gravity energy reservation. Acta Aeronaut. Astronaut. Sin. 2014, 35, 408–416. [Google Scholar]
  31. Huang, H.L.; Savkin, A.V. Path planning for a solar-powered UAV inspecting mountain sites for safety and rescue. Energies 2021, 14, 1968. [Google Scholar] [CrossRef]
  32. Zhang, L.; Ma, D.; Yang, M.; Xia, X.; Yao, Y. Optimization and analysis of composite sandwich box beam for solar drones. Chin. J. Aeronaut 2021, 34, 148–165. [Google Scholar] [CrossRef]
  33. Zhang, L.; Ma, D.; Yang, M.; Yao, Y.; Yu, Y.; Yang, X. Experimental and numerical study on the performance of double membrane wing for long-Endurance low-speed aircraft. Appl. Sci. 2022, 12, 6765. [Google Scholar] [CrossRef]
  34. Stojaković, P.; Rašuo, B. Single propeller airplane minimal flight speed based upon the lateral maneuver condition. Aerosp. Sci. Technol. 2016, 49, 239–249. [Google Scholar] [CrossRef]
  35. Stojaković, P.; Velimirović, K.; Rašuo, B. Power optimization of a single propeller airplane take-off run on the basis of lateral maneuver limitations. Aerosp. Sci. Technol. 2018, 72, 553–563. [Google Scholar] [CrossRef]
Figure 1. The solar-powered aircraft.
Aerospace 09 00672 g001
Figure 2. Energy transmission path of solar-powered UAV.
Aerospace 09 00672 g002
Figure 3. Wind tunnel tests of wings with different skin materials.
Aerospace 09 00672 g003
Figure 4. Comparison of aerodynamic characteristics between rigid skin and photovoltaic skin wings.
Aerospace 09 00672 g004
Figure 5. GaAs cells mounted on the UAV.
Aerospace 09 00672 g005
Figure 6. Definition of solar azimuth.
Aerospace 09 00672 g006
Figure 7. GaAs cells mounted on the UAV.
Aerospace 09 00672 g007
Figure 8. Test of single GaInP/GaAs/Ge cell.
Aerospace 09 00672 g008
Figure 9. Electrical performance prediction of the GaInP/GaAs/Ge triple-junction PV cells served in the geosynchronous orbit.
Aerospace 09 00672 g009
Figure 10. Capacity decay curve of lithium-ion battery.
Aerospace 09 00672 g010
Figure 11. Lithium-ion battery capacity decay test.
Aerospace 09 00672 g011
Figure 12. Motor power and torque test.
Aerospace 09 00672 g012
Figure 13. Propeller wind tunnel test.
Aerospace 09 00672 g013
Figure 14. Change in motor efficiency under different working conditions.
Aerospace 09 00672 g014
Figure 15. Change in motor efficiency with flight altitude under maximum continuous state.
Aerospace 09 00672 g015
Figure 16. Typical flight profile.
Aerospace 09 00672 g016
Figure 17. Control flow chart of solar-powered UAV flight strategy.
Aerospace 09 00672 g017
Figure 18. Flight altitude and speed of typical flight profile.
Aerospace 09 00672 g018
Figure 19. Climb rate of typical flight profile.
Aerospace 09 00672 g019
Figure 20. Secondary battery capacity and power curve of typical flight profile.
Aerospace 09 00672 g020
Figure 21. Power spectrum of typical flight profile.
Aerospace 09 00672 g021
Figure 22. Variation of remaining capacity of secondary battery with takeoff time during the first day of climb.
Aerospace 09 00672 g022
Figure 23. Variation of maximum flight altitude on the first day with takeoff time.
Aerospace 09 00672 g023
Figure 24. Variation of maximum overnight altitude with takeoff time.
Aerospace 09 00672 g024
Figure 25. Influence of flight date on maximum overnight altitude.
Aerospace 09 00672 g025
Figure 26. Influence of flight date on maximum flight altitude.
Aerospace 09 00672 g026
Figure 27. Influence of flight date on the earliest takeoff time.
Aerospace 09 00672 g027
Figure 28. Influence of flight date and overnight altitude on takeoff time window.
Aerospace 09 00672 g028
Figure 29. Influence of flight latitude on maximum overnight altitude.
Aerospace 09 00672 g029
Figure 30. Comparison of PV cell output power at different latitudes (21 Feb.).
Aerospace 09 00672 g030
Figure 31. Comparison of PV cell output power at different latitudes (21 Apr.).
Aerospace 09 00672 g031
Figure 32. Influence of flight latitude on maximum flight altitude.
Aerospace 09 00672 g032
Figure 33. Influence of takeoff weight on maximum overnight altitude (21 Mar., 41° N).
Aerospace 09 00672 g033
Figure 34. Influence of takeoff weight on maximum flight altitude (21 Mar., 41° N).
Aerospace 09 00672 g034
Figure 35. Influence of lift–drag ratio reduction on maximum overnight altitude (21 Mar., 41° N).
Aerospace 09 00672 g035
Figure 36. Influence of lift–drag ratio reduction on maximum flight altitude (21 Mar., 41° N).
Aerospace 09 00672 g036
Figure 37. Variation of maximum overnight altitude with secondary battery energy density.
Aerospace 09 00672 g037
Figure 38. Variation of maximum flight altitude with secondary battery energy density.
Aerospace 09 00672 g038
Table 1. Value of coefficient Aij.
Aij(Re/105)0(Re/105)1(Re/105)2
α07.983 × 10−19.208 × 10−3−9.792 × 10⁻⁵
α15.898 × 1001.392 × 10−22.255 × 10⁻³
α2−7.246 × 1004.610 × 10−2−1.894 × 10⁻²
Table 2. Value of coefficient Bij.
Bij(Re/105)0(Re/105)1(Re/105)2
α02.284 × 10⁻²−6.603 × 10−41.493 × 10−5
α11.403 × 10−12.108 × 10−4−8.493 × 10⁻⁵
α21.362 × 100−6.438 × 10−22.983 × 10−3
Table 3. Main energy system parameters.
SubsystemsParametersValue
PV cellsInitial conversion efficiency28%
Power generation area12 m2
Secondary batteriesEnergy density350 Wh/kg
Discharge depth90%
Maximum discharge rate0.2 C
Energy management modulesMPPT efficiency95%
DC/DC module efficiency80%
Cable efficiency80%
Table 4. Equivalent fluence per year for GaInP/GaAs/Ge PV cells irradiated by the solar protons and the radiation belt electrons in the geosynchronous orbit.
Electrical ParametersAnnual Equivalent Fluence of Solar Proton, cm−2 a−1Annual Equivalent Fluence of Electrons, cm−2 a−1Sum of Annual Equivalent Fluence of Proton and Electron, cm−2 a−1
Voc1.33 × 10101.02 × 10133.54 × 1013
Isc1.44 × 10101.02 × 10131.52 × 1013
Pmax1.33 × 10101.02 × 10132.35 × 1013
Table 5. Dynamic system parameters.
ParametersValues
Number of motors2
Maximum output power of the motor560 W
Propeller diameter1.4 m
Table 6. Values of coefficient Cij.
Cij(Re/105)0(Re/105)1(Re/105)2
λ0−2.481 × 1002.783 × 100−1.818 × 10⁻¹
λ16.882 × 100−4.081 × 100−1.432 × 100
λ2−3.640 × 1008.042 × 10−12.200 × 100
Publisher’s Note: MDPI stays neutral with regard to jurisdictional claims in published maps and institutional affiliations.

