Article

Experimental and Numerical Investigations on the Mixing Process of Supercritical Jet Injected into a Supersonic Crossflow

1
School of Astronautics, Beihang University, Beijing 100191, China
2
Shanghai Institute of Space Propulsion, Shanghai 201112, China
3
Shanghai Electrical and Mechanical Engineering Institute, Shanghai 201100, China
*
Authors to whom correspondence should be addressed.
Aerospace 2022, 9(11), 631; https://doi.org/10.3390/aerospace9110631
Submission received: 18 September 2022 / Revised: 18 October 2022 / Accepted: 20 October 2022 / Published: 22 October 2022
(This article belongs to the Special Issue Advances in Hypersonic Aircraft Propulsion Technology)

Abstract

:
The mixing process and distribution characteristics of a supercritical endothermic hydrocarbon fuel (EHF) jet injected into a supersonic crossflow were investigated by experimental and numerical methods, respectively. The schlieren system and acetone planar laser-induced fluorescence (PLIF) optical system were used to capture the flow-field structural characteristics and instantaneous plume. The mixture and real gas models were employed to calculate the interaction of a transverse jet and supersonic crossflow and reveal a good accuracy with the experimental results. The mixing efficiency and total pressure loss were analyzed based on the numerical results. The results indicate that the supercritical-state EHF directly changes to a gaseous state as it enters the supersonic crossflow from the injector. The EHF jet plume boundary increases with the increasing momentum flux ratio (q). As the streamwise and spanwise distance increases, the traverse heights and expand width increase, and the EHF jet plume presents a semicircle shape in the cross-sectional plane. With the increase in the traverse direction, the concentration distribution shows a fast and then slow power exponential decreasing law; the highest concentration point starts from the near-wall region and rises in the transverse direction with the flow distance increasing. For the same injection condition, the higher the inflow Mach number, the higher the mixing efficiency. For the same Ma, the mixing efficiency is better for the case with low injection pressure and high injection temperature. The total pressure loss is greater in the higher Ma, and high injection pressure conditions cause greater total pressure loss.

1. Introduction

The scramjet engine is considered to be the promising air-breathing propulsion system for future supersonic aircraft [1,2]. The high enthalpy airflow and combustion heat release make the scramjet face an extremely strict thermal environment [3]. Endothermic hydrocarbon fuels (EHFs) are used both as fuel and a thermal protection coolant for regenerative cooling scramjet engines [4,5,6], which have the advantages of a high volumetric energy density, large heat sinks, and ease of storage [7,8]. After absorbing heat, EHF becomes a supercritical fluid and presents unique thermophysical properties. Supercritical-state EHF is characterized by a density similar to that of a liquid and a viscosity coefficient similar to that of gas, as well as zero surface tension, zero latent heat of vaporization, and high compressibility [9].
For scramjet engines, due to the extremely high-speed incoming flow and the limited length of the combustor, the residence time of the fuel jet is very short. Therefore, the hydrocarbon fuel–air mixture has a significant influence on the ignition process [10] and combustion efficiency [11,12], which ultimately affects the thrust performance. As for liquid fuel injected into a supersonic crossflow, plenty of studies mainly focus on jet breakup and atomization [13,14], droplet–gas mixing [15], distribution characteristics [16,17], and evaporation process [18]. Furthermore, supercritical-state EHF can be directly converted to gaseous EHF without evaporation in a low static pressure environment, which significantly enhances the mixture of fuel and air. For high enthalpy crossflow, Yuan et al. (2018) [19] investigated the evaporation characteristics of the JP-4 jet spray with a high-speed camera coupled with the schlieren system and Mie scattering observation. In previous references, fewer experimental studies for heated kerosene jets in supersonic crossflow have been published in comparison with the cold condition. Yang et al. (2021) [20] proposed that fuel temperature and local flow velocity competitively influence the phase distribution in the jet plume, resulting in different evaporation distances in the direction perpendicular to the wall. Sun et al. (2014, 2016) [21,22] experimentally investigated the supersonic combustion with a cavity-strut injection of supercritical kerosene in a model scramjet engine. Fan et al. (2006) [23] conducted the preheat kerosene in a supersonic model combustor experiment and showed that the use of vaporized kerosene injection holds the potential of enhancing fuel–air mixing and promoting overall burning. Nevertheless, compared with liquid fuel and gas fuel, the recent studies of the mixing process and distribution characteristics of supercritical-state fuel jets injected into supersonic crossflow are not comprehensive, and the flow-field parameters have not been reported. The mixture of fuel and air is critical for the ignition process and combustion efficiency, which ultimately affects the performance of the engine. Therefore, an in-depth study of the distribution characteristics of supercritical-state fuels is very essential for the optimal design of injectors and combustion chambers.
For the two-phase flow physics of the jet in supersonic crossflow (JISC), plenty of experimental works have made the macroscopic discussion. However, the detailed analysis is still challenging to perform because of the limitations of optical techniques in resolving the spatiotemporal evolution of the highly unsteady flow field [24]. Recently, numerical simulation becomes an efficient way to investigate the distribution characteristics and mixing process of flow structures formed by the interaction of transverse jet and airflow.
Therefore, based on the experimental method and numerical simulation, the distribution characteristics of a supercritical hydrocarbon fuel jet injected into a supersonic crossflow were investigated in this paper. The schlieren system is adopted to capture the flow-field structural characteristics, and the acetone planar laser-induced fluorescence (PLIF) technique is used to obtain the concentration distribution of the jet plume. A two-phase flow algorithm is applied for details of interaction simulations of supercritical-state EHF and gas crossflow based on the mixture model. A series of numerical simulations have been conducted in parallel to compare with the results of the actual flow field. The mixing characteristics are analyzed based on fluorescence concentration distribution obtained by the acetone PLIF experimental method.

2. Experimental Setup and Method

2.1. Experimental Facilities

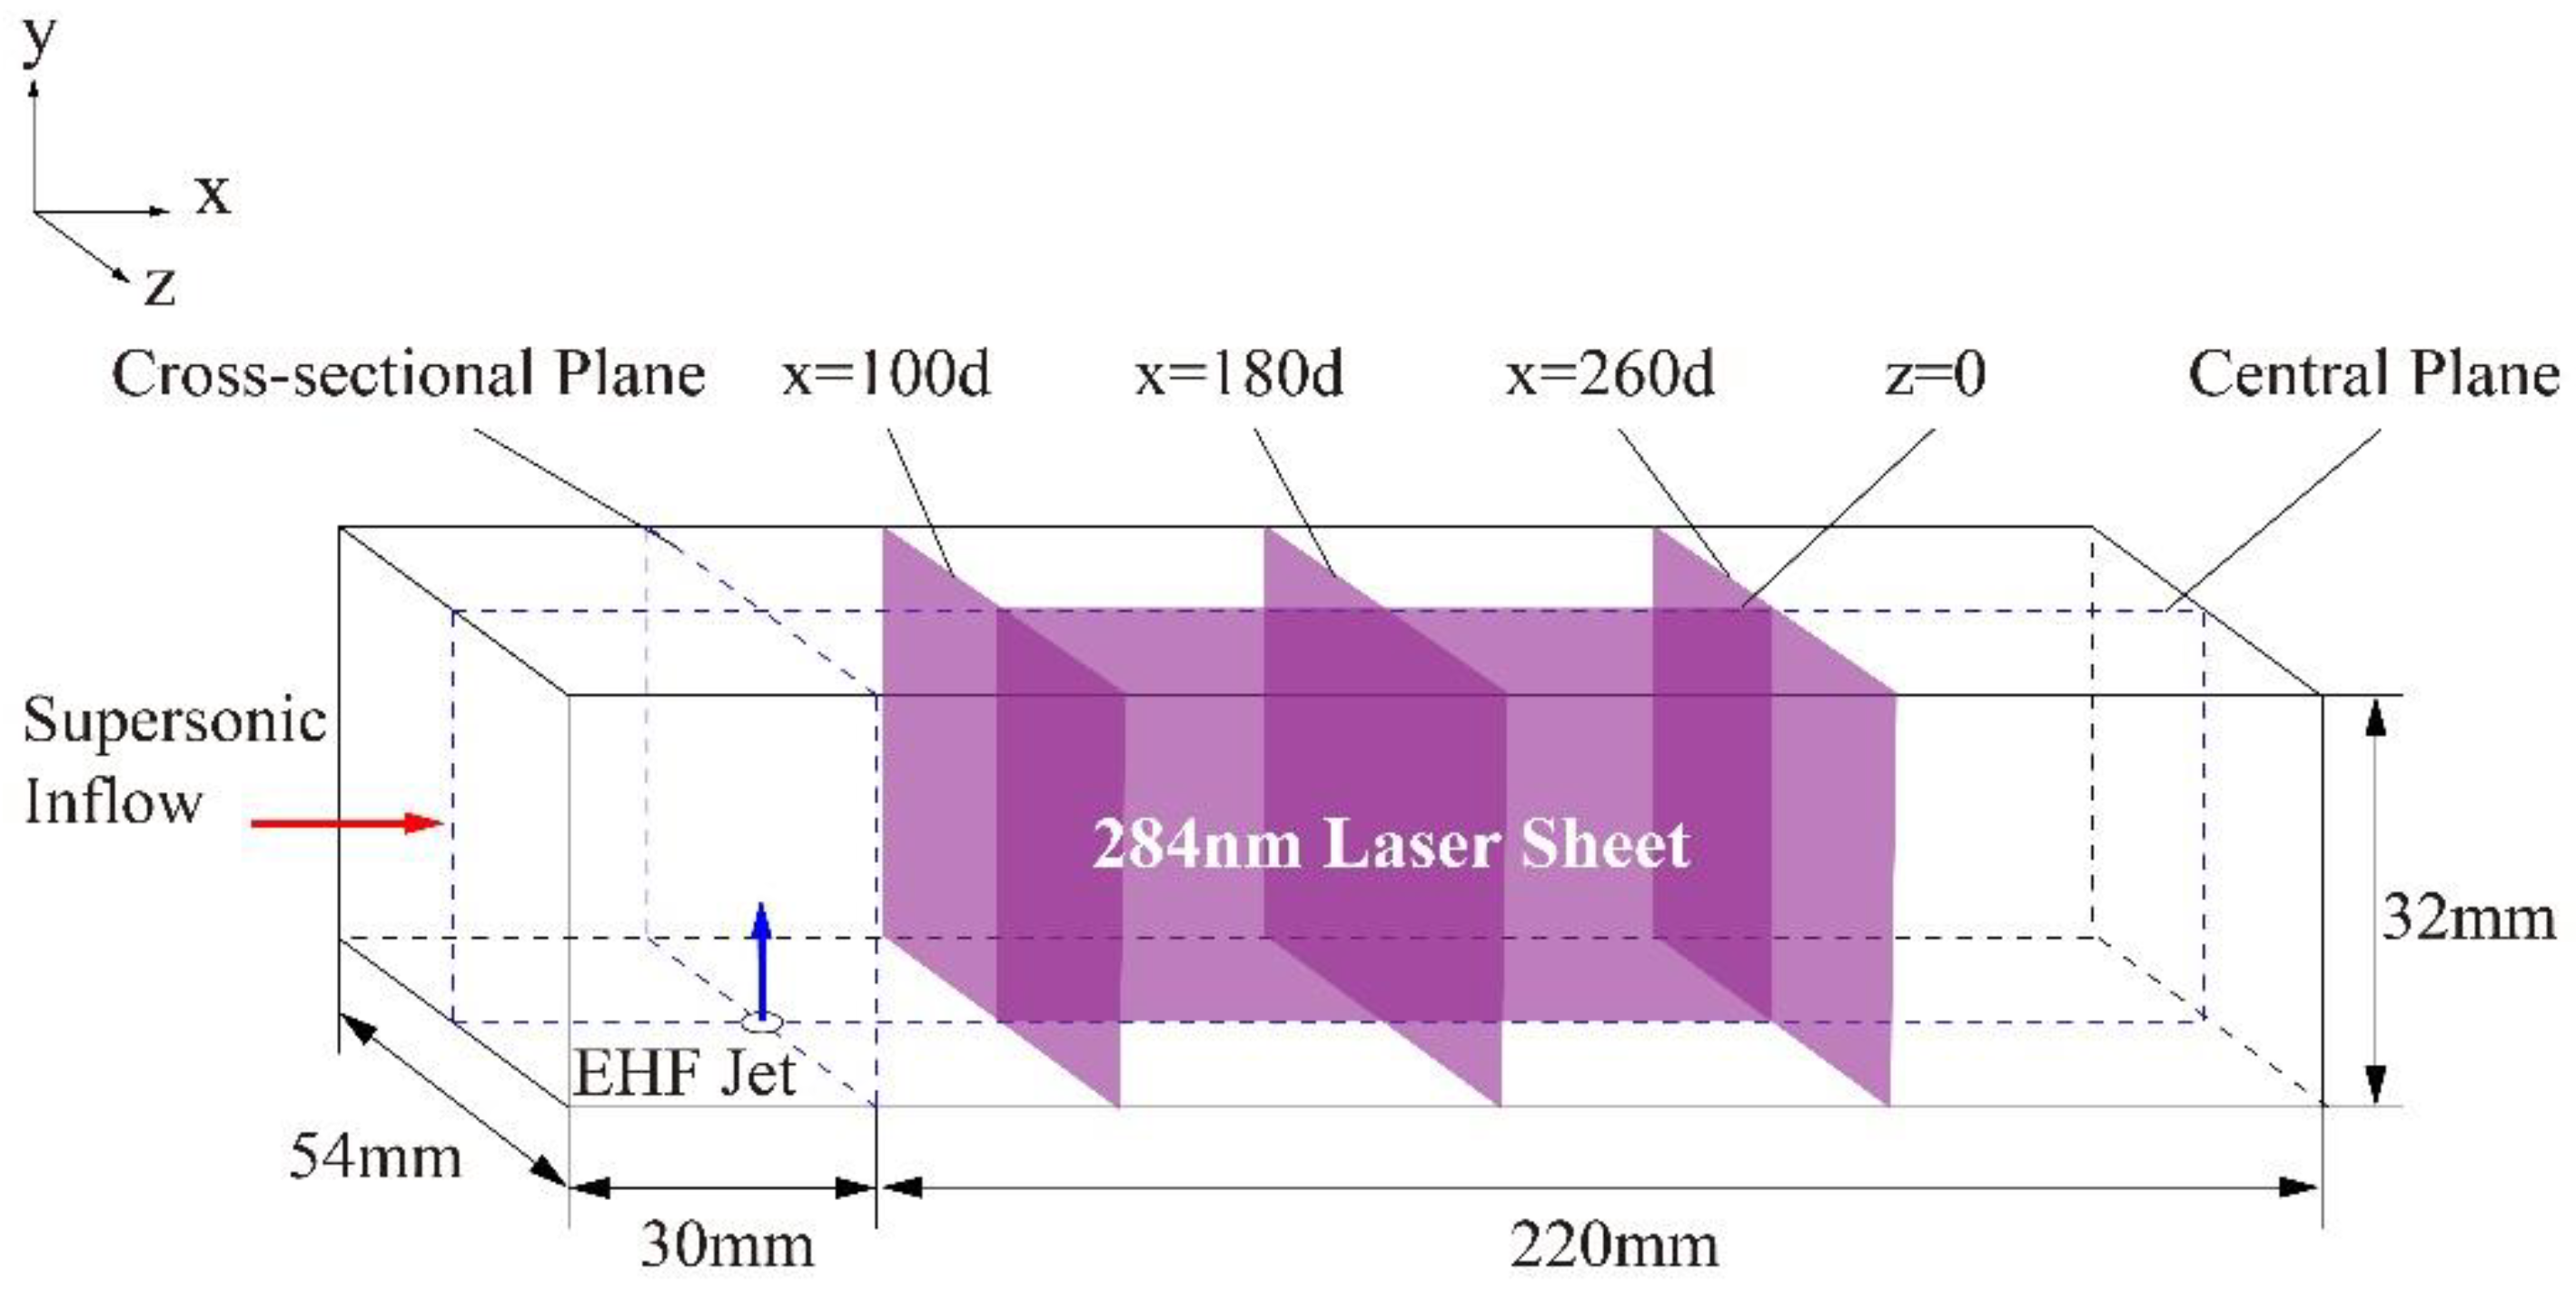
The mixing experiments were performed in a two-dimensional supersonic wind tunnel with designed Mach numbers, as shown in Figure 1. High-pressure air enters the test section after being accelerated through a 2D Laval nozzle. The dimension in the test section is 250 × 54 × 32 mm. Three windows were opened on the top and two side walls, which were inlaid with S2 optical glasses for observation and imaging. The Mach number, total temperature, and total pressure of supersonic flow in the test section are 2.0 and 2.8, 300 K, and between 0.43 MPa and 0.79 MPa, respectively. The supercritical-state EHF was injected into the test section upward with a diameter of 0.5 mm and a length-to-diameter ratio of 8. The Cartesian coordinates system employed in the experiment is also shown in Figure 1, and the origin is established at the center of the injection orifice. The x, y, and z denote the direction of streamwise, transverse, and spanwise, respectively.
The experiments were conducted using kerosene-based EHF as fuel with a critical pressure of 2.7 MPa and a critical temperature of 680 K. The supercritical EHF was generated by two stages of electric heaters short-circuited to stainless-steel tubes with rated voltages of 60 V and 80 V output, respectively. The EHF temperature was raised by heat transfer between the metal wall and the fluid inside the pipe. With the coordination of two heating stages, the EHF reached the required temperature from room temperature to 900 K in 120 s. An electric heating band wrapped around the pipe between the heater and injector with an output of 600 W ensured the precise control of the injection temperature (±1 K).
The EHF was supplied by nitrogen pressurization at different pressures. The flow rate of the fuel was measured by a mass flow meter with an accuracy of ±0.5%, and the total equivalent ratio of the EHF was controlled by the nitrogen pressure. The static pressure of the inflow and EHF injector was measured using pressure sensors with an accuracy of ±0.1%. The fuel temperature was measured using armored K-type thermocouples, with a probe diameter of 0.5 mm, temperature measurement range of 100–1600 K, and accuracy ±0.75%.

2.2. Optical Diagnostic System

The schlieren system was adopted to capture the flow-field structural characteristics and instantaneous plume. The imaging system was composed of an LED array light source, schlieren system light path, and digital camera. The digital camera (Canon EOS 5D Mark IV) equipped with a Nikon AF 60 mm microlens was used to record the near-field spray zone. The camera exposure time is 1/8000 s, and the image resolution is 6720 × 4480 pixels. The frame frequency is 2000 fps.
The acetone PLIF optical system was used to observe the flow structures of the EHF plume, which consists of a pump laser (Nd: YAG), dye laser, sheet optics, intensified charge-coupled device (ICCD) camera, filter, synchronization controller, and computer. The frequency-tripled Nd: YAG laser at an excitation wavelength of 355 nm was adopted, and the excitation wavelength was converted to 284 nm by the dye laser. The pulse frequency, pulse width, and pulse energy of the laser used in the experiments at 284 nm are 10 Hz, 10 ns, and 20 mJ, respectively. In the experiment, a high-energy pulse laser beam was transformed into a light sheet through light-sheet optics, which was equipped with a cylindrical lens and a spherical lens and placed on the top of the test section. The length of the laser sheet is about 80 mm, and the thin waist is about 0.3 mm.
Since the fuel downstream distribution is the main focus of the current study, the laser sheet is located in the center and cross-sectional planes of the test section and extends from the leading edge of the top optical window, as shown in Figure 2. Each optical measurement can only visualize the fluorescence signal of a single laser sheet plane for the operating conditions. Based on a series of measurements in the center and cross-sectional planes, the three-dimensional structure of the EHF jet plume can be reconstructed. The ICCD camera captures flow-field information using a 1376 × 1040 pixel imaging array. The image deformation caused by the inclination of the camera is corrected according to the Scheimpflug principle [25].
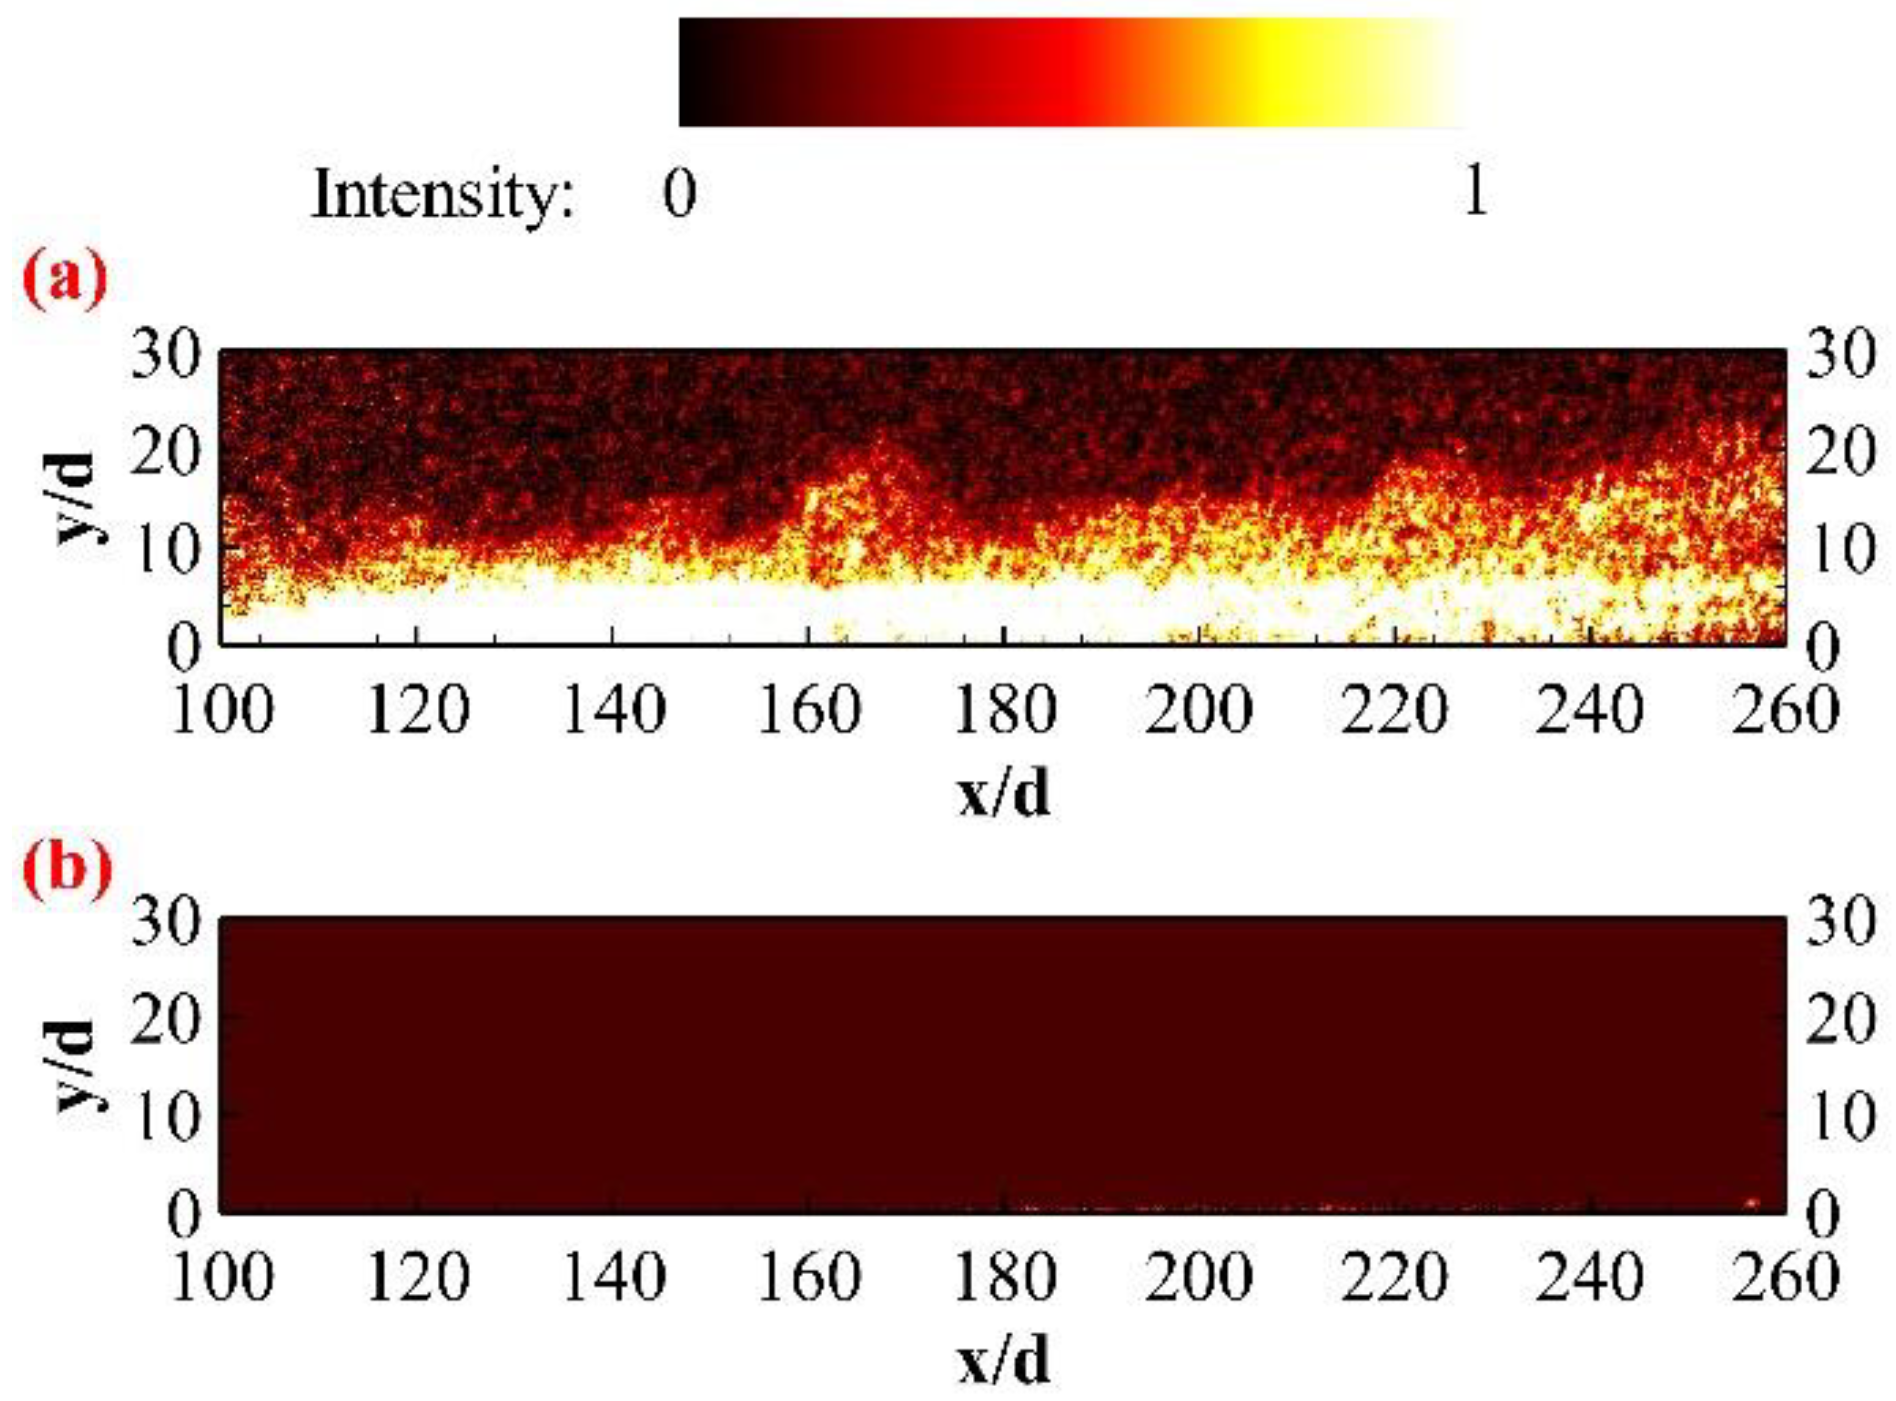
In the current work, a 5% molar fraction of acetone was added to the EHF as a tracer for PLIF measurements. This concentration is high enough to ensure reasonable fluorescence levels, yet low enough to observe the same jet dynamics as the jet plume without acetone [26]. Acetone PLIF imaging techniques are applicable up to approximately 1000 K [27]. The absorption spectra of acetone at high temperatures have been measured in previous studies [28]. The ICCD camera captures the majority of the acetone fluorescence signal with a 400 nm high-pass filter to eliminate elastic light reflections. The comparison of the fluorescence signal instantaneous image with and without acetone at Test 1-1 experiment condition is shown in Figure 3. It is obvious that the acetone–PLIF system has excellent characteristics of exciplex stability for high-temperature EHF jet ejected into a supersonic crossflow.

2.3. Experimental Conditions

The jet–air momentum flux ratio is given by
q = ρ j u j 2 ρ g u g 2
where ρ and u represent the density and velocity, respectively. The subscripts “j” and “g” indicate the EHF jet and gas crossflow, respectively.
The Mach number is given by
M a = u g c
where c is the sound speed in the gas.
The distribution characteristics of different momentum flux ratios were investigated by varying the EHF injection pressure and temperature under constant crossflow conditions. Four groups of operating conditions were set for comparison in this research as listed in Table 1, including the inflow Mach number, EHF injection pressure and temperature, and the momentum flux ratio. Considering that the EHF jet is ejected as a supercritical fluid, the properties and momentum fluxes of the EHF jet were calculated using NIST-SUPERTRAPP [29]. The effect of the decomposition of EHF on injection during heating was not considered in this study.

3. Numerical Methods

3.1. Mixture Model

The mixture model was applied in this work to simulate the interaction of the transverse supercritical-state EHF jet and airflow. The mixture model uses a single-fluid approach and allows the phases to be interpenetrating. The volume fractions α q and α p for a control volume can, therefore, be equal to any value between 0 and 1, depending on the space occupied by phase q and phase p. The mixture model solves the continuity equation for the mixture, momentum equation for the mixture, energy equation for the mixture, and volume fraction equation for the secondary phases, as well as algebraic expressions for the relative velocities.
The continuity, momentum, and energy equations for the mixture are as follows:
t ρ m + · ρ m v m = 0
t ρ m v m + · ρ m v m v m = p + μ m ( v m + v m T )     + ρ m g + F k = 1 n α k ρ k v d r , k v d r , k
t k α k ρ k E k + · k α k v k ρ k E k + p = · k e f f T k j h j , k J j , k + τ = e f f · v + S h
where v m , ρ m , and α k are the mass-averaged velocity, mixture density, and volume fraction of phase k, respectively,
v m = 1 ρ m k = 1 n α k ρ k v k ,   ρ m = k = 1 n α k ρ k
and n, F , μ m , and v d r , k are the number of phases, body force, the viscosity of the mixture, and the drift velocity for secondary phase k, respectively,
μ m = k = 1 n α k μ k ,   v d r , k = v k v m
and h j , k , J j , k , k e f f , and E k are the enthalpy of species j in phase k, diffusive flux of species j in phase k, effective conductivity, and total enthalpy, respectively,
k e f f = α k k k + k t ,   E k = E k p ρ k + v 2 2
where k t is the turbulent thermal conductivity defined according to the turbulence model being used and is the sensible enthalpy for phase k.
The relative velocity is defined as the velocity of a secondary phase p relative to the velocity of the primary q:
v p q = v p v q
The mass fraction for any phase k is defined as
c k = α k ρ k ρ m
The drift velocity and relative velocity are connected by the expression
v d r , p = v p q k = 1 n c k v k q
where v k q is the velocity of phase k relative to phase q.
From the continuity equation for secondary phase p, the volume fraction equation for secondary phase p can be obtained:
t α p ρ p + · α p ρ p v m = · α p ρ p v d r , p + q = 1 n m ˙ q p m ˙ p q

3.2. Real Gas Model

EHF is injected into the supersonic crossflow as a supercritical state, and the real gas effect causes parameters such as the specific heat ratio of the supercritical as well as gaseous hydrocarbon fuel to vary with temperature and pressure. The flow of supercritical-state EHF cannot be typically accurately modeled using the ideal-gas assumption. Therefore, the Aungier–Redlich–Kwong real gas model [30] is used instead for the simulation of supercritical-state EHF.
The Aungier–Redlich–Kwong equation of the state of the gas (A–R–K EoS) is written in the following form:
P = R T V b + c a T V V + b
where c is a correction value defined by
c = R T c P c + a 0 V c V c + b + b V c
and for the forms
a 0 = 0.42747   R 2 T c 2 / P c b = 0.08664   R T c / P c n = 0.4986 + 1.1735   ω + 0.4754   ω 2
The equation is improved for fluid properties near the critical point and substances with negative eccentricity factors and provides better predictions for calculations near the critical point.

3.3. Simulation Settings

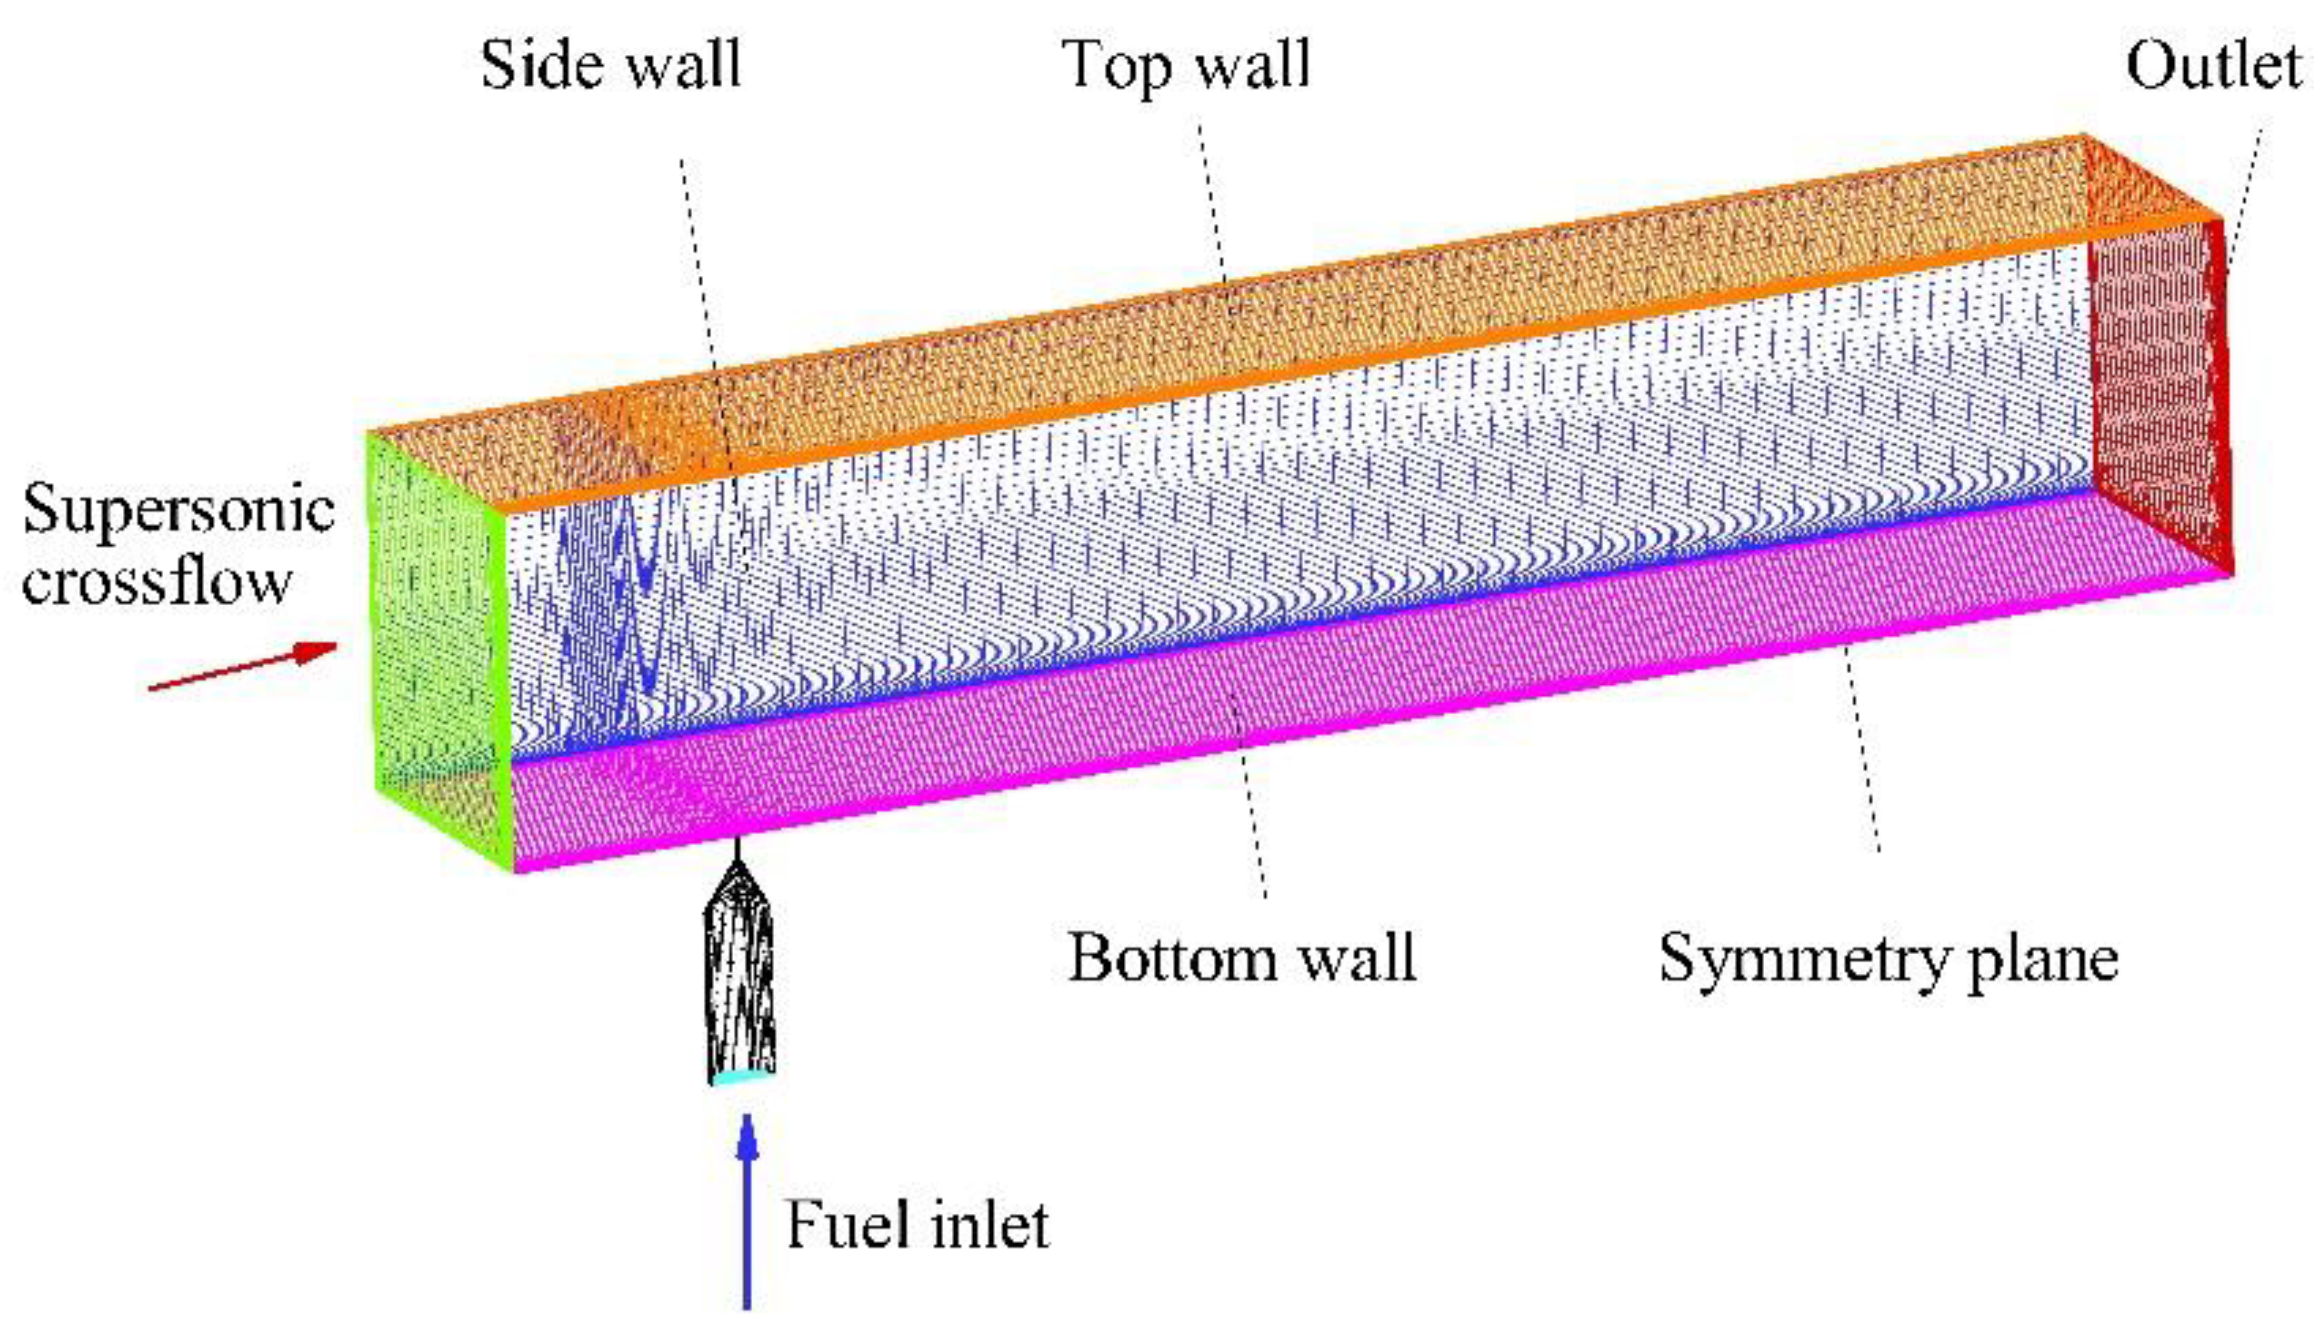
The schematic diagram of the computational domain is shown in Figure 4, which is 162 mm, 32 mm, and 27 mm in the streamwise, transverse, and spanwise directions, respectively. The jet orifice with a diameter of 0.5 mm is located in the center of the bottom floor and 20 mm from the leading edge. To reduce the computational cost, half of the flow-field area is considered, and the symmetry plane condition is adopted in the center section. The bottom and top walls are reducible to an adiabatic and no-slip condition. The velocity vector, static pressure, and static temperature of the supersonic inflow are specified based on experimental conditions. The outflow parameters are acquired by a second-order extrapolation of interior variables. The velocity vector, static pressure, and static temperature of the fuel jet are specified based on experimental conditions. The fuel flow rate obtained from the simulation is within a 7% error of the experimental measurement, indicating that the fuel inlet boundary conditions are accurately set. The mesh is refined around the jet orifice, near-wall region, and injection flow channel. The number of grid points in the streamwise, transverse, and spanwise directions is 162 × 91 × 95 in the rectangular channel and 25 × 59 × 25 in the injection flow channel of the fuel jet, which leads to a total number of cells of 1,620,420.
The numerical simulation is performed on the commercial software ANSYS Fluent®. The mixture model is applied to simulate the interaction of the fuel jet and supersonic crossflow, and the real gas model is used to simulate the supercritical-state EHF under very high-pressure conditions. A pressure-based solver is used for steady calculation, and the SIMPLE algorithm is employed. The pressure-velocity segregated solver is used, and spatial discretization is conducted with a second-order upwind method. The realizable k-ε model is used for turbulent modeling in the steady-state calculation. The steady-state numerical results provide deeper insight into the flow and mixing characteristics, as well as the jet plume spatial distribution, mixing efficiency, and total pressure loss. Moreover, the large eddy simulation (LES) is used for turbulent modeling in the unsteady-state calculation (Case U3-2). The unsteady-state numerical simulations are conducted to obtain more details of the flow structure formed by the interaction of the transverse jet and supersonic crossflow.
Two types of numerical simulation were set in this research as listed in Table 2, including the steady-state case and the unsteady-state case.

4. Results and Discussion

4.1. Flow Structure

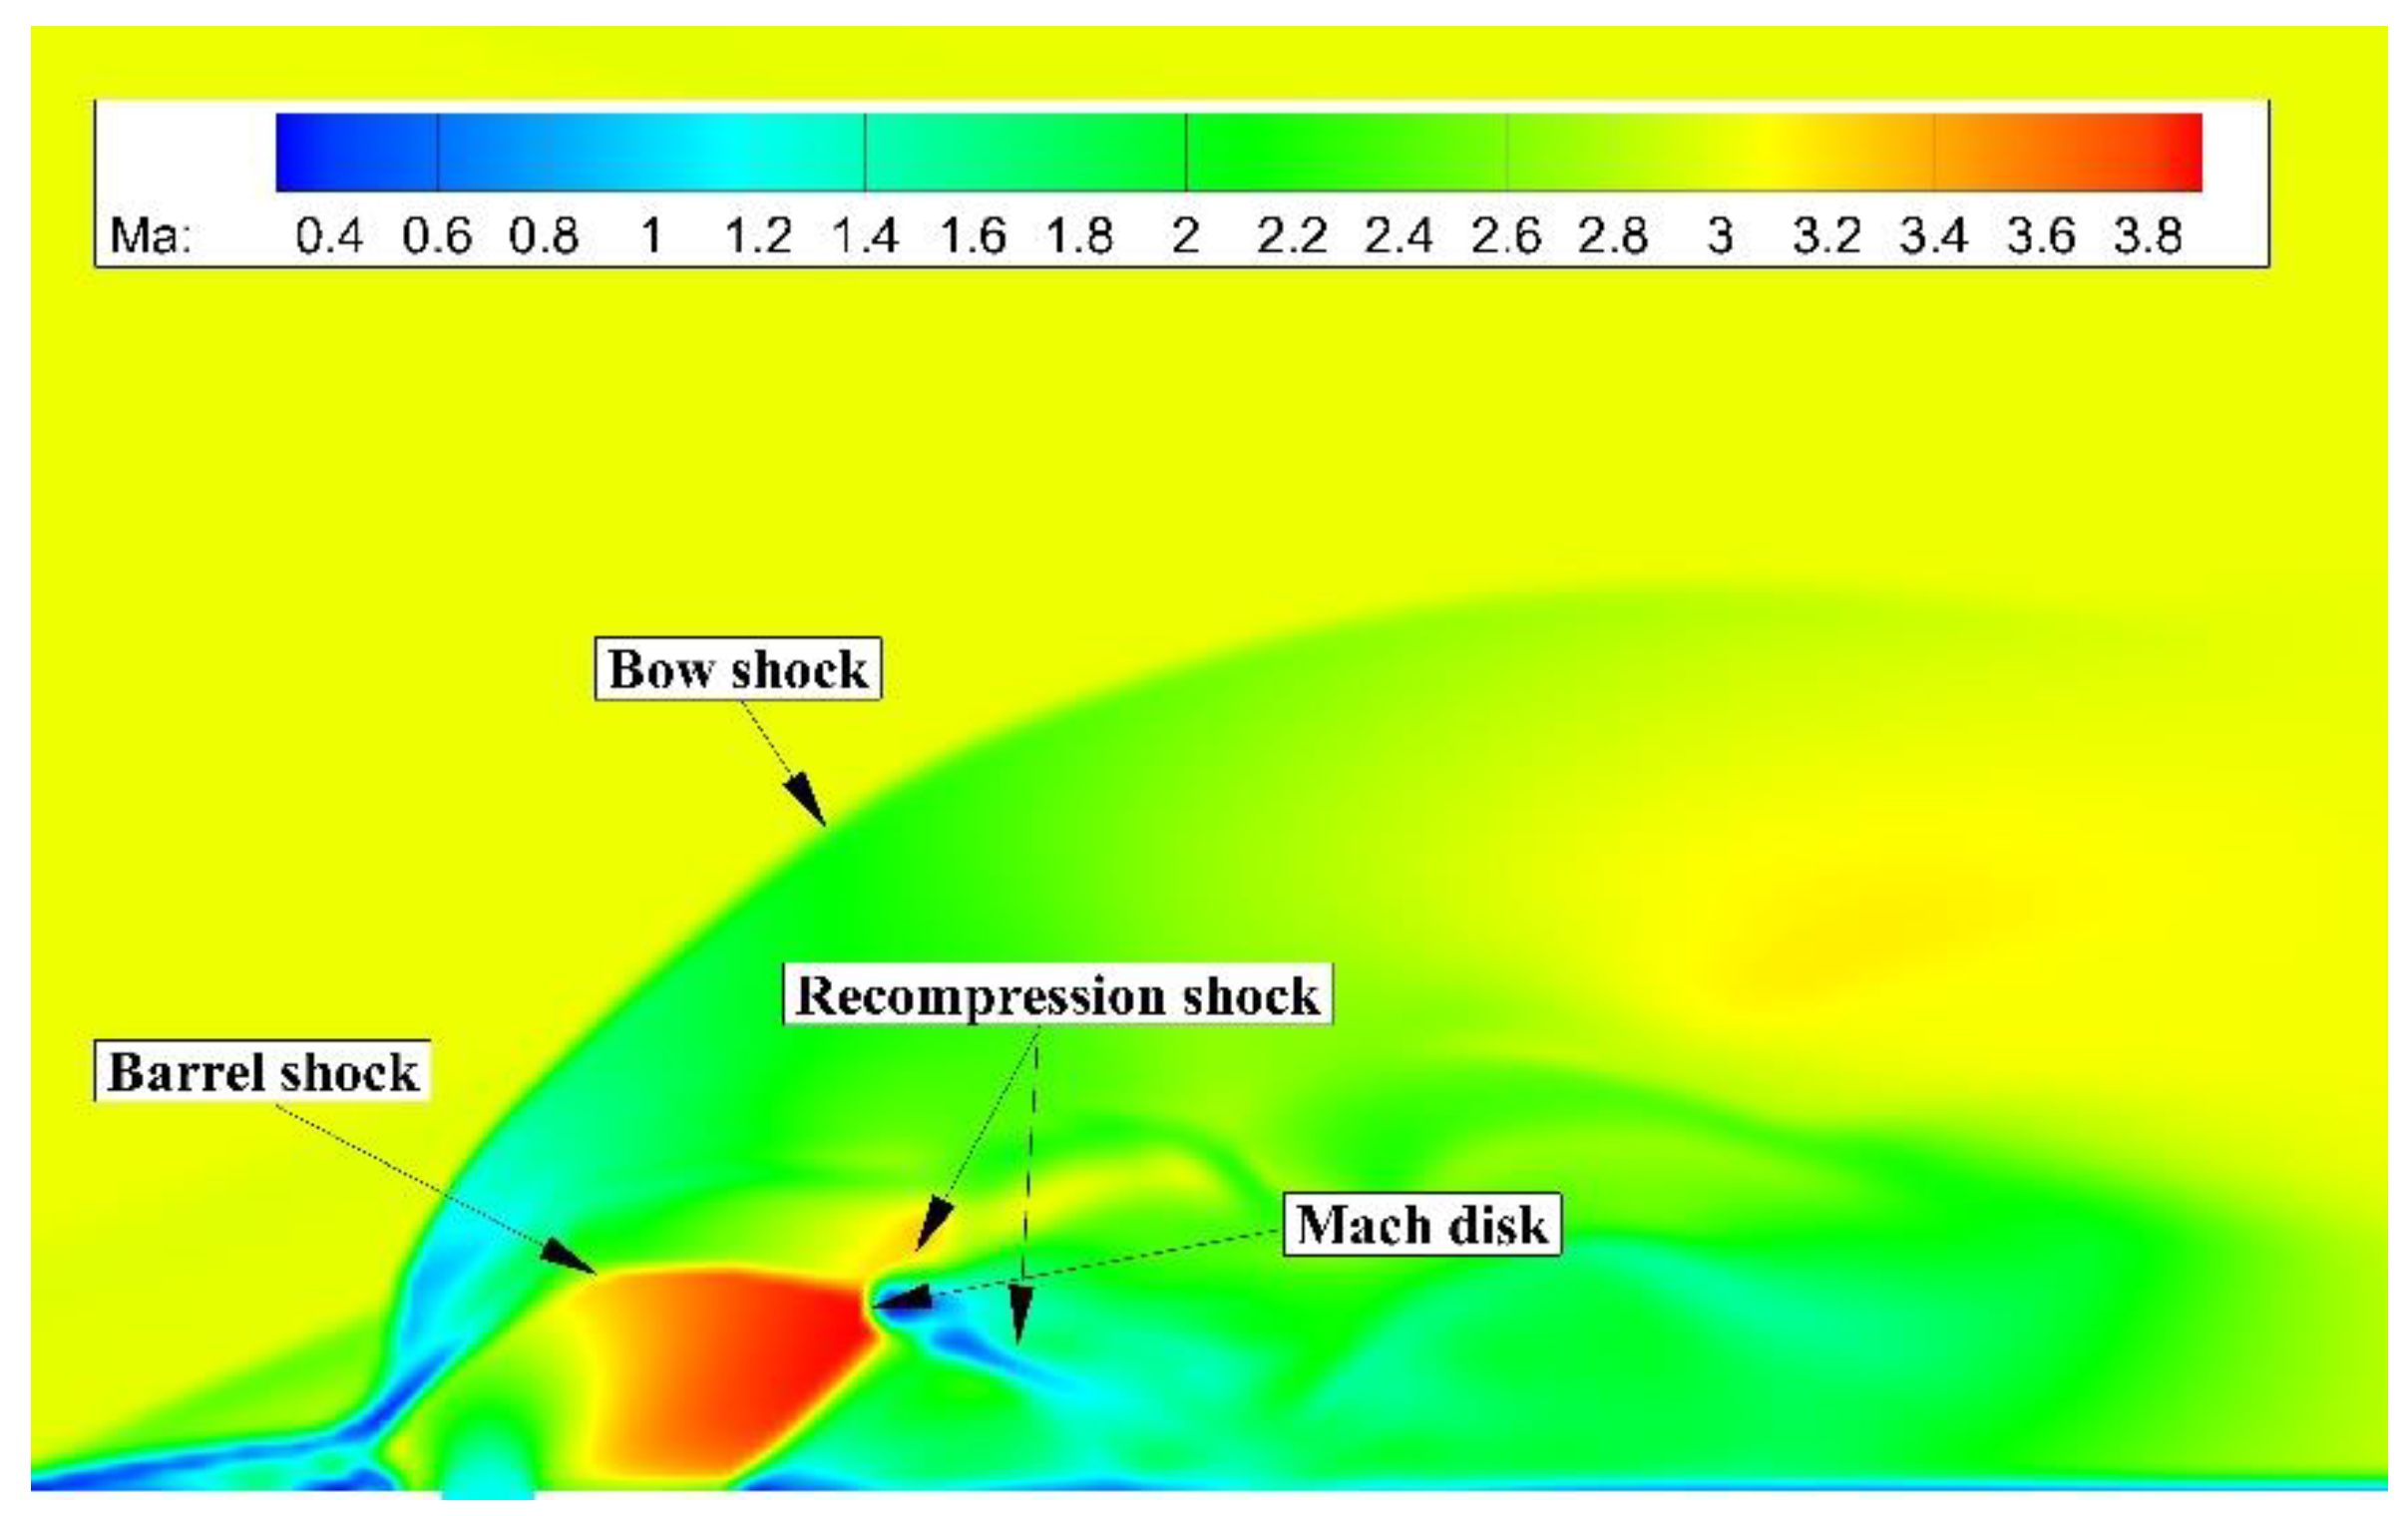
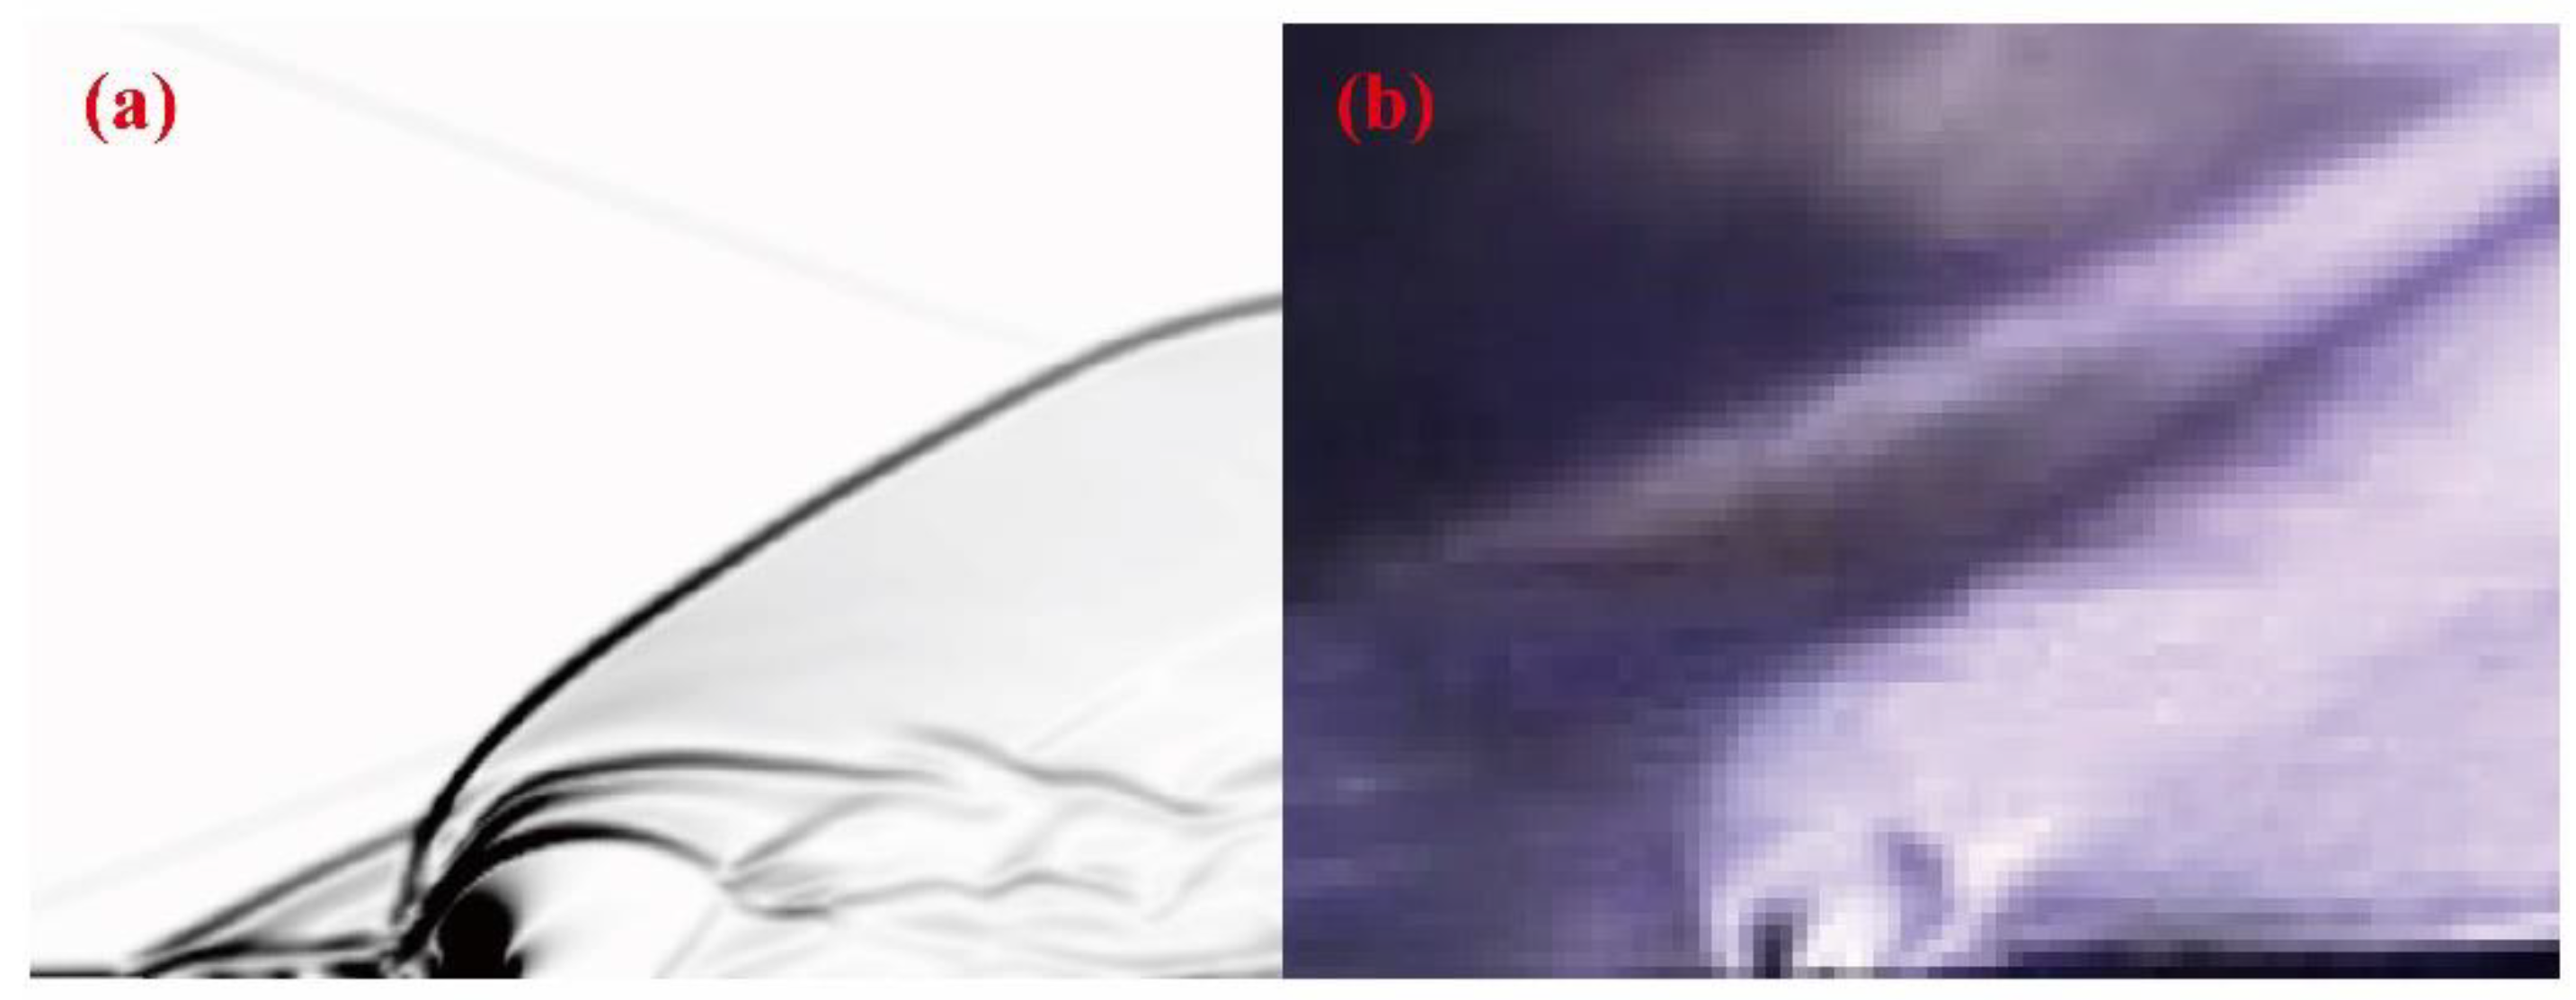
The flow-field structural characteristics are acquired with the schlieren system and numerical method. Figure 5 presents the Mach number contour plot at the symmetric surface (Case U3-2). In this simulation case, the Mach number and total pressure of the supersonic flow are 2.8 and 0.72 MPa, respectively. The injection pressure and injection temperature of the EHF jet are 2.8 MPa and 740 K, respectively. The numerical result shows the complex shock structure of the jet interaction flow very well. A barrel shock and Mach disk that formed due to the rapidly expanding jet are clearly captured. A recompression shock structure forms due to the change in the flow direction behind the Mach disk. The bow shock is induced by the interaction of the barrel shock and airflow, resulting in the separation zone of the boundary layer upstream. It indicates that the supercritical-state EHF directly changes to a gaseous state as it enters the supersonic crossflow from the injector [31,32]. Figure 6 compares the shock structure of the experimental and numerical schlieren images. Both images show good agreement in terms of the size and position of the shocks.
The bow shock angle obtained by schlieren images under different test conditions is shown in Figure 7, which reflects the effect of the jet on the flow field. In the Ma 2.8 incoming flow (Figure 7a), the bow shock angle does not vary much for different injection temperatures and injection pressures, and the jet-to-air momentum flux ratio varies from 4.6 to 6.8. Figure 7b presents the bow shock angle for a similar injection condition at different incoming Mach numbers. It can be seen that the bow shock angle at a lower Mach number is significantly larger under the similar injection condition and momentum flux ratio.
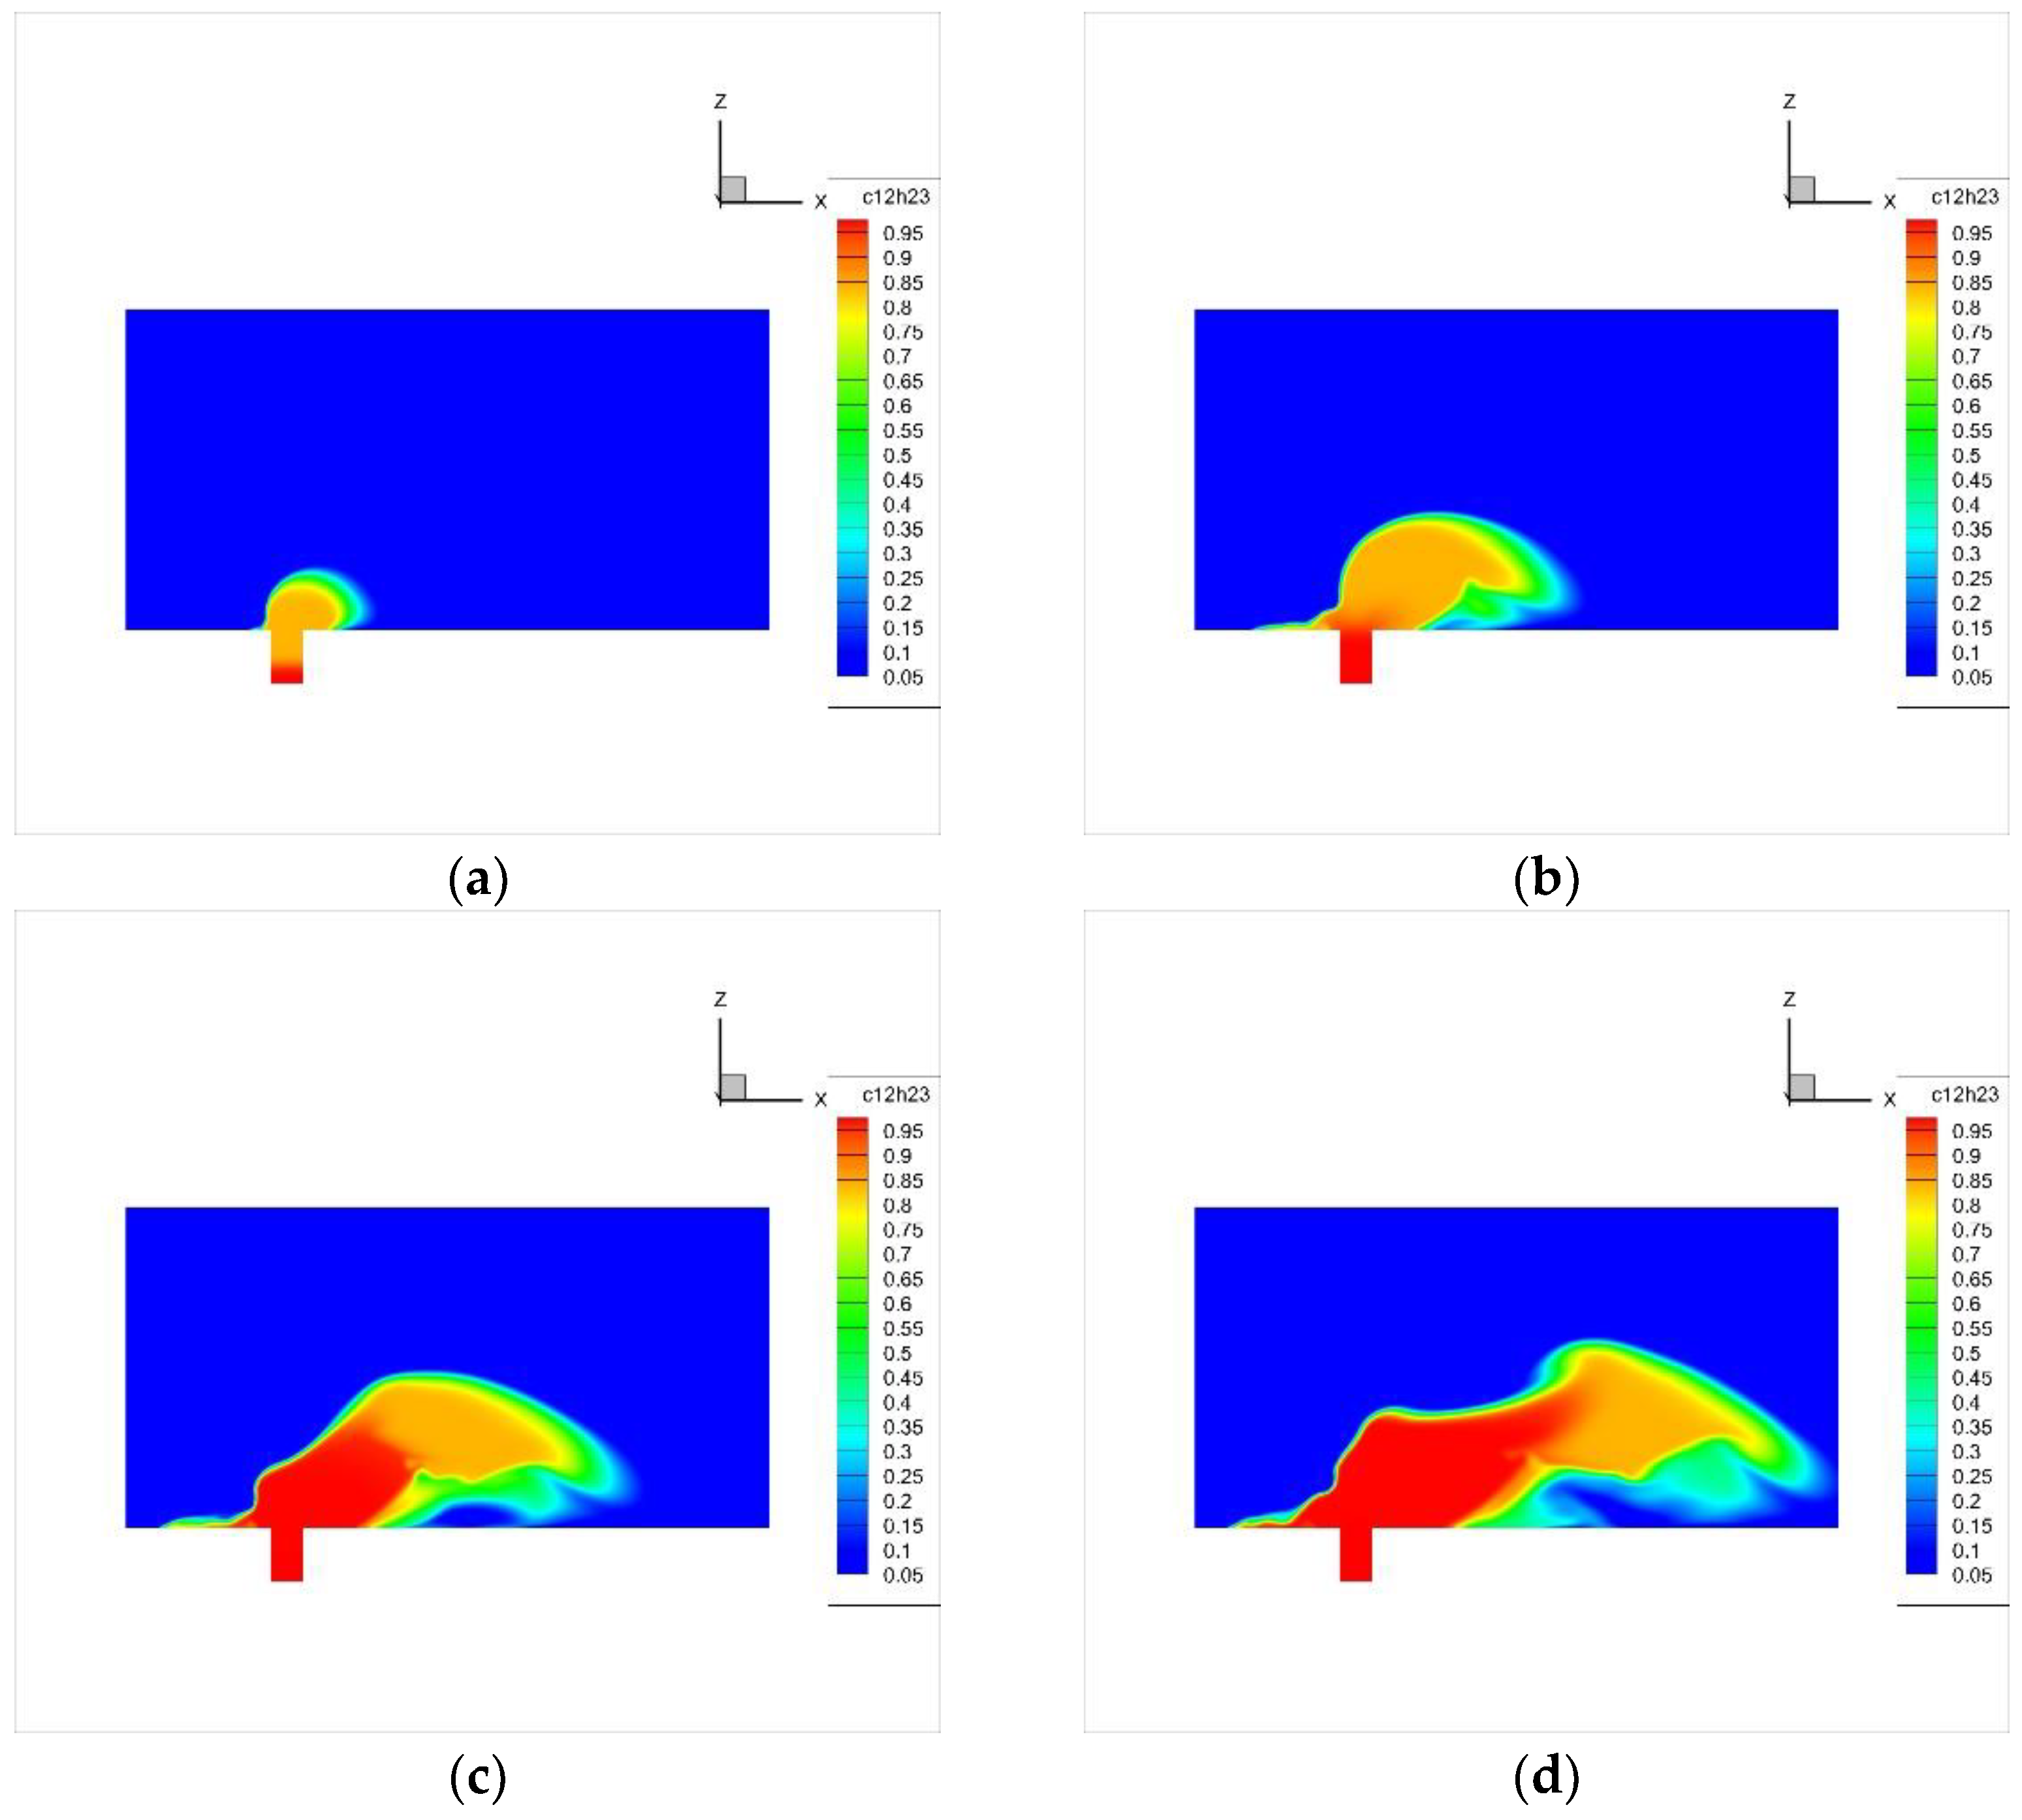
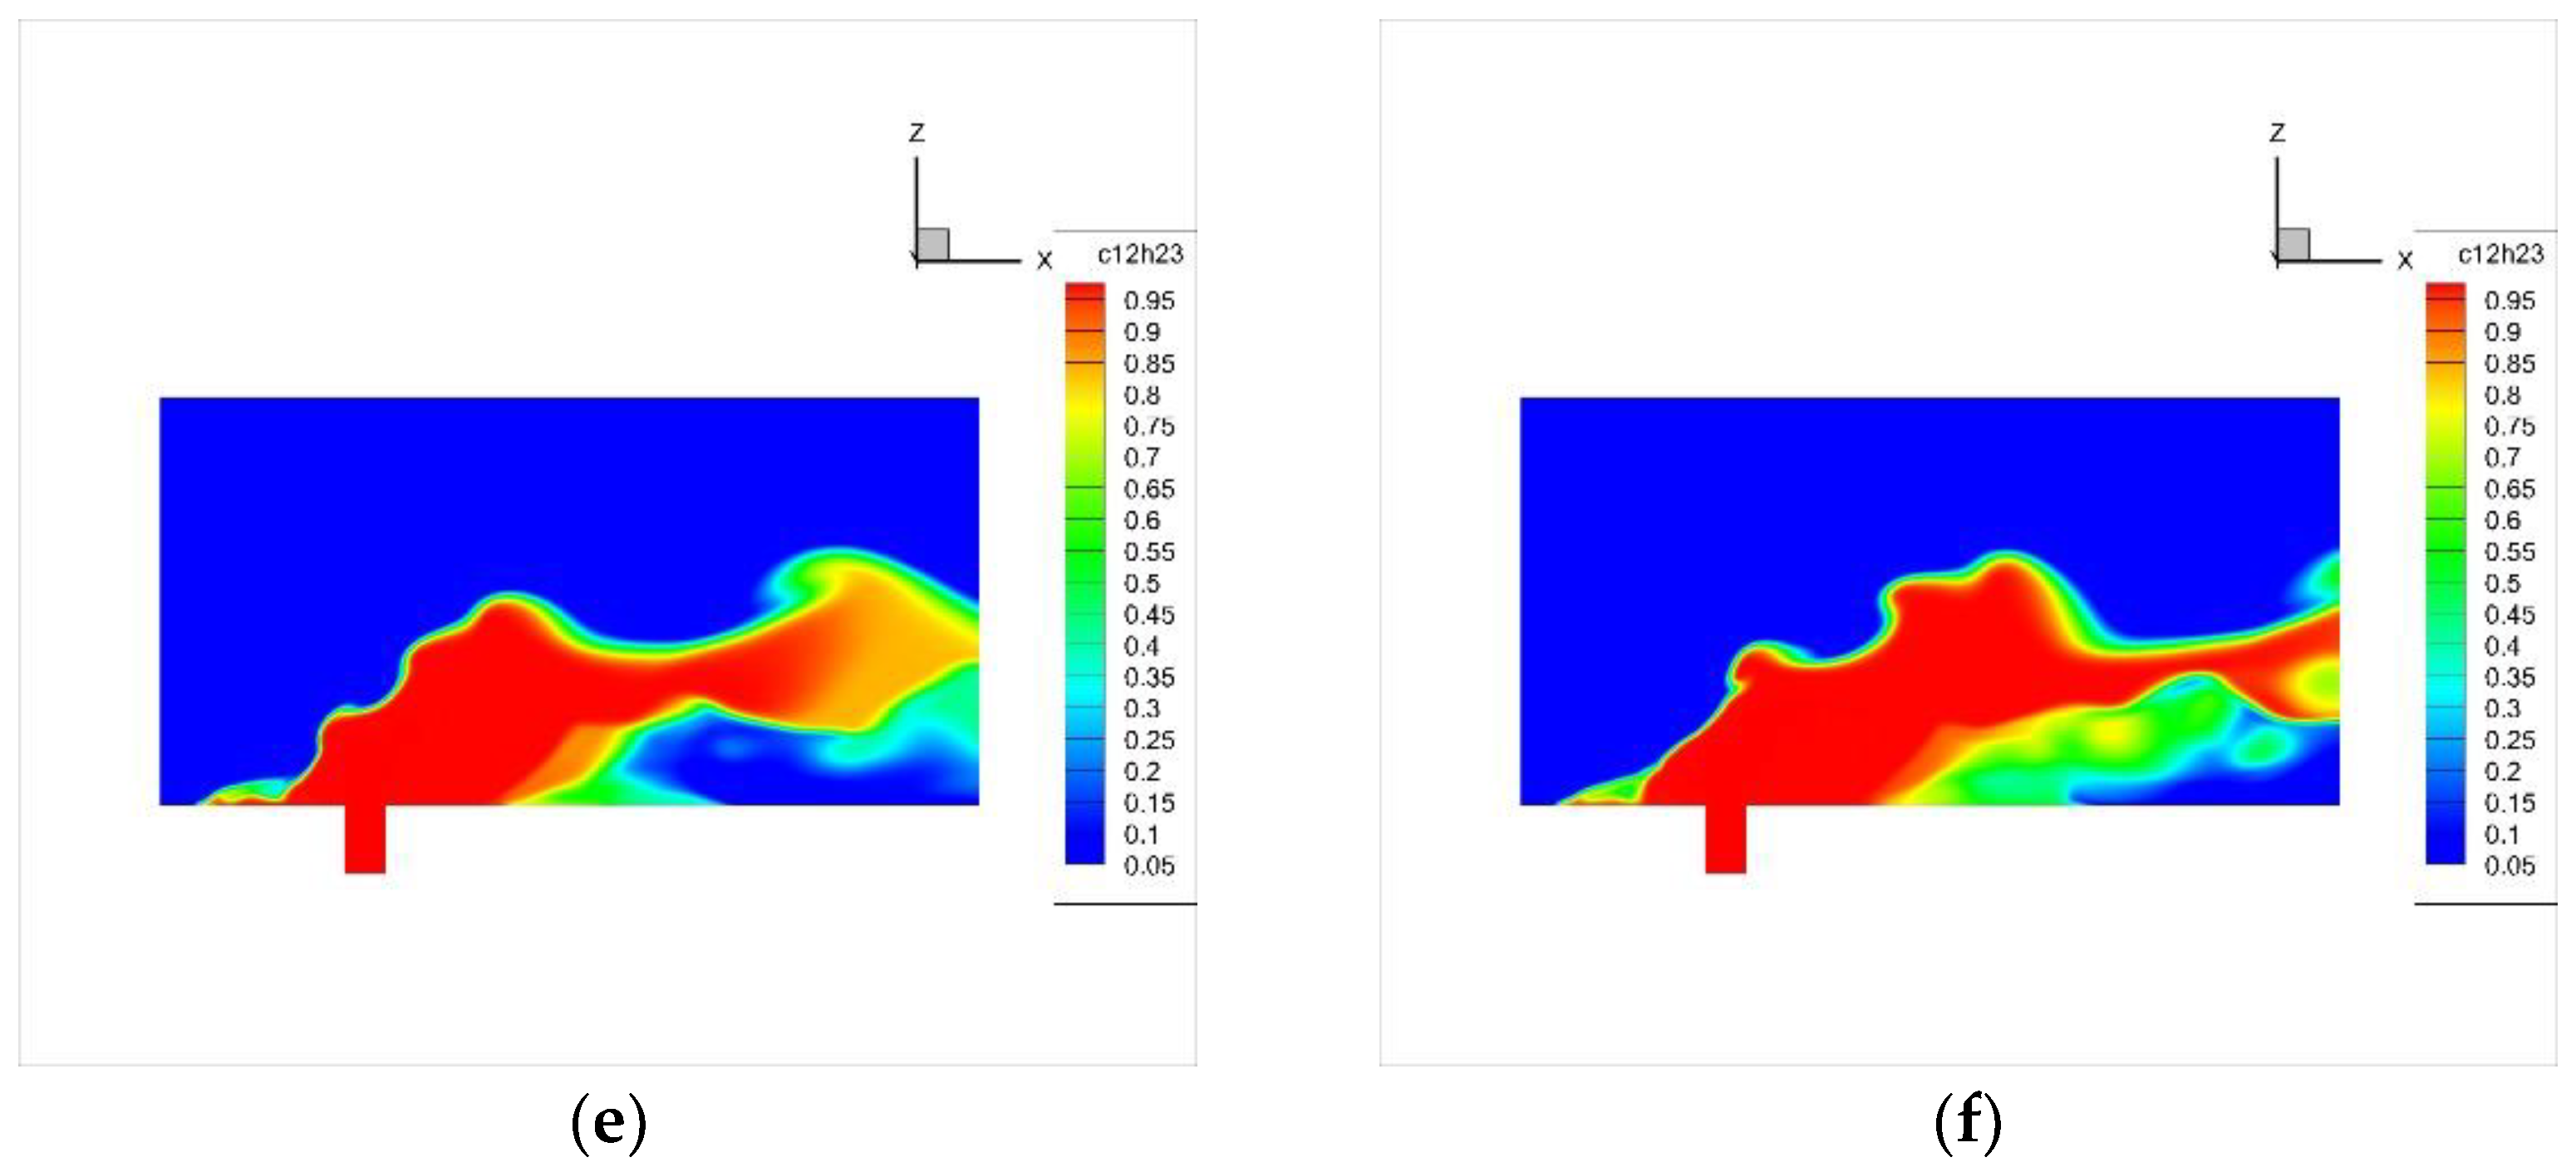
The evolution of the supercritical EHF jet with the contours of the mass fraction in supersonic crossflow is shown in Figure 8 (Case U3-2). The test conditions are Ma 2.8 incoming flow, 2.8 MPa injection pressure, and 740 K injection temperature (Test 3-2). As can be seen, a backflow area appears just after the fuel is injected into the crossflow, and part of the fuel enters upstream along the lower wall surface. The jet morphology displays strong instability.

4.2. Spatial Distribution

The central plane distribution of the EHF jet plume is investigated by the acetone PLIF method, and the instantaneous images of the fluorescence signal are shown in Figure 9 (Test 1-1). It can be seen that the large-scale eddy structures are in the shear layer between EHF and the main flow. The structure of the EHF jet plume is unsteady and greatly varies due to the effect of turbulence. The EHF concentration images are colored with the fluorescence signal intensity. To reduce the effects of laser sheet intensities and test environments, the fluorescence signal results are normalized.
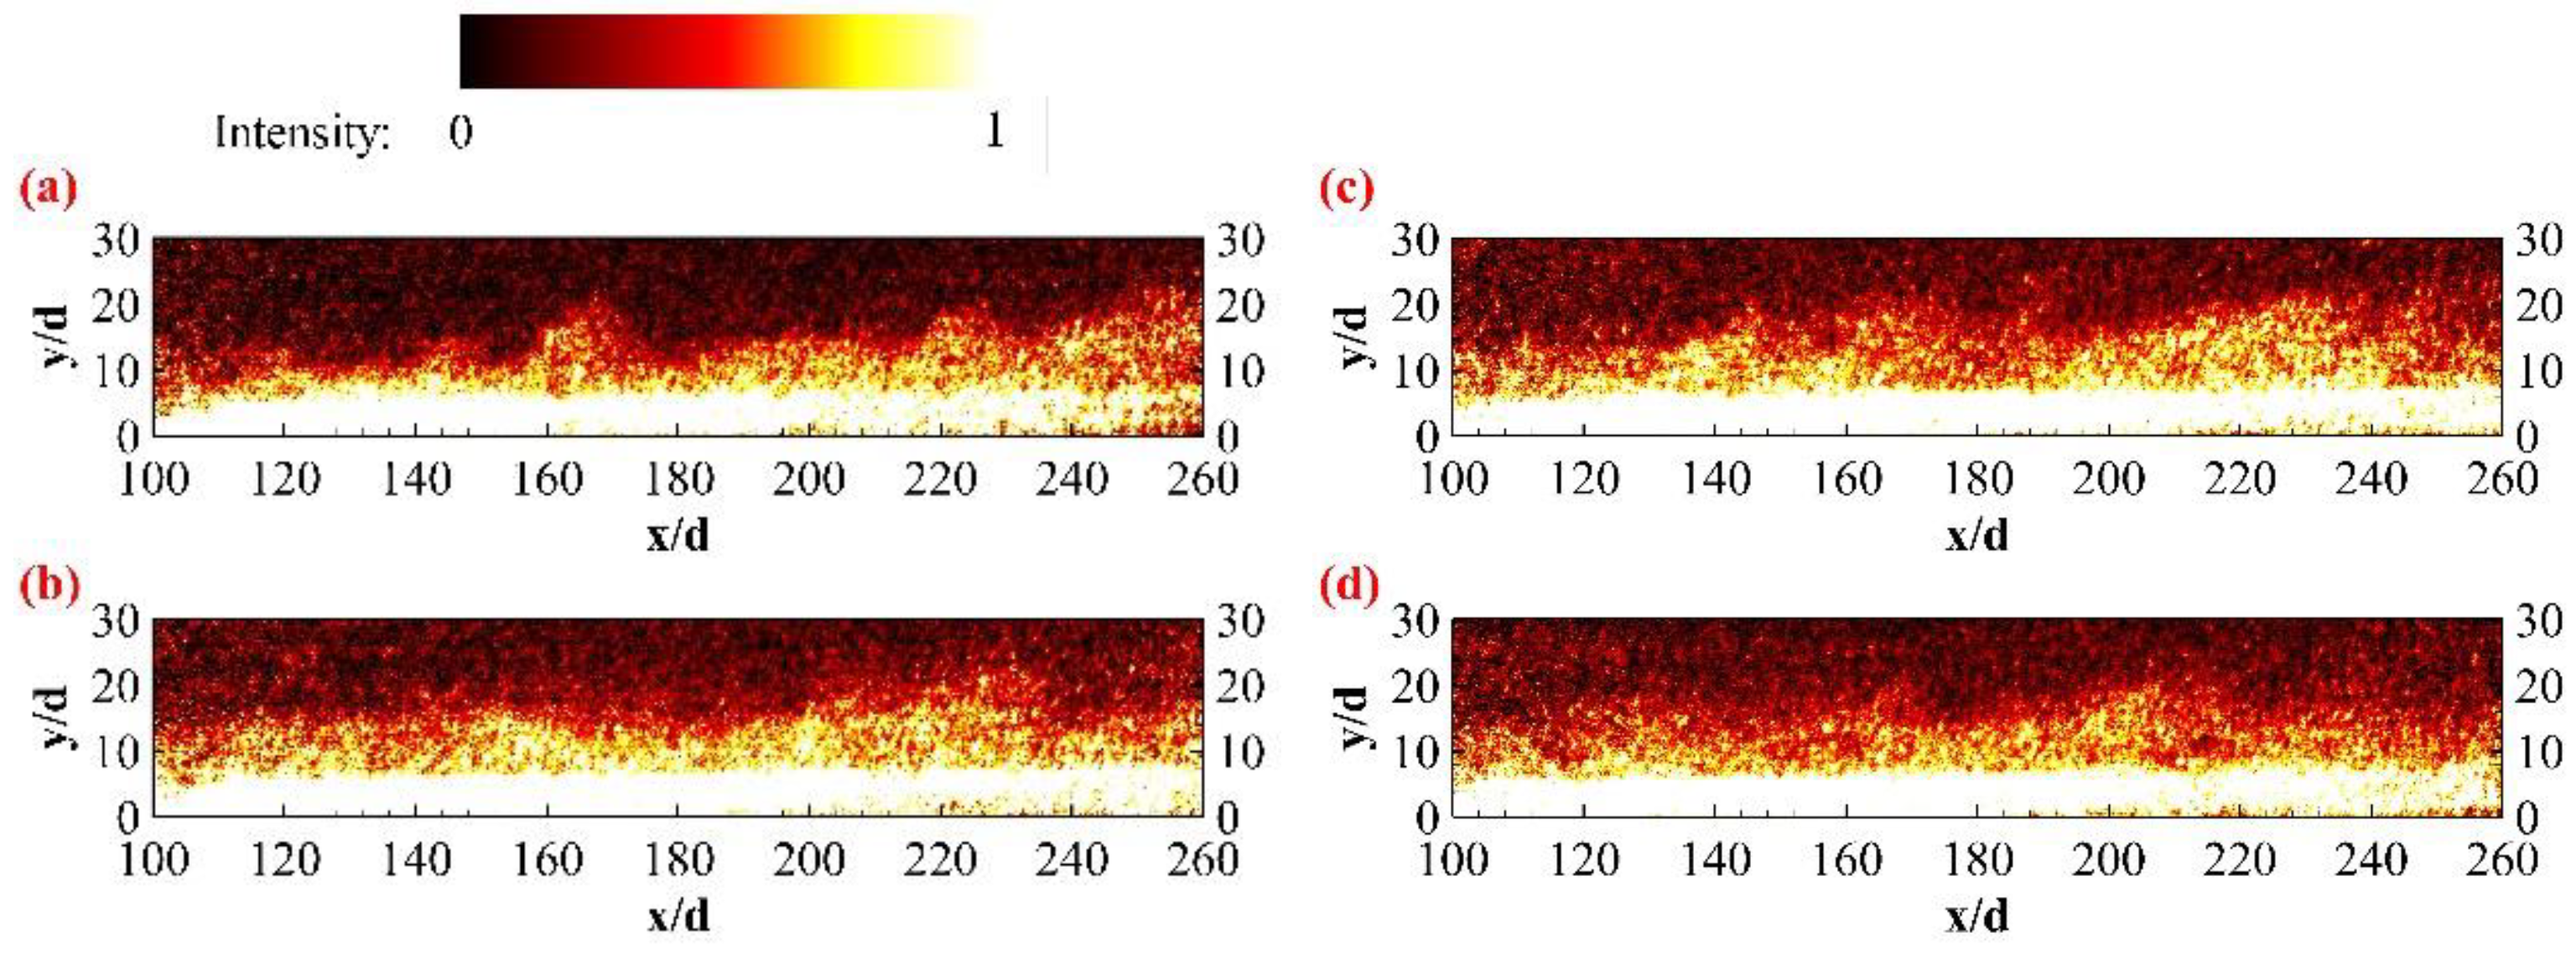
For the instantaneous images of the fluorescence signal, the EHF jet is unsteady and time-varying. Therefore, the statistical analysis of the EHF jet needs a spatial average and temporal average [33]. The average fluorescence signal image of the center-plane EHF jet is obtained from the experimental data under the Ma 2.0 conditions shown in Figure 10 (Tests 1-1, 1-2, 2-1, and 2-2). The regions with EHF plume are extracted, and the EHF concentration is colored in the distribution results. The EHF jet expands and mixes with the mainstream, and the traverse heights and high-concentration region increase with the streamwise distance increasing. For Ma = 2.0, the high-concentration region accounts for merely half of the jet plume with a distinct boundary.
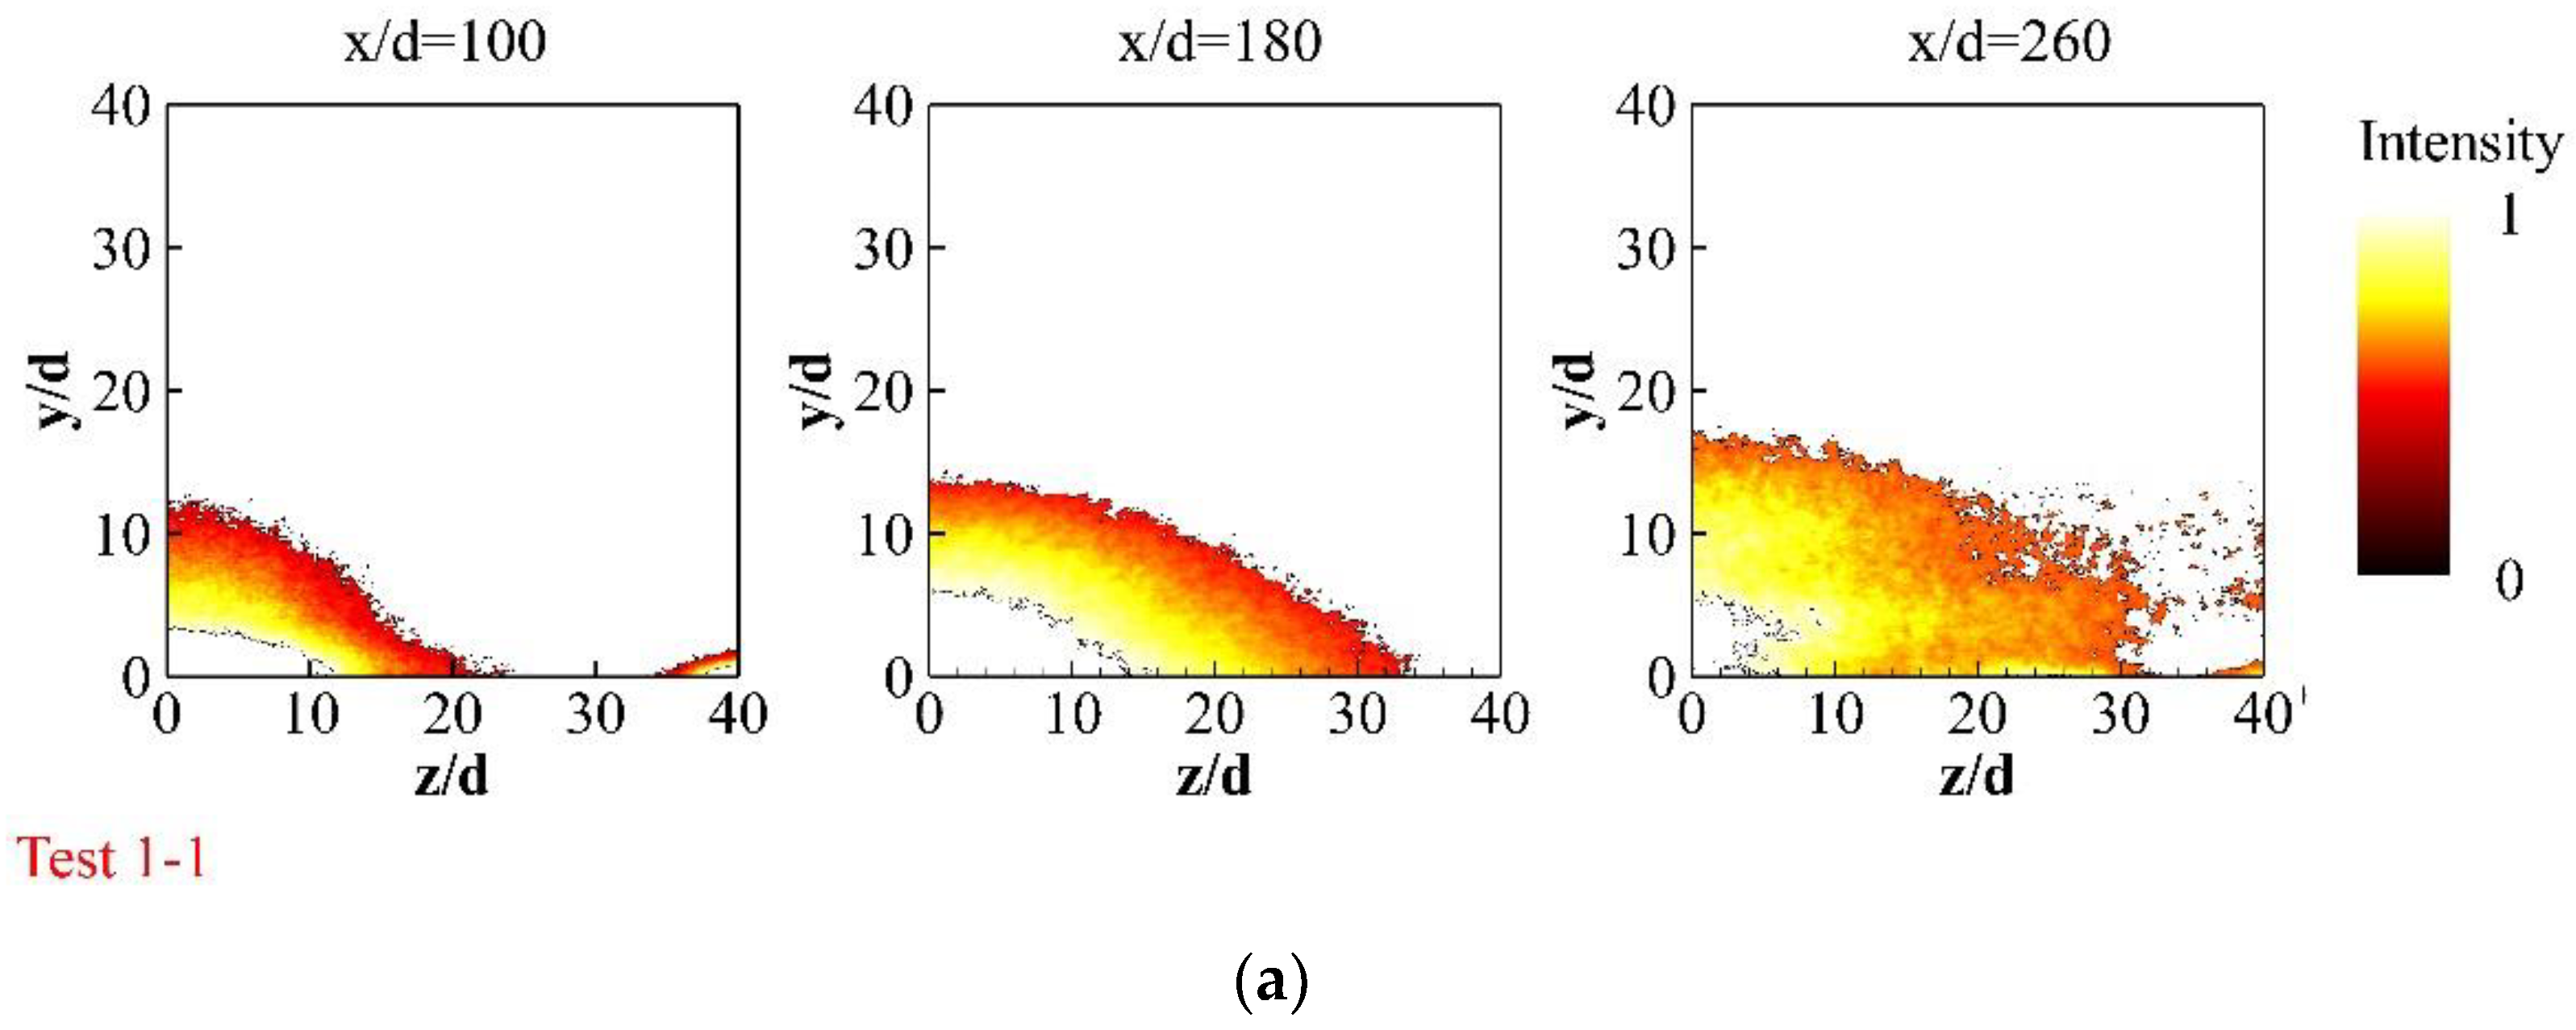
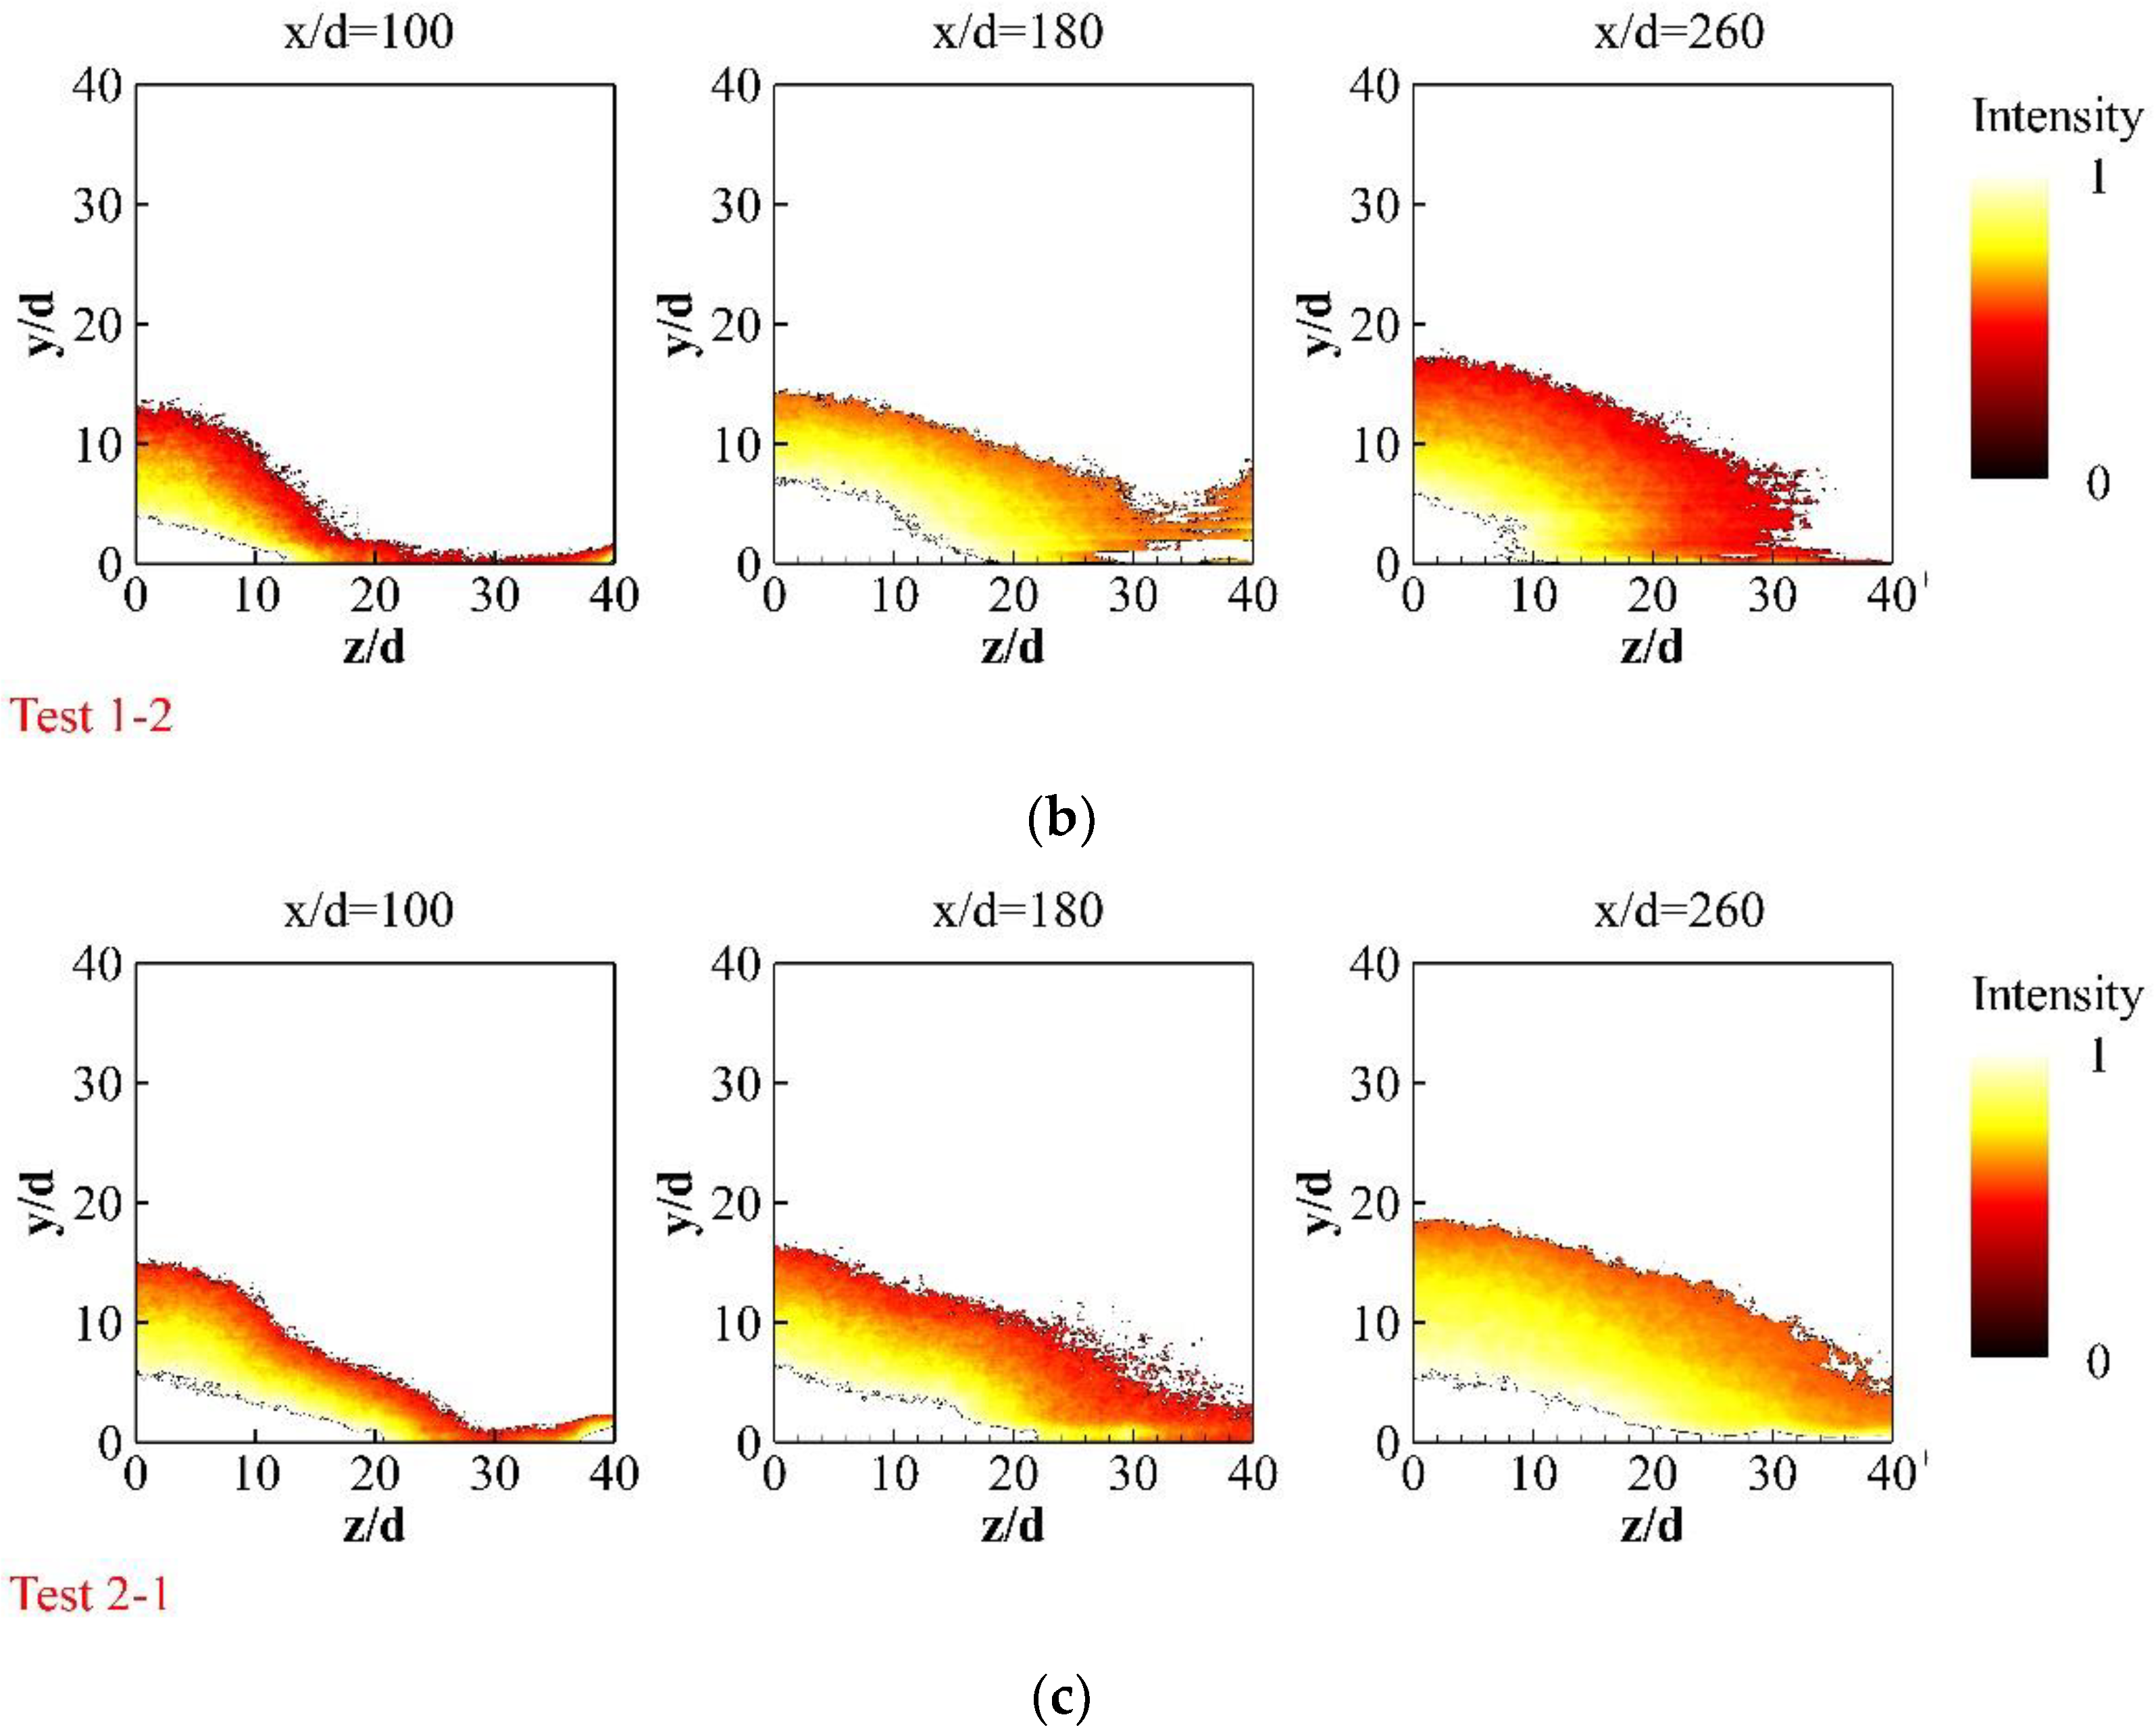
The evolution of the cross-sectional structure is also discussed based on the average fluorescence signal image of acetone PLIF. The structure and contour plots of the concentration components of the EHF jets in three different cross-sectional planes at x/d = 100, 180, and 260 are given in Figure 11 (Tests 1-1, 1-2, and 2-1). The EHF plume regions are extracted and colored in the concentration distribution. It can be seen that each figure presents a semicircle shape and expands with the x/d increasing. The semiwidths of the EHF jet are the same in the corresponding position under different injection temperatures for the 2.8 MPa injection pressure (Figure 11a,b), which increases from 20d to 30d. Comparing the semiwidth between the different injection pressures (Figure 11b,c), it expands more under 4.2 MPa with a similar q. An increase in semiwidth obviously occurs at the cross-sectional plane of x/d = 180 but disappears at x/d = 260. The high-concentration region of the EHF jet appears in the bottom region of the cross-sectional plane, which is in excellent agreement with the central distribution. It decreases from the bottom region to the periphery.
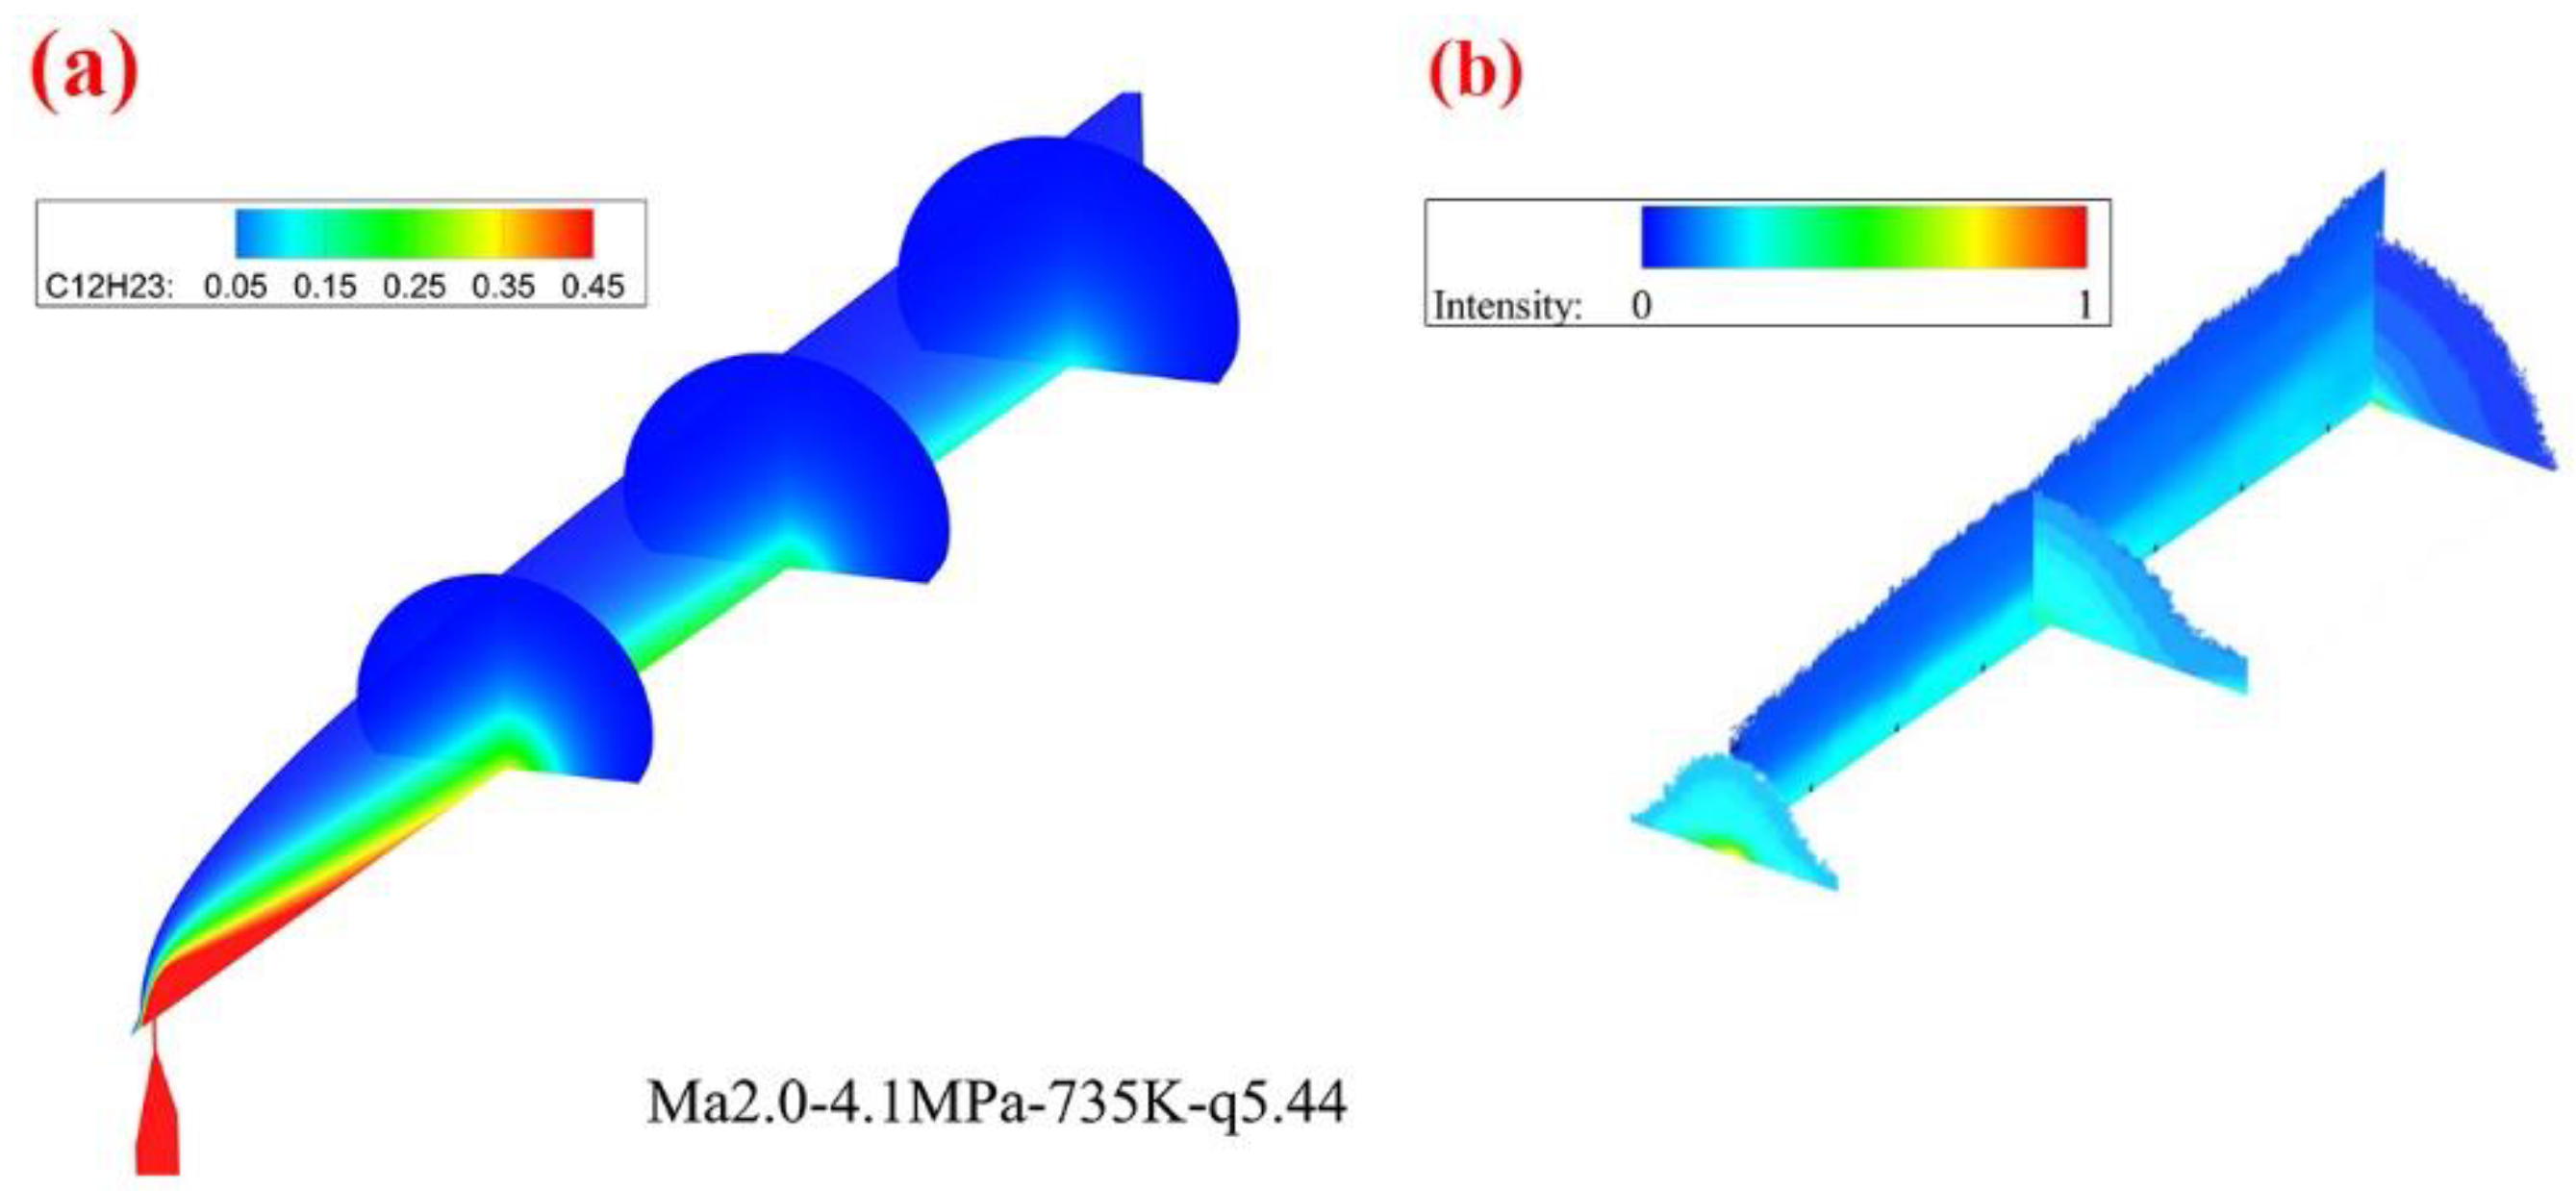
Figure 12 shows the numerical results (Figure 12a) and experimental results (Figure 12b) of the fuel concentration distribution for Ma 2.0, injection pressure 4.1 MPa, and injection temperature 735 K (Test 2-2). It can be seen that the simulation fuel concentration distribution is consistent with the experimental results at the center section and cross-sections. The concentration decreases in different cross-sections along the flow and spread directions.
The structure of the flow field and the EHF distribution have different characteristics for different injection and incoming flow conditions. Figure 13 shows the calculated fuel mass fraction for the four injection conditions in the Ma 2.0 crossflow. The simulated concentration at the center section and cross-sections at x/d = 100, 180, and 260 and the equivalent surface with the mass fraction of 0.005 are also shown in the contour. It can be seen that the mass fraction distribution shows similar characteristics under different working conditions. The 0.005 mass fraction equivalent surface is used as the jet boundary. The increase in pressure will greatly expand the fuel distribution range, whereas the effect of temperature on fuel distribution is more significant at high injection pressure; moreover, the higher the temperature, the smaller the mass fraction equivalent surface distribution range, which may be since the increase in temperature will accelerate the diffusion rate, which, in turn, will cause the concentration to drop faster.

4.3. Mixing Characteristics

4.3.1. Concentration Distribution

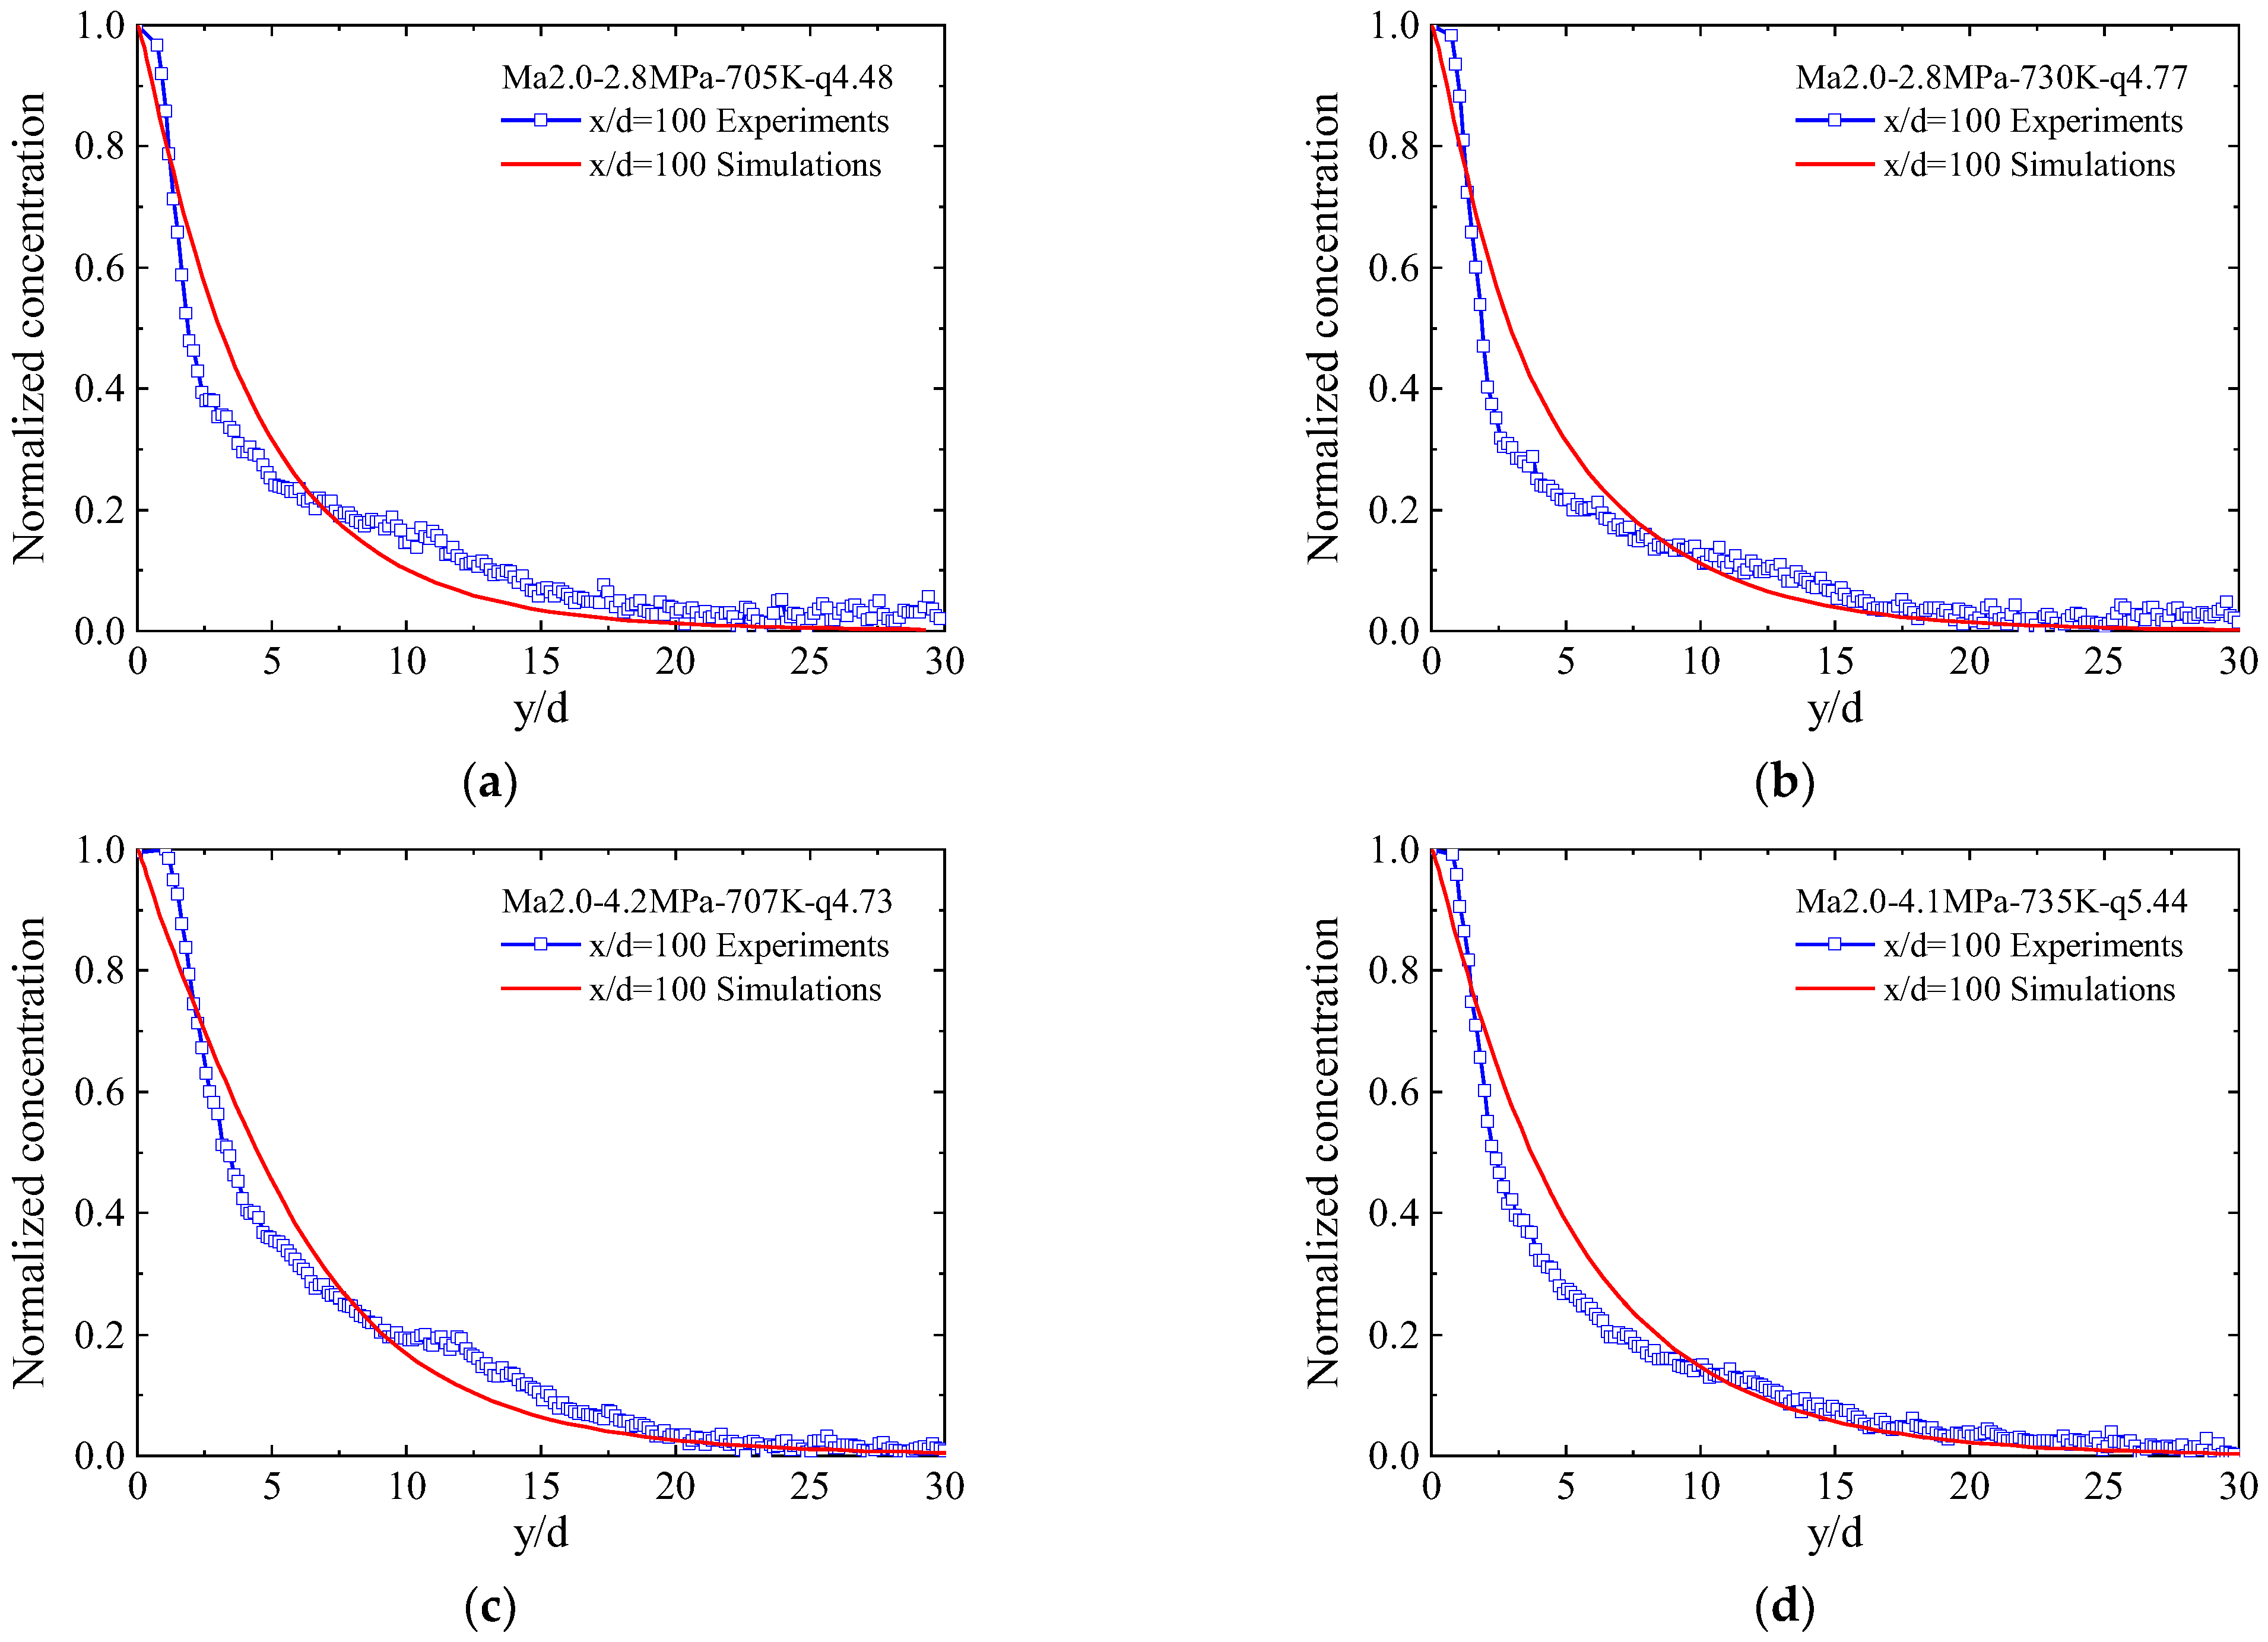
Figure 14 compares the concentration curves of the EHF jet obtained from experiments and simulations. The curve data are extracted and normalized from the central contour plots for plume concentration in streamwise distance x/d = 100 at different injection conditions under Ma 2.0 incoming flow (Tests 1-1, 1-2, 2-1, and 2-2). It can be seen that the experimental and simulation results are consistent with each other. With the increase in the penetration depth (y/d), the concentration distribution shows a fast and then slow power exponential decreasing law. The results verify the correctness of the simulation. In addition, it can be seen that the experimentally measured concentration decrease rate is generally higher than that of the simulation measurements.
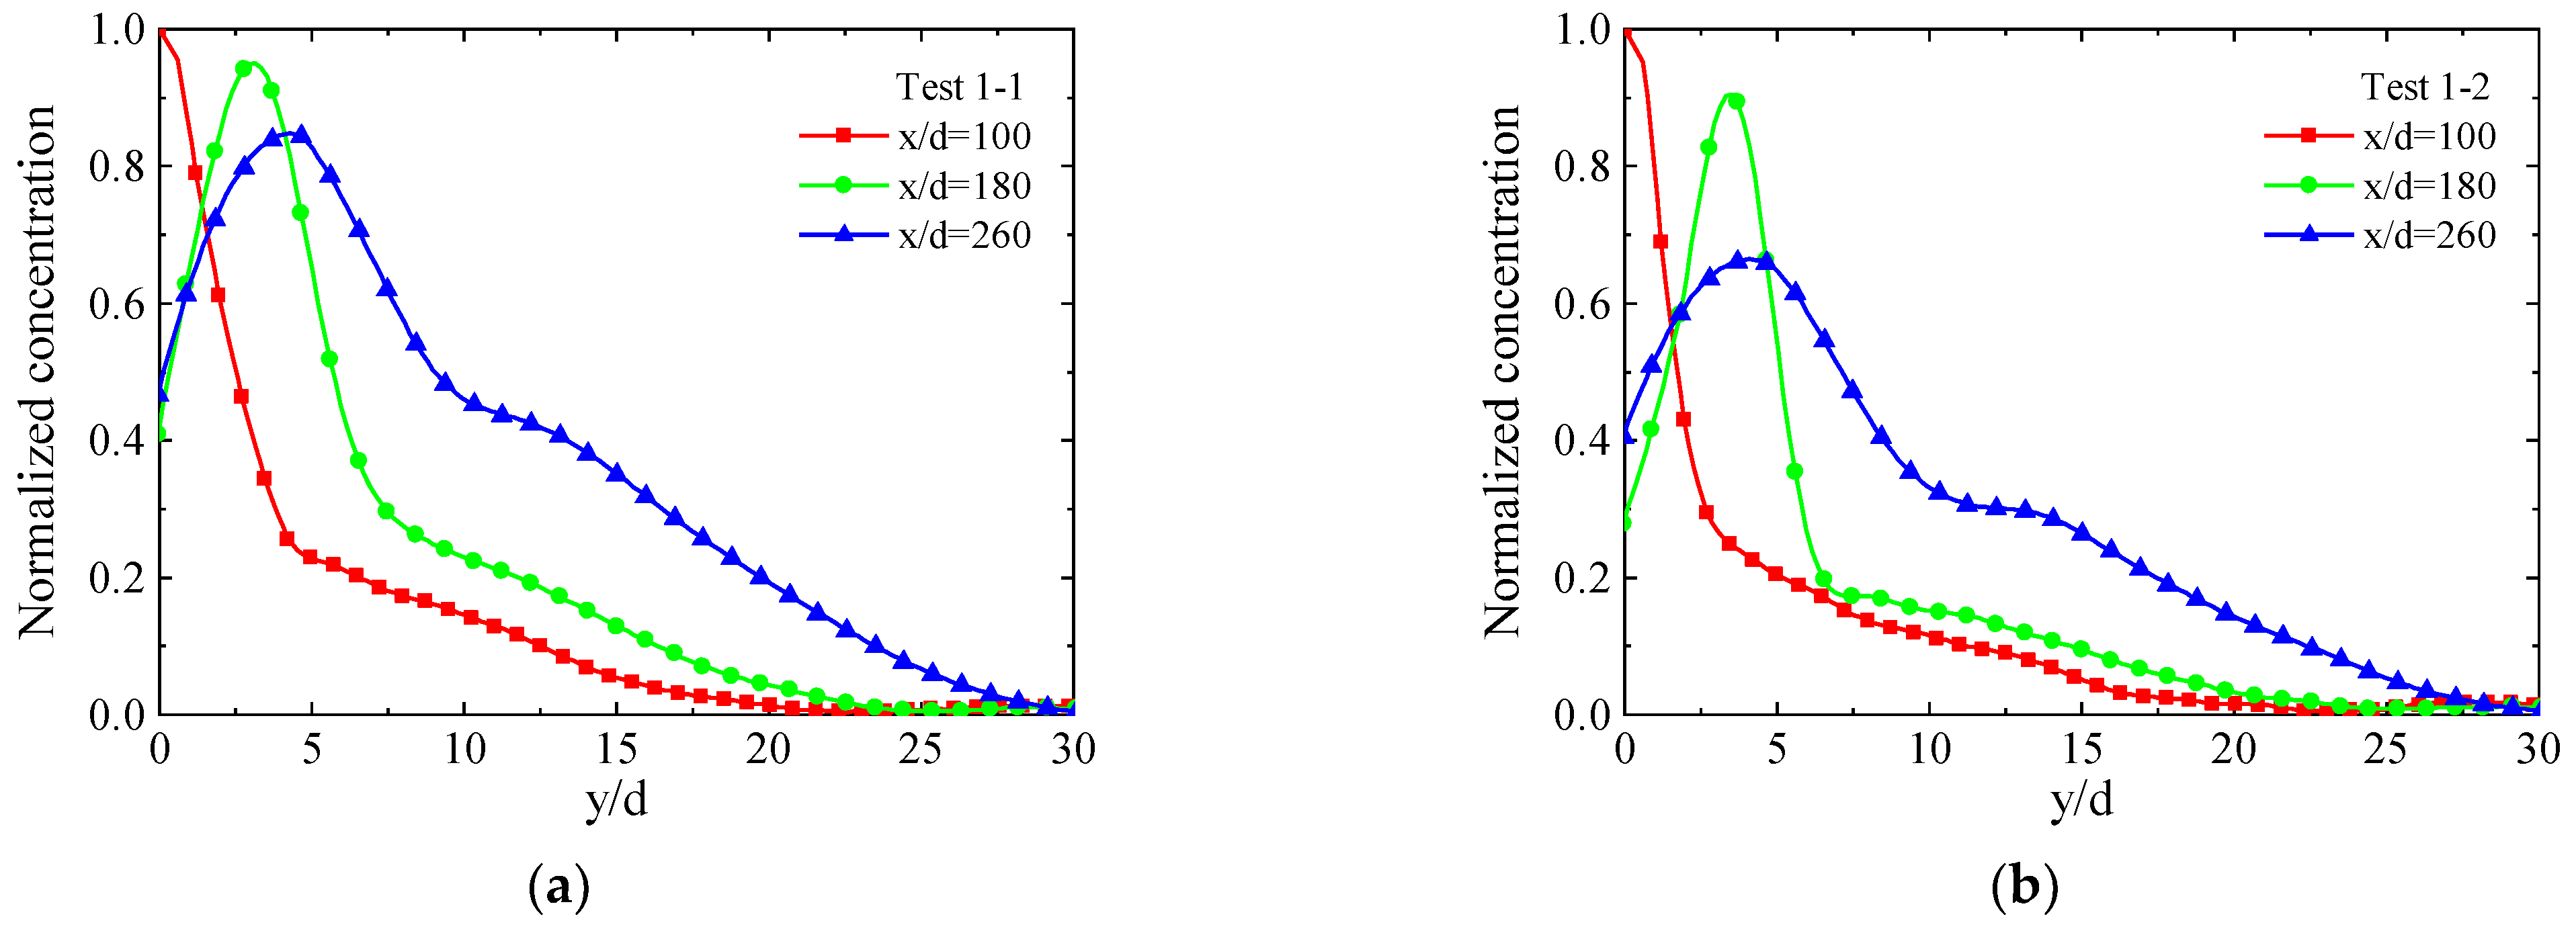
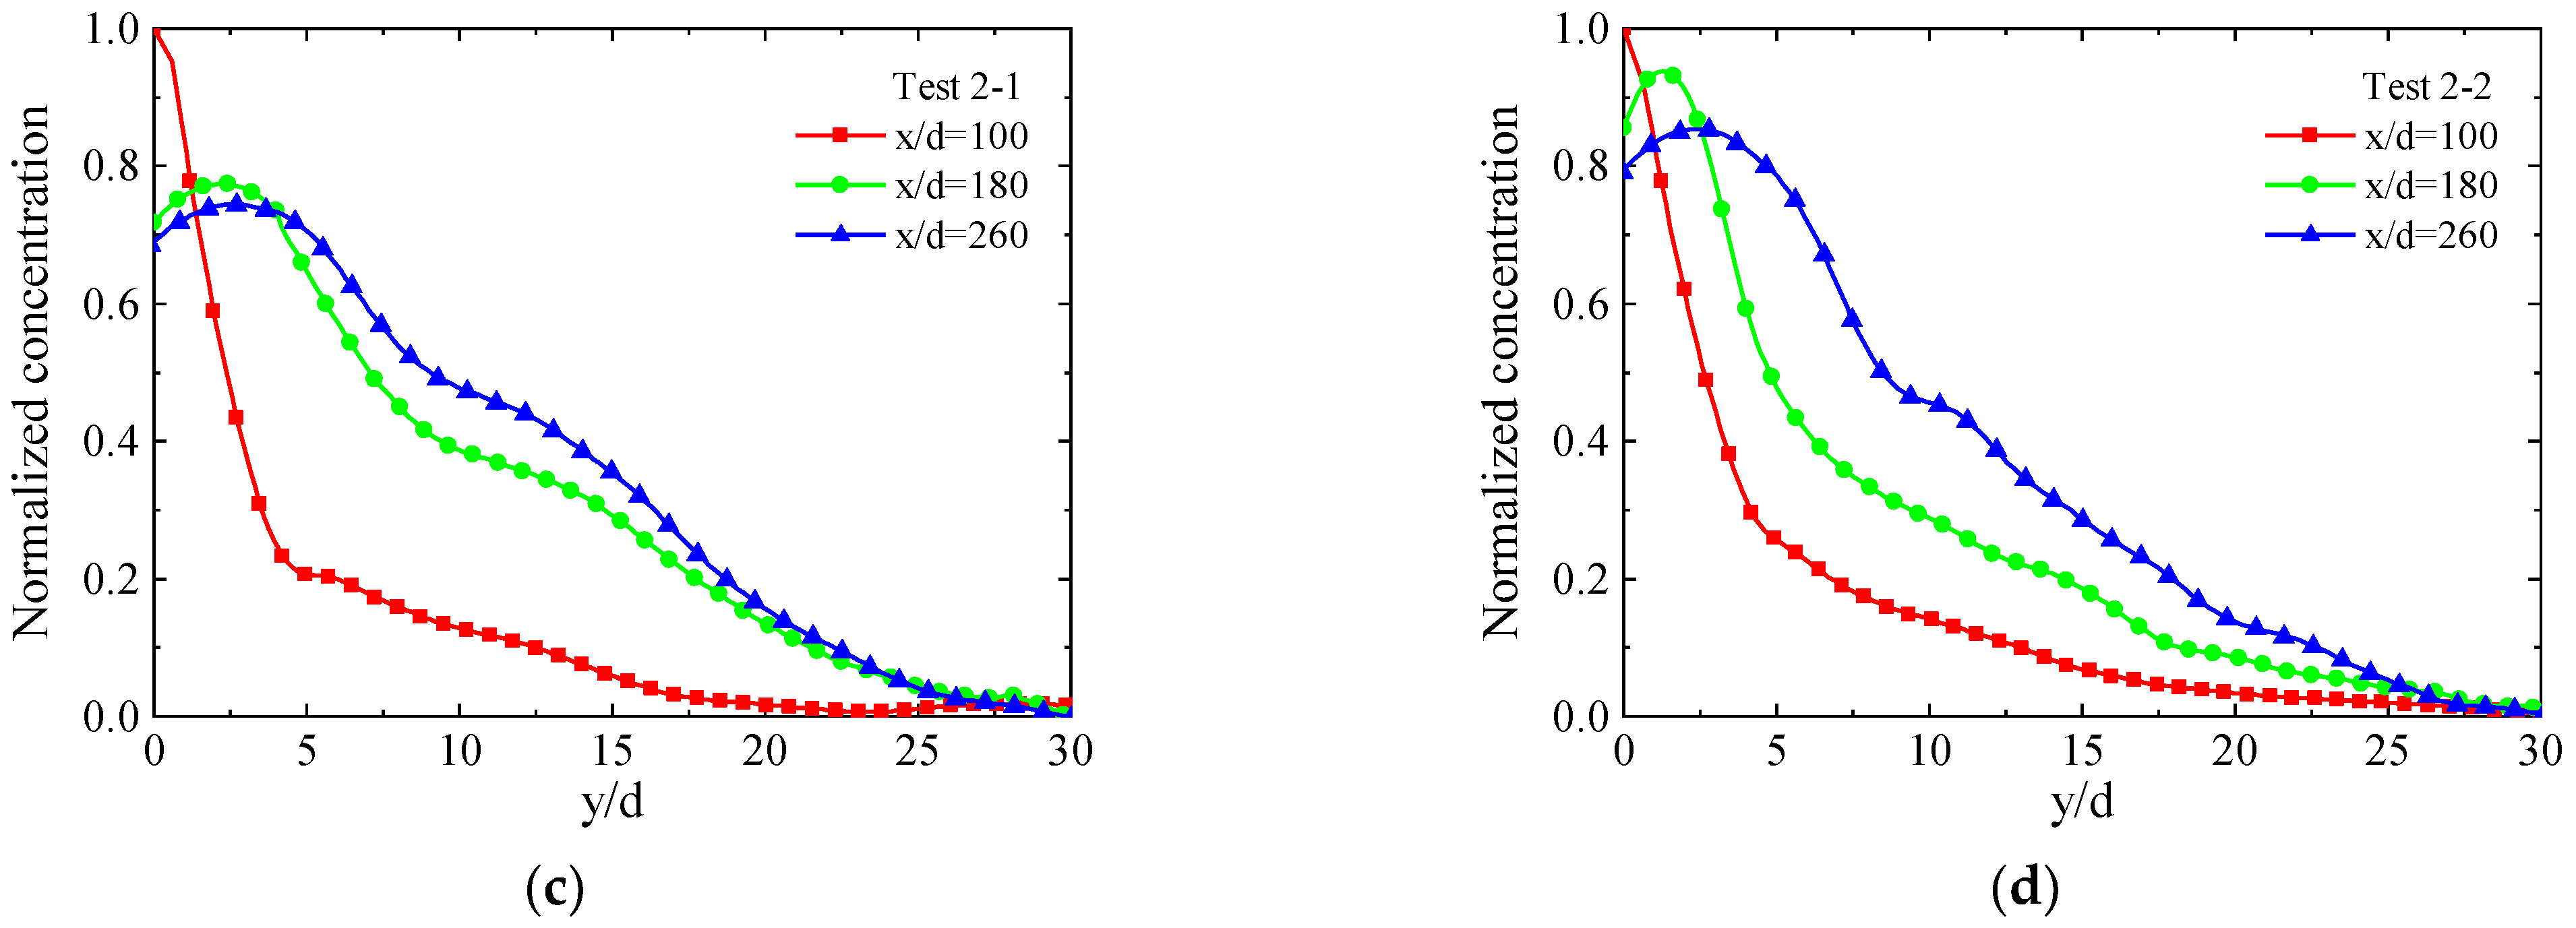
Figure 15 shows the concentration curves of the EHF jet along the flow direction at Ma 2.0 (Tests 1-1, 1-2, 2-1, and 2-2). The curve data are extracted and normalized from the central concentration contour for the EHF plume at flow distances x/d of 100, 180, and 260. As can be seen, the highest concentration point starts from the near-wall region (x/d = 100) and rises in the y direction with the streamwise distance increasing (x/d = 180 and 260), which is in good agreement with the cross-sectional distribution.
The relative values of the highest concentration points for x/d = 100 to 260 gradually decrease. x/d = 100 has a more variable concentration curve, indicating that most of the EHF components are confined within the limited space of the bottom wall, whereas the concentration curve for x/d = 260 tends to be smooth and flat.

4.3.2. Mixing Efficiency

The mixing efficiency, η m , is defined as that fraction of the least available reactant that would react if the fuel–air mixture was brought to chemical equilibrium without additional local or global mixing. In fuel-rich regions, all of the local oxygen is considered “mixed”, whereas in fuel-lean regions, all of the fuel is mixed. The definition of mixing efficiency is [34]
η m = m ˙ fuel , mix m ˙ fuel , total = A α R ρ u d A A α ρ u d A
where m ˙ fuel ,   mix is the mixed fuel mass flow rate, m ˙ fuel ,   total is the total fuel mass flow rate from flow-field integration, A is the area enclosed by zero fuel defining the extent of the mixing region, and α is the fuel mass fraction:
α R = α                                                   w h e r e   α α s 1 α 1 α s α s                           w h e r e   α > α s              
and α s is the fuel stoichiometric mass fraction (0.062); when α max < α s , η m equals 1.0.
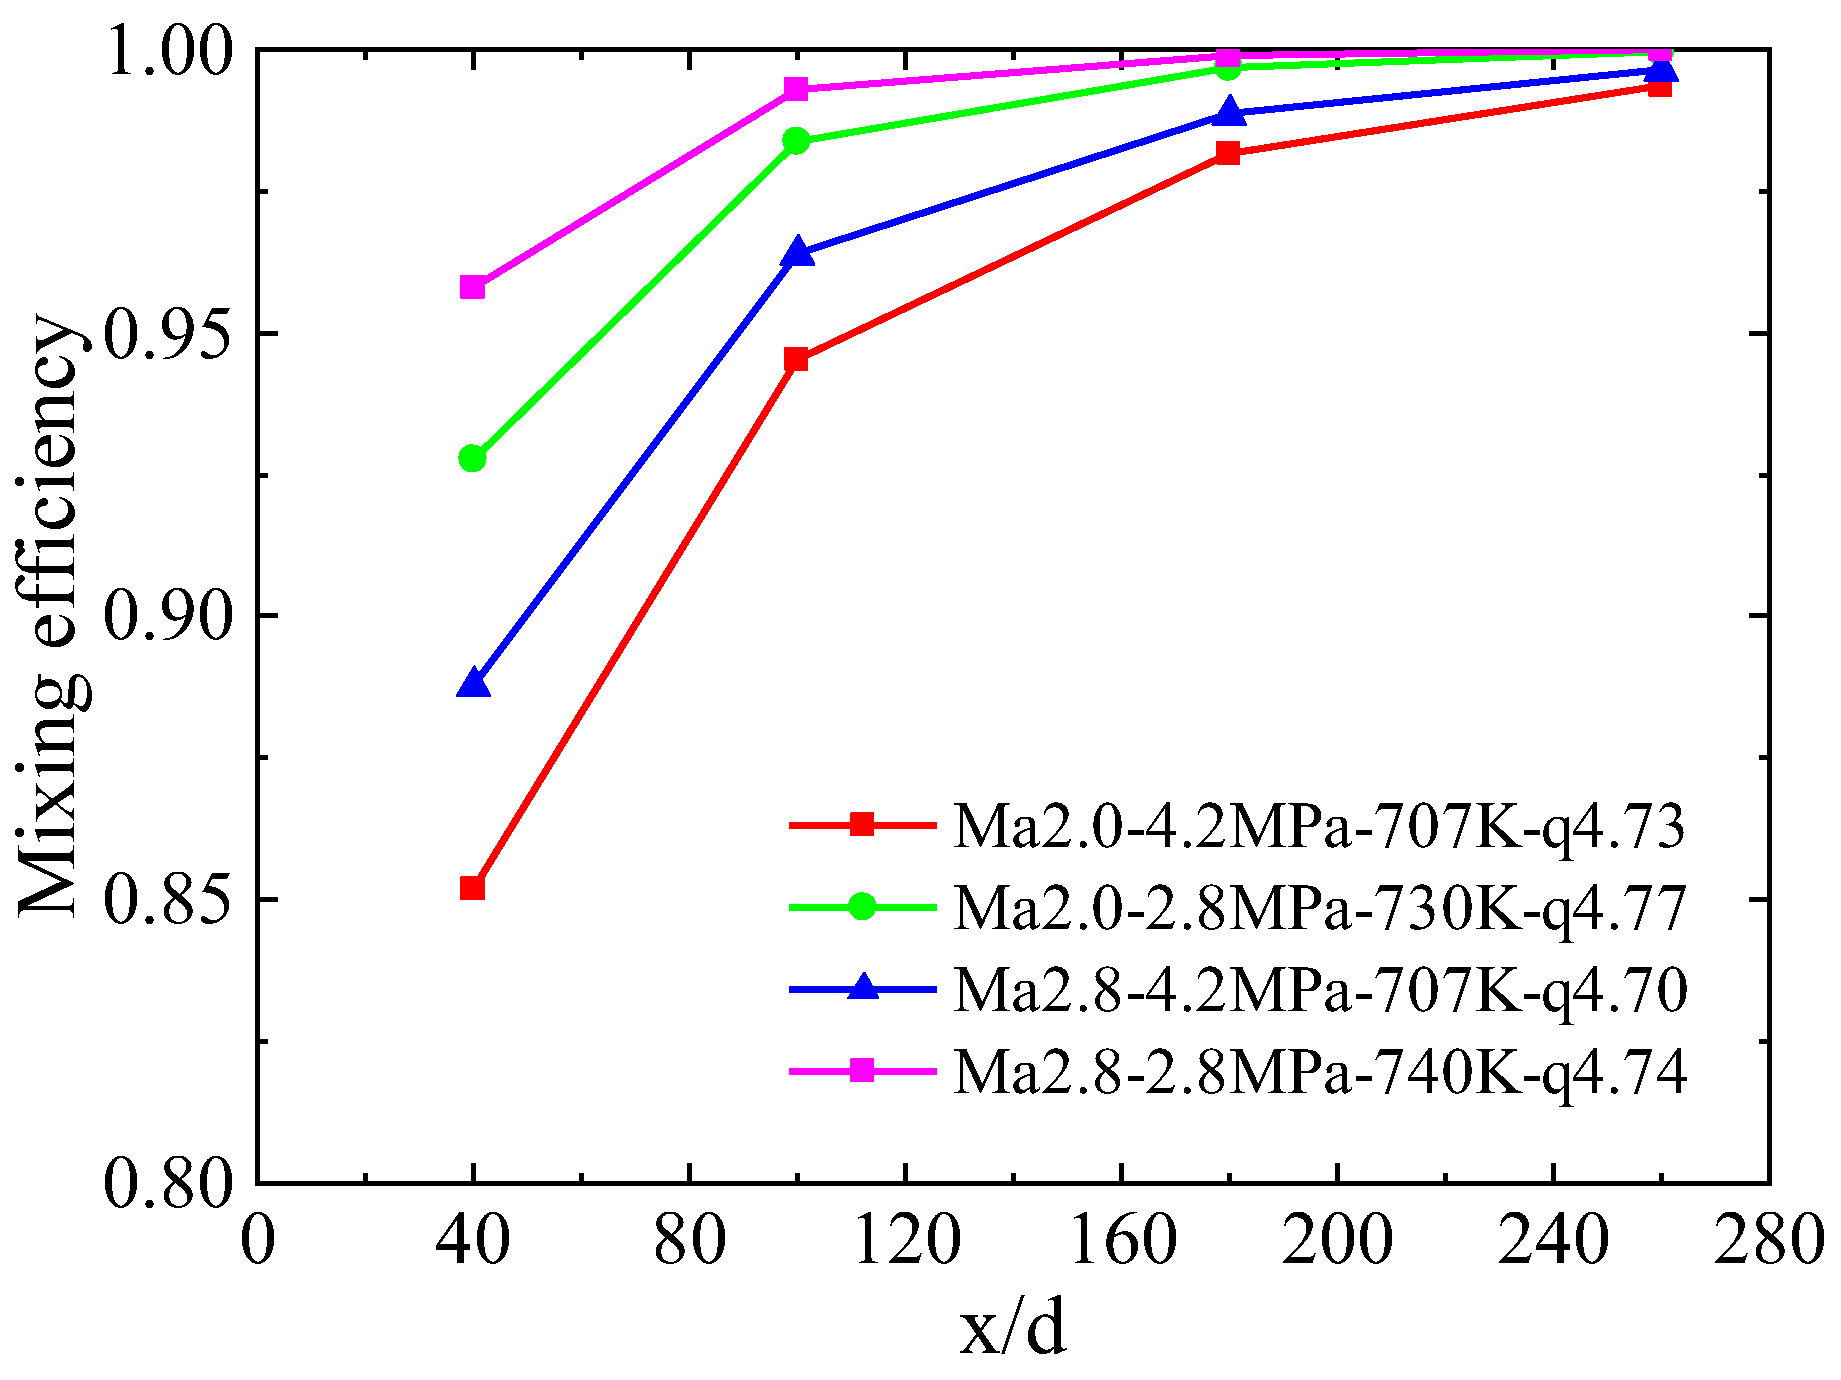
A comparison of the mixing efficiency for the two injection conditions at different incoming Mach numbers is given in Figure 16. The cross-sections are selected from the flow distance x/d = 40, 100, 180, and 260, respectively. As can be seen, the mixing efficiency integrally increases with the location of the distance from the nozzle and infinitely tends to 1. For the same injection condition, the higher the incoming Mach number, the higher the mixing efficiency. This trend is consistent with the concentration distribution results obtained from the experimental study in the previous section. The higher the Mach number of the incoming flow, the faster the flow speed, and the greater the degree of wrapping on the jet, which accelerates the mixing process between the fuel and incoming air, making the mixing efficiency higher.
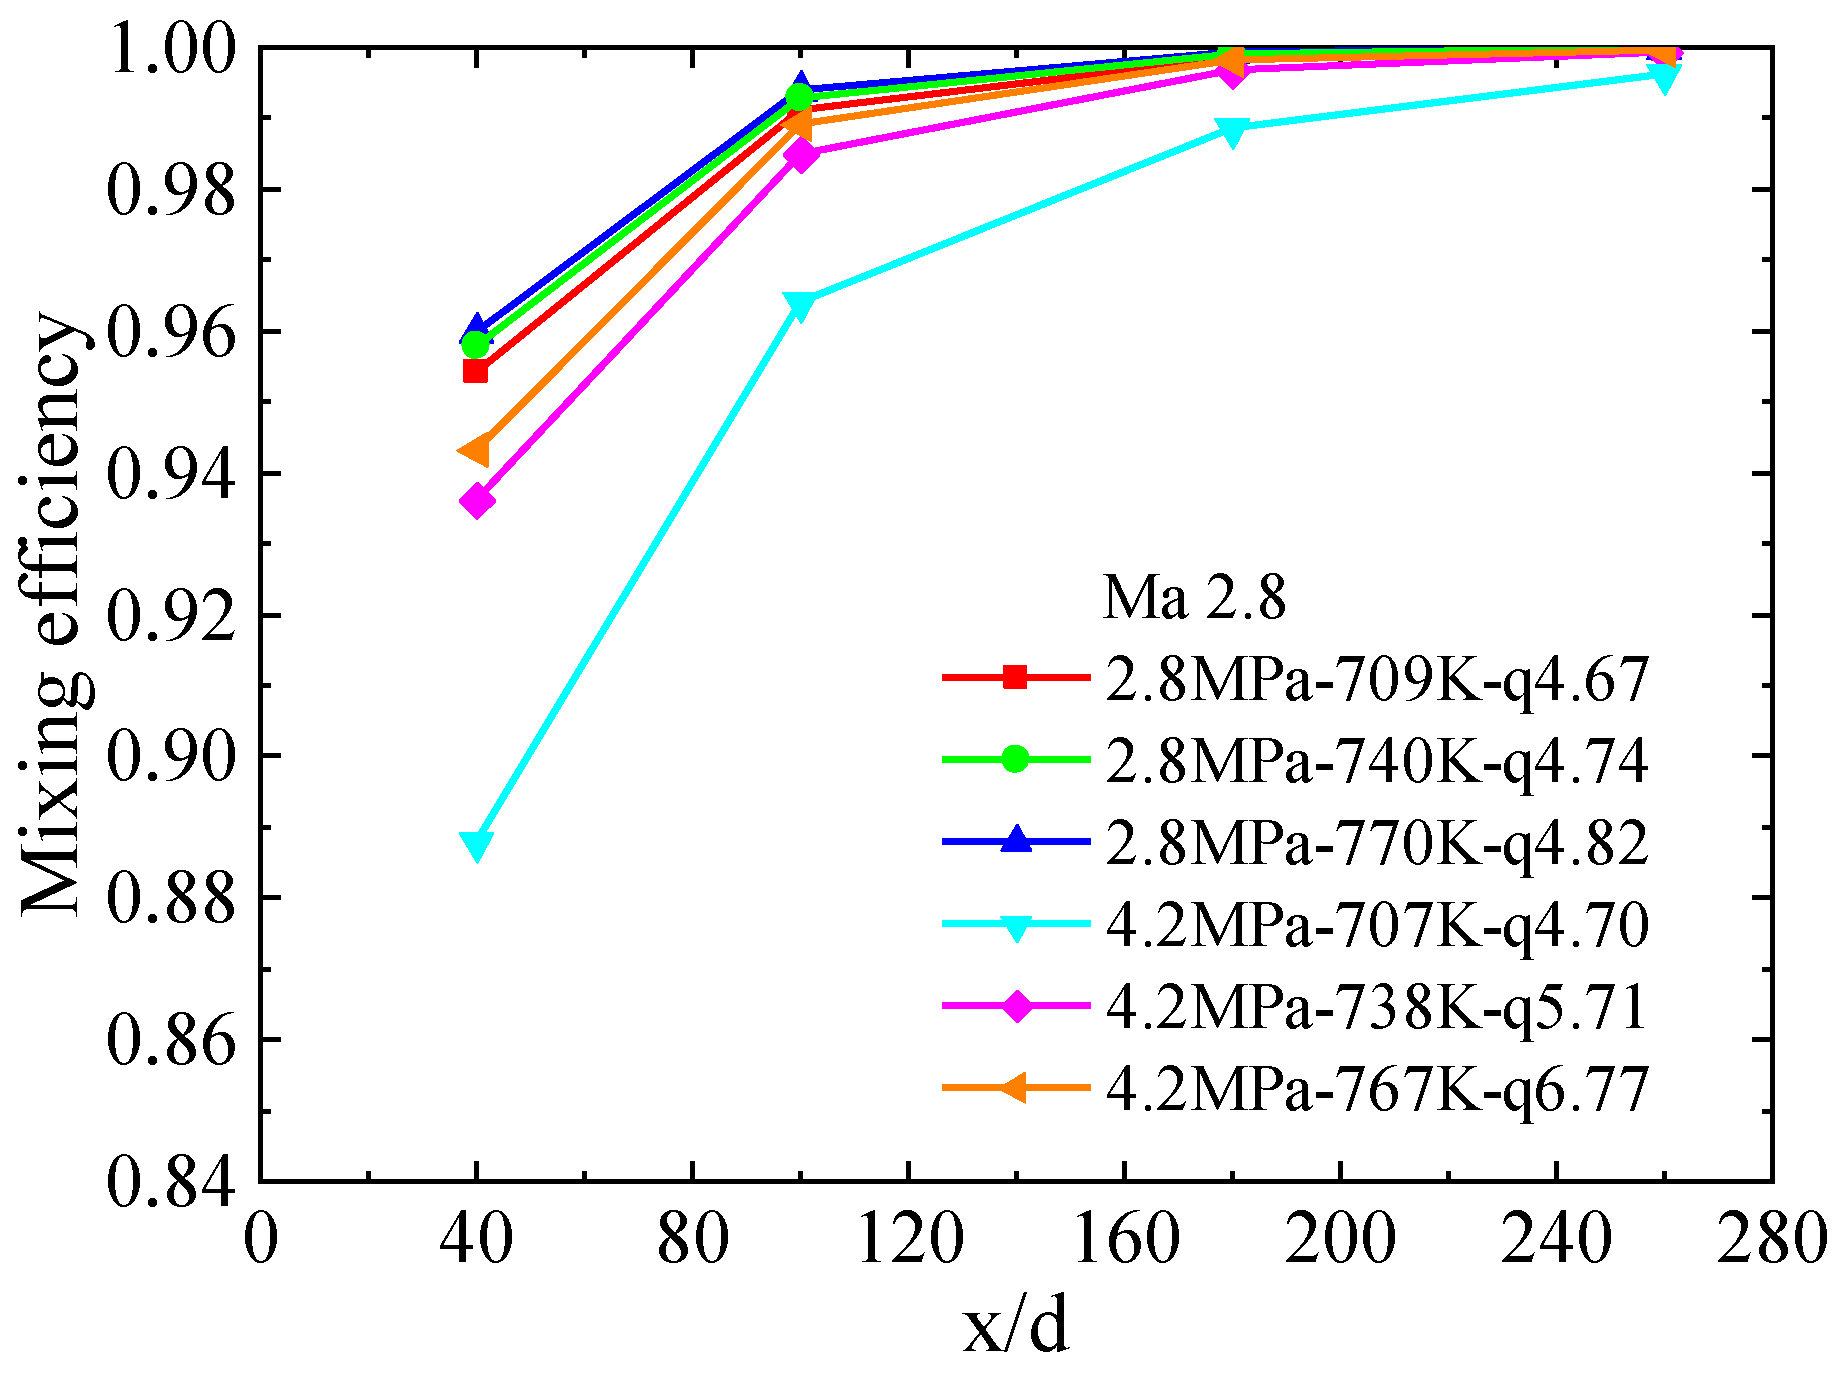
To compare the effect of different injection conditions on the mixing efficiency at the same incoming Mach number, a comparison of the mixing efficiency at different injection temperatures for two injection pressures at Ma 2.8 incoming flow is presented in Figure 17. It can be seen that the mixing is better for the case with low injection pressure because the low injection pressure corresponds to a lower flow rate, and it is easier to achieve a better oxygen-enriched state as expected by Equation (13) compared with the case with high pressure. In addition, the higher the injection temperature, the better the mixing efficiency. This pattern is also consistent with the findings of the previous section, where an increase in temperature enhances the diffusivity of the fuel, which, in turn, leads to better mixing with the air. However, the degree of improvement in mixing efficiency due to the increase in temperature tends to diminish as the temperature gets higher. Compared with the change in mixing efficiency from 700 K to 730 K, the increase in mixing efficiency due to the change in temperature from 730 K to 770 K is not significant. The increase in temperature during supercritical-state injection has an upper limit on the improvement of mixing efficiency. The effect of increased temperature on mixing efficiency is more significant for high-pressure conditions than for low-pressure conditions, which indicates that high injection pressure enhances the sensitivity of mixing efficiency to temperature changes.

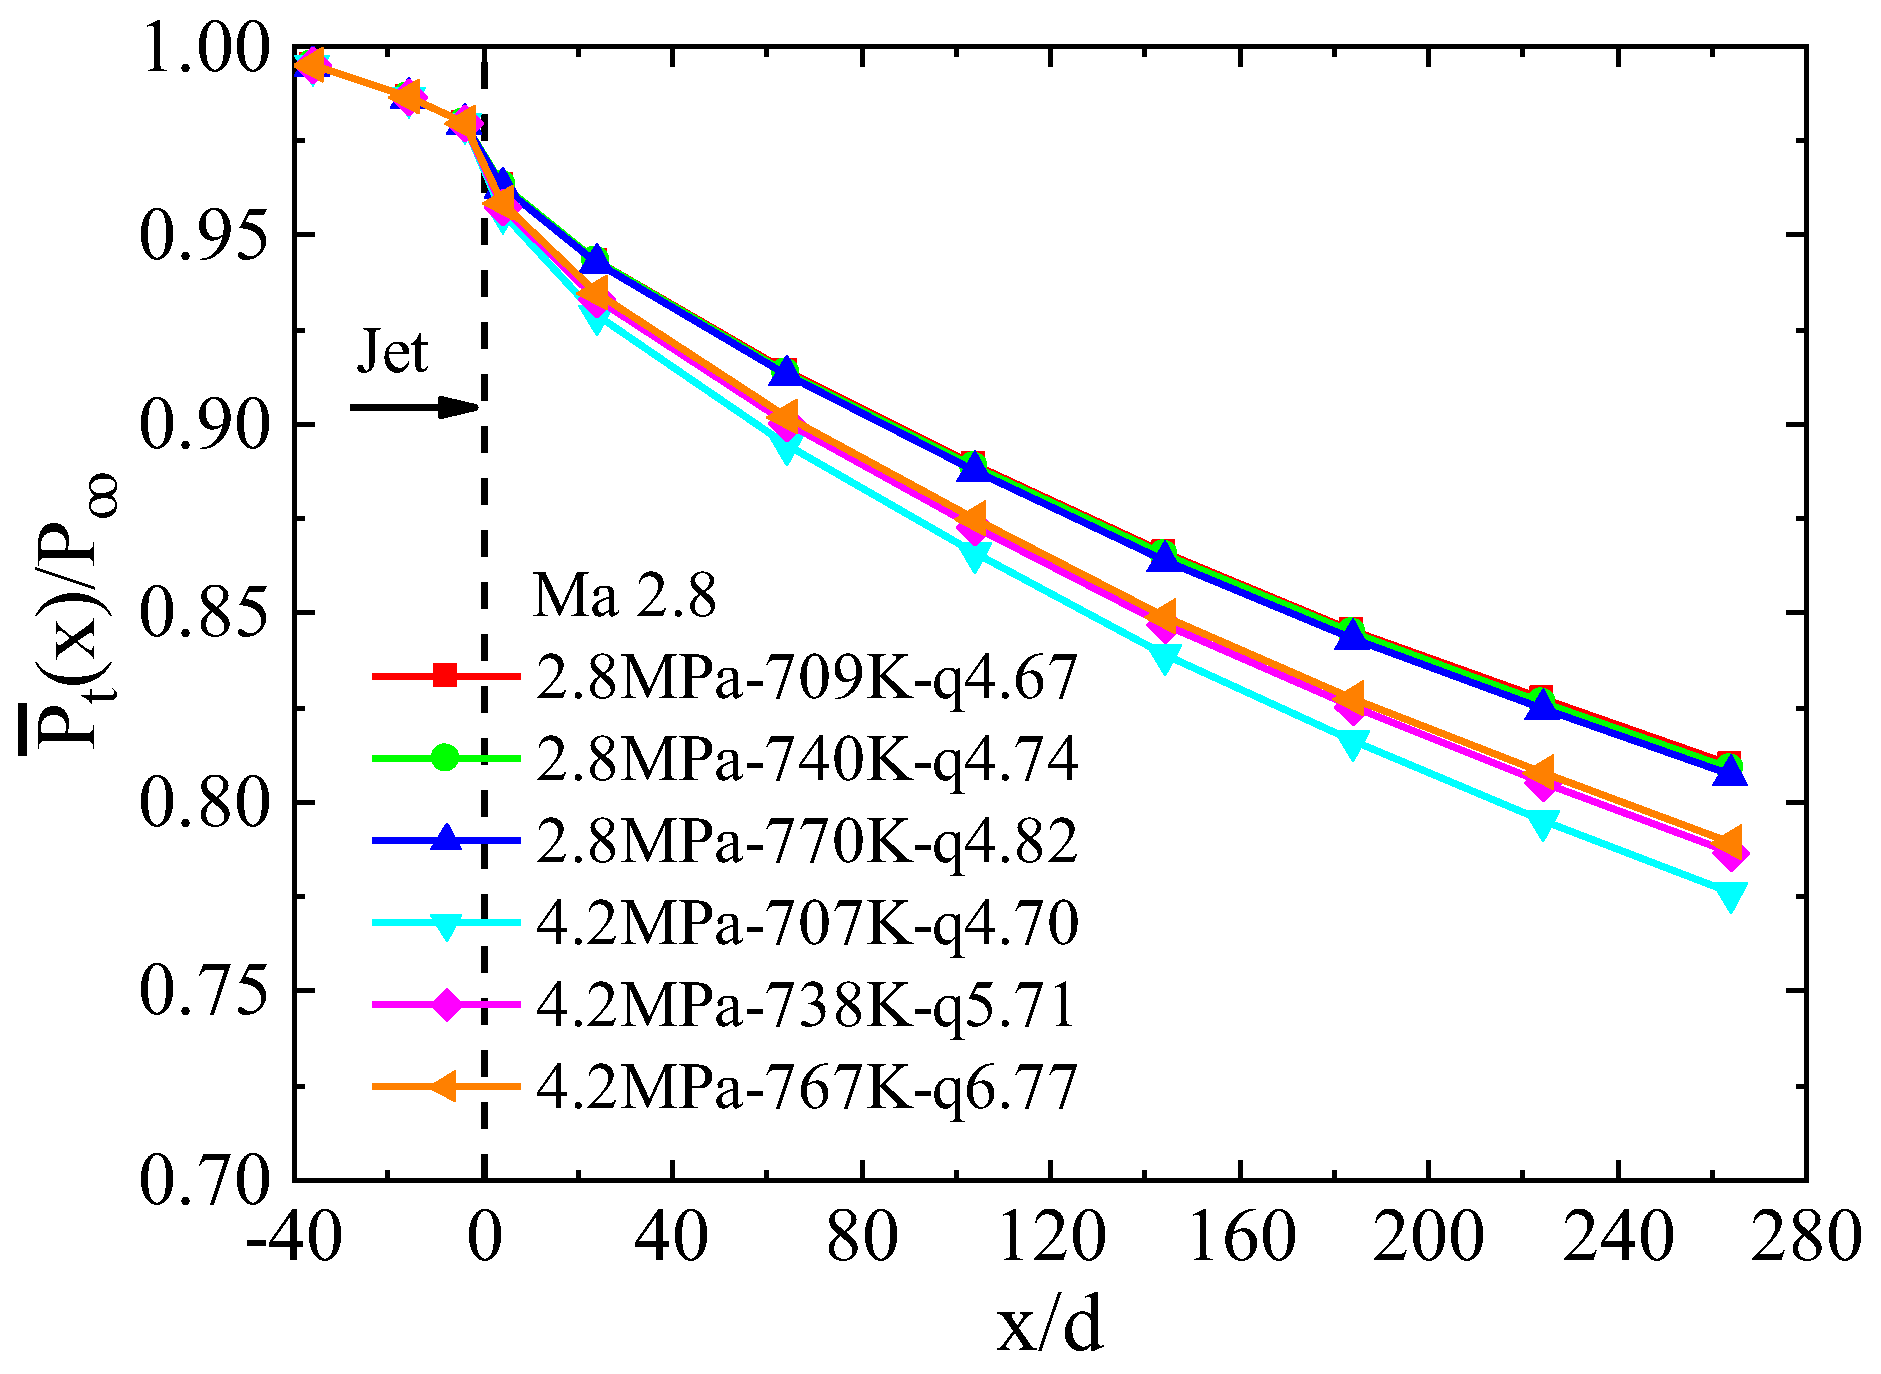
4.3.3. Total Pressure Loss

The induced total pressure loss at the outlet is an important criterion from the perspective of the optimal design of the injection scheme, in addition to the efficiency of mixing. Gao et al. [35] proposed a mass-weighted average total pressure parameter for evaluating the total pressure loss; this method is expressed in the equation
P ¯ t ( x ) = d y   d z ρ u P t ( x , y , z ) d y d z d y   d z ρ u d y d z
A cross-section along the flow direction is weighted to obtain a one-dimensional distribution of the total pressure in the flow field along the flow direction, which can be compared with the total pressure of the inlet flow to better compare the total pressure loss of different solutions. The ratio of the average total pressure and the total inlet flow pressure defined by Equation (14) for each section is defined as the total pressure recovery factor.
The variation of the total pressure recovery coefficient along the flow direction for two injection conditions at different Mach numbers is given in Figure 18. As can be seen, the recovery coefficient before the nozzle is close to 1, rapidly declining in the vicinity of the jet stream, and the total pressure loss is greater in the Ma 2.8 incoming flow condition. It can also be seen that the change in operating conditions for the same injection has a greater effect on the total pressure loss at high Mach numbers.
To characterize the effect of injection conditions on the total pressure loss, the variation of the total pressure recovery coefficient along the flow direction for different injection temperatures and pressures in the Ma 2.8 incoming flow is presented in Figure 19. It can be seen that high injection pressure conditions generally cause greater total pressure loss. In addition, the effect of temperature change on the total pressure loss is almost negligible at the lower injection pressure condition (2.8 MPa). Furthermore, at higher injection pressure (4.2 MPa), the total pressure recovery coefficient improved with increasing temperature, but the higher the temperature, the smaller the degree of improvement.

5. Conclusions

The flow structure, spatial distribution, and mixing characteristics of a supercritical endothermic hydrocarbon fuel (EHF) jet injected into a supersonic crossflow have been investigated by experimental and numerical methods. The concentration distribution, mixing efficiency, and total pressure loss are analyzed.
The supercritical-state EHF directly changes to a gaseous state as it enters the supersonic crossflow from the injector, and the flow structure formed by the interaction of the EHF jet and supersonic mainstream captured by the numerical method reveals a good accuracy with the experimental results. Based on the acetone planar laser-induced fluorescence (PLIF) method, the EHF jet plume boundary increased with the increasing momentum flux ratio (q). With the streamwise and spanwise distance increasing, the traverse heights and expand width increase, and the EHF jet plume presents a semicircle shape in the cross-sectional plane. With the increase in the traverse direction, the concentration distribution shows a fast and then slow power exponential decreasing law (x/d = 100); the highest concentration point starts from the near-wall region (x/d = 100) and rises in the y direction with the streamwise distance increasing (x/d = 180 and 260). For the same injection condition, the higher the Ma, the higher the mixing efficiency due to the degree of wrapping on the jet. For the same Ma, the mixing is better for the case with low injection pressure and high injection temperature. In addition, high injection pressure enhances the sensitivity of mixing efficiency to temperature changes. The total pressure loss is greater in the higher Ma, and high injection pressure conditions cause greater total pressure loss. At higher injection pressure, the total pressure recovery coefficient improved with increasing temperature, but the higher the temperature, the smaller the degree of improvement.
The findings of the present paper may be useful for the design of the fuel injection approach. Of course, research about different injection schemes needs to be carried out in future work, and, at the same time, the ignition and combustion of supercritical fuel under high total temperature inflow conditions also should be considered.

Author Contributions

Data curation, K.X. and S.D.; formal analysis, K.X.; investigation, W.Z.; project administration, X.X.; supervision, Q.Y.; writing — original draft, W.Z.; writing — review & editing, Q.Y. All authors have read and agreed to the published version of the manuscript.

Funding

This research was funded by National Natural Science Foundation of China grant numbers 51776013 and 51706010.

Institutional Review Board Statement

Not applicable.

Informed Consent Statement

Not applicable.

Data Availability Statement

Not applicable.

Conflicts of Interest

The authors declare no conflict of interest.

Nomenclature

csound speed in the gas: m/suvelocity, m/s
dinjection orifice diameter, mm υ volume fraction
MaMach numberxmole fraction
Ppressure, Paρdensity, kg/m3
qjet-to-air momentum flux ratioμviscosity, mPa·s
Ttemperature, K

References

  1. Smart, M.K. Scramjets. Aeronaut. J. 2007, 111, 605–619. [Google Scholar] [CrossRef]
  2. Urzay, J. Supersonic combustion in air-breathing propulsion systems for hypersonic flight. Annu. Rev. Fluid Mech. 2018, 50, 593–627. [Google Scholar] [CrossRef]
  3. Edwards, T. Aviation fuel development-past highlights and future prospects. In Proceedings of the AIAA International Air and Space Symposium and Exposition: The Next 100 Years, Dayton, OH, USA, 14–17 July 2003; p. 2611. [Google Scholar] [CrossRef]
  4. Li, Y.; Xie, G.; Sunden, B. Flow and thermal performance of supercritical n-decane in double-layer channels for regenerative cooling of a scramjet combustor. Appl. Therm. Eng. 2020, 180, 115695. [Google Scholar] [CrossRef]
  5. Feng, Y.; Qin, J.; Bao, W.; Yang, Q.; Huang, H.; Wang, Z. Numerical analysis of convective heat transfer characteristics of supercritical hydrocarbon fuel in cooling panel with local flow blockage structure. J. Supercrit. Fluids 2014, 88, 8–16. [Google Scholar] [CrossRef]
  6. Li, H.; Qin, J.; Bao, W.; Huang, H. Performance improvement of gaseous hydrocarbon fuel driven thermal power generation systems for hypersonic vehicles. Energy Convers. Manag. 2019, 199, 111949. [Google Scholar] [CrossRef]
  7. Wu, X.; Yang, J.; Zhang, H.; Shen, C. System design and analysis of hydrocarbon scramjet with regeneration cooling and expansion cycle. J. Therm. Sci. 2015, 24, 350–355. [Google Scholar] [CrossRef]
  8. Gascoin, N.; Abraham, G.; Gillard, P. Synthetic and jet fuels pyrolysis for cooling and combustion applications. J. Anal. Appl. Pyrol. 2010, 89, 294–306. [Google Scholar] [CrossRef] [Green Version]
  9. Vincent-Randonnier, A.; Rouxel, B.; Roux, P.; Poirot, M.; Sicard, M.; Raepsaet, B.; Ser, F. Experimental investigations on the self-ignition of a thermally decomposed endothermic fuel in hot supersonic air flow in the MPP-LAERTE combustion test bench. In Proceedings of the 15th AIAA International Space Planes and Hypersonic Systems and Technologies Conference, Dayton, OH, USA, 28 April–1 May 2008. [Google Scholar] [CrossRef]
  10. Li, X.; Liu, W.; Pan, Y.; Yang, L.; An, B.; Zhu, J. Characterization of ignition transient processes in kerosene-fueled model scramjet engine by dual-pulse laser-induced plasma. Acta Astronaut. 2018, 144, 23–29. [Google Scholar] [CrossRef]
  11. Zhang, J.; Chang, J.; Ma, J.; Wang, Y.; Bao, W. Investigations on flame liftoff characteristics in liquid-kerosene fueled supersonic combustor equipped with thin strut. Aero. Sci. Technol. 2019, 84, 686–697. [Google Scholar] [CrossRef]
  12. Tian, Y.; Yang, S.; Le, J. Study on flame stabilization of a hydrogen and kerosene fueled combustor. Aero. Sci. Technol. 2016, 59, 183–188. [Google Scholar] [CrossRef]
  13. Wu, L.Y.; Wang, Z.-G.; Li, Q.; Zhang, J. Investigations on the droplet distributions in the atomization of kerosene jets in supersonic crossflows. Appl. Phys. Lett. 2015, 107, 104103. [Google Scholar] [CrossRef]
  14. Thomas, R.H.; Schetz, J.A. Distributions across the plume of transverse liquid and slurry jets in supersonic airflow. AIAA J. 1985, 23, 1892–1901. [Google Scholar] [CrossRef] [Green Version]
  15. Su, Y.-H.; Yuan, H.F.; Su, Y.-P. Liquid-fuel injection into supersonic cross flow. Combust. Sci. Technol. 2020, 192, 1436–1447. [Google Scholar] [CrossRef]
  16. Wei, X.; Li, L.; Zhao, Z.; Bo, T.; Bian, X.; Zuo, Y. The droplet size and penetration height of a kerosene jet in a crossflow. At. Sprays 2020, 30, 495–515. [Google Scholar] [CrossRef]
  17. Pan, Y.; Dai, J.; Bao, H. Effect of scramjet combustor configuration on the distribution of transverse injection kerosene. J. Mech. Sci. Technol. 2014, 28, 4997–5002. [Google Scholar] [CrossRef]
  18. Balasubramanyam, M.S.; Chen, C.P. Modeling liquid jet breakup in high speed cross-flow with finite-conductivity evaporation. Int. J. Heat Mass Transf. 2008, 51, 3896–3905. [Google Scholar] [CrossRef]
  19. Yuan, T.; Su, Y.H.; Lin, Y.T. The mixing of the spray in Mach 2 high enthalpy cross flow. In Proceedings of the 2018 Joint Propulsion Conference, Cincinnati, OH, USA, 9–11 July 2018. [Google Scholar] [CrossRef]
  20. Yang, K.; Li, C.-Y.; Pan, Y.; Wang, Z.-G.; Liu, C.-Y.; Wang, N. Investigation of the evaporation characteristics of a transverse vaporized kerosene jet in supersonic flow. Acta Astronaut. 2021, 185, 257–263. [Google Scholar] [CrossRef]
  21. Sun, M.-B.; Zhong, Z.; Liang, J.-H.; Wang, Z.-G. Experimental investigation of a supersonic model combustor with distributed injection of supercritical kerosene. J. Propuls. Power 2014, 30, 1537–1542. [Google Scholar] [CrossRef]
  22. Sun, M.-B.; Zhong, Z.; Liang, J.-H.; Wang, H.-B. Experimental investigation on combustion performance of cavity-strut injection of supercritical kerosene in supersonic model combustor. Acta Astronaut. 2016, 127, 112–119. [Google Scholar] [CrossRef]
  23. Fan, X.; Yu, G.; Li, J.; Zhang, X.; Sung, C.-J. Investigation of vaporized kerosene injection and combustion in a supersonic model combustor. J. Propul. Power 2006, 22, 103–110. [Google Scholar] [CrossRef] [Green Version]
  24. Lee, J.; Lin, K.-C.; Eklund, D. Challenges in fuel injection for high-speed propulsion systems. AIAA J. 2015, 53, 1405–1423. [Google Scholar] [CrossRef]
  25. Wegener, A.; Laser-Junga, H. Photography of the anterior eye segment according to Scheimpflug's principle: Options and limitations-a review. Clin. Exp. Ophthalmol. 2009, 37, 144–154. [Google Scholar] [CrossRef] [PubMed]
  26. Elbaz, A.M.; Roberts, W.L. Experimental study of the inverse diffusion flame using high repetition rate OH/acetone PLIF and PIV. Fuel 2016, 165, 447–461. [Google Scholar] [CrossRef] [Green Version]
  27. Thurber, M.C.; Hanson, R.K. Simultaneous imaging of temperature and mole fraction using acetone planar laser-induced fluorescence. Exp. Fluids 2001, 30, 93–101. [Google Scholar] [CrossRef]
  28. Koch, J.D.; Gronki, J.; Hanson, R.K. Measurements of near-UV Absorption Spectra of Acetone and 3-Pentanone at High Temperatures. J. Quant. Spectrosc. Rad. Trans. 2008, 109, 2037–2044. [Google Scholar] [CrossRef]
  29. Huber, M.L. NIST Standard Reference Database 4-NIST Thermophysical Properties of Hydrocarbon Mixtures Database; National Institute of Standards and Technology Standard Reference Data Program: Gaithersburg, MD, USA, 2007. [Google Scholar]
  30. Aungier, R.H. A Fast, Accurate Real Gas Equation of State for Fluid Dynamic Analysis Applications. J. Fluids Eng. 1995, 117, 277–281. [Google Scholar] [CrossRef]
  31. Gao, W.; Liang, H.-S.; Xu, Q.-H.; Lin, Y.-Z.; Sung, C.-J. Injection of supercritical aviation kerosene fuel into quiescent atmospheric environment. In Proceedings of the 45th AIAA/ASME/SAE/ASEE Joint Propulsion Conference & Exhibit, Denver, CO, USA, 2–5 August 2009. [Google Scholar] [CrossRef]
  32. Gao, W.; Lin, Y.; Hui, X.; Zhang, C.; Xu, Q. Injection characteristics of near critical and supercritical kerosene into quiescent atmospheric environment. Fuel 2019, 235, 775–781. [Google Scholar] [CrossRef]
  33. Li, P.; Wang, Z.; Bai, X.-S.; Wang, H.; Sun, M.; Wu, L.; Liu, C. Three-dimensional flow structures and droplet-gas mixing process of a liquid jet in supersonic crossflow. Aero. Sci. Technol. 2019, 90, 140–156. [Google Scholar] [CrossRef]
  34. Mao, M.; Riggins, D.W.; Mcclinton, C.R. Numerical simulation of transverse fuel injection. In Proceedings of the Computational Fluid Dynamics Symposium on Aeropropulsion, Cleveland, OH, USA, 24–26 April 1990. [Google Scholar]
  35. Gao, Z.; Lee, C. Numerical research on mixing characteristics of different injection schemes for supersonic transverse jet. Sci. China Technol. Sci. 2011, 54, 883–893. [Google Scholar] [CrossRef]
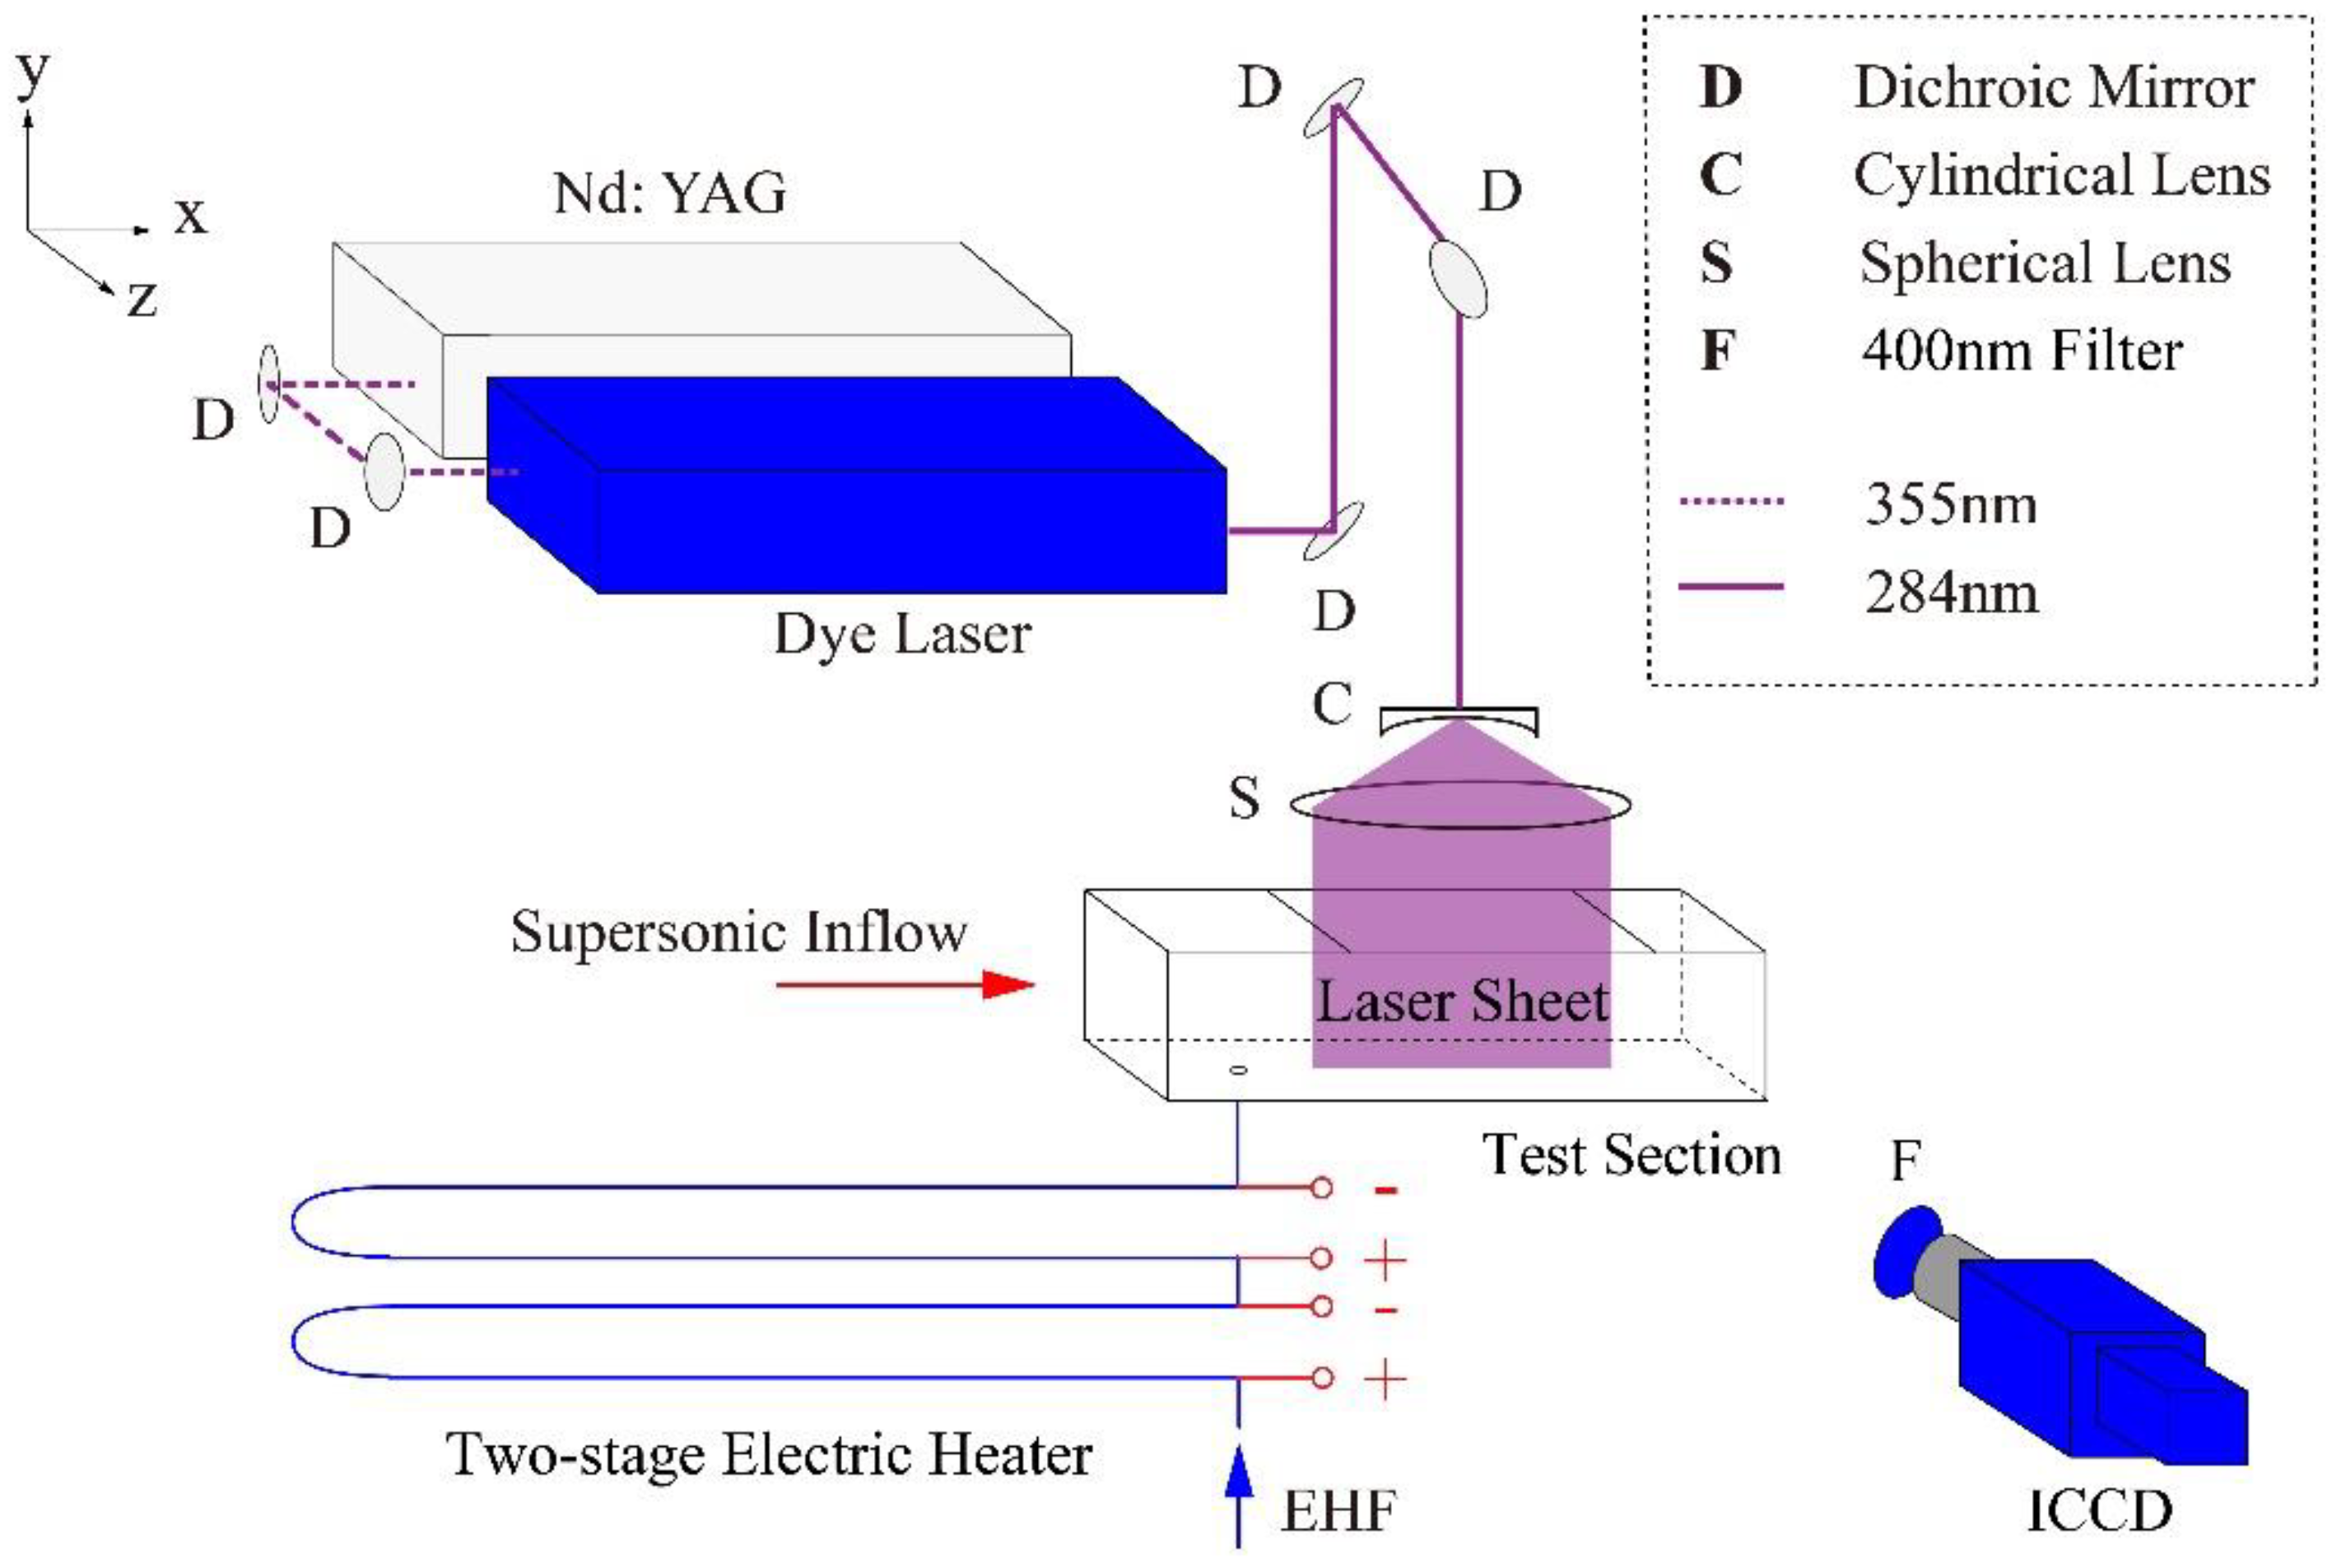
Figure 1. Schematic of experimental setup.
Aerospace 09 00631 g001
Figure 2. Schematic of test section, injector, and laser optics.
Aerospace 09 00631 g002
Figure 3. Comparison of fluorescence signal (a) with acetone, (b) without acetone (Test 1-1, operating condition).
Aerospace 09 00631 g003
Figure 4. Schematic of computational domain, boundary conditions, and mesh.
Aerospace 09 00631 g004
Figure 5. Mach number contour at symmetric surface.
Aerospace 09 00631 g005
Figure 6. Comparison of shock structure: (a) schlieren visualization, (b) numerical schlieren.
Aerospace 09 00631 g006
Figure 7. Bow shock angle under different test conditions. (a) Injection condition. (b) Mach number for incoming flow.
Aerospace 09 00631 g007
Figure 8. Morphology of supercritical jet in supersonic crossflow: (a) t = 2 μs, (b) t = 4 μs, (c) t = 6 μs, (d) t = 8 μs, (e) t = 10 μs, (f) t = 12 μs (Case U3-2).
Aerospace 09 00631 g008aAerospace 09 00631 g008b
Figure 9. Instantaneous images of fluorescence signal: (a) t = 1 s, (b) t = 2 s, (c) t = 3 s, (d) t = 4 s (Test 1-1).
Aerospace 09 00631 g009
Figure 10. Central plume structures of EHF jet injected into Ma 2.0 crossflow. (a) Ma = 2.0, Pj = 2.8 MPa, Tj = 705 K. (b) Ma = 2.0, Pj = 2.8 MPa, Tj = 730 K. (c) Ma = 2.0, Pj = 4.2 MPa, Tj = 707 K. (d) Ma = 2.0, Pj = 4.1 MPa, Tj = 735 K.
Aerospace 09 00631 g010
Figure 11. Cross-sectional plume structures of EHF jet injected into Ma 2.0 crossflow. (a) Ma = 2.0, Pj = 2.8 MPa, Tj = 705 K. (b) Ma = 2.0, Pj = 2.8 MPa, Tj = 730 K. (c) Ma = 2.0, Pj = 4.2 MPa, Tj = 707 K.
Aerospace 09 00631 g011aAerospace 09 00631 g011b
Figure 12. Comparison of EHF concentration distribution of flow field: (a) numerical results, (b) experimental results (Test 2-2).
Aerospace 09 00631 g012
Figure 13. Mass fraction of EHF in central plane and cross-sectional plane. (a) Ma = 2.0, Pj = 2.8 MPa, Tj = 705 K. (b) Ma = 2.0, Pj = 2.8 MPa, Tj = 730 K. (c) Ma = 2.0, Pj = 4.2 MPa, Tj = 707 K. (d) Ma = 2.0, Pj = 4.1 MPa, Tj = 735 K.
Aerospace 09 00631 g013
Figure 14. Comparison of concentration curves obtained by experiments and simulations. (a) Ma = 2.0, Pj = 2.8 MPa, Tj = 705 K. (b) Ma = 2.0, Pj = 2.8 MPa, Tj = 730 K. (c) Ma = 2.0, Pj =4.2 MPa, Tj = 707 K. (d) Ma = 2.0, Pj = 4.1 MPa, Tj = 735 K.
Aerospace 09 00631 g014
Figure 15. Concentration curves of EHF jet along the flow direction under Ma 2.0. (a) Ma = 2.0, Pj = 2.8 MPa, Tj = 705 K. (b) Ma = 2.0, Pj = 2.8 MPa, Tj = 730 K. (c) Ma = 2.0, Pj = 4.2 MPa, Tj = 707 K. (d) Ma = 2.0, Pj = 4.1 MPa, Tj = 735 K.
Aerospace 09 00631 g015aAerospace 09 00631 g015b
Figure 16. Mixing efficiency at different Mach numbers.
Aerospace 09 00631 g016
Figure 17. Mixing efficiency at different injection conditions.
Aerospace 09 00631 g017
Figure 18. Total pressure recovery coefficient at different Ma.
Aerospace 09 00631 g018
Figure 19. Total pressure recovery coefficient at different injecting conditions.
Aerospace 09 00631 g019
Table 1. Experimental operating conditions.
TestMach Number,
Ma
Total Pressure,
P0/(MPa)
Injection Pressure,
Pj/(MPa)
Injection Temperature,
Tj/(K)
Momentum Flux Ratio,
q
1-12.00.442.87054.48
1-22.00.432.87304.77
1-32.00.442.87804.96
2-12.00.434.27074.73
2-22.00.464.17355.44
2-32.00.444.17766.58
3-12.80.752.87094.67
3-22.80.722.87404.74
3-32.80.792.87704.82
4-12.80.774.27074.70
4-22.80.794.27385.71
4-32.80.764.27676.77
Table 2. Numerical simulation conditions.
CaseMach Number,
Ma
Total Pressure,
P0/(MPa)
Injection Pressure,
Pj/(MPa)
Injection Temperature,
Tj/(K)
Momentum Flux Ratio,
q
S1-12.00.442.87054.48
S1-22.00.432.87304.77
S1-32.00.442.87804.96
S2-12.00.434.27074.73
S2-22.00.464.17355.44
S2-32.00.444.17766.58
S3-12.80.752.87094.67
S3-22.80.722.87404.74
S3-32.80.792.87704.82
S4-12.80.774.27074.70
S4-22.80.794.27385.71
S4-32.80.764.27676.77
U3-22.80.722.87404.74
Publisher’s Note: MDPI stays neutral with regard to jurisdictional claims in published maps and institutional affiliations.