3.1. Compressor Performance Characteristics
- (a)
Compressor performance characteristics
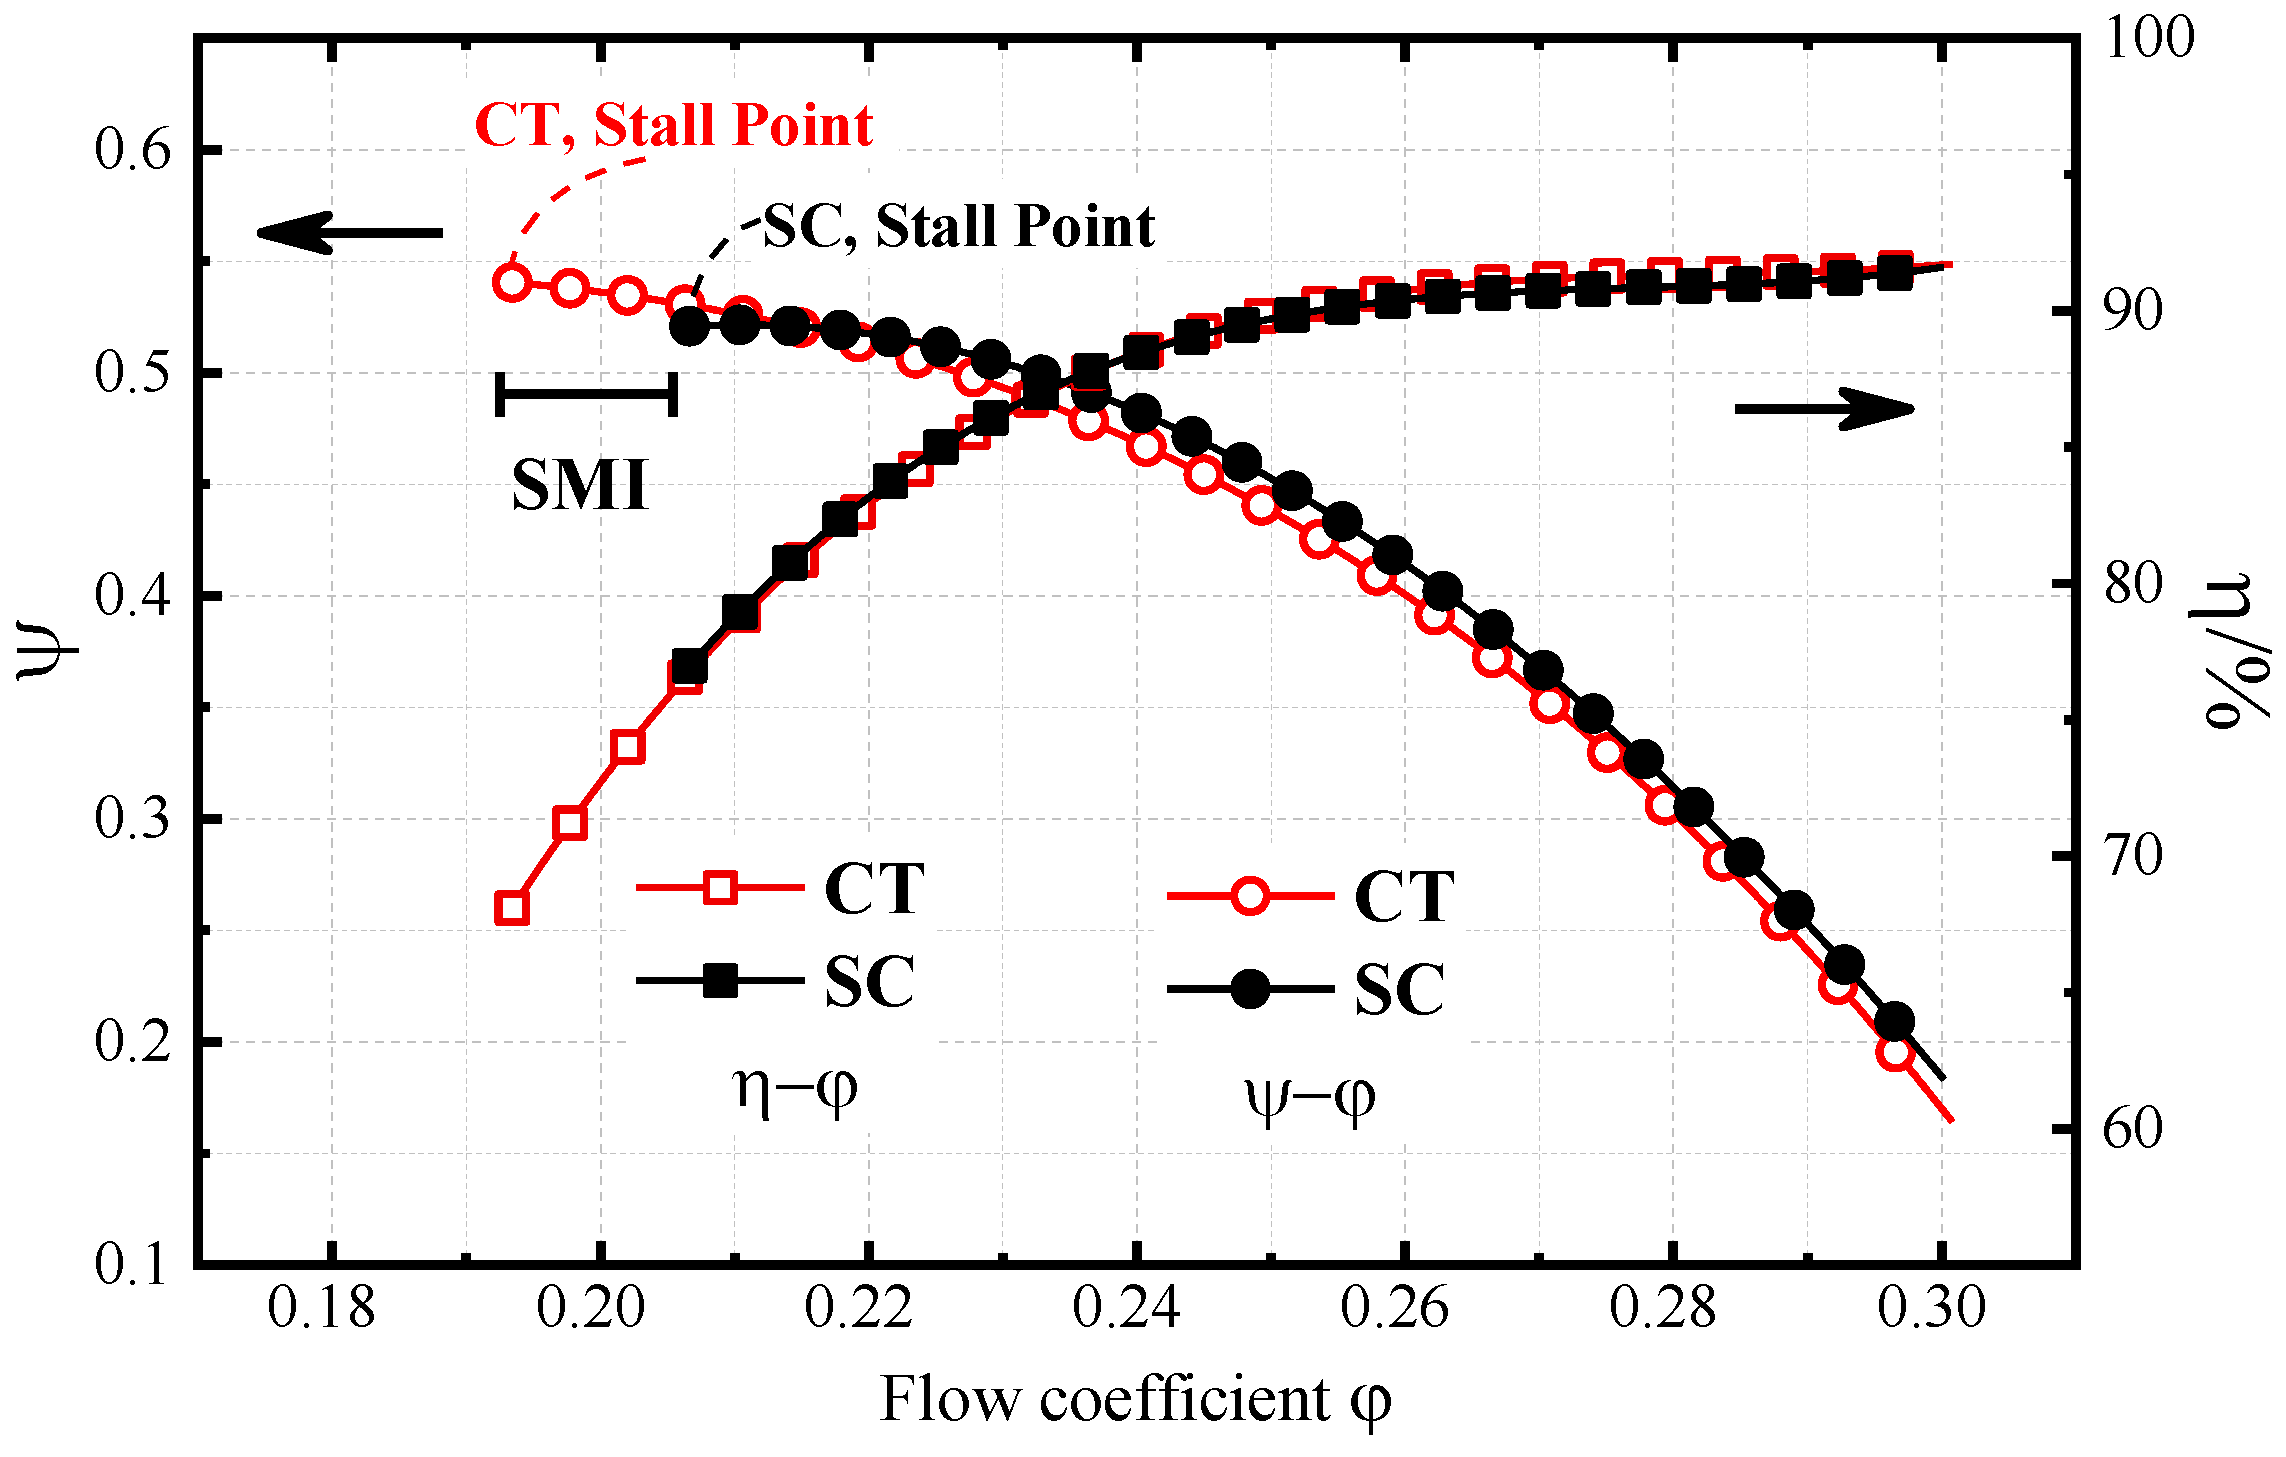
Figure 4 shows the compressor characteristics, with and without casing treatment. For brevity, the FMCT is abbreviated as CT, and the SC refers to the smooth casing wall condition. The stall point defined in this paper is the last stable operation point of the compressor at a fixed speed line. In
Figure 4, the ordinate in the left vertical axis is the pressure rise coefficient, while the one on the right is the efficiency coefficient. The abscissa is the flow coefficient. Among the four curves, the circle refers to the pressure rise characteristic, and the diamonds denote the efficiency characteristic. In addition, the curve using open symbols refers to CT, and the solid symbols refer to SC. Comparing the pressure rise characteristics, we see that with CT, the compressor forms an extension of the curve for SC. The calculated SMI (stall margin improvement) is 14.9%. Regarding efficiency characteristic, the two curves nearly coincide with each other, which means that the CT results in nearly no efficiency loss.
- (b)
Noise characteristics
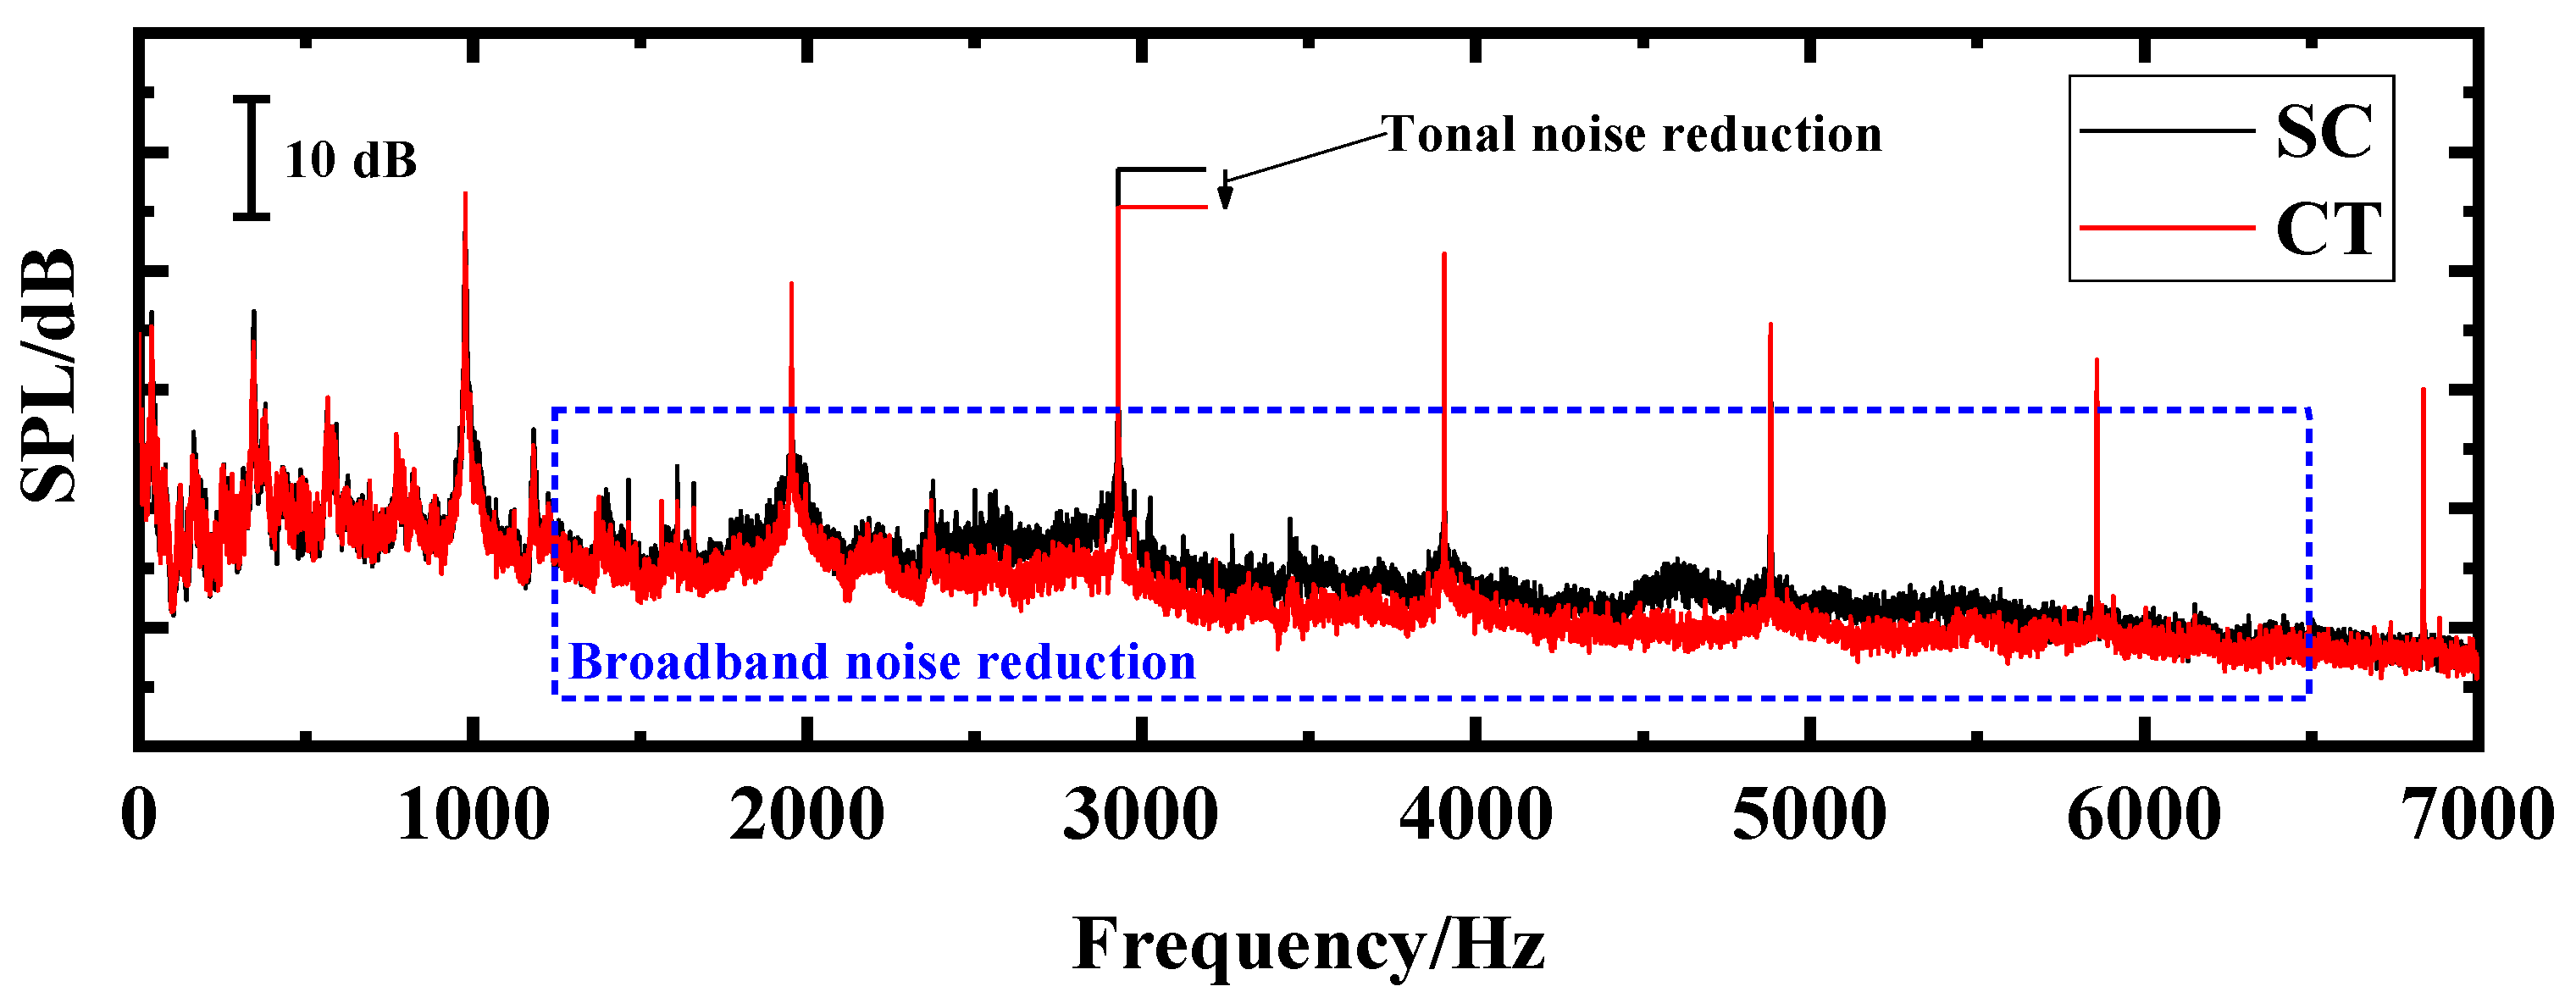
Figure 5 presents the noise frequency spectrum obtained at the design point of the compressor. The black line and the red line refer to SC and CT, respectively. The ordinate is
SPL (sound pressure level) and the abscissa is frequency. The dominant sound source of TA36 is the interaction noise at the third order BPF (blade passing frequency), as shown in
Figure 5. It appears that, especially at the third BPF, the tonal noise is reduced by 3.2 dB in the CT condition.
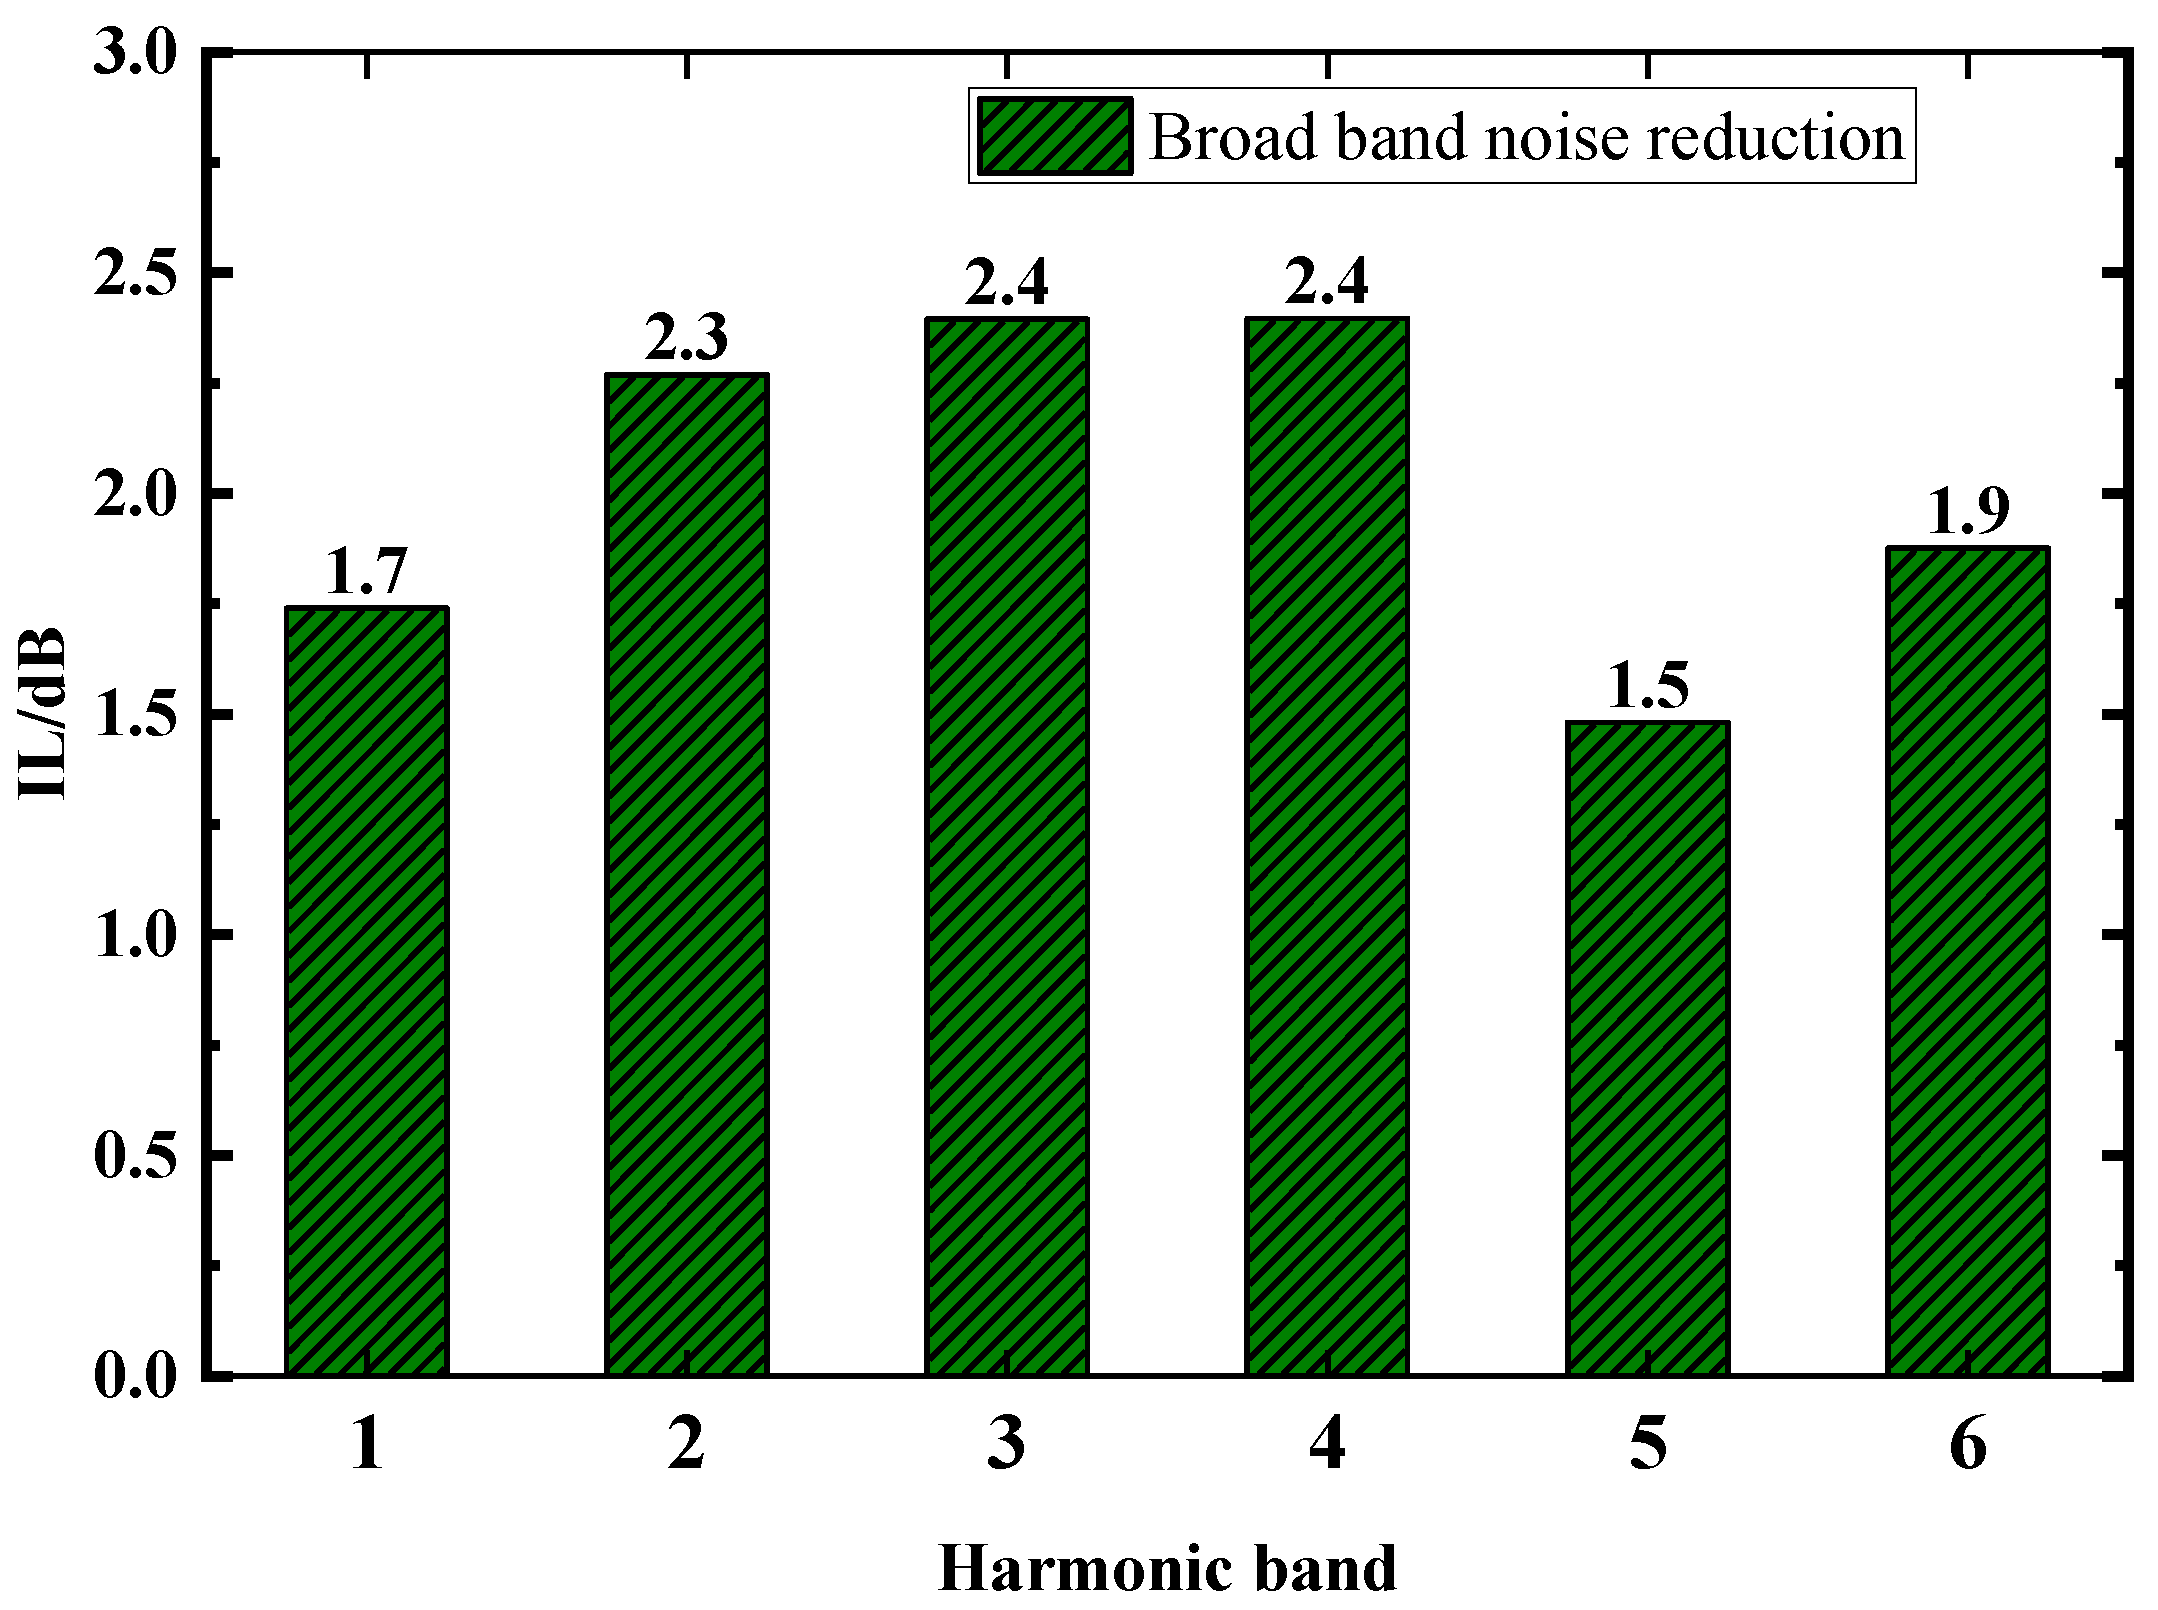
As indicated by a blue dashed box, the broadband noise level of the compressor is also reduced in the CT condition. To make a more quantitative comparison regarding broadband noise, the energy-averaged
IL (insertion loss) is calculated at each BPF band. The procedure is as follows: the first step is removing the tonal noise at each order of BPF. The next step is to divide the noise spectrum into several harmonic bands centered on each order of BPF. In the third step, the sound energy in each band is averaged into one representative
SPL. At last, the
IL is obtained by
Figure 6 shows the
IL in the first six orders of the harmonic bands. It is found that the
IL is distributed between 1.5 and 2.4 dB. The maximum
IL appears at the third and fourth order bands.
Looking back at
Figure 5, it is found that in the CT condition, both tonal noise (especially at the third order of BPF, which is the dominant noise source) and broadband noise are attenuated. The tonal noise in the compressor comes mainly from the interaction between the potential fields around the blades or the wake that interacts with the downstream stator blade. In the present experiment, the CT is only installed over the rotor tip rather than over the stator, so the reason for reducing the tonal noise may not be that it suppresses the pressure fluctuation on the stator surface. It is supposed that the CT affects the wake or some other secondary flows due to the permeable feature of the foam metal. In addition, the broadband noise is also reduced in the CT condition, as shown in
Figure 5 and
Figure 6. This is partly because the acoustic absorption, through the viscous and thermal dissipation, occurs inside the foam metal.
The above results are aimed at investigating the effect of the CT at the design point. However, the compressor may not always work at the design point. Therefore, it is necessary to test the CT under off-design conditions. For this purpose, acoustic levels at different mass flow points during the throttling process are measured and compared.
Figure 7 displays the curves of OASPL (overall sound pressure level) versus the mass flow, where the bandwidth of the calculation is from 20 Hz to 16,384 Hz. In
Figure 7, the black symbols refer to the SC, and the red symbols refer to the CT. A marked difference in the OASPL curves for SC and CT can be noted. First of all, near the choke point, the OASPL in CT is a little higher than that in SC. However, at the other smaller mass flow points, the OASPL is reduced in the CT. For both casing conditions, the OASPL is at the lower value when the compressor operates near the design point (6.5 kg/s). The reason for the lower OASPL is that the stage is well matched at this point. The OASPL is increasing with the compressor throttling to the near stall point. This is because the blade loading increases during this process, which results in a higher pressure change along the blade. In summary, in the present experiment, the OASPL reduction generated by the CT is up to 3.1 dB during the throttling process, except the near choke point. It should be noted that a microphone is subjected to fluctuations, both in the sound and the pseudo-sound, when a measurement is performed in the near field. The compressor noise, therefore, contains the contribution of the pseudo-sound. A far-field acoustic experiment is under consideration to exclude the interference of pseudo-sound.
3.2. Stall Process Analysis
In
Section 3.1, a comparison of the performance characteristics indicates that the CT improves the stall margin and reduces the noise level of the compressor. To further understand the work mechanism, the stall processes and the rotor tip flow field of the compressor, with and without the CT, are measured and analyzed in the following sections.
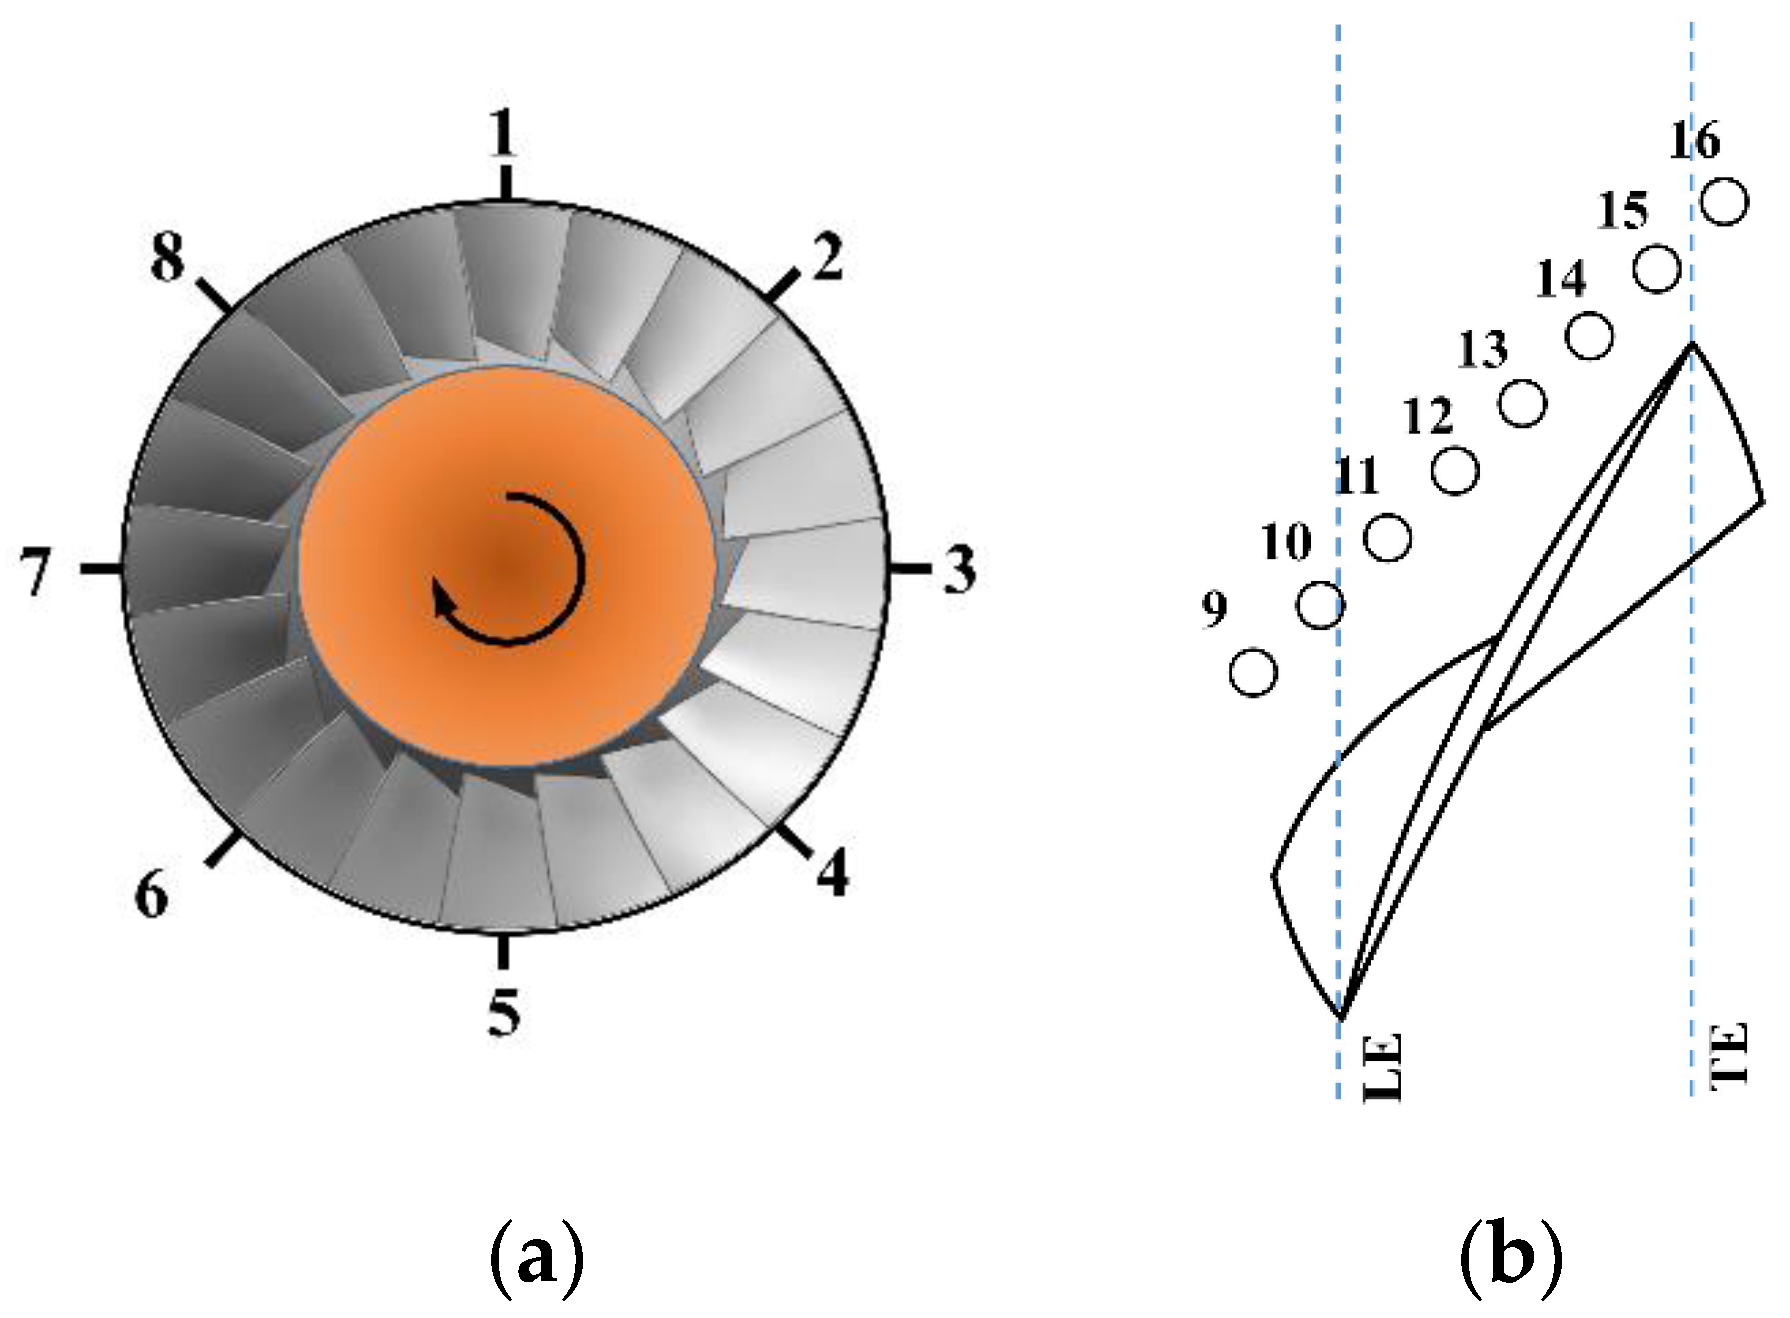
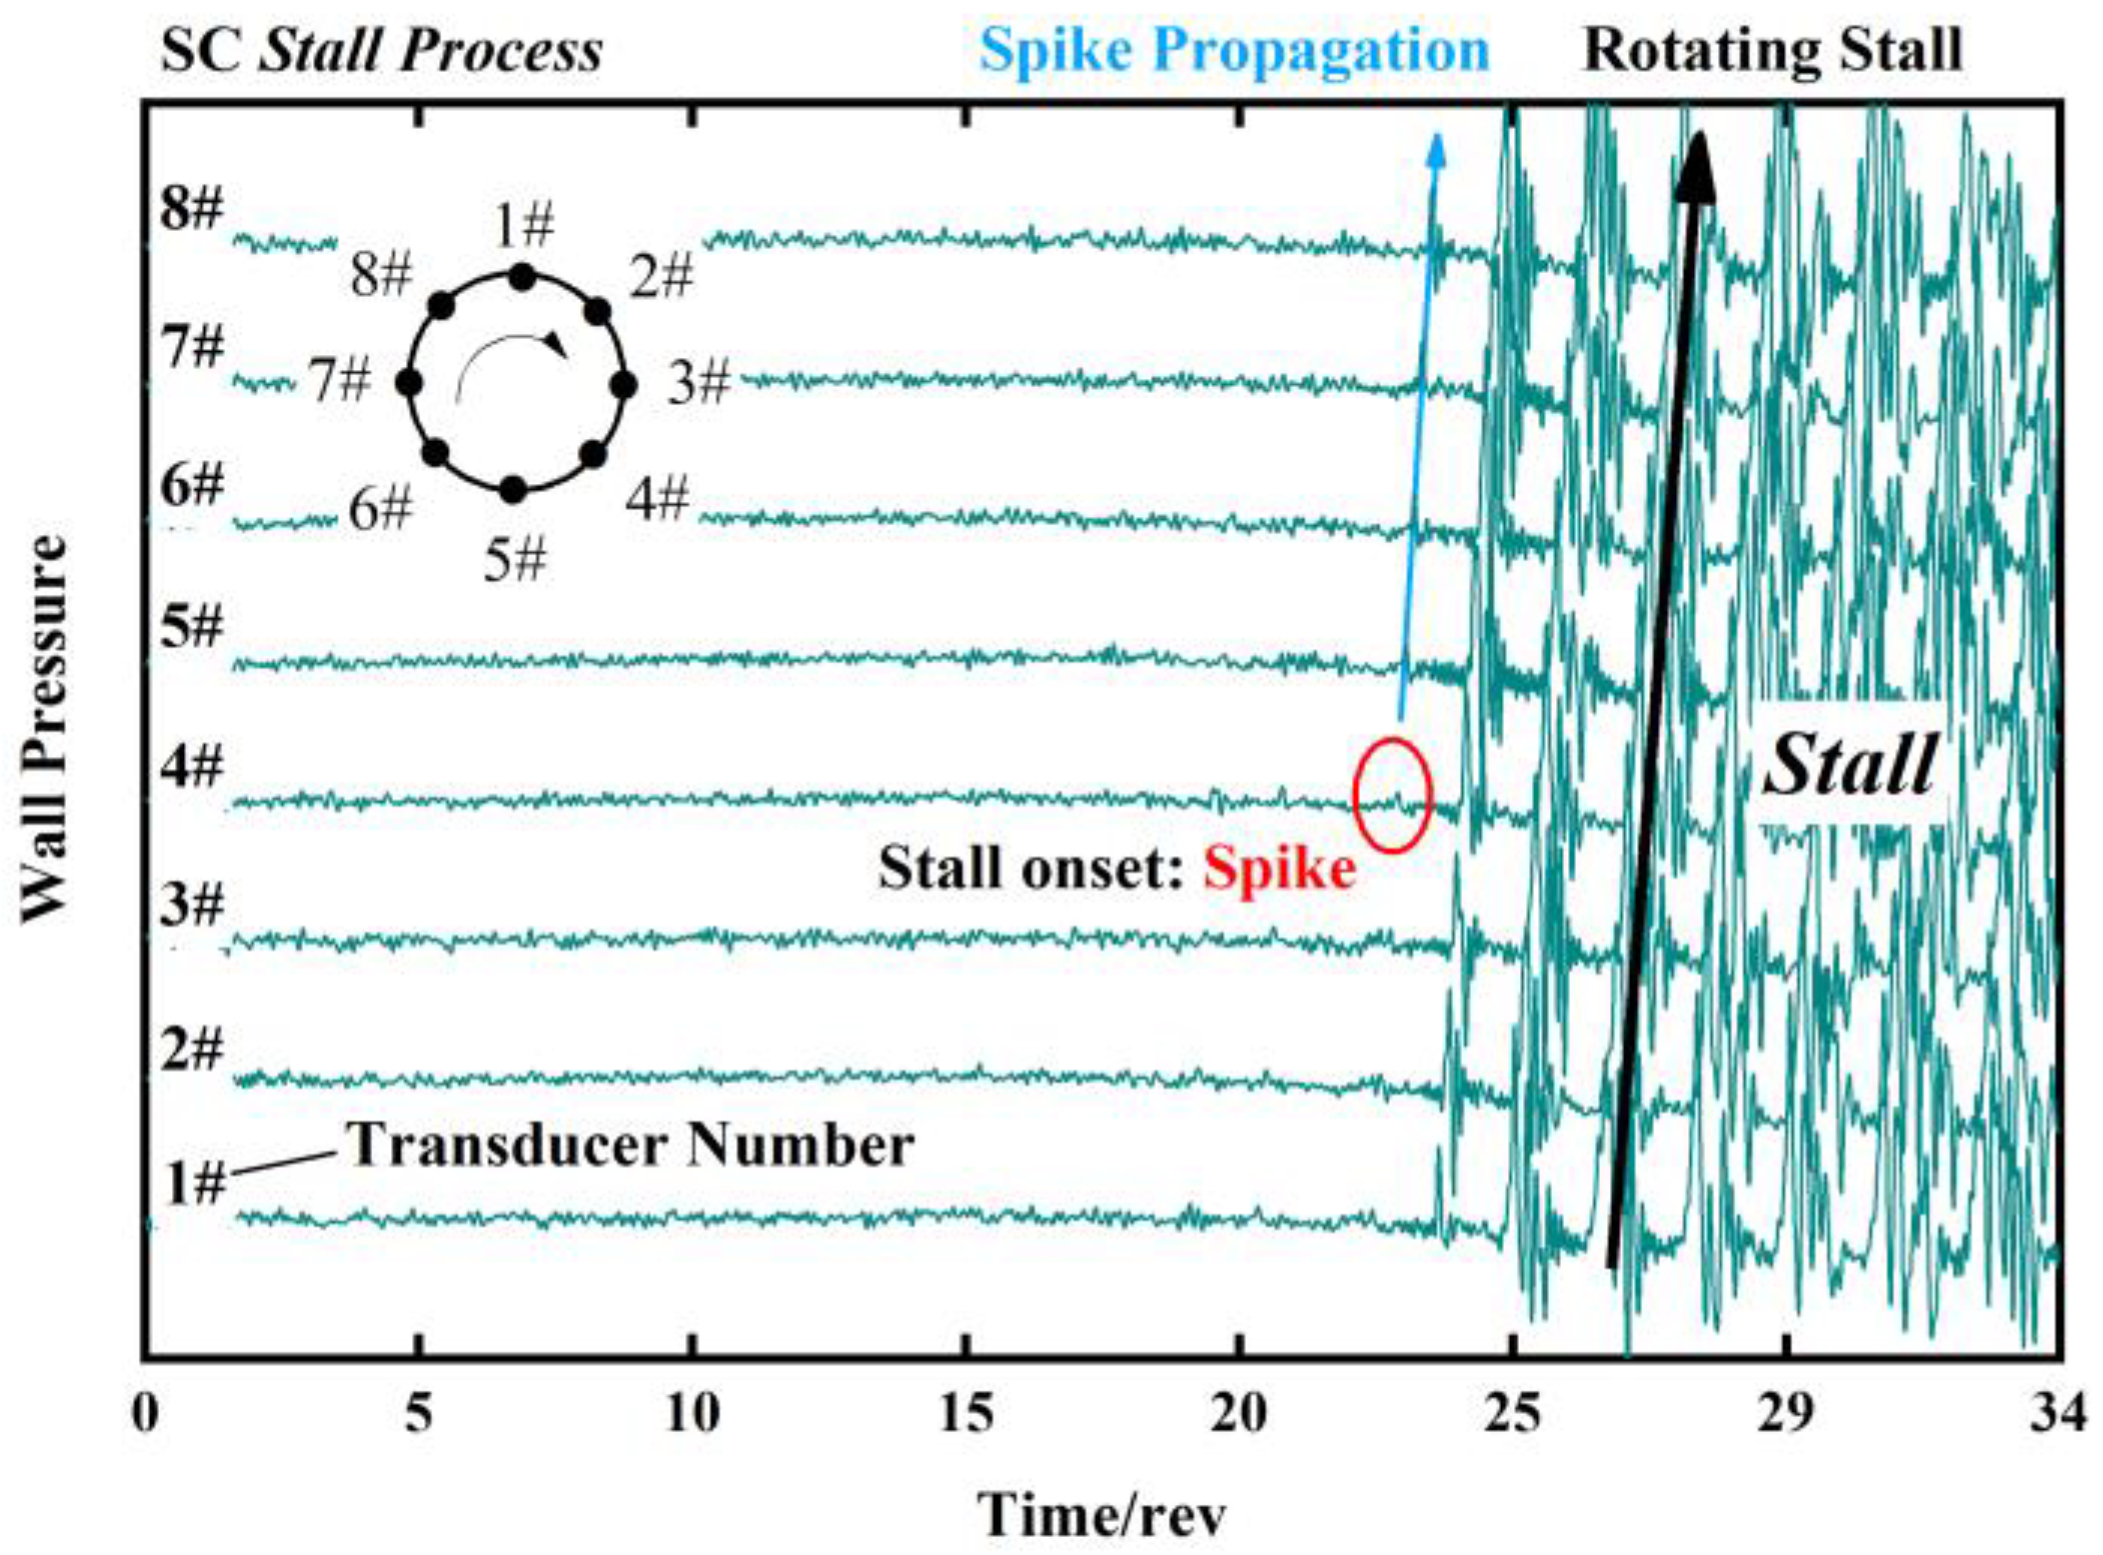
Figure 8 shows the stall process of the compressor in the SC. There are eight wall pressure signal traces. The pressure measurements are obtained by eight high-response transducers mounted upstream of the rotor leading edge, as introduced in
Section 2.2. The abscissa is time represented by the period of a rotor revolution (the start point is set arbitrarily). The ordinates are normalized wall pressures, respectively. The raw data are bandpass filtered from 2 to 500 Hz. As circled by a red oval, the “spike” appears with a sudden pressure rise, followed by a rapid drop. Once it emerges, this pattern grows in both length and strength as it travels along the circumferential annulus of compressor. After several revolutions, the spike develops into rotating stall cells, as shown in
Figure 8. These data suggest that the compressor is a “spike-type” stall onset in the SC.
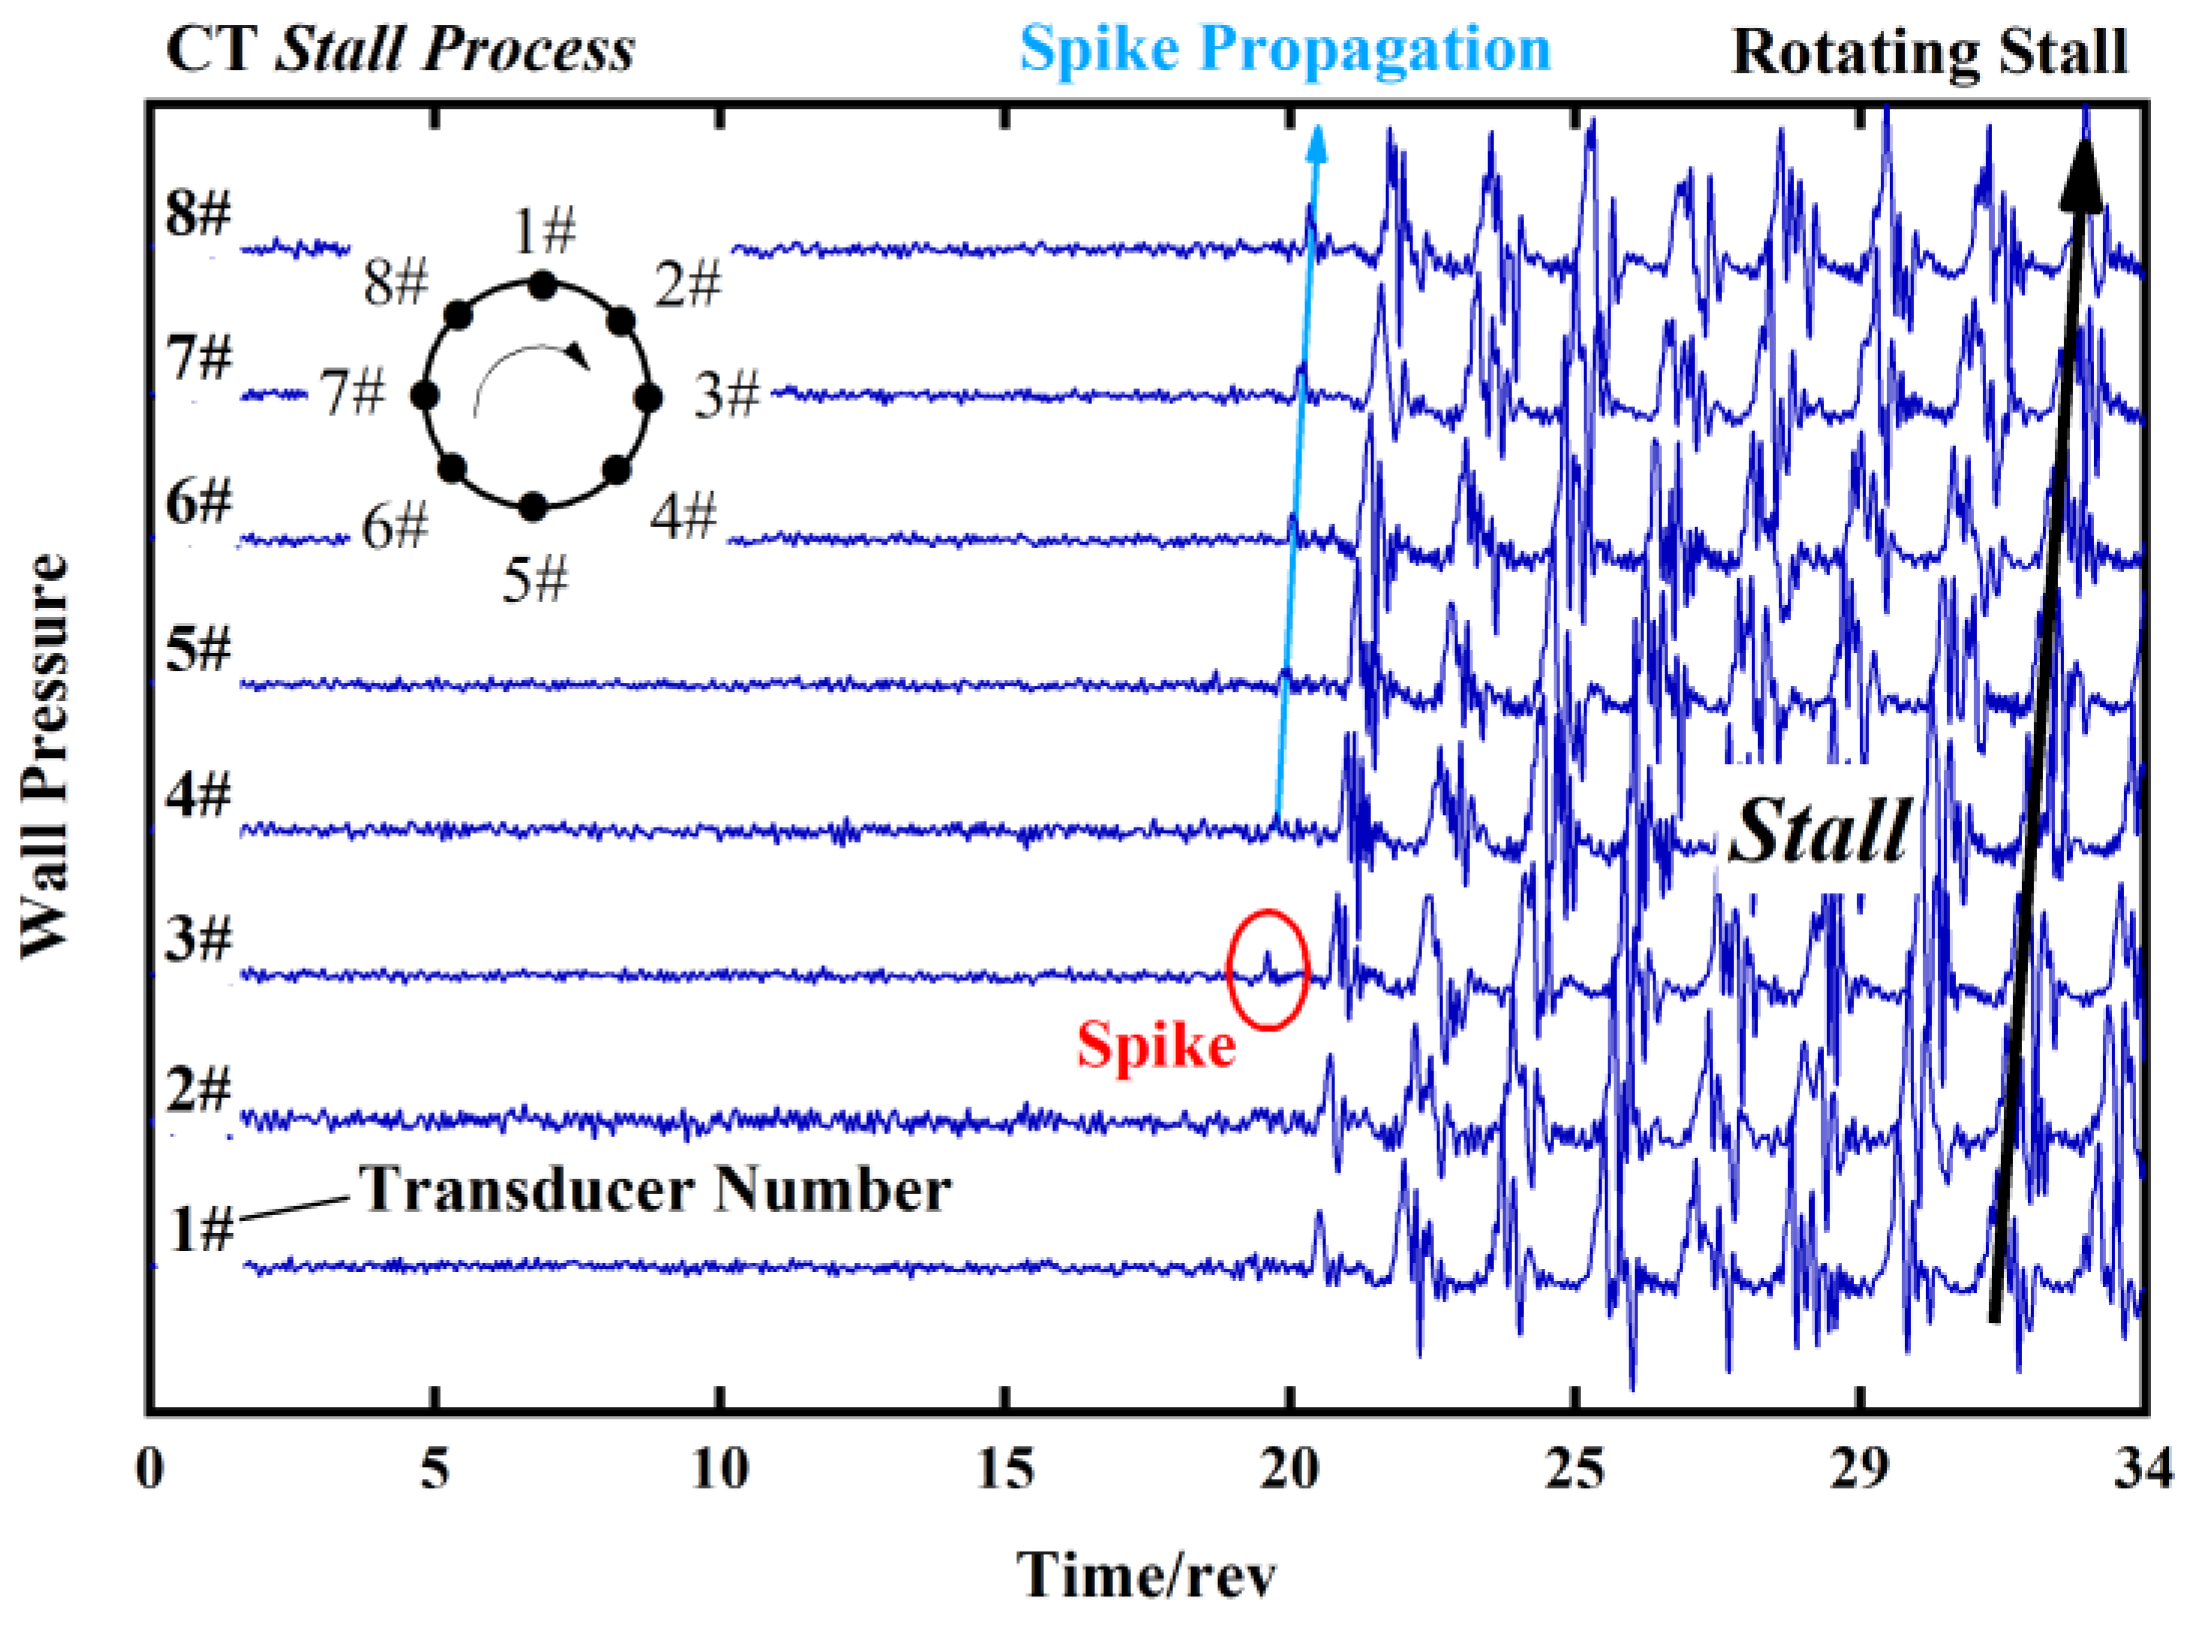
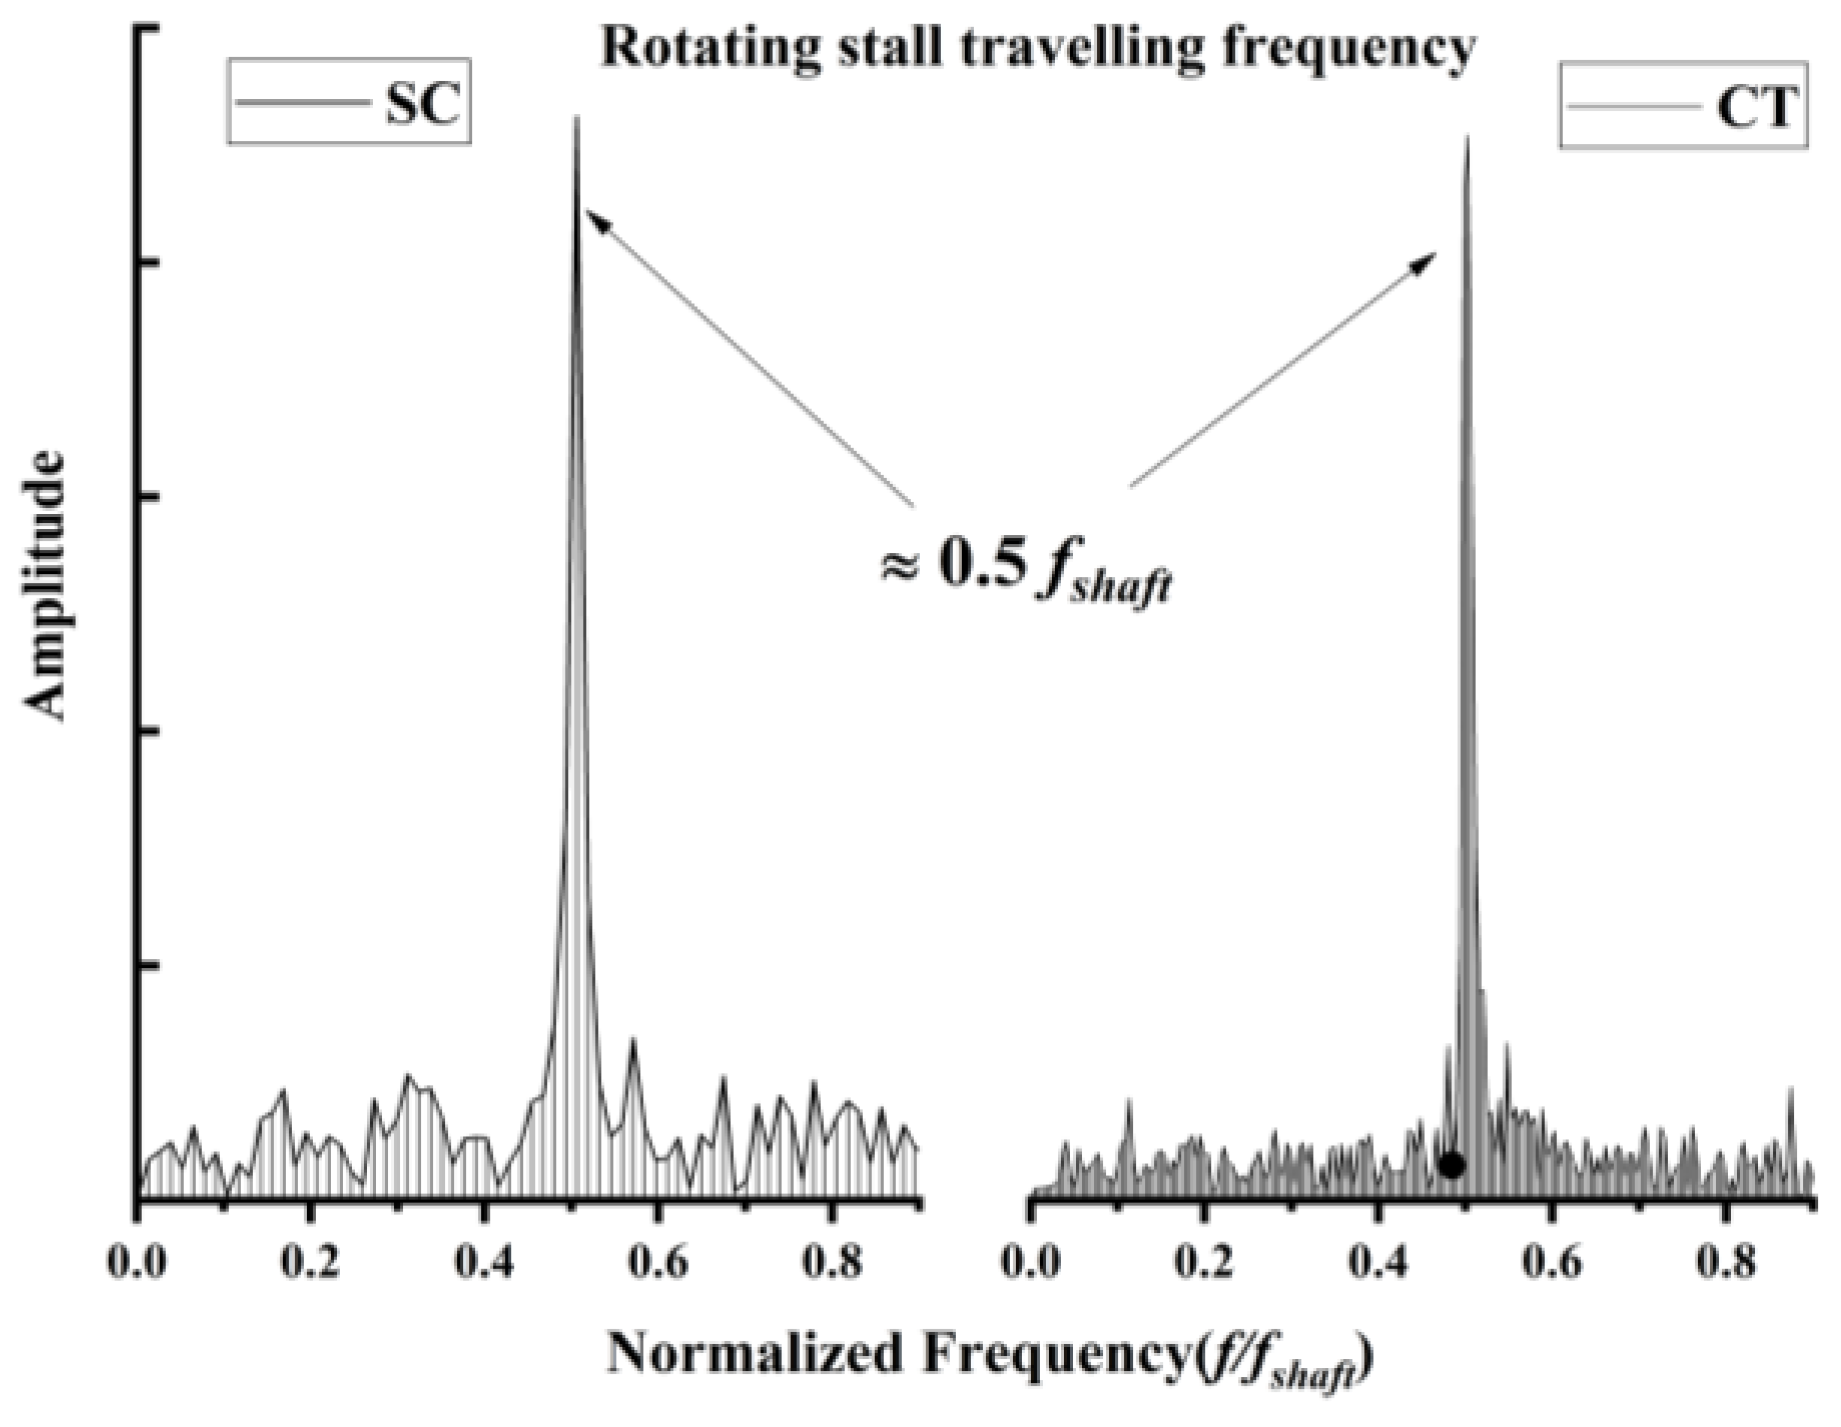
Figure 9 shows the stall process of the compressor with CT. It can be seen that in the CT condition, the compressor also stalls via a spike-type stall onset. In addition, the FFT transform is performed on a single set of transducer measurement data during the stall process of the compressor in SC and CT, respectively. The frequency spectrum for the SC and the CT are shown in
Figure 10. One can see that the travelling frequency of the stall cell is about half that of the compressor rotor frequency in either the SC or CT condition. This indicates that the CT dose not change the travelling speed of the developed rotating stall cell.
3.3. Prestall Disturbances Analysis
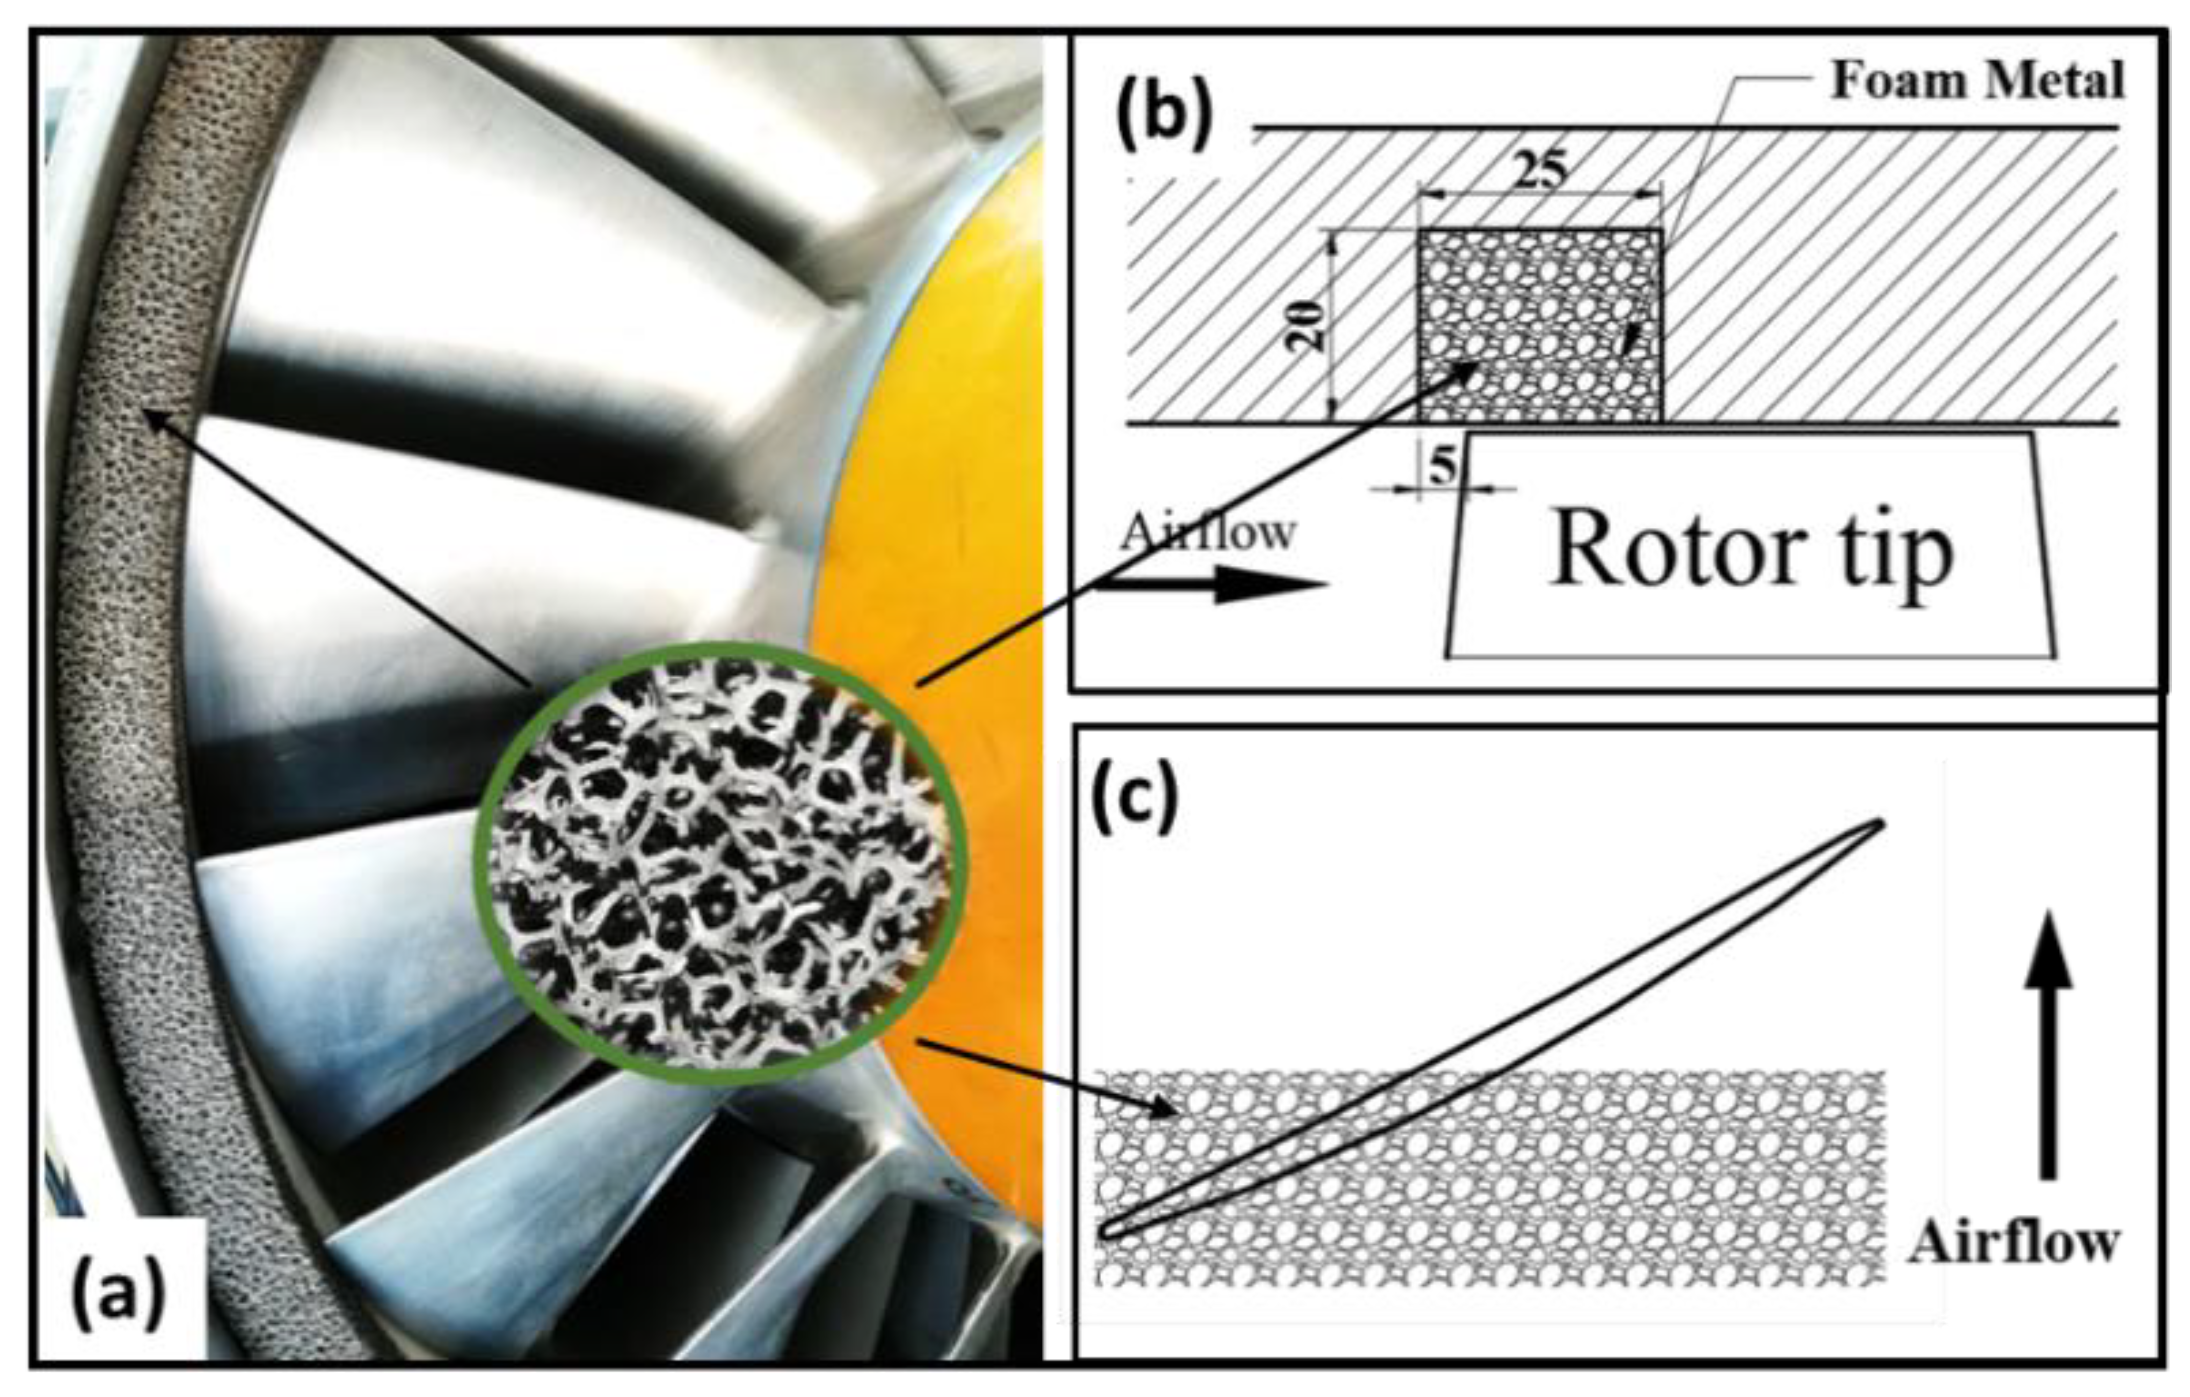
In this section, further attention is placed on the pre-stall stage. It is known that stall precursors are active before the rotating stall occurs. In fact, many flow disturbances appear in the stall process; those which actually trigger the compressor stall are called stall precursors. The key to the active control technology used to improve the stall margin of the compressor is to cancel the stall precursors. We also believe that the energy of the precursors can be suppressed by the CT. As opposed to the solid casings, the foam metal creates a “soft” wall condition for the precursor waves. When these waves are incident in foam metal surface, part of the wave will penetrate into the foam metal and be dissipated. Based on the understanding above, we can compare the energy level of the flow disturbances at the same operating point of the compressor in both SC and CT.
As He [
24] has pointed out, the most unstable mode of disturbance is generally concentrated in the lower order. In the present experiment, the first mode of flow disturbances is investigated. The modal information can be obtained by performing the spatial Fourier decomposition of the data measured by the eight transducers, as presented in
Section 3.2. The calculated Fourier coefficient is a complex number containing information on the spatial position and amplitude of the propagating disturbances. As shown in Equation (5), we refer the Fourier coefficient as
Ck.
Ck is a function of time and the mode
k.
In Equation (5), is the pressure measurements from the n-th transducer of N high-response transducers. N is 8 in the present experiment.
In addition, the power spectrum density (
PSD) is calculated based on the FFT on
Ck. To be specific,
F(
ω) is the FFT coefficient of
Ck, and the
PSD is calculated from
where
M is the total number of the data points. More detail can be found in Ref. [
25].
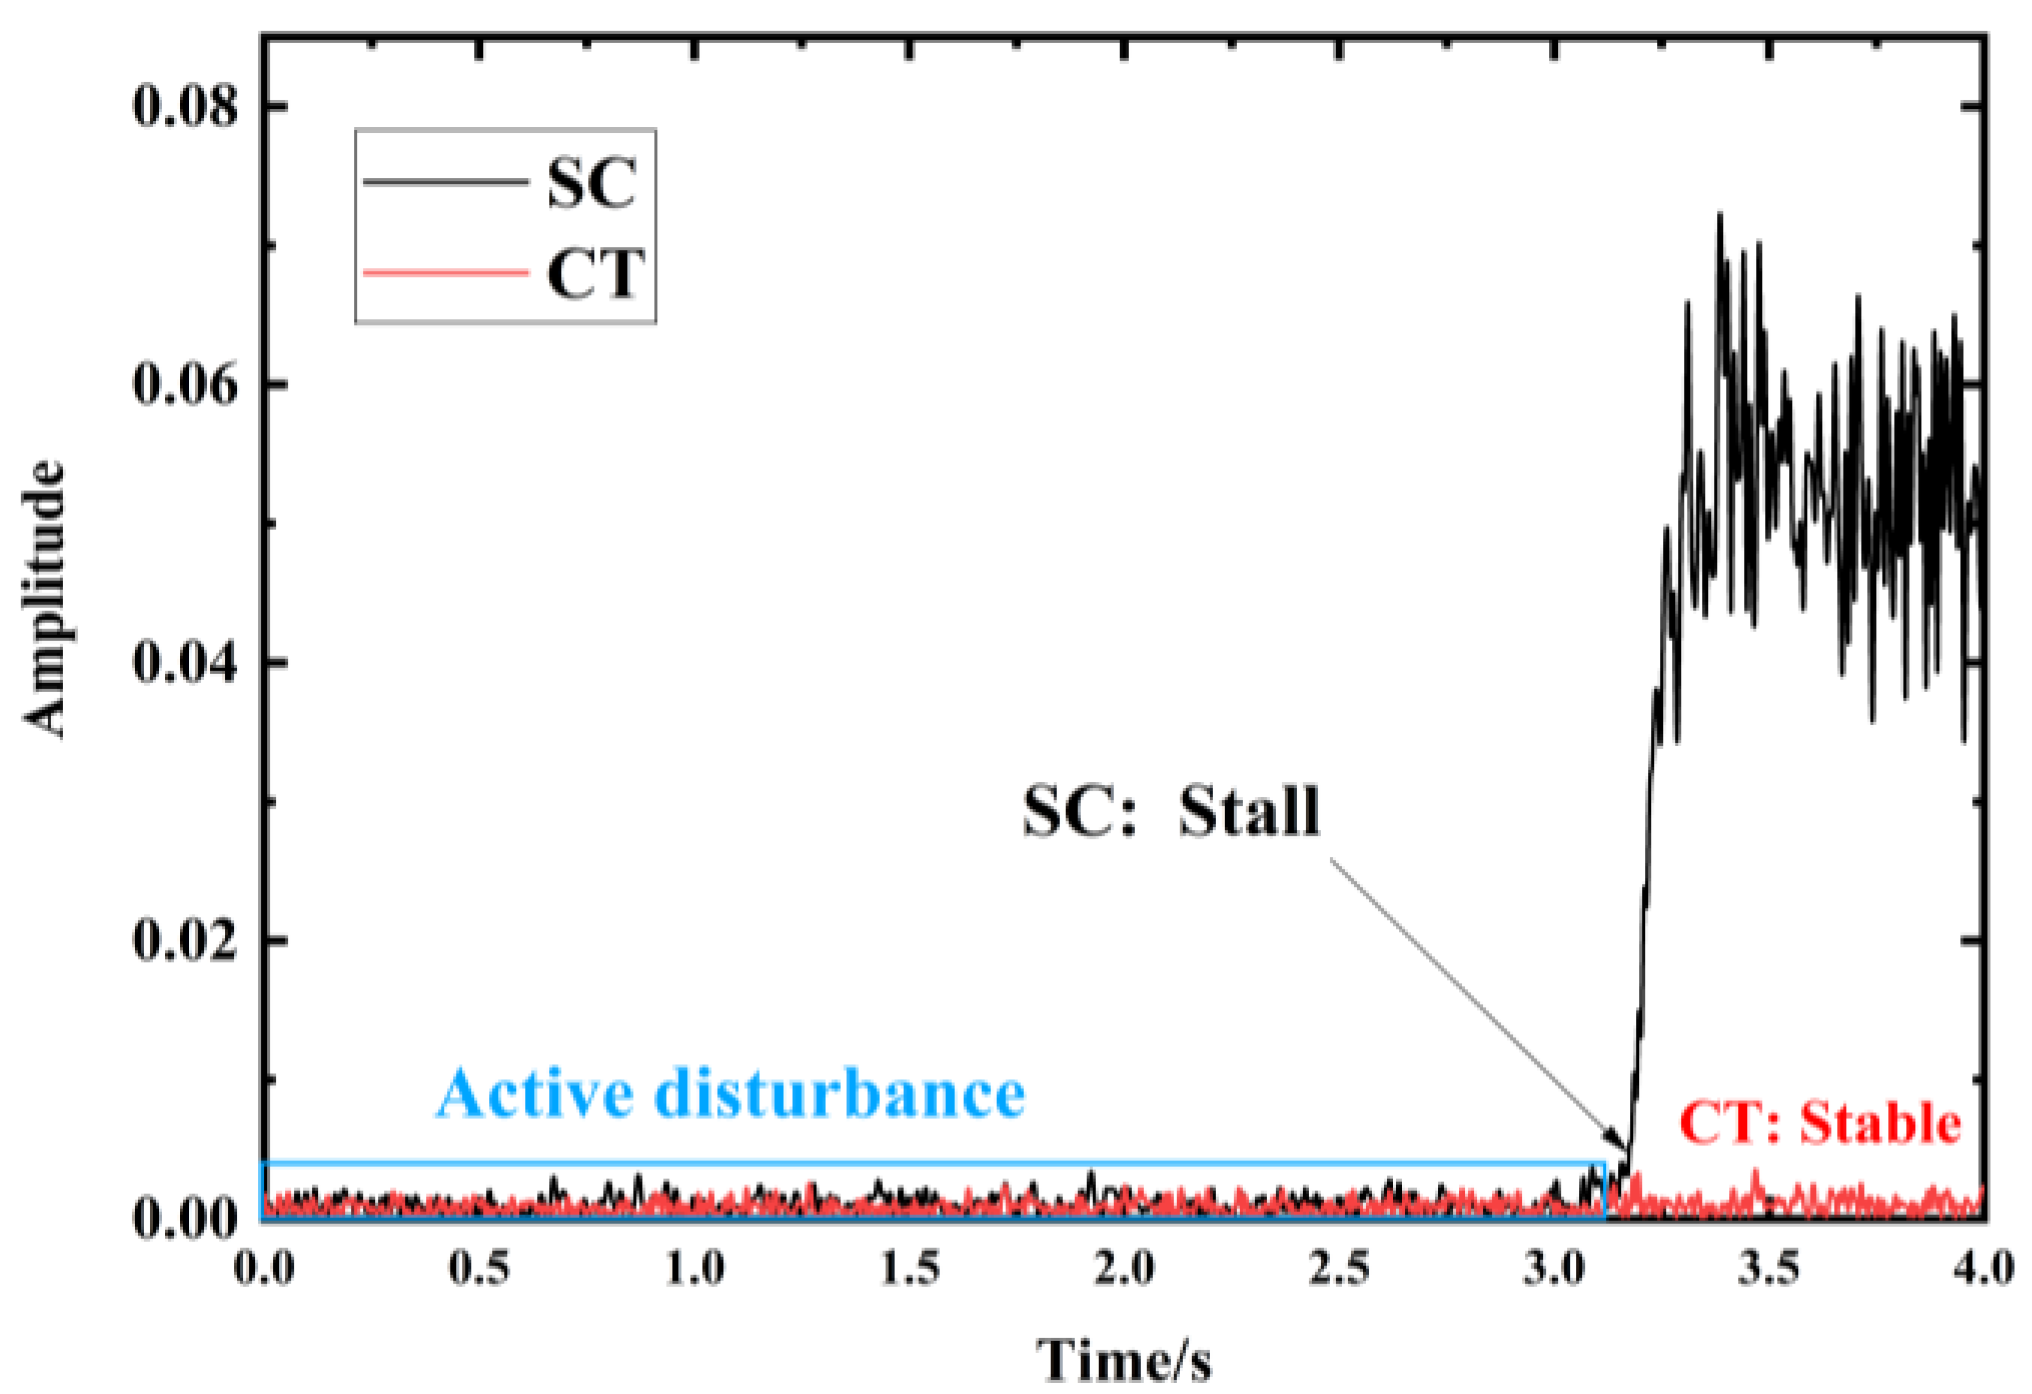
Figure 11 presents the amplitude of
C1 evolving over time. The black line refers to the SC condition, while the red line corresponds to the CT condition. As marked by a blue box, the flow disturbances are active, since the amplitude is not zero. When the compressor is throttling to a small mass flow point, in SC, the amplitude of disturbance is increased rapidly, which means that the rotating stall occurs. However, in CT, the disturbance amplitude remains at the same low level as before.
In the frequency domain, the disturbance energy is calculated and compared. Two sets of 100 revolutions-long data before the stall point of the compressor in the SC are measured; one is obtained in the SC condition, and the other is obtained in the CT condition. In
Figure 12, the left graph shows the
PSD spectrum in the SC, and the right graph shows that in the CT. Two things are obvious: first, the peak value of
PSD is decreased in CT. Second, the disturbance energy in the wide band range is also reduced. It is suggested that, in the CT condition, disturbances in a wide range of frequency bands are suppressed. As a result, the development of the disturbances (including stall precursors) is restricted. This is the reason why the stall is delayed.
3.4. Rotor Tip Flow Field
Tip clearance flow plays an important role in compressor stability, especially for the compressor that stalls via the spike-type stall inception. Vo et al. [
10] proposed two necessary conditions related to tip clearance flow for the formation of spike disturbances: one is that the interface of the tip leakage flow and the incoming main flow become parallel to the inlet plane of the rotor at the LE (leading edge). The second is that a backflow of fluid in the adjacent passage occurs at the TE (trailing edge). Tip leakage flow is a flow structure through the blade tip clearance driven by the pressure difference between the pressure and suction sides of the blades. A tip leakage vortex (TLV) formed when the shear of the tip leakage flow and the incoming flow occurs. With increasing blade loading, the trajectory of TLV, as well as the interface of the tip leakage flow and the incoming flow, moves upstream.
With a goal to investigate the stall margin improvement mechanism of CT, in this section, the flow structures of the rotor tip region in SC and CT are analyzed.
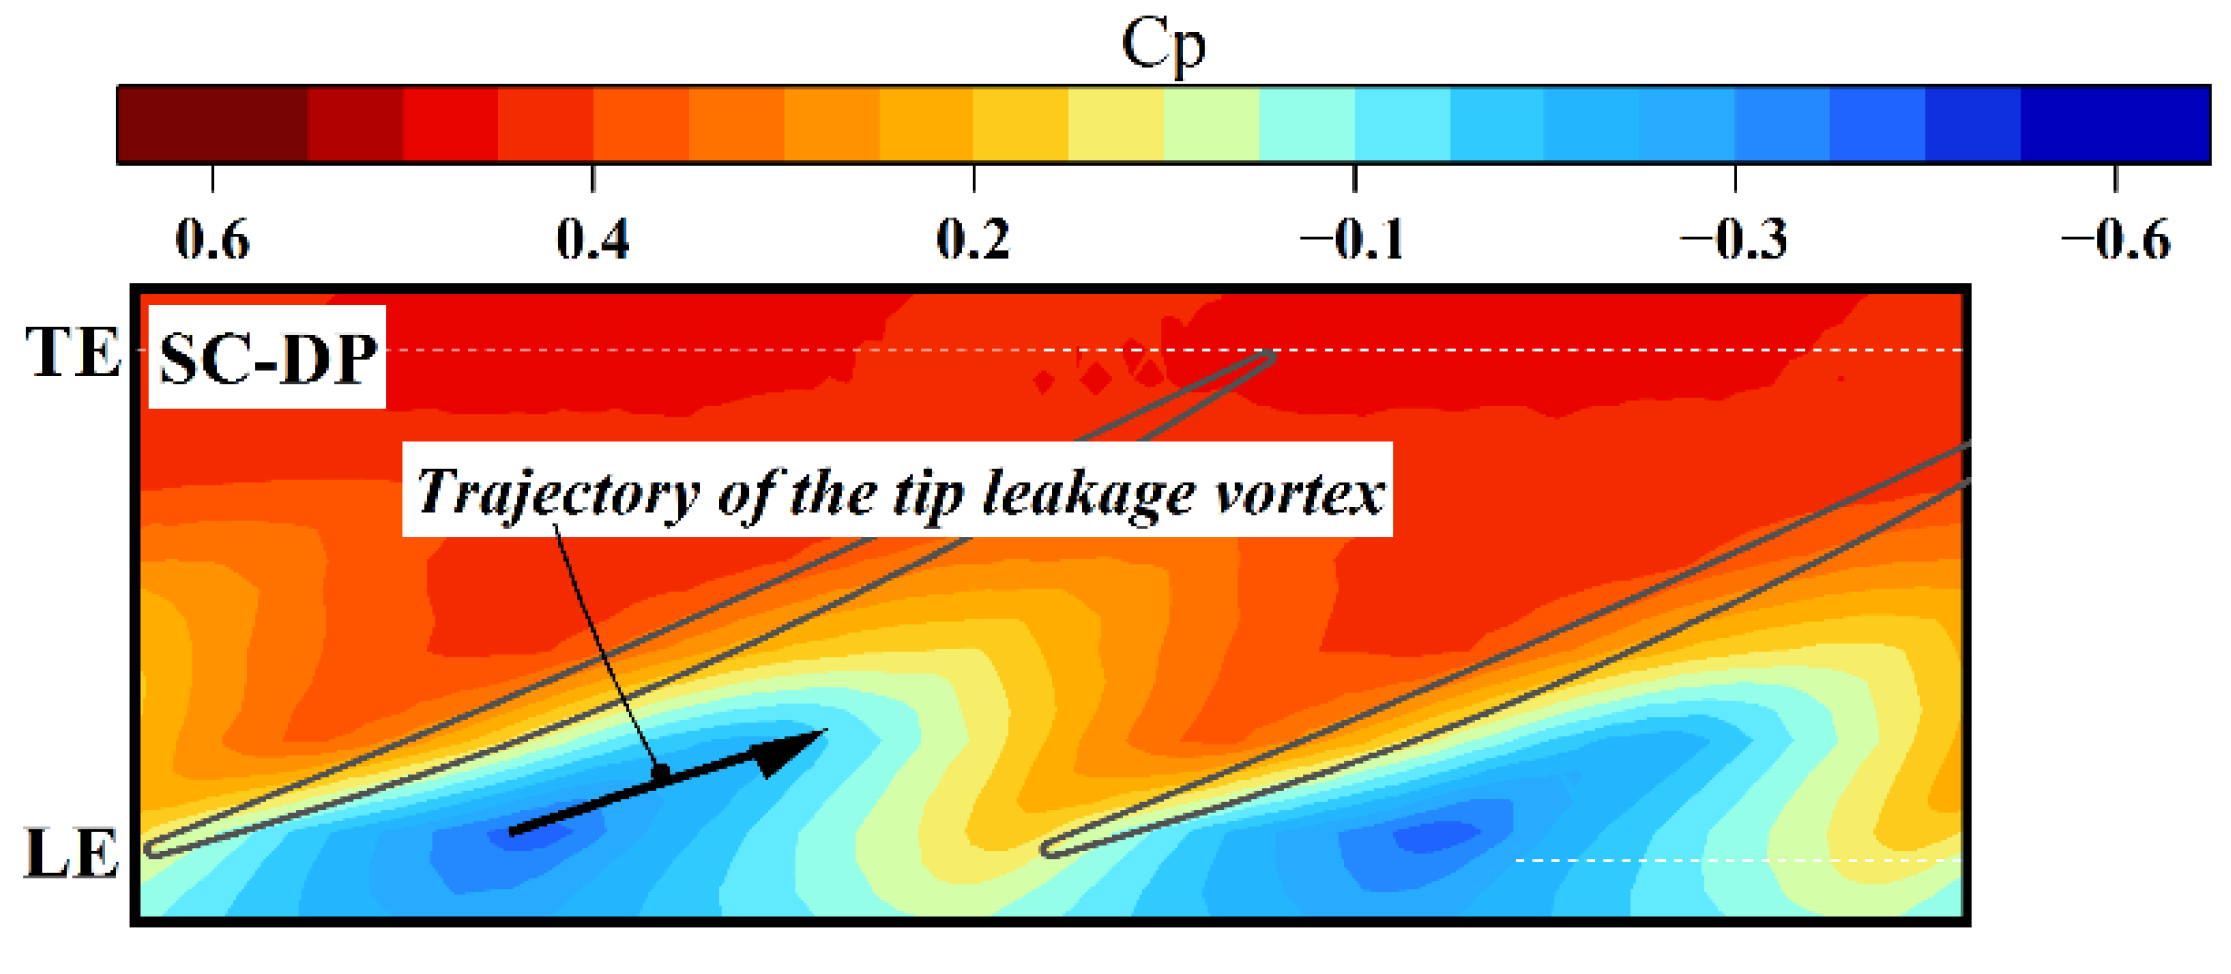
Figure 13 shows the phase-locked wall pressure contours of the compressor at DP (the design point in SC).
is the normalized wall pressure defined as
where the
is the measured wall pressure when the compressor is operating, and the
is the wall pressure obtained when the compressor is not operating.
In
Figure 13, the position of LE and TE for the rotor blade, respectively, are shown by white dashed lines. The trajectory of the TLV is marked by a black arrow. It is seen that the TLV is formed on the suction side of the blade near the LE and is developed downstream of the passage.
The root-mean-square (
RMS) of
Cp, used as an indicator of the flow unsteadiness, is calculated by
where
N is the number of revolutions. The
Cp(
i) is the non-dimensional pressure at the
i-th revolution, and
is the average of
Cp(
i) s in
N revolutions.
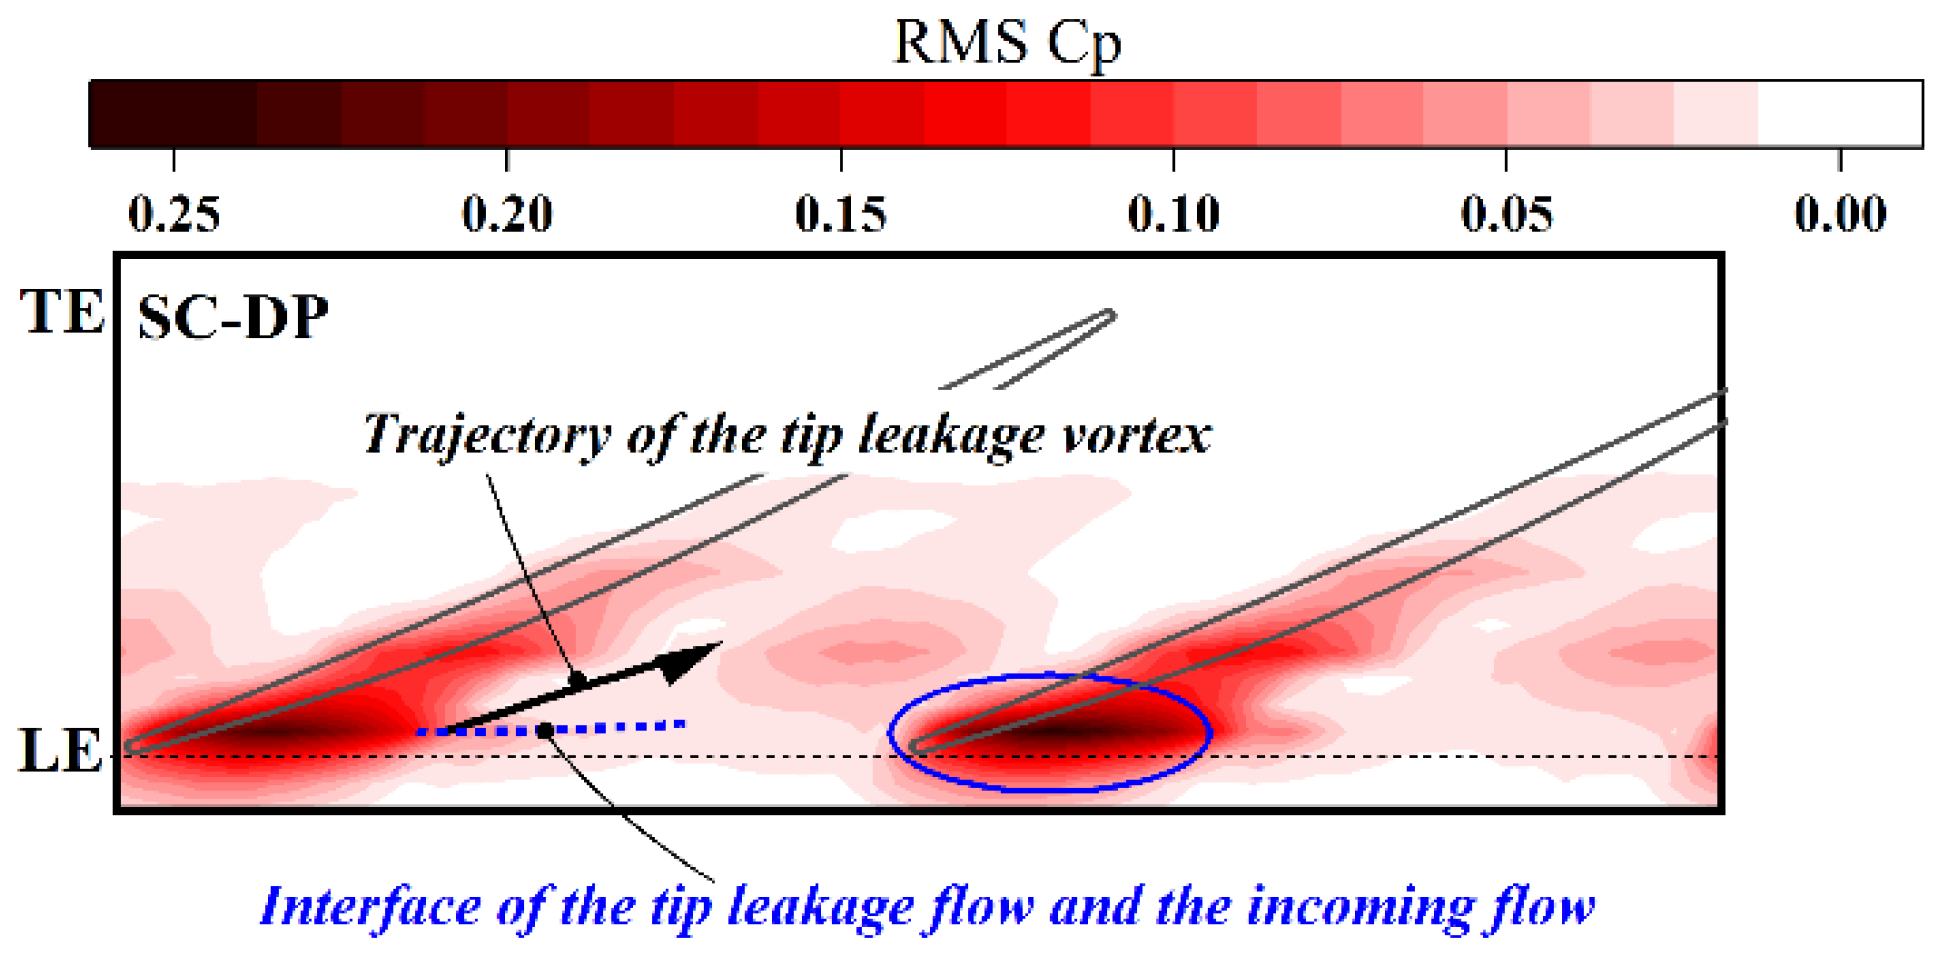
Figure 14 shows the
RMS Cp contour of the compressor at DP in the SC condition. As circled by a blue oval, the highest
RMS Cp concentrates near LE on the suction side of blade tip. This is the region where the tip leakage flow and the incoming flow meet. The interaction of these two flows in different directions results in a strong pressure fluctuation. Another high
RMS region, indicated by a blue dashed line, refers to the interface of the tip leakage flow and the incoming flow.
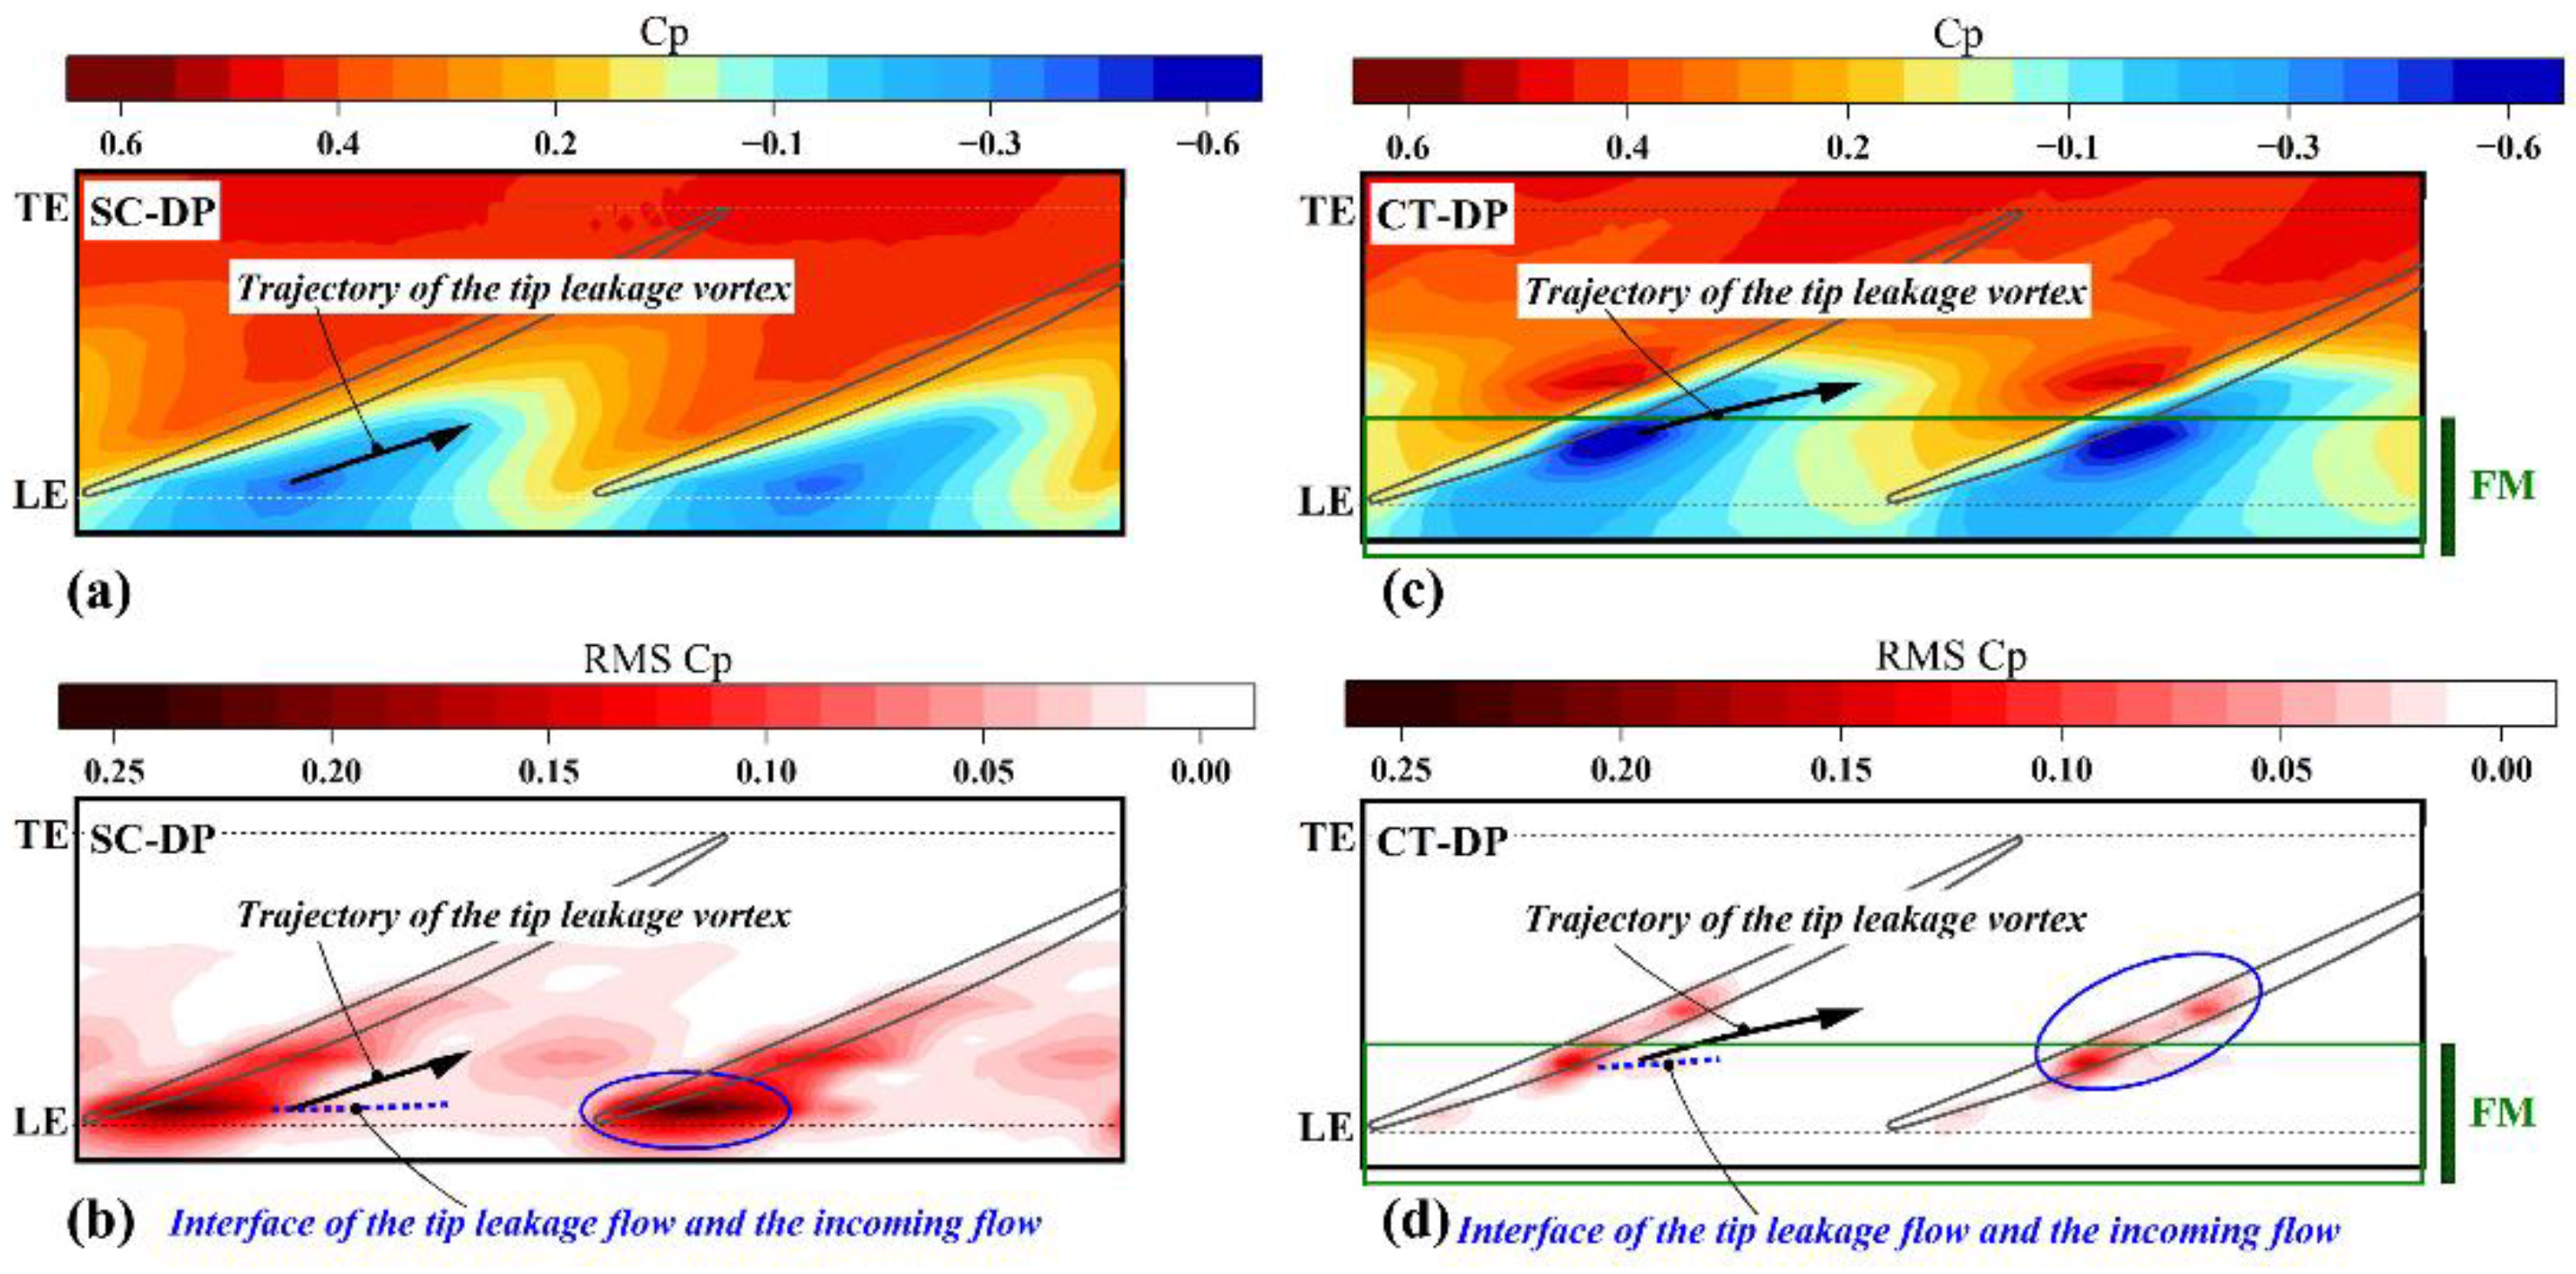
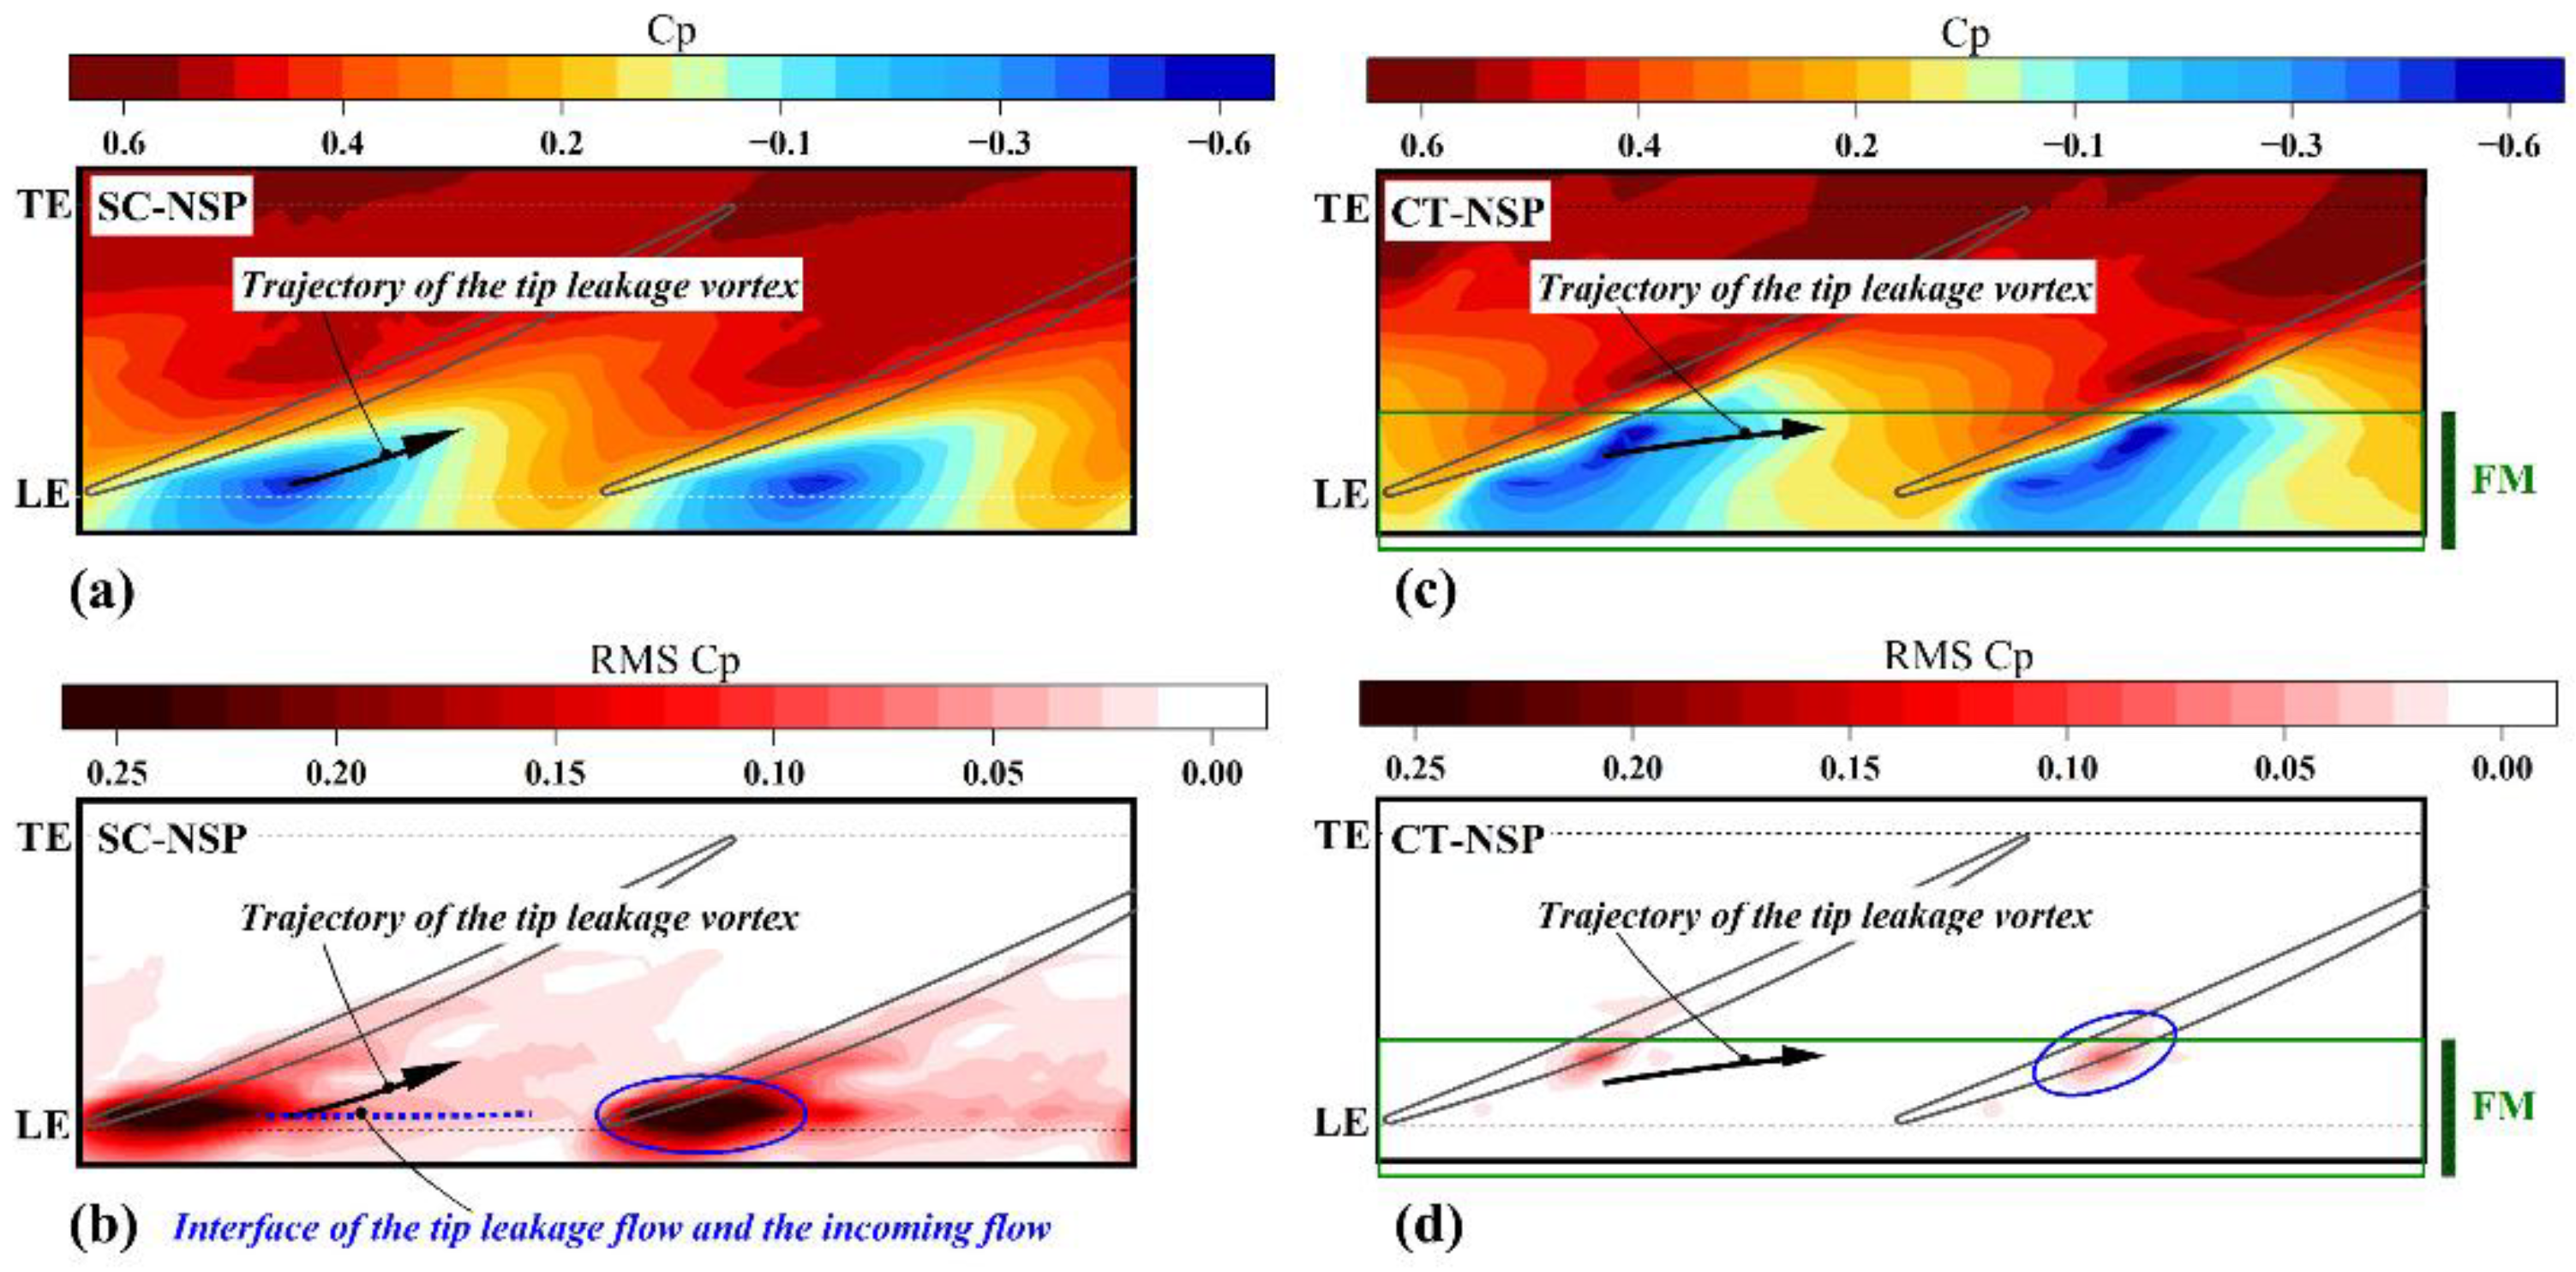
A comparison between the flow structures of the compressor at DP, with and without CT, is shown in
Figure 15. In
Figure 15c,d, the region covered by foam metal is marked by a green box and labeled as FM. One can see in
Figure 15c that the minimum pressure area is near the trailing edge of the foam metal ring. However, in SC, the area is located near the LE of the blade. The minimum pressure region is thought of as the origination of the TLV. It is suggested that in CT, the TLV is rolling up at the further downstream position of the passage compared with that in the SC. In addition, differences can be seen in the trajectory of the TLV for the two conditions such that the TLV tends to occur at the adjacent blade in the CT.
Figure 15d shows the
RMS contours in the CT. There are three features that should be considered. First, the highest
RMS region near the LE, as circled in
Figure 15b, disappears in the CT condition. The second difference is that the highest
RMS region appears near the trailing edge of the foam metal ring where the TLV is formed. Third, as indicated by a blue dashed line, the interface of the tip leakage flow and the incoming flow is also located further downstream, compared with that in the SC.
The flow structures in SC and CT when the compressor is throttled into NSP (the near stall point in SC) are show in
Figure 16. In SC, it is seen that the TLV is still in the blade passage. The interface of the tip leakage flow and the incoming flow is nearly parallel to the LE plane of the rotor. The notable change is that the
RMS level near the LE is increased. This can be understood if one remembers that the strength of the tip leakage is increasing with the throttling process, since the blade loading is increasing at the same time. In CT, as marked by a black arrow, the trajectory of the TLV is more circumferential, but it is still located near the trailing edge of the foam metal ring. It is shown in
Figure 16d that the highest
RMS region is still concentrated near the corner of the suction side of the blade and the trailing edge of the foam metal ring.
These comparisons made between the flow structures of the compressor in SC and CT suggest that the CT affects the behavior of the tip clearance. First of all, the origination point of the TLV is moved to the downstream position of the passage in CT. In the regions covered by the foam metal, the tip leakage flow is weak, hence the rolling-up of the TLV is unsustainable. Since the strength of the tip leakage flow is determined by the local blade loading, it is thus deduced that the blade loading is reduced in this region. This conclusion can also be confirmed if one can compares the pressure contours covered by the foam metal in
Figure 15a,c or
Figure 16a,c. On the other hand, at NSP, the interface of the tip leakage flow and the incoming flow is nearly parallel to the LE of rotor. However in CT, the interface is located downstream.
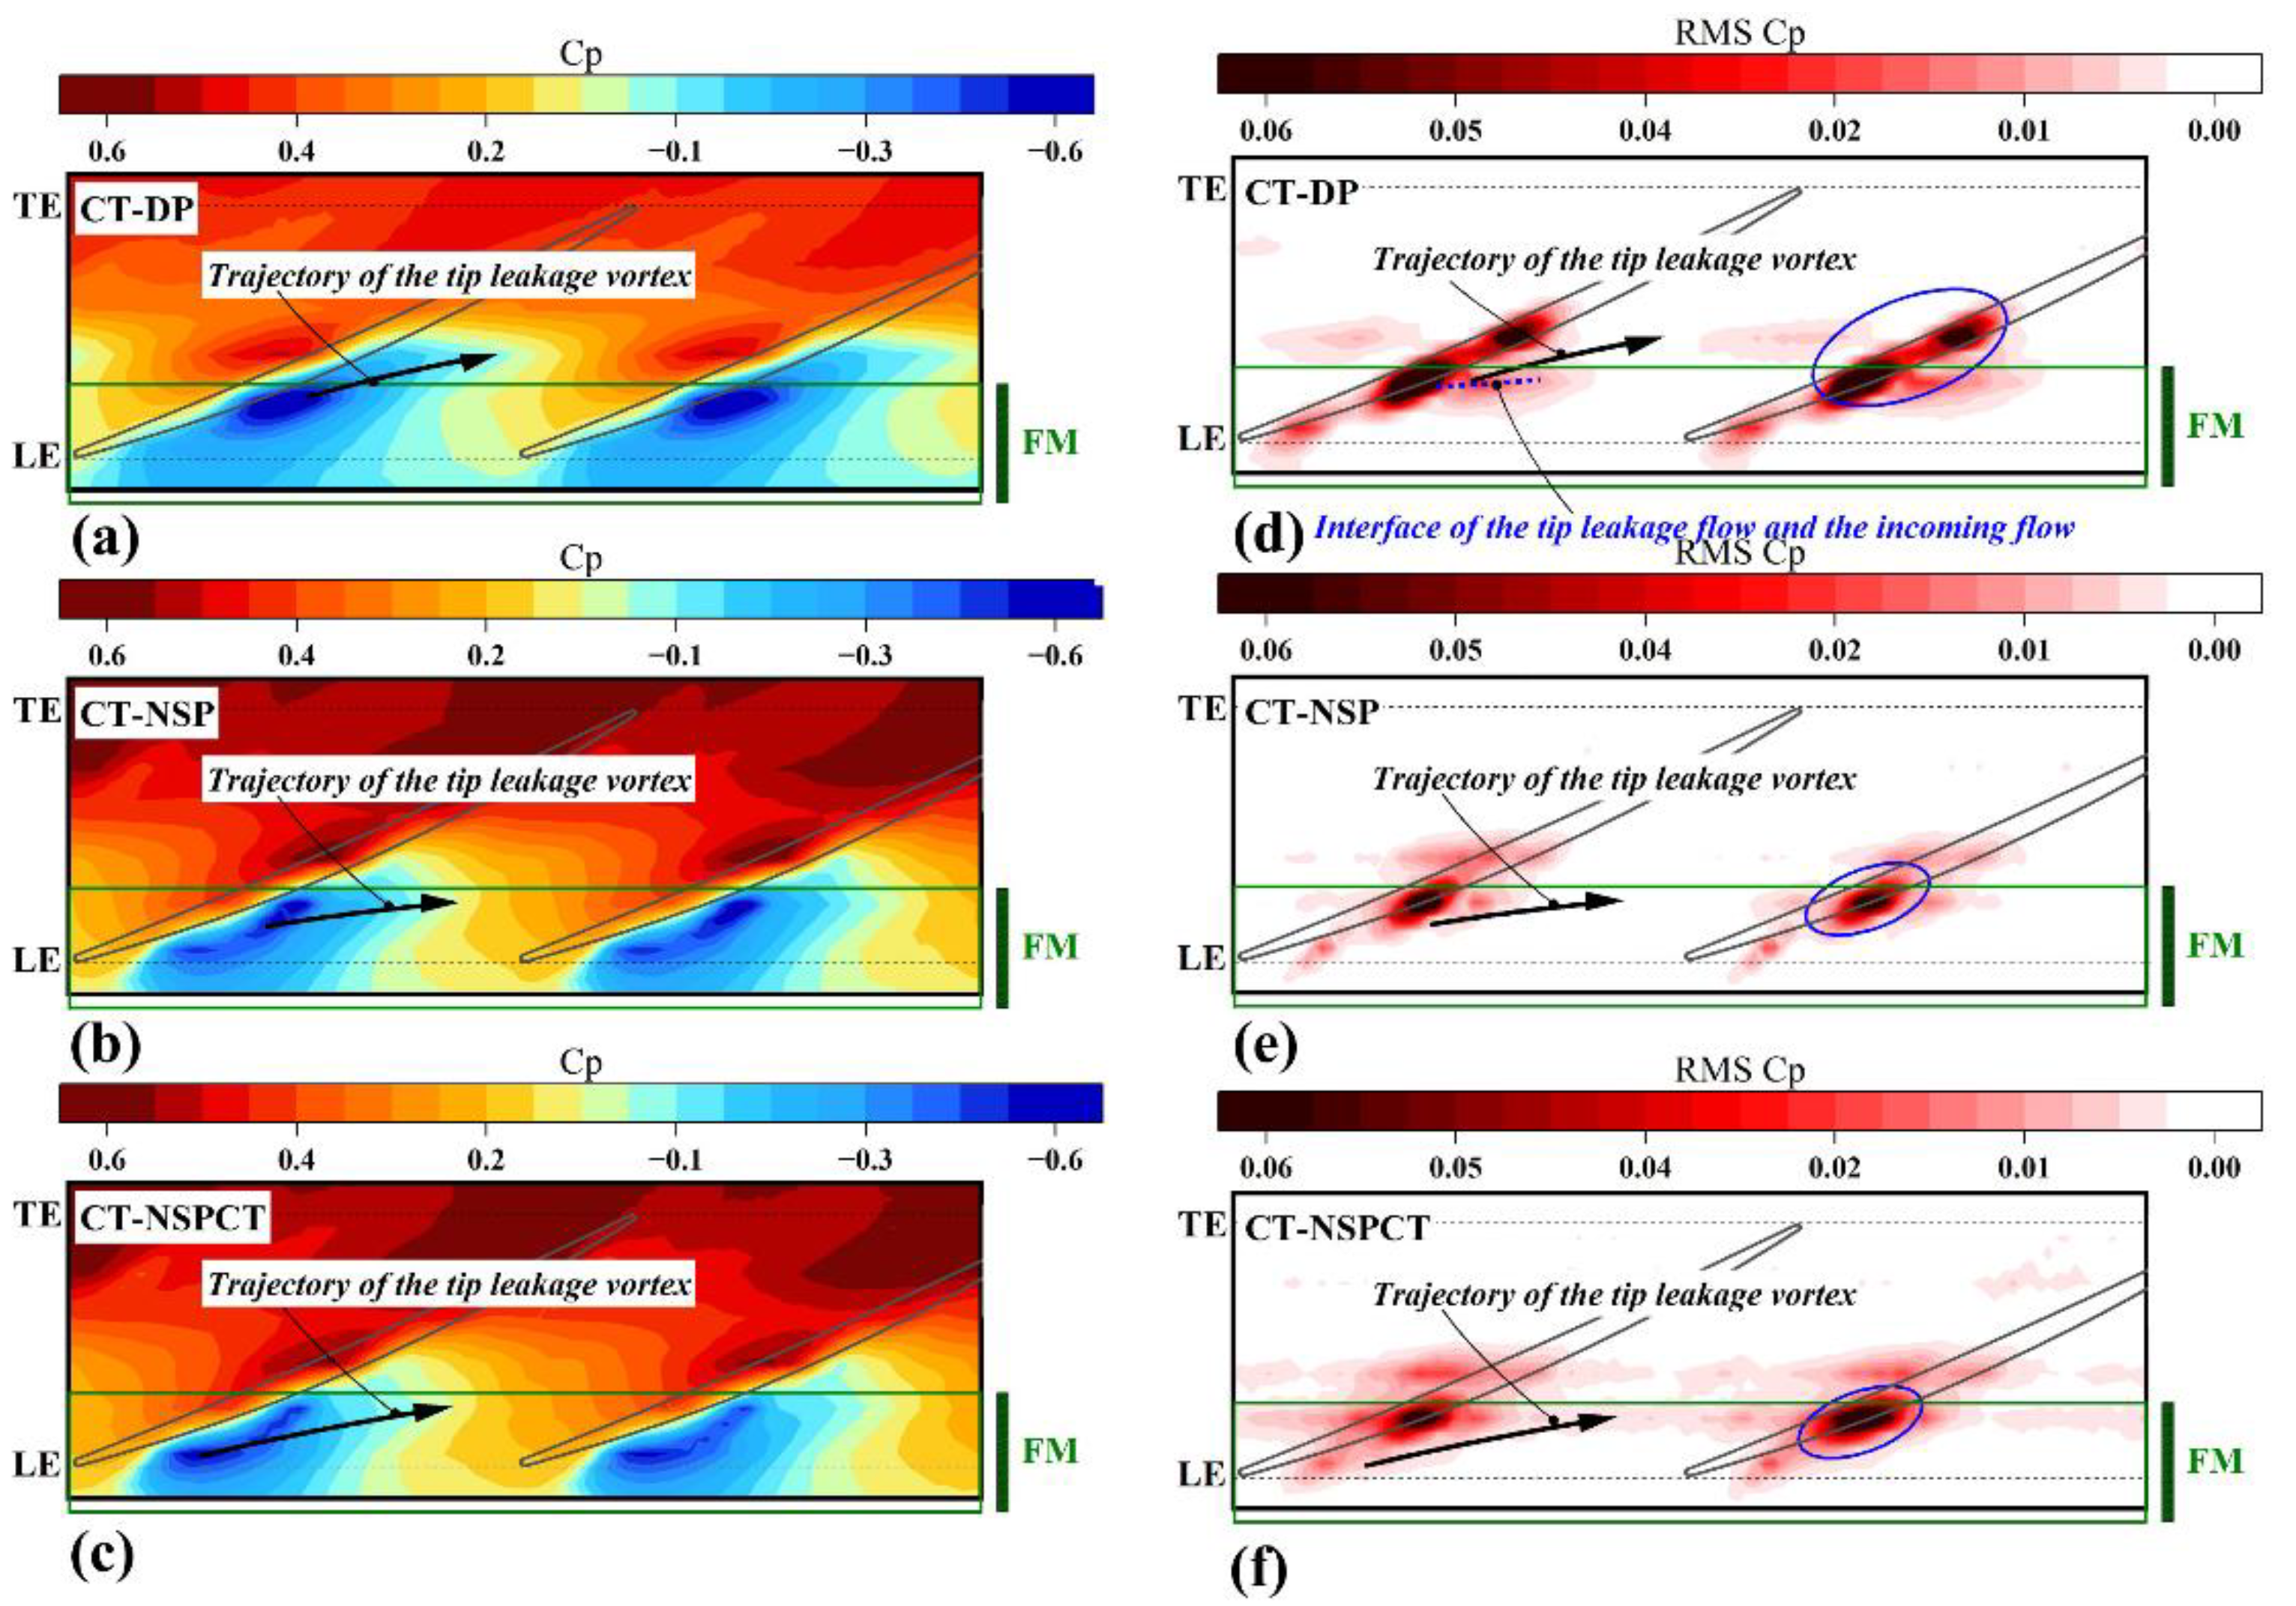
To further understand the behavior of the TLV in CT, the flow structure of the compressor at NSPCT (the near stall point in CT) is plotted in
Figure 17. The scale of the
RMS contours is adjusted to provide more information. When the compressor is throttling from DP to NSPCT, it is shown in
Figure 17a–c that the position of the minimum pressure region is moved upstream from the trailing edge of the foam metal ring to the place near the LE of the rotor. It is noted that for the compressor in the SC, the peak loading position on the rotor blades moves to the leading edge during the throttling process [
26]. In the CT, because the blade loading is reduced in the region near the LE of the rotor blade, at NSP, the region of the maximum blade loading is located near the trailing edge of the foam metal ring.
In
Figure 17d–f, one can see that at DP, there are two higher
RMS regions on both sides of the trailing edge of the foam metal ring. At NSP, there is only one highest
RMS region located in the corner of the blade suction side and the trailing edge of the foam metal ring. To further throttle the compressor to the NSPCT, the highest
RMS region dose not moved upstream. It is thus deduced that in the CT, the origination and the evolution of the TLV are influenced by the foam metal. In the CT, the TLV is formed at a position further downstream, and its trajectory tends to be circumferential, but is still located in the blade passage when the compressor is operating at NSP.
3.5. Frequency Spectrum Analysis
The analysis on the tip flow structure is further performed in the frequency domain, as shown in
Figure 18. The three operating points regarding the characteristics are presented in
Figure 18f. The three graphs in the upper part of the
Figure 18 are related to the CT, and the lower two graphs are corresponding to the SC. In each graph, the ordinate is the frequency normalized by the rotor frequency. The frequency at ordinate 20 is the BPF. The abscissa is the spatial location of the transducers, and the positions of the LE and the TE are marked by white lines, respectively. At DP, in the SC, the peak at BPF corresponds to a disturbance associated with a slight rotor asymmetry. While in the CT, in the region from LE to about 50% of the blade chord, the peak at BPF may be related to the pressure fluctuation caused by the in and out flow from the foam metal. At NSP, we can see in
Figure 18e that a frequency band concentrates near the LE of the rotor. This is because the interface of the tip leakage flow and the incoming flow is nearly parallel to the LE in this region. The interaction of these two flows results in a strong pressure fluctuation. However, in
Figure 18b, a band from 15% to 50% of the blade chord is dominant. This is because the TLV is formed in this region, as shown in
Figure 17e. When the compressor is throttling to NSPCT, the peak frequency is in the band from 15% to 50% of the blade chord, but the strength of the fluctuation is increased. This phenomenon coincides with the results in
Figure 17f.


