1. Introduction
In the engine operating condition, the working gas temperature in the High-Pressure Turbine (HPT) is often above 1800 K [
1]. The turbine blade has to be effectively cooled to ensure that the surface temperature is lower than the melting point of the blade material. The typical gas-to-wall temperature ratio (TR) in the engine is in the range of 1.5 to 1.7. Such high TRs usually cannot be easily achieved in most of the cold experimental studies in turbine heat transfer. The assumption is that the aerodynamic flow structures are independent of TR or can be globally scaled. The classical definition of the heat transfer coefficient (HTC) is considered as independent of the wall temperature and only depends on the local flow structure. Under this assumption, the cold experimental data can be scaled up to the high-temperature condition by matching the Nusselt number.
With the fluid-solid coupling effect considered in the engine condition, the fluid properties can vary with local TR, including density, dynamic viscosity, thermal conductivity, heat capacity, etc. The change in fluid properties will challenge the validity of the basic linear assumption in Newton’s cooling law. Kays et al. [
2] proposed a simple global correction to the Nusselt number correlation obtained at a constant property condition. A similar approach was also adopted by Eckert [
3] and Fitt [
4]. However, if the variation of the property is significant enough, especially in the boundary layer region, the global correction method would not be adequate, as pointed out by Kays et al. [
2]. Fitt [
4] and Petukov [
5] provided both numerical and experimental data to study the dependence of HTC on wall temperature and discussed the issue of the high-temperature scaling of low-temperature experimental data. Perelman [
6] pointed out the problem of the conventional heat transfer calculation approach due to the unclear thermal boundary condition specification. Luikov [
7] indicated that the fluid temperature distribution depends on both fluid dynamics and solid thermal properties, based on Zinnen’s [
8] results. Luikov [
9] further emphasized the limitation of the uncoupled methods by showing some contradictory results in many cases. Maffulli and He [
10,
11] pointed out the importance of TR in turbine blade heat transfer studies. Their numerical results highlight the nonlinear relationship between the tip local heat flux, and a three-point correction approach was proposed.
For conventional film cooling studies, the conjugate heat transfer (CHT) effects and fluid–solid coupling effects were usually ignored, which is doubted by Harrison and Bogard [
12,
13]. For different turbomachinery applications, CHT is reported to have better accuracy [
14,
15]. Starke et al. [
16] carried out a CHT simulation for squealer tip cooling. Compared with conventional thermal studies without coupling, there exist significant differences in the over-tip region, though the global trends were similar. The fluid–solid interaction has an influence on the local flow field.
In high-pressure turbines, transonic Over-Tip Leakage (OTL) flow occurs in the tight tip clearance [
17,
18,
19] due to the large pressure difference between the blade pressure side and suction side. Zhang et al. [
18] provided both experimental and numerical results on a flat blade tip, revealing the existence of a shock wave and the transonic nature of the OTL flow. These flow structures have a significant influence on the heat transfer performance of the blade. The OTL flow is complex due to strong interactions with the cooling injections and the ‘scraping effect’ from the relative casing motion. Due to the very tight clearance, the fluid-solid coupling effect can be significant, and a global correction approach might not be effective. Jiang et al. [
20] carried out transient thermal measurements for blade tip heat transfer at various TRs. Their experimental data indicate that the convective heat transfer coefficient changes significantly with different TR conditions. For a transonic blade tip, the numerical study by Zhang and He [
21] reveals the qualitative influence of TR on the tip aerothermal performance and proposes HTC correction methods.
The majority of the existing laboratory experimental research on OTL flow cannot keep the same TR as the engine condition. With such limitation, it is unclear how much deviation will be introduced by different TR values to the tip HTC and cooling effectiveness. As a case study, a typical squealer tip cooling design was employed in this numerical study, with a specific focus on two different wall thermal boundary conditions. One approximates to the adiabatic condition, with a TR of 1.1; the other one is close to the engine operating condition, with a TR of 1.7. RANS CFD simulation was first validated against experimental data recently published for a squealer tip in a high-speed disk rotor facility (Lu et al. [
22]). The changes in fluid properties near the tip and casing surfaces, the OTL flow structure and the coolant distribution under different TRs are discussed in detail.
2. CFD Method and Validation
In this numerical work, steady RANS CFD was conducted by using the commercial solver ANSYS CFX
® (Zhongran Chi’s group, Shanghai, China). The turbulence model is k-omega shear stress transport (SST) in order to obtain better near-wall behavior and separation prediction. The performance of the k-omega SST model in OTL flow and heat transfer prediction has been previously validated by Maffulli and He [
10], Ma et al. [
23] and Xie et al. [
24]. The blade profile used in this experiment was taken from a typical HP turbine rotor design. The geometry of the squealer tip and the corresponding calculation domain are illustrated in
Figure 1. The computational domain consists of one blade with periodic boundary conditions. The computational domain has an x-direction length of 150 mm and a y-direction length of 125 mm; the chord length of the tip is 70.08 mm. The uniform total pressure and total temperature are used as the inlet boundary conditions of the mainstream and coolant inlet. Averaged static pressure is used as an outlet boundary condition, which allows for 5% pressure variation. The wall velocity of the casing was set to be 140 m/s. Detailed boundary condition information in this study is listed in
Table 1.
The mesh was generated by the software Pointwise v18.3 (Hongmei Jiang’s group, Shanghai, China). Unstructured mesh is used inside the cavity region. To ensure the boundary layer accuracy near the wall surfaces, the near-wall mesh is structured. The y+ distribution on the tip surface for the uncooled result with TR of 1.1 is also shown in
Figure 1. The majority of the area has a y-plus value around 1. For each cooling hole, the mesh is extruded by 1 mm to a chamber as the cooling inlet.
The element-based finite volume method is used to discretize the spatial domain and conserve relevant qualities such as mass, momentum and energy. A high-resolution scheme is chosen as the discretization method for the Advection term and turbulent equations. For the convergence criteria, the residue of the energy term should be less than 10−8, and several points are chosen on the tip (on the outside tip wall, on the tip rim, on the tip inner wall and on the cavity floor) to track the temperature and heat flux change. When all these temperatures and heat fluxes are stable, the result will be regarded as converged.
A mesh independence study was conducted with the uncooled case (TR = 1.1) at three different grid levels (17 million, 21 million and 26 million). For each case, only the number of grid layers inside the tip clearance and the cavity varies. The results in heat transfer and aerodynamics are evaluated.
Figure 2a presents the circumferentially averaged heat flux on the tip surface, while
Figure 2b shows the span-wise averaged OTL mass flux distribution along the axial direction. Evidently, the results from the 21 million and 26 million grids show a negligible difference, and the 21 million grids were employed for all the analyses in this paper to save computational costs.
For each given wall temperature Tw, an approximate calculation method is applied for the heat transfer coefficient by using two cases with a 10 K wall temperature difference (Zhang and He [
16]). Between these two cases, the influence of the TR difference introduced to the OTL flow field and near-wall fluid properties should be minimized. A small temperature interval such as 10 K is chosen in such cases to avoid numerical errors and provide a finite difference approximation of the local tangent slope of a heat flux-wall temperature curve. Too large of a temperature interval will bring non-negligible changes in fluid properties, while too small of an interval will cause truncation and rounding errors.
where T
2 = T
1 − 10 K; q
2 and q
1 are the tip surface wall heat fluxes when the wall temperatures are T
1 and T
2, respectively.
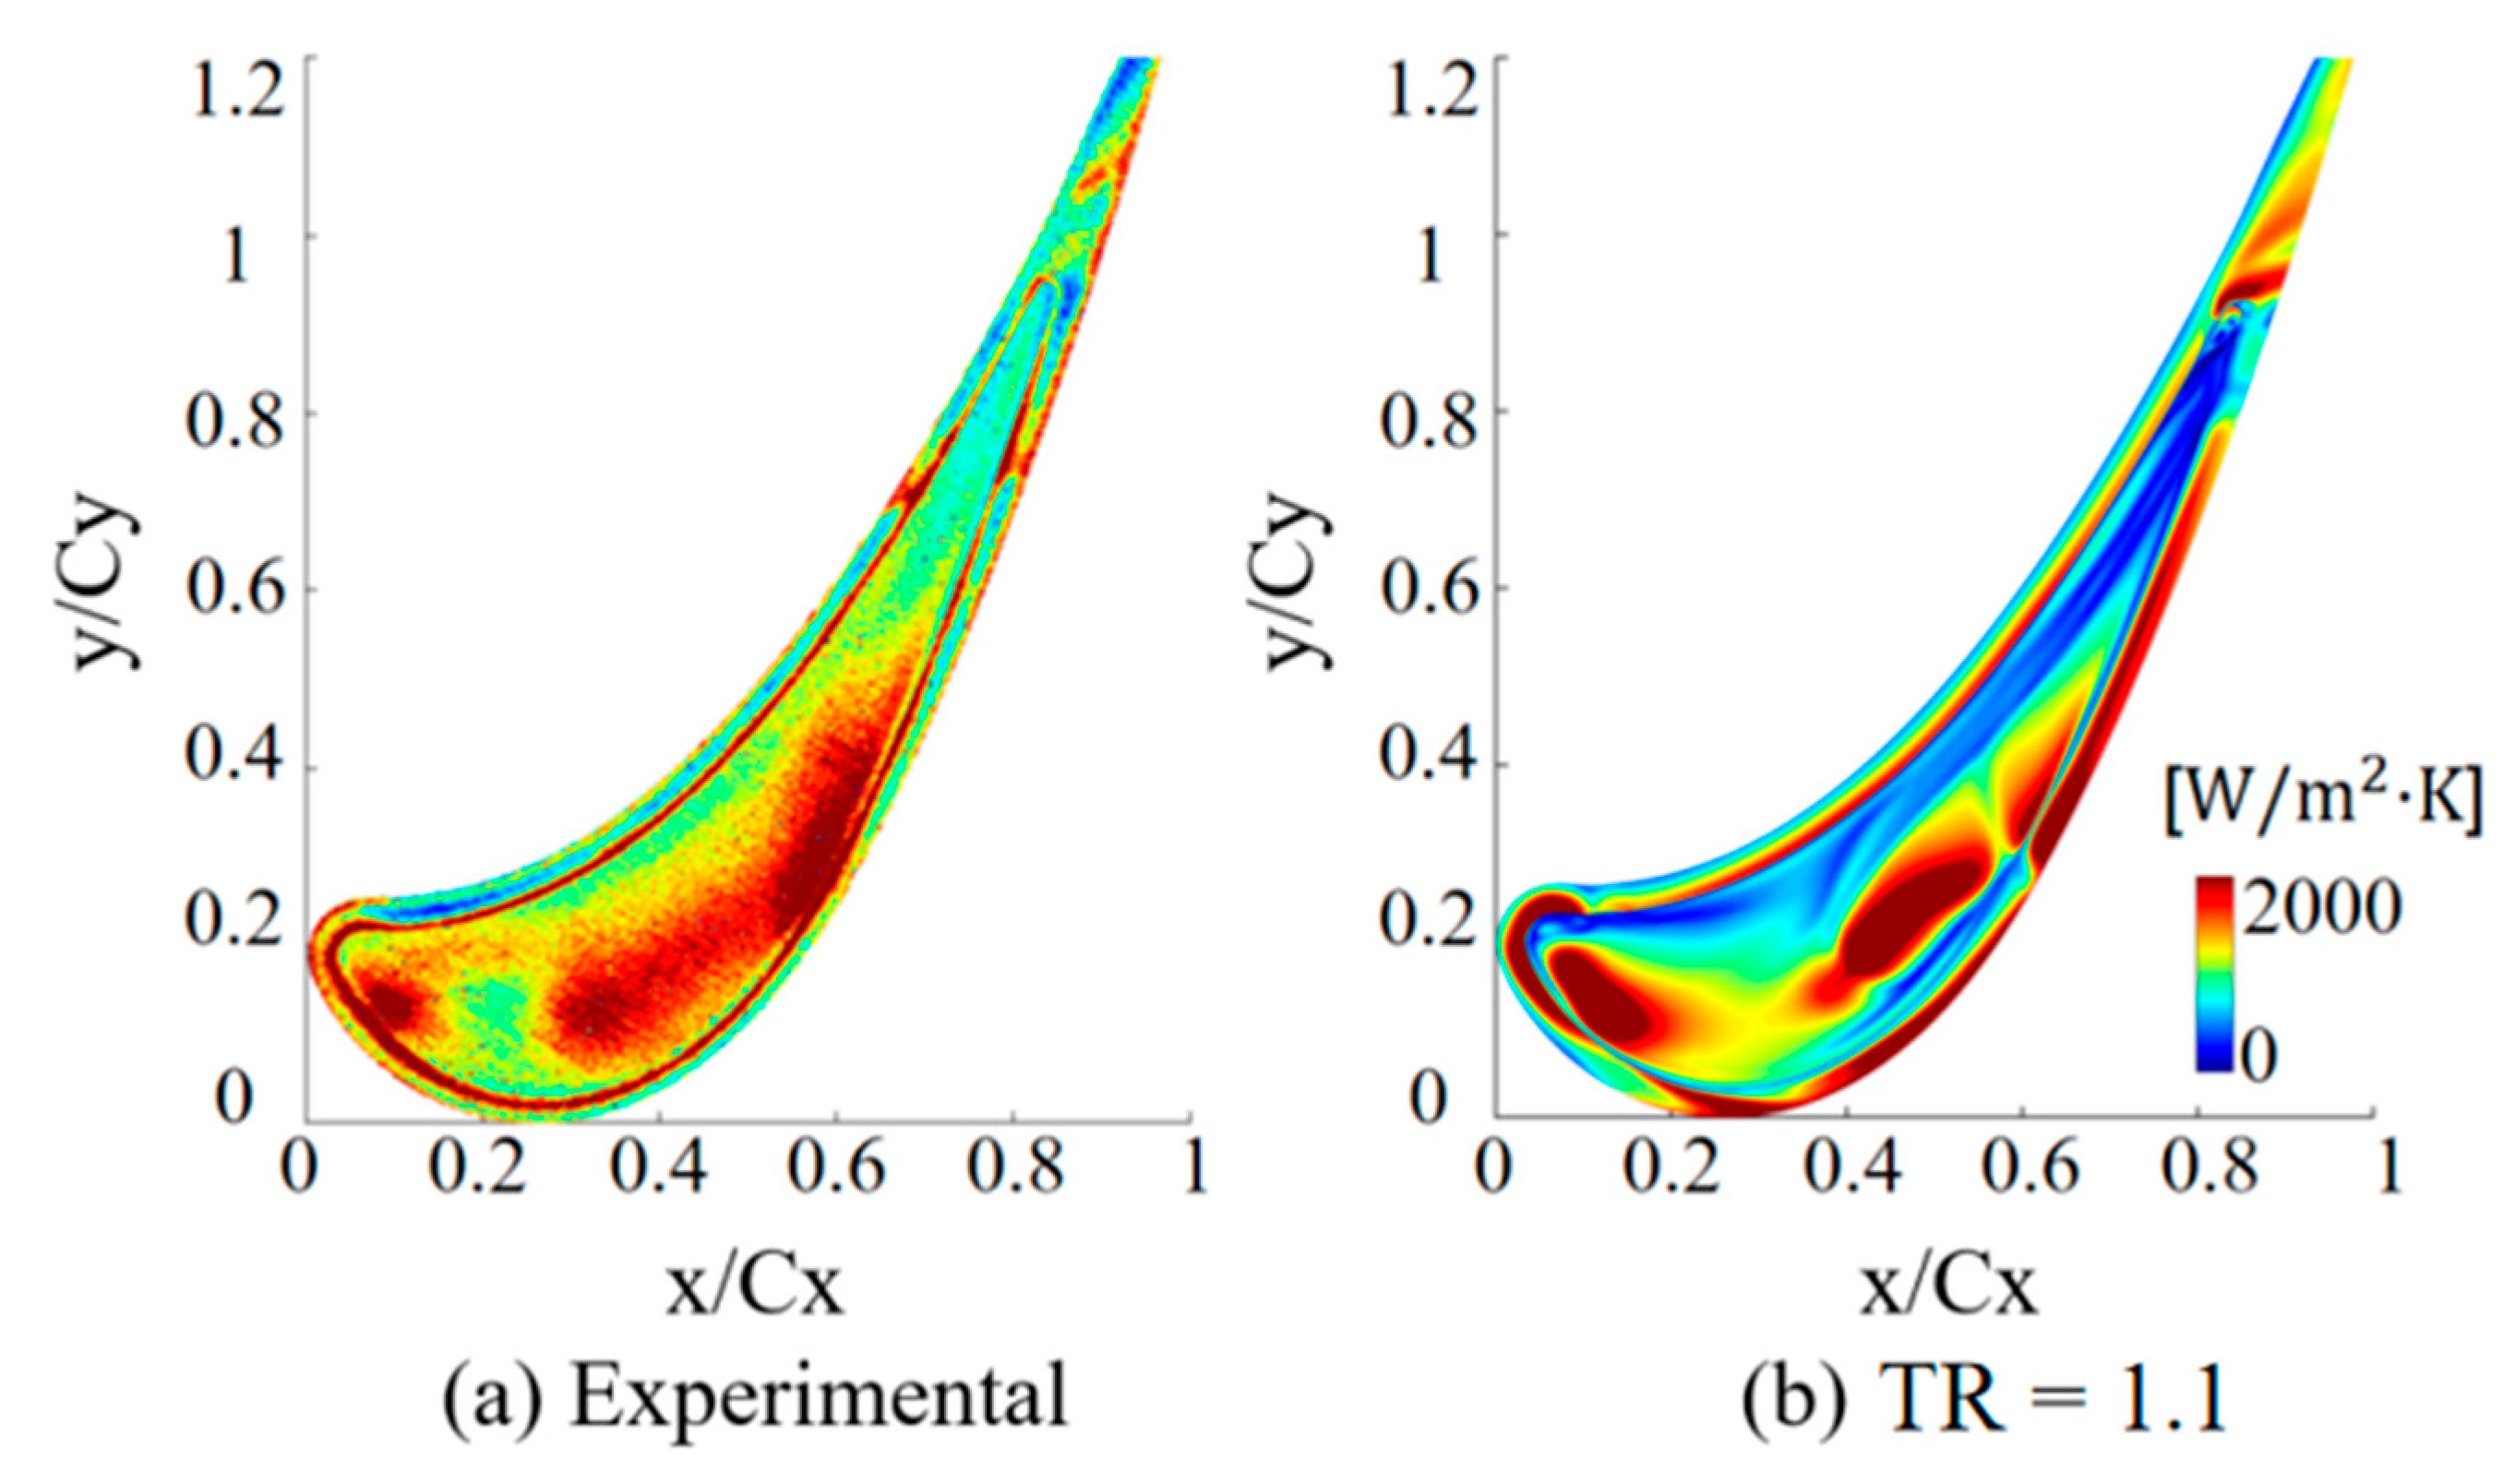
The experimental data obtained by Lu et al. [
22] were employed to validate the numerical method employed in the present study. In the experiment, the inlet total pressure is 172 kPa, the inlet total temperature is 340 K, the exit static pressure is 101 kPa, the relative casing Mach number is 0.4, the exit Mach number is 0.9 and the inlet Reynolds number is 460,000. This experimental study reported unique data at the engine realistic Reynolds and Mach numbers—most interestingly, with high-speed relative casing motion achieved by a large disk rotor. The same boundary conditions were adopted in the experimental and numerical work. With the boundary conditions listed in
Table 1,
Figure 3 compares the tip HTC distributions for an uncooled squealer tip. Both the CFD and experimental results qualitatively show three hot spots in the tip surface region. There still exists some noticeable quantitative HTC difference. It is expected that the RANS CFD simulation underpredicts the OTL cavity flow diffusion.
3. Results and Discussion
This study numerically investigated the influence of the gas-to-wall temperature ratio.
In this section, the numerical results of the tip HTC for the uncooled squealer tip are first compared at two different TRs. The underlying flow structures and change in fluid properties are discussed. Then, the impact of TR on tip cooling effectiveness and coolant distributions over the tip cavity region are demonstrated.
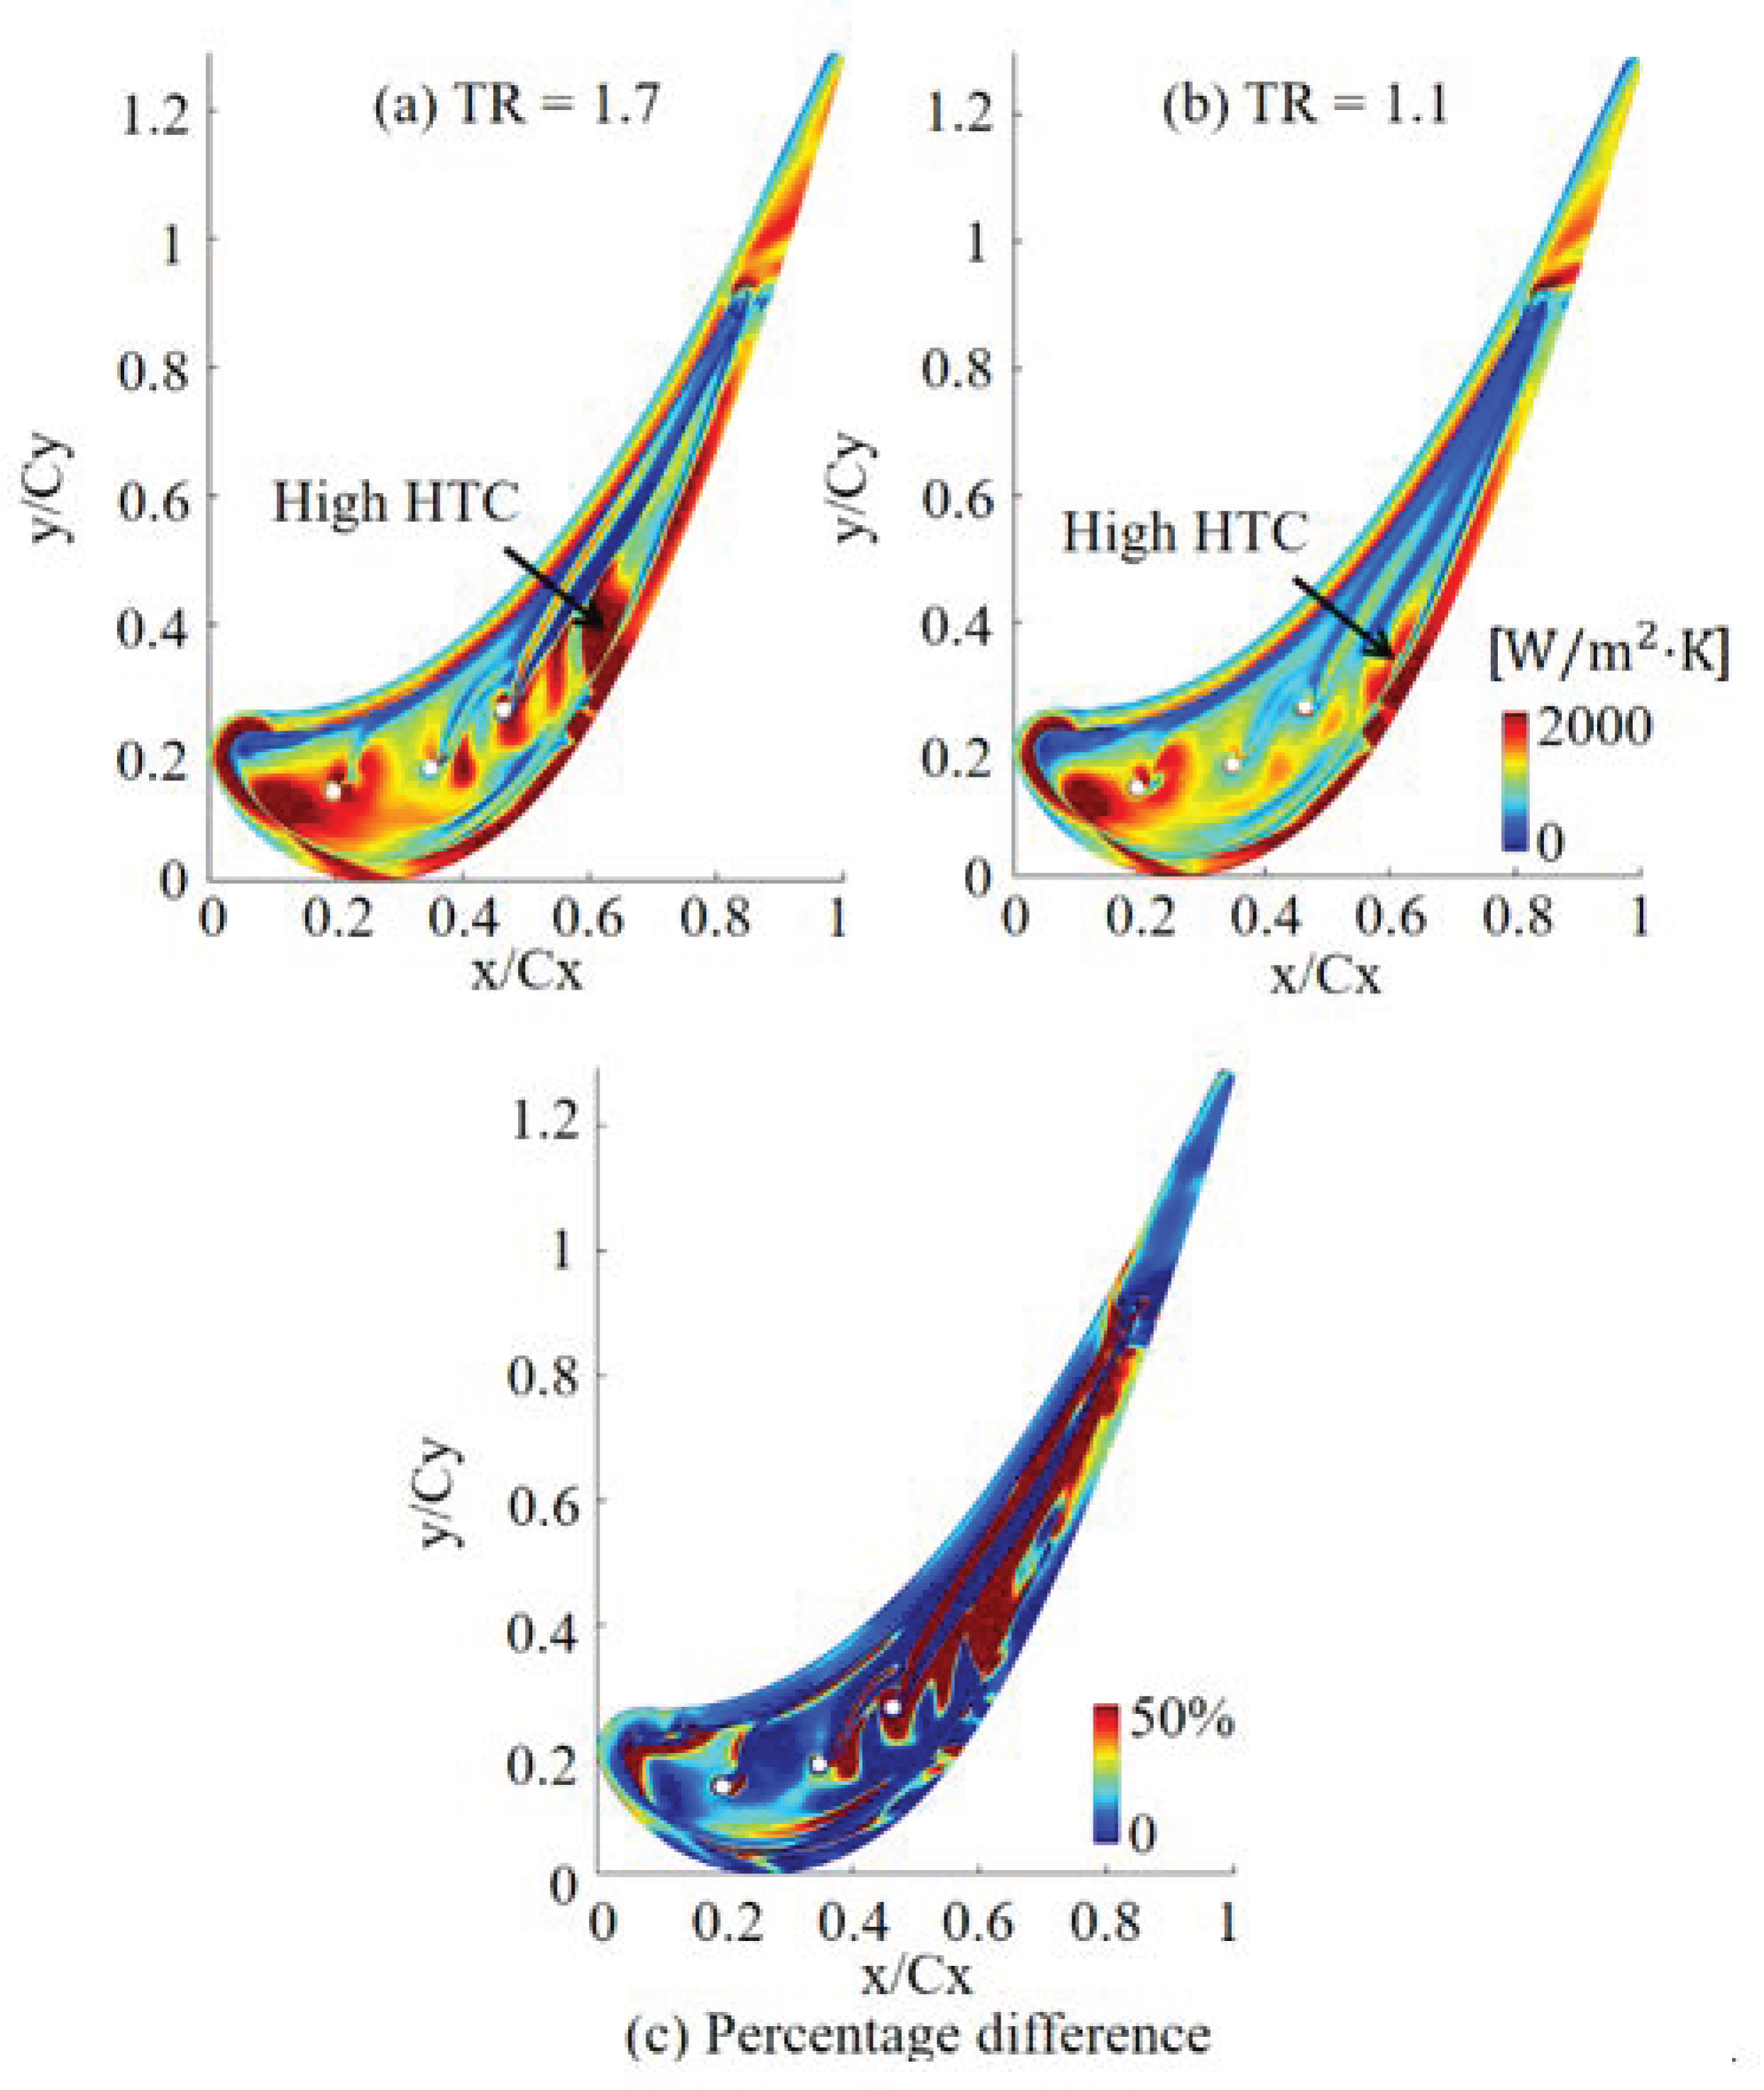
Figure 4a presents the HTC distribution for an uncooled squealer tip at a high TR of 1.7. Compared with the result at the low TR of 1.1, shown in
Figure 3b, a significant increase in HTC can be observed when the wall temperature ratio increases, especially in the leading edge suction-side cavity floor, the mid-chord suction-side cavity floor and the trailing edge cavity floor region.
Figure 4b shows the percentage difference between two TRs. The maximum change in HTC can reach over 50%.
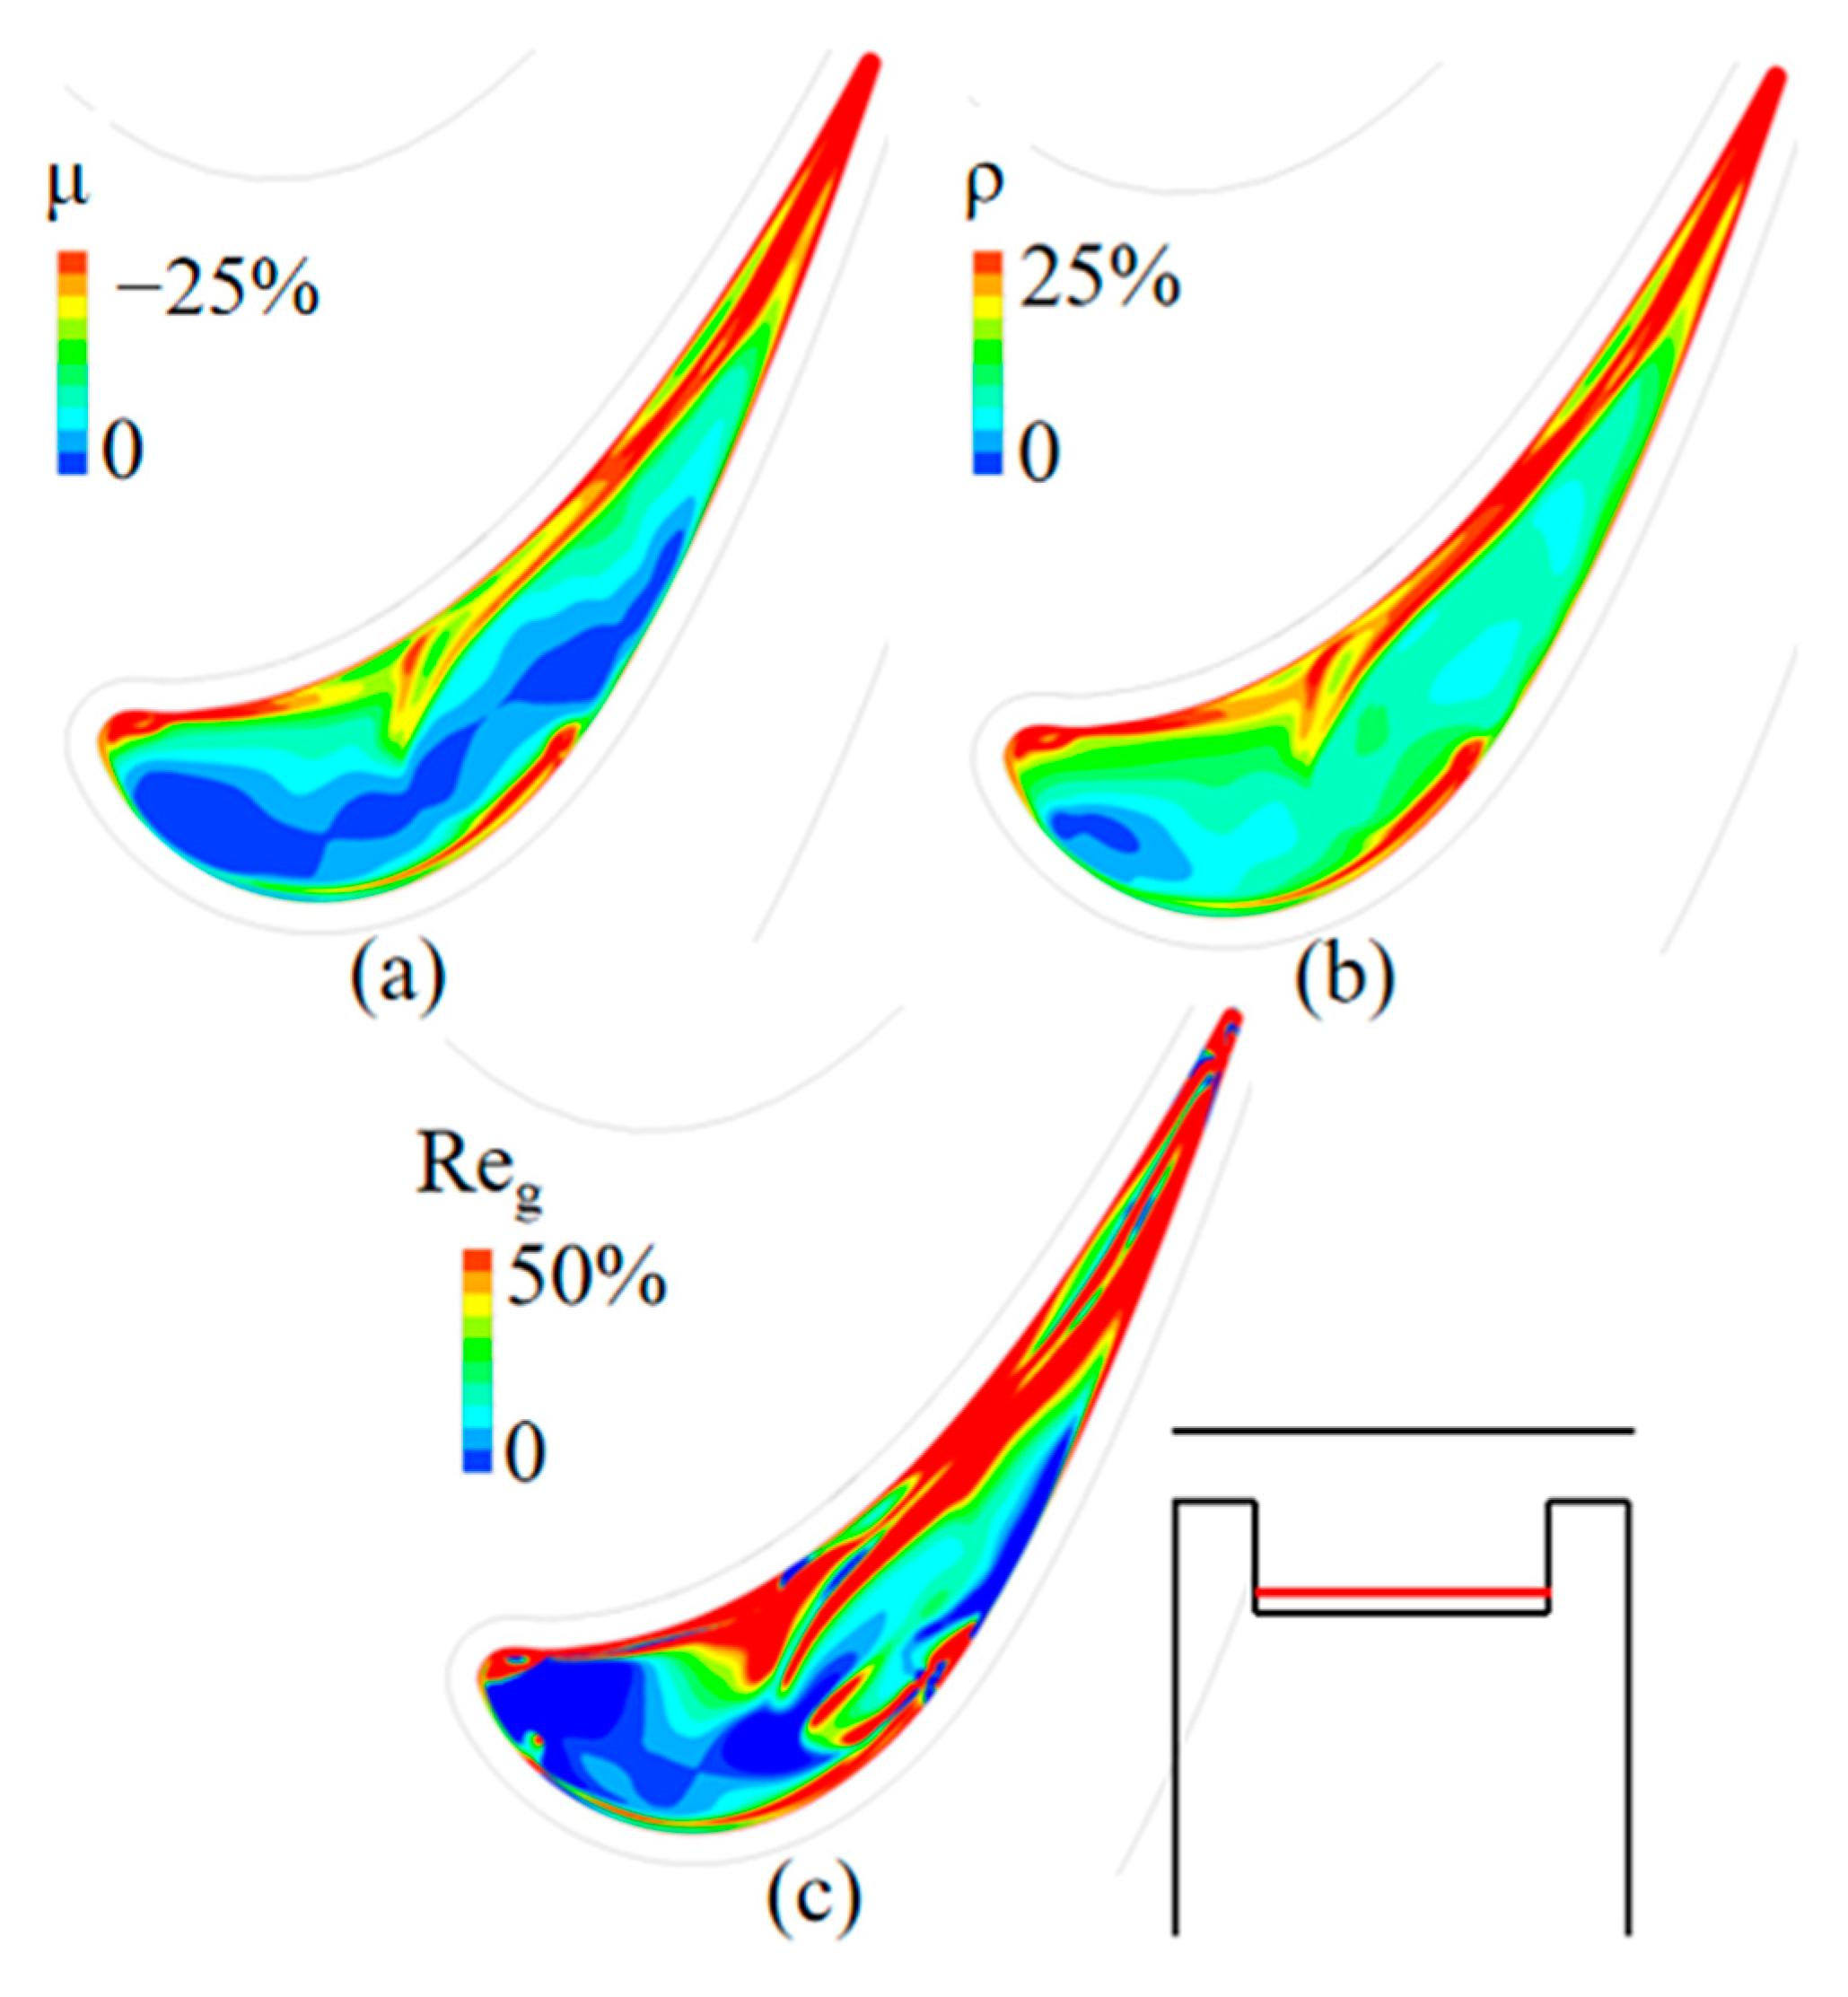
Before exploring the underlying flow structure change due to different wall temperatures, it would be useful to examine the change in fluid properties near the cavity floor and the casing surface. Two planes were selected for comparison purposes, as shown in
Figure 5 and
Figure 6.
Figure 5a,b present the percentage change in local density and viscosity near the squealer cavity floor surface (location indicated by the red line). The density of the gas increases globally when the TR increases, while the viscosity decreases globally when the TR increases. Notice that, here, the TR increase is due to the decrease in the wall temperature, since the gas temperature is held as constant. In the pressure-side cavity region and in the near leading edge suction-side cavity region, stripes of large density and viscosity difference appear. The difference is over 25%. In the other regions, the average difference is about 10%.
To quantify the combined effect on near-wall forces from the fluids, a local Reynolds number based on the gap clearance h
g is defined as.
where U is the local flow velocity, and the gap clearance h
g is 1 mm (1% span) in this study.
Generally, a larger Re indicates a stronger convection, the Reynolds analogy also regards the convective heat transfer and the wall friction as related. The change in the local Reynolds number can be linked with the change in the local HTC.
Figure 5c shows the distribution of Re
g on the near-cavity floor. The Re
g difference is over 50% in the pressure-side cavity region and in the leading edge suction-side cavity region. A 10~30% Re difference appears in the mid-chord cavity region, which is consistent with the HTC difference distribution shown in
Figure 4b. As expected, the local Re and local HTC are positively related.
Figure 6 presents the percentage change in the density, viscosity and Reynolds number near the casing wall. A significant ρ and μ difference appears after the OTL flow exits the suction-side rim tip region, as illustrated in
Figure 6a,b. The change in these fluid properties leads to over a 50% change in the local Reynolds number. Different near-casing Reynolds numbers at different TRs suggest different secondary flow behaviors in the blade passage. The development of the scraping vortex due to the casing motion can also be very different.
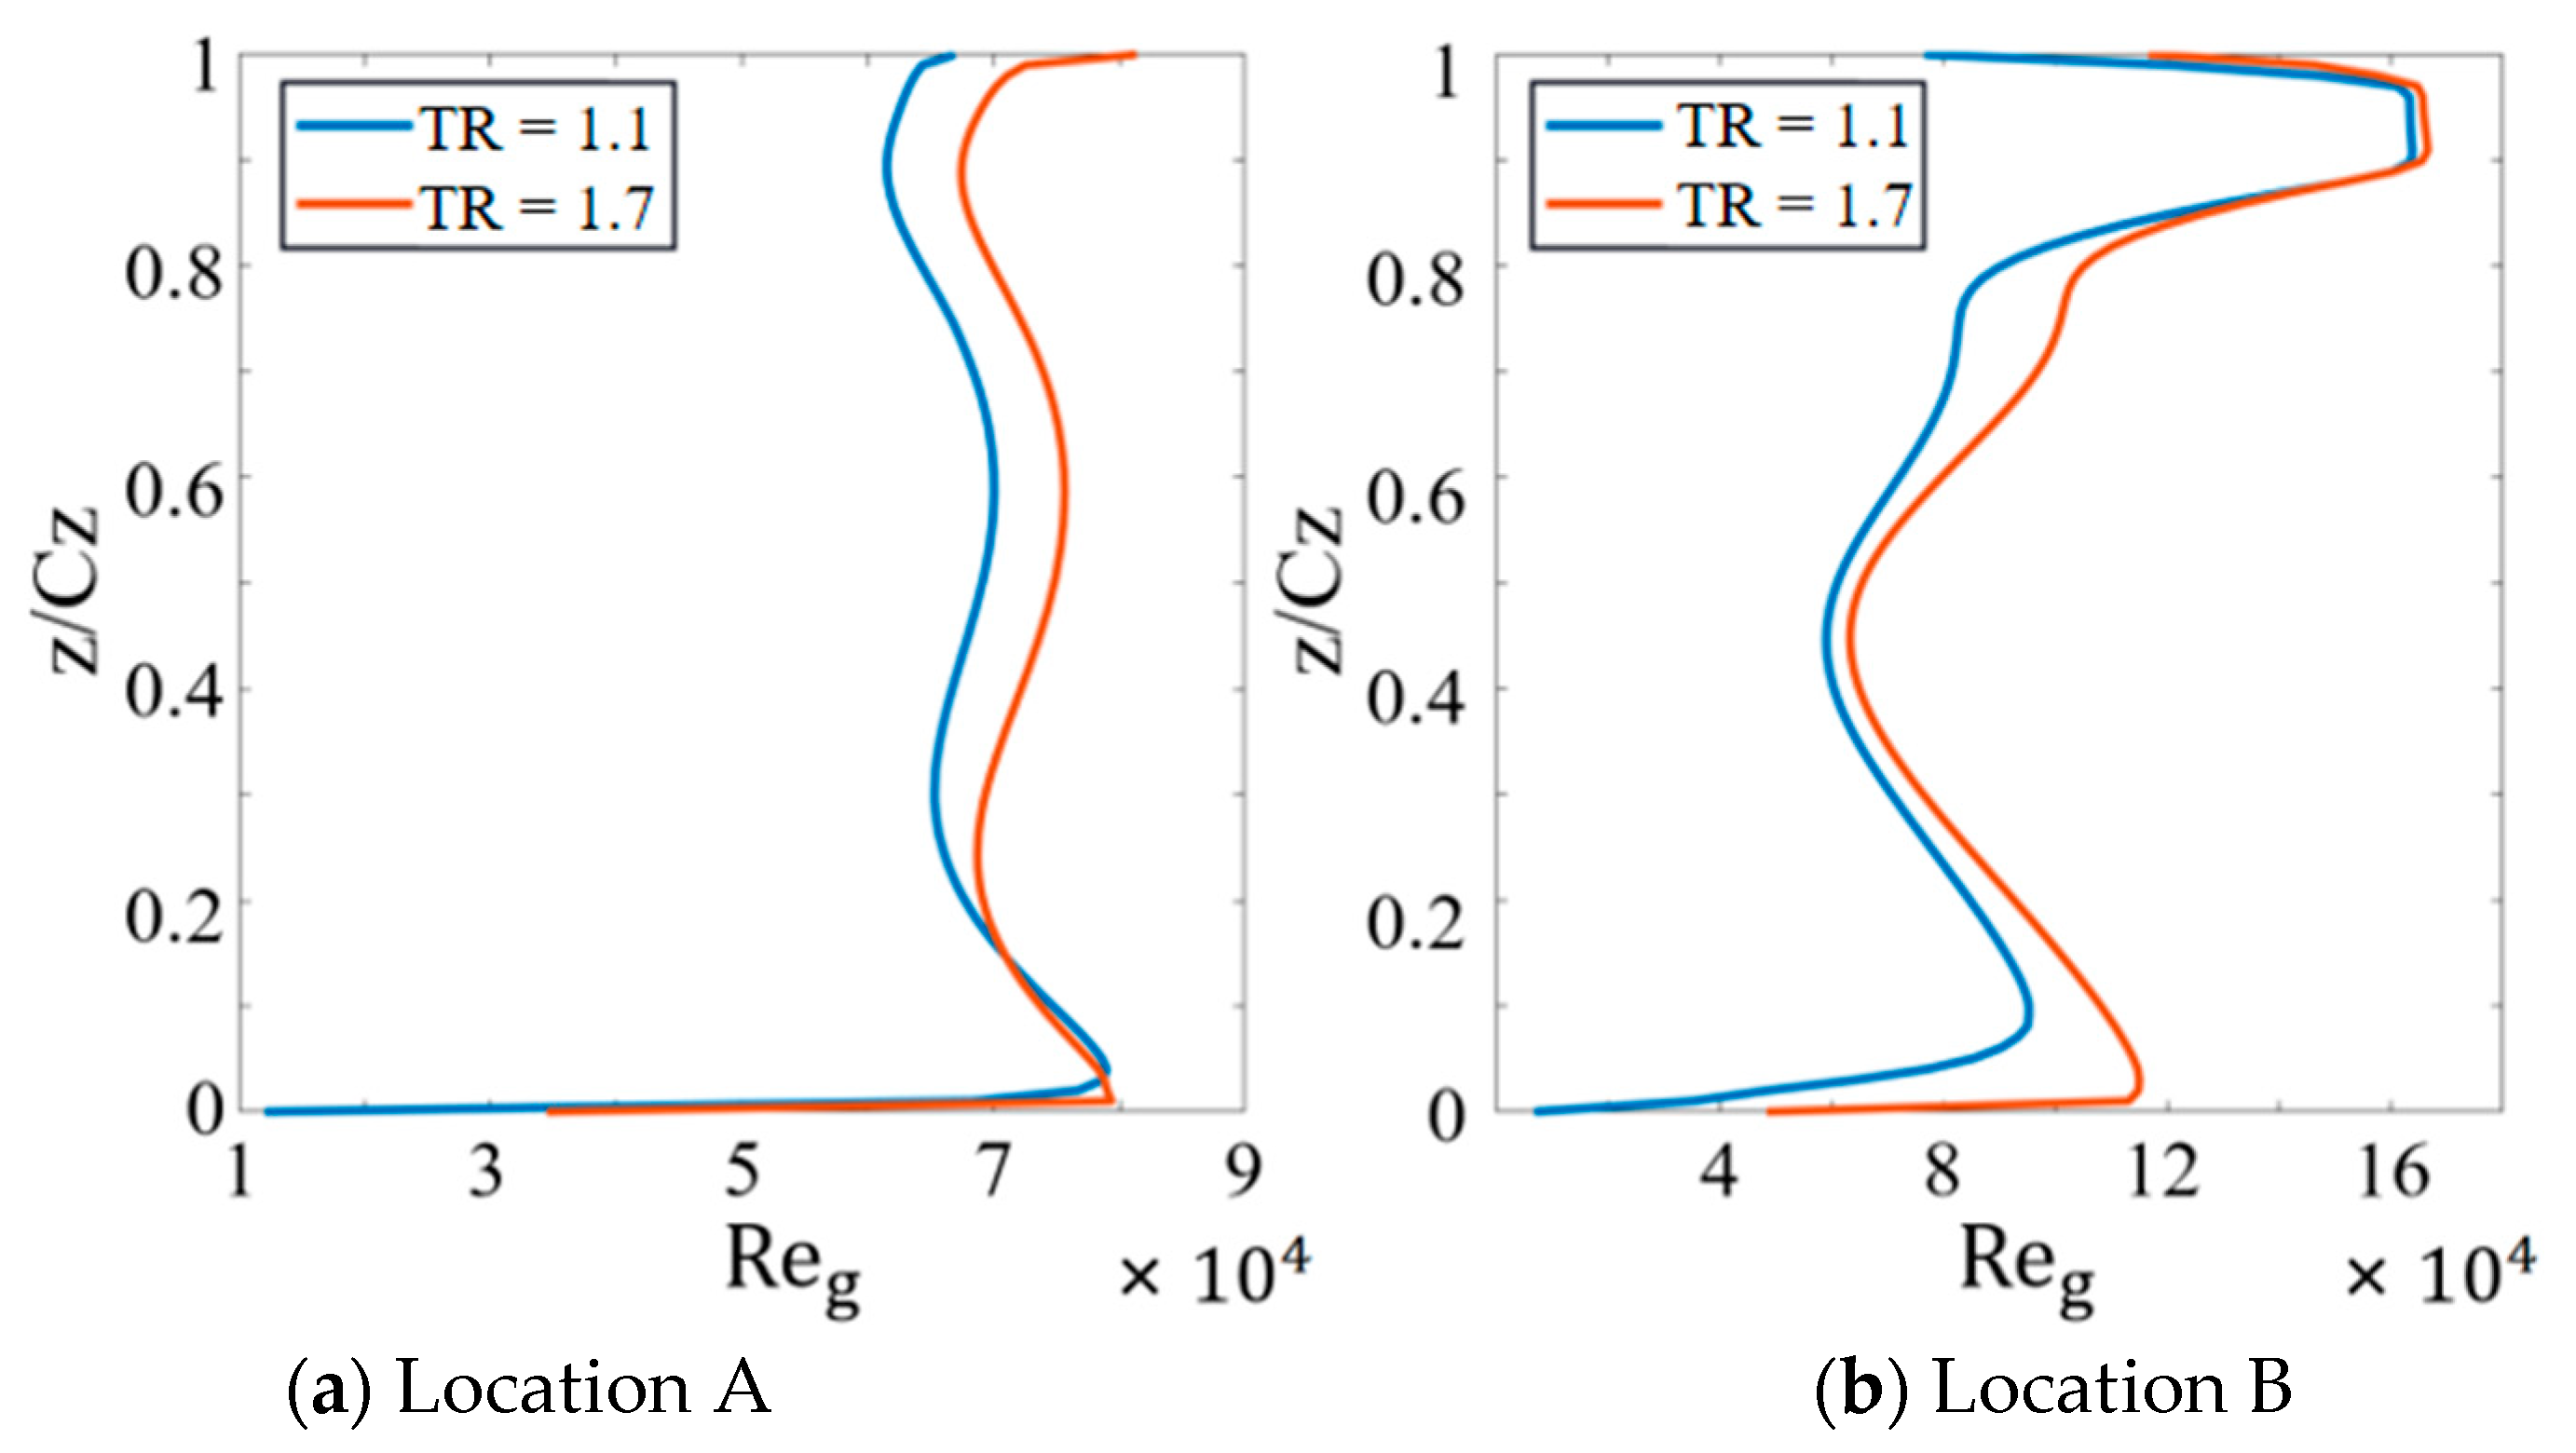
The Reynolds number distributions that are normal to the cavity floor are compared at locations ‘A’ and ‘B’, labeled in
Figure 6c. Generally, the TR = 1.7 case shows a larger Re
g across the tip gap than the TR = 1.1 case. At location A, the difference in HTC on the cavity floor is small, the near-wall Reg difference is also not significant. However, a roughly 20% difference can be observed in the near-casing region. The difference in Reg outside of the near-casing region is also significant.
Figure 7b indicates similar conclusions at location B, where a significant difference in Reg is associated with a large change in HTC on the cavity floor.
Inevitably, the fluid property change leads to a variation in the OTL flow structure. A non-dimensional vorticity is defined as,
where ω is the vorticity, Cx is the chord length in the x-direction, U
inlet is the inlet mainstream velocity and A is the area.
Figure 8 illustrates the non-dimensional vorticity distributions on the cut plane shown in
Figure 6c. The main OTL region is occupied by a large cavity vortex, a corner vortex and a scrapping vortex generated by the relative casing wall motion. The cavity vortex impinges onto the cavity floor, close to the suction side, spreads towards the pressure side and separates near the pressure side. In the impingement region, a high HTC region is generated. The cavity vortex region also has a high HTC due to the strong convection in the near-cavity floor region. For the TR = 1.7 case, the incoming OTL flow impinges onto the cavity floor, and the cavity vortex is pushed away from the suction-side rim by the strong scrapping vortex. On the other hand, for the low TR = 1.1 case, the cavity vortex occupies most of the OTL region, and the scraping vortex is relatively weaker. The cavity vortex impinges onto the suction-side rim instead of the cavity floor. These different vortical flow structures explain the large percentage difference in HTC, as shown in
Figure 4b.
The larger size of the scraping vortex observed in
Figure 8a is due to the higher local Reynolds number associated with the high TR condition, as discussed in
Figure 7a.
Next, the impact of TR on the aerothermal performance of a cooled squealer tip is analyzed.
Figure 9 compares the HTC distributions on the tip surface under different TRs. Similar to the uncooled condition, the HTC increases globally as the TR increases. In addition, there are some qualitatively different patterns near the downstream cavity region.
In this numerical study, the cooling flow and mainstream OTL flow were set as two different species in ANSYS CFX, each with the same gas properties but with different temperatures. Such a setup provides a convenient way to quantify the cooling effectiveness by calculating the coolant mass fraction in the solution data.
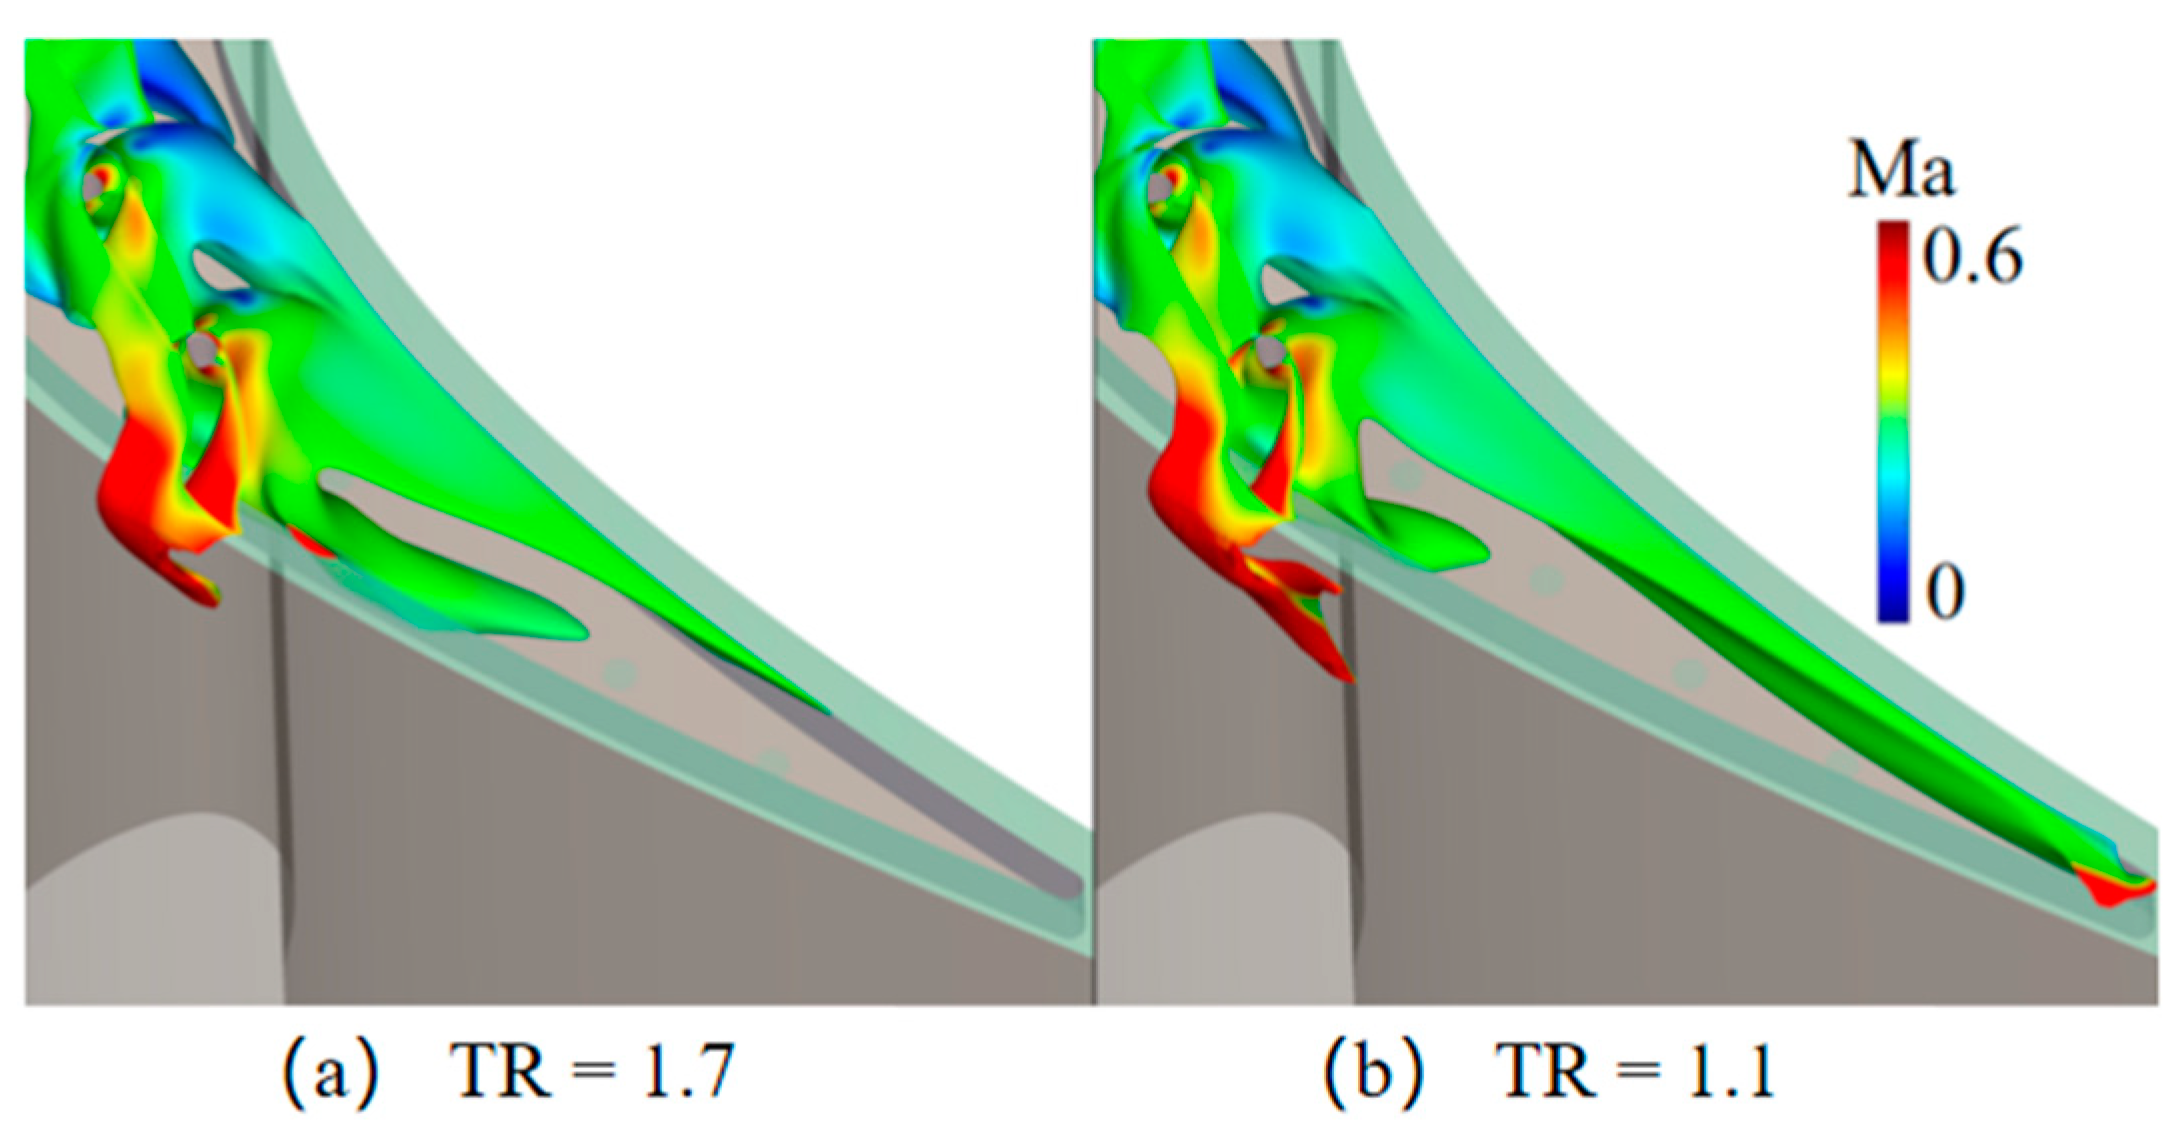
Figure 10 illustrates the iso-surface of the coolant mass fraction (η = 0.27) under two different TRs. After the cooling gas ejects from the holes, it spreads inside the cavity and mixes into the cavity vortex. Some coolant leaves the cavity region near the suction-side mid-chord region. In comparison, when the TR increases, less coolant stays in the cavity and leaves the suction-side rim.
Figure 11 illustrates the coolant mass fraction
distribution on the tip surface. A high
appears within the cavity and the rim regions near the suction side. For the higher TR case,
increases near the suction-side region but decreases near the pressure-side region.
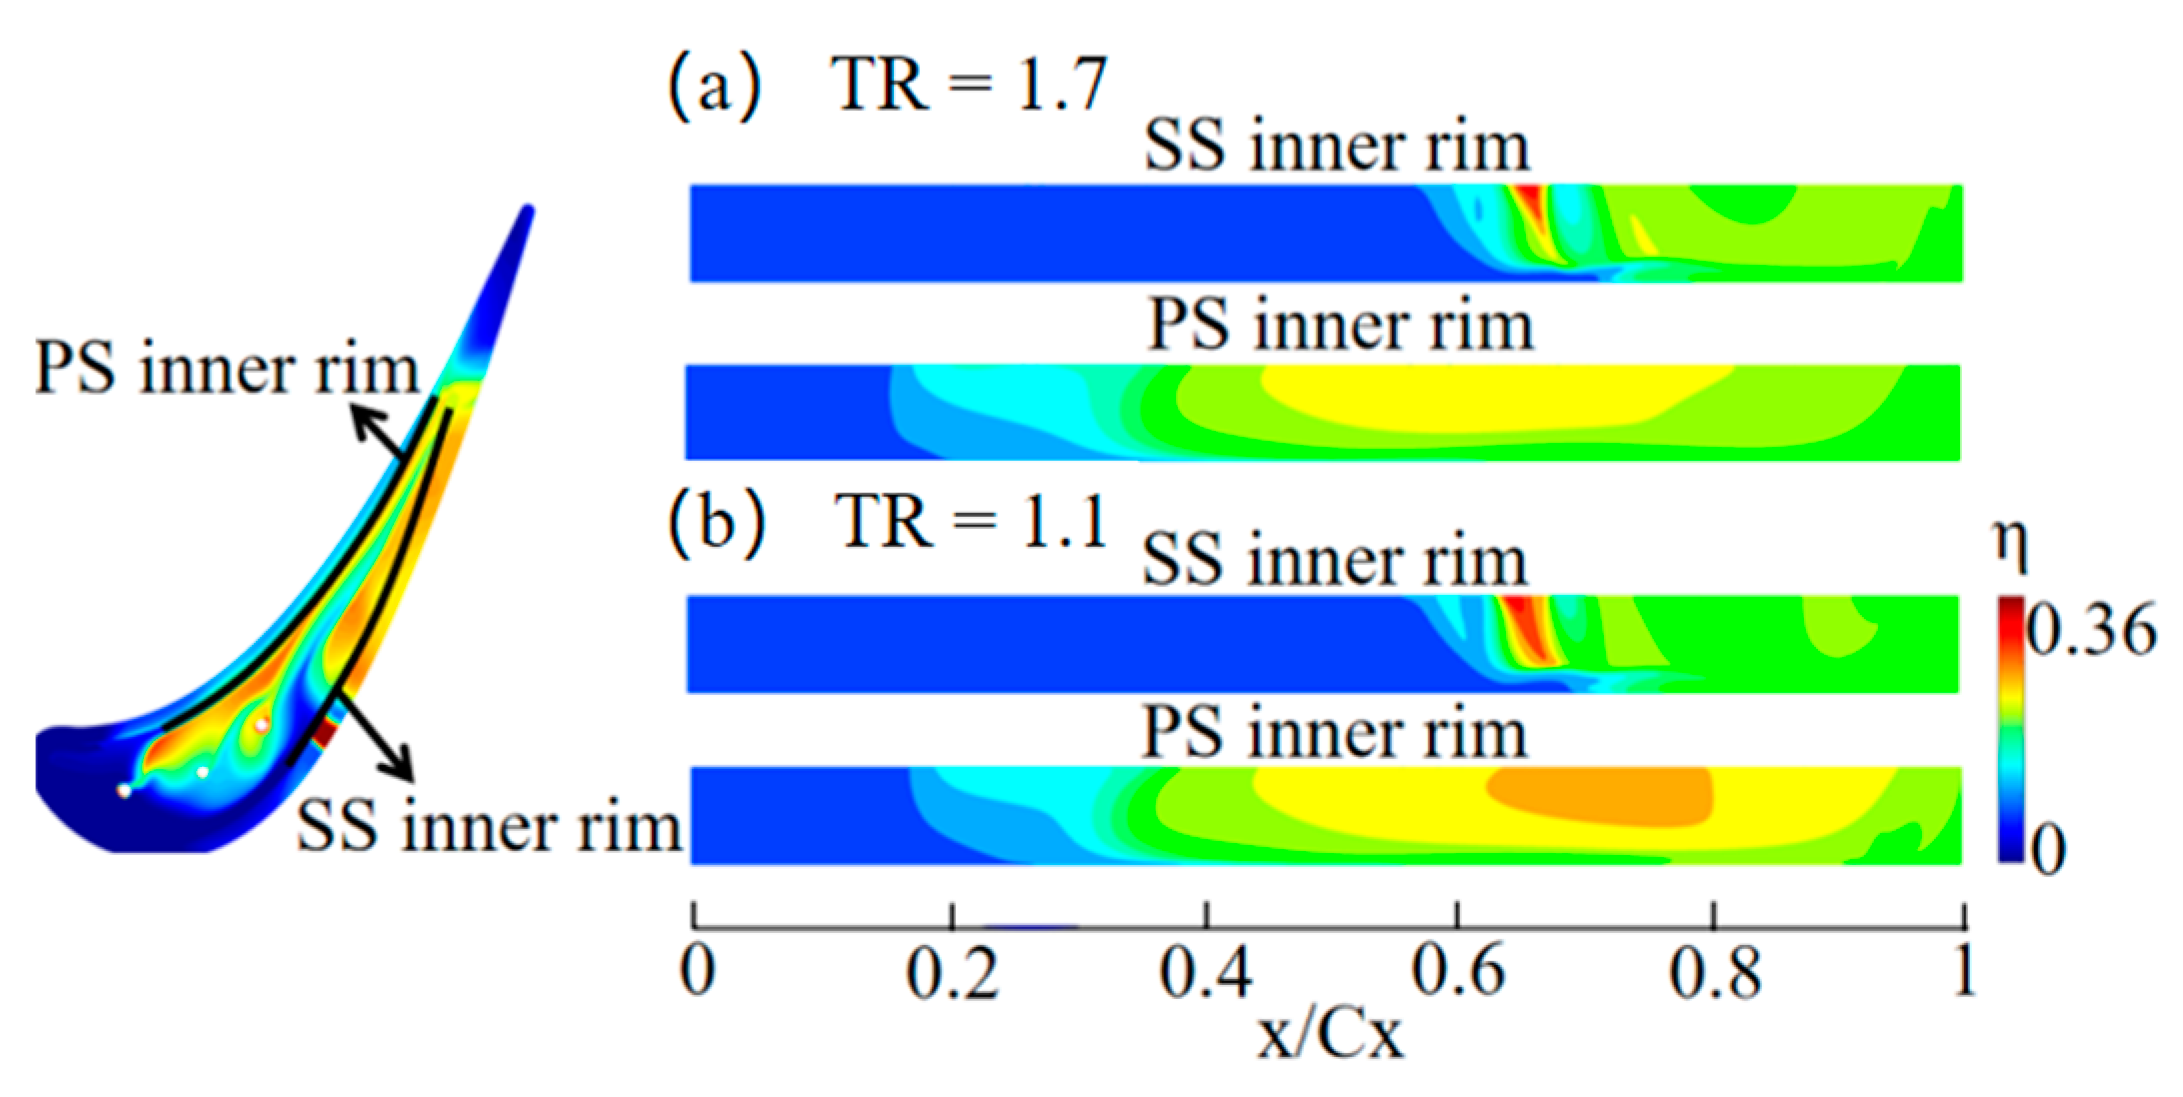
Figure 12 illustrates the coolant mass fraction distribution on the inner rim of the squealer tip. A higher TR leads to a smaller coolant mass fraction on both the pressure- and suction-side inner rims.
4. Conclusions
This study numerically investigated the influence of the gas-to-wall temperature ratio on a typical squealer tip cooling aerothermal performance. RANS CFD simulation was validated against the existing experimental data obtained from a high-speed disk rotor facility (Lu et al. [
22]). A detailed numerical analysis on the coupling effect between the OTL flow and the wall thermal boundary condition was conducted at two different scenarios: one is near the adiabatic condition, with a TR of 1.1; the other one is close to the engine operating condition, with a TR of 1.7.
For a transonic squealer tip with a relative casing motion effect: a stronger scrapping vortex and different cavity vortices in terms of both size and location are associated with a high TR; the local HTC can change over 50% with a high TR condition; the reduction in cooling effectiveness with a high TR can be up to 15%.
For an uncooled squealer tip, a higher TR will lead to a larger HTC on the tip surface, especially in the mid-chord SS region. The gas properties, including the density and dynamic viscosity, change significantly, resulting in a large increase in the near-wall Reynolds number. The higher local Reynolds number brings a larger scrapping vortex and different cavity vortices in terms of both size and location.
For a cooled squealer tip, similarly, a higher TR leads to a larger HTC on the tip surface, especially in the mid-chord SS region. The coolant mass fraction is introduced to quantitatively describe the cooling performance. Under a higher TR, the coolant mass fraction inside the cavity decreases and leaves the SS rim more.
The results demonstrated in this paper highlight the importance of the gas-wall temperature ratio in aerothermal experimental studies of turbine blade tips. The fluid–solid conjugate effect needs more attention to gain a more accurate and scalable understanding of the OTL flow in the engine realistic condition.


 ,
, 


