Article

Simulation of Landing and Take-Off Noise for Supersonic Transport Aircraft at a Conceptual Design Fidelity Level

1
Institute of Aerodynamics and Flow Technology, German Aerospace Center (DLR), 37073 Göttingen, Germany
2
Aerospace Engineer and Scientist, 22589 Hamburg, Germany
3
Institute of Propulsion Technology, German Aerospace Center (DLR), 51147 Köln, Germany
4
Institute of Propulsion Technology, German Aerospace Center (DLR), 10623 Berlin, Germany
5
Glenn Research Center, National Aeronautics and Space Administration (NASA), Cleveland, OH 44135, USA
*
Authors to whom correspondence should be addressed.
Aerospace 2022, 9(1), 9; https://doi.org/10.3390/aerospace9010009
Submission received: 11 November 2021 / Revised: 8 December 2021 / Accepted: 20 December 2021 / Published: 23 December 2021
(This article belongs to the Special Issue Aircraft Noise)

Abstract

:
The German Aerospace Center has launched an internal project to assess the noise impact associated with supersonic transport aircraft during approach and departure. A dedicated simulation process is established to cover all relevant disciplines, i.e., aircraft and engine design, engine installation effects, flight simulation, and system noise prediction. The core of the simulation process is comprised of methods at the complexity and fidelity level of conceptual aircraft design, i.e., typical overall aircraft design methods and a semi-empirical approach for the noise modeling. Dedicated interfaces allow to process data from high fidelity simulation that will support or even replace initial low fidelity results in the long run. All of the results shown and discussed in this study are limited to the fidelity level of conceptual design. The application of the simulation process to the NASA 55t Supersonic Technology Concept Aeroplane, i.e., based on non-proprietary data for this vehicle, yields similar noise level predictions when compared to the published NASA results. This is used as an initial feasibility check of the new process and confirms the underlying methods and models. Such an initial verification of the process is understood as an essential step due to the lack of available noise data for supersonic transport aircraft in general. The advantageous effect of engine noise shielding on the resulting system noise is demonstrated based on predicted level time histories and certification noise levels. After this initial verification, the process is applied to evaluate a conceptual supersonic transport design based on a PhD thesis with two engines mounted under the wing, which is referred to as aircraft TWO. Full access to this vehicle’s design and performance data allows to investigate the influence of flight procedures on the resulting noise impact along approach and departure. These noise results are then assembled according to proposed Federal Aviation Agency regulations in their Notice of Proposed Rulemaking, e.g., speed limitations, for Supersonic transport noise certification and the regulations from Noise Chapters of the Annex 16 from the International Civil Aviation Organization in order to evaluate the resulting levels as a function of the flight procedure.

1. Resurrection of Civil Supersonic Air Transport

There have been two commercial supersonic aircraft in operation the past century. The Tupolev TU-144 in the Soviet Union and Aérospatiale/BAC Concorde in the western world. For the certification of these supersonic vehicles, the noise certification regulations mainly addressed en route sonic boom noise. Part 36 [1] of the Federal Aviation Agency’s (FAA) rules as well as ICAO Annex 16 Vol. 1 does not provide special standards for landing and take-off (LTO) noise limits for supersonic aircraft. Additionally, most countries ban supersonic flight over land for commercial aviation or at least do not accept a perceptible sonic boom on the ground. Consequently, the sonic boom will remain a major challenge, but LTO noise has to be addressed as well. Up to this day no officially approved noise certification standard for the future generation of supersonic business jets has been defined, i.e., sonic boom and LTO noise. Amid ongoing discussions with respect to novel regulations, several commercial projects aim at bringing supersonic transport aircraft back into service within the next decade, e.g., Boom Technology. Obviously, a major goal of all novel concepts is to tackle the LTO and sonic boom noise challenge. Boom Technology, Inc., known as Boom Supersonic, aims at bringing a commercial airliner into service called “Overture”. It is designed to transport up to 88 passengers over a range of 4250 nautical miles (transatlantic capability) and offers the possibility to operate at Mach 1.7 powered by three engines. The aircraft is to be operated with 100% sustainable aviation fuel. No final specifications will be presented here since they are subject to change during the evolution of the final design. Yet, Boom aims at full compliance with strict noise regulations of Chapter 14 of the ICAO Annex 16 by advanced engine technology, high performance aerodynamics, and application of variable noise reduction systems (VNRS). Japan Airlines entered into a still active strategic partnership with Boom Technology Inc. The company put down a deposit for 20 aircraft [2]. Furthermore, United Airlines signed an order for 15 Overture aircraft and 35 options [3]. The companies looking to build supersonic transport aircraft are putting pressure on regulators as their designs advance and they are pushing towards an entry into service. Consequently, the International Civil Aviation Organization (ICAO) has committed itself to a new international standard for noise certification of supersonic aircraft, including flight over land and LTO noise. FAA has proposed a first set of regulations, i.e., Notice of Proposed Rulemaking (NPRM), for the noise certification of next generation supersonic aircraft.

Scope of This Article

The focus of this study lies on the LTO noise and the issue of sonic boom during cruise is not addressed here. Since all supersonic transport (SST) aircraft have to operate at typical airports, understanding and assessing noise generation and ground impact during subsonic flight phases is of utmost importance. Furthermore, other important aspects such as economical implications and climate effects are not in the scope of this study. Two specific SST aircraft concepts are under investigation, i.e., aircraft and engine design, flight performance and operation, and noise prediction. Both concepts are assessed under the proposed NPRM by FAA, which are described below and the Noise Chapters of ICAO Annex 16. The findings of this assessment support rule makers and SST designers in the context of minimum LTO noise for aircraft certification.

2. LTO Noise Challenge

When it comes to LTO noise of supersonic aircraft, some general difficulties and challenges are inherent to SST aircraft design. When compared to conventional aircraft, supersonic aircraft are subject to increased drag, including wave drag, due to their high flight velocities. Therefore, the thrust requirement is derived from cruise flight rather than take-off conditions, resulting in higher specific thrust compared to conventional aircraft. Consequently, due to higher specific thrust and poor propulsive efficiency, supersonic aircraft consume more fuel than conventional aircraft and are more expensive to operate. Significant fuel requirements of such vehicles can furthermore result in increasing vehicle weight. Furthermore, the high specific thrust leads to a high jet velocity and thus high jet noise. Due to the supersonic cruise flight, wing area and airfoil shapes are significantly different compared to subsonic designs. One common solution is the delta wing shape. It will deteriorate the aircraft’s capabilities for slow speed approaches. This problem is furthermore intensified by slim supersonic airfoils that complicate any installation of a high-lift system and limit available options. All these aspects result in adverse effects on the LTO noise. The required high specific thrust directly contributes to excessive engine noise during take-off under existing certification regulations, i.e., specified full engine thrust setting along take-off. The increased aircraft weight will negatively influence the flight performance of the vehicle especially during take-off due to reduced climb-out capabilities.

2.1. Towards Novel Certification Regulations

The FAA NPRM on Noise Certification of Supersonic Airplanes proposes to add an appendix C to Part 36 of the noise certification requirements of the United States Code of Federal Regulations (CFR) Title 14 [4] by applying existing NASA ideas [5] to these new SST vehicles. The NPRM contains a detailed description of proposed noise limits for the three individual noise reference measurement points. Limits are defined depending on number of engines and maximum take-off mass of the supersonic aircraft to be certified. Figure 1 summarizes the limits for the individual reference measurement points as proposed in §C36.5(a), C36.5(b) and C36.5(c) of the NPRM, which is identical to the values from Chapter 3 of ICAO Annex 16 Vol. 1. Modifications to Chapter 3 are prescribed in §C36.5(d), i.e., no airplane may exceed the noise limits defined in §C36.5(a–c) at any measurement point. Furthermore, the cumulative margin with respect to the cumulative Chapter 3 level must be at least 13.5 EPNdB. The proposed regulation changes by FAA need to be carefully assessed for such SST vehicles. Certain existing regulations for subsonic aircraft pose significant challenges and leave unsolvable hurdles for any new SST concept, e.g., the requirement of maximum thrust setting during departure prior to the pilot-initiated cutback could result in excessive SST noise at the lateral point. Furthermore, the before mentioned differences in flight performance of SST could require different speed limitations during certification in order to meet any reasonable noise limit. As a consequence, FAA’s proposed modifications to existing regulations for subsonic aircraft seem necessary and are under consideration by many research groups with the main focus on departure procedures. Several operational rule changes are under discussion within ICAO, so that SST vehicles stand a chance in any noise certification process. Potential modifications are mainly assessed by NASA for their impact based on existing noise regulations for subsonic aircraft. These NPRM definitions are applied within the presented study to evaluate the calculated levels. In addition, levels are compared to rules of the ICAO Noise Chapters, which are the current standard for noise certification of subsonic aircraft.

2.2. Activities in the Research Community

In the past, the sonic boom has been identified as the major bottleneck for any potential SST product, hence any low-boom technologies would improve the business case. Ever since, the sonic boom reduction is a major topic and challenge. NASA carries out its Low-Boom Flight Demonstration program and tasked Lockheed Martin to build the X-59 experimental plane which is called Quiet SuperSonic Technology (QueSST). The aircraft shall be delivered by 2023 and the produced data will be made available to regulators. The Carpet Determination In Entirety Measurements flight series, or CarpetDIEM [6], is paving the way for the acoustics measurements of the X-59 [7]. In recent years, it became most obvious, that not only the sonic boom but also the noise generated during landing and take-off could possibly be a potential show-stopper for the introduction of novel SST concepts.
Consequently, NASA has launched dedicated research activities with the focus on LTO noise based on a novel SST aircraft concept, i.e., NASA 55t Supersonic Technology Concept Aeroplanes (STCA), as early as in 2017 [8,9,10].
In Europe, the large H2020 project SENECA has been recently initiated and is funded by the European Union. The focus lies on simulation of SST LTO noise including assessment of gaseous emissions in the vicinity of airports and the impact of supersonic travel on the global climate.
Similar research activities have been launched recently at major research establishments around the world, e.g., Japan Aerospace Exploration Agency (JAXA) [11] and the Central Aerohydrodynamic Institute of Russia (TsAGI) [12,13].

2.3. DLR Research Activities

To specifically address the issue of LTO noise for SST vehicles and to understand proposed modifications to the regulations, DLR has initiated an internal research project. The project Estimation of Landing and Take-off Noise for Supersonic Transport Aircraft (ELTON_SST) joins different DLR institutes and brings together experts from different fields in order to capture all relevant aspects and interdependencies. The work presented in this article is part of the ELTON_SST project.
In ELTON_SST a dedicated simulation process has been established that is described in the next section. In a first step, the core simulation process comprises simulation tools at a low to mid fidelity level but interfaces for the integration of high fidelity simulation results are under development. The core process will be applied to a concept of NASA for verification of the methods, i.e., the STCA [9]. Furthermore, the process is applied to a SST design as described in Ref. [14] for a more detailed assessment. The findings from these initial applications shall provide insights and contribute toward novel regulations for SST noise certification.

3. Simulation Process

An existing process for automated simulation of noise certification of subsonic aircraft described in Reference [15] has been extended to assess future civil supersonic aircraft. Dedicated interfaces to external simulation tools are implemented into the existing process to enable future research activities based on higher fidelity simulation results. Furthermore, the existing process is upgraded to calculate SST certification levels at the three reference points according to the suggested rule changes by FAA [4].
A schematic illustration of the novel process is depicted in Figure 2. The simulation core is already described in detail in Reference [15]. Dashed lines indicate the interfaces to external high fidelity simulation tools. Design aspects as well as operational conditions that have to be provided to these external tools as inputs are generated within the simulation core. Based on this input from the low to mid fidelity tools, complementary simulation on a higher fidelity level can then be initiated to confirm earlier assumptions and results. For example, integration of aerodynamic data from CFD simulations with the DLR TAU code supports results from flight simulation at lower fidelity levels. Ultimately, CFD calculations can provide aerodynamic maps in the form of look-up tables for a more physics-based flight simulation of approach and departure.
The process in its current status enables an automated calculation of certification levels at the level of conceptual design. The results shown and discussed in this study are generated by using the simulation core with additional input from complementary simulation results as described in the following section.

3.1. Aircraft and Engine Design

All the required aircraft data, e.g., geometries, weights, and engine specifics, are available as direct input or based on engineering judgement for the NASA 55t STCA. For the aircraft TWO, the aircraft design is elaborated by the tool PrADO [16], a development of the Technical University of Braunschweig. PrADO consists of individual modules, each of which represents one discipline of the overall design process (e.g., aerodynamics). Through an iterative process, the interactions between different disciplines are calculated, taking into account positive and negative effects of design aspects on other sub-disciplines, i.e., considering so called snowball effects. Modules with different fidelity levels are available, but the individual module can also be replaced by external results of higher fidelity simulations. For example, the presented application example incorporates high-lift and cruise aerodynamics from the DLR CFD code TAU [17]. Furthermore, the PrADO engine design module is replaced by external engine data for this SST study. DLR experts have delivered performance and geometrical data for the SST engines under consideration for direct implementation into the process. The DLR tool GTlab (Gas Turbine Laboratory) was applied to design the SST engine model and to calculate required data [18]. The tool is an interactive, cross-platform simulation and preliminary design environment for aero engines and gas turbines. The object-oriented software concept in C++ and the use of standardized libraries and procedures ensure a high degree of usability, extensibility and flexibility. The GTlab Software Suite consists of the three main modules Performance, Sketchpad and Designer, which are adapted to the application spectrum of Engine Performance and Preliminary Design as needed.

3.2. Flightpath Simulation

For the detailed simulation of approach and departure flight paths a dedicated tool has been developed, i.e., FLIPNA [19]. FLIPNA can directly operate based on detailed engine maps and aerodynamics provided by PrADO and/or GTlab. The underlying flight performance calculation is based on the method described in ECAC Doc. 29. Procedural profile steps for approach and departure can be generated. The resulting trajectory simulated by FLIPNA consists of a series of flight points with parameters describing engine and aircraft operation conditions, e.g., setting of the engine thrust and the high-lift system. The resulting trajectory is physics-based and yields all the required input parameters for a subsequent system noise prediction.

3.3. Noise Shielding

Different software tools are available at DLR to compute the effect of noise shielding from the airframe. Different fidelity levels can be assessed but within this study for a quick estimate on potential noise shielding effects a simple method is applied. The method of Maekawa [20] is applied here with some additional modifications as described in Ref. [21] to reproduce the published NASA results [9,10]. Available and more advanced noise shielding simulation tools could be applied in the future, if access is granted to 3D-geometry data of the NASA 55t STCA. On the other hand, Maekawa can directly be applied to the available and very simplified description of the aircraft. Based on wing planform and engine locations, the Maekawa method can predicts noise shielding effects for all vehicles within this study.

3.4. Aircraft System Noise Prediction

At this point, all the required input data is available to initiate a system noise prediction, i.e., aircraft and engine parameters, prevailing operating conditions (flight trajectories), and potential noise shielding factors. For the system noise prediction the DLR code Parametric Aircraft Noise Analysis Module (PANAM) has been selected. PANAM is a componential and parametrical simulation tool and has been validated against measurements, e.g., Reference [22], and other simulation tools like ANOPP2 (NASA) or CARMEN (ONERA), e.g., Reference [23]. PANAM has been upgraded with additional noise source models in order to better capture the selected SST engines, in particular a modified jet [24] and a combustion noise model [25]. Both were verified against experiment in the original literature. The adjustment of the noise source models promise a more accurate representation of the low bypass engines of the supersonic aircraft during landing and take-off. Overall, appropriate simulation methods are selected and incorporated into the process, i.e., noise source modelling, noise shielding, and propagation attenuation. The applied methods are summarized in Table 1. All required input data for a system noise simulation are automatically generated and provided to PANAM within the process as depicted in Figure 2. PANAM outputs standard single event noise metrics, e.g., EPNL, SEL, and LAMAX, at arbitrary observer locations along approach and departure.

3.5. Interfaces to Complementary Simulation

The low to mid fidelity simulation core is supplemented by interfaces to high fidelity tools of DLR, which are indicated by dashed lines in Figure 2. As described before, aerodynamic and engine performance data is directly processed and incorporated into the overall simulation process.
The high fidelity tools are also used to validate the results of the simulation core. This is part of ongoing research activities and not within the scope of the presented study. Mainly, simulated aerodynamic data from low to mid fidelity will be subject to a high fidelity verification for selected operating conditions. Based on initial results from the simulation core, input parameters describing a selected operating condition can directly be processed by the complementary simulation tools. For example, a CFD RANS analysis of the flight conditions attributed with the PNLTM (maximum PNLT along 10-dB downtime) can be initiated. The operating conditions at this point are used as an input and resulting high fidelity predictions can be used for validation purposes. Furthermore, fan noise predictions will be compared to results from the DLR tool PropNoise [35] at characteristic operating points. Furthermore, simplified shielding assessment can be compared to corresponding simulation results from available high fidelity tools.

4. Verification

Due to the lack of available and non-proprietary data for SST vehicle, i.e., including noise data, the available NASA 55t STCA data from Refs. [9,10] was selected for an initial verification benchmark. This activity is understood as a feasibility assessment of the simulation process in its status quo. A more detailed comparison was not in the scope of the presented study but is scheduled for the near future. More work is required to assimilate the simulation methods and input parameters at DLR in order to match the NASA simulations and enable a real benchmark test, e.g., as described in Reference [23] for subsonic transport aircraft.

4.1. Aircraft Design and Noise Shielding Effects

The aircraft geometry is adapted from the published NASA geometries. Rough estimates of wing shape, high-lift concept, landing gear and engine installation have been derived from available information as provided in the available NASA publications [9,10]. The Maekawa noise shielding method [20] was implemented in the DLR simulation process. Based on the rough geometry estimates, a simplified representation of the vehicle can be derived as input for Maekawa, as depicted in Figure 3.
The gray colored area indicates the 55t STCA geometry based on available NASA publications and the colored lines show the selected representation of the 55t STCA geometry within this study. The colored symbols indicate the selected locations of inlet fan noise source and rear engine sources. The sound transmission is predicted for the center engine as well as for the two over-wing mounted engines. Fan noise contribution emitted from the inlet is shielded by the wing. Furthermore, the fuselage is approximated and considered as an additional shielding surface. All areas considered for their potential shielding effect are shown in Figure 3. Note: As the planform of the shielding surface has to be trapezoid for the Maekawa method, small deviations between the NASA 55t STCA representation and the modeled shielding planform are present but have no relevant influence on the predicted shielding. Based on the Maekawa tool, shielding factors are predicted for all emission angles and for the relevant frequency bands. These factors are then directly accounted for in the subsequent system noise prediction and applied to the predicted fan noise emission.

4.2. Engine Redesign

The engine model used in this study was redesigned with GTlab to match publicly available data of the 55t STCA engine design [9]. Similar to the NASA engine model, the high pressure system (high pressure compressor, combustor and high pressure turbine) was based on a pre-existing, generic model of the CFM56-7B engine. The fan and the low-pressure turbine were newly designed as fast rotating components. Due to the lower overall pressure ratio, compared to the underlying CFM 56 engine, no booster is required on the low pressure spool. For the divergent part of the nozzle a variable geometry concept was used to allow for adjusting the engine configuration to different operating conditions.
The DLR engine model is designed to match the thrust of the NASA 55t STCA engines at the three published design points, e.g., cruise design point, end of field, and static take-off. Table 2 shows a comparison of engine performance parameters for the three design points between the NASA 55t STCA engine and the DLR redesign. The data for the cruise design point show very good agreement, with slightly higher values for the pressure ratio of compressor and nozzle and a slightly lower value of the extraction ratio. Some deviations are found for the two sea level operating conditions. These deviations can probably be attributed to the use of generic component maps with presumably different efficiency characteristics, causing deviations in the engine component off-design behavior.

4.3. Flight Procedures

Flight trajectories with all required operational parameters as required for a noise simulation are provided by NASA through one of the authors of this paper. They are used as direct input (see Ref. [10], Figure 3). No dedicated flight simulation with DLR tool FLIPNA is performed at this point due to the lack in aerodynamic data to model the flight operation of the aircraft. Only the provided fixed flight procedures can be processed and alternative flight tracks can not be assessed at this point. From NASA, one conventional approach track and two departure tracks are provided for an assessment and initial comparison. For noise certification a straight flight path is prescribed for both landing and take-off procedures.

4.3.1. Departure Procedures

The selected departure tracks to investigate the noise certification comprise a standard and an advanced flight procedure. The advanced departure procedure features a VNRS concept as described in Reference [9]. The VNRS concept under consideration is the so called Programmed Lapse Rate (PLR) [36] during take-off. The PLR refers to an additional thrust reduction before reaching the cutback altitude and in addition to the typical pilot-initiated cutback. The main reason for the application of the PLR is to achieve some additional level reduction at the lateral measurement point which is exposed to increasing noise from SST vehicles according to initial noise predictions by NASA [9]. The PLR is automatically initiated after the initial maximum thrust setting during the acceleration phase on the runway and until reaching the obstacle height. An Automatic Take-off Thrust Control System (ATTCS) would be used to initiate the PLR’s proposed 10% thrust reduction so that the pilot’s workload is not affected and to ensure that the PLR is always flown and certification levels are thus complied with. So the PLR could lead to an additional responsibility of the ATTCS. Another change to the standard flight procedure is a proposed increase in flight speed during take-off in combination with a delayed rotation take-off, which is referred to as high speed climb-out. This modification of flying fast at low altitudes aims to avoid flying in the region of reversed command or in the so-called “back part of the power curve” as already explained in Reference [9]. This consequently reduces thrust requirement, which is associated with a decrease in engine noise.

4.3.2. Approach Procedure

The proposed certification rules for the approach of supersonic aircraft do not differ from the regulations for subsonic aircraft, i.e., the approach will be flown with the typical 3 degree glide path and a selected speed of Vref + 10 kn or ≈84.9 m/s (165 kt) with the maximum landing weight. The selected approach speed depends on the flapped aerodynamics and stall speed, among others. As prescribed, the aircraft is above the approach measurement point at an altitude of 120 m. A flap deflection study was performed by NASA to maximize the approach speed and thus minimize engine thrust. In the relevant approach segment, the aircraft is in stabilized flight condition with landing gear extended and a constant total thrust of 71.1 kN.

4.4. Noise Assessment

Based on the simplified aircraft design, the detailed engine redesign, the Maekawa shielding approximation, and the flight trajectories, the DLR system noise prediction is initiated.
Figure 4 shows PNLT over time for DLR simulations calculated with PANAM as well as NASA data (red) extracted from Reference [10] (Figure 4, Figure 5, Figure 6 and Figure 7).
The flyover and the lateral measurement points are assessed for two different departure procedures. For the lateral assessment, the distances of measurement point to Brake-Release (3756 m for standard procedure and 4130 m for advanced procedure) are fixed and adopted from the NASA study. This location was chosen because at this point the aircraft has climbed to about 1000 ft, where the effects of lateral attenuation have abated, but before the airplane climbs higher and recedes from observers on the ground.
In addition to the level time histories, the certification levels (EPNL) are listed in Table 3 together with limits of noise certification for the NASA 55t STCA study. A reduction in certification levels by applying the advanced procedure for both the flyover and lateral point can be confirmed. It can be seen that the benefits for the lateral point are larger with reductions around 3.3 EPNdB than for the flyover point with around 1.5 EPNdB which are both similar to the reductions in the NASA investigations (see Ref. [9]: 2.0 EPNdB for lateral point and −1.6 EPNdB for flyover). For the approach, where no procedure adjustment is sought, there is a deviation of 2.4 EPNdB from the NASA comparison data. Thereby, the jet noise is no longer the dominant sound source, so that the differences is due to the dominant fan noise. While in the NASA studies a margin on Chapter 4 of 1.6 EPNdB was observed by applying the advanced procedure, here the cumulative result is an exceedance of the required limit by 2.6 EPNdB. Consequently, noise certification to FAA NPRM or even Chapter 14 requires further level reduction through noise mitigation measures.
In order to investigate the shielding effect of the engines, a comparative calculation was also performed without taking noise shielding effects into consideration. An effective reduction in the certification level for the NASA 55t STCA due to over-the-wing engine integration is evident when the certification levels of the two setups are compared. This is particularly visible for the forward fan noise, where a system noise reduction of more than 8.5 dB can be identified under certain operating conditions. An under-the-wing configuration would result in higher levels under the same operating conditions.
In addition, it is shown that without engine noise shielding, there is even an increase in PNLT of 2.5 dB in the maximum of forward directed fan noise (e.g., see Figure 4, flyover advanced at t = 73 s) when the advanced procedure is applied and the engine is operated at lower thrust setting. This is attributed to the effect of relative blade tip mach number on predicted noise levels according to the applied buzz-saw noise model Ref. [38] as already shown in Ref. [19].
A comparison of the PNLTM for the lateral position shows a good agreement with the NASA data when using the Maekawa model. Remaining discrepancies, i.e., flyover in Figure 4 can be attributed to the fan forward noise prediction in combination with the Maekawa shielding. PNLTM/EPNL prediction differences between NASA and DLR are below 2.3 dB/0.9 EPNdB for flyover and approx. 0.8 dB/0.9 EPNdB for lateral location. Unfortunately, the differences for approach are higher. Overall, the agreement is considered satisfying and can be traced back to remaining differences in simulation methods, implementation of the models, and input parameters between NASA and DLR.
The results confirm the benefits of an adapted take-off procedures for the STCA concept. Feasibility of the findings is demonstrated when comparing these findings with available NASA results. A final and detailed tool comparison is still pending in order to answer remaining open questions and to rule out a close agreement on certain result parameters by simple coincidence. Overall it can be concluded, that the novel process chain can reasonably be applied to other preliminary concepts of similar supersonic aircraft designs of which one is presented in the next section.

5. Application on a Twin-Engine Aircraft

Current concepts from manufacturers usually feature under-the-wing engine installations, where advantageous noise shielding through the wing and fuselage cannot be exploited. Therefore, a further configuration is investigated that addresses this aspect in order to estimate the magnitude of noise certification levels of such configurations. Based on an available SST aircraft design [14], the influence of the flight procedure under the proposed FAA certification rules are assessed, i.e., via dedicated parameter sensitivities. The DLR simulation process can generate arbitrary noise metrics, e.g., SPL(t), SEL, LAMAX, EPNL, and even Sound Quality metrics [39,40]. With the focus on certification, the assessment within this study is limited to EPNL. Levels at selected observer locations and the actual noise distribution along the entire flight trajectory are investigated.
The aircraft and engine details are described in the following section. Thereafter, the flight simulation and noise prediction results are presented.

5.1. Aircraft and Engine Design

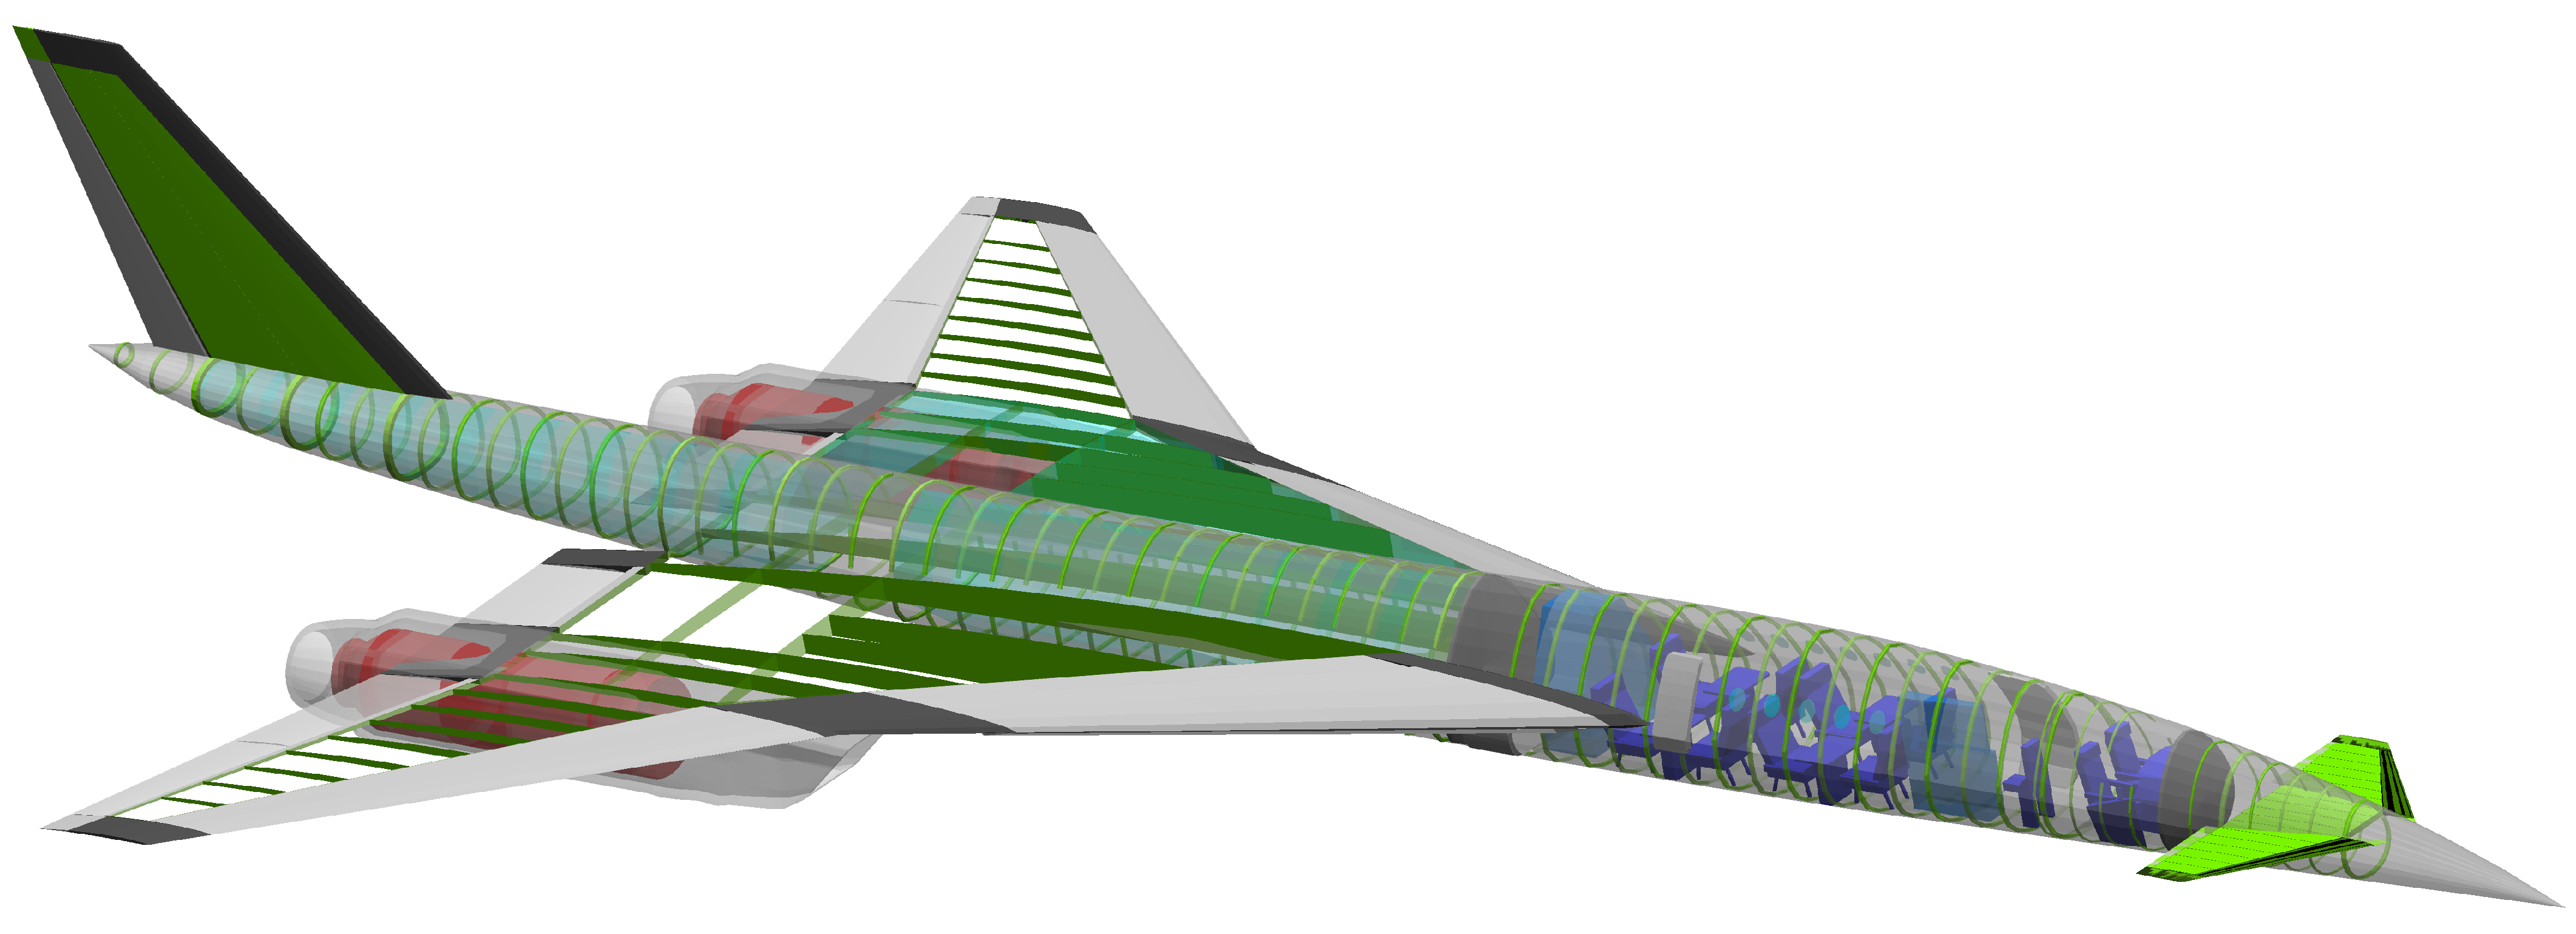
The basic aircraft that is used for the study presented in this publication has been derived within the frame of conceptual/preliminary design. The selected aircraft is well described in Ref. [14] and its geometrical data is provided in Table A1. The results of the aircraft design process are given in Table A3. The aircraft data presented here originates from this source except of an updated engine design. The aircraft TWO is equipped with a scaled version of the DLR engine described in Table 2. The aircraft is designed to carry eight passengers, equal to 726 kg of payload, along a range of 7500 km (4050 nautical miles), thus providing transatlantic capability. Its maximum fuel volume is ( V f u e l , m a x ) is 44.7 m 3 .
However one significant change has been made for this study by reducing cruise speed at the design point of the aircraft from Ma = 1.6 to Ma = 1.4. The change to a lower Mach number in this publication is a result of current trends in the design of supersonic business jets as outlined in the introduction. Consequently the resulting aircraft does have a lower Maximum Take-off Mass ( m M T O M ) than the basic design from Ref. [14] and it thus requires engines with less static thrust. Keeping in mind that this publication focuses on acoustics, the Ma = 1.4 design promises a more favorable starting point with respect to engine noise compared to an aircraft with a design speed of Ma = 1.6.
An extract to the requirements is given in Table A2.

5.2. Flight Simulation and Noise Prediction

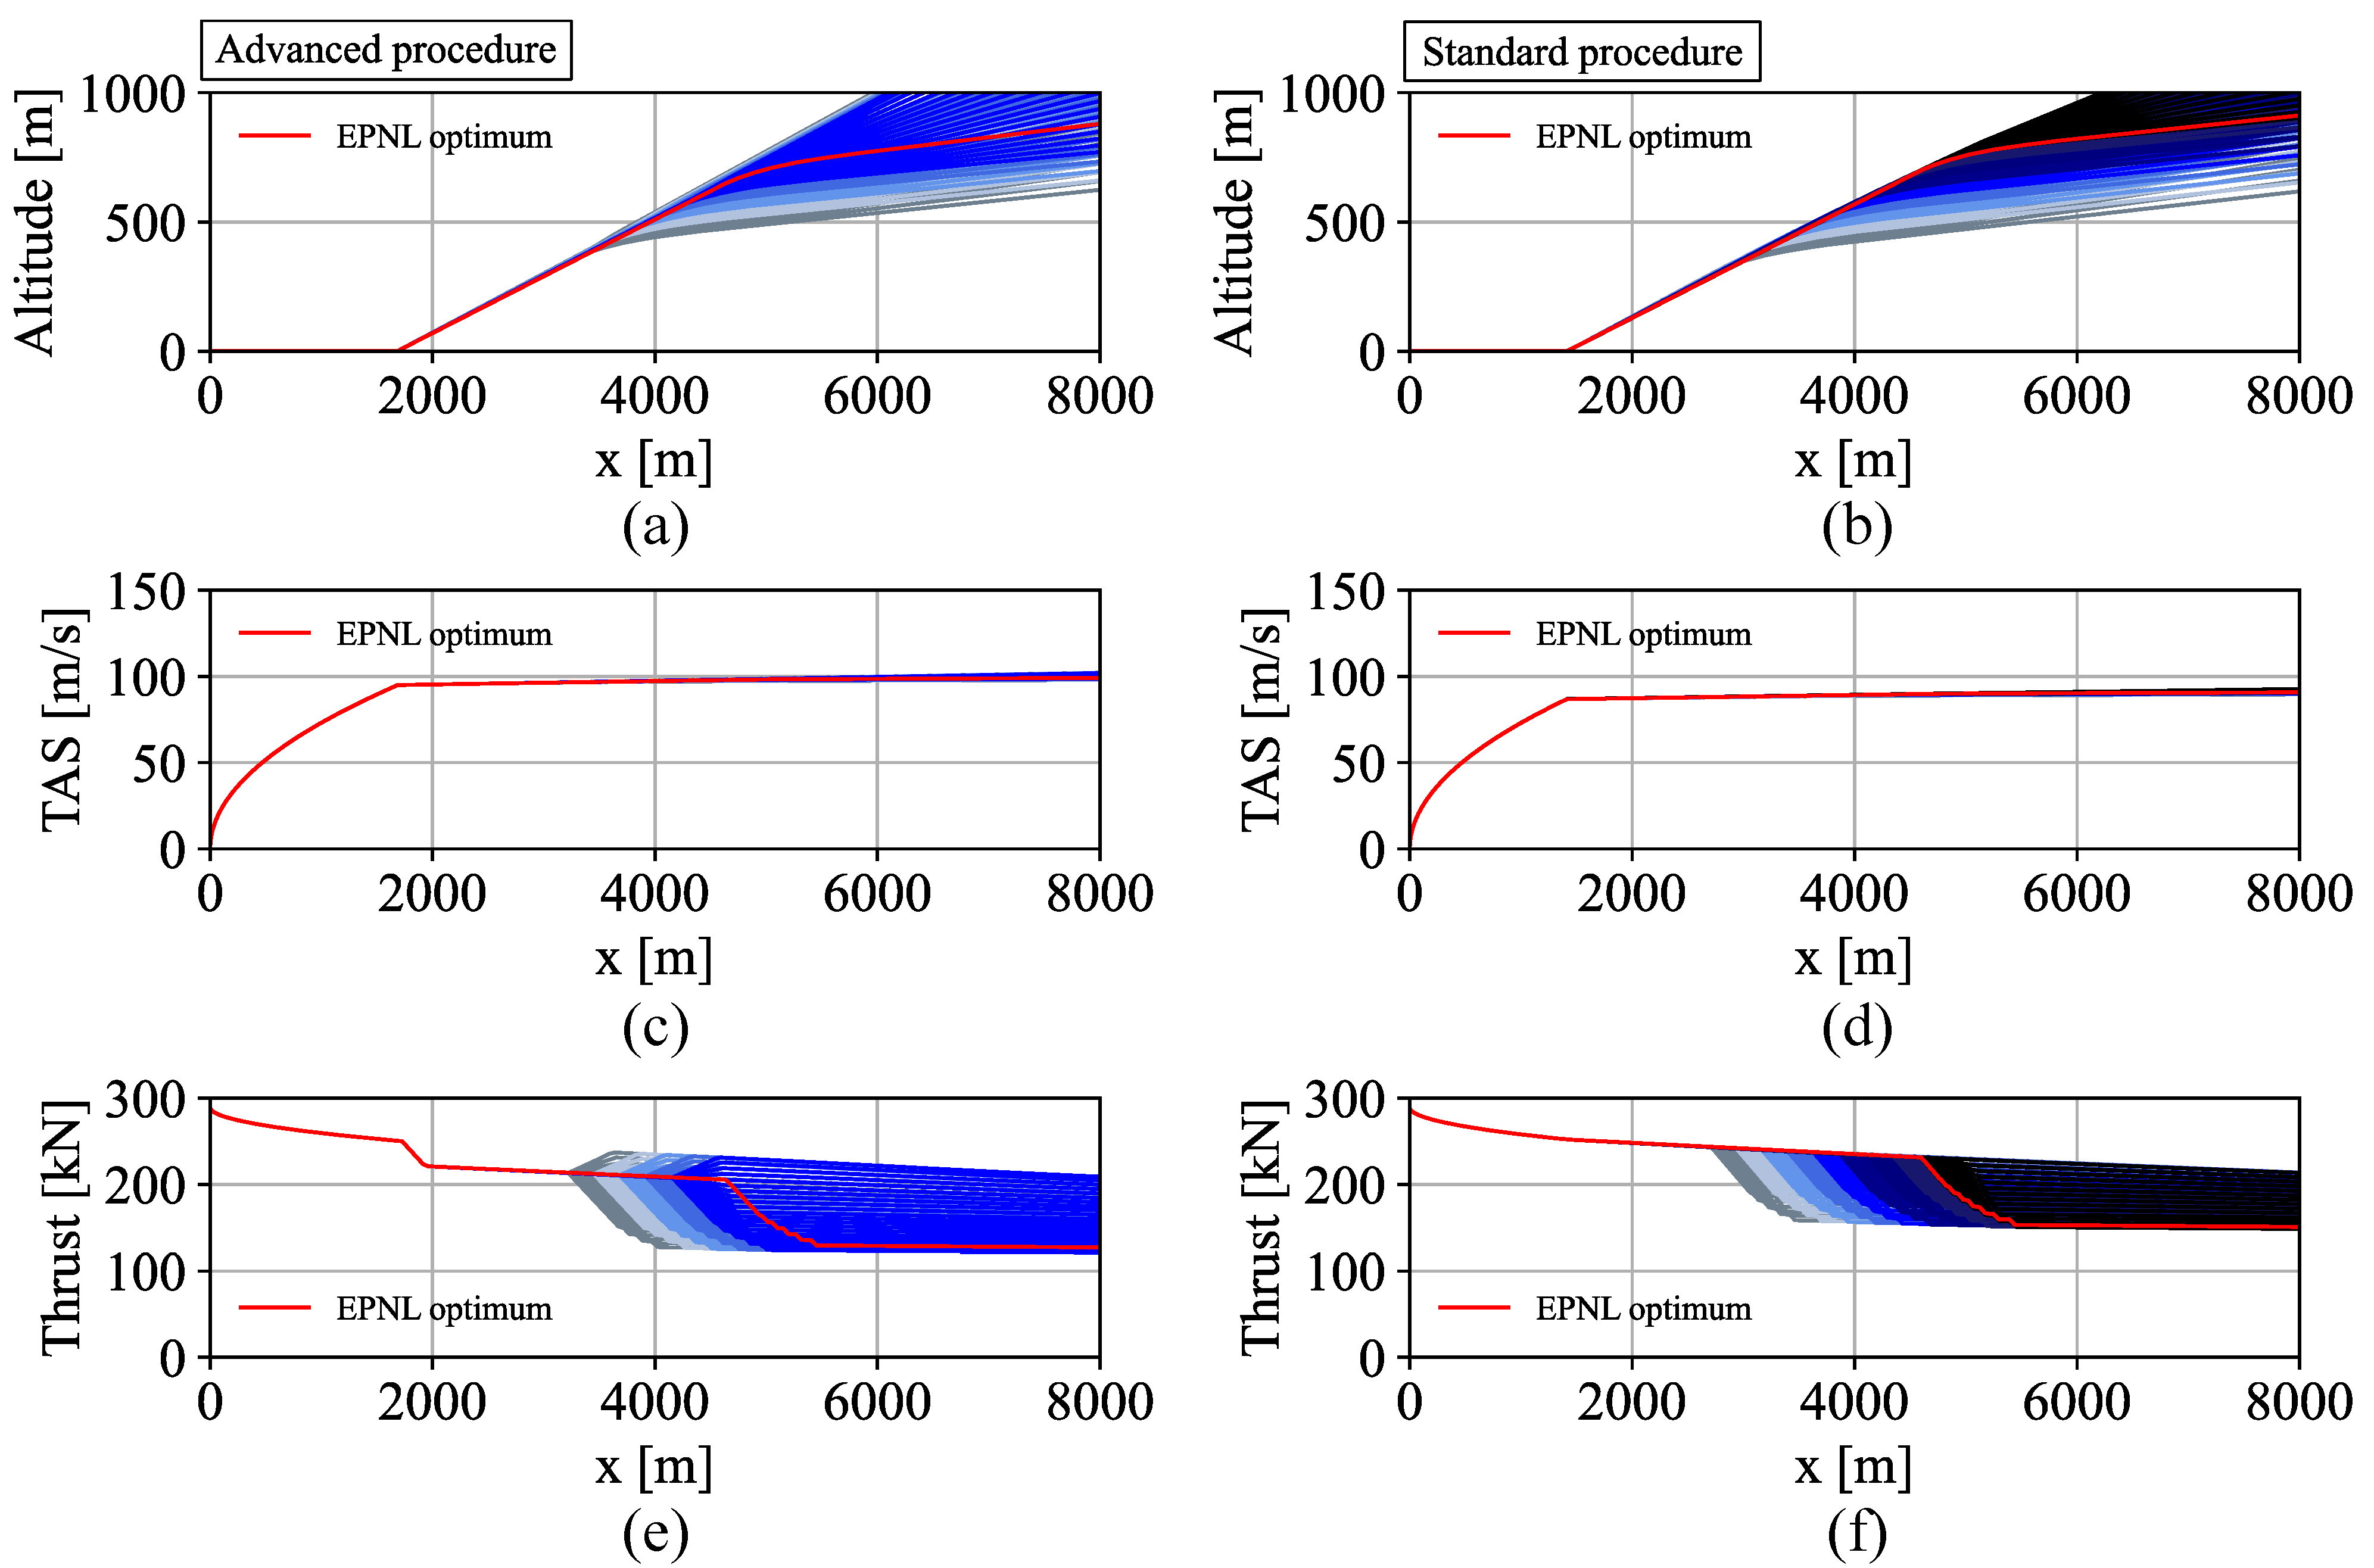
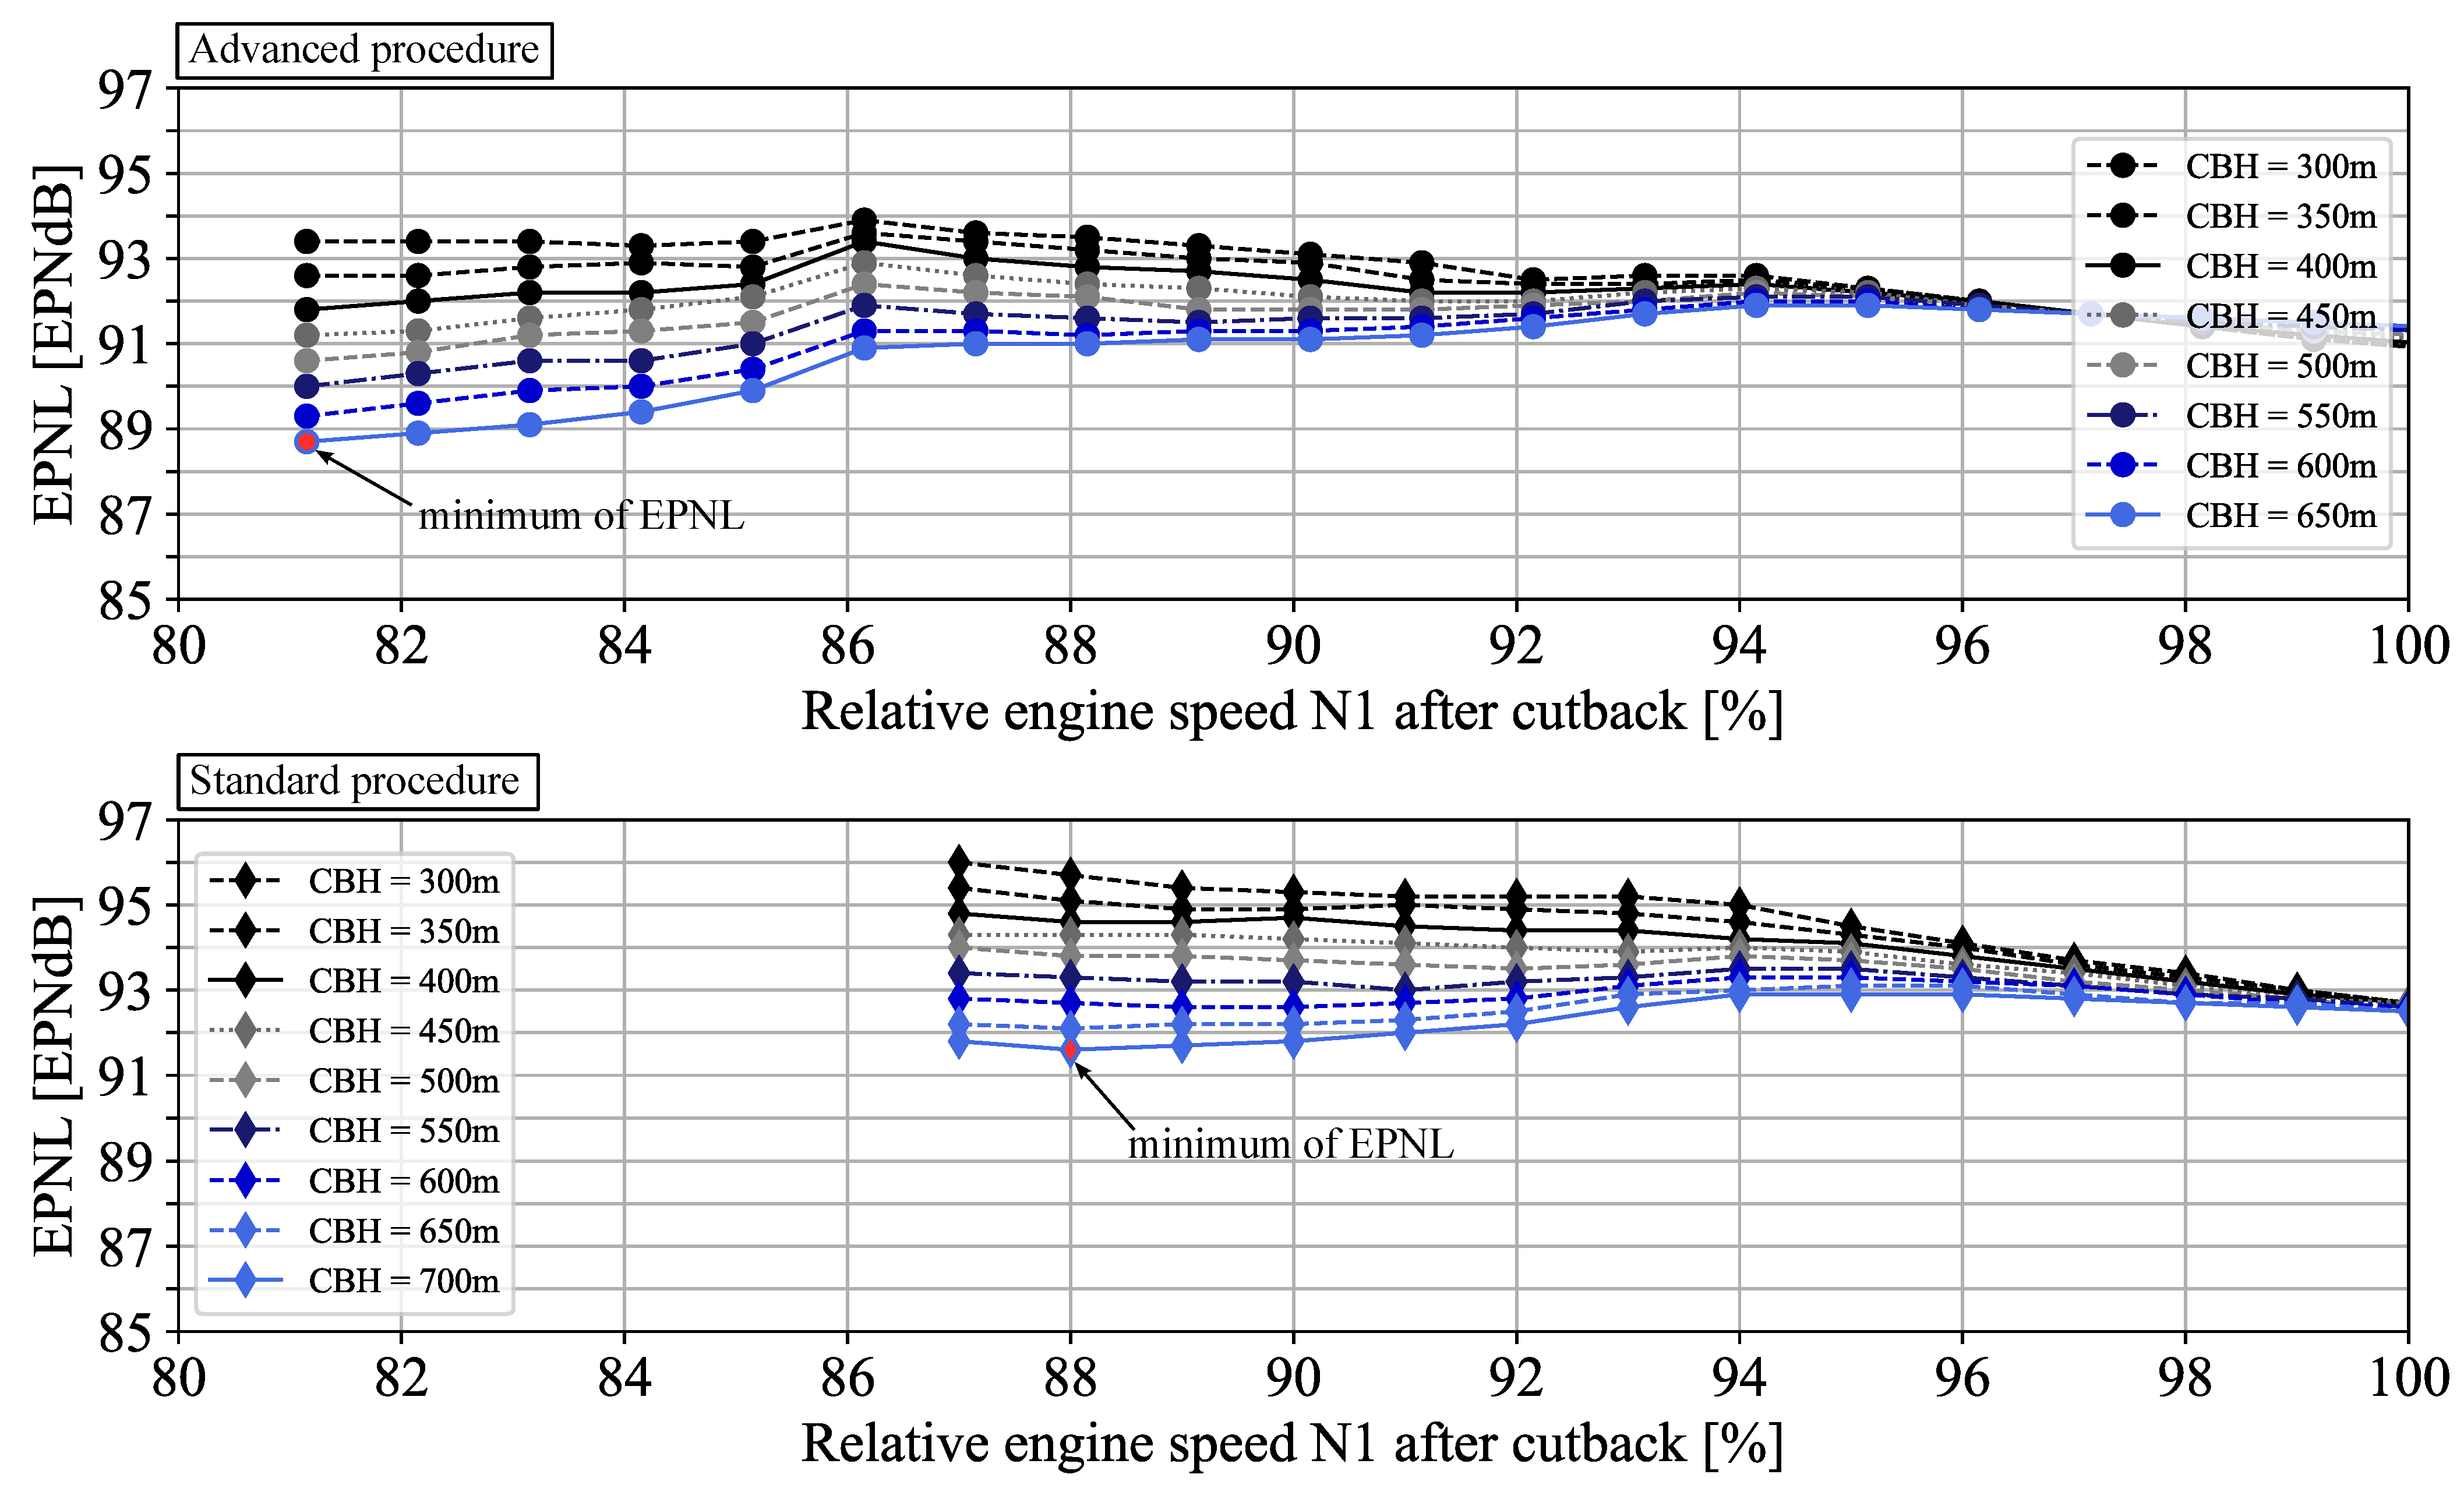
To determine the trajectories for standard and advanced take-off, an optimization was performed taking into account the ICAO noise certification regulations, which includes a variation of airspeed, thrust and cutback height. The standard definition of NASA was chosen as a reference Reference [9]. The aim of this optimization was to minimize the certification level at the individual noise measurement points. The results are shown in the form of EPNL at the flyover measurement point above relative engine speed in Figure 5 for the standard (bottom) and the advanced departure procedure (top). In addition, a figure of all trajectories evaluated for the variation is included in the Appendix A in Figure A2. The noise certification regulations limit the ranges of the individual flight path parameters, e.g., minimum climb rate (4%), minimum cutback altitude for two engines (300 m), and maximum cutback altitude, respectivly the requirement that the thrust reduction of the cutback must be completed before the measurement of the EPNL at the flyover point. The application of the highspeed climbout allows the thrust for the advanced procedure to be reduced further after the pilot-initiated cutback, due to the decreased thrust requirement as described above. Obviously, the lowest certification level at the flyover measurement point results for the highest cutback altitude still allowed, whereas this altitude is larger for the standard procedure, since there is no additional thrust reduction through PLR and thus a faster increase in flight altitude. For both procedures, the lowest EPNL occurs in the range of low relative engine speeds. As can be seen, it is also confirmed for the aircraft TWO that an advanced procedure or a highspeed climbout results in a reduction at the flyover measurement point. In the following, the two procedures with the lowest EPNL are analyzed in more detail.
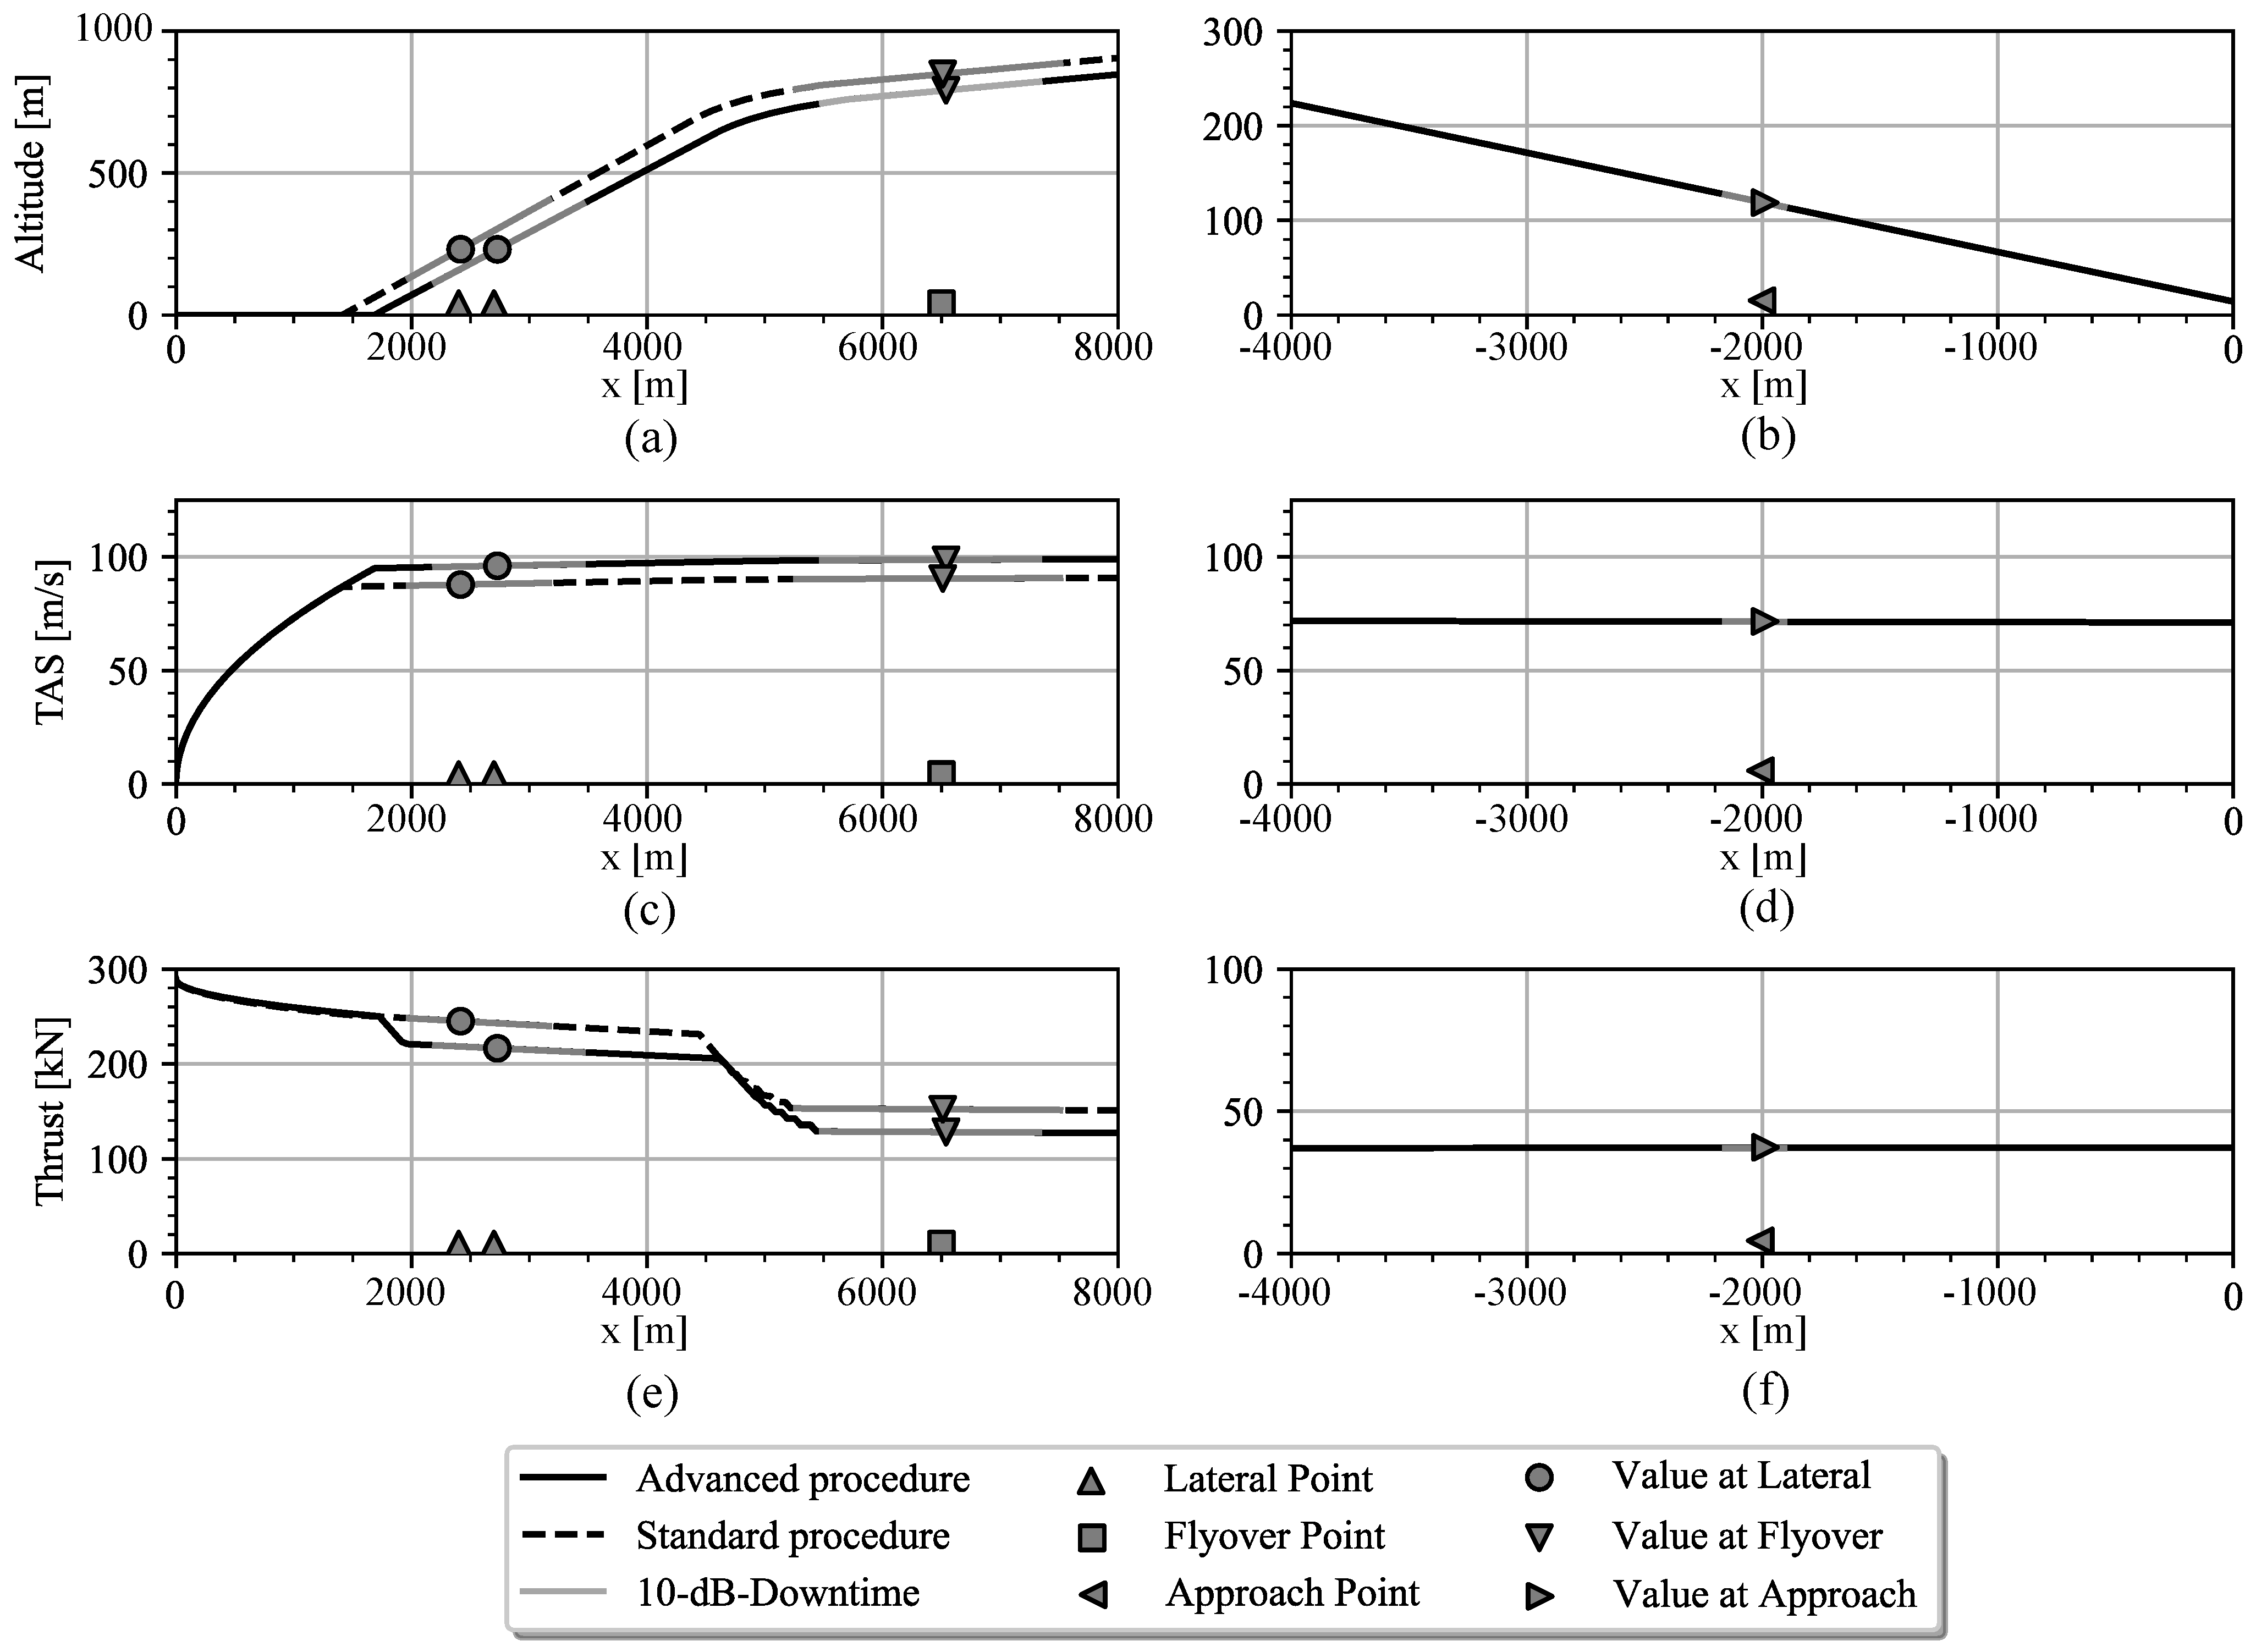
Figure 6 provide the resulting trajectories as simulated for this vehicle, i.e., take-off (left) and approach (right), respectively. The proposed SST rule changes refer to the take-off situation only, so that it is sufficient to assess one approach procedure here.
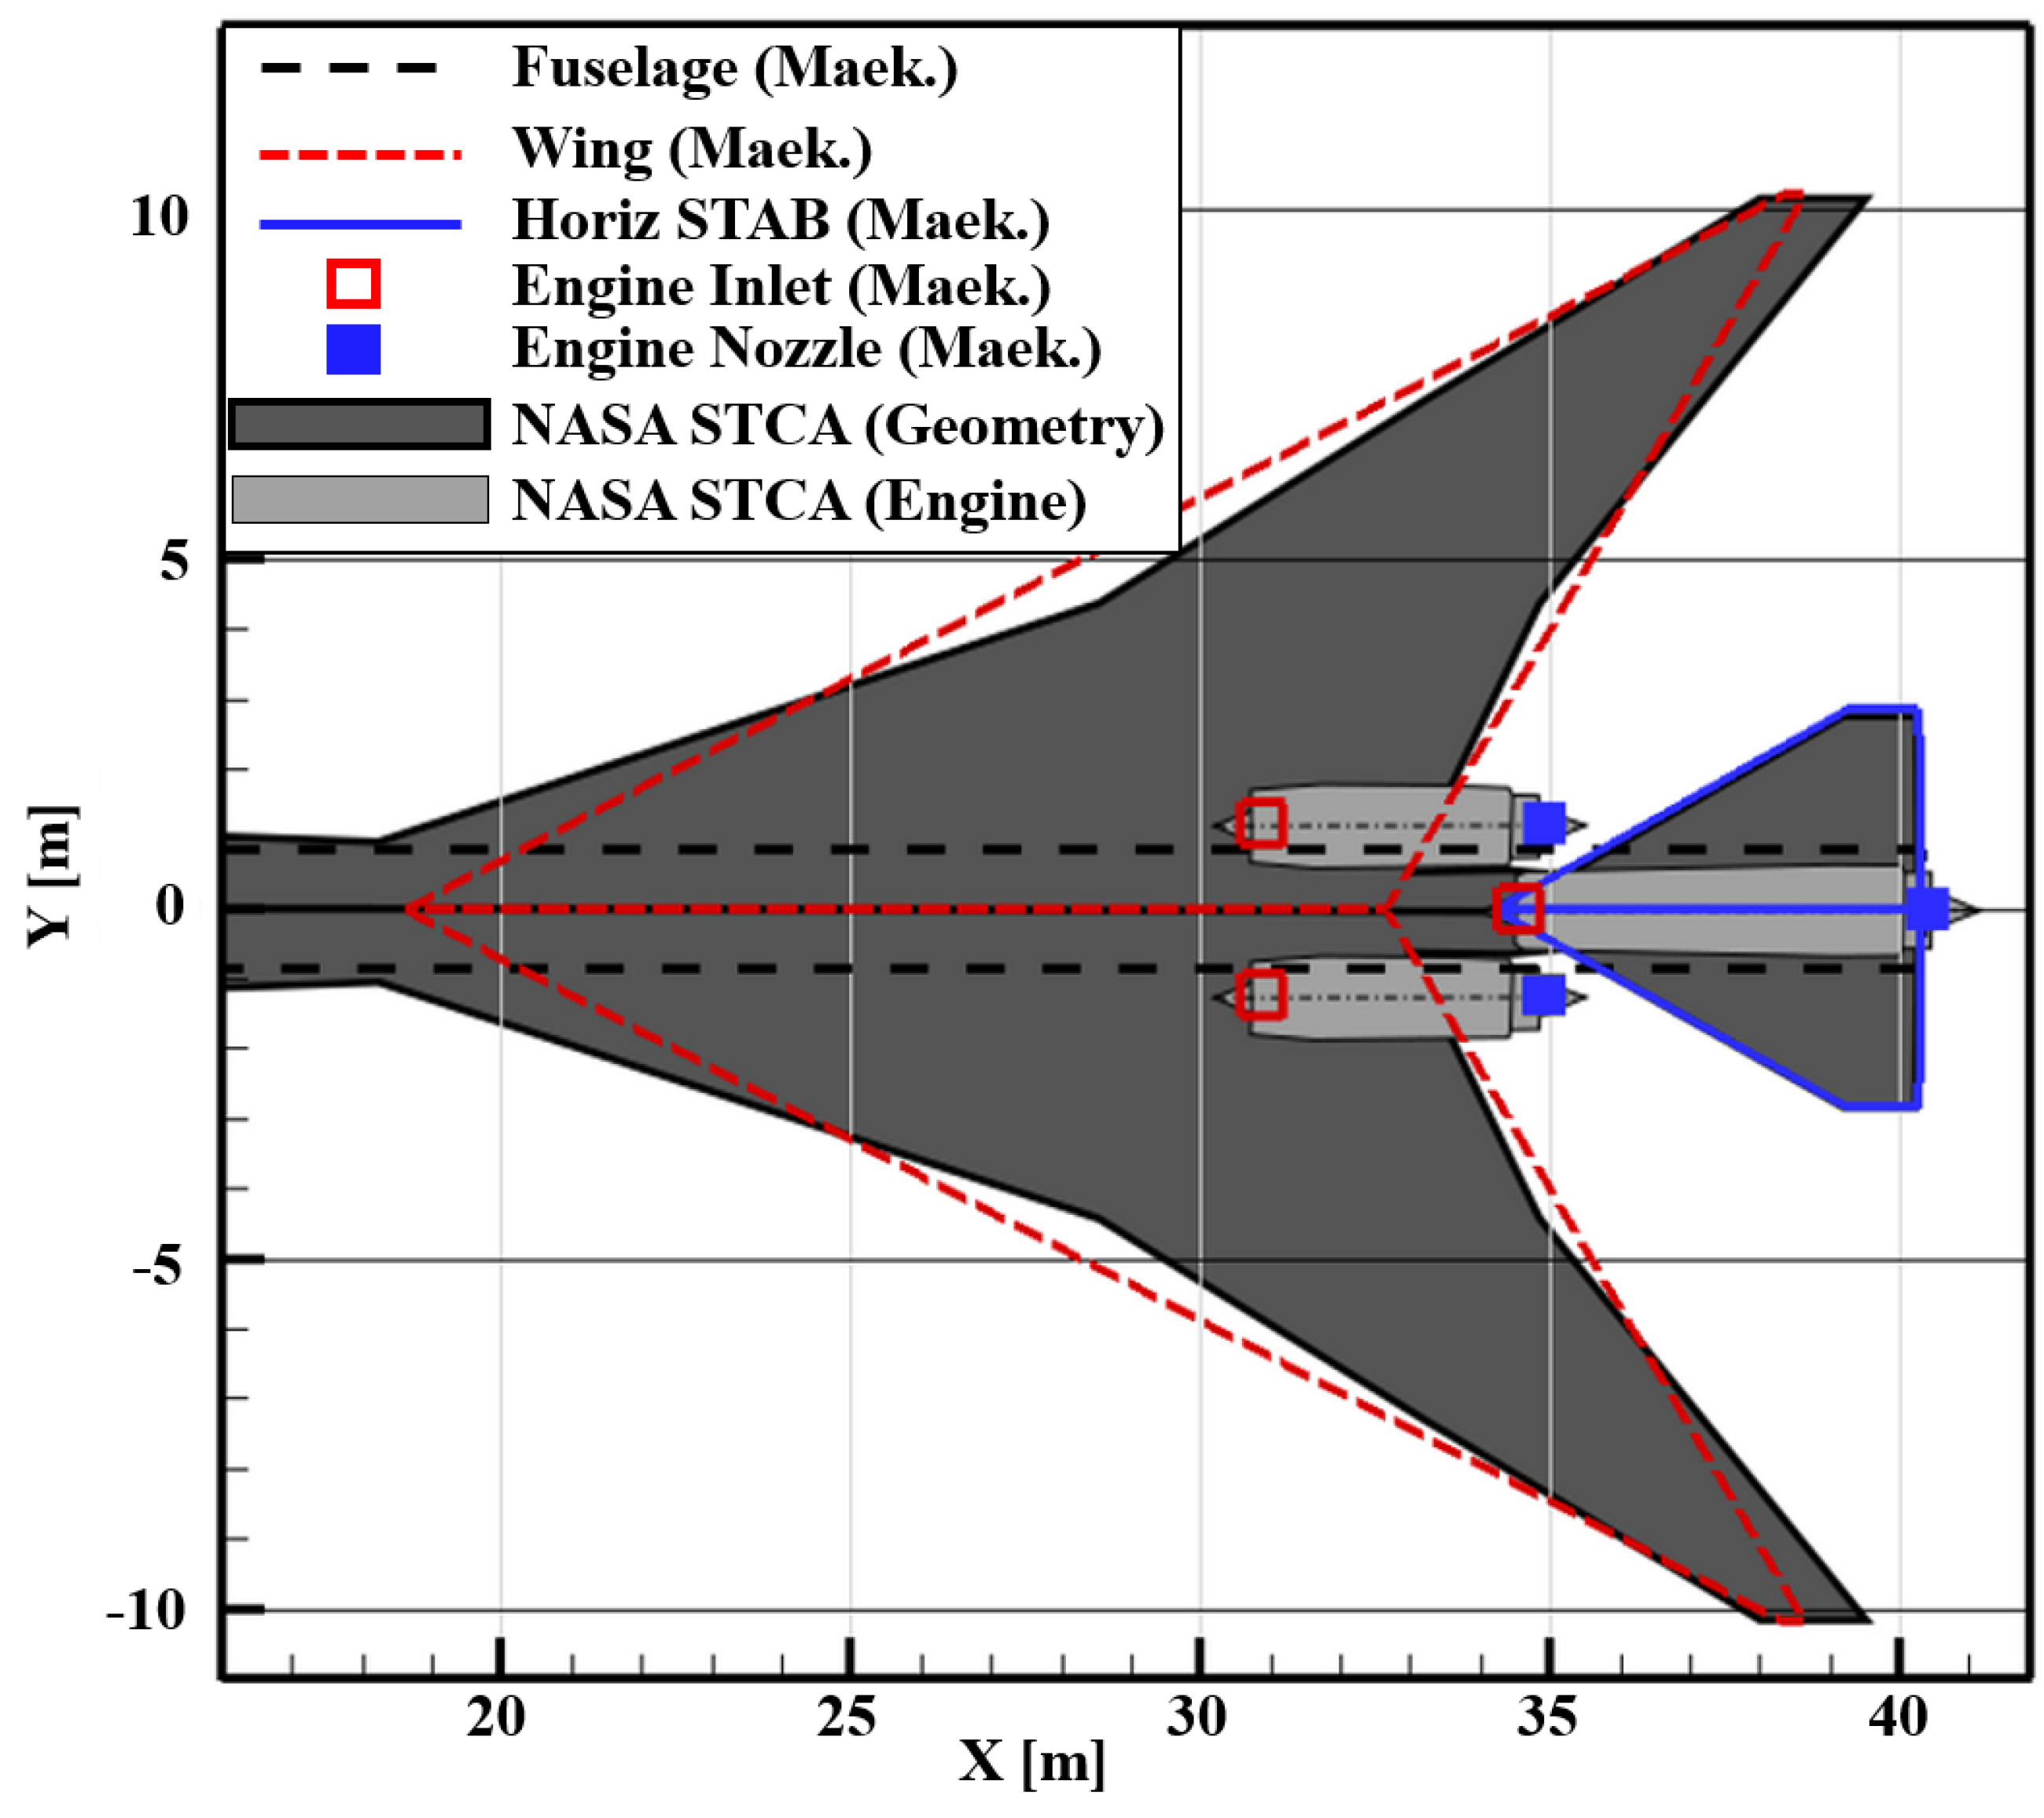
Since the engines are mounted under the wing in the configuration investigated, no effective shielding of the engine noise can be achieved here, as was observed with the NASA 55t STCA. For this reason, the modeling of the shielding effect was neglected in these investigations. The lateral measurement position was calculated separately for each simulated trajectory and the position with the highest EPNL was selected for noise assessment.
Although the maximum take off mass is very similar, the aircraft TWO has a higher thrust excess compared to NASA 55t STCA due to the smaller number of engines. The reason for this is that, airworthiness regulation requires an aircraft to be able to take-off with one engine inoperative. This means that the aircraft TWO requires a shorter runway length and can gain altitude more quickly. The characteristic take-off speed V2, which determines the speed limitation in the departure procedure of the noise certification, is lower for the aircraft TWO than for the NASA 55t STCA. Nevertheless, the speed differences between standard and advanced procedure are the same.
In order to achieve a higher flightspeed (V2 + 35 kn) for the highspeed climbout, a delayed rotation take-off is used in the advanced take-off, which results in a significantly longer runway length of approx. 1690 m compared to the standard take-off (approx. 1410 m) with lower flightspeed (V2 + 20 kn). As a result, the aircraft has a higher altitude along the standard take-off, which can be advantageous on the ground due to atmospheric attenuation and distance. However, due to the variable position of the lateral measurement point, there is a shift of the highest EPNL and thus the selected lateral measurement point position relative to the brake release point changes from 2300 m to 2700 m. It is observed that flight altitude above the lateral measurement point as well as the relevant range of the trajectory related to altitude is very similar for the two procedures.
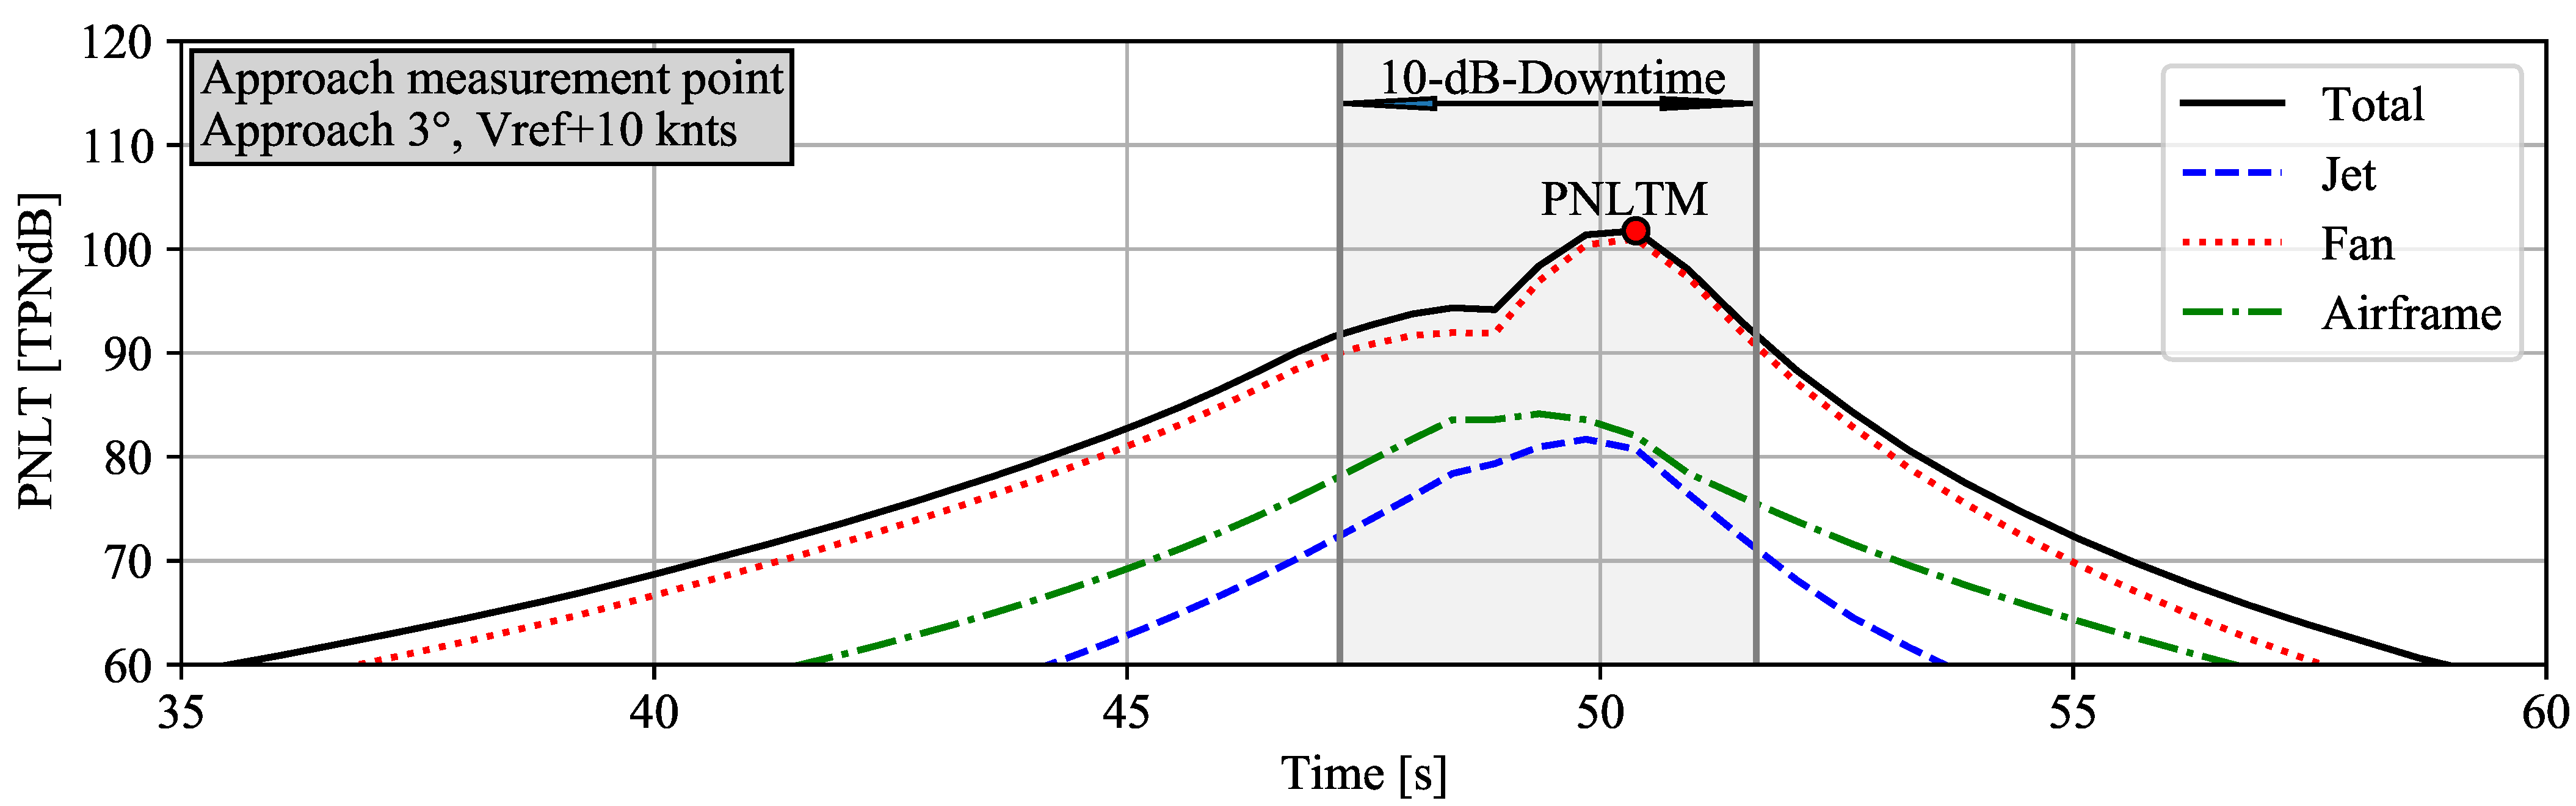
For the approach simulation a 3° glide path with a height of 120 m above the measurement point is assessed, i.e., with the aircraft in a stable flight condition. For the aircraft TWO, this results in an airspeed of 71.48 m/s above the measurement point with a constant total thrust of 37,160 N over the relevant area of the flight path according to the specifications with Vref+10 knts.

5.3. Noise Assessment

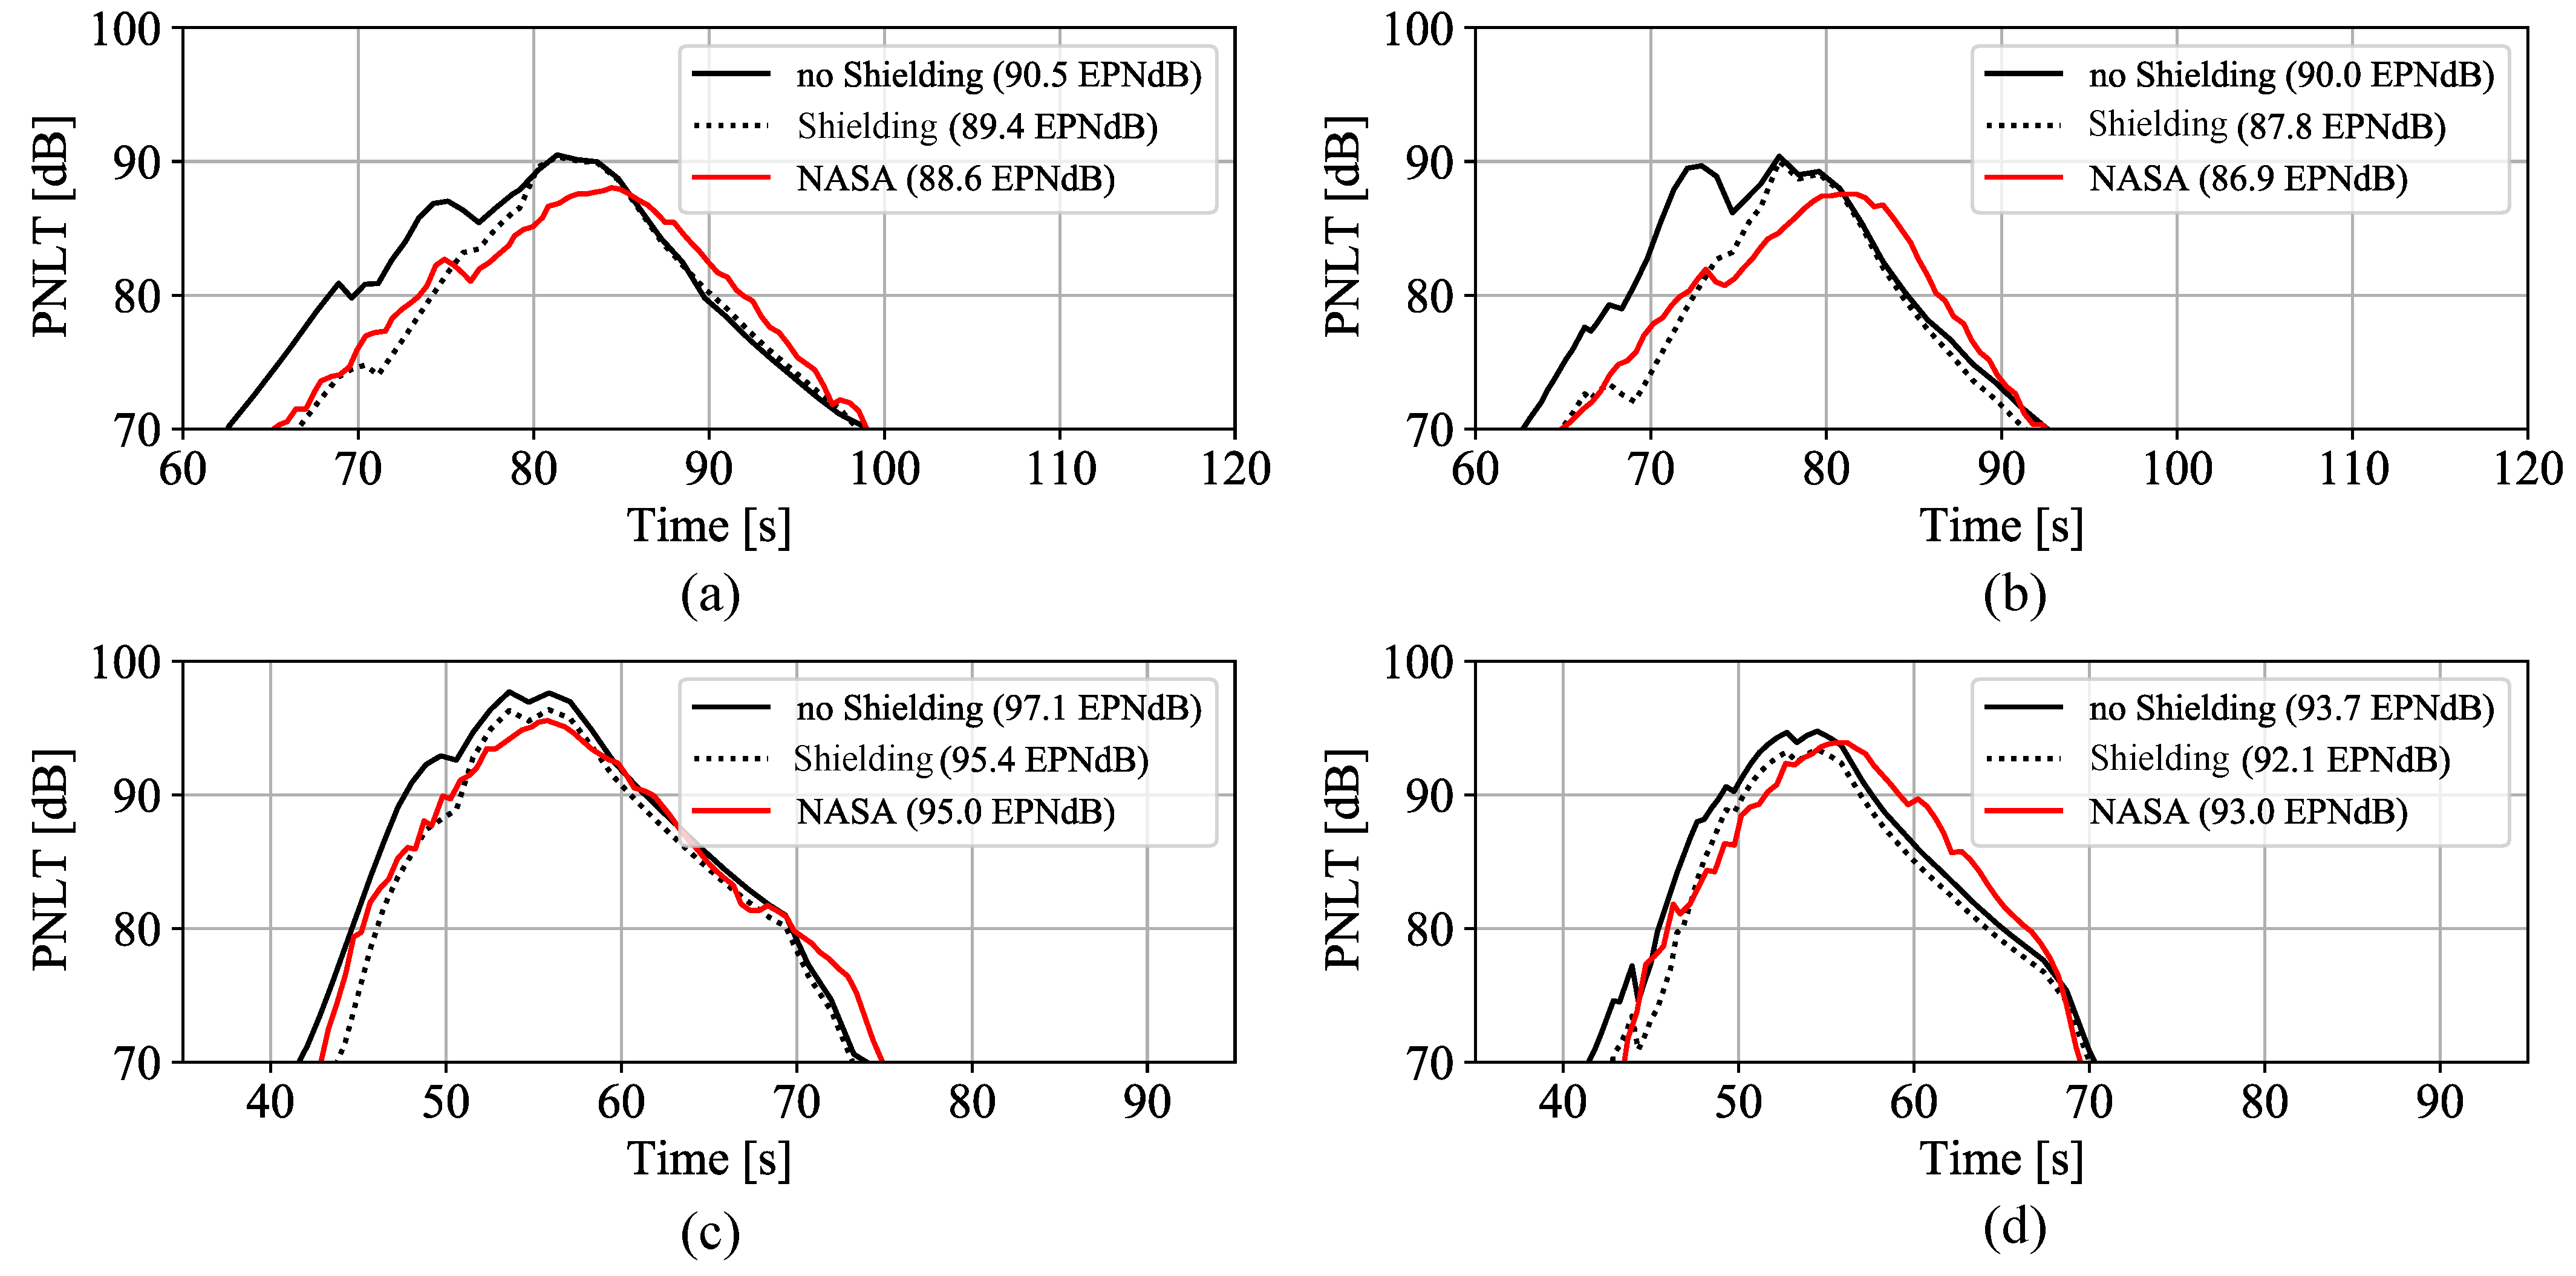
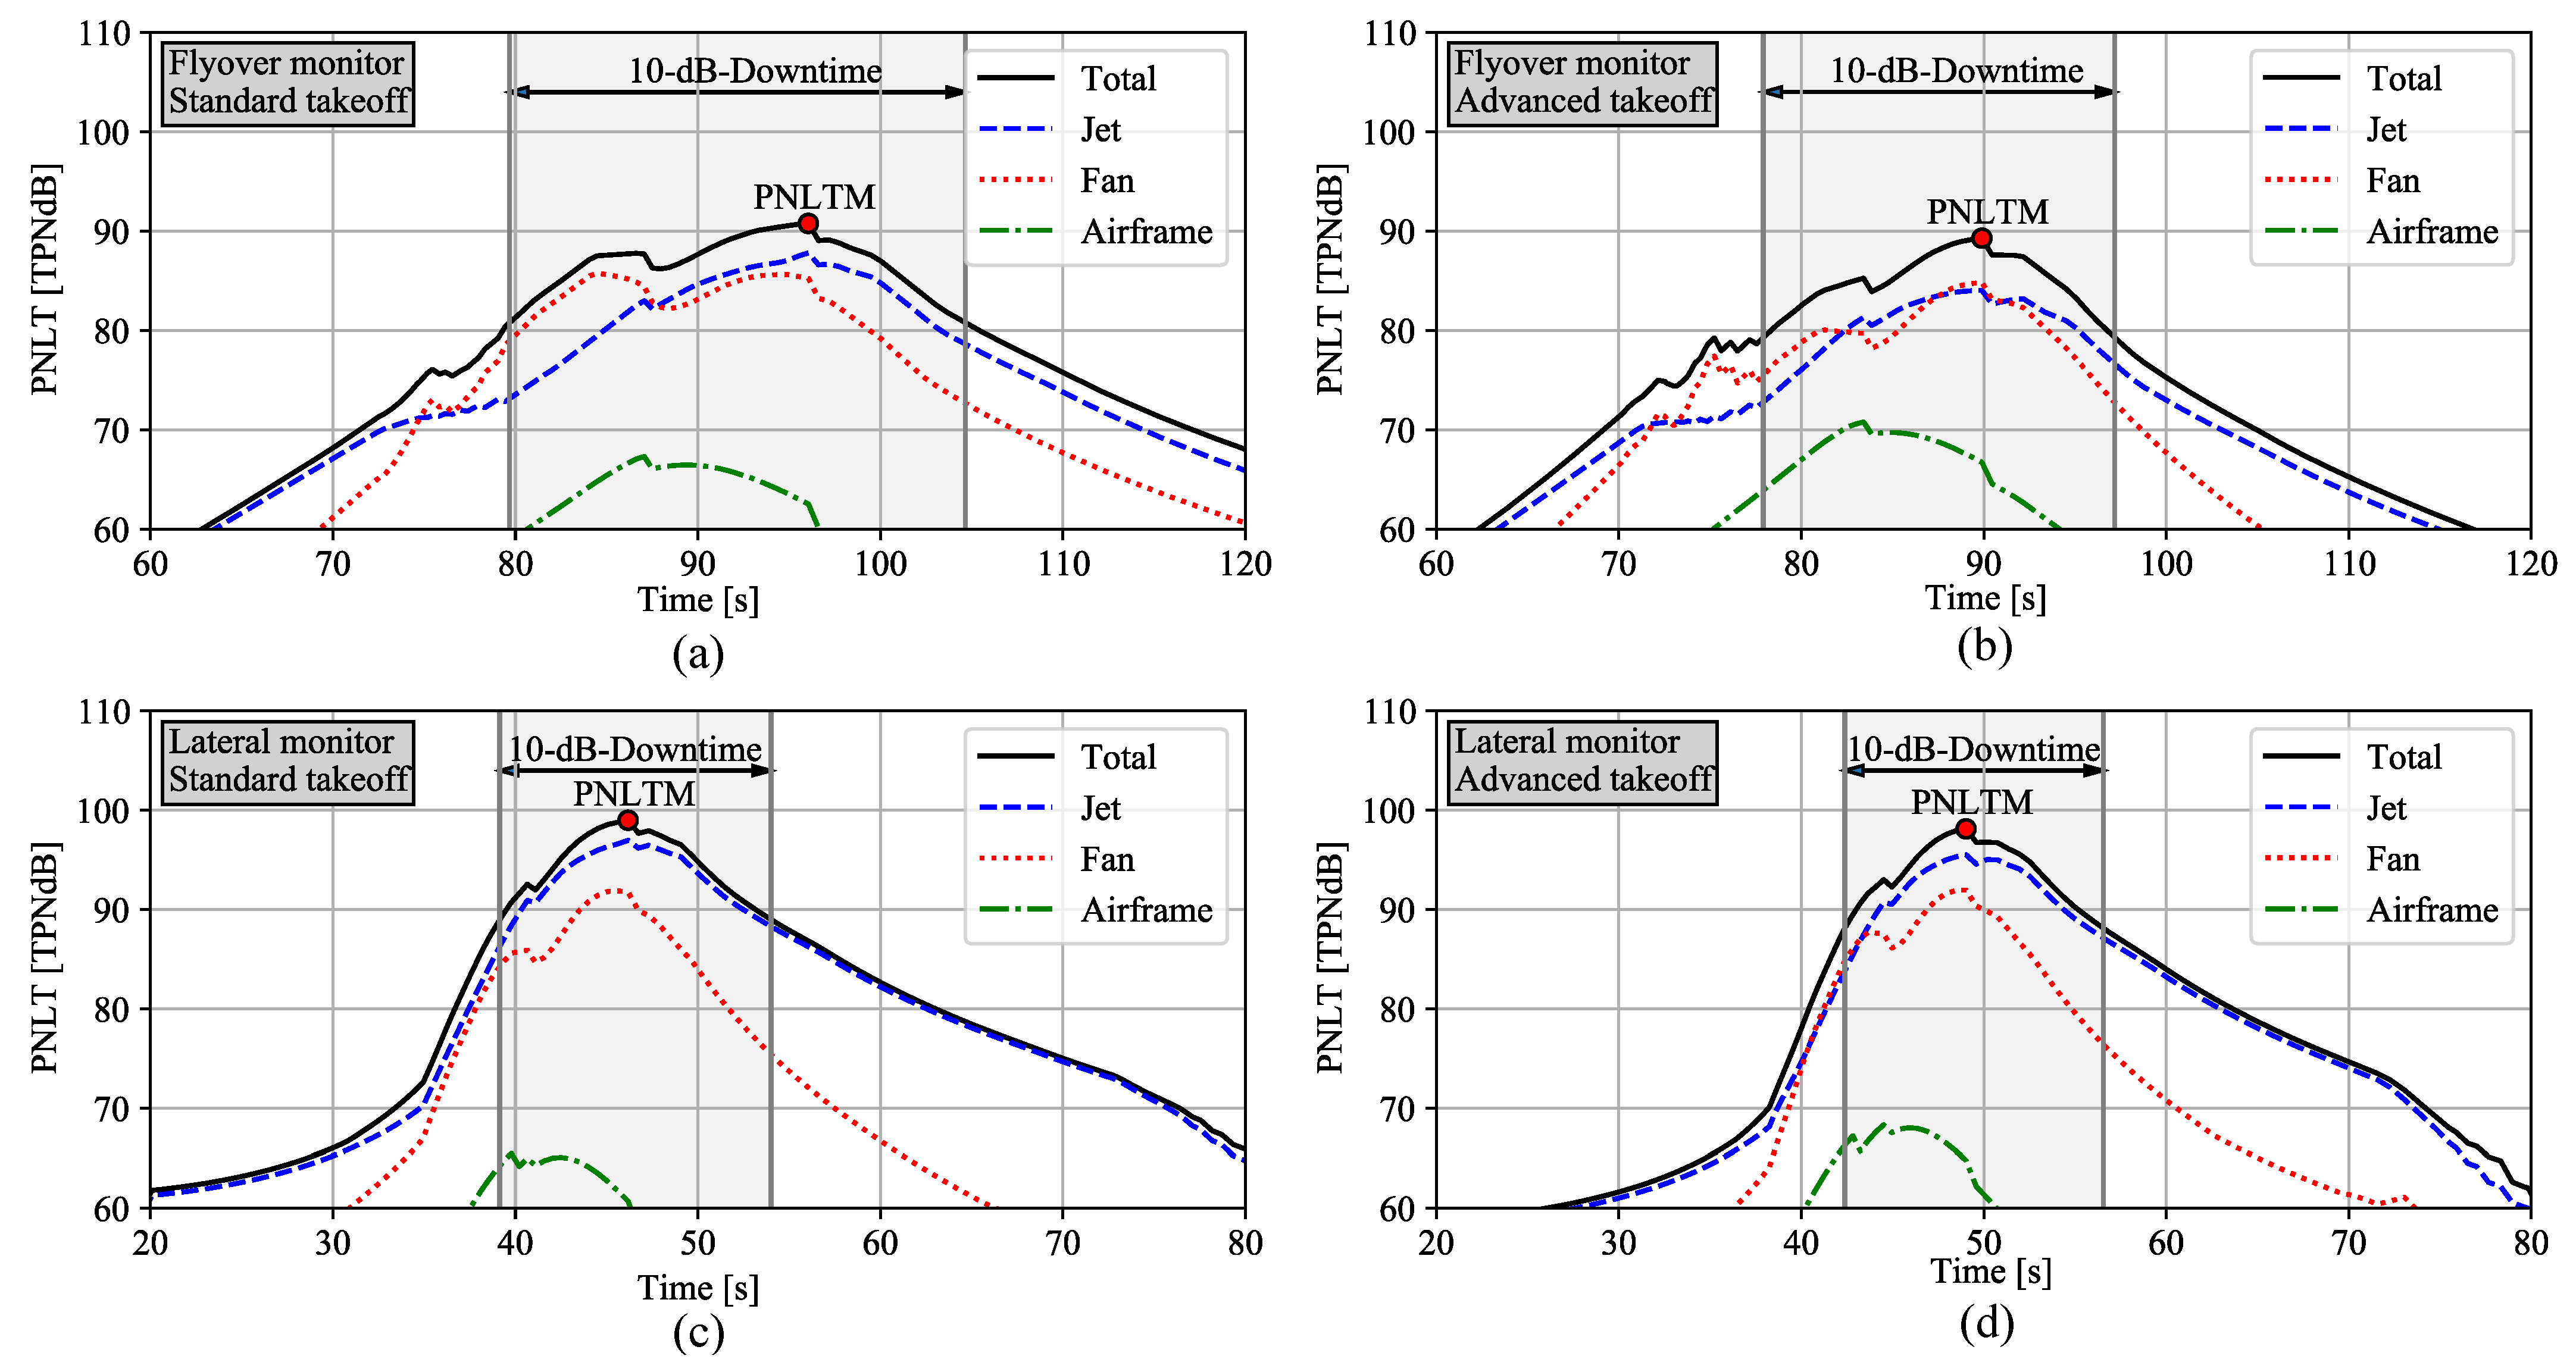
In order to assess the advanced and standard departure and the approach procedure, the tone corrected perceived noise data (PNLT) for the total aircraft as well as for individual noise components (jet, fan, airframe), are depicted in Figure 7 and Figure 8. In addition, the area of the 10 dB-down time relevant for the calculation of the EPNL and the maximum of the tone corrected perceived noise level (PNLTM) are highlighted in the figures. Predicted EPNL are summarized in Table 4.
In both PNLT plots (standard and advanced), there are two distinct local peaks, which can be attributed to forward and backward radiated engine noise contribution. The first peak is associated with the fan contribution, cf. see red dotted lines. The second peak is at a significantly higher level and can be associated with the rearward radiated jet contribution.
The following differences in noise source ranking along standard and advanced procedure can be identified for the aircraft TWO. Jet noise is dominating the fan noise at the lateral measurement point by +5 dB along the standard and by +3.5 dB along the advanced flight procedure, respectively. At the flyover measurement point the contribution of both noise sources, i.e., jet and fan, is of similar magnitude due to the reduced thrust setting (thrust cutback) and the resulting reduction in jet exhaust velocity. In general, the influence of the fan on total aircraft noise is higher along the advanced take-off compared to the standard procedure due to the PLR and the highspeed climbout. Fan noise influence is increased due to a lower jet noise contribution which is a direct consequence of the PLR thrust reduction and the increased flight speed along the highspeed climbout as already mentioned in Ref. [10]. Consequently, the effectiveness of fan noise shielding is increased along the advanced procedure as can be demonstrated for NASA 55t STCA. The highspeed climbout has a larger effect on the flyover measurement point, which also confirms the observations of NASA.
Only one approach flight is simulated for the aircraft TWO as described above. The predicted PNLT is plotted in Figure 8. Jet noise contribution is significantly decreased, revealing a dominant fan noise. Airframe noise levels are still insignificant even for this approach situation. The predicted EPNL are listed in Table 4 and no additional approach contour plots are shown in this paper. These plots are omitted since only one approach flight procedure is considered in the study.

Certification Noise Levels

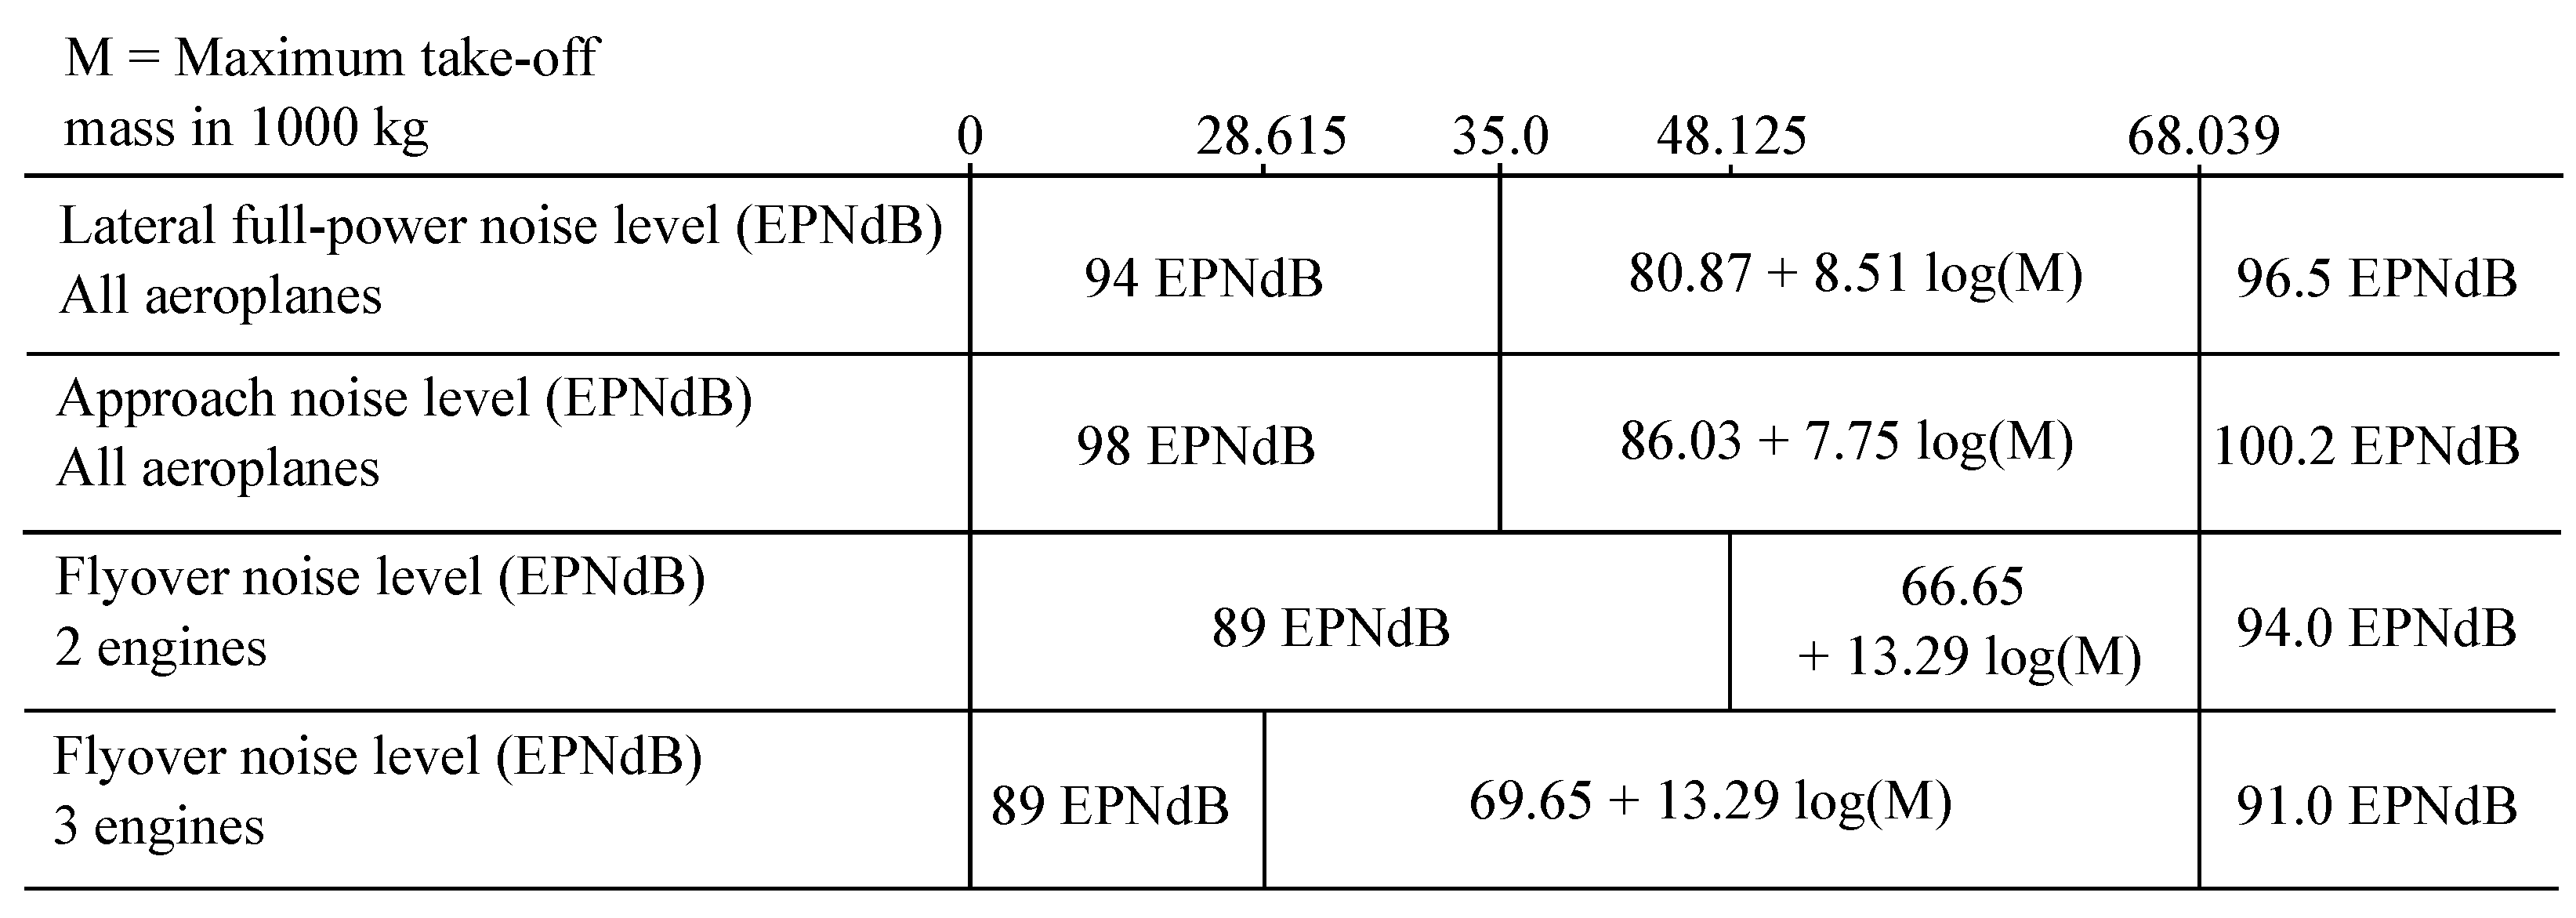
The predicted EPNL values are now compared to available noise limits specified according to the Noise Chapters of ICAO Annex 16 [37] and the proposed FAA regulations [4], see Table 4. At the departure measurement points, defined limits of the FAA NPRM are exceeded by the aircraft TWO along the standard departure (+1.8 EPNdB at the flyover point and +1.7 EPNdB at the lateral point). Applying the advanced procedure for this vehicle will reduce the noise levels but still exceed or barely met the limits (−1.1 EPNdB at the flyover point and +0.7 EPNdB at the lateral point). As already mentioned, exceeding the limits at the individual measurement points is no longer permitted, which is why certification according to the proposals of the NPRM or any other than ICAO Noise Chapter 3 would not be possible for the aircraft TWO.
Overall, noise level reductions along an advanced procedure can be confirmed for the aircraft TWO vehicle but are of reduced effectiveness compared to an over-wing aircraft as documented by NASA and the comparative study with the novel simulation process already shown for the 55t STCA. Compared to the 55t STCA, the limits are exceeded not only at the lateral point but also at the flyover measurement point, which results from similar EPNL and the reduced number of engines. An aircraft, like the aircraft TWO, with two engines requires more thrust for a similar take-off mass, which leads to higher nozzle exit velocities and thus more jet noise.
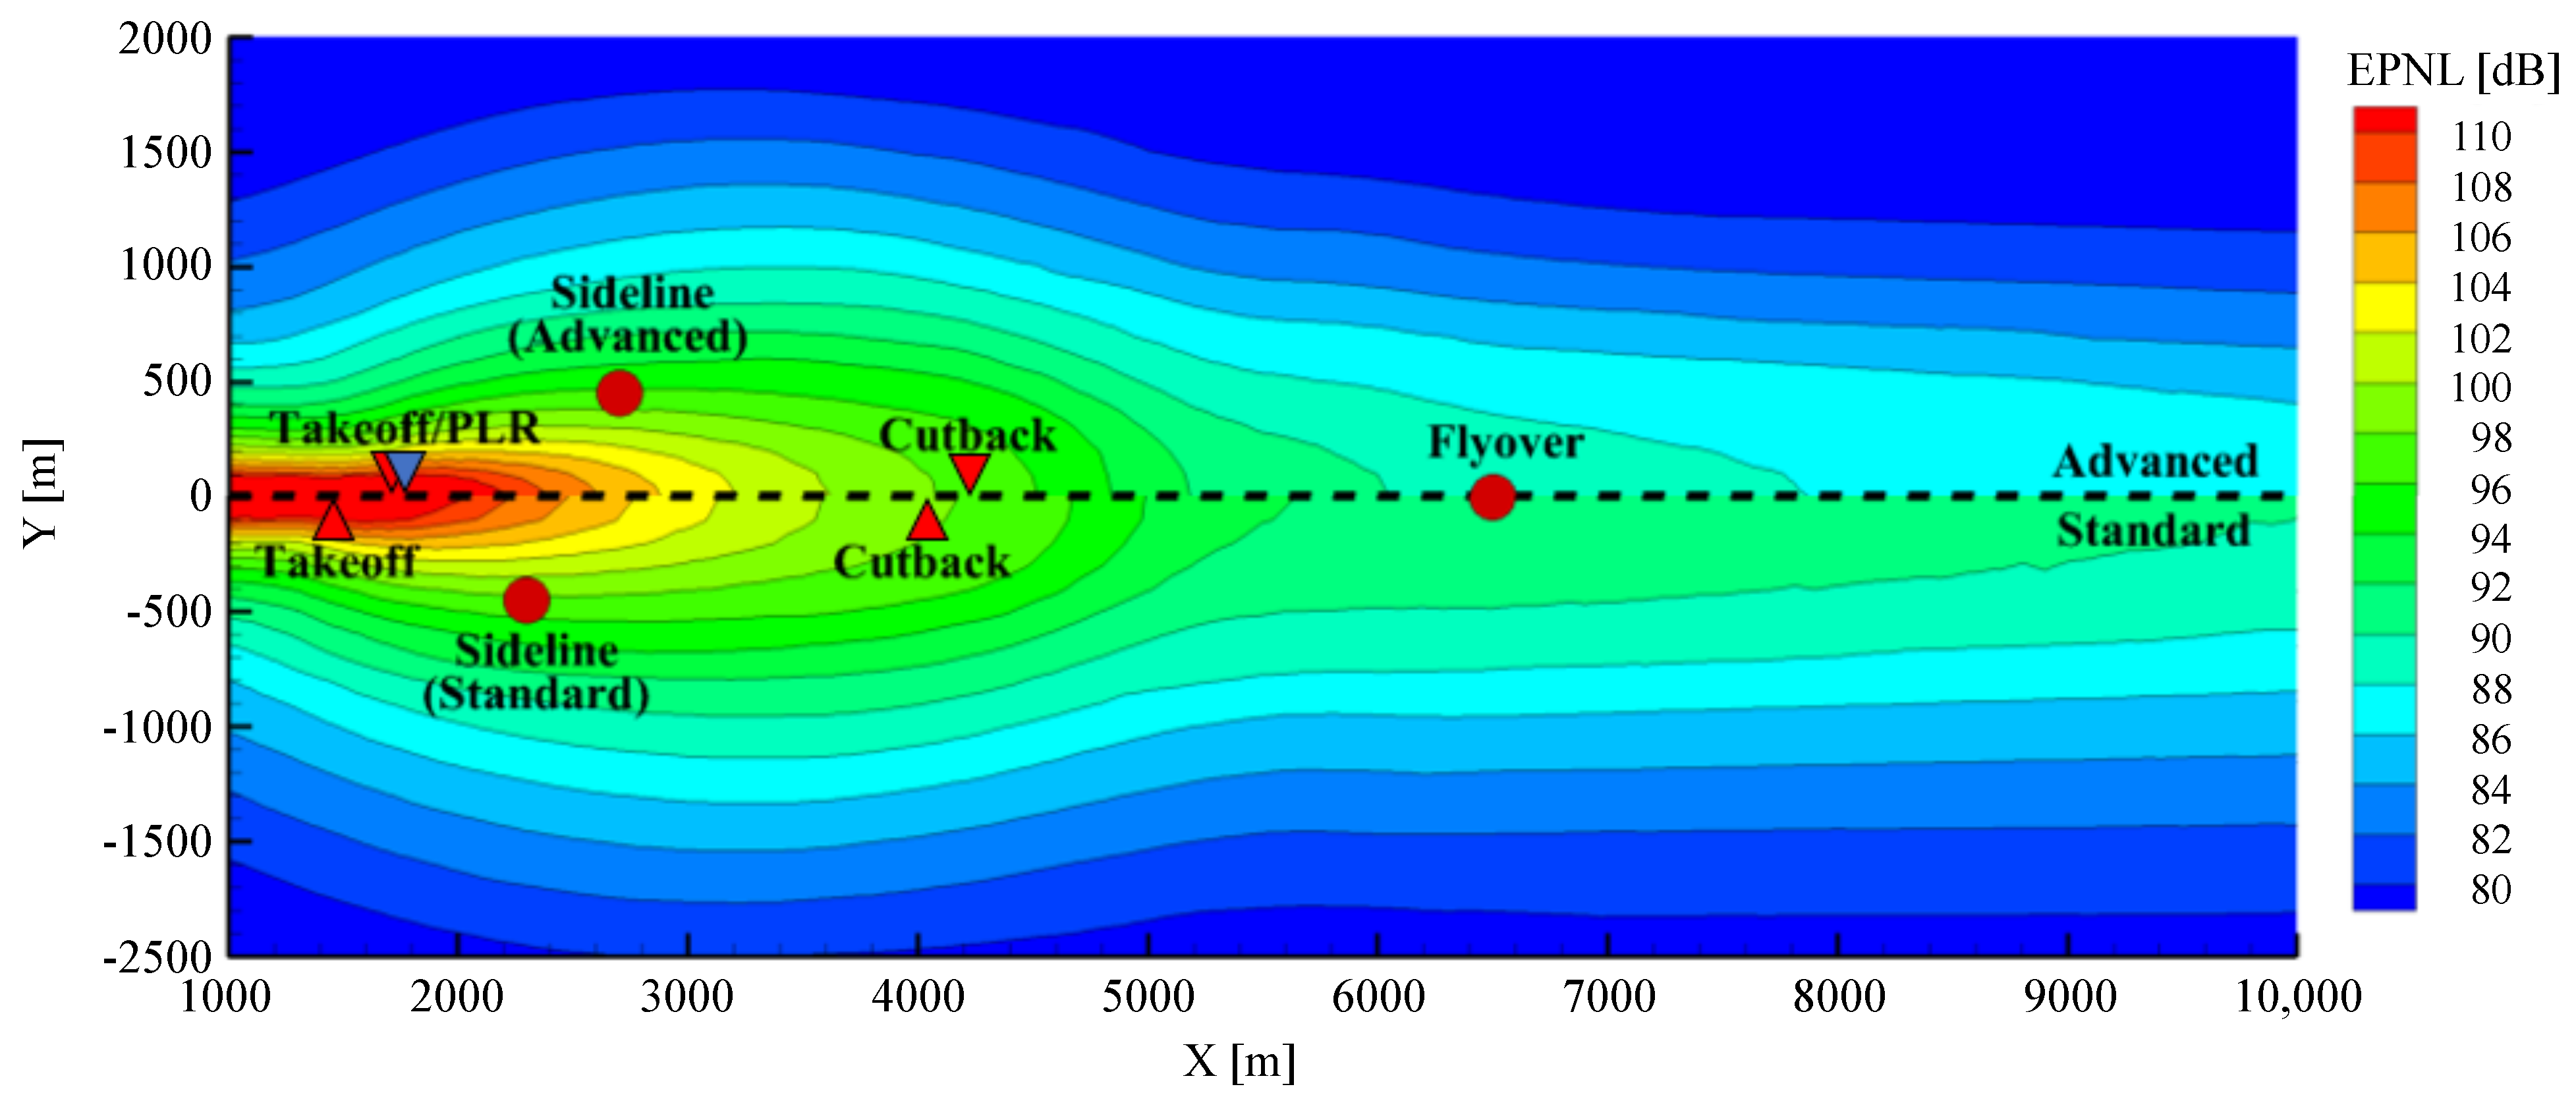
For a better comparability of the two procedures, the predicted EPNL contours for both departure procedures are depicted, see Figure 9. The upper half of the plot shows the EPNL for the advanced take-off procedure and the lower half the EPNL for the standard take-off procedure. The longer acceleration on the ground extends the area with increased EPNL along the advanced procedure, as the aircraft stays longer on the ground. This is confirmed by a different lateral measurement position along the two procedures. After the pilot initiated cutback, the contour areas strongly decrease and become narrower for the advanced procedure compared to the results of the standard procedure. In summary, the advanced procedure reduces the EPNL countour areas of the aircraft TWO with the exception of the area shortly after take-off. Nevertheless, for the two certification measurement points lateral and flyover, smaller EPNLs result for the advanced procedure are observed.

6. Conclusions and Future Work

First results to estimate the landing and take-off noise of future SST aircraft are presented. Upgrades to an existing simulation process for the simulation of noise certification in aircraft preliminary design as well as interfaces to high fidelity simulation tools are presented.
Recalculations of the NASA studies on their 55t STCA configuration based on NASA trajectories were performed to verify the simulation process. Similar simulation methods have been applied compared to the NASA work. A satisfying agreement was observed between the PNLT and EPNL results, with an additional quantification of the effect of engine noise shielding for this vehicle. Detailed comparison of individual noise sources with NASA’s results are yet still pending and are planned for the near future.
An application with complete simulation of noise certification is presented for a supersonic configuration developed at the Technical University of Braunschweig with two engines mounted under the wing which is referred to as aircraft TWO. The application includes the determination of optimal trajectories based on the noise certification regulations for the take-off procedure. The regulations of the certification process are established and the certification noise is predicted. NASA concepts for noise reduction via PLR and high speed climbout are confirmed. Overall, noise level reductions along an advanced procedure versus a standard procedure are predicted for the aircraft TWO in a lesser extend of what is known for the NASA 55t STCA. Inherent differences among under-wing and over-wing engine installation are demonstrated and disadvantages are experienced if engine noise is not shielded by the airframe. This can be attributed to a more dominant fan noise for any non-shielded engine concept if compared to a shielded variant. In addition along an advanced departure procedure, fan noise is generally reduced to a lesser extend compared to the jet noise. In conclusion, the proposed advanced departure procedure is more advantageous if jet noise is clearly dominating fan noise, i.e., the over-wing engine installation case. Current industry developments feature under-the-wing engine concepts and based on the presented findings of this study, a successful noise certification according to the proposed FAA regulations will be even more challenging. Novel technologies to reduce individual noise sources in addition to advantageous flight procedures become essential for these concepts.
In conclusion, the feasibility of the novel DLR simulation process and the applicability of the process toward SST vehicle assessments is confirmed. Results are promising and future updates will contribute to a better assessment of future SST air transportation. Yet, it should be noted that the simulation core process is based on semi-empirical methods and not validated against any experimental data for such SST vehicles. Validation of semi-empirical results with high-fidelity simulation is still ongoing but initial results look very promising.
Next to the planned NASA benchmark activities, future work will focus on a 3-engine configuration, referred to as THREE. For this vehicle, the third engine is integrated into the rear fuselage (tailplane). This aircraft is very similar in geometry compared with the two-engined aircraft studied here. In the upcoming study, certification regulations for different numbers of engines will be studied. In addition high fidelity simulations are currently carried out, which will be used to verify the results of the low to mid-fidelity simulations. The results will be processed directly for an overall assessment of the aircraft TWO and aircraft THREE. These simulations include CFD simulations of the aerodynamic performance with the DLR TAU Code [41] and CAA simulations of the engine noise shielding with DLR FMP [42] for characteristic operation conditions. Due to the relevance of fan noise for under-the-wing configurations, which is demonstrated in this work, the shielding of fan and jet noise sources has to be taken into account within these high-fidelity evaluations. At this point, especially the fan models currently used in PANAM and other similar noise prediction tools show a large uncertainty in predicting the noise of such fan architectures for SST aircraft. Therefore a further development of the fan noise prediction is pending and needed to improve predictive capabilities and noise assessment.

Author Contributions

Conceptualization, M.N., L.B. and M.S.; methodology, M.N., M.S., L.B., M.P.; software, M.N., L.B., M.P., M.K., R.J.; validation, M.N., L.B. and M.S.; formal analysis, M.N., M.S., L.B., M.P. and M.K.; investigation, M.N., M.S., L.B., M.P. and M.K.; resources, M.N., M.S., M.P., M.K. and J.J.B.; data curation, M.N., L.B.; writing—original draft preparation, M.N., M.S., L.B., M.P.; writing—review and editing, M.N., M.S., L.B., M.P., R.J., J.J.B.; visualization, M.N. and M.S.; supervision, M.N. and L.B.; project administration, L.B.; funding acquisition, L.B. All authors have read and agreed to the published version of the manuscript.

Funding

Internal funding supported the DLR work activities. Other contributors have not received any funding.

Acknowledgments

Members of the ELTON_SST Project, namely Jan Delfs, Lars Enghardt, Roland Ewert, Jochen Kirz, and Markus Lummer, provided a lot of helpful comments and discussions to different subdivisions of this work. Special thanks to NASA for providing the trajectories and an extensive technical exchange.

Conflicts of Interest

The authors declare no conflict of interest.

Abbreviations

The following abbreviations are used in this manuscript:
ATTCSAutomatic Take-off Thrust Control System
CFDComputational Fluid Dynamics
DLRDeutsches Zentrum für Luft- und Raumfahrt e.V.
ELTON_SSTEstimation of Landing and Take-off Noise for Supersonic Transport Aircraft
FAAFederal Aviation Administration
FLIPNAFlightpath for Noise Analysis
GTlabGas Turbine Laboratory
ICAOInternational Civil Aviation Organization
JAXAJapan Aerospace Exploration Agency
LTOLanding and Take-off
NASANational Aeronautics and Space Administration
PAAPropulsion Airframe Aeroacoustic integration or interaction effects
PLRProgammed Lapse Rate
PrADOPreliminary Aircraft Design and Optimization Program
PANAMParametric Aircraft Noise Analysis Module
SENECA(LTO) noiSe and EmissioNs of supErsoniC Aircraft
SSBJSupersonic Business Jet
SSTSupersonic Transport
STCASupersonic Technology Concept Aeroplane
TAUDLR CFD software package
TsAGICentral Aerohydrodynamic Institute of Russia
QueSST           Quiet SuperSonic Technology
VNRSVariable Noise Reduction System
Variables/metricsunit
A W Wing area, m 2
EPNLEffective perceived noise level, dB
L A e q Time-weighted, equivalent continuous sound pressure level, dB
l A C Aircraft length, m
LAMAXMaximum noise level from a single noise event
Ma C Cruise Mach number, -
M M T O M Maximum take-off mass, -
NFresnel zone number, -
n E Number of engines, -
n P A X Number of passengers, -
PNLTTone corrected perceived noise level, dB
PNLTMMaximum of tone corrected perceived noise level, dB
R D Range at design point, NM
sWing span, m
SELSound exposure level, dB (also referred to as L p , A E or L A X )
SPLSound pressure level, dB (also referred to as L or L p )
SPL(A)A-weighted SPL, dB (also referred to as L A or L p , A )
tTime, s
TASTrue Air Speed, m/s
V f u e l , m a x Maximum Fuel Tank Volume, m 3
V R e f Reference Speed, m/s
V 2 Take-off safety speed, m/s
δ Difference in shortest source-edge-receiver distance, m
Δ Difference in sound pressure level, dB
Φ Azimuthal/lateral directivity, +90° equals to starboard
Θ Polar/longitudinal directivity, 0° equals flight direction
Plot legend
airfsum of t.e., l.e. and gear
engsum of combustion, fan and jet
comcombustion noise (all engines)
fansum of inlet and exhaust fan noise (all engines)
fan bbfan: only broadband noise (all engines)
fan tfan: only tonal noise (all engines)
jetsum of jet noise (all engines)

Appendix A

Table A1. Aircraft TWO: geometrical data from Ref. [14].
ParameterValueUnit
Aircraft length36.80m
Wing area150.0m 2
Wing span18.50m
Leading edge sweep angles72.5, 52.0deg
Dihedral angles0deg
Number of engines2
Max. fuel volume44.7m 3
Table A2. Extract of the requirements from Ref. [14].
ParameterValueUnitRemarks
Number of Passengers (design point)8--
Passenger mass (incl. luggage)91kg-
Maximum Payload1728kg-
Range at design point4000 (7408)nm (km)-
Cruise Mach number1.6--
V A T , speed at threshold<140kts
Max. allowed runway length2200mserve smaller airports.
Max. cruise altitudeFL600-avoid interference with normal air traffic.
Same as for Concorde.
ETOPS180minallow to serve North and Latin America
Table A3. TWO: PrADO results, Design Point Ma = 1.4 from Ref. [14].
ParameterValueUnitRemark
m M T O M 55,412kgMax. take-off mass
m O E W 24,313kgOperational empty mass (weight)
m f u e l , m a x 28,015kgMax. fuel mass
W S , m a x 348.84 kg m 2 Max. wing loading
S 0 291.72kNTotal static thrust
A L T b e g i n , c r u i s e , D 14.341kmAltitude at the begin of cruise at the design point
A L T e n d , c r u i s e , D 17.860kmAltitude at the end of cruise at the design point
L / D b e g i n , c r u i s e , D 6.30mLift-to-drag ratio at the begin of cruise at the design point
V A T 237, (128) km h , ( kts ) Speed at threshold
l R W Y , T 2389mRunway length at take-off
l R W Y , L D 1369mRunway length at landing
Figure A1. Side view of the aircraft TWO.
Aerospace 09 00009 g0a1
Figure A2. Flight altitude (a,b), True Air Speed (c,d) and Thrust (e,f) over X in the form of the distance to the brake release point is plotted for all trajectories considered in the flight path optimization. On the left side are all advanced and on the right side all standard departure procedures. The EPNL optimum, i.e., the trajectory with the lowest EPNL at flyover position is colored in red and trajectories with the same cutback height are assigned to one specific color (grey = lower, blue = middle, and black = higher cutback heights).
Aerospace 09 00009 g0a2

References

  1. FAA. PART 36—Noise Standards: Aircraft Type and Airworthiness Certification, Subpart D—Noise Limits for Supersonic Transport Category Airplanes. Standard. 2020. Available online: https://www.law.cornell.edu/cfr/text/14/36.301 (accessed on 21 December 2020).
  2. Japan Airlines (JAL). Japan Airlines Press Release. December 2017. Available online: https://press.jal.co.jp/en/2017/12/index_2.html (accessed on 21 December 2020).
  3. Boom Technology, Inc. Available online: https://boomsupersonic.com/united (accessed on 17 August 2021).
  4. Department of Transportation and Federal Aviation Administration. Noise Certification of Supersonic Airplanes. Technical Report. Federal Register, Notice of proposed rulemaking (NPRM). 2021; Volume 85, No. 71; pp. 20431–20447. Available online: https://www.govinfo.gov/content/pkg/FR-2020-04-13/pdf/2020-07039.pdf (accessed on 20 March 2021).
  5. Grantham, W.D.; Smith, P.M. Development of SCR Aircraft Takeoff and Landing Procedures for Community Noise Abatment and their Impact on Flight Safety. Supersonic Cruise Res. 1980, 1979, 299–333. [Google Scholar]
  6. NASA. NASA Tests 30-Mile-Long Microphone Array in Preparation for Quiet Supersonic X-59. 2019. Available online: https://www.nasa.gov/centers/armstrong/features/NASA-Tests-Microphone-Array-for-X-59.html (accessed on 21 December 2020).
  7. NASA. Low-Boom Flight Demonstration. 2020. Available online: https://www.nasa.gov/mission_pages/lowboom/overview (accessed on 21 December 2020).
  8. Berton, J.J.; Jones, S.M.; Seidel, J.A.; Huff, D.L. Advanced Noise Abatement Procedures for a Supersonic Business Jet. In Proceedings of the 23rd International Symposium on Air Breathing Engines (ISABE): Economy, Efficiency and Environment, Manchester UK, 3–8 September 2017. ISABE-2017-22538. [Google Scholar]
  9. Berton, J.J.; Huff, D.L.; Geiselhart, K.; Seidel, J. Supersonic Technology Concept Aeroplanes for Environmental Studies. In Proceedings of the AIAA Scitech 2020 Forum, Orlando, FL, USA, 6–10 January 2020; p. 263. [Google Scholar]
  10. Rizzi, S.A.; Berton, J.J.; Tuttle, B.C. Auralization of a Supersonic Business Jet Using Advanced Takeoff Procedures. In Proceedings of the AIAA Scitech 2020 Forum, Orlando, FL, USA, 6–10 January 2020; p. 266. [Google Scholar]
  11. Akatsuka, J.; Ishii, T. System Noise Assessment of NASA Supersonic Technology Concept Aeroplane Using JAXA’s Noise Prediction Tool. In Proceedings of the AIAA Scitech 2020 Forum, Orlando, FL, USA, 6–10 January 2020; p. 265. [Google Scholar]
  12. Sergey Chernyshev (TsAGI). Supersonic Transport: From the Tu-144 to the New Generation. October 2019. Available online: https://ftfsweden.se/wp-content/uploads/2019/10/FT2019-Plenary_TsAGI-Sergey-Chernyshev.pdf (accessed on 7 October 2021).
  13. Stephen Trimble. Russia Working on Quiet Supersonic Business Jet. 2012. Available online: flightglobal.com (accessed on 14 March 2012).
  14. Schuermann, M. Supersonic Business Jets in Preliminary Aircraft Design. Ph.D. Thesis, TU-Braunschweig, Niedersächsisches Forschungszentrum für Luftfahrt (NFL), Braunschweig, Germany, 2016. [Google Scholar]
  15. Nöding, M.; Bertsch, L. Application of noise certification regulations within conceptual design. Aerospace 2021, 8, 210. [Google Scholar] [CrossRef]
  16. Heinze, W. Beitrag Zur Quantitativen Analyse Der Technischen Und Wirtschaftlichen Auslegungsgrenzen Verschiedener Flugzeugkonzepte für Den Transport Grosser Nutzlasten; Technical Report ZLR-Forschungsbericht; Inst. für Flugzeugbau und Leichtbau, Technische Universität Braunschweig: Braunschweig, Deutschland, 1994; ISBN 3-928628-14-3. [Google Scholar]
  17. Schuermann, M.; Horst, P.; Gaffuri, M. Extensions to aircraft pre-design for supersonic aircraft. In Proceedings of the 52nd Aerospace Sciences Meeting, National Harbor, MD, USA, 13–17 January 2014; p. 0184. [Google Scholar]
  18. Reitenbach, S.; Vieweg, M.; Becker, R.; Hollmann, C.; Wolters, F.; Schmeink, J.; Otten, T.; Siggel, M. Collaborative Aircraft Engine Preliminary Design Using a Virtual Engine Platform, Part A: Architecture and Methodology. In Proceedings of the AIAA Scitech 2020 Forum, Orlando, FL, USA, 6–10 January 2020; p. 0867. [Google Scholar]
  19. Blinstrub, J. Immission-Based Noise Reduction within Conceptual Aircraft Design; Technical Report DLR-FB-2019-12, DLR; Deutsches Zentrum für Luft- und Raumfahrt (DLR): Göttingen, Germany, 2019. [Google Scholar] [CrossRef]
  20. Maekawa, Z. Noise reduction by screens. Appl. Acoust. 1968, 1, 157–173. [Google Scholar] [CrossRef]
  21. Fleischer, F. Zur Anwendung von Schallschirmen. Laermbekaempfung 1970, 6, 131–136. [Google Scholar]
  22. Bertsch, L. Noise Prediction within Conceptual Aircraft Design; Technical Report DLR-FB-2013-20, DLR; Deutsches Zentrum für Luft- und Raumfahrt (DLR): Göttingen, Germany, 2013. [Google Scholar] [CrossRef]
  23. Bertsch, L.; Sanders, L.; Thomas, R.H.; LeGriffon, I.; June, J.C.; Clark, I.A.; Lorteau, M. Comparative Assessment of Aircraft System Noise Simulation. AIAA J. Aircr. 2021, 58, 4. [Google Scholar] [CrossRef]
  24. Stone, J.; Krejsa, E.; Clark, B.; Berton, J. Jet Noise Modeling for Suppressed and Unsuppressed Aircraft in Simulated Flight; Technical Report NASA/TM—2009-215524; NASA, Glenn Research Center: Cleveland, OH, USA, 2009. [Google Scholar]
  25. Kazin, S.; Matta, R.; Bilwakesh, K.; Emmerling, J.; Latham, D. Core Engine Noise Control Program. Volume III. Prediction Methods; Technical Report; General Electric CO Cincinnati OH Aircraft Engine Business Group: Cincinnati, OH, USA, 1974. [Google Scholar]
  26. Dobrzynski, W.; Chow, L.; Guion, P.; Shiells, D. A European Study on Landing Gear Airframe Noise Sources. In Proceedings of the 6th AIAA/CEAS Aeroacoustics Conference, Lahaina, HI, USA, 12–14 June 2000. [Google Scholar] [CrossRef]
  27. Dobrzynski, W.; Pott-Pollenske, M. Slat Noise Source Studies for Farfield Noise Prediction. In Proceedings of the 7th AIAA/CEAS Aeroacoustics Conference, Maastricht, The Netherlands, 28–30 May 2001. [Google Scholar] [CrossRef]
  28. Pott-Pollenske, M.; Dobrzynski, W.; Buchholz, H.; Gehlhar, B.; Walle, F. Validation of Semiempirical Airframe Noise prediction Method through Dedicated A319 Flyover Noise Measurements. In Proceedings of the 8th AIAA/CEAS Aeroacoustics Conference, Breckenridge, CO, USA, 17–19 June 2002. [Google Scholar] [CrossRef]
  29. Rossignol, K.S. Development of an empirical prediction model for flap side-edge noise. In Proceedings of the 16th AIAA/CEAS Aeroacoustics Conference, Stockholm, Sweden, 7–9 June 2010. [Google Scholar] [CrossRef]
  30. Rossignol, K.S. Empirical Prediction of Airfoil Tip Noise. In Proceedings of the 17th AIAA/CEAS Aeroacoustics Conference, Portland, OR, USA, 5–8 June 2011. [Google Scholar] [CrossRef] [Green Version]
  31. Heidmann, M. Interim Prediction Method for Fan and Compressor Source Noise; Technical Report NASA TMX-71763; NASA: Washington, DC, USA, 1979. [Google Scholar]
  32. Lummer, M. Maggi-Rubinowicz Diffraction Correction for Ray-Tracing Calculations of Engine Noise Shielding. In Proceedings of the 14th AIAA/CEAS Aeroacoustics Conference, Vancouver, BC, Canada, 5–7 May 2008. [Google Scholar] [CrossRef]
  33. International Organization for Standardization (ISO). Acoustics—Attenuation of Sound during Propagation Outdoors. Part 1: Calculation of the Absorption of Sound by the Atmosphere; Technical Report ISO 9613-1:1993; ISO: Geneva, Switzerland, 1993. [Google Scholar]
  34. Society of Automotive Engineers (SAE). Prediction Method for Lateral Attenuation of Airplane Noise during Takeoff and Landing; Technical Report Aerospace Information Report, AIR 1751; SAE: Warrendale, PA, USA, 1981. [Google Scholar]
  35. Moreau, A. A Unified Analytical Approach for the Acoustic Conceptual Design of Fans of Modern Aero-Engines. Ph.D. Thesis, TU-Berlin, Berlin, Germany, 2017. [Google Scholar]
  36. Airplanes, B.C. High-Speed Civil Transport Study; NASA CR-4233; NASA: Seattle, WA, USA, 1989. [Google Scholar]
  37. International Civil Aviation Organization (ICAO). Environmental Protection. Annex 16 to the Convention on International Civil Aviation. Vol. I, Aircraft Noise, 5th ed.; Technical Report Annex 16; ICAO: Montreal, QC, Canada, 2008; Volume I. [Google Scholar]
  38. Kontos, K.; Janardan, B.; Gliebe, P. Improved NASA-ANOPP Noise Prediction Computer Code for Advanced Subsonic Propulsion Systems; Technical Report NASA-CR-195480; NASA: Washington, DC, USA, 1996. [Google Scholar]
  39. Bertsch, L.; Wolters, F.; Heinze, W.; Pott-Pollenske, M.; Blinstrub, J. System noise assessment of a tube-and-wing aircraft with geared turbofan engines. J. Aircr. 2019, 56, 1577–1596. [Google Scholar] [CrossRef]
  40. Greco, G.F.; Bertsch, L.; Ring, T.P.; Langer, S.C. Sound quality assessment of a medium-range aircraft with enhanced fan-noise shielding design. CEAS Aeronaut. J. 2021, 12, 481–493. [Google Scholar] [CrossRef]
  41. Schwamborn, D.; Gerhold, T.; Kessler, R. DLR-TAU Code—An Overview. In Proceedings of the 1st ONERA/DLR Aerospace Symposium, Paris, France, 21–24 June 1974. [Google Scholar]
  42. Lummer, M. Calculation of Acoustic Shielding at Full-Scale Aircraft Configurations. In Proceedings of the 16th CEAS-ASC Workshop, 2nd Scientific Workshop of X-Noise, Braunschweig, Germany, 11–12 October 2012. [Google Scholar]
Figure 1. Noise limits on individual reference noise measurement points as proposed by FAA as a function of number of engines and maximum take-off mass (M). Table from the descriptions in Ref. [4].
Aerospace 09 00009 g001
Figure 2. Process chain with simulation core for assessment of noise certification of supersonic aircraft (low to mid fidelity) and interfaces to complementary simulations (high fidelity). Extension of the illustration from Ref. [15].
Aerospace 09 00009 g002
Figure 3. Representation of NASA 55t STCA as input for the noise shielding prediction.
Aerospace 09 00009 g003
Figure 4. PNLT time history: NASA 55t STCA. Flyover measurement point for standard (a), advanced procedure (b) and lateral measurement point for standard (c) and advanced procedures (d). PANAM simulation results with engine noise shielding by using Maekawa (dotted black line), and by assuming no engine noise shielding (solid black line) as well as NASA data (solid red line) are shown.
Aerospace 09 00009 g004
Figure 5. EPNL at flyover measurement point over relative engine speed N1 after pilot-initiated cutback of flightpath variation for advanced (top) and standard departure procedure (bottom) in the allowed range of certification regulations in terms of cutback height (CBH) (≥300 m) and climb rate (≥4%) for the aircraft TWO.
Aerospace 09 00009 g005
Figure 6. Take-off (left) and approach (right) flightpaths (altitude (a,b), calibrated airspeed (c,d) and total thrust (e,f)) as result of optimization for standard and advanced procedure. Flyover, lateral and approach measurement points as well as operation condition above measurement points and relevant part of flightparameters for EPNL calculation (10-dB-Downtime) are marked. The x position is specified relative to the brake-release point for take-off and relative to the runway threshold for approach.
Aerospace 09 00009 g006
Figure 7. Calculated PNLT over time at flyover measurement point for standard (a) and advanced take-off (b) and at lateral measurement point standard (c) and advanced take-off (d). 10 dB-down time is filled grey and PNLTM is marked. 10 dB-down time represents the relevant time of the PNLT course for the calculation of the EPNL.
Aerospace 09 00009 g007
Figure 8. Calculated PNLT of the aircraft TWO over time for approach reference noise measurement point. 10 dB-down time is filled grey and PNLTM is marked. 10 dB-down time represents the relevant time of the PNLT course for the calculation of the EPNL.
Aerospace 09 00009 g008
Figure 9. Comparison of EPNL contours for advanced (top) and standard procedure (bottom) of the aircraft TWO. Point of take-off, PLR and Cutback (triangles) as well as lateral and flyover reference noise measurement point (red dots) are marked with symbols. The x position is specified relative to the brake-release point.
Aerospace 09 00009 g009
Table 1. PANAM system noise assessment: source models selected for this study.
Noise Source/ElementModel
airframe noise models (airf)
trailing edgeDLR [22,26,27,28,29,30]
leading edgeDLR [22,26,27,28]
main landing gearDLR [22,26,27,28]
nose landing gearDLR [22,26,27,28]
engine noise models (eng)
fan broadband & tonalmodified Heidmann [31]
jetStone 2 [24]
combustionEmmerling [25]
noise shielding effects (PAA)
-SHADOW [32]
sound propagation effects
-ISO 9613 [33]
ground attenuation effects
-SAE AIR 1751 [34]
Table 2. Engine performance summary compared to data published by NASA [9].
ParameterUnitCruise Design PointEnd of FieldStatic Take-Off
NASADLRNASADLRNASADLR
Altitudem15,24015,2400.00.00.00.0
Mach-1.41.40.250.250.00.0
Δ T I S A K0015151515
Net thrustN14,812.614,812.662,897.962,897.973,929.473,929.4
SFCg/kN/s26.7126.7416.6617.4213.5714.37
BPR-2.902.902.902.983.002.96
T4K1833.31833.31750.01789.71738.91781.0
TETK1766.71766.71688.91728.21677.81719.8
T3K805.6805.5800.0813.0794.4807.4
Overall Pressure Ratio-22.0022.0021.0022.2021.0022.50
Fan Pressure Ratio-2.002.001.901.971.901.99
Compressor Pressure Ratio-11.2011.3611.1011.3811.2011.44
Extraction Ratio-1.100.941.100.941.100.94
Nozzle Pressure Ratio-5.906.091.902.011.801.94
Table 3. Simulated certification levels at individual measurement points (flyover, lateral and approach) and cumulative level for NASA 55t STCA. Limits of individual measurement points and cumulative from ICAO Annex 16 and FAA NPRM for Noise Certification of Supersonic Airplanes.
ProcedureFacilityShieldingFlyoverLateralApproachCumulative
StandardDLRMaekawa89.495.498.8285.5
AdvancedDLRMaekawa87.892.198.8280.6
StandardDLRno Shielding90.597.1102.4290.0
AdvancedDLRno Shielding90.093.7102.4286.1
StandardNASAMaekawa88.695.096.4280.0
AdvancedNASAMaekawa87.093.096.4276.4
Noise regulations * FlyoverLateralApproachCumulative
Limit (Chapter 3) 92.895.799.5288.0
Limit (Chapter 4) 92.895.799.5278.0
Limit (Chapter 14) 91.894.798.5271.0
Limit (FAA NPRM) 92.895.799.5274.5
* Caution: additional rules are applicable according to the ICAO Noise Chapters/NPRM, e.g., no trading Refs. [1,37].
Table 4. Simulated certification levels at individual measurement points (flyover, lateral and approach) and cumulative level for aircraft TWO. Limits of individual measurement points and cumulative from ICAO Annex 16 and FAA NPRM for Noise Certification of Supersonic Airplanes.
ProcedureFacilityShieldingFlyoverLateralApproachCumulative
StandardDLRno Shielding91.697.494.3283.3
AdvancedDLRno Shielding88.796.494.3279.4
Noise Regulations * FlyoverLateralApproachCumulative
Limit (Chapter 3) 89.895.799.5285.0
Limit (Chapter 4) 89.895.799.5275.0
Limit (Chapter 14) 88.894.798.5268.0
Limit (FAA NPRM) 89.895.799.5271.5
* Caution: additional rules are applicable according to the ICAO Noise Chapters/NPRM, e.g., no trading Refs. [1,37]
Publisher’s Note: MDPI stays neutral with regard to jurisdictional claims in published maps and institutional affiliations.

