Article

Jet Impingement Heat Transfer Characteristics with Variable Extended Jet Holes under Strong Crossflow Conditions

Shanxi Engineering Laboratory of Turbomachinery and Power Equipment, Institute of Turbomachinery, Xi’an Jiaotong University, Xi’an 710049, China
*
Author to whom correspondence should be addressed.
Aerospace 2022, 9(1), 44; https://doi.org/10.3390/aerospace9010044
Submission received: 8 December 2021 / Revised: 7 January 2022 / Accepted: 12 January 2022 / Published: 15 January 2022
(This article belongs to the Special Issue Cooling/Heat transfer (Volume II))

Abstract

:
In this paper, detailed flow patterns and heat transfer characteristics of a jet impingement system with extended jet holes are experimentally and numerically studied. The jet holes in the jet plate present an inline array of 16 × 5 rows in the streamwise (i.e., the crossflow direction) and spanwise directions, where the streamwise and spanwise distances between adjacent holes, which are normalized by the jet hole diameter (xn/d and yn/d), are 8 and 5, respectively. The jets impinge onto a smooth target plate with a normalized distance (zn/d) of 3.5 apart from the jet plate. The jet holes are extended by inserting stainless tubes throughout the jet holes and the extended lengths are varied in a range of 1.0d–2.5d, depending on the jet position in the streamwise direction. The experimental data is obtained by using the transient thermochromic liquid crystal (TLC) technique for wide operating jet Reynolds numbers of (1.0 × 10⁴)–(3.0 × 10⁴). The numerical simulations are well-validated using the experimental data and provide further insight into the flow physics within the jet impingement system. Comparisons with a traditional baseline jet impingement scheme show that the extended jet holes generate much higher local heat transfer levels and provide more uniform heat transfer distributions over the target plate, resulting in the highest improvement of approximately 36% in the Nusselt number. Although the extended jet hole configuration requires a higher pumping power to drive the flow through the impingement system, the gain of heat transfer prevails over the penalty of flow losses. At the same pumping power consumption, the extended jet hole design also has more than 10% higher heat transfer than the baseline scheme.

1. Introduction

Jet impingement cooling is an effective internally enhanced heat transfer technique, which is widely employed at the backsides of a combustor liner and in leading-edge, mid-chord, and endwall regions of turbine vanes and blades in gas turbine engines to thermally protect the hardware from the erosion of hot gases. Typically, the jet holes are seen to be an array of multiple holes in industrial applications. In this case, the jet flows are highly sensitive to the accumulated crossflow that is induced by the upstream post-impingement air (also called spent air) in a confined impingement channel. Strong crossflow deflects and mixes with the subsequential impingement jets, and reduces the jet impingement strength, resulting in lower heat transfer levels on the target surfaces, relative to straight impingement jets. Stronger crossflow improves convection heat transfer levels over the target surface, simultaneously, but heat transfer levels enhanced by the jet impingement outperform those by the crossflow convection. Therefore, the presence of the crossflow generally deteriorates the heat transfer of jet impingement cooling, and at this point, strategies that reduce or inhibit the crossflow should be adopted to generate a more effective impingement configuration with lower coolant consumption, which is also the focus of the majority of past studies in this field.
Over the past decades, many aspects of jet impingement cooling have been investigated. Detailed reviews on the jet impingement heat transfer were typically conducted by Weigand and Spring [1] and Ekkad and Singh [2], showing that the geometrical configurations, including the jet diameter (d) [3], hole spacing (xn and yn) [4], hole arrangement (inline or staggered) [5], and jet-to-target distance (zn) [6], as well as the jet Reynolds number (Rej) [7], are important affecting factors, in addition to the previously mentioned jet-induced crossflow. Typically, as the crossflow results from the multiple jets in a confined impingement channel, the strength of the crossflow (generally normalized as a cross-to-jet flow ratio, Gc/Gj) is intimately linked with the impingement configurations and exit open areas of the crossflow. The study of Liucià et al. [8] showed that the crossflow was increased with the hole number, leading to a rapid drop of heat transfer in the further downstream regions of the target surface, but a slight impact in upstream regions. Liucià et al. [8] also considered the effects of the jet-to-target distance. Although increasing the impingement channel spacing decreased the impact of the crossflow, a significant heat transfer degradation was observed due to the loss of jet momentum at a larger zn. In this case, there was an optimal value of zn that balanced the loss of jet momentum and the crossflow effects to yield the highest thermal performance. Different exit schemes of the crossflow were documented by Azad et al. [9], and they found that the co- and counter-flowing crossflow provided the best heat transfer performance on both smooth and roughed surfaces because higher discharge openings reduced the crossflow strength. Xing and Weigand [10] conducted a similar work in which minimum, medium, and maximum cases were investigated on flat and dimpled target surfaces. In addition to the spent air flow exit schemes, Lee et al. [11] experimentally examined the effects of zn, xn, yn, and Rej on the crossflow patterns. The crossflow was strongly associated with the layout of the impingement configuration but was scarcely affected by the Rej. Despite this, it was found that the crossflow could augment local heat transfer for cases with a lower Rej value at denser hole spacing and jet distance, indicating that the crossflow effects on heat transfer had close relationships with the Rej, though the Rej, per se, had slight impacts on the crossflow strength.
To reduce the adverse effects of the crossflow, multiple novel methods have been adopted to alter the way the jets impinge onto the target. In addition to the typical normal jet impingement, inclined jets [12,13,14,15] are also seen in impingement cooling applications, which are generally arranged to be co-jet with the crossflow. Measurements by EI-Gabry and Kaminski [14] and Li et al. [15] proved that inclined jets brought about comparative overall heat transfer performance, but it was noted that thermal gradients over the target were reduced due to more uniform heat transfer distributions for the inclined jets. Gao and Ekkad [16] presented a detailed heat transfer distribution for a linearly stretched impingement jet array, in which the spacing between adjacent holes in both the streamwise and spanwise directions was increased for further downstream rows to reduce the crossflow effects. As the crossflow was inhibited, somewhat, the existing correlations [17,18] were shown to have significant errors in predicting the heat transfer for the stretched impingement array. To increase the flow area of the crossflow, a corrugated wall design was proposed by Correia [19] to reduce the flow flux of the crossflow. Further studies by Esposito et al. [20] and Chi et al. [21] showed that the corrugated configuration allowed a further increase in the jet rows without obviously reducing the local heat transfer. Moreover, more homogeneous heat transfer patterns and lower pressure drops were observed in the corrugated design. Kim et al. [22] added ribs onto the target wall of the corrugated (also called castellated by Kim et al. [22]) jet arrays, and detailed comparisons between the baseline and the corrugated cases with and without ribs were made. The addition of the ribs extinguished the wall jets but still presented a much more uniform heat transfer distribution than the baseline case. Inspired by the vortex generated by delta-wings, a pair of vortex generators were installed upstream of the jet hole exit by Wang et al. [23], with the purpose of inducing a vortex pair as well as reducing the crossflow effects. Heat transfer enhancement was observed, but the heat transfer improvement was adversely affected by increasing the crossflow [24].
Most recently, multi-stage impingement [25,26] and extended jet impingement cooling [27,28] have drawn attention. Liu and Zhang [25,26] numerically investigated a three-stage impingement cooling design, showing that the crossflow effects could be completely removed, and thus, 50% of the coolant consumption designed for a traditional impingement configuration even achieved an over-cooled target surface, but the pressure drop was significantly increased. To balance the heat transfer improvement and pressure drop, Tepe et al. [27,28] experimentally and numerically examined a novel impingement concept by simply extending the jet holes into the crossflow channel based on the work by Esposito et al. [20,29]. Tepe et al. [27,28] reported that the heat transfer rate on the target surface achieved an increase of up to approximately 32%, with a slight penalty of pressure loss. However, the work by Tepe et al. [27,28] was undertaken with only six rows of jet holes that generated the weak crossflow. Therefore, the interaction of the extended jets with the crossflow was not well revealed by the study of Tepe et al. [27,28].
For the current study, detailed heat transfer characteristics of jet impingement cooling with extended jet holes were measured by using the transient thermochromic liquid crystal (TLC) technique. The special focus of this study was on the thermal performance of the extended jets under a strong crossflow condition. Therefore, the jet impingement was designed to feature sixteen rows of jet holes in the streamwise direction, which was roughly three times as many as those used by Tepe et al. [27,28]; thus, stronger crossflow was produced in the impingement channel, which reproduced an engine-like condition where the interaction of the extended jets with the strong crossflow could be well examined. In particular, the jet holes were linearly extended towards the target along the crossflow direction. Moreover, companion computational fluid dynamics (CFD) simulations were performed as well to obtain further insight into the flow physics behind the jet-with-crossflow interaction. This work is expected to provide added value to the design of improved jet impingement cooling, particularly in a strong crossflow case for real gas turbine internal impingement cooling applications.

2. Experimental Setup

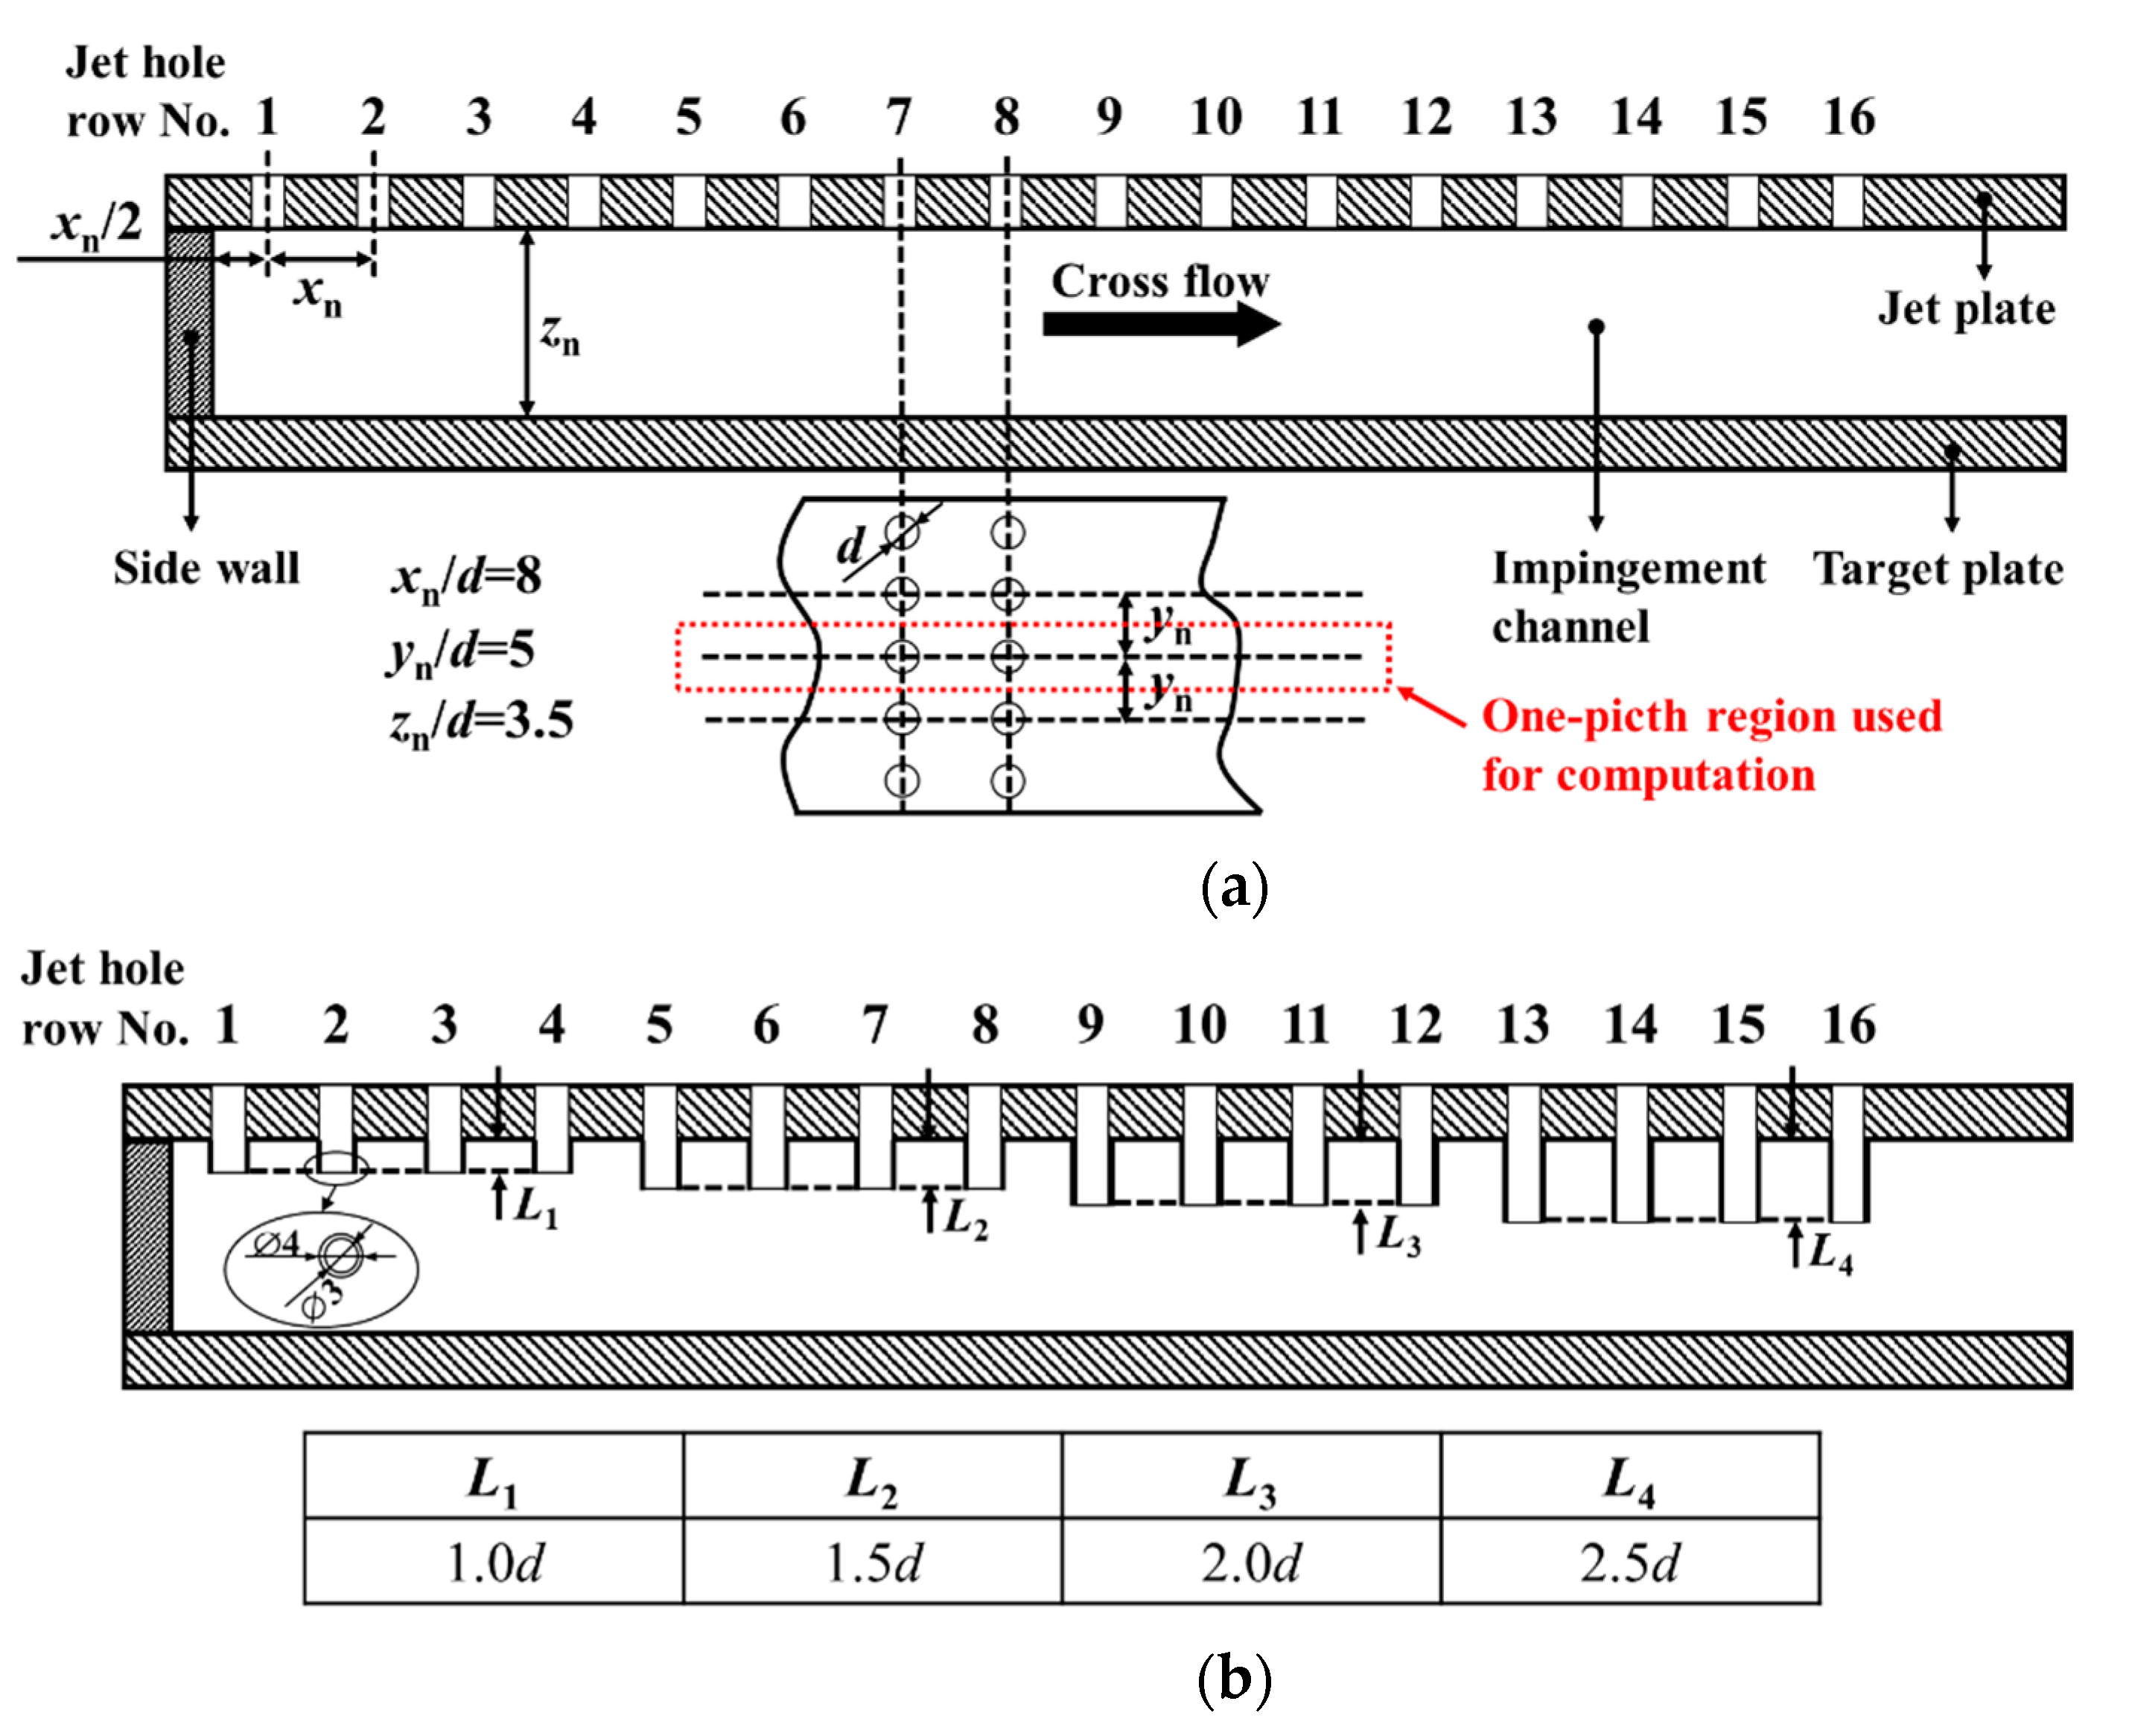
2.1. Design of Impingement Cooling System

The cross-section of an impingement cooling system with extended jet holes is illustrated in Figure 1, in which a baseline configuration is also included for a direct comparison. The impingement cooling configuration consists of three components: jet plate, target plate, and sidewalls, resulting in an impingement channel where the crossflow is accumulated. To achieve a maximum crossflow condition, the impingement channel is open at one side only. The jet plate has a hole array of 16 × 5 jets and the diameter, d, of the jet holes is 3.0 mm. The spacing distances of two adjacent holes in the jet plate are xn/d = 8 and yn/d = 5 in the streamwise (the x-direction) and spanwise (the y-direction) directions, respectively. The side walls are used to separate the jet and target plates, generating a jet distance, z, of 3.5d. For proper measurements of heat transfer on the target surface, the test model is made of highly transparent plexiglass and the target and jet plates have a thickness of 20 mm. The jet holes in Figure 1b feature an extended jet section from the jet plate into the impingement channel, aiming at preventing the jets from being rapidly deflected by the accumulative crossflow. The extension of the jet holes is achieved by inserting stainless steel tubes with a wall thickness of 0.5 mm and an inner diameter of 3.0 mm into jet holes with a diameter of 4.0 mm, allowing the extended jet hole configuration to have the same jet diameter as the baseline case (see Figure 1b). As the strength of the crossflow increases with the increase in jet rows along the streamwise direction (i.e., the crossflow direction), the extension of the jet holes is also varied, depending on the jet position. The jet holes are evenly split into four groups and the extended length of each group is linearly increased. The first hole group is extended at a shorter length of 1.0d, and the most downstream group, which experiences the strongest crossflow, has a longer extended length of 2.5d. Figure 1b shows more details of the variable extended jet hole configuration.

2.2. Test Facility

An experiment setup for measuring flow characteristics through the impingement cooling system and heat transfer on the target surface is shown in Figure 2.
The air was drawn into the test section by a compressor from Atlas Copco. Before entering the test section, the compressed air was heated up to the desired temperature by an electric heater with a power of 54 kW. In order to meet the requirement of a step increase in air temperature for the transient thermochromic liquid crystal (TLC) technique that will be discussed in a later section, the desired mass flow rate and temperature of the air were adjusted in a by-pass line before the experiments, which was similar to the method adopted in Refs. [27,30]. Once the desired mass flow rate and temperature of the air were achieved and remained unchanged, the compressed hot air was suddenly (less than 0.2 s) introduced into the test section by a three-way valve. The mass flow rate of the air was regulated by a flow meter (Azbil LF-I-Y-ZQ, Shanghai, China) to achieve the desired jet Reynolds number, Rej. The temperature of the air before entering the test section was monitored by PT-100 temperature probes, but after flowing into the test section, the temperature was recorded by fast response thermocouples with a head diameter of 0.27 mm (Omega T-type) for the purpose of capturing the sudden change of the air temperature. The thermocouples were placed right upstream of the test model, as illustrated in Figure 2 and Figure 3b.
The test section in Figure 2 consisted of a diffuser, an air supply plenum, and the test impingement model. To achieve a uniform oncoming flow feeding the jet holes in the jet plate, the supply plenum had a length of 1000 mm, and a flow straightener was perpendicularly placed in the middle of the plenum section, relative to the approaching flow. In addition to monitoring the temperature, total pressure within the plenum, along with static pressure at the impingement channel exit, was recorded as well by total pressure probes (see Figure 2 and Figure 3b) and static pressure taps to evaluate flow losses throughout the jet impingement system.

2.3. Measurement Method and Technique

The details of the test model are shown in Figure 3 to elaborate the measurement methods. Figure 3a displays a photograph of the test section and relevant measurement equipment. As stated previously, heat transfer measurements in this study were conducted using the transient TLC technique. Therefore, a thin coating of TLC (SPN100/R40C1W from LCR Hallcrest, Flintshire, UK) was uniformly sprayed onto the internal surface of the target plate where heat transfer coefficients, h, were deduced. After the TLC layer was dry, another layer of black paint was imposed onto the top of the TLC layer, providing good contrast when the color of the TLC was changed during the transient experiments. The details of the multiple layers of the instrumented target surface are shown in the close-up of region A in Figure 3b.
During the experiments, the target surface was illuminated by two cold white light sources. The evolution of the TLC color was recorded using an RGB camera (SONY XCG-5005CR, Shanghai, China) in real time from the outer side of the target plate. Simultaneously, the changes in the hot air temperatures within the plenum were recorded as well. Both the air temperatures and the images were used as input boundary conditions to calculate the values of h over the target surface.
The transient TLC technique is a method based on a one-dimensional, semi-finite conduction model [31]. The target plate made of plexiglass has low values of thermal diffusivity and thermal conductivity, allowing the conduction within the solid target plate to be assumed as one-dimensional conduction. Moreover, the thickness of the target plate was determined to be 20 mm, guaranteeing a proper assumption of a semi-finite solid model by completing the measurements within a short time before the thermal perturbation reached the backside of the target plate. The governing equation for the one-dimensional, semi-finite conduction model and corresponding initial and boundary conditions have already been detailed in Ref. [31] and it is thereby not repeated herein. The analytical solution for the governing equation is given by:
T w T i T T i = 1 exp ( β 2 ) erfc ( β )
where β = h α s t k s and α s = k s ρ s c s . In Equation (1), the initial temperature, Ti, the thermal conductivity, ks, and the thermal diffusivity, αs, of the solid, and the air temperature, T, are known or measured; therefore, the above equation presents a wall temperature, Tw, as a function of time, t. In the experiments, the relationships between the wall temperature of the target surface and the elapsed time were stored in the TLC images; thus, the h values over the target surface were determined.
In a real experiment, a perfect step change of the oncoming air in temperature is not possible. The temperature of the air, T, is time-variant in a transient experiment. In order to take the temperature variation of the air into consideration, Duhamel’s superposition principle was employed, and Equation (1) can be rewritten as:
T w T i = i = 1 n max U ( t t i ) ( T , i T , i - 1 )
where U ( t t i ) = 1 exp [ h 2 k s 2 α s ( t t i ) ] erfc [ h k s α s ( t t i ) ] . More details of this procedure can be found in Refs. [31,32]. The above equation was solved via an error minimization within an in-house MATLAB code to obtain the h distributions on the target surface, which was further non-dimensionalized as the Nusselt number:
N u = h d k
where k is the thermal conductivity of the air.
To quantify flow losses through the jet holes, the discharge coefficient, Cd, is defined as:
C d = m ˙ real m ˙ ideal
where m ˙ real is the real mass flow rate through the holes of the jet plate, which was measured by the flow meter, and m ˙ ideal is the ideal mass flow rate, given by:
m ˙ ideal = π 4 d 2 p t , in ( p ex , s p t , in ) ( κ + 1 ) / 2 κ 2 κ ( κ 1 ) R T t , in [ ( p t , in / p ex , s ) ( κ 1 ) / κ 1 ]
Furthermore, flow losses generated by the entire jet impingement cooling system were evaluated by pumping power [33]:
Q = π d R e j μ N 4 ρ Δ p
where N is the total number of jet holes and Δp is the pressure drop through the jet impingement configuration from the inlet plenum to the exit of the impingement channel.

2.4. Uncertainty Analysis

Uncertainties of measurements in mass flow rate, temperature, and pressure were ±1.0% F.S. (full scale of the flow meter), ±0.5 °C, and ±0.05%, respectively. Regarding the uncertainty of the Nusselt number, another important contributing factor was the resolution of the camera’s recording time (t), which had a maximum error level of 0.067 s. The sequential perturbation method proposed by Moffat [34] was used to calculate the uncertainty of Nu, resulting in a minimum relative uncertainty of 3.97% at Nu = 11.58 and a maximum relative uncertainty of 11.2% at Nu = 173.75. The typical values and measurement errors of the parameters are summarized in Table 1.

2.5. Comparison with Previous Data

Data of Nu for the baseline case were experimentally obtained and compared with the data predicted by the correlation of Florschuetz et al. [35]. Figure 4 and Figure 5 show the heat transfer data that are averaged in a one-row area and over the entire target surface, respectively, for jet Reynolds numbers of (1.0 × 10⁴)–(3.0 × 10⁴). The distributions of the one-row averaged Nu in Figure 4 quantify that regardless of the Rej, the heat transfer levels decay along the crossflow direction, indicating the detrimental effects of the crossflow on the jet flows. This is rightly the reason that the anti-crossflow scheme by extending the jet holes is proposed in this study. The agreement between the experimental data in this work and the correlation of Florschuetz et al. [35] is globally satisfactory. The maximum deviation for the three Rej cases is found near the crossflow exit, where the crossflow is the strongest. It appears that for the current measurements the strong crossflow has a more pronounced effect on the jets near the exit of the impingement channel, resulting in a quicker decay of the jet impingement heat transfer. Overall, the maximum deviation between the experimental data and the predicted results by the correlation is 7.31% for Rej = 2.0 × 10⁴. A further comparison of area-averaged Nu in Figure 5 shows that the prediction by the correlation is somewhat greater than the present data. This trend can also be found in the work of Li et al. [15] and Madhavan et al. [30], which could be attributed to the measurements of low spatial resolution by using thermocouples in Ref. [35].

3. Computational Methodology

3.1. Computation Domain and Boundary Conditions

Corresponding numerical simulations were also undertaken to provide complementary information for the physical mechanisms behind the complex flow in the jet impingement channel where the jets and the crossflow interact with one another. The steady flow and heat transfer were obtained using the ANSYS CFX code in which the Reynolds-averaged Navier–Stokes (RANS) simulations were implemented. Figure 6 shows the computation domain that was modeled completely according to the test model. As symmetrical boundary conditions were applied on the spanwise sides of the domain, only one pitch fluid domain was used. In the setting of the CFX code, a total energy model was selected for the heat transfer option, which included high-speed energy effects and viscous work term in the energy equation. A turbulent Prandtl number of 0.85 was attained. In the solving process, a high-resolution scheme, which is based on the second-order upwind differencing scheme with a blending function to the first-order upwind differencing scheme, was applied to the advection and turbulence terms.
A mass flow boundary condition was specified at the inlet and atmospheric pressure at the outlet of the impingement channel. The total mass flow rate entering the inlet of the domain was determined by the jet Reynolds number and the total number of jet holes. To simulate heat transfer over the target surface, a constant temperature of 300 K was imposed on the target wall and the inlet temperature of the air was set to 270 K. All other walls, including the jet holes, were simulated as adiabatic walls with non-slip boundary conditions. This sort of simulation is extensively practiced in experimental and numerical combined studies, such as Refs. [5,21,27,30].

3.2. Validation of the Computation Setup

The shear stress transport (SST) k-ω turbulence model was selected as the closure equation for the RANS simulations. It has been widely verified that this type of turbulence model has a better performance in predicting such flow problems, e.g., Refs. [5,21,27,36,37]. To further evaluate the prediction accuracy of the SST k-ω turbulence model using the current experiment data, comparisons of heat transfer results obtained from the computation fluid dynamics (CFD) and the experimental measurements are made in Figure 7, showing the local Nu along the centerline and spanwise-averaged Nu distributions as a function of the jet row number. This validation was made for the baseline case at Rej = 1.0 × 10⁴.
The CFD results and the experimental data share a similar trend along the crossflow direction. At the first five rows, the local peak Nu at the stagnation of the jet flows from the CFD is higher than the measurements, but an opposite pattern is observed from the spanwise-averaged data, indicating that the RANS simulation cannot capture the lateral spreading of the jets well after the impingement of the jets onto the target due to its inherent deficit. At the middle jets, both local and spanwise-averaged Nu values are under-predicted by the CFD and over-predicted at the most downstream jets near the channel exit. Globally, the averaged deviation between the CFD and experiment data is 9.48%, showing a satisfactory agreement.
The computation domain was structurally meshed in the ANSYS ICEM. To guarantee the proper usage of the SST k-ω turbulence model, the first grid node was placed at a distance of 0.001 mm apart from all walls and the growth ratio of the grid stretching from the walls was 1.05. Such settings provided a non-dimensional distance, y+, of less than 1.0 and at least 20 layers of nodes within the boundary layer, which properly resolved the wall-nearby flow patterns. Regarding the grid size used for the simulations, three sets of meshes were generated for the baseline case: Grid 1 with 8.1 million, Grid 2 with 12.2 million, and Grid 3 with 18.0 million nodes. The spanwise-averaged Nu values from Grids 1, 2, and 3 for Rej = 1.0 × 10⁴ are varied within 3.3%, as shown in Figure 8. It was thereby determined to use the grid setting with 12.2 million nodes to obtain the CFD results displayed in this study.

4. Results and Discussion

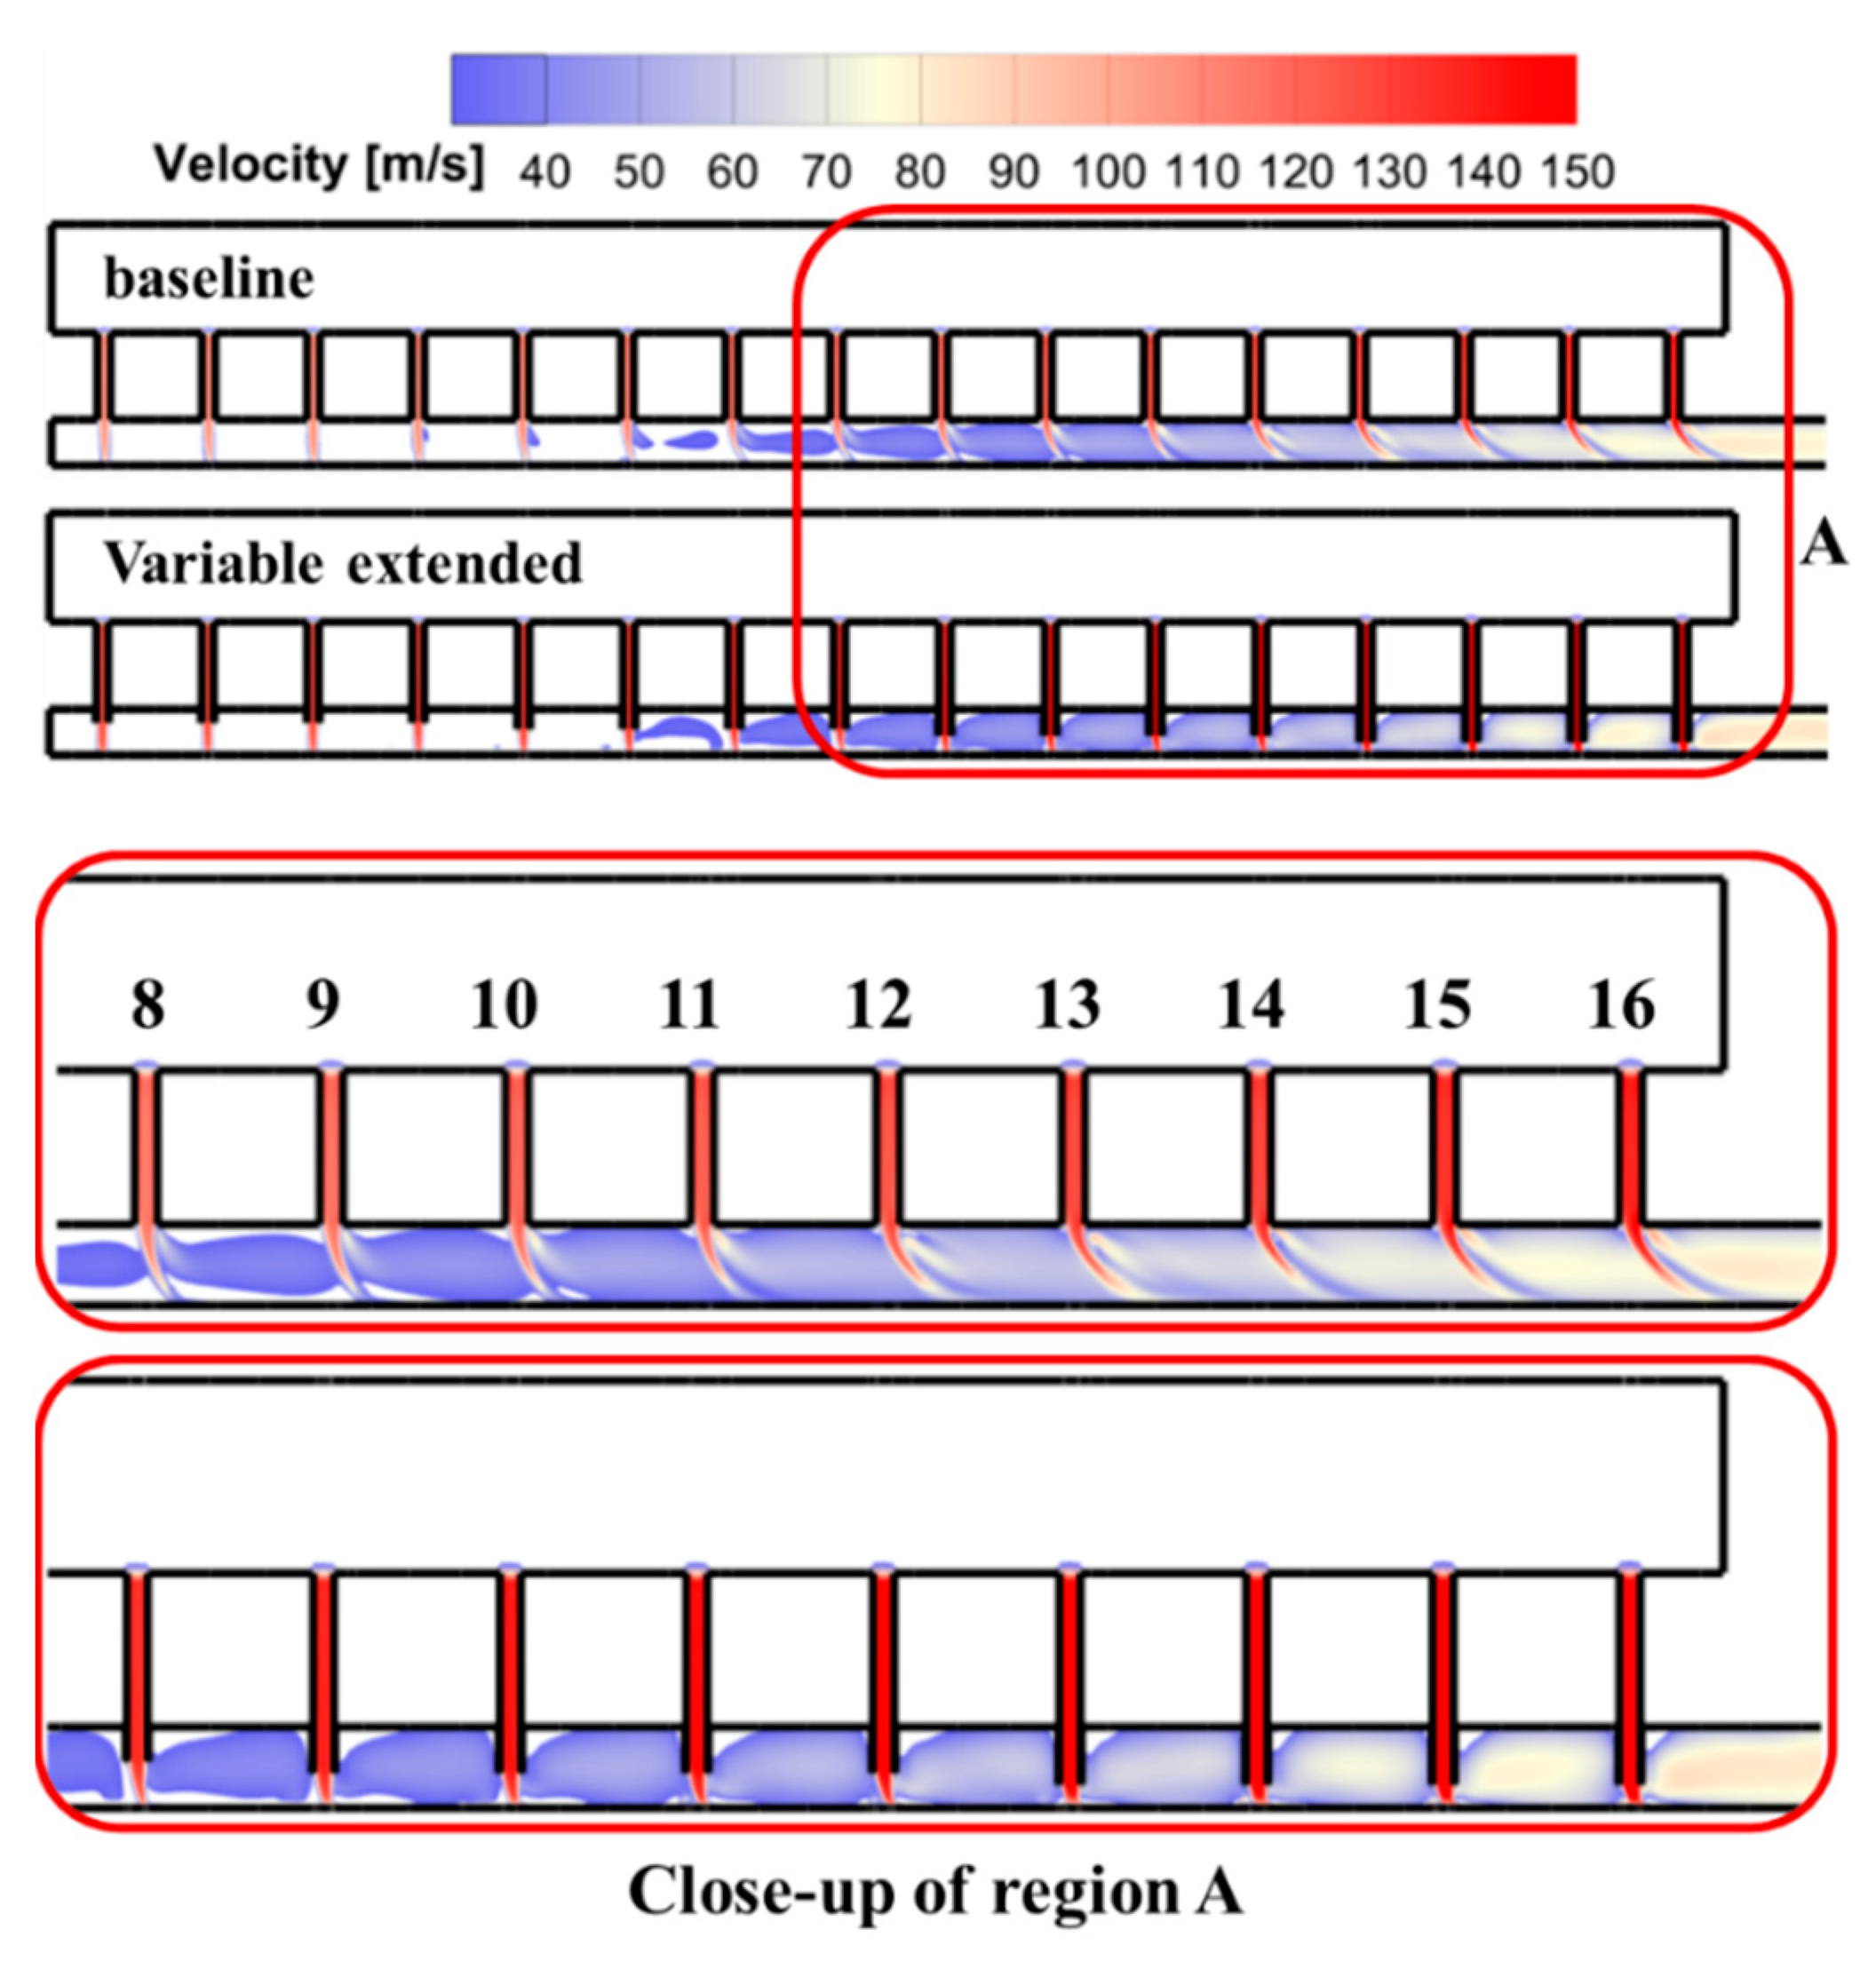
4.1. Flow Characteristics
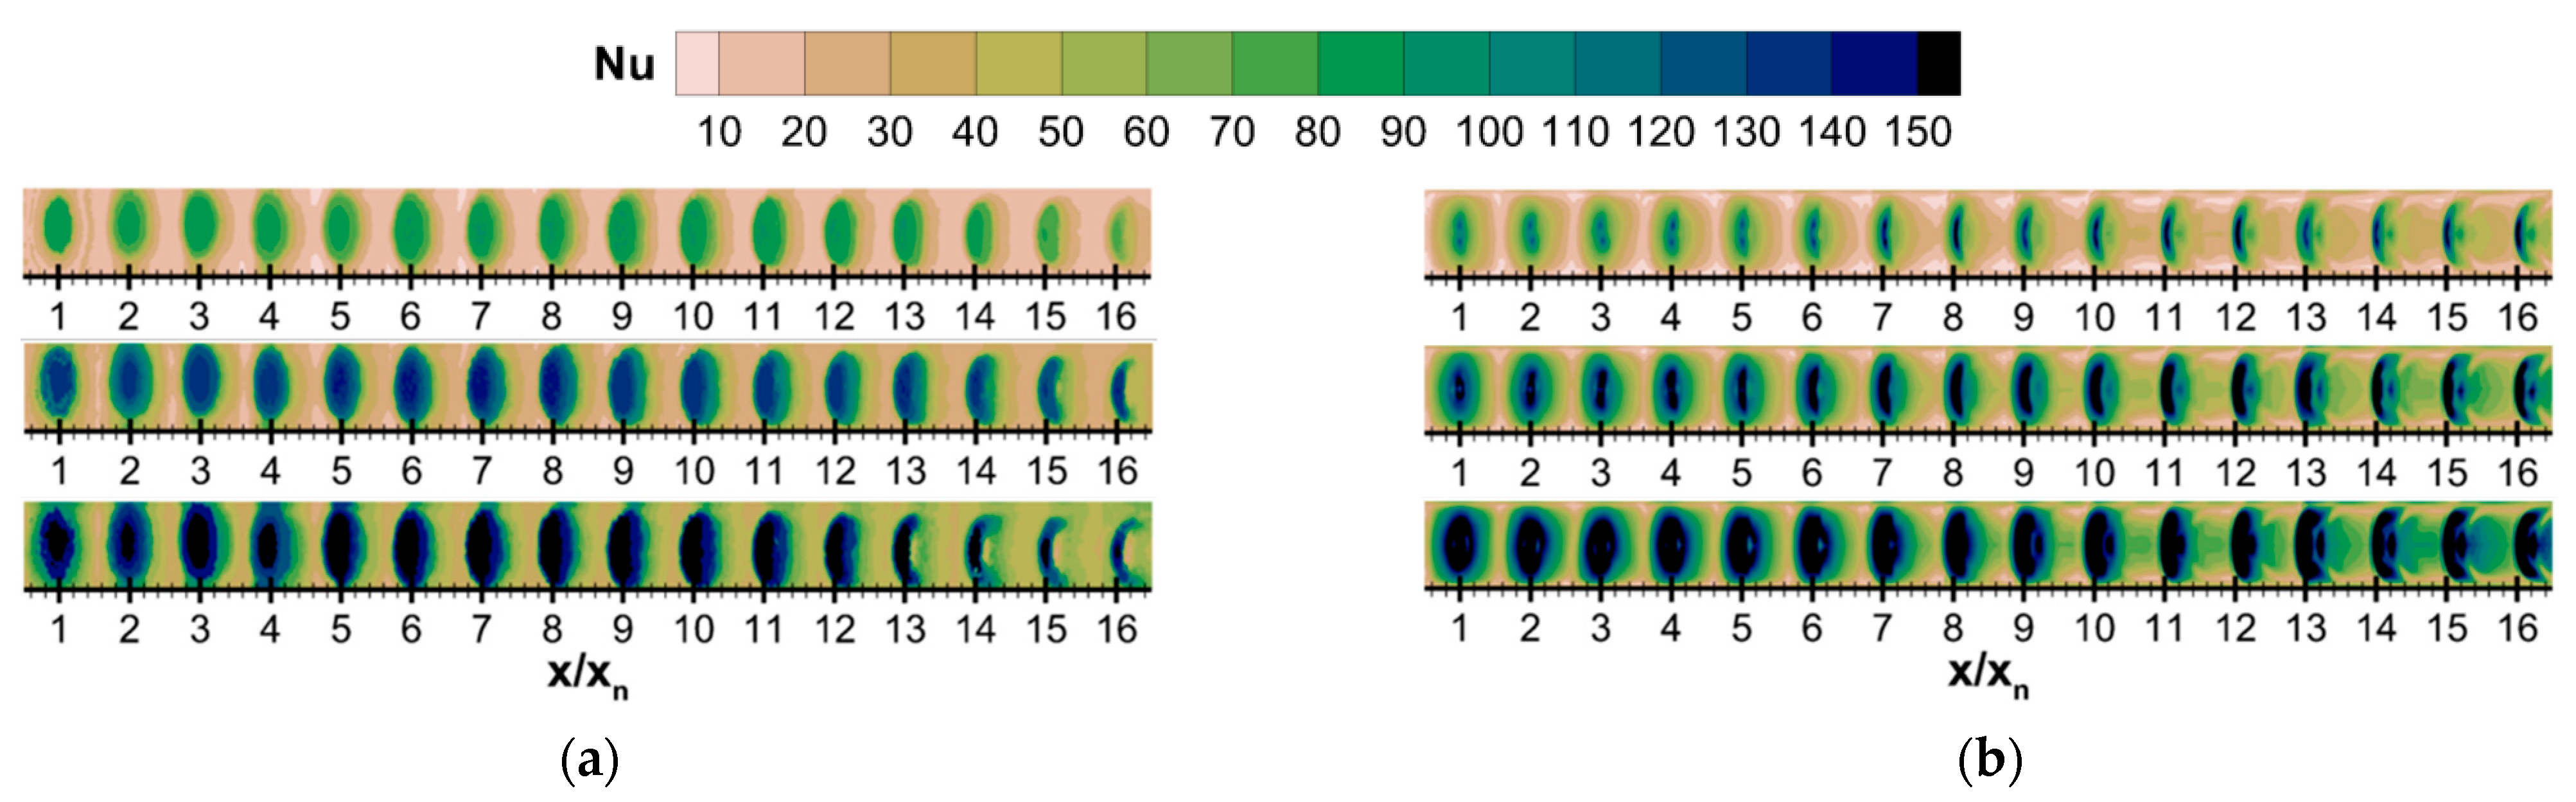
For proper implementation of the correlation of Florschuetz et al. [35] and evaluation of the flow losses through the jet plate, separate experiments were conducted to measure the total pressure in the supply plenum and static pressure at the jet hole exits. Figure 9 shows the discharge coefficient, Cd, as a function of the ratio of inlet total to exit static pressures, Pt,in/Pex,s, for the baseline jet impingement configuration. Please note that the pressure ratios for the jet Reynolds numbers investigated in this study are in the range of 1.04–1.30.
The values of Cd are found to be slightly varied with Pt,in/Pex,s, particularly at higher Pt,in/Pex,s values, and have a typical averaged value of 0.84. The experimental data from Richlick et al. [38] are also plotted for comparison. As the ratio of the jet hole length to diameter in this work is greater, the discharge coefficients are reversely lower than those in Ref. [38], but it is seen that there is only a slight gap.
Although the air is uniformly supplied, mass flow through every single jet hole is varied with the jet position, resulting in different local jet Reynolds numbers. Figure 10 shows the distributions of the local jet Reynolds number, Rej,l, at each jet hole.
As the total pressure in the supply plenum is shared and the pressures at the jet hole exits are gradually decreased from the first jet row to the last row, the levels of Rej,l are gradually increased along the crossflow direction, contrarily. It is also noted that the distribution patterns of Rej,l are rarely linked to the averaged jet Reynolds number. In terms of heat transfer, the distribution pattern of Rej,l is beneficial because the downstream jets need more jet energy to resist the deflection of the increased crossflow.
To characterize the development of the crossflow within the impingement channel, the ratio of crossflow mass flow flux, Gc, to local jet mass flow flux, Gj, is plotted in Figure 11 as a function of the streamwise jet rows.
Comparisons of Gc/Gj for the baseline and the variable extended cases are made, along with the data from Florschuetz et al. [35]. Similarly, the data from the baseline case and Florschuetz et al. [35] agree well with one another. Despite the increase in the local jet mass flow along the streamwise direction, as shown in Figure 10, the accumulation of the crossflow has a much more rapid rise, leading to an increased Gc/Gj distribution. However, the Gc/Gj ratios for the variable extended configuration are obviously lower than those for the traditional baseline case. This is because the accumulation of the crossflow in the impingement channel of the variable extended case is lower due to skewed flows generated by the extended jets. In this case, it is believed that the variable extended jets could yield higher heat transfer levels over the target surface due to the reduced crossflow.
Figure 12 shows the jet velocity contours on the cut plane throughout the centerlines of jet holes for a Rej of 2.0 × 10⁴. In addition to the velocity distribution patterns, the most prominent differences are the jet patterns from the jet holes.
A close observation clearly shows that the jets start to deflect by the crossflow roughly from the eighth row, and the deflection is intensified further downstream. The deflection of the jets not only results in the shift of the jet stagnation toward downstream regions but also generates greater losses of jet momentum. Compared with the baseline case, the jets from the extended jet holes, regardless of the jet position, straightly impinge onto the target surface, indicating that the interaction of the jets with the crossflow is significantly inhibited by the extended jet holes. Furthermore, the extended jet holes reduce the distance from the jet exits to the stagnation, providing more jet momentum to enhance the local heat transfer.
The extension of the jet holes could also require higher pumping power to drive the air with the same mass flow rate throughout the jet impingement cooling system, relative to the baseline configuration, because of the skewed flow induced by the extended jet holes. The pumping power, Q, as calculated by Equation (6), is plotted in Figure 13, showing that a higher mass flow rate needs more pumping power.
For all jet Reynolds numbers, the consumption of pumping power by the variable extended configuration is consistently greater, and the gap between the two configurations is continuously increased with the increase of the jet Reynolds number. In the following section, heat transfer enhancement against the elevated pumping power by the extended jets will be discussed to demonstrate the comprehensive performance of the jet impingement configuration.

4.2. Heat Transfer

Detailed local heat transfer for the baseline and variable extended cases is shown in Figure 14 and Figure 15.
The sub-plots from the top to the bottom correspond to the results from Rej values of 1.0 × 10⁴, 2.0 × 10⁴, and 3.0 × 10⁴, respectively. Nusselt number distributions from both experiments and CFD are presented. For the baseline case, the high heat transfer levels on the target that indicate the locations of the jet stagnations can be identified at the upstream rows. With the accumulation of the crossflow, the positions of the jet stagnations are definitely shifted towards the downstream region. A more interesting finding is that the jet stagnations of the last three rows are not clearly visible. The experimental and CFD results both agree on the above observations. Although the local jet Reynolds number is increased along the crossflow direction (see Figure 10), the strong interaction of the jets with the increasing oncoming crossflow generates reduced heat transfer levels on the target surface.
Concerning the extended jet hole case, the stagnations of all jets are clearly identified, and most importantly, it seems that the positions of the jet stagnations are slightly affected by the crossflow, even at the downstream rows. These findings can be explained from the distributions of Gc/Gj in Figure 11 and the jet velocity contours in Figure 12. Additionally, for the same jet Reynolds number, the extended jet hole scheme has higher local Nu levels almost everywhere. This is not only because of the reduced interaction with the crossflow but also due to the reduced jet distance to the target (see Figure 12).
The spanwise-averaged Nu data obtained from the experiments is plotted in Figure 16 for quantitative comparisons of the two jet impingement schemes.
The centerline of the jet hole is indicated by the vertical arrow along the x-axis. From the plots in Figure 16, the shift in the jet stagnation that corresponds to the peak Nu value is clearly seen. For the baseline scheme, the shift of the peak Nu is found from the third row. With the increase in the crossflow strength along the crossflow direction, the shift is also elevated away from the centerline of that jet hole, and simultaneously, the local Nu is reduced as well. Especially, in the last three to five rows, the local Nu is significantly decreased. This tendency is applied to all three jet Reynolds number cases. In the extended jet impingement cooling system, the peak Nu at all jet centerlines is seen and their shifts are found to be very slight, regardless of the position of the jet rows. Most importantly, the distributions of the peak Nu are homogenous, indicating that the crossflow has limited effects on the impingement jets. It can thereby be concluded from Figure 14, Figure 15 and Figure 16 that the added value of the extended jet holes lies in not only generating significantly improved heat transfer levels but also providing much more uniform heat transfer distributions over the target surface.
Comparisons of the overall heat transfer performance between the baseline and extended jet hole configurations are made in Figure 17, in which the data are obtained by area-averaging Nu over the entire target surface from the experimental results in Figure 14 and Figure 15.
The improvement presented in Figure 17 is the heat transfer enhancement by extending the jet holes relative to the baseline configuration. For the investigated jet Reynolds number range in this study, the highest improvement of 35.54% is found at the moderate jet Reynolds number and the lowest improvement of 25.55% occurs at the low jet Reynolds number, but it is noted that the gap of the Nuavg between the two configurations is continuously increased.
Although the heat transfer improvement of approximately 25%–35% is found for the extended jet holes, this benefit is achieved at the expense of additional pumping power. Therefore, the area-averaged Nu is plotted against the required pumping power in Figure 18.
Included also are the data from the work of Madhavan et al. [30], in which flow diverters were employed in the upstream of jets to prevent the detrimental effects of crossflow, and the jet Reynolds number was operated in a range of 0.35 × 10⁴–1.20 × 10⁴. It is clear that the gain in heat transfer overwhelms the penalty of flow losses induced by the extended jet holes. At a Reynolds number of around 1.0 × 10⁴, the diverter scheme generates a comparative heat transfer level with the extended jet hole scheme, but much more pumping power is required for the diverter case. At the same pumping power consumption of 40 W, the diverters in Ref. [30] produce a 10% higher Nu value, and the extended jet holes in this work yield an 18% higher Nu value.

5. Conclusions

An experimental and numerical combined study of flow and heat transfer characteristics within an extended jet impingement configuration was conducted in this paper, aiming at improving the jet impingement heat transfer performance under strong crossflow conditions. The jets were prevented from being deflected by extending the jet holes into the impingement channel, and the extended length was varied depending on the strength of the crossflow at that jet position. The experimental measurements were performed by using the transient liquid crystal (TLC) technique for a range of jet Reynolds numbers from 1.0 × 10⁴ to 3.0 × 10⁴, and corresponding numerical simulations were undertaken to provide complementary information of flow physics. A traditional baseline jet impingement scheme that shared the same jet hole patterns was investigated as well for comparisons.
Both experimental measurements and numerical simulations demonstrated that the extended jet hole scheme effectively restrained the adverse effects of the crossflow on impingement jets, resulting in significantly improved local heat transfer levels and simultaneously generating an increased uniformity of heat transfer distributions over the target surface. The reasons that contribute to this effect were at least twofold. On the one hand, interactions of the jets with the crossflow were obviously inhibited due to the reduced crossflow strength and the protection by the extended jet holes; on the other hand, the jet distance to the jet stagnation was reduced as well for the extended jet holes, providing more jet momentum to enhance local heat transfer. At the same pumping power, the extended jet hole configuration could generate more than 10% higher heat transfer compared with the traditional baseline configuration.
Since the extended jet hole impingement has been experimentally and numerically verified to have intensified the heat transfer levels as well as more uniform heat transfer distributions, this sort of extended jet hole design deserves more attention in future real applications because the advances in additive manufacturing could make it possible. The present work did not consider the variation in jet geometries and surface conditions of the target wall. It is therefore recommended to further conduct a comprehensive, parametric study; thus, a well-developed correlation will provide valuable guidance for the design of such a configuration in real engines.

Author Contributions

Conceptualization, X.Y.; methodology, X.Y. and H.W.; software, X.Y. and H.W.; validation, X.Y., and H.W.; formal analysis, X.Y.; investigation, X.Y. and H.W.; resources, Z.F.; data curation, X.Y. and H.W.; writing—original draft preparation, X.Y.; writing—review and editing, Z.F.; visualization, X.Y.; supervision, Z.F.; project administration, Z.F.; funding acquisition, X.Y. All authors have read and agreed to the published version of the manuscript.

Funding

This research was funded by the financial support from the Fundamental Research Funds for the Central Universities of China grant number xjh012019020. The APC was exempted by the publisher MDPI.

Institutional Review Board Statement

Not applicable.

Informed Consent Statement

Not applicable.

Data Availability Statement

Not applicable.

Conflicts of Interest

The authors declare no conflict of interest.

Nomenclature

CdDischarge coefficient
csSpecific heat capacity of solid
dDiameter of jet hole
GcMass flow flux of crossflow
GjMass flow flux of jets
hHeat transfer coefficient
kThermal conductivity
LExtended length of jet holes
m ˙ Mass flow rate
NTotal number of jet hole
nmaxMaximum step of temperature change
NuNusselt number
pPressure
QPumping power
RGas constant
RejAveraged jet Reynolds number
Rej,lLocal jet Reynolds number
TTemperature
tTime
xnStreamwise jet-to-jet distance
ynSpanwise jet-to-jet distance
znJet-to-target distance
x, y, zThe Cartesian coordinate
Greeks
αThermal diffusivity
κSpecific heat ratio
μViscosity
ρDensity
Subscripts
avgArea-averaged
exOutlet
iInitial value, index
idealIdeal value
inInlet
realReal value
sSolid, static
tTotal
wWall
Air
Overbars
Spanwise-averaged
=Row-averaged

References

  1. Weigand, B.; Spring, S. Multiple Jet Impingement—A Review. Heat Transf. Res. 2011, 42, 101–142. [Google Scholar] [CrossRef]
  2. Ekkad, S.V.; Singh, P. A Modern Review on Jet Impingement Heat Transfer Methods. J. Heat Transf. 2021, 143, 064001. [Google Scholar] [CrossRef]
  3. Florschuetz, L.W.; Metzger, D.E.; Takeuchi, D.; Berry, R. Multiple Jet Impingement Heat Transfer Characteristic—Experimental Investigation of in-Line and Staggered Arrays with Crossflow; NASA-CR-3217; NASA: Washington, DC, USA, 1980. [Google Scholar]
  4. Cocchi, L.; Facchini, B.; Giuntini, S.; Winchler, L.; Tarchi, L.; Innocenti, L.; Andrei, L.; Bonini, A. Experimental Investigation on Impingement Array Cooling Systems through IR Thermography, Proceedings of the ASME Turbo Expo 2016: Turbomachinery Technical Conference and Exposition, Volume 5B: Heat Transfer, Seoul, Korea, 13–17 June 2016; ASME Paper No. GT2016-57436; ASME: New York, NY, USA, 2016. [Google Scholar] [CrossRef]
  5. Xing, Y.; Spring, S.; Weigand, B. Experimental and Numerical Investigation of Heat Transfer Characteristics of Inline and Staggered Arrays of Impinging Jets. J. Heat Transf. 2010, 132, 092201. [Google Scholar] [CrossRef]
  6. Cho, H.H.; Rhee, D.H.; Goldstein, R.J. Effects of Hole Arrangements on Local Heat/Mass Transfer for Impingement/Effusion Cooling With Small Hole Spacing. J. Turbomach. 2008, 130, 041003. [Google Scholar] [CrossRef]
  7. Lee, J.; Ren, Z.; Haegele, J.; Potts, G.; Jin, J.S.; Ligrani, P.; Fox, M.D.; Moon, H.-K. Effects of Jet-To-Target Plate Distance and Reynolds Number on Jet Array Impingement Heat Transfer. J. Turbomach. 2013, 136, 051013. [Google Scholar] [CrossRef]
  8. Llucià, S.; Terzis, A.; Ott, P.; Cochet, M. Heat transfer characteristics of high crossflow impingement channels: Effect of number of holes. Proc. Inst. Mech. Eng. Part A J. Power Energy 2015, 229, 560–568. [Google Scholar] [CrossRef]
  9. Azad, G.S.; Huang, Y.; Han, J.-C. Impingement Heat Transfer on Dimpled Surfaces Using a Transient Liquid Crystal Technique. J. Thermophys. Heat Transf. 2000, 14, 186–193. [Google Scholar] [CrossRef]
  10. Xing, Y.; Weigand, B. Experimental investigation of impingement heat transfer on a flat and dimpled plate with different crossflow schemes. Int. J. Heat Mass Transf. 2010, 53, 3874–3886. [Google Scholar] [CrossRef]
  11. Lee, J.; Ren, Z.; Ligrani, P.; Fox, M.D.; Moon, H.K. Crossflows from jet array impingement cooling: Effects of hole array spacing, jet-to-target plate distance, and Reynolds number. Int. J. Therm. Sci. 2015, 88, 7–18. [Google Scholar] [CrossRef]
  12. Schulz, S.; Schueren, S.; von Wolfersdorf, J. A particle image velocimetry-based investigation of the flow field in an oblique jet impingement configuration. J. Turbomach. 2014, 136, 051009. [Google Scholar] [CrossRef]
  13. Schueren, S.; Hoefler, F.; Von Wolfersdorf, J.; Naik, S. Heat Transfer in an Oblique Jet Impingement Configuration With Varying Jet Geometries. J. Turbomach. 2013, 135, 021010. [Google Scholar] [CrossRef]
  14. El-Gabry, L.A.; Kaminski, D.A. Experimental Investigation of Local Heat Transfer Distribution on Smooth and Roughened Surfaces Under an Array of Angled Impinging Jets. J. Turbomach. 2005, 127, 532–544. [Google Scholar] [CrossRef]
  15. Li, W.; Xu, M.; Ren, J.; Jiang, H. Experimental Investigation of Local and Average Heat Transfer Coefficients Under an Inline Impinging Jet Array, Including Jets With Low Impingement Distance and Inclined Angle. J. Heat Transf. 2017, 139, 012201. [Google Scholar] [CrossRef]
  16. Gao, L.; Ekkad, S.V.; Bunker, R.S. Impingement Heat Transfer Part I: Linearly Stretched Arrays of Holes. J. Thermophys. Heat Transf. 2005, 19, 57–65. [Google Scholar] [CrossRef]
  17. Florschuetz, L.W.; Metzger, D.E.; Su, C.C. Heat transfer characteristics for jet array impingement with initial crossflow. ASME J. Heat Transf. 1984, 106, 34–41. [Google Scholar] [CrossRef]
  18. Kercher, D.M.; Tabakoff, W. Heat Transfer by a Square Array of Round Air Jets Impinging Perpendicular to a Flat Surface Including the Effect of Spent Air. J. Eng. Power 1970, 92, 73–82. [Google Scholar] [CrossRef]
  19. Correia, V.H.S. Impingement Cooling Apparatus for Turbine Shrouds Having Ducts of Increasing Cross-Sectional Area in the Direction of Post-Impingement Cooling Flow. U.S. Patent 5,480,281, 2 January 1996. [Google Scholar]
  20. Esposito, E.I.; Ekkad, S.V.; Kim, Y.; Dutta, P. Novel Jet Impingement Cooling Geometry for Combustor Liner Backside Cooling. J. Therm. Sci. Eng. Appl. 2009, 1, 021001. [Google Scholar] [CrossRef]
  21. Chi, Z.; Kan, R.; Ren, J.; Jiang, H. Experimental and numerical study of the anti-crossflows impingement cooling structure. Int. J. Heat Mass Transf. 2013, 64, 567–580. [Google Scholar] [CrossRef]
  22. Kim, T.; Jung, E.Y.; Bang, M.; Lee, C.; Moon, H.K.; Cho, H.H. Heat Transfer Measurements for Array Jet Impingement With Castellated Wall. J. Turbomach. 2022, 144, 031009. [Google Scholar] [CrossRef]
  23. Wang, C.; Wang, L.; Sundén, B. A novel control of jet impingement heat transfer in cross-flow by a vortex generator pair. Int. J. Heat Mass Transf. 2015, 88, 82–90. [Google Scholar] [CrossRef]
  24. Wang, C.; Luo, L.; Wang, L.; Sundén, B. Effects of vortex generators on the jet impingement heat transfer at different cross-flow Reynolds numbers. Int. J. Heat Mass Transf. 2016, 96, 278–286. [Google Scholar] [CrossRef]
  25. Liu, K.; Zhang, Q. A Novel Multi-Stage Impingement Cooling Scheme—Part I: Concept Study. J. Turbomach. 2020, 142, 121008. [Google Scholar] [CrossRef]
  26. Liu, K.; Zhang, Q. A novel multi-stage impingement cooling scheme—Part ii: Design optimization. J. Turbomach. 2020, 142, 121009. [Google Scholar] [CrossRef]
  27. Tepe, A.Ü.; Yetişken, Y.; Uysal, Ü.; Arslan, K. Experimental and numerical investigation of jet impingement cooling using extended jet holes. Int. J. Heat Mass Transf. 2020, 158, 119945. [Google Scholar] [CrossRef]
  28. Tepe, A.Ü.; Arslan, K.; Yetisken, Y.; Uysal, U. Effects of Extended Jet Holes to Heat Transfer and Flow Characteristics of the Jet Impingement Cooling. J. Heat Transf. 2019, 141, 082202. [Google Scholar] [CrossRef]
  29. Esposito, E.I.; Ekkad, S.V.; Kim, Y.; Dutta, P. Comparing Extended Port and Corrugated Wall Jet Impingement Geometry for Combustor Liner Backside Cooling, Proceedings of the ASME Turbo Expo 2007: Power for Land, Sea, and Air, Volume 4: Turbo Expo 2007, Parts A and B, Montreal, Canada, 14–17 May 2007; ASME Paper No. GT2007-27390; ASME: New York, NY, USA, 2007. [Google Scholar] [CrossRef]
  30. Madhavan, S.; Ramakrishnan, K.R.; Singh, P.; Ekkad, S.V. Jet Impingement Heat Transfer Enhancement by U-Shaped Crossflow Diverters. J. Therm. Sci. Eng. Appl. 2020, 12, 041005. [Google Scholar] [CrossRef]
  31. Han, J.-C.; Wright, L.M. Experimental Methods in Heat Transfer and Fluid Mechanics; CRC Press: Boca Raton, FL, USA, 2020. [Google Scholar]
  32. Singh, P.; Pandit, J.; Ekkad, S.V. Characterization of heat transfer enhancement and frictional losses in a two-pass square duct featuring unique combinations of rib turbulators and cylindrical dimples. Int. J. Heat Mass Transf. 2017, 106, 629–647. [Google Scholar] [CrossRef]
  33. Bergman, T.L.; Incropera, F.P.; DeWitt, D.P.; Lavine, A.S. Fundamentals of Heat and Mass Transfer, 6th ed.; John Wiley and Sons: Hoboken, NJ, USA, 2011. [Google Scholar]
  34. Moffat, R.J. Describing the uncertainties in experimental results. Exp. Therm. Fluid Sci. 1988, 1, 3–17. [Google Scholar] [CrossRef] [Green Version]
  35. Florschuetz, L.W.; Metzger, D.E.; Truman, C.R. Jet Array Impingement with Crossflow—Correlation of Streamwise Resolved Flow and Heat Transfer Distributions; NASA-CR-3373; NASA: Washington, DC, USA, 1981. [Google Scholar]
  36. Yang, X.; Liu, Z.; Zhao, Q.; Liu, Z.; Feng, Z.; Guo, F.; Ding, L.; Simon, T.W. Experimental and numerical investigations of overall cooling effectiveness on a vane endwall with jet impingement and film cooling. Appl. Therm. Eng. 2019, 148, 1148–1163. [Google Scholar] [CrossRef]
  37. Zuckerman, N.; Lior, N. Impingement Heat Transfer: Correlations and Numerical Modeling. J. Heat Transf. 2005, 127, 544–552. [Google Scholar] [CrossRef] [Green Version]
  38. Ricklick, M.A. Characterization of an Inline Row Impingement Channel for Turbine Blade Cooling Applications. Ph.D. Thesis, University of Central Florida, Orlando, FL, USA, 2009. [Google Scholar]
Figure 1. Geometrical configurations of baseline and variable extended jet hole impingement cooling systems: (a) baseline impingement configuration; (b) variable extended jet hole design.
Aerospace 09 00044 g001
Figure 2. Schematic of the experimental test section.
Aerospace 09 00044 g002
Figure 3. Measurement method and techniques for the jet impingement flow and heat transfer: (a) photograph of the measurement equipment; (b) illustration of the measurement method.
Aerospace 09 00044 g003
Figure 4. Row-averaged Nu from measurements and correlation of Florschuetz et al. [35].
Aerospace 09 00044 g004
Figure 5. Area-averaged Nu from measurements and correlation of Florschuetz et al. [35].
Aerospace 09 00044 g005
Figure 6. Computation domain with a close-up of the grid.
Aerospace 09 00044 g006
Figure 7. Validation of the turbulence model, Rej = 1.0 × 10⁴: (a) local Nu along the centerline and (b) spanwise-averaged Nu.
Aerospace 09 00044 g007aAerospace 09 00044 g007b
Figure 8. Grid sensitivity analysis.
Aerospace 09 00044 g008
Figure 9. Discharge coefficients of jet holes for various pressure ratios: comparisons with the data from Richlick et al. [38].
Aerospace 09 00044 g009
Figure 10. Local jet Reynolds number distributions at individual holes for the variable extended cases.
Aerospace 09 00044 g010
Figure 11. Streamwise distributions of crossflow-to-jet mass flow flux ratios: comparisons between the baseline, variable extended, and correlation of Florschuetz et al. [35].
Aerospace 09 00044 g011
Figure 12. Jet velocity distributions on the streamwise centerline plane, Rej = 2.0 × 10⁴.
Aerospace 09 00044 g012
Figure 13. Variation of pumping power with Rej for the baseline and variable extended cases.
Aerospace 09 00044 g013
Figure 14. Local distributions of Nu for the baseline configuration, from top to bottom: Rej = 1.0 × 10⁴, 2.0 × 10⁴ and 3.0 × 10⁴; (a) Exp; (b) CFD.
Aerospace 09 00044 g014
Figure 15. Local distributions of Nu for the variable extended configuration, from top to bottom: Rej = 1.0 × 10⁴, 2.0 × 10⁴ and 3.0 × 10⁴; (a) Exp; (b) CFD.
Aerospace 09 00044 g015
Figure 16. Comparisons of spanwise-averaged Nu between the baseline and variable extended cases: (a) Rej = 1.0 × 10⁴; (b) Rej = 2.0 × 10⁴; (c) Rej = 3.0 × 10⁴.
Aerospace 09 00044 g016aAerospace 09 00044 g016b
Figure 17. Area-averaged Nu values for the baseline and variable extended cases.
Aerospace 09 00044 g017
Figure 18. Area-averaged Nu as a function of pumping power for the baseline and variable extended cases, along with the data for the configurations (xn/d = yn/d = 6, z/d = 2) from Madhavan et al. [30].
Aerospace 09 00044 g018
Table 1. Uncertainty of experiments.
ParameterTypical ValueMeasurement Error
m ˙ 7.077–21.231 g/s±1.0% F.S.
T23–67.5 °C±0.5 °C
p101.347–147.236 kPa±0.05%
t0–150 s±0.067 s
Nu11.58–173.75±3.97–±11.20%
Publisher’s Note: MDPI stays neutral with regard to jurisdictional claims in published maps and institutional affiliations.

