Article

Propulsion Sizing Correlations for Electrical and Fuel Powered Unmanned Aerial Vehicles

Department of Mechanical Engineering, Aeronautics and Applied Thermofluids Research Group, Escuela Politécnica Nacional, Quito 170517, Ecuador
*
Author to whom correspondence should be addressed.
Aerospace 2021, 8(7), 171; https://doi.org/10.3390/aerospace8070171
Submission received: 9 August 2020 / Revised: 14 December 2020 / Accepted: 12 January 2021 / Published: 24 June 2021
(This article belongs to the Collection Unmanned Aerial Systems)

Abstract

:
Despite the increasing demand of Unmanned Aerial Vehicles (UAVs) for a wide range of civil applications, there are few methodologies for their initial sizing. Nowadays, classical methods, mainly developed for transport aircraft, have been adapted to UAVs. However, these tools are not always suitable because they do not fully adapt to the plethora of geometrical and propulsive configurations that the UAV sector represents. Therefore, this work provides series of correlations based on off-the-shelf components for the preliminary sizing of propulsion systems for UAVs. This study encompassed electric and fuel-powered propulsion systems, considering that they are the most used in the UAV industry and are the basis of novel architectures such as hybrid propulsion. For these systems, weight correlations were derived, and, depending on data availability, correlations regarding their geometry and energy consumption are also provided. Furthermore, a flowchart for the implementation of the correlations in the UAV design procedure and two practical examples are provided to highlight their usability. To summarize, the main contribution of this work is to provide parametric tools to size rapidly the propulsion system components, which can be embedded in a UAV design and optimization framework. This research complements other correlation studies for UAVs, where the initial sizing of the vehicle is discussed. The present correlations suit multiple UAV categories ranging from micro to Medium-Altitude-Long-Endurance (MALE) UAVs.

1. Introduction

At early stages of design, where the airplane layout is not well established yet, a large spectrum of aircraft configurations remains a feasible design option. In this way, the large amount of architectures to be assessed at conceptual and preliminary design phases has encouraged the employment of parametric and semi-empirical models due to their rapid implementation and moderate computational cost while maintaining accurate results [1,2]. In this sense, the conception of civil airplanes has historically relied on well documented parametric models, semi-empirical correlations, and technical criteria, which have been derived from statistical data of operative aircraft [3,4,5,6]. Along the years, these correlations have been enhanced by including the recent advances in technology, which has enabled to assess non-conventional aircraft models (e.g., Blended Wing Body aircraft) [7,8]. Furthermore, under certain considerations, these correlations have been firstly adapted and then employed for the conceptual design of unmanned aerial platforms that generally fit in the category of High-Altitude-Long-Endurance (HALE) Unmanned Aerial Vehicles (UAVs) [9,10,11]. However, their applicability on the design of other UAV categories (specially medium, small, and micro) could lead to over- or underestimate the aircraft components since UAVs employ different design trade-offs compared with transport aircraft [12].
In this context, the design of UAVs requires a personalized research to establish appropriate correlations that encompass the large spectrum of UAV categories. This could allow sizing the different aircraft systems, e.g., propulsion, weight, and geometry, in a more rapid and accurate way while considering the UAV’s design requirements and performance constraints. In this sense, various authors have developed empirical correlations for conceptual and preliminary design based on statistical analysis of databases for different categories of UAVs [12,13,14,15,16]. These studies present several design charts and correlations that combine key parameters such as wing loading and power loading as functions of the payload mass or the vehicle’s endurance. Therefore, these correlations enable defining other initial characteristics of the UAV such as power and thrust required, initial take-off mass, wing reference area, and rough estimates of the airplane dimensions. Regarding the sizing of UAVs’ propulsion systems, Gur and Rosen [17] introduced several correlations for the energetic assessment and weight estimation of electric brushless motors and Li-Po batteries, while Bershadsky et al. [18] exhibited correlations for electrical sizing of brushless motors, electronic speed controllers, and batteries commonly used in multi-rotors. Although the aforesaid approaches are useful for small UAVs, they lack of data for larger vehicles, and, hence, they are biased to a small spectrum of UAV configurations. For instance, Bershadsky et al. [18] limited the study of battery packs to 22.2 [V].
In similar fashion to electrical systems, there are few studies about the preliminary sizing of fuel engines focused on UAVs. In this way, Schoemann and Homung [19] provided a semi-empirical model to size piston engines for hybrid propulsion systems. However, their application involves a large number of engine parameters, most of them unknown at early design stages, which make them unsuitable for preliminary studies. On the other hand, Cirigliano et al. [20] exhibited correlations to estimate weight, size, and specific power of Internal Combustion Engines (ICE) and turbine-based engines derived as power law functions; nevertheless, the range of power output varies from 10 2 to 10 5 [KW], which make these correlations adequate for really large and heavy UAVs. Turbine-based engines have been studied more deeply for civil aviation; for example, various correlations for weight estimation and their geometrical sizing can be found in [1,3,21]. Meanwhile, in [22], the performance data of more than 1000 turbofan and turbojet engines are compiled in an extended database for thrust values ranging from 10 4 to 5 × 10 6 [N]. Nonetheless, micro, small, and Medium-Altitude-Long-Endurance (MALE) UAVs employ power systems ranging lower than the aforesaid power and thrust ranges [9,10,23]. Thus, the above correlations and performance data cannot be implemented to set the design space of smaller UAV configurations. In this paper, the power output ranges from 10 1 to 10 2 [KW] and the thrust generated varies from 10 1 to 10 4 [N].
This work focuses on compiling a robust database of off-the-shelf components, covering a wide spectrum of UAV configurations, to enable the derivation of empirical correlations to size propulsion components at preliminary design stage. In this way, the commercial availability of these components can be accounted when optimization routines are implemented in the design of propulsion system. Hence, the importance of this work lies on complementing other correlations studies [12,13,14,15,16,17,18,19,20], since it can be embedded on UAV optimization and design routines to set preliminary aircraft parameters and determining their feasibility arranged in a certain configuration and based on market availability. This feature has been found of major importance in the optimal integration between airframe and propulsion systems for different UAV designs, since designers or hobbyist employ off-the-shelf components due to their low cost to set the energy–propulsion configuration. Figure 1 shows the types of propulsion systems and the components that are explored in this work. The proposed correlations are mainly focused on determining the preliminary weight and geometrical features of the propulsion components based on other UAV requirements regarding the mission planning stage.

2. Mission Requirements and UAV Categories
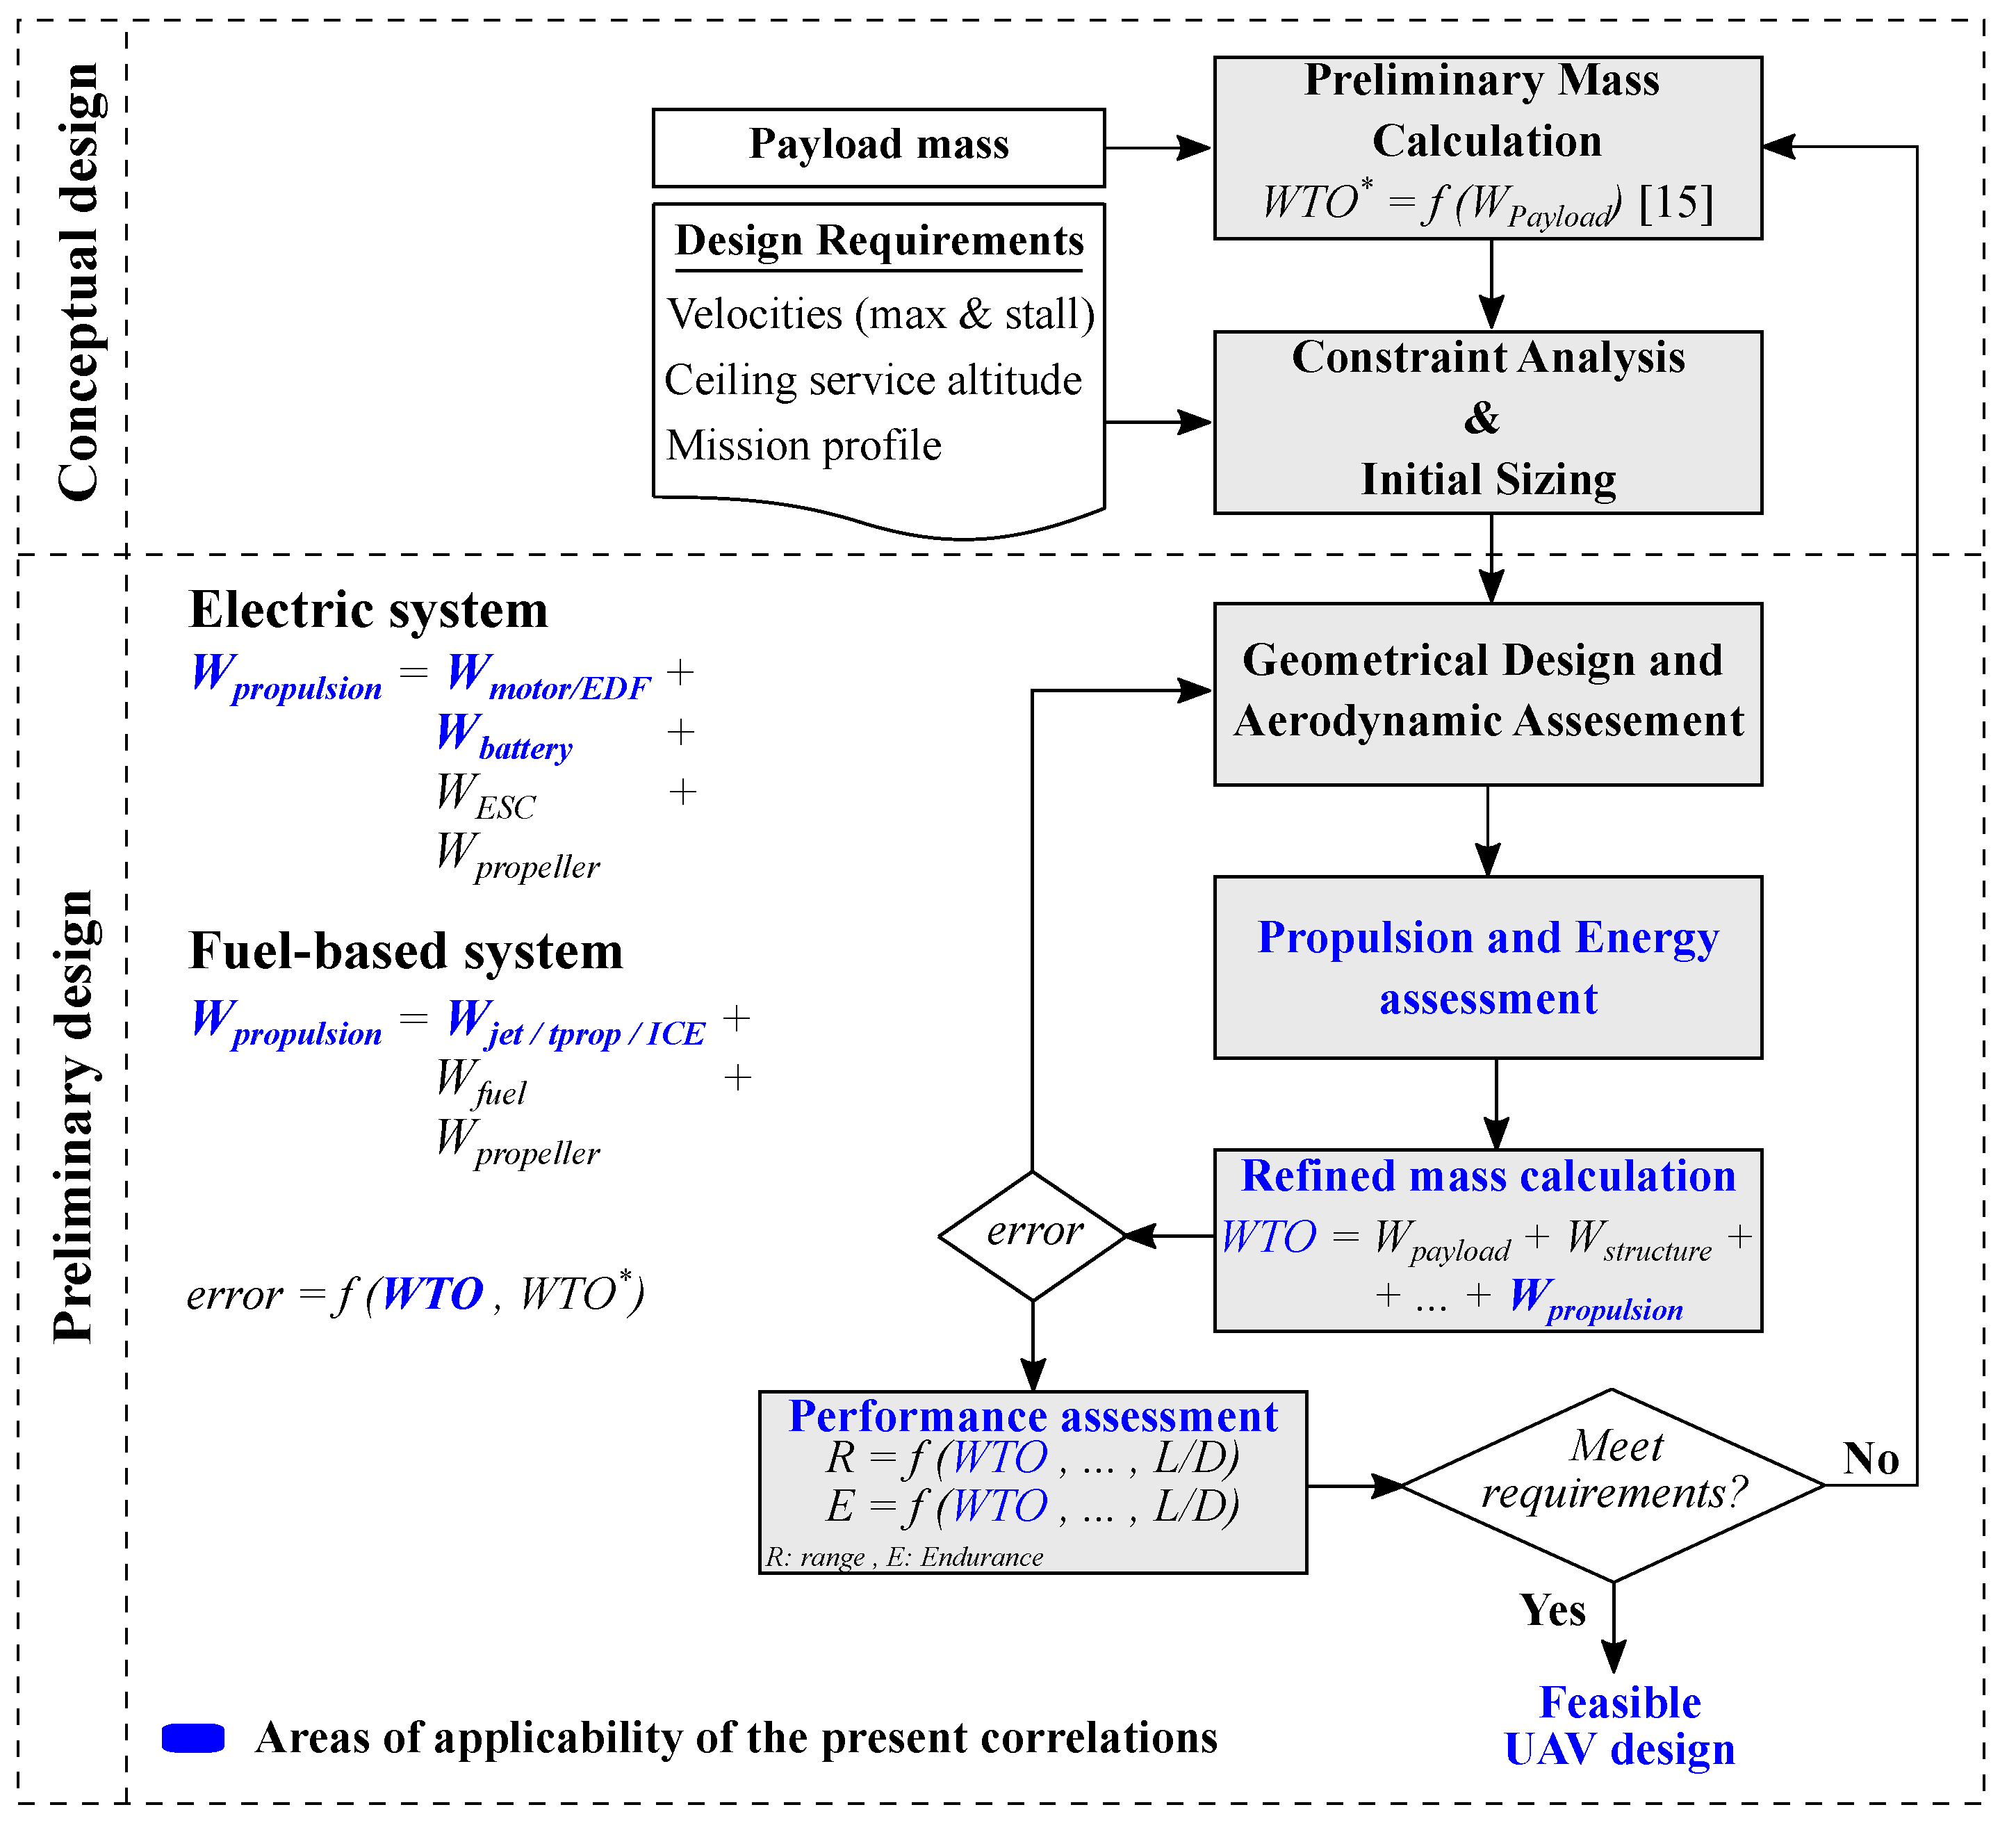
The present correlations encompass two main UAV types: electric and fuel-powered. In respect to the UAV categories, the proposed correlations are valid for a wide spectrum of categories, ranging from micro UAVs to MALE and even HALE UAVs. For example, micro UAVs are generally powered by electric brushless motors and batteries; therefore, the correlations proposed for electric propulsion system components could be employed for the design and assessment of this UAV category. On the other hand, MALE and HALE UAVs are generally powered by fuel engines such as turbojet or piston engines; therefore, the correlations derived for fuel-based propulsion systems could be employed. In addition, the proposed correlations could be also employed for the sizing of novel propulsion architectures such as hybrid propulsion, as in [24], where the proposed correlations are employed in the propulsion system modeling of a MALE hybrid-electric UAV. Regarding to UAV configurations, the proposed correlations are not limited to a specific type of UAV layout. In contrast, they are suitable for a variety of UAV layouts; for instance, multi-copters, fixed-wing, flying taxis, blended-wing-body, etc. To exemplify this, let us consider a multi-copter UAV, which can be powered by electric motors or fuel engines, depending on the mission type and the payload on board. Consequently, the decision on using the correlations for electric or fuel-based systems depends exclusively on the UAV designer or design team.
Respect to the UAV mission requirements, the proposed correlations are mainly linked to the following design requirements: the maximum take-off mass, the flight altitude, the propulsion system type (if specified in the requirements), volume constraints (if any). The relationship between the maximum take-off mass and the proposed correlations is clearly evident, since correlations to determine the mass of electric and fuel-based propulsion system components are provided. The design requirement of flight altitude could play a key role in the selection of internal combustion engines, for example. As shown below, correlations for ICE engines for low/medium and high altitude have been derived separately. Other design requirements such as available volume can be linked with the correlations proposed to determine the geometric features of some propulsion system components. The aforementioned mission/design requirements are provided only for reference. The UAV designers should be capable of integrating the proposed correlations with additional mission/design requirements, depending on their needs. In the following sections, the usability of the correlations and their implementation with other design tools is illustrated.

3. Methodology

The sizing correlations presented in this work are the result of a systematic data analysis based on the methodology presented in [14,15,16]. At the initial stage of this research, an extensive survey of different propulsion architectures for various vehicle configurations was carried out. These data reveal the existence of a wide spectrum of power plants for unmanned aircraft, ranging from fuel- to electric-based propulsion [23,25,26,27,28,29]. For the components of the systems presented in Figure 1, an exhaustive data gathering of off-the-shelf devices was developed to generate structured databases that integrate both design parameters and operational characteristics. The information used in the analysis was collected from state-of-the-art catalogs, online stores, and specialized forums. To ensure an accurate correlation, the dispersion of the data was constantly monitored through Cook’s distance criteria [30], which were employed to assess the influence of a specific observation in the regression analysis [31]. This principle allows avoiding deviations that affect the distribution of the parameters plotted along the range of study. The Cook’s analysis was found to be very useful for the obtained correlations, since market trends and consumer preferences create a non-uniformly dispersed database, as observed in Section 4. The data analysis was performed in three sequential phases. Initially, the datasets were preliminary evaluated using techniques for classification and data visualization, following the approach described by Alulema [31], who removed outlier and leverage points using the Cook’s distance.
To describe the implementation of the present correlations for preliminary sizing of UAV propulsion systems, a flowchart describing the variables and inputs required is depicted in Figure 2. As observed, the geometrical and weight correlations (depicted in blue) enable propulsion component sizing, and, since they are determined by using an extensive off-the-shelf database, they allow a refinement of the conceptual models and reduce the design space of potential solutions setting up their feasibility. This latter aspect is very important in preliminary design of UAVs, as the spectrum of UAVs architectures is usually very wide, making the determination of conceptual configurations cumbersome and unreliable if actual components are not considered.

4. Results and Discussion

This section compiles the correlations found for electric propulsion systems, which are based on a previous work [31], and the correlations for fuel-based propulsion systems.

4.1. Electric Propulsion Systems

As presented in [17,18,32], the main components of an electric propulsion system (conventional or hybrid-electric) are the electric motor, the electronic speed controller (ESC), the battery, and the propeller/fan. This section covers the formulation of sizing correlations for cells and batteries, electric ducted fans, and brushless motors (outrunner and inrunner). Propellers and ESCs were not included in this analysis since information regarding these devices is widely available on the open domain (technical info of propellers: https://www.apcprop.com/technical-information/; performance data of propellers: https://m-selig.ae.illinois.edu/props/propDB.html) and their weight can be neglected when compared with batteries’ or electric motors’ weight [18].

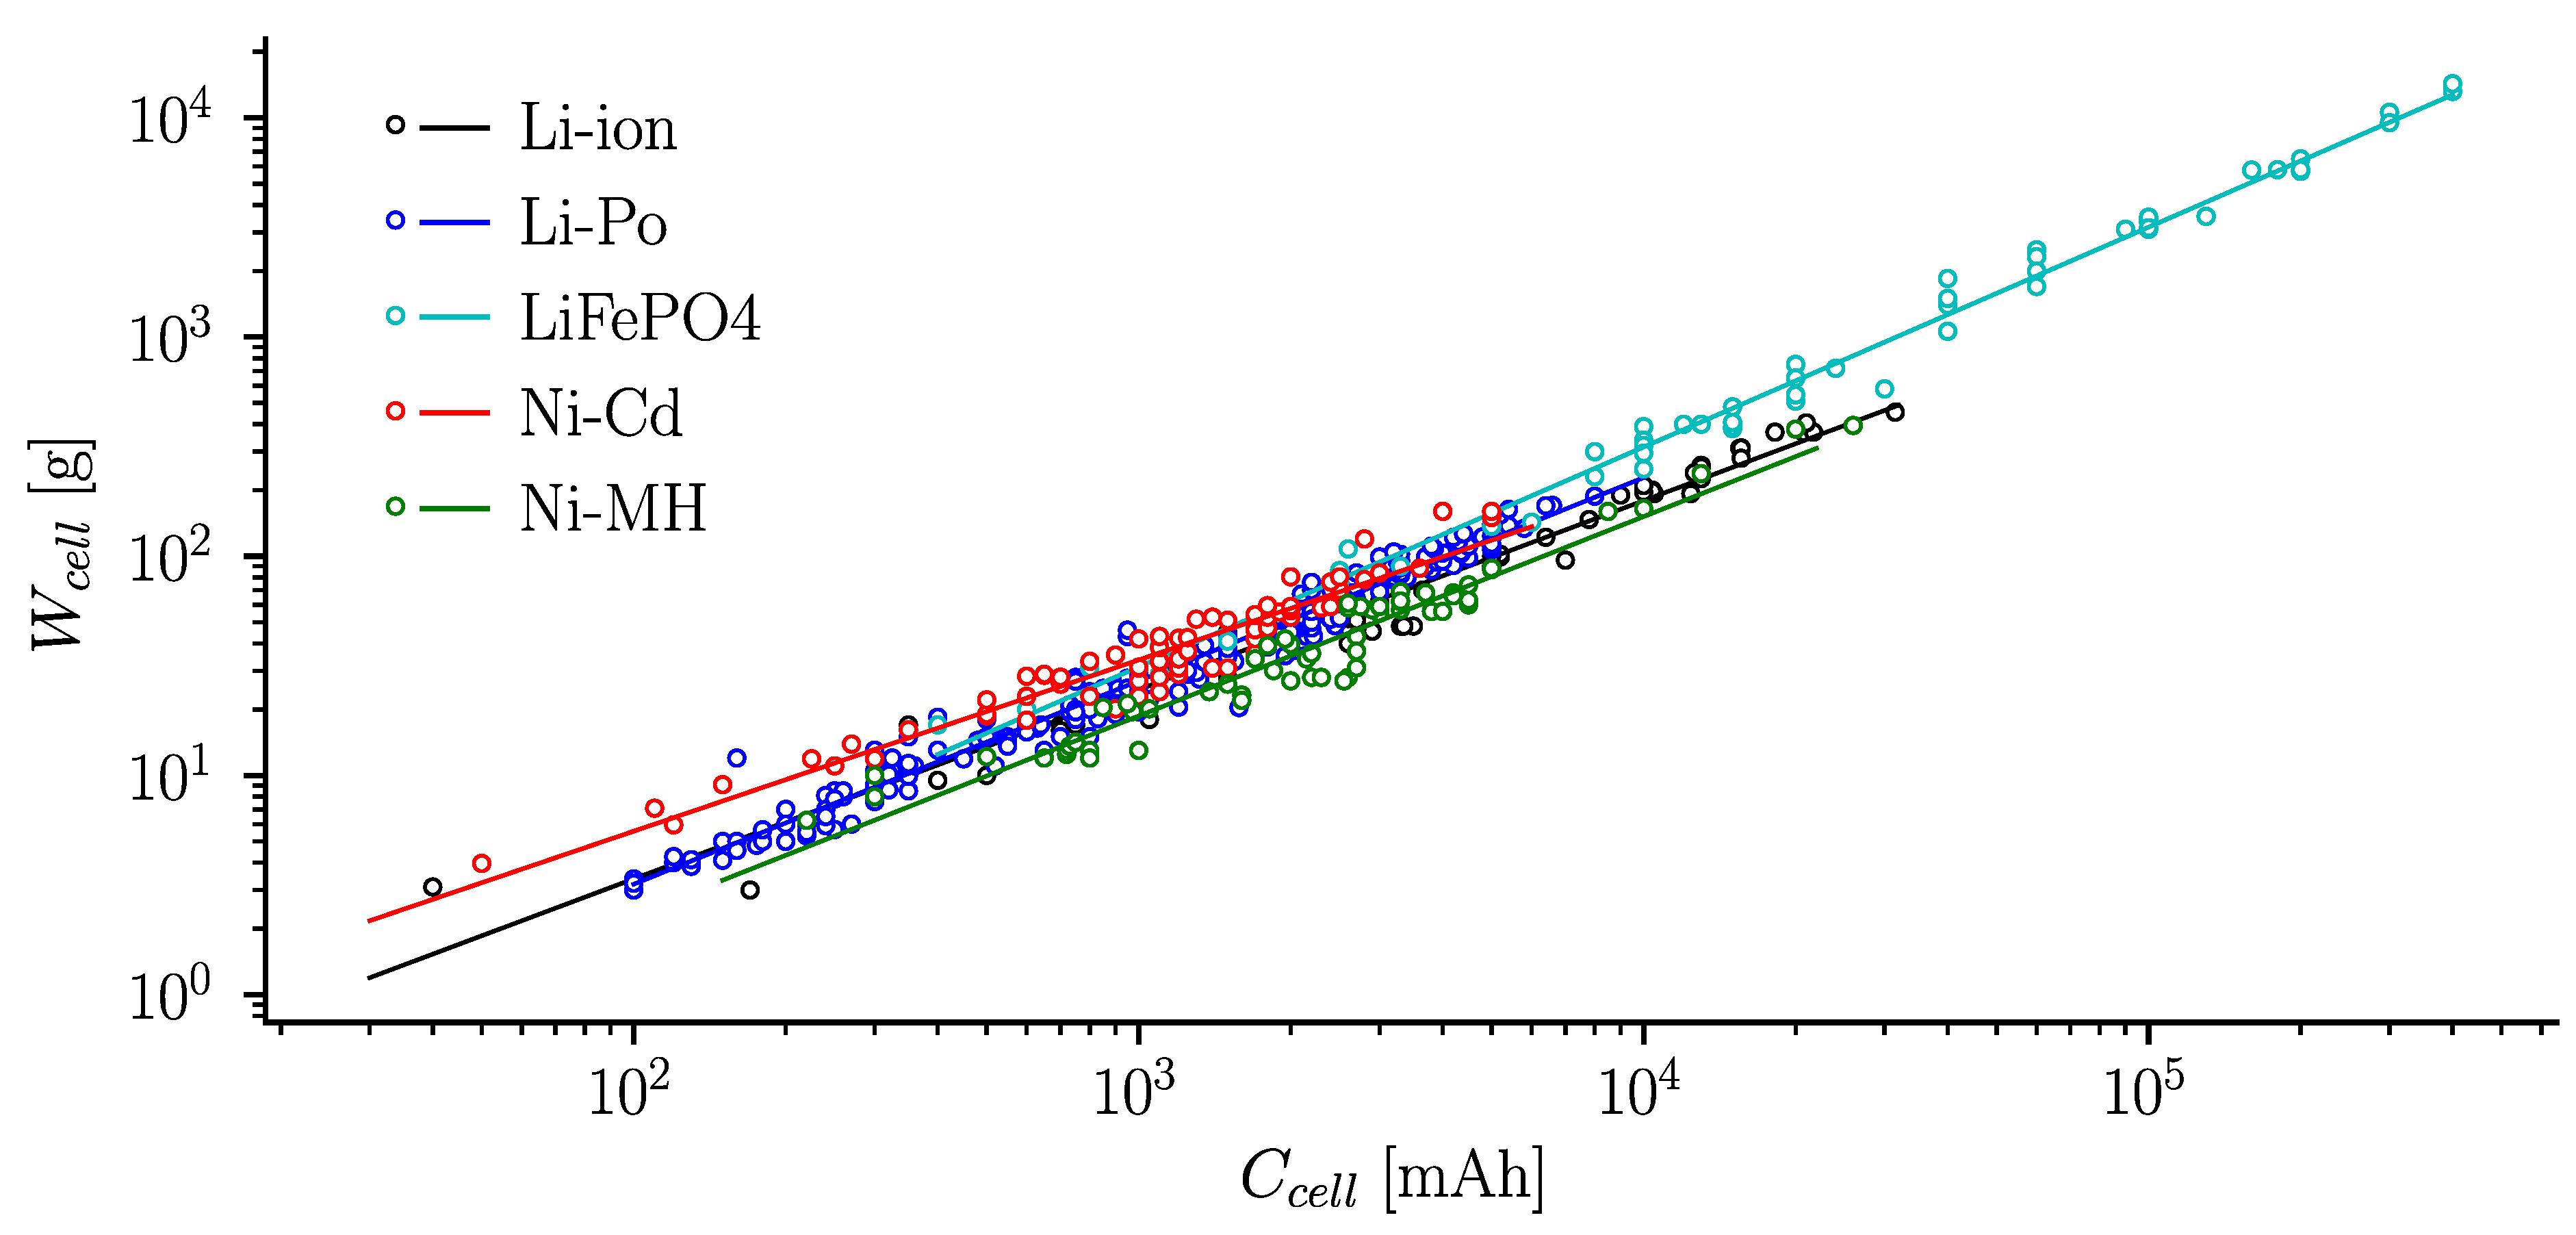
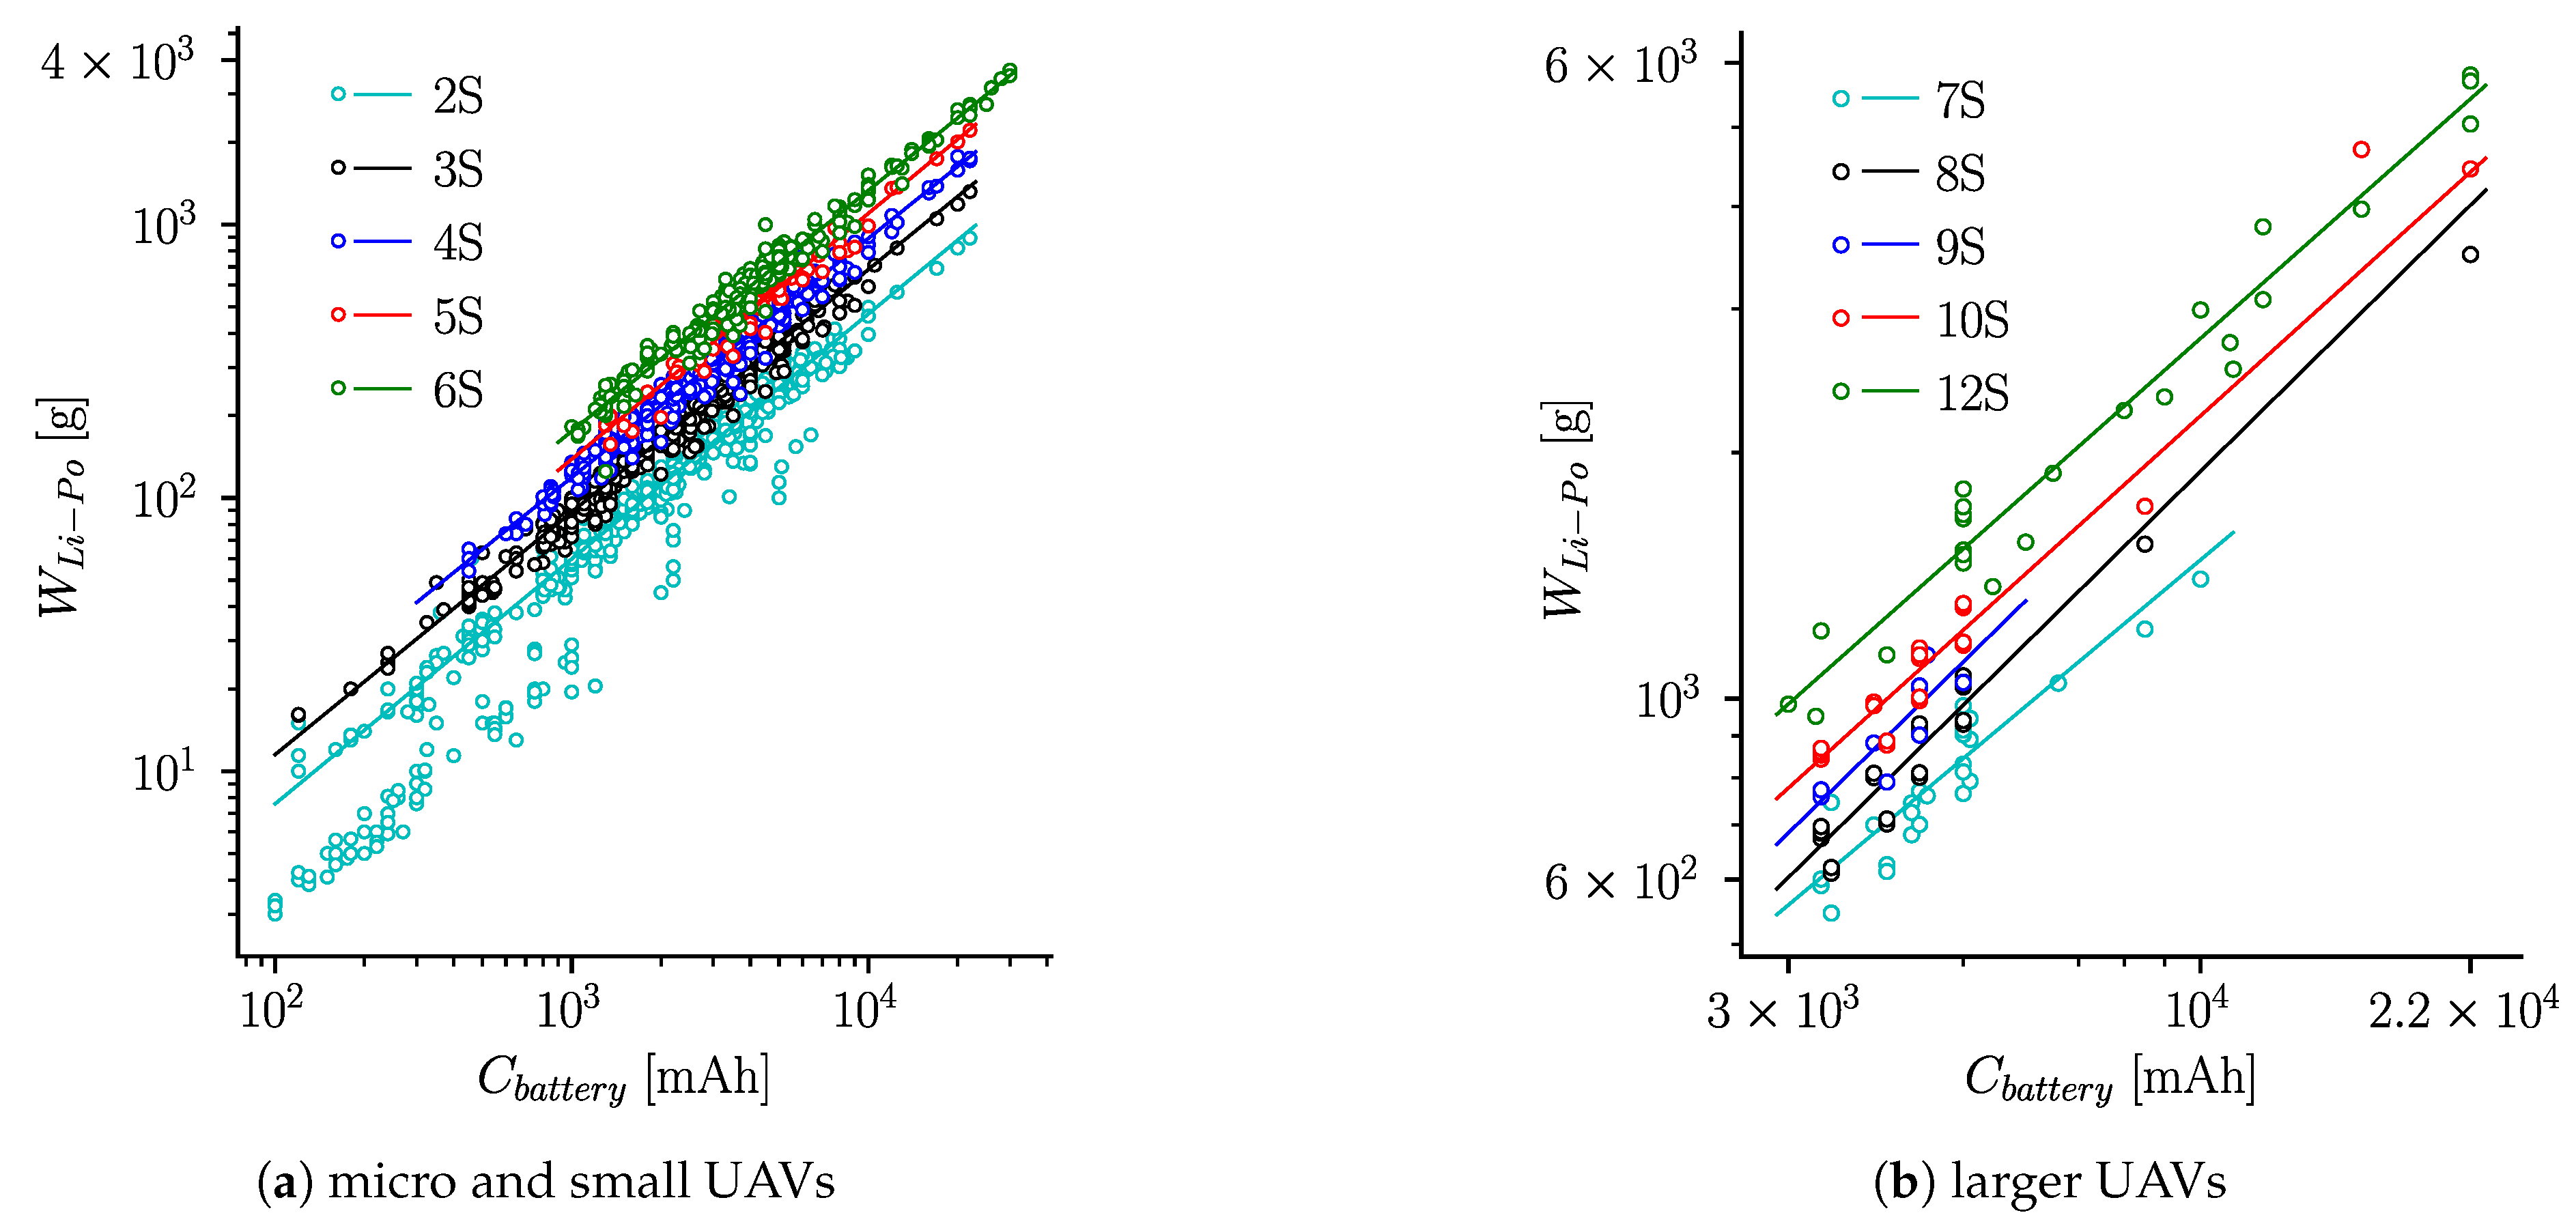
4.1.1. Cells and Batteries

Batteries are the key components of electric propulsion systems since they supply the energy required to run the motor and other electric/electronic components for navigation, control, and data acquisition [33]. The battery manages the performance of the UAV because it contributes significantly to the total weight of the UAV and plays an important role over the flight time (endurance), which depends directly on the battery capacity ( C b a t t e r y ) and UAV Take-Off Gross Weight ( T O G W ) [34]. For electric air vehicles, there are different battery types in terms of chemistry which are reported in the literature [29,35,36]. The electrical modeling and advantages and disadvantages of these devices are well reported in previous works [37,38,39], and, hence, these topics are not explored in the present work. Instead, this section aims to present a sort of correlations for weight estimation of unitary cells and battery packs for the following battery chemistry: Li-Po, Li-ion, LiFePO4, NiCd, and NiMH.
In this study, three characteristics of cells and batteries are evaluated: capacity C cell , voltage, and weight W cell . In respect to unitary cells, Figure 3 illustrates the data collected from different manufacturers plotted in a logarithmic scale, while Table 1 presents the regression coefficients and the number of observations (n) in each dataset. The database developed for this purpose includes: prismatic, flat, and cylindrical cells. It is important to mention that these data consider the wiring weight, envelope material, and insulation covers. Moreover, as shown in Table 1, the coefficient R 2 shows good agreement with the data gathered (higher than 0.9 for all types of cell chemistry). The capacity of the unitary cell was selected as independent variable as it offers a direct link between the commercial selection of batteries and various performance characteristics such as endurance and range [34]. The range of capacity for each type of cell (internal composition) can be appreciated in Figure 3, but, in general, this study addressed battery cells from 30 [mAh] to 500 [Ah] of capacity. It is important to note that, to make more generic the proposed correlations, the modeling was defined for one cell, which then can be extrapolated for the case of a larger number of cells. The present correlations intends to facilitate the studies over the performance of electric powered UAVs as a function of different characteristics from these power sources such as battery internal composition, voltage (number of cells connected in-series), and capacity (number of cells connected in parallel).
Since Li-Po cells and Li-Po batteries are the most utilized in micro, small and MALE commercial UAVs, they were further studied to offer a better description for different cell arrangements. The data collected were plotted in two separate figures for facilitate their visualization and to divide the analysis in two main categories. On the one hand, Figure 4a groups Li-Po battery that are commonly used by RC (remote control) and FPV (First person view) micro and small UAVs, while batteries in Figure 4b are the most oriented to larger UAVs that require higher values of power. Table 2 presents the regression coefficients obtained from the aforesaid plots and the number of observations for each number of LiPo battery cells. Similar to unitary cells, correlations to determine the mass of a LiPo battery W Li Po as function of its capacity C battery were derived. As observed in Table 2, the regression coefficient R 2 indicates a good fitting between the data gathered and the power law model.

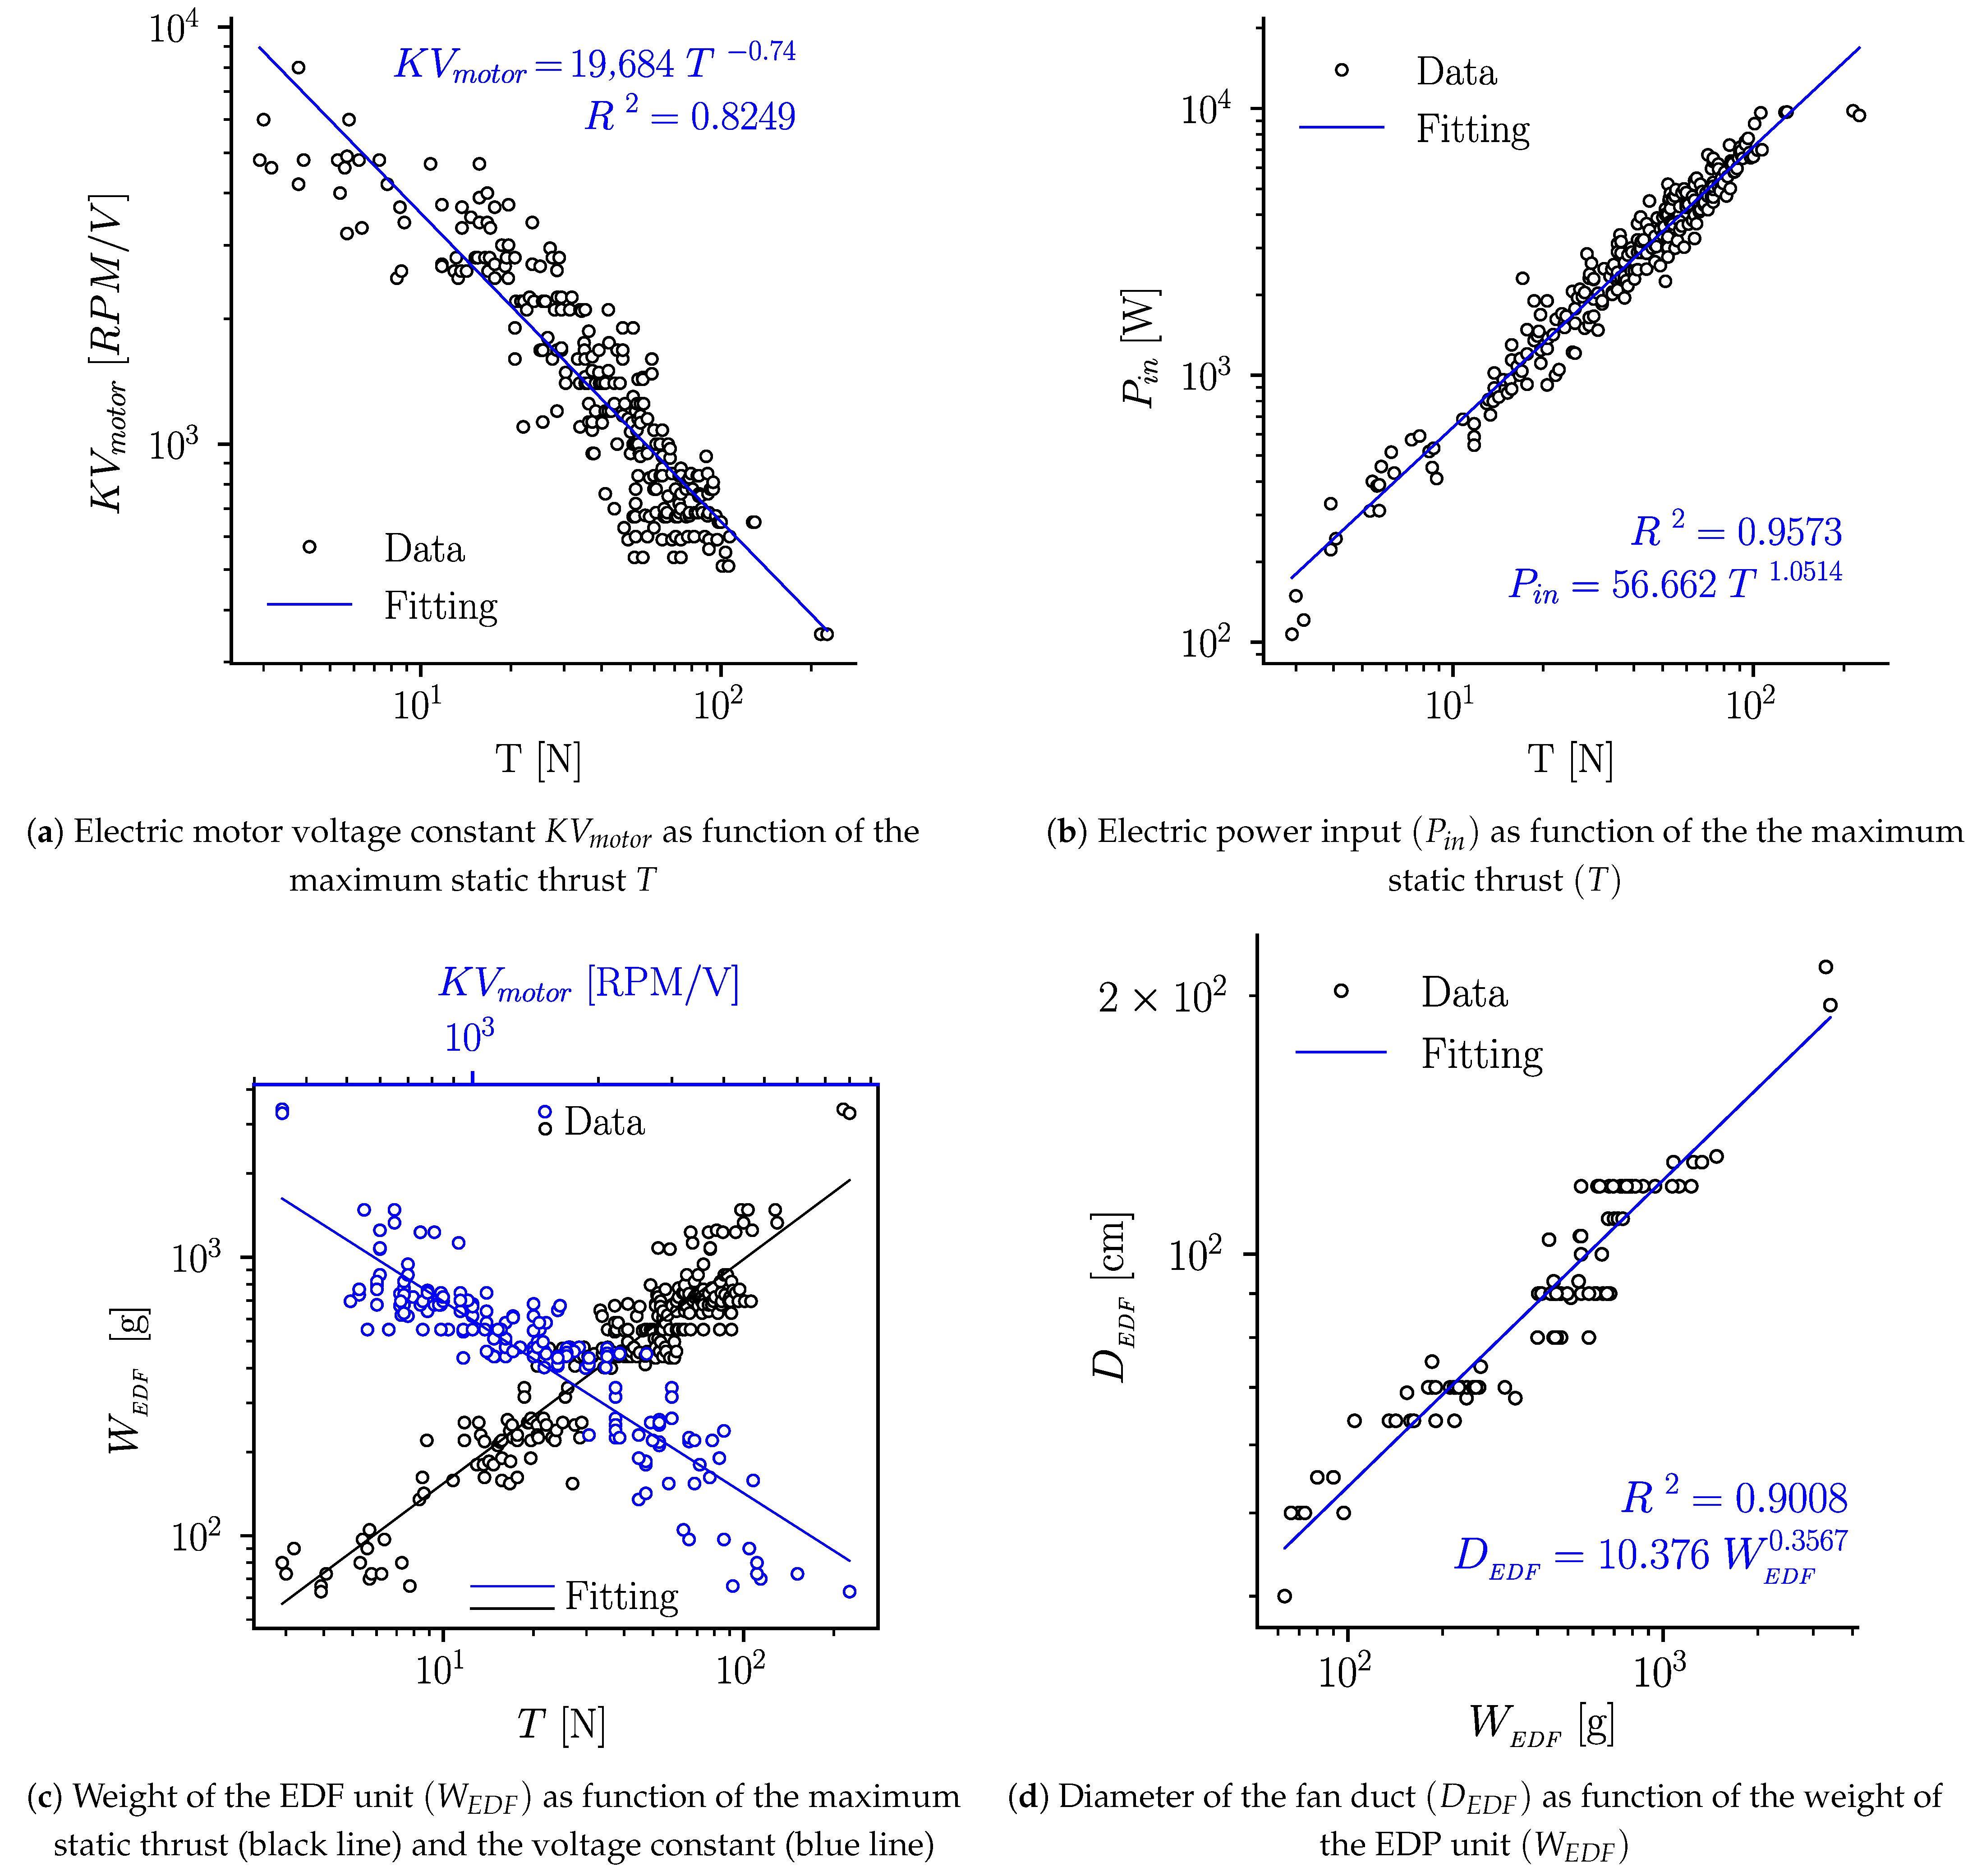
4.1.2. Electric Ducted Fan (EDF)

EDFs are propulsive components that generate thrust because of the pressure difference between the flow intake and exit station. Since these devices operate at high RPM, they also demand less torque compared with simple propellers while generating the same amount of thrust with less power. Moreover, the differences in performance of both propulsion systems have caused that EDFs are modeled in a different way [40]. Firstly, higher rotational speeds and lower torque demand the employment of brushless inrunner motors [41] unlike propellers that are commonly associated with outrunner motors. These assumptions were taken into account when establishing the correlations that associate key preliminary characteristics of a EDF presented in this section. For this, compiled data from different sources (EDF by brand: https://www.turbines-rc.com/en/127-edf-by-brand) result in a database of 270 ducted fan units from 12 different manufacturers that includes EDFs manufactured with plastic, aluminum, steel, and carbon-fiber parts. Considering that the function of an EDF is to generate thrust, the maximum static thrust (T [N]), provided by manufacturers, was defined as the independent variable. This assumption was also used by Isikveren [1], who presented correlations to determine the weight, diameter and length of large turbofan engines. According to the authors of [40,42,43], the maximum static thrust specified by manufacturers can be assumed as the thrust required for take-off or can be calculated using the approaches presented in [40,44].
Figure 5a introduces a correlation to determine the voltage constant ( K V m o t o r ) of a brushless inrunner motor as a function of the maximum static thrust, while Figure 5b provides a correlation to estimate the power that a battery must supply to an electric motor ( P in [W]) in order to generate a certain amount of thrust. On the other hand, Figure 5c present two correlations to determine the weight of the EDF ( W EDF [g]) from two different perspectives (Equations (1) and (2)). The former equation allows calculating the weight of the EDF from the maximum static thrust that the fan generates, while in the latter equation, the EDF weight is estimated from the voltage constant of the electric motor, which implicitly involves the number of RPM of the fan and the voltage that is supplied to the electric motor. Finally, Figure 5d presents a correlation to size the duct diameter ( D EDF [cm]) as function of the weight of the EDF. For all of the proposed models, the coefficient R 2 shows good match between the power law and the data collected. The gathered data also reveal some particular features of electric ducted fans. For instance, two EDFs of the same diameter and weight can generate different amounts of thrust depending on the K V s of the electric motor. Similarly, two EDFs powered by the same electric motor can generate similar values of thrust and weigh differently depending on the diameter of the duct and the number of fan blades.
W E D F = 24.116 T 0.8051 , R 2 = 0.8770
W E D F = 441 , 839 K V m o t o r 0.9571 , R 2 = 0.8225

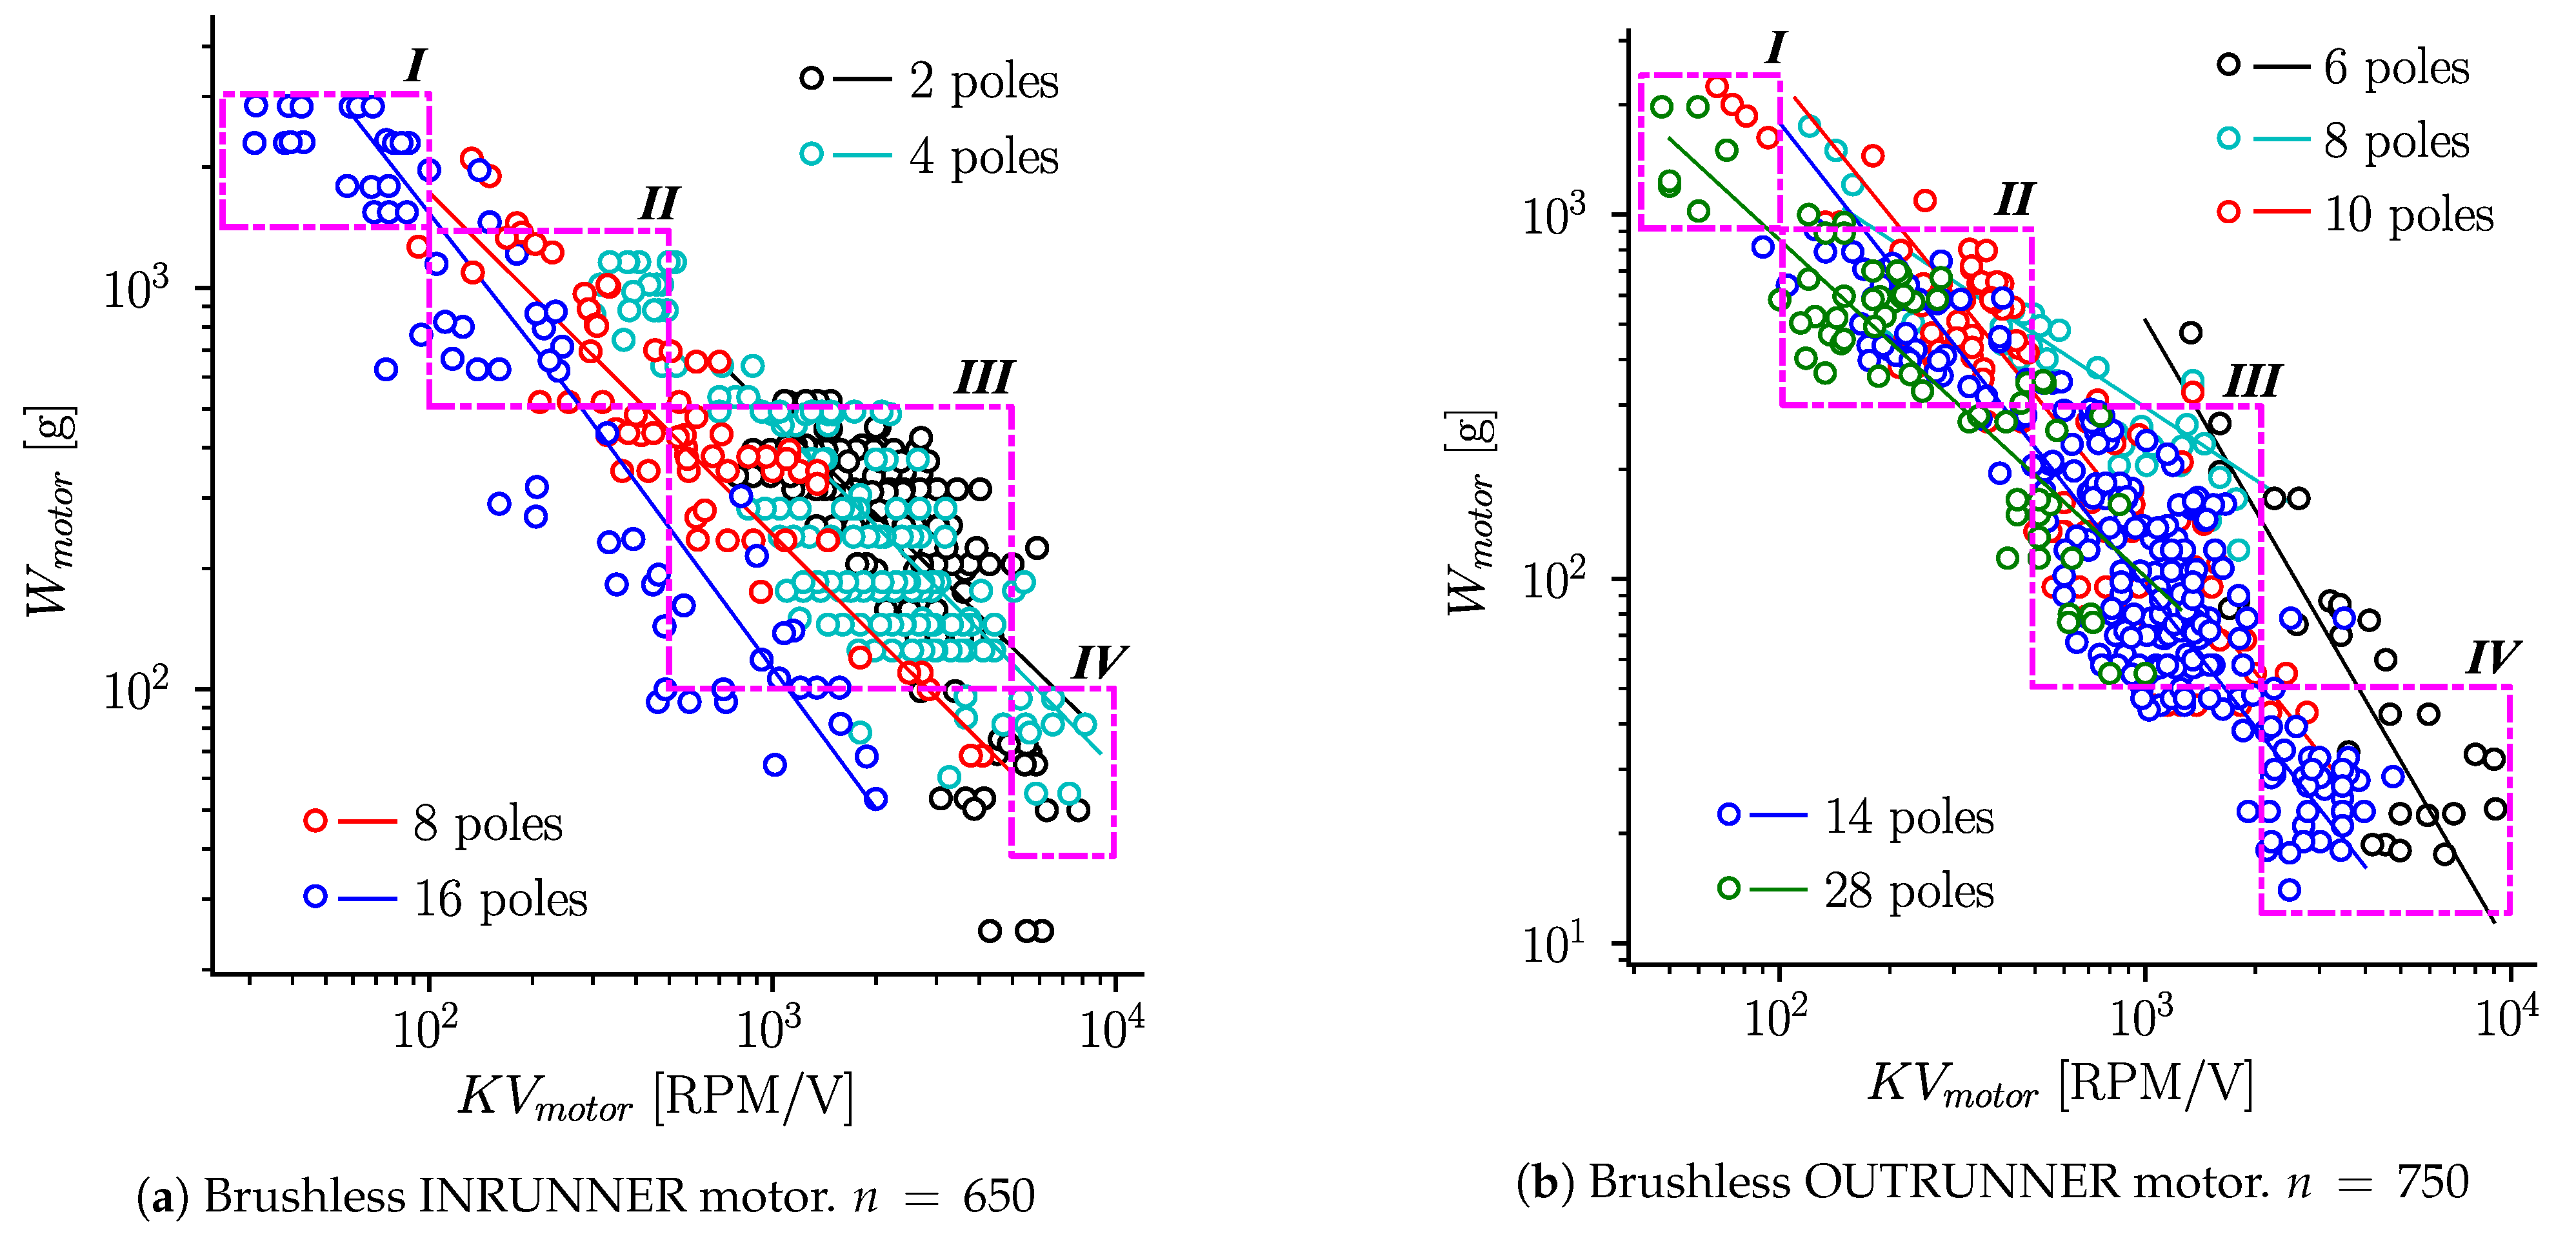
4.1.3. Electric Brushless Motors

Brushless motors are other key component in electric propulsion systems since they convert the electrical power stored in the battery into mechanical power [17,18]. The authors of [41,45,46] thoroughly described the electrical modeling and performance of such devices. However, for the preliminary design of electric-powered UAVs, general properties of the electric motor (e.g., weight, power, and motor constant) are of greater interest. The authors of [17,18,19] presented some correlations to determine the weight, diameter, no load current, and internal resistance of the electric brushless motor; nevertheless, the accuracy of those correlations is questionable because of two factors: the really low value of the coefficient of correlation R 2 (where provided) and the number of data points and manufacturers included in those analysis. Similar to previous works [17,18,19], the motor constant ( K V m o t o r ) was defined as independent variable for this study, since it offers a direct link between the commercial selection of brushless motors and the number of RPM of the propeller and the voltage of the battery that powers the electric motor.
To determine highly accurate correlations, several approaches were evaluated in this study. The first approach was to establish a robust database that enables various statistical analysis. For this, data were collected from 12 manufacturers of outrunner motors and from 10 manufacturers of inrunner motors. Initially, a global correlation that encompasses the whole range of the motor constant was determined; nonetheless, the coefficient of correlation was lower than 0.5 . Other approaches were to determine correlations for groups of manufacturers, segment the range of study, and vary the number of data points for the regression model. In fact, these approaches allowed slightly increasing the value of the coefficient of correlation, but the increase was not representative. Unlike batteries and EDFs, it was not possible to derive accurate correlations for brushless motors due to their non-linear behavior. This is reflected on the disparity and non-uniformity of the gathered data (Figure 6), which makes it difficult to model this type of motors with uni-variate [17,18] and even with multi-variate models [19].
Figure 6a,b illustrates the brushless motor weight as a function of the motor constant. It can be appreciated that these plots present an analogous behavior to the ones found in [17,18,19]. The number of magnetic poles of the motor was employed to split the aforesaid plots in different categories. As stated in [41,46], the larger is the number of motor poles, the lower is the motor constant. This behavior is clearly observed in Figure 6 for both inrunner and outrunner motors. Even though no accurate correlations were determined, some trade-offs were identified. Table 3 presents a classification of electric brushless motors as function of the motor constant ( K V motor [RPM/V]) and motor weight ( W motor [g]). Four categories were identified for both inrunner and outrunner motors. Classes I and II: These categories group brushless motors for heavy duty applications; these motors provide really high values of torque and power at relatively low number of RPM. Class III: Motors for small RC and FPV UAVs fall in this category, and they widely used for aero-modeling. These motors have intermediate values of torque and RPM. Class IV: This category comprises motors of low torque and high RPM, commonly used for small and micro UAVs.

4.2. Fuel-Based Propulsion Systems

Fuel-based propulsion systems, turbine-based, and piston engines are commonly employed in small, MALE, and HALE UAVs because they permit to accomplish longer endurance and range [20,26,27]. The following section presents a group of correlations for sizing and selection of fuel-based engines focused on turbojet, turboprop, and internal combustion engines. Turbofan engines were not included in this study because very few devices for UAV applications were encountered.

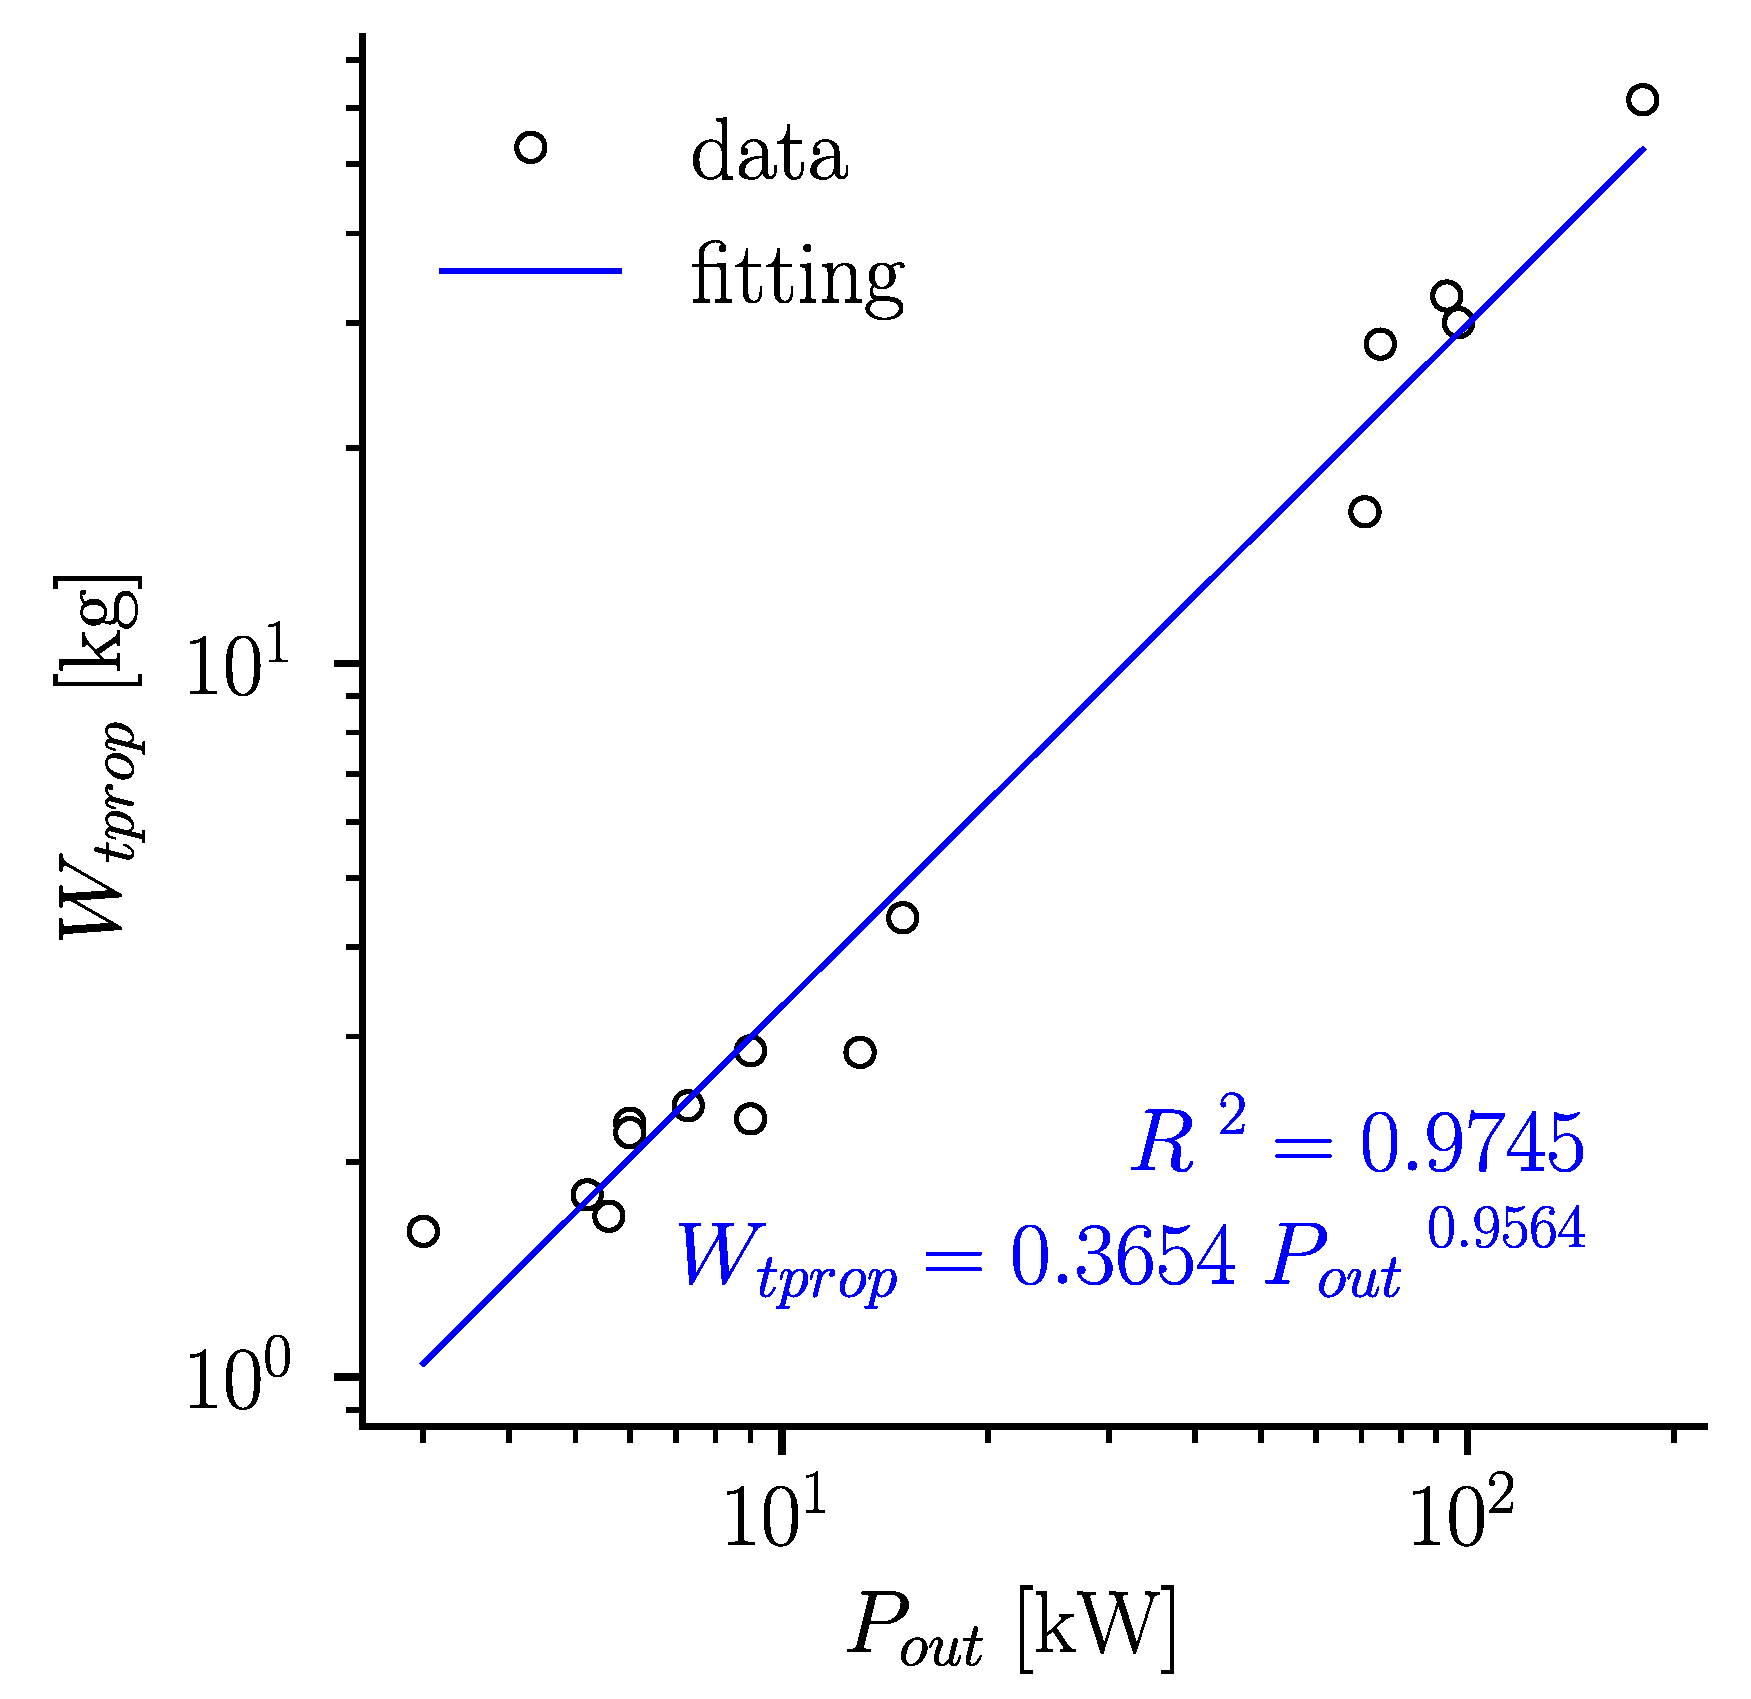
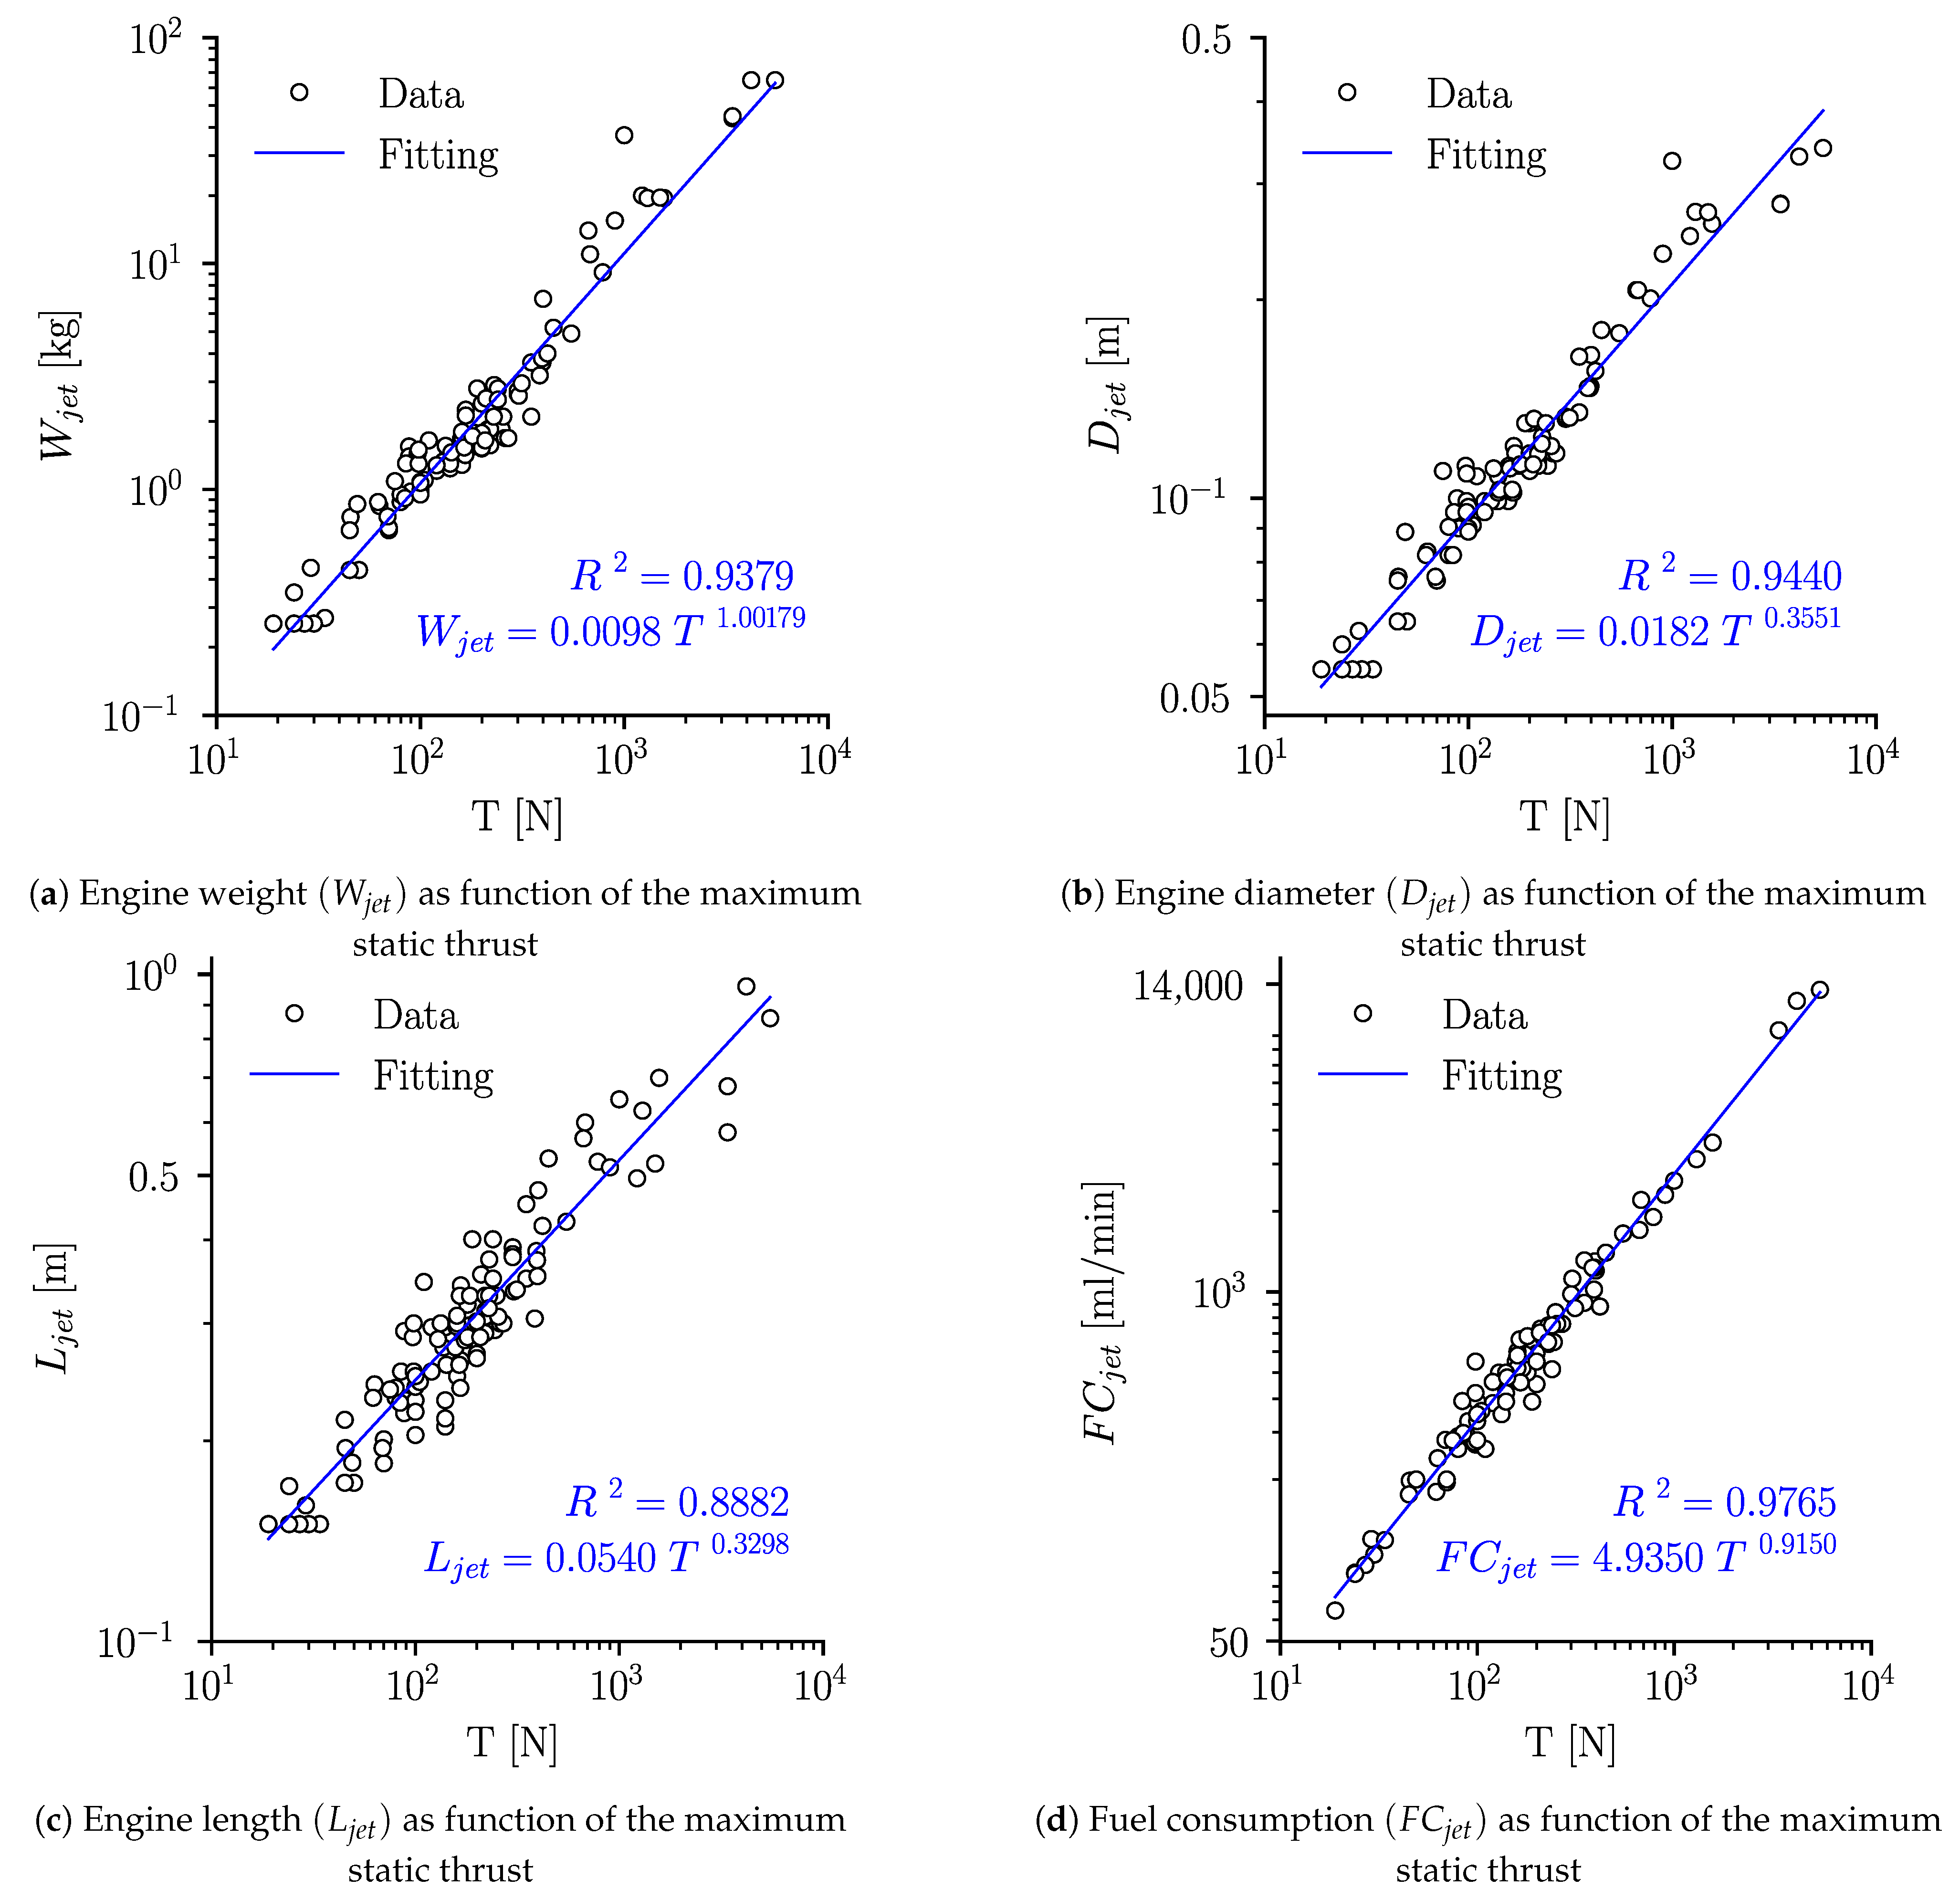
4.2.1. Turbojet and Turboprop Engines

In this section, sizing correlations of turbojet and turboprop engines for UAV applications are presented. For this aim, a database consisting of 117 turbojet engines from 15 manufactures was structured and includes majorly single spool turbines and few double spool. In this case, the maximum static thrust was selected as independent variable, since the function of turbojet engines is to generate thrust from the high energy of the exit flow. On the other hand, the database for turboprop engines contains only 19 samples from eight manufacturers. This type of engines is manufactured in lower quantity than other engine types due to their higher cost and complexity. For this case, the power output was used as independent variable, since turboprops are used to provide power shaft to the propulsive system. Both the maximum static thrust and the power output are also employed by the manufacturers to characterize turbojet and turboprop engines, respectively. As mentioned in the section of EDFs, the maximum static thrust can be estimated using different approaches and assumptions (see Section 4.1.2), while the rated power that manufacturers provide is the power output at cruise conditions, according to the manufacturers themselves.
For turbojet engines, correlations to estimate their weight ( W jet [kg]), diameter ( D jet [m]), length ( L jet [ m ] ), and fuel consumption ( F C jet [mL/min]) were derived. Figure 7 illustrates the data collected; the correlation and the R 2 coefficient are presented in each subplot. The weight of the turbojet engine (Figure 7a) does not include the weight of miscellaneous components (e.g., fuel tank, additional air filters, etc.). The diameter of the engine (Figure 7b) is the outer diameter, and the length is measured from the inlet station to the end of the nozzle (Figure 7c). Most manufacturers provide the fuel consumption in [mL/min]; therefore, it was preferred to maintain the units for this parameter (Figure 7d). Figure 8 present a correlation for weight estimation of turboprop engines ( W tprop [kg]) as function of their power output ( P out [kW]). From the data collected, it was appreciated that most turboprop engines consist of a turbojet engine connected with a gearbox and a clutch. Thus, the correlations to determine the diameter and the fuel consumption of turbojet engines are also valid for turboprop ones. Finally, the regression coefficients show good fitting between the data collected and the power law model, with R 2 higher than 0.9 for all the variables depicted.

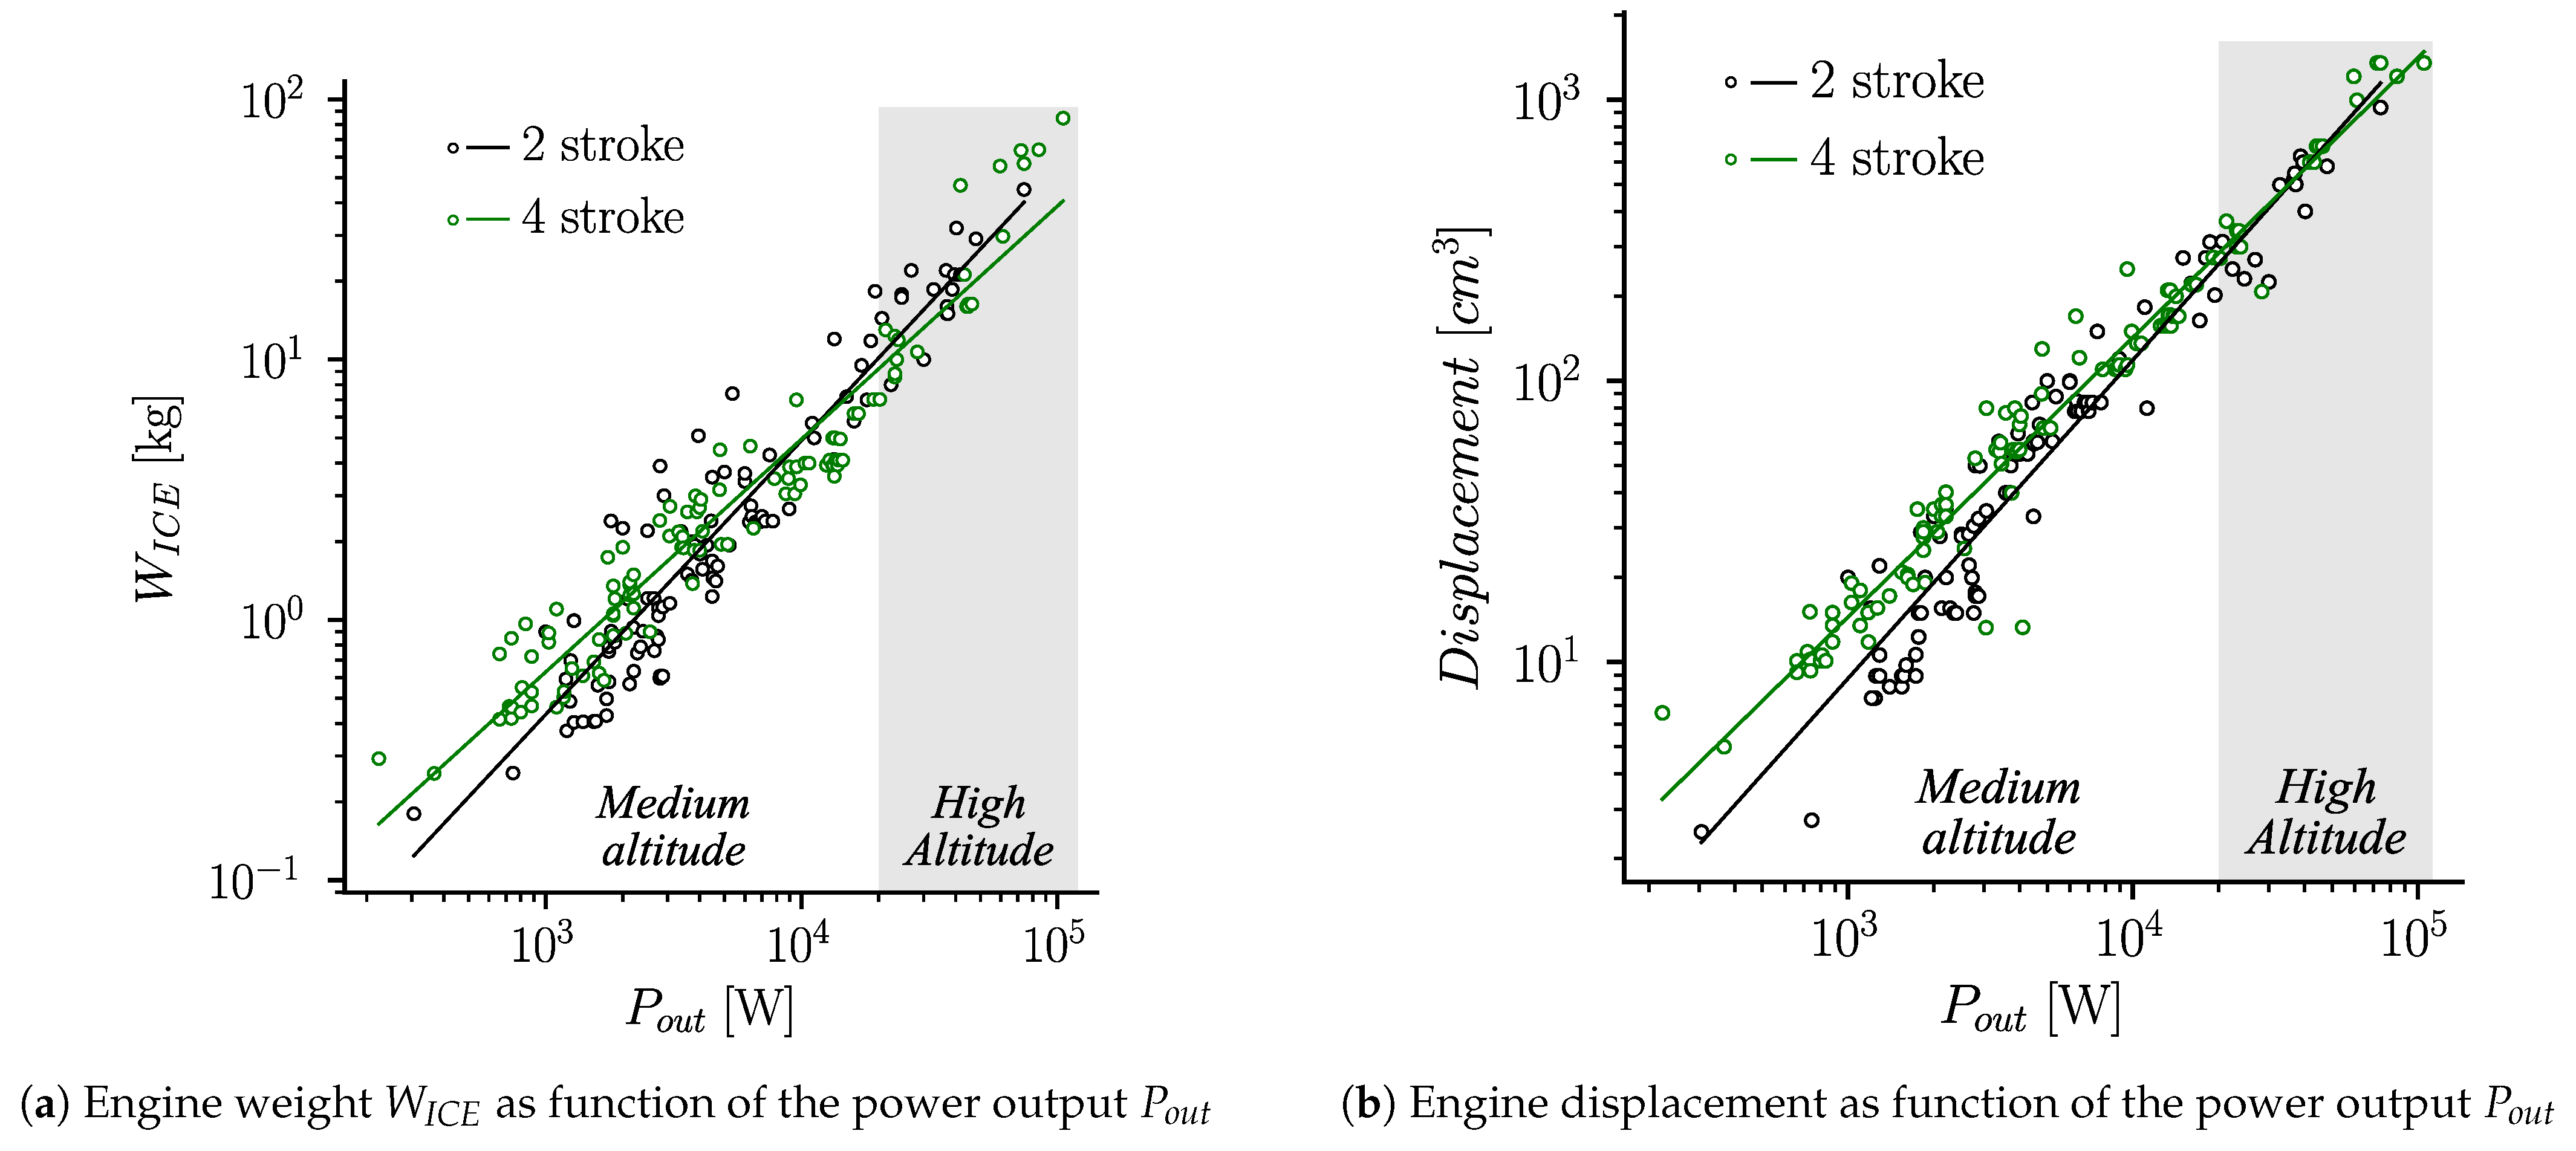
4.2.2. Internal Combustion Engines (ICE)

The low cost of these systems, compared with turbine-based engines, make them attractive for the small and MALE UAV sectors. The higher specific energy, compared with their electric counterparts, is also another reason for their use in long endurance unmanned aircraft. The thermodynamic modeling of these power machines is well documented [47,48]; however, more general parameters of the engine (e.g., weight, displacement, and power) are required at early stages of aircraft design. This section presents correlations to determine the weight and the displacement of two stroke and four stroke ICE engines. For this, a database based on off-the-shelf engines was assembled. The database cover engines from 35 manufacturers, including different configurations (e.g., single piston, V-type, and Wankel) and various fuel types (e.g., regular gasoline, AVGAS, and nitromethane). As a result, 114 two stroke engines and 113 four stroke engines were surveyed. Afterwards, correlations to estimate engine’s weight W ICE (Figure 9a and Table 4) and displacement (Figure 9b and Table 5) were derived as a function of the power output P out . These three parameters are used by manufacturers to characterize an ICE engine and are also useful for engine selection. The power output provided by the manufacturers is the power at cruise condition. From the data collected, two engine categories were identified, which are marked in Figure 9a,b. Engines located in the white zone (left of the plot) can operate at moderate altitudes (<3000 [masl]), while engines in the gray zone (right zone of the plot) have been optimized for operation at high altitudes (up to 5500 [masl] approx.). In a similar fashion to the power systems, the coefficient of correlation shows a good match between the data collected and the power law model, which enabled defining simple but accurate correlations to size ICE engines.

5. Application Examples: Electric and Fuel-Based UAVs

This section highlights the usability of the correlations and their implementation with existing methods for the design and performance assessment of electric and fuel-based UAVs.

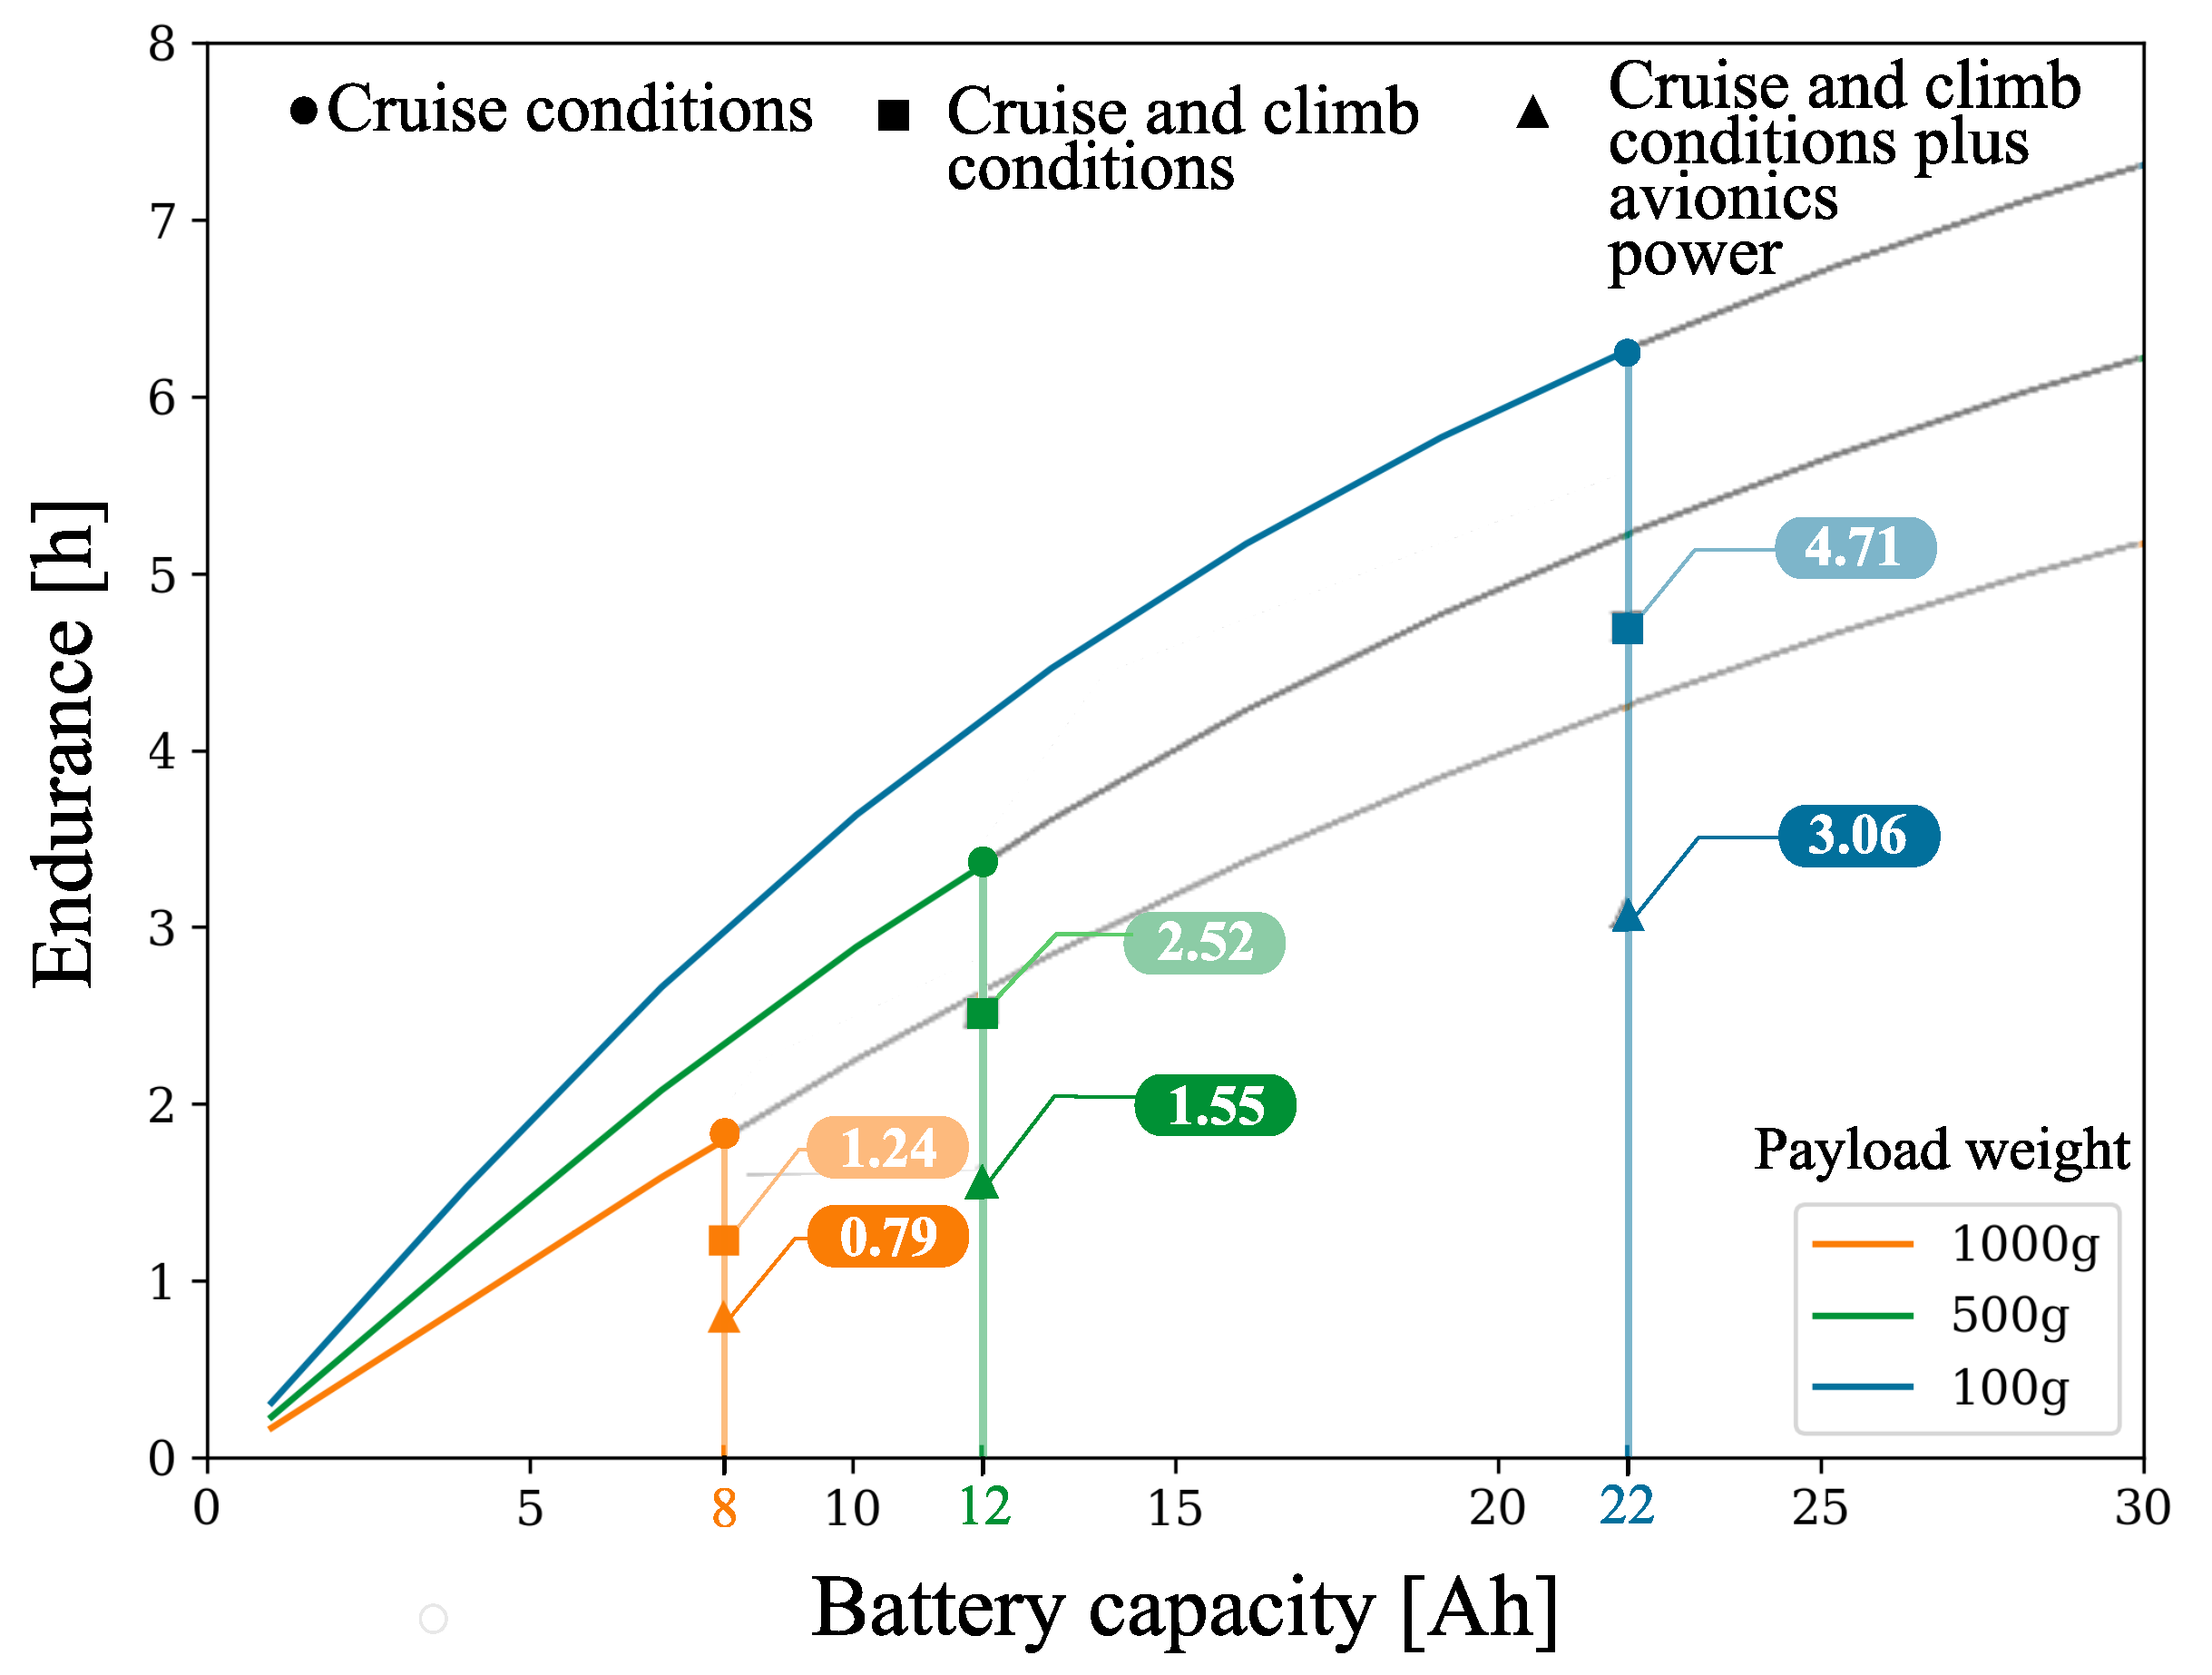
5.1. Electric-Powered UAV

This example illustrates the application of the correlations in the performance assessment of battery-powered unmanned aircraft. The Skywalker X8 UAV was defined as the baseline case because it is one of the most used commercial UAVs for mapping and monitoring missions. In addition, the Skywalker UAV offers the typical performance of a small electric fixed-wing UAV; therefore, it is a good representative case of study. For this UAV, the effect of resizing the power source (i.e., battery) on the UAV performance was evaluated. According to Traub [34], the endurance in straight level flight of a battery-powered aircraft can be calculated with Equation (3), where R t is the battery hour rating; η t o t combines the motor and propeller efficiency in a single term; V and C are the rated voltage and battery capacity, respectively; ρ is the air density; S is the wing reference area; C D o is the zero lift drag coefficient of the UAV; W is the total UAV mass; k is the induced drag factor; and n is the discharge rate, which depends on the battery type and temperature. As observed in this equation, the endurance of a battery powered UAV depends greatly on the battery parameters such as the rated voltage, capacity, discharge rate, and of course the battery mass, which also affect directly to the total UAV mass W. According to this equation, the endurance can be maximized by using batteries of higher capacity and voltage; however, this is not completely true because the battery mass W b a t t e r y and consequently the total UAV mass W is also increased proportionally to the battery capacity C b a t t e r y , according to the correlations presented in Table 2.
E = R t 1 n η t o t V C 1 2 ρ U 3 S C D o + ( 2 k W 2 ) / ( ρ U S ) n
In a previous work [49], we employed the proposed correlations to study the effect of resizing the power source of an existing UAV. A modified version of Equation (3) was also developed based on experimental measurements of the power consumed by the propulsion system, avionics, and payload. Compared with Equation (3), the modified endurance equation (Equation (4)) introduces two terms: the effective battery capacity C e f f e c t i v e and the power consumed by avionics and other electronics items P a v . The effective battery capacity is a fraction of the nominal capacity that can be employed for propulsion and the avionics power is the fraction of power that is diminished from the power source (i.e., the battery) to energize the electronic items on board the UAV, including payload, actuators, and avionics.
E = R t 1 n η t o t V C e f f e c t i v e 1 2 ρ U 3 S C D o + ( 2 k W 2 ) / ( ρ U S ) + P a v n
In Equations (3) and (4), the total UAV mass is as function of the battery mass W = W b a t t e r y + W f i x e d , considering the mass of the other components including the fuselage mass remain fixed. This exemplifies that the present correlations permit to formulate more detailed mass calculation approaches, as stated in the flowchart depicted in Figure 2. Table 6 presents the baseline parameters of the Skywalker X8 UAV, employed in this illustrative example. For this UAV, the effect of increasing the battery capacity on the UAV performance was evaluated by means of the two endurance equations discussed above. For this particular example, the correlation to determine the mass four cells (4S) Li-Po batteries were employed, since manufacturers recommend that the already installed electric motor works well with this type of batteries. The total UAV mass was calculated as function of the battery mass and the fixed mass, as mentioned above. As observed in Figure 10, three payload mass were evaluated, which correspond to typical RGB cameras used for monitoring and mapping tasks. In this study, the total UAV mass was constrained to W = 4 [kg], since this is the maximum take-off mass recommended for this UAV. Therefore, this study concentrated on determining how much the battery capacity can be increased in order to boost the UAV endurance. Figure 10 shows the effect of the battery capacity on the UAV endurance, determined through Equations (3) and (4). In this figure, the solid curved lines represent the UAV endurance determined with the original Equation (3), for each of the three payload scenarios. The solid vertical lines indicate the maximum battery capacity to satisfy the constraint imposed for the total UAV mass. The dots that intersect with the curved lines delimits the maximum battery capacity and maximum endurance that can be achieved under the imposed considerations. The square and triangular markers indicate the maximum endurance and battery capacity, respectively. However, they were obtained with the modified endurance equation (Equation (4)). As observed, the endurance estimations obtained with the original equation are very optimistic, while the values obtained with the modified equation are closer to actual endurance values, according to the authors experience with experimental flight tests.
The above example illustrates how the present correlations can be coupled with existing tools for the design and performance assessment of electric-powered aircraft. In the above example, the characteristics of the electric motor were kept fixed; however, in a more complicated case of study or design problem, the correlations to size the electric motor can be coupled easily with a detailed mass estimation model or even with a propeller performance model. This example demonstrates briefly the usability of the correlations for simple design cases and even for exploratory and optimization studies. Furthermore, their parametric nature permits implementing the correlations in any computational framework for UAV design and optimization.

5.2. Fuel-Powered UAV

This section exemplifies the use of the sizing correlations of internal combustion engines. The coupling between a propeller performance model, the engine sizing correlations, and the refined mass calculation is briefly explained. According to Gundlach [13], the sizing process of a propeller-driven propulsion system begins with the assessment of the propeller performance to determine the propeller characteristics such as the advanced ratio J, the power coefficient C p , the propeller diameter D, and the rotational speed. For this purpose, the actuator disk theory or the blade element momentum theory can be employed. With the propeller performance parameters, the power shaft can be determined with Equation (5). This power shaft corresponds to the power that the internal combustion engine must supply to the propeller. At this point, the power shaft or power output (from the engine perspective) can be used to determine general but significant characteristics of an internal combustion engine that fulfills the thrust and power requirements. For this, the correlations presented in Table 4 and Table 5 can be employed. As appreciated, the correlations provided for internal combustion engines permit determining the engine mass and displacement as function of the power shaft or power output. In these correlations, the engine type is implicit, since correlations for two and four stroke engines were developed separately. The main advantage of using the present correlations is that they were derived from off-the-shelf components widely used in UAVs, which make them more suitable for the design and analysis of different UAV categories compared with existing correlations that have been derived for large civil aircraft.
P s h a f t = C p ( J ) ρ V J 3 D 2

6. Conclusions

Series of correlations for sizing the UAV’s propulsion systems were developed based on off-the shelf components. Although the proposed correlations cover a large spectrum of UAVs, a greater emphasis was placed on vehicles ranging from micro to MALE. For the development of these models, Cook’s distance criteria were employed to reduce the dispersed data, and then, statistical analysis was performed to derive the sizing correlations following a power law. The results obtained show good agreement and satisfactory correlations indexes, which make them suitable for conceptual and preliminary design phases. The main contribution of this work lies on fulfillment of the gap in the broad spectrum of design alternatives that UAVs represent, where current models do not provide a scheme for assessing the feasibility of the propulsion configurations when using off-the-shelf components. This aspect makes the present work a useful tool to be implemented in any optimization routine for defining weight and main geometrical features of a propulsion system, accelerating the design process at early stages.

Author Contributions

Conceptualization, V.A., D.R. and E.V.; methodology, V.A., E.V. and V.H.; investigation, V.A. and E.C.; data curation, D.R. and E.C.; validation, V.A., V.H. and E.C.; formal analysis, V.A., E.V. and D.R.; writing—original draft preparation, V.A. and E.V.; writing—review and editing, V.H., E.C. and D.R. All authors have read and agreed to the published version of the manuscript.

Funding

This research was funded by Escuela Politecnica Nacional through the following grants: PIGR 19-01, PIMI 15-03, and PIMI 18-01.

Acknowledgments

The authors gratefully acknowledge the financial support provided by Escuela Politécnica Nacional through the projects PIGR 19-01, PIMI 15-03, and PIMI 18-01.

Conflicts of Interest

The authors declare no conflict of interest.

References

  1. Isikveren, A.T. Quasi-Analytical Modelling and Optimisation Techniques for Transport Aircraft Design. Ph.D. Thesis, Royal Institute of Technology (KTH), Stockholm, Sweden, 2002. [Google Scholar]
  2. Chambers, M.C.; Ardema, M.D.; Patron, A.P.; Hahn, A.S.; Miura, H.; Moore, M.D. Analytical Fuselage and Wing Weight Estimation of Transport Aircraft; Nasa Technical Memorandum 110392: Washington, DC, USA, 1996.
  3. Torenbeek, E. Synthesis of Subsonic Airplane Design: An Introduction to the Preliminary Design of Subsonic General Aviation and Transport Aircraft, with Emphasis on Layout, Aerodynamic Design, Propulsion and Performance; Springer Science & Business Media: New York, NY, USA, 1982. [Google Scholar]
  4. Roskam, J. Airplane Design; DARcorporation: Lawrence, KS, USA, 1985. [Google Scholar]
  5. Anderson, J.D. Aircraft Performance and Design; WCB/McGraw-Hill: Boston, MA, USA, 1999; Volume 1. [Google Scholar]
  6. Nield, B.N. An overview of the Boeing 777 high lift aerodynamic design. Aeronaut. J. 1995, 99, 361–371. [Google Scholar]
  7. Liebeck, R.; Page, M.; Rawdon, B. Blended-wing-body subsonic commercial transport. In Proceedings of the 36th AIAA Aerospace Sciences Meeting and Exhibit, Reno, NV, USA, 12–15 January 1998; p. 438. [Google Scholar]
  8. Torenbeek, E. Advanced Aircraft Design: Conceptual Design, Analysis and Optimization of Subsonic Civil Airplanes; John Wiley & Sons: Hoboken, NJ, USA, 2013. [Google Scholar]
  9. Bravo-Mosquera, P.D.; Cerón-Mu noz, H.D.; Díaz-Vázquez, G.; Catalano, F.M. Conceptual design and CFD analysis of a new prototype of agricultural aircraft. Aerosp. Sci. Technol. 2018, 80, 156–176. [Google Scholar] [CrossRef]
  10. Panagiotou, P.; Kaparos, P.; Salpingidou, C.; Yakinthos, K. Aerodynamic design of a MALE UAV. Aerosp. Sci. Technol. 2016, 50, 127–138. [Google Scholar] [CrossRef]
  11. Kontogiannis, S.G.; Ekaterinaris, J.A. Design, performance evaluation and optimization of a UAV. Aerosp. Sci. Technol. 2013, 29, 339–350. [Google Scholar] [CrossRef]
  12. Sóbester, A.; Keane, A.; Scanlan, J.; Bressloff, N. Conceptual design of UAV airframes using a generic geometry service. In Proceedings of the Infotech@ Aerospace, Arlington, VA, USA, 26–29 September 2005; p. 7079. [Google Scholar]
  13. Gundlach, J. Designing Unmanned Aircraft Systems: A Comprehensive Approach; American Institute of Aeronautics and Astronautics: Reston, VA, USA, 2012. [Google Scholar]
  14. Götten, F.; Finger, D.; Braun, C.; Havermann, M.; Bil, C.; Gómez, F. Empirical correlations for geometry build-up of fixed wing unmanned air vehicles. In Proceedings of the Asia-Pacific International Symposium on Aerospace Technology, Chengdu, China, 16–18 October 2018; Springer: Singapore, 2018; pp. 1365–1381. [Google Scholar]
  15. Verstraete, D.; Palmer, J.L.; Hornung, M. Preliminary Sizing Correlations for Fixed-Wing Unmanned Aerial Vehicle Characteristics. J. Aircr. 2017, 55, 715–726. [Google Scholar] [CrossRef]
  16. Gómez-Rodríguez, Á.; Sanchez-Carmona, A.; García-Hernández, L.; Cuerno-Rejado, C. Preliminary Correlations for Remotely Piloted Aircraft Systems Sizing. Aerospace 2018, 5, 5. [Google Scholar] [CrossRef] [Green Version]
  17. Gur, O.; Rosen, A. Optimizing electric propulsion systems for unmanned aerial vehicles. J. Aircr. 2009, 46, 1340–1353. [Google Scholar] [CrossRef] [Green Version]
  18. Bershadsky, D.; Haviland, S.; Johnson, E.N. Electric multirotor UAV propulsion system sizing for performance prediction and design optimization. In Proceedings of the 57th AIAA/ASCE/AHS/ASC Structures, Structural Dynamics, and Materials Conference, San Diego, CA, USA, 4–8 January 2016; p. 0581. [Google Scholar]
  19. Schoemann, J.; Hornung, M. Modeling of hybrid electric propulsion systems for small unmanned aerial vehicles. In Proceedings of the 12th AIAA Aviation Technology, Integration, and Operations (ATIO) Conference and 14th AIAA/ISSMO Multidisciplinary Analysis and Optimization Conference, Indianapolis, Indiana, 17–19 September 2012; p. 5610. [Google Scholar]
  20. Cirigliano, D.; Frisch, A.M.; Liu, F.; Sirignano, W.A. Diesel, spark-ignition, and turboprop engines for long-duration unmanned air flights. J. Propuls. Power 2017, 34, 878–892. [Google Scholar] [CrossRef]
  21. Mattingly, J.D.; Heiser, W.H.; Pratt, D.T. Aircraft Engine Design; American Institute of Aeronautics and Astronautics: Reston, VA, USA, 2002. [Google Scholar]
  22. Roux, Elodie. Turbofan and Turbojet Engines: Database Handbook; Elodie Roux: Blagnac, France, 2007. [Google Scholar]
  23. Lidor, A.; Weihs, D.; Sher, E. Novel Propulsion Systems for Micro Aerial Vehicles. J. Propuls. Power 2018, 35, 243–267. [Google Scholar] [CrossRef]
  24. Valencia, E.A.; Jimenez, D.; Alulema, V.H.; Roumeliotis, I.; Montalvan, J.; Pozo, M.; Cando, E. Modeling of a series hybrid propulsion UAV used for monitoring in the Galapagos Islands. In Proceedings of the AIAA Propulsion and Energy 2020 Forum, 24–28 August 2020; p. 3960. [Google Scholar]
  25. Griffis, C.L.; Wilson, T.A.; Schneider, J.A.; Pierpont, P.S. Framework for the conceptual decomposition of unmanned aircraft propulsion systems. In Proceedings of the 2018 IEEE, Aerospace Conference, Big Sky, MT, USA, 1–8 March 2008; pp. 1–10. [Google Scholar]
  26. Griffis, C.; Wilson, T.; Schneider, J.; Pierpont, P. Unmanned Aircraft System Propulsion Systems Technology Survey; Embry Riddle Scholarly Commons: Daytona Beach, FL, USA, 2009. [Google Scholar]
  27. Gupta, S.G.; Ghonge, M.M.; Jawandhiya, P. Review of unmanned aircraft system (UAS). Int. J. Adv. Res. Comput. Eng. Technol. (IJARCET) 2013, 2, 1646. [Google Scholar] [CrossRef]
  28. Adamski, M. Analysis of propulsion systems of unmanned aerial vehicles. J. Mar. Eng. Technol. 2017, 16, 291–297. [Google Scholar] [CrossRef]
  29. Cwojdziński, L.; Adamski, M. Power units and power supply systems in UAV. Aviation 2014, 18, 1–8. [Google Scholar] [CrossRef]
  30. Huitema, B. The Analysis of Covariance and Alternatives: Statistical Methods for Experiments, Quasi-Experiments, and Single-Case Studies; John Wiley & Sons: Hoboken, NJ, USA, 2011; Volume 608. [Google Scholar]
  31. Alulema, V.H.; Valencia, E.A.; Cando, E.; Rodriguez, D. Preliminary sizing correlations for UAVs’ propulsion system. In Proceedings of the AIAAPropulsion and Energy Forum 2019, Indianapolis, IN, USA, 19–22 August 2019; p. 10. [Google Scholar]
  32. Logan, M.; Chu, J.; Motter, M.; Carter, D.; Ol, M.; Zeune, C. Small UAV research and evolution in long endurance electric powered vehicles. In Proceedings of the AIAA Infotech@ Aerospace 2007 Conference and Exhibit, Rohnert Park, CA, USA, 7–10 May 2007; p. 2730. [Google Scholar]
  33. Gong, A.; Verstraete, D. Role of battery in a hybrid electrical fuel cell UAV propulsion system. In Proceedings of the 52nd AIAA Aerospace Sciences Meeting, National Harbor, MD, USA, 13–17 January 2014. [Google Scholar]
  34. Traub, L.W. Range and endurance estimates for battery-powered aircraft. J. Aircr. 2011, 48, 703–707. [Google Scholar] [CrossRef]
  35. Karunarathne, L.; Economou, J.T.; Knowles, K. Model Based Power and Energy Management System for PEM Fuel Cell/Li-Ion Battery Driven Propulsion System. In Proceedings of the 5th IET International Conference on Power Electronics, Machines and Drives (PEMD 2010), Brighton, UK, 19–21 April 2010. [Google Scholar]
  36. Jung, S.; Jeong, H. Extended kalman filter-based state of charge and state of power estimation algorithm for unmanned aerial vehicle Li-Po battery packs. Energies 2017, 10, 1237. [Google Scholar] [CrossRef] [Green Version]
  37. Crompton, T.P. Battery Reference Book; Elsevier: Amsterdam, The Netherlands, 2000. [Google Scholar]
  38. Fotouhi, A.; Auger, D.J.; Propp, K.; Longo, S.; Wild, M. A review on electric vehicle battery modelling: From Lithium-ion toward Lithium–Sulphur. Renew. Sustain. Energy Rev. 2016, 56, 1008–1021. [Google Scholar] [CrossRef] [Green Version]
  39. Kuhn, E.; Forgez, C.; Lagonotte, P.; Friedrich, G. Modelling Ni-mH battery using Cauer and Foster structures. J. Power Sources 2006, 158, 1490–1497. [Google Scholar] [CrossRef]
  40. Piolenc, M.; Wright, G. Ducted Fan Design: Volume 1; CreateSpace Independent Publishing Platform: Scotts Valley, CA, USA, 2015. [Google Scholar]
  41. Xia, C.l. Permanent Magnet Brushless DC Motor Drives and Controls; John Wiley & Sons: Hoboken, NJ, USA, 2012. [Google Scholar]
  42. Sforza, P.M. Commercial Airplane Design Principles; Elsevier: Amsterdam, The Netherlands, 2014. [Google Scholar]
  43. Mair, W.A.; Birdsall, D.L. Aircraft Performance; Cambridge University Press: Cambridge, UK, 1996; Volume 5. [Google Scholar]
  44. Gudmundsson, S. General Aviation Aircraft Design: Applied Methods and Procedures; Butterworth-Heinemann: Oxford, UK, 2013. [Google Scholar]
  45. Zeraoulia, M.; Benbouzid, M.E.H.; Diallo, D. Electric motor drive selection issues for HEV propulsion systems: A comparative study. IEEE Trans. Veh. Technol. 2006, 55, 1756–1764. [Google Scholar] [CrossRef] [Green Version]
  46. Hendershot, J.R.; Miller, T.J.E. Design of Brushless Permanent-Magnet Machines; Motor Design Books: Venice, FL, USA, 2010. [Google Scholar]
  47. Guzzella, L.; Onder, C. Introduction to Modeling and Control of Internal Combustion Engine Systems; Springer Science & Business Media: New York, NY, USA, 2009. [Google Scholar]
  48. Taylor, C.F. The Internal-Combustion Engine in Theory and Practice: Combustion, Fuels, Materials, Design; MIT Press: Cambridge, MA, USA, 1985; Volume 2. [Google Scholar]
  49. Valencia, E.A.; Changoluisa, D.; Alulema, V.H.; Rodriguez, D.A.; Valencia, D.; Nandar, J.; Hernandez, J.; Pozo, M.; Cruz, P.; Cando, E. Power Management Strategies for Small Electric Fixed WingUAVs Employed in Natural Resources Mapping. In Proceedings of the AIAA Propulsion and Energy 2020 Forum, 24–28 August 2020; p. 3963. [Google Scholar]
Figure 1. Propulsion systems for UAVs addressed in this work.
Aerospace 08 00171 g001
Figure 2. Schematic flowchart for implementation of empirical correlations.
Aerospace 08 00171 g002
Figure 3. Weight of unitary cells ( W c e l l ) as function of the cell capacity ( C c e l l ) [31].
Aerospace 08 00171 g003
Figure 4. Weight of LiPo batteries ( W Li Po ) as function of the battery capacity ( C battery ) [31].
Aerospace 08 00171 g004
Figure 5. Sizing correlations for EDFs from 2 to 250 [N] of maximum static thrust. n = 270 [31].
Aerospace 08 00171 g005
Figure 6. Motor constant K V motor and motor weight W motor characteristics of electric brushless motors.
Aerospace 08 00171 g006
Figure 7. Sizing correlations for turbojet engines from 20 to 10,000 [N] of maximum thrust.
Aerospace 08 00171 g007
Figure 8. Weight of turboprop engines ( W tprop ) as function of the cruise power output ( P out ) from 2 to 200 [kW]. n = 20 .
Aerospace 08 00171 g008
Figure 9. Sizing correlations for ICE engines from 200 to 100,000 W of cruise power.
Aerospace 08 00171 g009
Figure 10. Effect of battery capacity on the UAV endurance using two formulations of the endurance equation [49].
Aerospace 08 00171 g010
Table 1. Regression coefficients for unitary cells. W c e l l = A · C c e l l B [31].
TypeAB R 2 n V nominal [ V ]
Li-ion0.06350.86270.9644773.7
Li-Po0.04460.92730.96962413.7
LiFePo40.03061.00310.9918643.3
Ni-Cd0.15240.78130.9237731.2
Ni-MH0.03490.90950.9439661.2
Table 2. Regression coefficients for Li-Po batteries. W L i P o = A · C b a t t e r y B [31].
N cells 2S3S4S5S6S7S8S9S10S12S
A0.12240.19310.28280.27770.39880.86570.29750.35640.72461.0378
B0.89630.88740.87440.89930.88100.80810.95120.94430.87150.8562
R 2 0.97230.97410.97630.95090.97610.85530.95270.84230.94340.9675
n7196204401413464351214731
Table 3. Range of motor weight ( W motor [g]) as function of the voltage constant K V m o t o r (based on Figure 6).
InrunnerOutrunner
Class K V m o t o r W m o t o r [g] K V m o t o r W m o t o r [g]
I50–1001500–300050–1009000–2500
II100–500500–1500100–500300–9000
III500–5000100–500500–200050–300
IV5000–10,00030–1002000–10,00010–50
Table 4. Weight of ICE engines, regression coefficients. W I C E = A · P o u t B .
AB R 2 n
Two stroke0.00031.05300.8959114
Four stroke0.00130.89520.9300113
Table 5. Displacement of ICE engines, regression coefficients. Displacement = A · P o u t B .
AB R 2 n
Two stroke0.00351.13270.9353114
Four stroke0.01510.99400.9612113
Table 6. Skywalker X8 UAV: baseline parameters.
AerodynamicsRequirements
Wing area S [m 2 ]0.8Operating Altitude4000
Max. UAV mass [kg]4Air Density, p @4000 m.a.s.l0.8023
C D o 0.01764Cruise Altitude [m]100
Aspect Ratio, AR5.51Rate of Climb [m/s]5
Empty mass (fixed) [kg]2.5
Publisher’s Note: MDPI stays neutral with regard to jurisdictional claims in published maps and institutional affiliations.

