Article

Effect of the Reynolds Number and Clearance Flow on the Aerodynamic Characteristics of a New Variable Inlet Guide Vane

Institute for Aero Engine, Tsinghua University, Beijing 100084, China
Aerospace 2021, 8(7), 172; https://doi.org/10.3390/aerospace8070172
Submission received: 9 May 2021 / Revised: 10 June 2021 / Accepted: 16 June 2021 / Published: 25 June 2021

Abstract

:
Recently, a new type of low-loss variable inlet guide vane (VIGV) was proposed for improving a compressor’s performance under off-design conditions. To provide more information for applications, this work investigated the effect of the Reynolds number and clearance flow on the aerodynamic characteristics of this new type of VIGV. The performance and flow field of two representative airfoils with different chord Reynolds numbers were studied with the widely used commercial software ANSYS CFX after validation was completed. Calculations indicate that, with the decrease in the Reynolds number R e c , the airfoil loss coefficient ω and deviation δ first increase slightly and then entered a high growth rate in a low range of R e c . Afterwards, a detailed boundary-layer analysis was conducted to reveal the flow mechanism for the airfoil performance degradation with a low Reynolds number. For the design point, it is the appearance and extension of the separation region on the rear portion; for the maximum incidence point, it is the increase in the length and height of the separation region on the former portion. The three-dimensional VIGV research confirms the Reynolds number effect on airfoils. Furthermore, the clearance leakage flow forms a strong stream-wise vortex by injection into the mainflow, resulting in a high total-pressure loss and under-turning in the endwall region, which shows the potential benefits of seal treatment.

1. Introduction

Variable inlet guide vanes (VIGVs) are widely used in turbo-machinery to provide the desired flow angle into the downstream rotor [1,2,3], which can improve the compressor efficiency and stall margin under off-design conditions. As the stagger angle increases, the VIGV enters into a high incidence condition, and the loss coefficient starts to increase rapidly, which is detrimental to the compressor’s efficiency. Therefore, some researchers proposed a new type of VIGV featuring a “dual-peak” surface velocity distribution under a high-incidence condition, which shows a wide low-loss operation range in two- and three-dimensional environments [4,5]. Related research has indicated that the chord Reynolds number and clearance flow can have an important influence on the compressor blade’s aerodynamic performance [6,7]. Therefore, to reveal the influence pattern for better applications of this new type of VIGV, this paper studies the effect of the Reynolds number and clearance flow on these “dual-peak” VIGV aerodynamic characteristics.
The chord Reynolds number R e c has been known from early research to be one of the factors that have an important impact on the airfoils’ aerodynamic performance [6]. In the 1950s, low-speed experiments on the compressor blade 10C4/40 P40, Lighthill blade, and NACA 65 series airfoil indicated that the airfoil loss coefficient shows a steep increase after the Reynolds number R e c decreases to a certain value, and in doing so confirmed the existence of critical Reynolds numbers [8,9,10]. However, it appears that no constant critical Reynolds number can hold for different airfoils [6], and the degradation in aerodynamic performance seems to be more remarkable for airfoils with a larger laminar boundary-layer at the design point (e.g., the Lighthill blade) [9]. Qualitative flow analysis indicates that a steep increase in the loss coefficient due to a low Reynolds number is related to the inception of boundary-layer separation [6]. The airfoil with a larger laminar region at the design point shows more serious performance degradation, due to the larger laminar separation under a low Reynolds number [6]. In addition, for a certain airfoil, the higher free-stream turbulence intensity leads to a lower critical Reynolds number [6,9], which is due to the earlier boundary-layer transition at a higher turbulence intensity.
Recent research has provided more flow details for the Reynolds number effect. In the 2000s, the high-speed experiments on a controlled diffusion airfoil conducted by Schreiber et al. [11] showed that, at a low turbulence intensity, a laminar separation bubble shortly after the maximum velocity (near 35–40% of the chord) on the suction surface could be observed for all Reynolds numbers in the tested range ( 0.7 ~ 3.0 × 10 6 ) [11]. However, they also found that the transition point moves to the acceleration front portion at a high turbulence intensity with a high Reynolds number [11]. In 2004, Sonoda and Schreiber et al. optimized the stator airfoil’s performance with a low Reynolds number by using the evolution strategy (ES) and multi-objective genetic algorithm (MOGA). The two obtained advanced compressor airfoils featured very early boundary-layer transitions (induced by an adverse pressure gradient around the leading edge), which reduced the separation flow with a low Reynolds number and obtained excellent aerodynamic performance [12,13]. This research showed the advantage of airfoil flow customization design through geometry optimization. In 2013, an experimental and numerical study (via ANSYS CFX) on a symmetric VIGV airfoil with R e c = 1.0 ~ 7.0 × 10 5 by Handel and Barthmes indicated a critical Reynolds number of 2.0 × 10 5 at β s = 90 o ,   80 o ,   and   70 o because of the inception of a separation region [14,15]. The reason for the over-turning phenomenon with a low Reynolds number was revealed and explained by the increase in the effective camber due to the boundary-layer thickening [14,15]. To further improve the low-Reynolds number airfoil’s performance, in 2019, Yang et al. used local dynamic surfaces as an active flow control method to suppress the laminar flow separation on the suction surface in a turbine cascade under a low Reynolds number [16]. In 2020, a novel passive control method was proposed by Arif et al. [17], which involved setting a short elastic panel flush mounted on the suction surface of an NACA 0012 airfoil under a low Reynolds number and showed the effectiveness of tonal noise reduction by the absorption of the energy of natural instabilities that evolve in the laminar boundary layer. In 2021, research on the surface roughness effect in a subsonic compressor airfoil conducted by Wang et al. [18] via simulations indicated that the surface roughness determined the loss generation process under a low Reynolds number by affecting the laminar separation bubble structure and the near-wall turbulence level.
The Reynolds number’s effect is different due to the difference of the aerodynamic design feature of airfoils. Most of the aforementioned works focused on the compressor airfoil or wing airfoil. Therefore, to provide more information on using this “dual-peak” cambered VIGV, this paper discusses the effect of the Reynolds number R e c and the clearance flow. Numerical calculations were successfully applied in aerodynamic field research [15,18,19], and, with proper setups, a good match with experimental results was obtained, providing a convenient method for systematic research. In this paper, firstly, the effect of the Reynolds number on the performances and boundary-layer behaviors of two “dual-peak” VIGV airfoils is explored using CFX with the RANS method after verification with experimental data. To reveal the related flow mechanism, a boundary-layer analysis is conducted on the transition location, inception, and re-attachment locations of separation to explain the airfoil performance variation. The three-dimensional research confirms the Reynolds number effect observed in plane airfoil research. The loss coefficient of the small-chord VIGV (halved Reynolds number) in the main blade part is significantly higher than that of the normal-chord version at the high stagger angle points. In addition, the leakage flow will form strong stream-wise vortex, generating a high total-pressure loss in the hub and tip regions, which shows the potential benefit from seal treatment.

2. Airfoil Samples and Evaluation

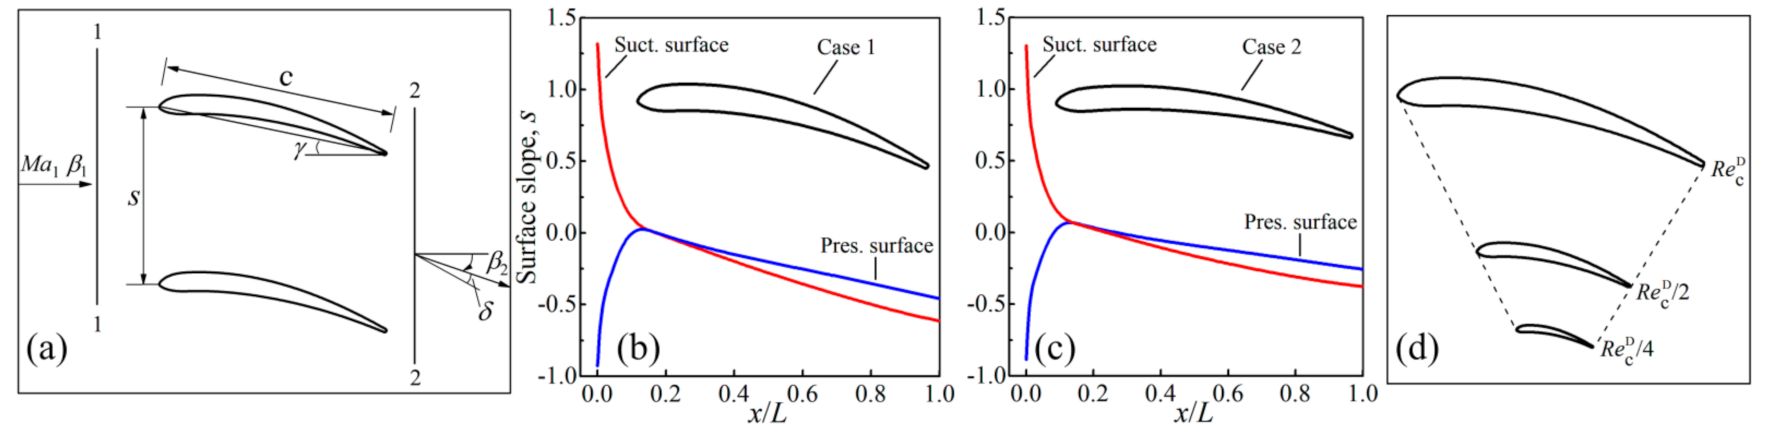
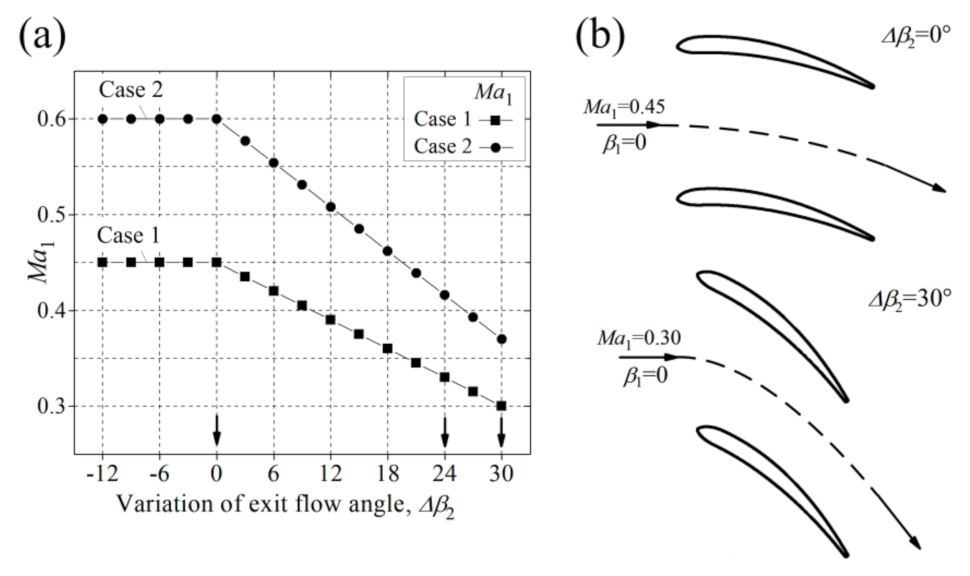
2.1. Research Samples

Two representative “dual-peak” VIGV airfoils (parameters given in Table 1) that show a minimum loss coefficient [5] were chosen to be researched here. The parameter definitions and geometry are shown in Figure 1a–c. The research range of chord Reynolds number (the last line of Table 1) is designed to cover the typical range that a VIGV can encounter in an application environment. The chord Reynolds number R e c is defined by
R e c = ρ U 1 c / μ 1
The ρ , U 1 , and μ 1 in Equation (1) are density, velocity, and dynamic viscosity of inflow, respectively. In this paper, the variation of chord Reynolds number R e c is achieved by scaling the airfoil chord as shown in Figure 1d.
Figure 2a shows the operation schedule for performance evaluation. The anticipated exit flow angle at each operation point was acquired by setting the airfoil stagger angle as shown in Figure 2b. To evaluate the airfoil performance, the total-pressure loss coefficient and deviation at the design point ( Δ β 2 = 0 ° ), high incidence ( Δ β 2 = 24 ° ), and maximum incidence ( Δ β 2 = 30 ° ) were used. The axial-velocity-density ratio was set to 1.0 for the two-dimensional research.

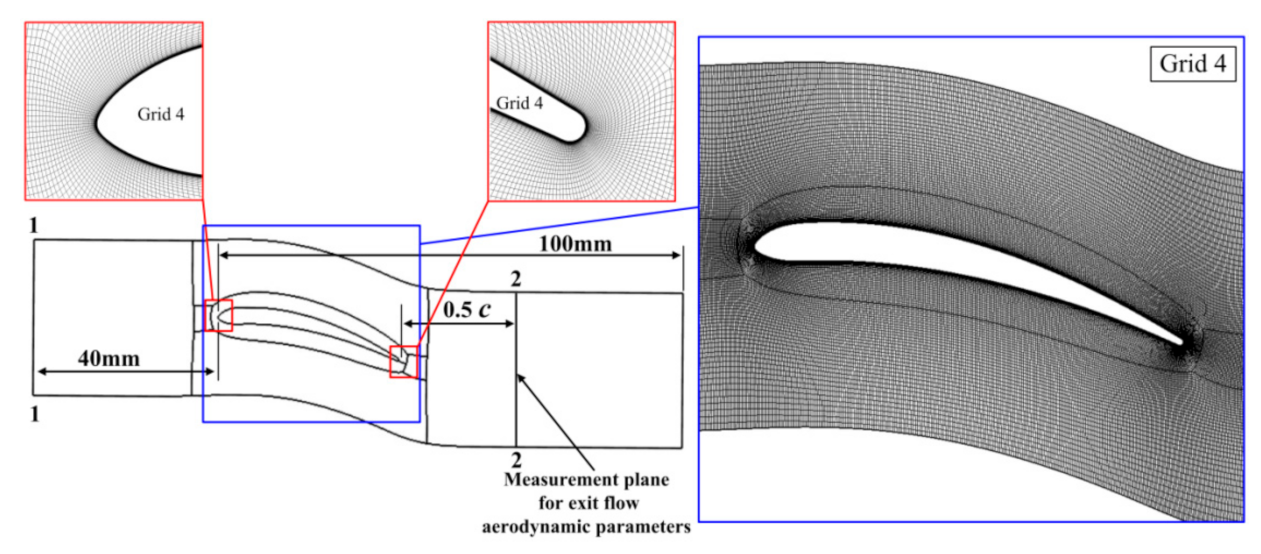
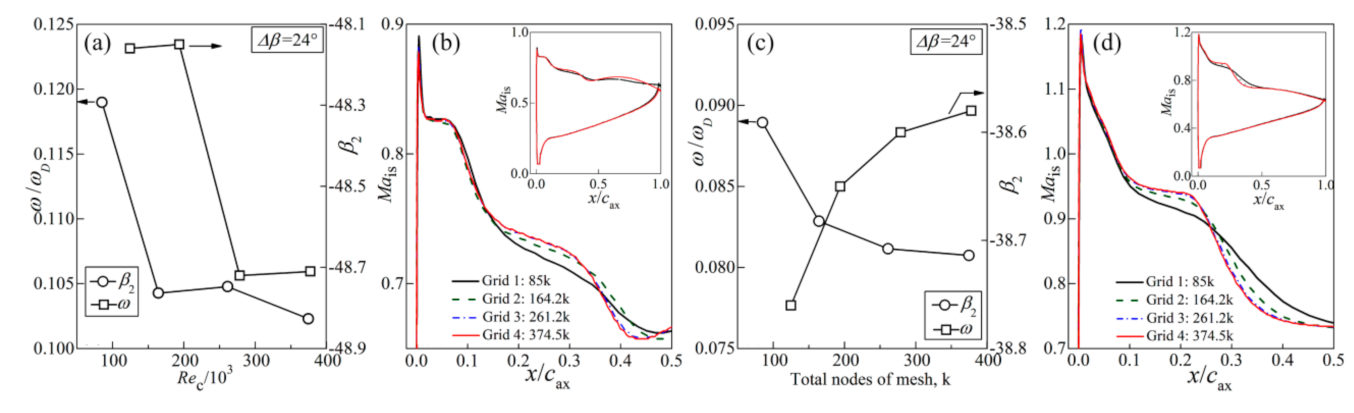
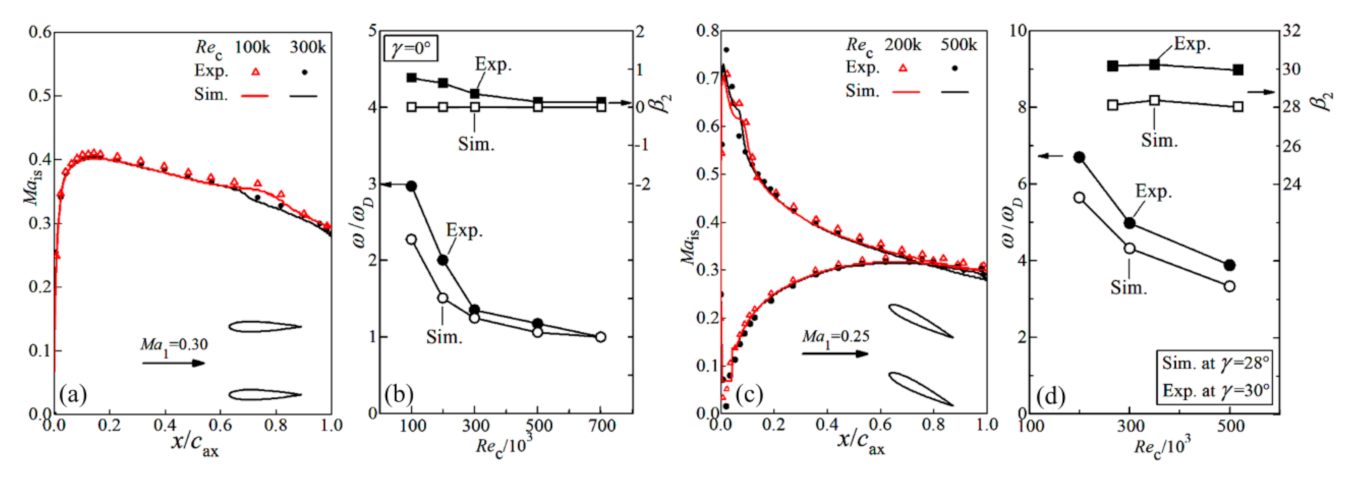
2.2. Numerical Method and Verification

To obtain the aerodynamic performance of the airfoils, steady simulations based on the Reynolds-Averaged Navier-Stokes (RANS) method were carried out by a widely used commercial solver, ANSYS CFX. For the setups, the high-resolution advection scheme, the SST turbulence model [20], and the γ R e θ transition model [21] were used. The physical timescale was used and set to 0.0005 s. An RMS of the residuals below 10 6 was used as the numerical convergence criteria.
The mesh for simulations had an O4H multi-block topology (Figure 3), generated with the IGG software package [22]. The inlet and outlet plane were located at   x = 40   and   100   mm , respectively. The LE plane of all airfoils were fixed at x = 0 . The stream-surface thickness was set to 0.5 mm with five equally spaced nodes. To determine the proper grid size, a grid independence test was conducted (Grids 1–4 in Table 2). For all grids, the blade surface wall cell height was set to 0.0008 mm to yield an average value of y + < 1 . The wall cell height expansion ratio was set to 1.10 to increase the grid density around the blade. As shown in Figure 4, in general, with the increase in mesh nodes, the variation of profile loss coefficient ω , outflow angle β 2 , and surface isentropic Mach number M a is gradually became smaller. The very close results between Grid 3 and 4 indicate that the mesh convergence was reached by Grid 3 (Figure 4).
As a further verification, a symmetric VIGV cascade (has a maximum relative thickness of 15% and solidity of about 1.0) with abundant measurement data from tests by Handel et al. [14] was simulated at a different Reynolds number R e c by using Grid 4 and comparing it with the experimental results. As shown in Figure 5, a good match between the simulated and experimental surface isentropic Mach number was observed. The expansion of the suction surface laminar separation bubble with the reduction in Reynolds number R e c (from 300 to 100 k) at the design point were well captured (Figure 5a). The increasing trend of the LE separation plateau and the reduction trend of the spike Mach number (from 500 to 200 k) at the high incidence point were also predicted by the simulation, but the magnitude of the pressure plateau and suction spike was slightly underestimated because of the slightly lower stagger angle relative to the experiment (the simulation at γ = 30 ° was found with a fully detached flow at low Reynolds numbers of 100 k and 200 k, so γ = 28 ° was used in the simulation [15]).
For aerodynamic parameters, the variation trend of relative loss coefficient ω / ω D by simulation was consistent with the experimental results (Figure 5b,d), but some underestimation at conditions with the appearance of flow separation was observed. The variation trend of the outflow angle β 2 at γ = 30 ° was also reflected by the simulation (the value is approached if corrected by 2 deg, the difference of stagger angle). In general, the numerical method with the above setups can predict crucial phenomena such as the expansion of the laminar separation bubble and the variation trend of the loss coefficient with acceptable accuracy, which can be used in the following numerical calculations.

3. Two-Dimensional Research: Airfoils

3.1. Loss Coefficient and Deviation

As shown in Figure 6 and Figure 7, the variation of the Reynolds number R e c has significant impact on airfoil performance. With the reduction in the Reynolds number, the airfoil loss coefficient ω and deviation δ first increase slightly and then enters a high growth rate in the low range of R e c . For Case 1 ( M a 1 = 0.45 ) and Case 2 ( M a 1 = 0.60 ), the Reynolds number, corresponding to the rapid performance degradation, is about R e c = 1.5 × 10 5 for the design point and 2.0 × 10 5 for high incidence and max incidence (marked by the arrows).

3.2. Flow Mechanism: Pattern of Transition and Separation

To reveal the flow mechanism behind the effect of chord Reynolds number R e c , this section will focus on the boundary-layer behaviors and flow field with emphasis on the key flow phenomena. In the analysis, the skin friction coefficient C f was used to determine the location and scale of boundary-layer separation, which is calculated by
C f = μ u / y wall / 0.5 ρ 1 u 1 2 inlet   main   flow
The relative momentum thickness δ 2 / c measures the momentum loss of boundary-layer and can be used to evaluate the generation of total-pressure loss [7], which is defined by
δ 2 / c = 0 δ 0 u U B C 1 u U B C / c
  • Design Point ( Δ β 2 = 0 ° )
The design point ( Δ β 2 = 0 ° ) and maximum incidence point ( Δ β 2 = 30 ° ) are two important operation points. Figure 8 shows the evolution of the suction surface boundary layer with a change in the chord Reynolds number R e c . Figure 9 compares the important boundary-layer parameter distribution of Case 1 at 4 Reynolds number (SP1 to SP4). As shown in Figure 8, the effect of the Reynolds number R e c on boundary-layer development at the design point can be divided into two phases: the laminar transition phase and the laminar separation phase.
I. Laminar transition phase. In the high Reynolds number range ( R e c > 2.6 × 10 5 for Case 1, and > 3.2 × 10 5 for Case 2), the suction surface boundary layer keeps a laminar state from the LE stagnation point to the initial point of transition x Tr . Inp . . With the reduction in the Reynolds number Re c , the initial point x Tr . Inp . and the accomplished point x Tr . Acp . of the transition region both move towards TE nearly linearly. Therefore, the length of the turbulent boundary-layer region L Tur . decreases 17.2% in chord for Case 1 and 12.8% in chord for Case 2, which tends to reduce the loss level. However, on the other side, according to the boundary-layer equation [7] (which can also be observed by comparing SP1 and SP2 in Figure 9c), the reduction in Reynolds number Re c will lead to a thicker momentum thickness δ 2 / c of the laminar boundary-layer portion, namely, increasing the loss level. The antagonism between the two factors (the length of the turbulent portion and the thickness of the laminar portion) explained why the airfoil performance is not sensitive to the Reynolds number in this phase.
II. Laminar separation phase. Once the chord Reynolds number Re c reduces to a certain value ( 1.9 × 10 5 for Case 1, and 2.4 × 10 5 for Case 2), the laminar separation occurs and becomes the dominant factor affecting the loss level. As shown in Figure 8, with the reduction in the Reynolds number R e c , the laminar separation inception point x Inp . moves upstream towards LE; meanwhile, the re-attachment point x Ret . moves downstream towards TE, leading to a rapid increase in the laminar separation length L LAS . and the momentum thickness δ 2 / c (Figure 8 and Figure 9c). This explains the high growth rate of the loss coefficient in the low Reynolds number range (Figure 6).
  • Maximum incidence ( Δ β 2 = 30 ° )
For the maximum incidence ( Δ β 2 = 30 ° ), Case 1 ( M a 1 = 0.45 ) is found to have a complex separation pattern with 3 phases: LE separation, LE and secondary separation, and secondary separation (Figure 10a):
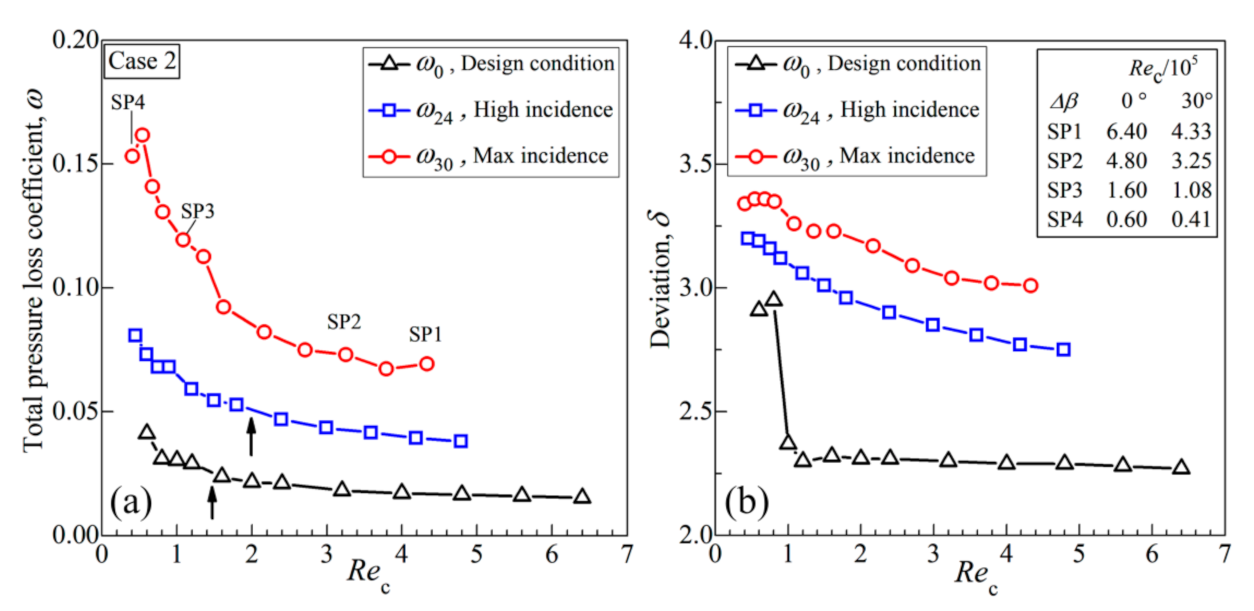
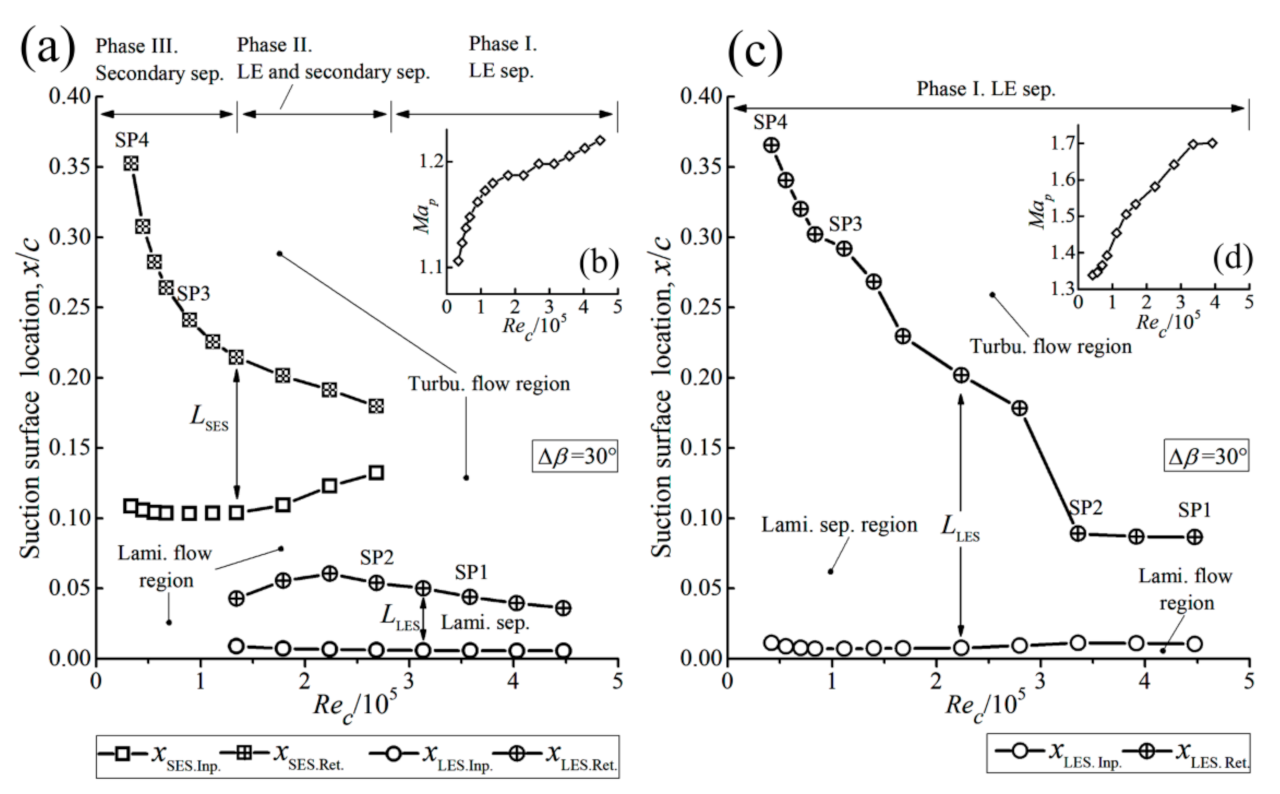
  • LE separation. In the high Reynolds number range ( R e c > 2.7 × 10 5 ), a laminar separation region is formed in the LE region due to the adverse pressure gradient behind the LE suction spike. Although the reduction in the Reynolds number R e c in this phase is considerable ( 4.5   to   2.7 × 10 5 ), the length of the LE separation L LES only shows a slight increase of 2.4% in chord length, so the growth rate of the loss coefficient is low in this phase (Figure 10a).
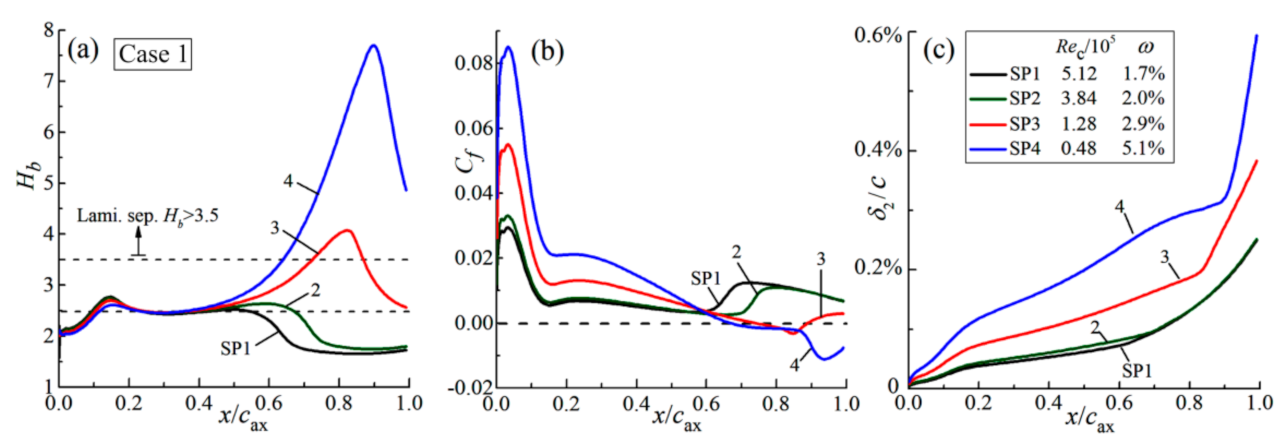
  • LE and secondary separation. In the intermediate Reynolds number range ( 1.3 × 10 5 < R e c < 2.7 × 10 5 ), a secondary separation region appears at about 15% chord location, on the suction surface (Figure 10a). The boundary-layer separation region identified by the laminar separation criteria, i.e., shape factor H b > 3.5 (Figure 11a), fits well with the range identified by the skin friction coefficient C f (Figure 11b), which indicates that it is a laminar separation. In this phase, with the reduction of R e c , the LE laminar separation region decreases 1.4% in chord length; meanwhile, the secondary laminar separation region extends 6.3% in chord length, so the airfoil loss coefficient keep increasing with a rate higher than phase I.
  • Secondary separation. In the low Reynolds number range ( R e c < 1.3 × 10 5 ), it is found the LE laminar separation disappears. This is because the relative thickness of boundary layer ( δ 1 / c ) will be larger at low Reynolds number and this changed the effective aerodynamic shape of the airfoil (Figure 12a), which results in lower peak Mach number M a p (Figure 10b). The decreased peak Mach number reduces the strength of subsequent adverse pressure gradient, and then the LE laminar separation disappears. As shown in Figure 10a, with the reduction of Reynolds number R e c from 1.3   to   0.3 × 10 5 , the separation inception point x SES . Inp . remains nearly constant, but the re-attachment point x SES . Ret . moves towards downstream from x = 0.21 to x = 0.35 , leading to a rapid extension of the separation region. In addition, the strength and height of the boundary-layer velocity loss is also significantly increased (comparing SP3 with SP4 in Figure 12b). These two factors (the increase in the length and height of the laminar separation region) causes the high growth of the loss coefficient in this phase (Figure 10a).
For Case 2, with a higher Mach number M a 1 D = 0.60 , the flow separation pattern has only one type: LE separation (Figure 10c). There is an “insensitive range” ( R e c > 3.4 × 10 5 ) where the LE laminar separation length L LES is almost unaffected by the Reynolds number (Figure 10c). However, once the Reynolds number R e c < 3.4 × 10 5 , the growth rate of the loss coefficient substantially increases due to the rapid increase in length and height of LE laminar separation region, which is same to Case 1.

4. Three-Dimensional Research: VIGV for High Pressure Compressor

4.1. Methodology

Compared with airfoil flow, the three-dimensional flow in the guide vane is more complex because of the flow property variation in the radial direction, interactions between adjacent stream surfaces, and the endwall effect. This section focuses on the effect of the Reynolds number and the clearance flow on the VIGV in a three-dimensional environment.
The dual-peak VIGV with an optimized LE portion, given in previous paper [5], was used as the blueprint to obtain the small-chord version by scaling the airfoils from root to tip with a constant ratio of 0.5 (Figure 13a,b). The numerical calculations in this part are conducted by the software ANSYS CFX with a steady and unsteady RANS method. The high-resolution advection scheme, the SST turbulence model [20], and the γ R e θ transition model [21] are used. The shroud and hub are the same for the normal- and small-chord VIGVs. To consider the influence of leakage flow, the tip and hub clearances are designed to a gap of 0.5 mm at a minimum state (Figure 13c). Pure axial flow with a total pressure of 101.325 kpa and a total temperature of 288.15 k is used as the inlet boundary condition. The mass flow rate is specified as the outlet boundary condition. For the unsteady RANS calculation (URANS), the numerical converged RANS result is used as the initial values to start the calculation. The same simulation mesh is used in the RANS and URANS calculations. The mesh has an O4H topology with a total node of 4971.9 k (Figure 14). For one layer, the mesh has 377 stream-wise nodes (233 on the profile surface) and 81 pitch-wise nodes (53 across the O-block). To research the Reynolds number and clearance flow effect on the three-dimensional VIGV performance in the entire operation range, five operating points from a design condition (P1) to a high stagger angle condition (P5) are calculated (Table 3).

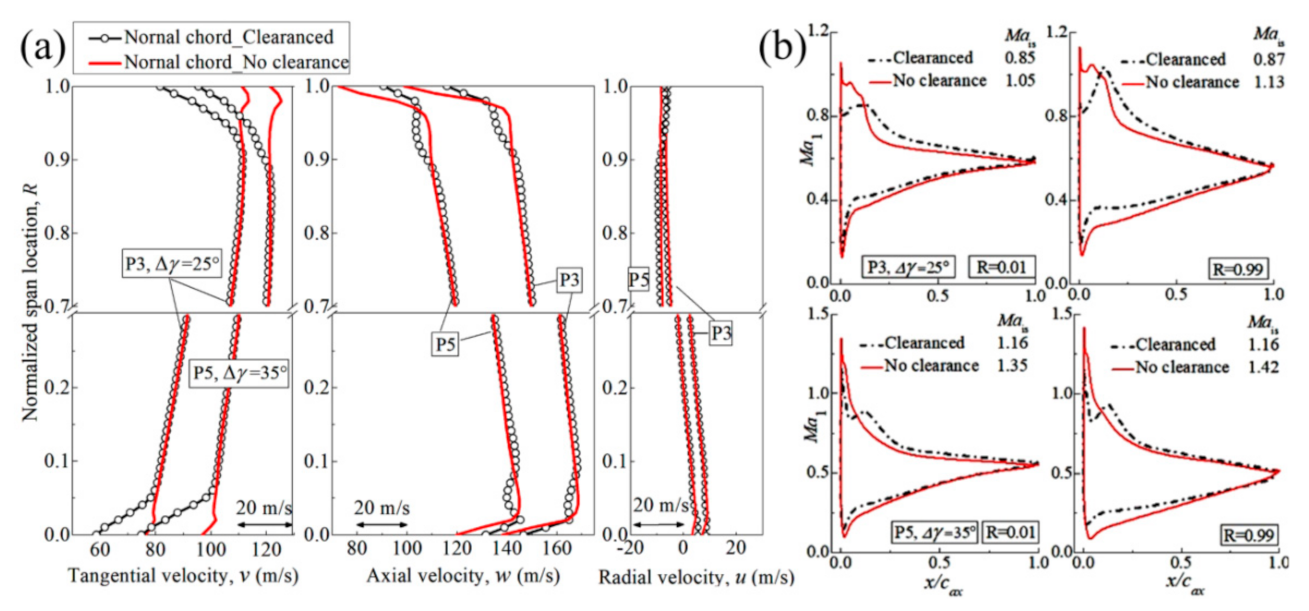
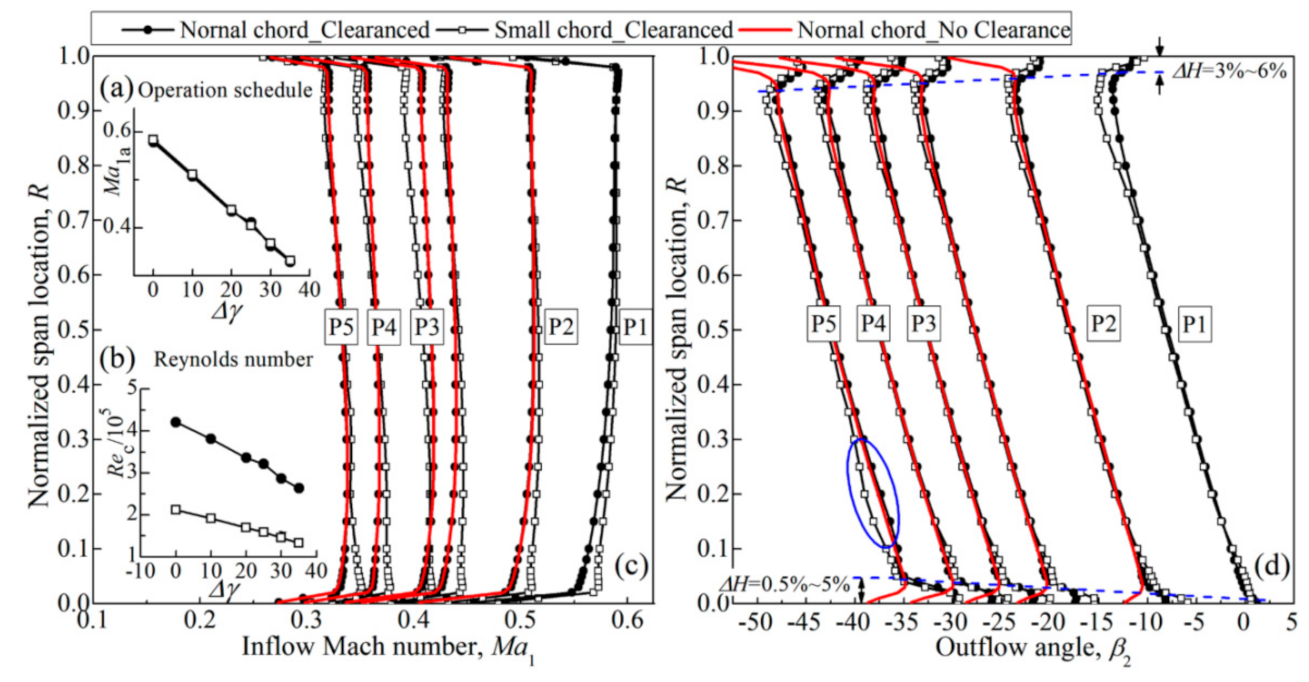
4.2. Reynolds Number Effect in Three-Dimensional VIGV

Figure 15 shows the operation schedule, Reynolds number, the radial distribution of the inlet Mach number M a 1 , and the outflow angle β 2 of the normal (×1.0) and small-chord versions (×0.5) at each operation point (same as Schedule 1 in [5]). The Reynolds number R e c at the mid-span ( R = 0.5 ) of the normal-chord VIGV is 4.2 × 10 5 at the design point and varied to 2.6 × 10 5 at the high stagger angle point P5. With a chord scale of 0.5, the Reynolds number R e c of the small-chord version is halved (Figure 15b).
The inlet Mach number M a 1 of the two versions are very close with a difference within 0.01 at most of the blade span (Figure 15c). The slightly higher inlet Mach number M a 1 in the root part ( R = 0 ~ 0.1 ) of the small-chord VIGV is caused by the contraction of the flow path because its inflow measurement plane ( x = 10   mm ) is 10 mm towards the downstream relative to the normal-chord version.
As shown in Figure 16a–e, the small-chord version (lower Reynolds number) has a higher loss coefficient ω in the main blade part ( R = 0.1 ~ 0.85 ), especially at the high stagger angle points (P4 and P5). Specifically, the averaged loss coefficient of the small-chord VIGV in the main part ( R = 0.1 ~ 0.85 ) is 44.3% and 80.5% higher than the normal-chord version at P4 ( Δ γ = 30   deg ) and P5 ( Δ γ = 35   deg ), respectively. The unsteady RANS (URANS) calculation confirms the effects of the chord Reynolds number reduction and clearance flow on the total-pressure loss level (Figure 16d–f). However, the specific loss coefficient distribution along the blade span is different from the RANS method. For example, the magnitude of the loss coefficient bulges (around R = 0.2   and   0.4 ) are reduced in the URANS calculation (Figure 16e), which reflects that the radial flow mixing is stronger in the URANS calculation.
For the flow guidance ability, the small- and normal-chord versions are almost the same in the mainflow region ( R = 0.1 ~ 0.85 ) except at the operation point P5 (Figure 15d). The small-chord version shows a 1.6° over-turning relative to the normal-chord version around span height R = 0.2 . Flow visualization indicates this flow over-turning is induced by the increase in effective camber due to the boundary-layer thickening around the former suction surface.
However, in the near-wall region (hub region R = 0 ~ 0.05 ; tip region R = 0.95 ~ 1 ), the loss level of the normal-chord version is higher than the small-chord version (the enlarged drawings in Figure 16a–e), which is because of the stronger leakage flow due to the larger clearance at LE and TE. The net effect of the mainflow and endwall regions are given in Figure 16f. The passage-averaged total pressure recovery coefficient σ of the small-chord VIGV shows a higher value with 0.12 and 0.36% at operating points P1 and P5, relative to the normal-chord version, which indicates that the reduction in the Reynolds number can cause considerable degradation in three-dimensional VIGV performance, especially at the high stagger angle.

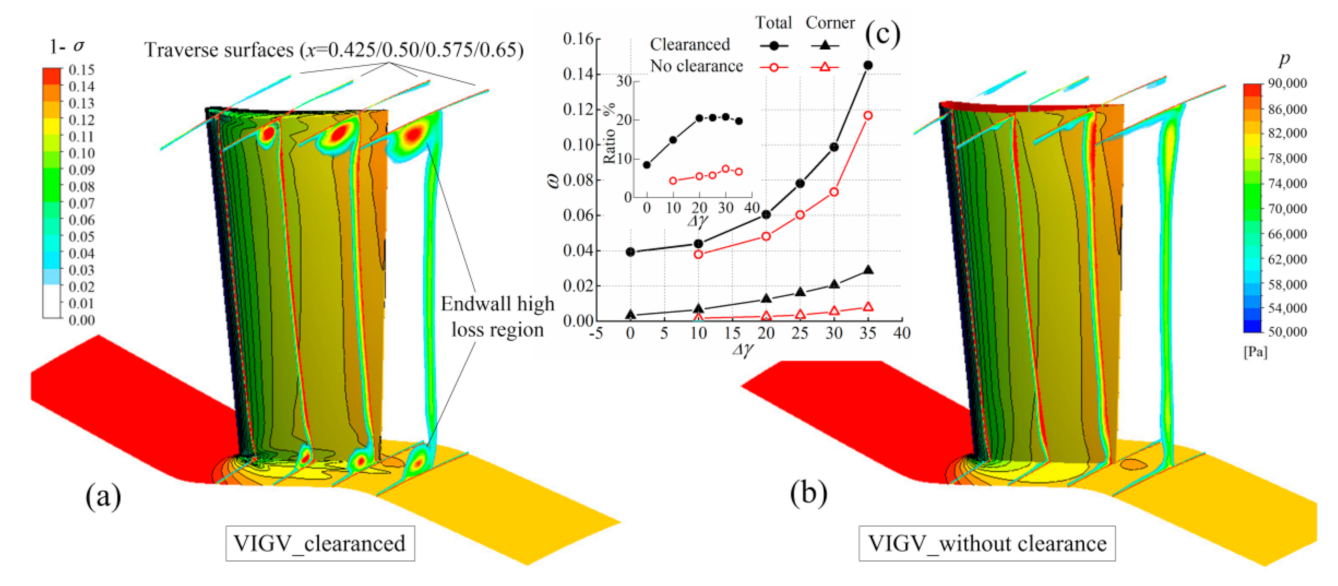
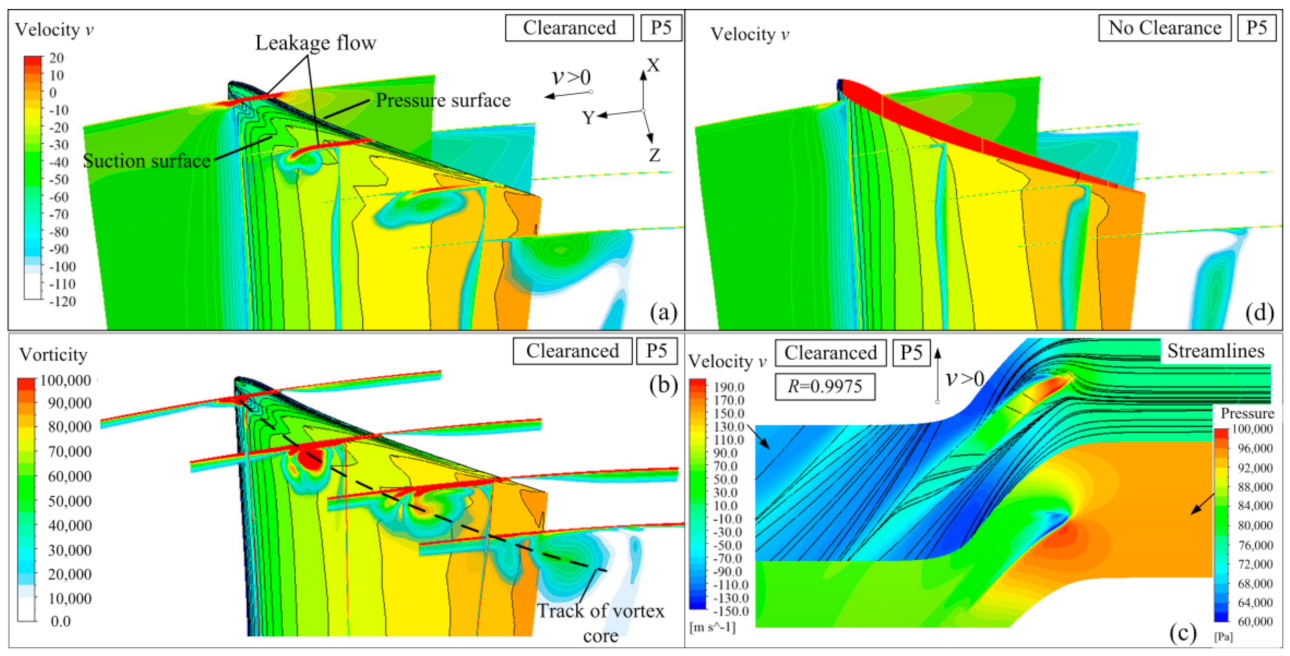
4.3. Impact of Endwall Leakage Flow

To reveal the impact of the leakage flow, Figure 16 displays the calculated results of the normal-chord VIGV without clearance. For all simulated operation points, the influence range of the clearance flow is the endwall region, namely, R = 0 ~ 0.1 at the hub and 0.85 ~ 1.0 at the tip (Figure 16 ) . The clearance VIGV has a much higher loss coefficient the endwall region (Figure 16b–e), which leads to a 0.2 percentage reduction in total-pressure recovery coefficient σ at the high stagger angle points (P4 and P5). Flow visualization shows that the entropy production in the leakage flow vortex forming and mixing with the mainflow leads to the high total-pressure loss in the corner region (Figure 17 and Figure 18). Furthermore, the total-pressure loss decomposition (to (1) the profile loss, (2) the endwall loss due to friction, (3) the corner loss due to leakage flow and the intersection of the vane and the wall boundary layer), by the method of Meyer and Engel [23], indicates that the proportion of corner loss increases from the design point to the high stagger angle point and is significantly larger with the existence of leakage flow. From operation point P2 to P5, the ratio of corner loss to total loss is about 4.3–6.7% in the VIGV without clearance and increases to 14.9–19.8% in the VIGV with clearance. As shown in Figure 18a, the leakage flow, driven by the blade surface pressure difference, shows a rapid increase in tangential velocity v at the edge of the pressure surface (pressure potential energy into kinetic energy) and injects into the suction side mainflow, generating a strong, anti-clockwise axial vortex (Figure 18b). Because of the decreased pressure difference from LE to TE, the strength of the clearance flow gradually reduces towards TE (Figure 18a,c). These results indicate the potential benefit in the loss reduction from seal treatment applications and that it should be placed in the former portion of the VIGV.
For the outflow angle, the VIGV with and without clearance are totally different near the endwall region (marked by the dashed line in Figure 15d). The VIGV with clearance shows insufficient turning (in other words, a large deviation) near the endwall region ( Δ H = 0.5 % ~ 5 %   for   hub ; Δ H = 3 % ~ 6 %   for   tip ) because of the loss of the tangential velocity v caused by the clearance leakage flow (Figure 19a). For the VIGV without clearance, the tangential velocity v in the endwall region is close to the design value (Figure 19a), but the axial velocity w is rapidly decreased (Figure 19b) because of the endwall boundary layer, which leads to the over-turning of the outflow (about 3% blade height for hub and 4% for shroud).
For the surface pressure distribution, two major differences exist. First, in the VIGV with clearance, the LE suction peak collapses (evaluated by the M a p , decreased by about 20%) compared with the VIGV without clearance. This can be illustrated by considering the clearance as a communication passage that unloads the pressure difference around the leading-edge region (Figure 18a–c), resulting in the collapse of the suction spike. Second, in the VIGV with clearance, a low-pressure region appears on the former suction surface (peak at x / c = 15 % , Figure 19b), which is induced by the accumulation of the high velocity leakage flow.

5. Conclusions

This paper investigates the effect of the Reynolds number and the clearance flow on the aerodynamic characteristics of a new type of VIGV. Key conclusions are summarized as follows:
  • With the reduction in Reynolds number R e c , the airfoil loss coefficient ω and deviation δ first increase slightly and then enter a high growth rate in the low range. For the two researched airfoils, the initial Reynolds number to the rapid performance degradation is 1.5 × 10 5 for the design point and 2.0 × 10 5 for the high incidence and max incidence.
  • For VIGV airfoils at the design point, in the high Reynolds number range, the antagonism between the reduction in the turbulent portion length and the thickening of the laminar portion makes the airfoil performance insensitive to the Reynolds number. Once the Reynolds number reduces to a certain value, the laminar separation bubble appears on the rear portion of the suction surface and extends rapidly because of the downstream migration of the re-attachment point, which leads to the steep increase in loss coefficient.
  • For VIGV airfoils at maximum incidence, the flow separation pattern is not the same for the two researched airfoils. However, for both airfoils, the rapid increase in the loss coefficient at a low Reynolds number is caused by the increase in the length and height of the laminar separation region.
The three-dimensional research confirms the Reynolds number effect. The average loss coefficient of the small-chord VIGV (Reynolds number halved) in the main part ( R = 0.1 ~ 0.85 ) is 44.3% and 80.5% higher than the normal-chord version at the high stagger angle points P4 ( Δ γ = 30   deg ) and P5 ( Δ γ = 35   deg ), respectively. In the VIGV with clearance, the entropy production in the leakage flow vortex mixing with the mainflow leads to the high loss level in the endwall region ( R = 0 ~ 0.1 and 0.85 ~ 1.0 ). The strength of the clearance flow gradually decreases towards the trailing edge. This indicates the potential benefit in loss reduction from seal treatment applications and that it should be placed in the former portion.

Funding

This research received no external funding.

Institutional Review Board Statement

Not applicable.

Informed Consent Statement

Not applicable.

Data Availability Statement

The data of the researched VIGV airfoils geometry are available from the corresponding author upon request.

Conflicts of Interest

The authors declare no conflict of interest.

Abbreviations

The following abbreviations and symbols are used in this manuscript:
c chord length (mm)
inominal incidence (degree)
kspecific heat ratio, k = 1.4
l S 1 leading edge separation length (mm)
l S 1 re-acceleration induced separation length (mm)
t max airfoil maximum thickness (mm)
t LE airfoil leading edge thickness (mm)
u velocity in boundary layer (m/s)
C m maximum deflection location of airfoil centerline
H b boundary-layer shape factor,   H b = δ 1 / δ 2
M a 1 inlet Mach number
M a is surface isentropic Mach number, M a is = 2 k 1 P 1 p 1 k 1 k 1
R relative blade span location
T u freestream turbulence intensity, T u = u 1 x 2 + u 1 y 2 + u 1 z 2   / u 1
U B C mainflow velocity at boundary-layer edge (m/s)
β 1 inlet flow angle measured from the axial direction (degree)
β 2 D design outflow angle measured from the axial direction (degree)
δ deviation angle (deg)
δ 0 boundary-layer thickness (mm)
δ 1 boundary-layer displacement thickness (mm)
δ 2 boundary-layer momentum thickness (mm)
σ cascade solidity, σ = c / s
ω total-pressure loss coefficient, ω = P 1 P 2 / P 1 p 1
Subscripts
1cascade inlet plane
2wake property measurement plane
axaxial direction
Dvalue at design point

References

  1. Kim, S.; Son, C.; Kim, K. Combining effect of optimized axial compressor variable guide vanes and bleed air on the thermodynamic performance of aircraft engine system. Energy 2017, 119, 199–210. [Google Scholar] [CrossRef]
  2. Dvirnyk, Y.; Pavlenko, D.; Przysowa, R. Determination of Serviceability Limits of a Turboshaft Engine by the Criterion of Blade Natural Frequency and Stall Margin. Aerospace 2019, 6, 132. [Google Scholar] [CrossRef] [Green Version]
  3. Vulpio, A.; Suman, A.; Casari, N.; Pinelli, M. Dust Ingestion in a Rotorcraft Engine Compressor: Experimental and Numerical Study of the Fouling Rate. Aerospace 2021, 8, 81. [Google Scholar] [CrossRef]
  4. Shi, H.; Liu, B.; Yu, X. Criteria for designing low-loss and wide operation range variable inlet guide vanes. Aerosp. Sci. Technol. 2018, 80, 177–191. [Google Scholar] [CrossRef]
  5. Shi, H.; Ji, L. Leading edge redesign of dual-peak type variable inlet guide vane and its effect on aerodynamic performance. Proc. Inst. Mech. Eng. Part G J. Aerosp. Eng. 2020. [Google Scholar] [CrossRef]
  6. Johnsen, I.A.; Bullock, R.O. Aerodynamic Design of Axial-Flow Compressors; NASA: Washington, DC, USA, 1965. [Google Scholar]
  7. Schobeiri, M.T. Turbomachinery Flow Physics and Dynamic Performance; Springer: Berlin, Germany, 2012. [Google Scholar]
  8. Lawson, T.V. An Investigation into the Effect of Reynolds Number on a Cascade of Blades with Parabolic Arc Camber Line; British NGTE: 1953.
  9. Blight, F.G.; Howard, W. Tests on Four Airfoil Cascadcs. Pt. I—Dcflection, Drag, and Velocity Distribution. Pt. II—Boundary Layer Characteristics; Department of Supply, The Aeronautical Research Laboratories: Melbourne, Australia, 1952. [Google Scholar]
  10. Herrig, L.J.; Emery, J.C.; Erwin, J.R. Systematic Two-Dimensional Cascade Tests of NACA 65-Series Compressor Blades at Low Speeds; National Advisory Committee for Aeronautics: Washington, DC, USA, 1957. [Google Scholar]
  11. Schreiber, H.-A.; Steinert, W.; Kusters, B. Effects of Reynolds Number and Free-Stream Turbulence on Boundary Layer Transition in a Compressor Cascade. ASME J. Turbomach. 2000, 124, 1–9. [Google Scholar] [CrossRef]
  12. Sonoda, T.; Yamaguchi, Y.; Arima, T.; Olhofer, M.; Sendhoff, B.; Schreiber, H.-A. Advanced High Turning Compressor Airfoils for Low Reynolds Number Condition—Part I: Design and Optimization. ASME J. Turbomach. 2004, 126, 350–359. [Google Scholar] [CrossRef]
  13. Schreiber, H.-A.; Steinert, W.; Sonoda, T.; Arima, T. Advanced High-Turning Compressor Airfoils for Low Reynolds Number Condition— Part II: Experimental and Numerical Analysis. ASME J. Turbomach. 2004, 126, 482–492. [Google Scholar] [CrossRef] [Green Version]
  14. Handel, D.; Barthmes, S.; Niehuis, R. 2D Investigation of the Flow Through a Symmetric Variable Inlet Guide Vane, Part 1: Experimental Analysis. In Proceedings of the 49th AIAA/ASME/SAE/ASEE Joint Propulsion Conference, San Jose, CA, USA, 14–17 July 2013. AIAA Paper 2013-3682. [Google Scholar]
  15. Barthmes, S.; Handel, D.; Niehuis, R. 2D Investigation of the Flow through a Symmetric Variable Inlet Guide Vane, Part 2: Numerical Analysis. In Proceedings of the 49th AIAA/ASME/SAE/ASEE Joint Propulsion Conference, San Jose, CA, USA, 14–17 July 2013. AIAA Paper 2013-3683. [Google Scholar]
  16. Yang, R.; Zhong, D.; Ge, N. Numerical investigation on flow control effects of dynamic hump for turbine cascade at different Reynoldsnumber and hump oscillating frequency. Aerosp. Sci. Technol. 2019, 92, 280–288. [Google Scholar] [CrossRef]
  17. Arif, I.; Lam, G.C.Y.; Wu, D.; Leung, R.C.K. Passive airfoil tonal noise reduction by localized flow-induced vibration of an elastic panel. Aerosp. Sci. Technol. 2020, 107, 106319. [Google Scholar] [CrossRef]
  18. Wang, M.; Yang, C.; Li, Z.; Zhao, S.; Zhang, Y.; Lu, X. Effects of surface roughness on the aerodynamic performance of a high subsonic compressor airfoil at low Reynolds number. Chin. J. Aeronaut. 2021, 34, 71–81. [Google Scholar] [CrossRef]
  19. Chen, W.; Qiao, W.; Wei, Z. Aerodynamic performance and wake development of airfoils with wavy leading edges. Aerosp. Sci. Technol. 2020, 106, 106216. [Google Scholar] [CrossRef]
  20. Menter, F.R. Two-equation eddy-viscosity turbulence models for engineering applications. AIAA J. 1994, 32, 1598–1605. [Google Scholar] [CrossRef] [Green Version]
  21. Langtry, R.B.; Menter, F.R. Transition Modeling for General CFD Applications in Aeronautics. In Proceedings of the 43rd AIAA Aerospace Sciences Meeting and Exhibit, Reno, NV, USA, 10–13 January 2005. AIAA Paper 2005-522. [Google Scholar]
  22. Dener, C.; Hirsch, C. IGG—An interactive 3D surface modelling and grid generation system. In Proceedings of the 30th Aerospace Sciences Meeting and Exhibit, Reno, NV, USA, 6–9 January 1992. AIAA Paper 92-0073. [Google Scholar]
  23. Hergt, A.; Meyer, R.; Engel, K. Experimental Investigation of Flow Control in Compressor Cascades. In Proceedings of the ASME Turbo Expo 2006: Power for Land, Sea, and Air, Barcelona, Spain, 8–11 May 2006. [Google Scholar]
Figure 1. VIGV airfoil definitions (a); Researched VIGV airfoil geometry and surface slope at the design condition (b,c); VIGV airfoil scaling for varying the chord Reynolds number R e c (d).
Aerospace 08 00172 g001
Figure 2. Operation schedule for airfoil performance evaluation (a); flow plot at the design and maximum incidence points (b).
Aerospace 08 00172 g002
Figure 3. Mesh topology and details at the leading edge and trailing edge.
Aerospace 08 00172 g003
Figure 4. Grid independence study: (a,b) for Case 1; (c,d) for Case 2.
Aerospace 08 00172 g004
Figure 5. Simulated (Grid 4) and experimental results [14] for the effect of chord Reynolds number Re c on the symmetric airfoil. (a,b) for the design ( γ = 0 ° ) condition and (c,d) for the high incidence condition ( γ = 20 ° ).
Aerospace 08 00172 g005
Figure 6. Influence of chord Reynolds number on the VIGV airfoil loss coefficient (a) and the deviation (b); Case 1 ( M a 1 = 0.45 ) .
Aerospace 08 00172 g006
Figure 7. Influence of chord Reynolds number on the VIGV airfoil loss coefficient (a) and the deviation (b); Case 2 ( M a 1 = 0.60 ).
Aerospace 08 00172 g007
Figure 8. Suction surface boundary layer at the design point ( Δ β 2 = 0 ° ): from transition to separation; (a) for Case 1 ( M a 1 = 0.45 ); (b) for Case 2 ( M a 1 = 0.60 ).
Aerospace 08 00172 g008
Figure 9. Influence of the Reynolds number R e c on (a) the boundary-layer shape factor H b , (b) the skin friction coefficient C f , and (c) the momentum thickness δ 2 / c for Case 1 ( M a 1 = 0.45 ).
Aerospace 08 00172 g009
Figure 10. Separation pattern at maximum incidence ( Δ β 2 = 30 ° ): inception and re-attachment point and LE peak Mach number: (a,b) for Case 1 ( M a 1 = 0.45 ); (c,d) for Case 2 ( M a 1 = 0.60 ).
Aerospace 08 00172 g010
Figure 11. Reynolds number effect on (a) the boundary-layer shape factor H b , (b) the skin friction coefficient C f , and (c) the momentum thickness δ 2 / c at maximum incidence ( Δ β 2 = 30 ° ) for Case 1 ( M a 1 = 0.45 ).
Aerospace 08 00172 g011
Figure 12. Front portion Mach number contour for SP1 to SP4 (a), a comparison of boundary-layer velocity profiles where suction surface x / C ax = 10 % ,   15 % , 20 % ,   and   25 % (b); Case 1 ( M a 1 D = 0.45 ).
Aerospace 08 00172 g012
Figure 13. The schematic for a meridian view of the normal-chord version (a) and the small-chord version (b), with tip clearance (c).
Aerospace 08 00172 g013
Figure 14. Mesh topology with tip LE and TE details.
Aerospace 08 00172 g014
Figure 15. Operation schedule (a) and Reynolds number at mid-span (b), radial distribution of the inlet Mach number Ma 1 (c), and the outflow angle β 2 (d) for normal- and small-chord VIGVs.
Aerospace 08 00172 g015
Figure 16. Radial distribution of the pitchwise-averaged total-pressure loss coefficient for normal-chord and small-chord VIGVs (ae); corresponding blade passage-averaged total pressure drop (f).
Aerospace 08 00172 g016
Figure 17. Impact of hub and tip clearance on the endwall region total-pressure drop ( 1 σ ), the blade and hub static pressure p at the high stagger angle point (P5, Δ γ = 35 ° ). (a) VIGV with clearance, (b) VIGV without clearance, and (c) loss coefficient decomposition.
Aerospace 08 00172 g017
Figure 18. Flow details of the tip region for the VIGVs with clearance (ac) and without clearance (d); P5 ( Δ γ = 35 ° ).
Aerospace 08 00172 g018
Figure 19. Impact of endwall clearance on the radial distribution of tangential, axial, and radial velocity at the outflow measurement plane (a) and the surface Mach number distribution near the endwall (b), at the operation points P3 ( Δ γ = 25 ° ) and P5 ( Δ γ = 35 ° ).
Aerospace 08 00172 g019
Table 1. Geometry parameters of the two researched airfoils.
ParametersCase 1Case 2
Design   inflow   Mach   number ,   M a 1 D 0.450.60
Inlet   flow   angle ,   β 1 0 deg
Design   exit   flow   angle ,   β 2 D 25.0 deg15.0 deg
Solidity ,   σ = c / s 1.201.05
Camber   angle ,   θ 39.027.0
Maximum   relative   thickness ,   T = t max / c 0.080.09
LE   thickness / Chord ,   t LE / c 0.0200.023
LE typeCurvature-continuous [5] with S= −0.1
Research   range   of   design   point   chord   Reynolds   number ,   R e C D 0.48 ~ 6.4 × 10 5 0.60 ~ 8.0 × 10 5
Table 2. Topology parameters of Grids 1–4 for the grid independence study.
Topology ParameterGrid 1Grid 2Grid 3Grid 4
Stream-wise nodes341397465517
Stream-wise nodes on profile surface81121181225
Pitch-wise nodes (around airfoil)66106146178
Pitch-wise nodes across the o-block21334553
Nodes number of overall mesh85.0 k164.2 k261.2 k374.5 k
Table 3. Inflow angle β 1 and stagger angle variation Δ γ at calculated operating points.
Operating PointP1P2P3P4P5
β 1 0 deg
Δ γ 0 deg10 deg20 deg30 deg35 deg
Publisher’s Note: MDPI stays neutral with regard to jurisdictional claims in published maps and institutional affiliations.

