Article

Monte Carlo Predictions of Aero-Engine Performance Degradation Due to Particle Ingestion

1
Department of Mechanical, Aerospace and Civil Engineering, University of Manchester, George Begg Building, Sackville Street, Manchester M1 3BB, UK
2
Rolls-Royce Civil Aerospace, Derby DE24 8BJ, UK
*
Author to whom correspondence should be addressed.
Aerospace 2021, 8(6), 146; https://doi.org/10.3390/aerospace8060146
Submission received: 4 May 2021 / Revised: 19 May 2021 / Accepted: 21 May 2021 / Published: 25 May 2021
(This article belongs to the Special Issue Life Cycle Modeling of Aircraft Propulsion Systems)

Abstract

:
Aero-engines, which encounter clouds of airborne particulate, experience reduced performance due to the deposition of particles on their high-pressure turbine nozzle guide vanes. The rate of this degradation depends on particle properties, engine operating state and the duration of exposure to the particle cloud, variables that are often unknown or poorly constrained, leading to uncertainty in model predictions. A novel method coupling one-dimensional gas turbine performance analysis with generalised predictions of particle deposition is developed and applied through the use of Monte Carlo simulations to better predict high-pressure turbine degradation. This enables a statistical analysis of deterioration from which mean performance losses and confidence intervals can be defined, allowing reductions in engine life and increased operational risk to be quantified. The method is demonstrated by replicating two particle cloud encounter events for the Rolls-Royce RB211-524C engine and is used to predict empirical particle properties by correlating measured engine performance data with Monte Carlo model inputs. Potential improvements in the confidence of these predictions due to more tightly constrained input and validation data are also demonstrated. Finally, the potential combination of the Monte Carlo coupled degradation model with in-service engine performance data and particle properties determined through remote or in situ sensing is outlined and its role in a digital twin to enable a predictive approach to operational capability is discussed.

1. Introduction

The dangers posed to the safe operation of gas turbine engines in the presence of airborne particulate such as volcanic ash and mineral dusts are well documented, ranging from benign events resulting in minimal damage to engines being rendered inoperative and safety margins compromised [1]. Encounters between aircraft and volcanic ash remain rare, but their consequences are well known due to several high-profile incidents involving commercial airliners. Most prominent was the 2010 eruption of the Eyjafjallajökull volcano in Iceland, when the resulting ash cloud reached and, shutdown, much of continental European airspace, with an estimated economic impact of USD 5 billion [2]. This generated significant interest in establishing quantities of ash in which engines could safely operate to avoid future, costly airspace closures.
Airborne mineral dust is encountered with much higher frequency due to the growth of aviation in arid regions and can be especially severe during dust storms. Due to its constant presence in these environments, dust ingestion is often unavoidable, and although not encountered in large quantities over short time periods typical of volcanic ash, multiple flight cycles combined with dust storms can see the total quantity ingested reach comparable levels [3]. However, to date, analogous safe quantities of mineral dust that can be tolerated by an engine have yet to be established.
This inability to avoid frequent ingestion of airborne particulate combined with the impracticality of airspace closures has precipitated a shift towards model-driven, risk-based approaches in which certain levels of damage, performance loss and reductions in safety margin can be tolerated to maintain efficiency of operations [4]. Key to this is the ability to determine safe quantities of airborne particulate that can be ingested by an engine without compromising safety margins.
Past efforts to assess the implications of operating in airborne particulate have focused on qualifying damage, with Clarkson and Simpson proposing a four stage metric ranging from no damage to serious safety implications [5]. Although this provides an indication of event severity, it does not quantify engine performance deterioration or safety margin reductions. In pursuit of this, significant work has been carried out to develop numerical models capable of predicting damage to individual components [5,6]. However, the ability to carry out these quantitative damage predictions using deterministic approaches such as computational fluid dynamics relies on complete knowledge of the particle properties and flow boundary conditions, with the rate of deposition shown to be a function of particle size, composition and concentration. Attempts have also been made to characterise physical properties of ingested particles [7,8,9], with the inability to determine these in a real-world scenario, such as during an exposure event, proving a hindrance to deterministic approaches [10,11]. This introduces a high degree of uncertainty into the numerical models currently available to predict the likelihood of deposition and limits confidence in the results obtained.
In this contribution, we demonstrate a method for predicting engine performance degradation due to particle deposition (Figure 1) in the absence of exact model inputs relating to the dust cloud concentration and particle properties as is the case during real-world encounters. To reduce uncertainty in the predicted engine performance degradation compared to deterministic approaches, we develop a random sampling Monte Carlo algorithm to carry out a statistical analysis, allowing performance loss to be predicted with degrees of confidence. This methodology is based around a generalised, reduced-order model [12,13], which, compared to existing deterministic methods, reduces the computing time required to carry out a Monte Carlo analysis by several orders of magnitude. This enables multiple combinations of variables to be assessed in a rapid manner and time constant for the rate of deposition to be predicted, which can potentially be used to estimate engine time to failure.

2. Materials and Methods

2.1. Background

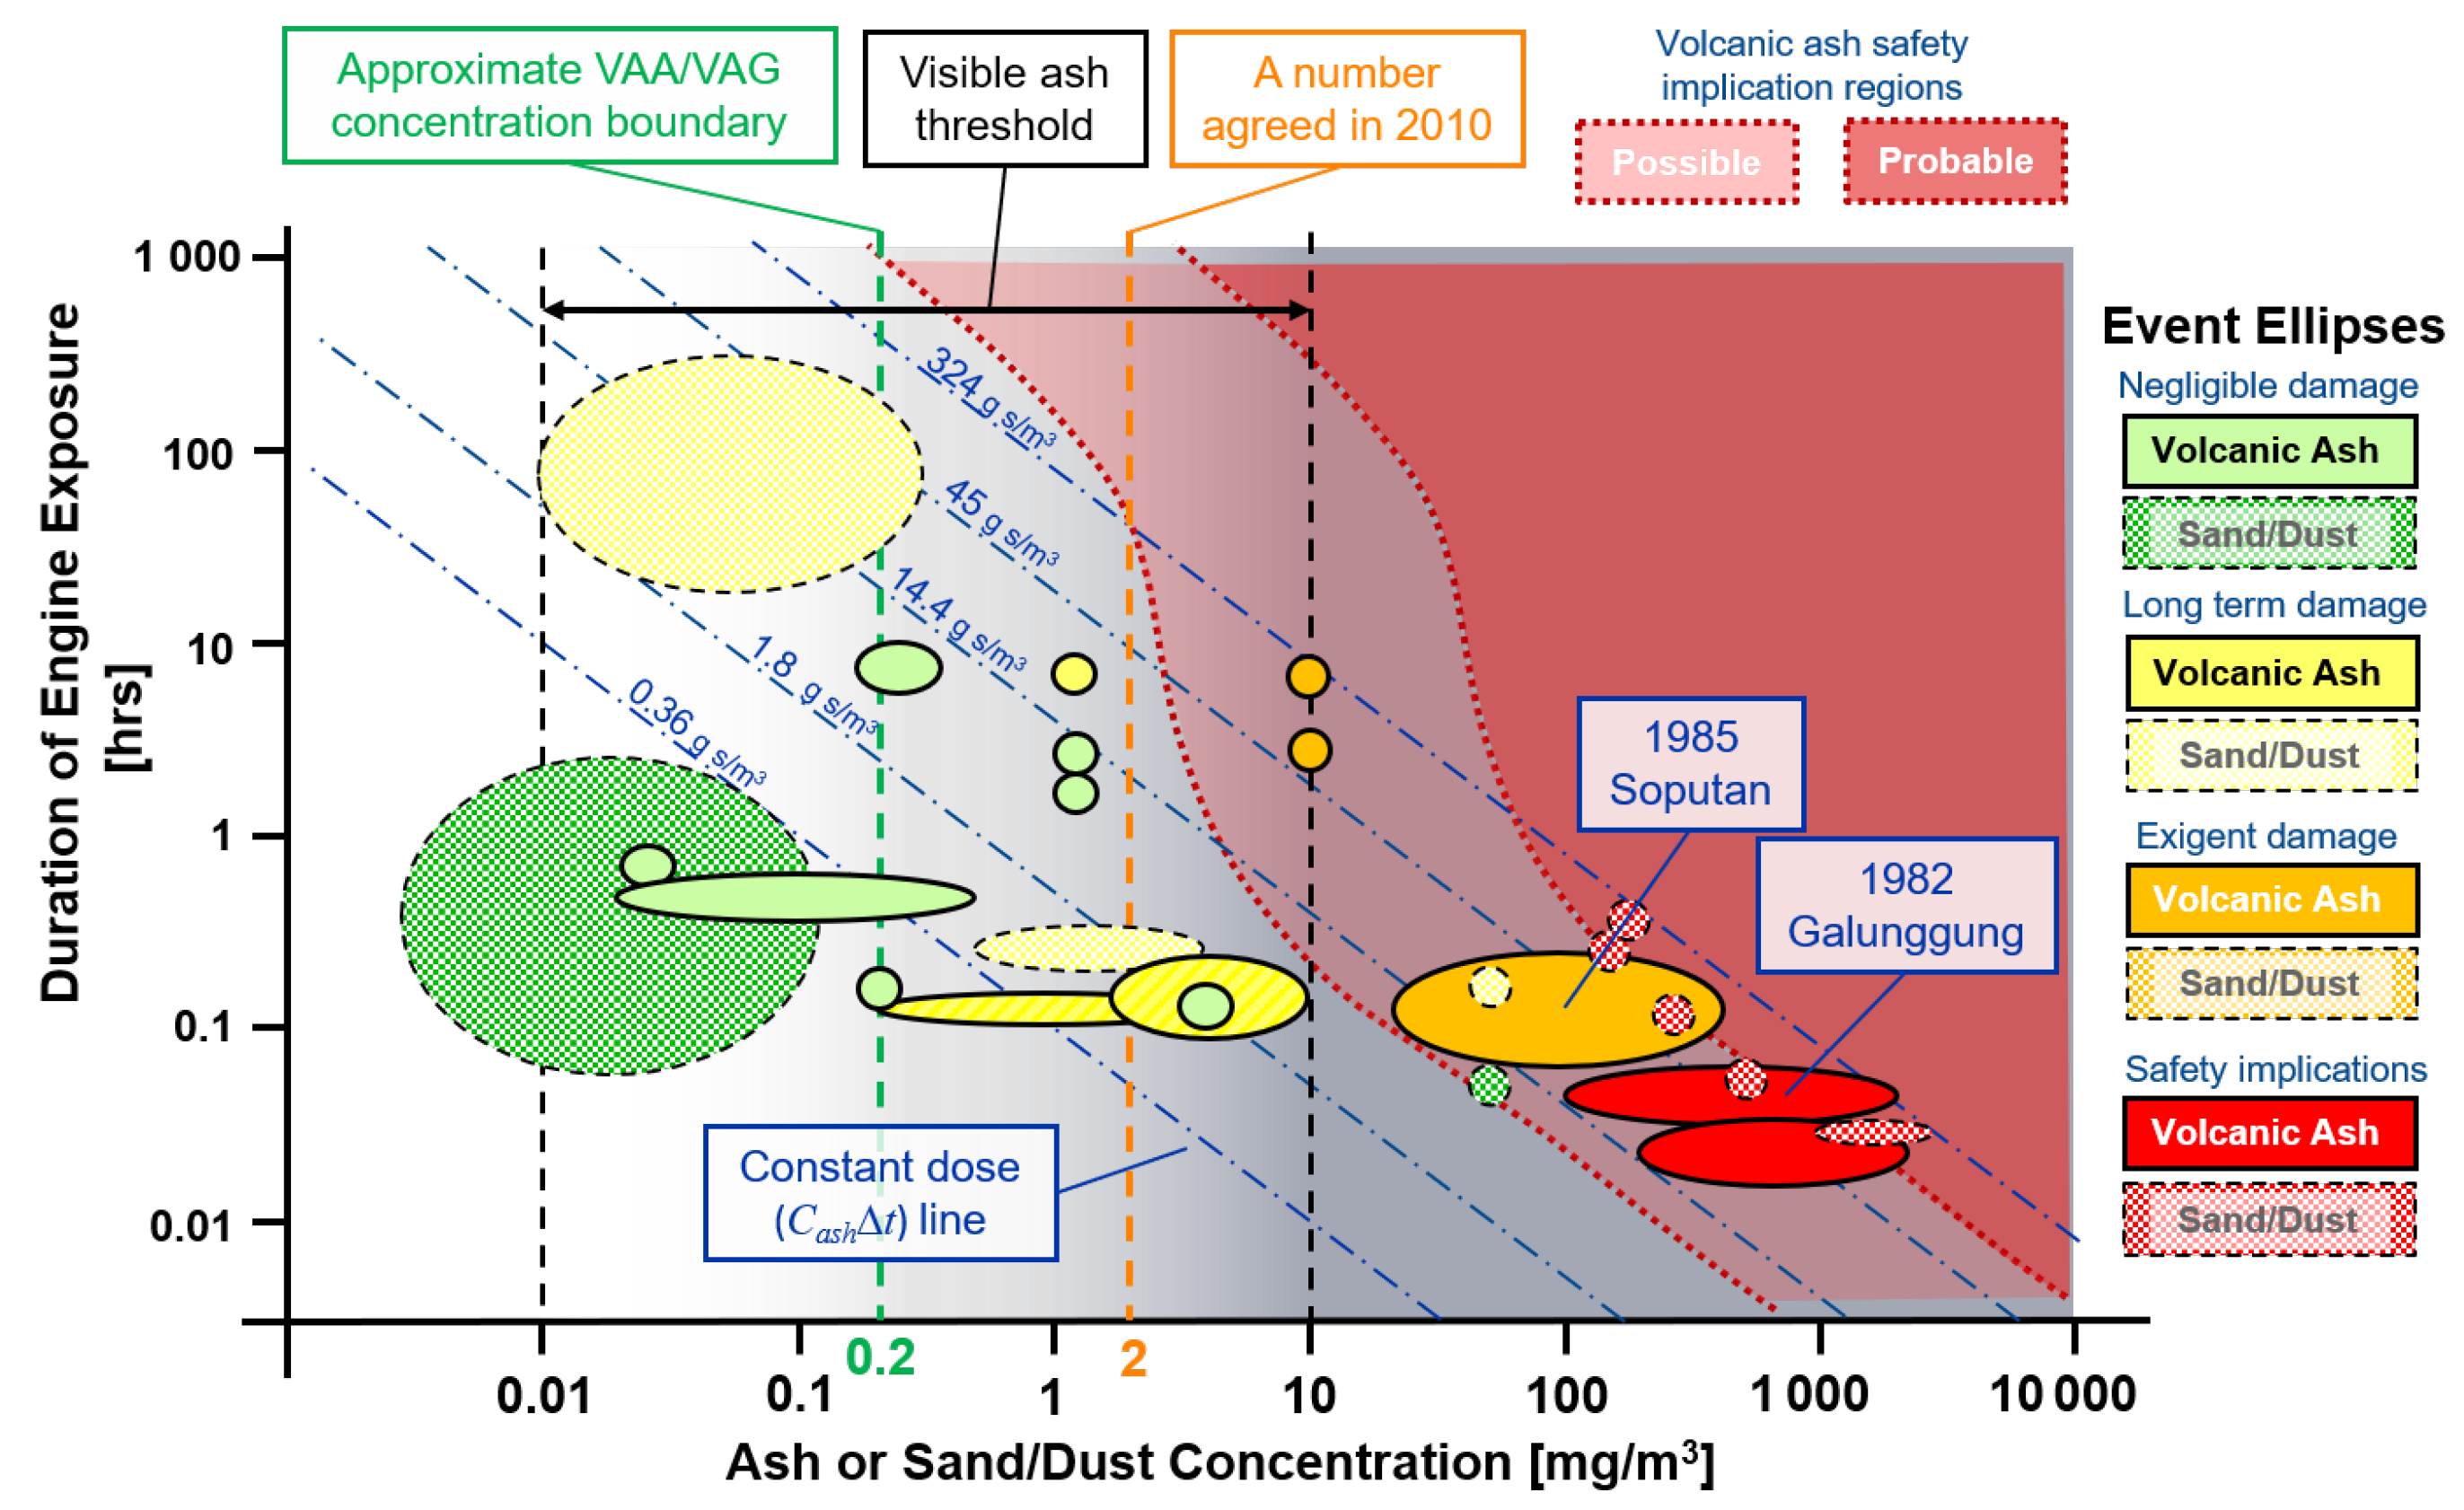
2.1.1. Historical Encounter Events

Encounters between aircraft and airborne particulate have increased significantly with the growing prevalence of air travel and the development of large hubs in the Middle East [3,15]. Whilst some events are well documented, others pass with relatively little attention as there is limited information relating to the particles encountered, the timeline of events and loss of engine performance, which are key in determining the quantity of dust ingested and the resulting damage. As a result, we focus this work on events, for which some of this information is available, and crucially, for which engine performance deterioration has been quantified.

2.1.2. 1982 Mount Galunggung Event

The most widely known encounter between volcanic ash and an aircraft occurred on 24 June 1982 when a Boeing 747-234B equipped with four Rolls-Royce RB211-524C engines, cruising at flight level 370 around 130 miles south of Jakarta, flew through an ash cloud emanating from Mount Galunggung. During the event, all four engines experienced compressor surge and loss of significant thrust and had to be shut down [14]. All engines were restarted; however, a second surge of engine 2 left three running engines for a safe landing at Jakarta. Post-event inspections found the cause of failure for all four engines to be a loss of core surge margin due to combined effects of compressor erosion and deposition in the high-pressure turbine. Engine performance data suggests that a 10% reduction in NGV nozzle area was sufficient to cause compressor surge and loss of thrust [14]. This was accompanied by a reduction in the high-pressure system spool speed and a steadily rising exhaust gas temperature.
The encounter duration was estimated by Clarkson et al. [1] to be in the range 2–4 min. Two separate retrospective analyses based upon estimates of the total ash mass deposited in the high-pressure turbine and the quantity of metal eroded in the compressor arrived at a concentration of around 2000 mg · m 3 [1]. Revisions of these calculations using better informed assumptions predicted concentrations at an order of magnitude lower, at around 200 mg · m 3 [1]. This agrees with back-cast predictions carried out using ash dispersion modelling, which suggest the time-averaged concentration during the encounter was around 320 mg · m 3 [16].

2.1.3. 1985 Mount Soputan Event

A second event, in which a Boeing 747-238B again equipped with four Rolls-Royce RB211-524C engines encountered an ash plume emanating from Indonesia’s Mount Soputan occurred in 1985, during which the crew noted changes in engine performance and infiltration of ash into the aircraft. Inspections after landing discovered that significant damage had occurred, with compressor blades eroded and ash deposited on NGVs. A retrospective analysis of engine performance data before and after the encounter showed increasing exhaust gas temperature and reducing high-pressure turbine spool speed as all four engines were run-down slightly [17]. However, this was insufficient to cause a loss of significant thrust or compressor surge, performance deterioration remained within accepted limits and the flight continued as planned. This resulted in a further four hours of flight with all engines operating but not ingesting ash [17]. There was also evidence of previously built-up deposits having been gradually shed from NGVs during this time [17].
Comparing the aircraft flight path and likely location of the ash cloud resulted in an estimated encounter duration of 4–14 min, with multiple sources reporting an average duration of 8 min [2,15,17]. Numerical dispersion modelling carried out by Witham et al. [16] of the ash cloud estimated a time-averaged concentration of 200 mg · m 3 , whilst observations of ash in the aircraft suggested a concentration greater than events where ash did not infiltrate the cabin such as the 2014 Mount Kelud encounter [18]. Thus, a sensible range of concentrations for the event is suggested to be 20–400 mg · m 3 .

2.1.4. Engine Dose

The amount of particulate matter ingested by an engine can be quantified in terms of a dose [3]. First proposed by Clarkson et al. [1] during an evaluation of previous encounter events, it is defined as the product of the encounter duration and the average dust cloud concentration. The theory of dose underpins the Duration of Exposure versus Ash Concentration (DEvAC) chart proposed by Clarkson and Simpson [5] in which known encounter events are plotted based on their concentration and duration (Figure 2) with the ellipse size representing uncertainty in these metrics.
This allows the events to be categorised using a four-stage qualitative range from no damage to safety implications through long-term damage and exigent damage. Generally, events resulting in serious safety implications are short duration, high concentration encounters in which turbine deposition is the dominant damage mechanism, with the converse true for erosion-dominated events, which result in negligible or long-term damage. The application of a surge margin loss model [5] to a worst case scenario of volcanic ash ingestion has allowed doses corresponding to probable (dark red) and possible (light red) engine damage to be defined as shown in Figure 2. The non-linearity of these boundaries results from the influence of concentration on the dominant damage mechanism, with high concentration events resulting in failure due to particle deposition at a relatively low dose. Conversely, for lower concentrations, larger doses can be tolerated before safety is compromised due to the erosion mechanism outweighing deposition. The determination of these boundaries has allowed a safe dose limit of volcanic ash to be defined as 14.4 g · s · m 3 [3].
The dashed blue lines in Figure 2 represent a constant dose and highlight how the combination of concentration and duration through which this is achieved affect the damage endured. For high concentration, short duration events such as the 1982 Mount Galunggung encounter, the engine failed, resulting in serious safety implications; however, for the less severe Soputan encounter, a similar dose was achieved through the combination of a lower concentration and longer duration, resulting only in exigent damage and no engine failure.

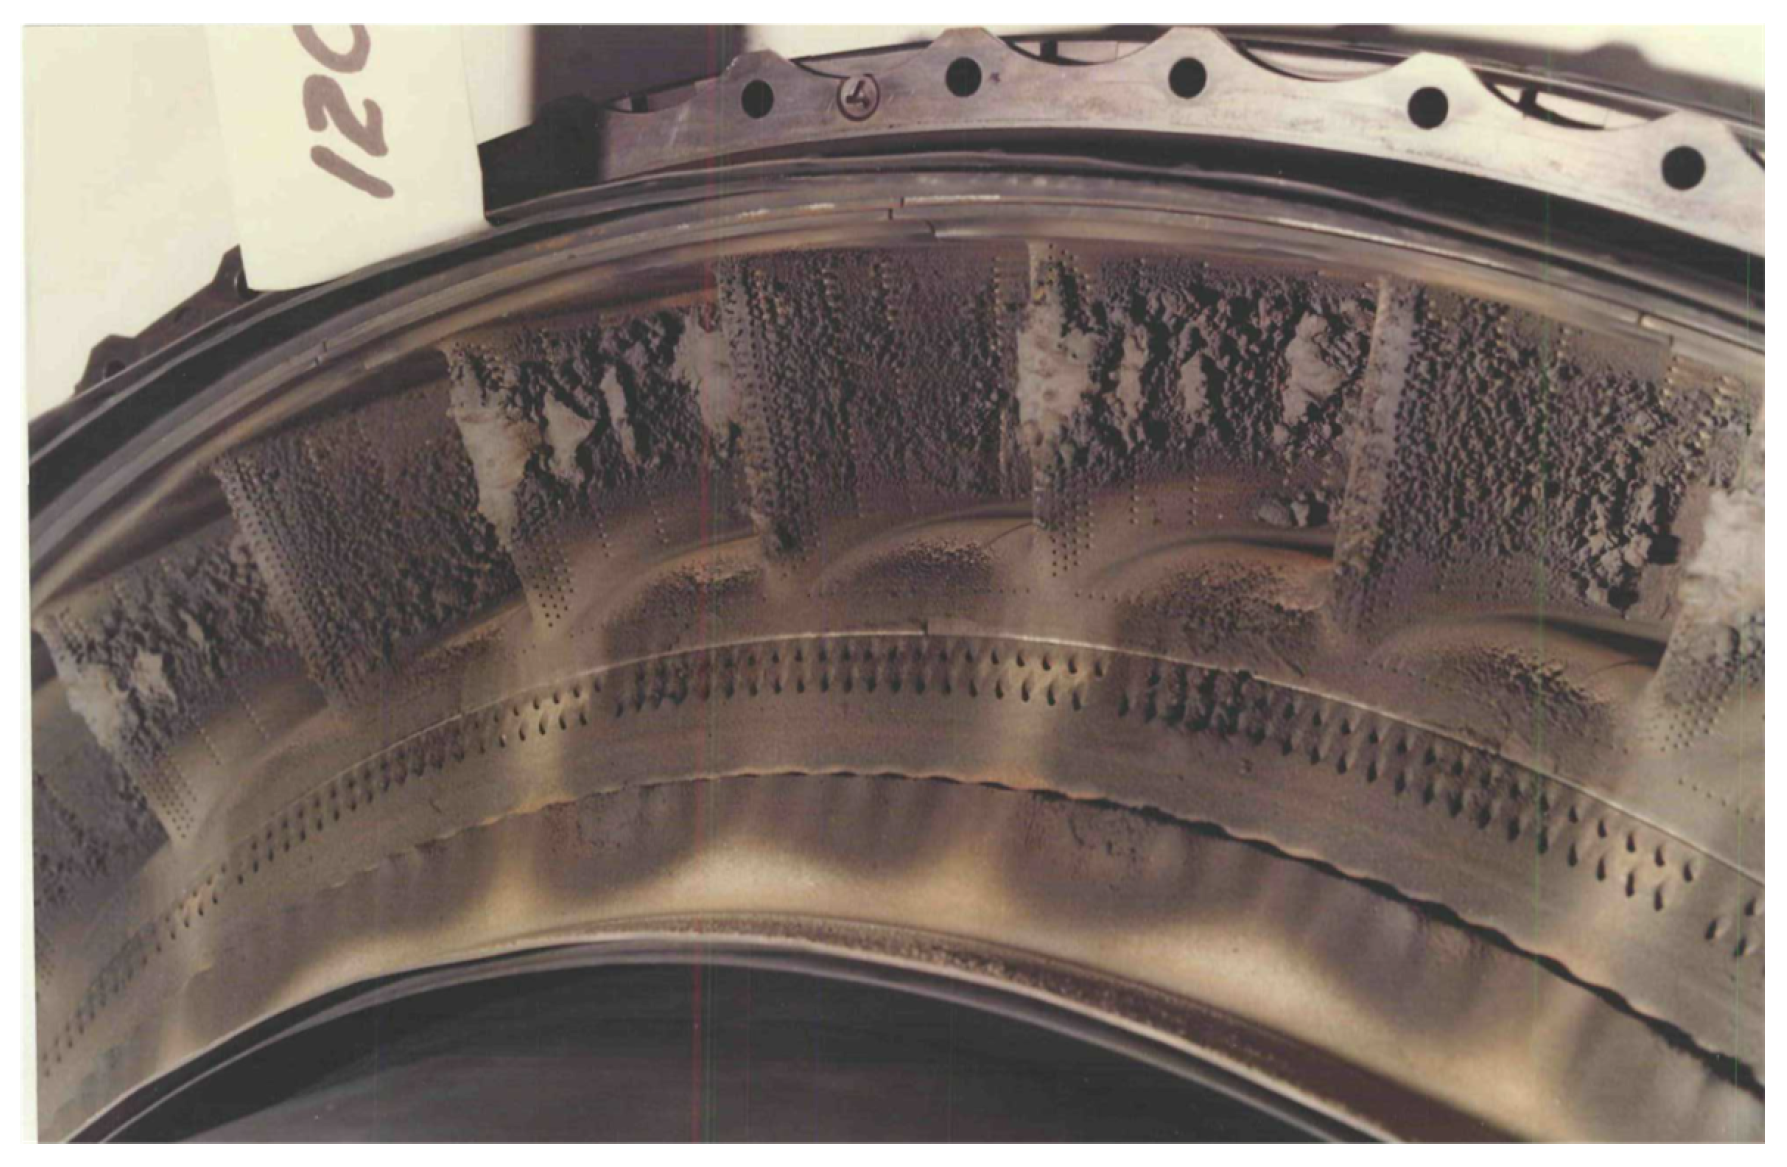
2.1.5. Nozzle Guide Vane Deposition

The rate at which an engine degrades during an encounter event depends on a balance between two core damage mechanisms—compressor erosion and turbine deposition—with the dominant mechanism depending on concentration. Generally, for high-dose encounters with relatively high concentrations, deposition in the high-pressure turbine is the dominant damage mechanism resulting in rapid nozzle throat closure [1].
In these cases, the reduced core flow rate due to nozzle throat closure results in the compressor running line moving to a lower mass flow rate for a fixed pressure ratio. At the same time, the combined effects of compressor erosion and abrasion result in a reduced pressure ratio for a fixed core mass flow rate, with these combined effects reducing the compressor surge margin. Consequently, gas temperatures throughout the engine increase, with the HPT unable to meet its intended pressure drop and the efficiency with which it can extract work from the flow inhibited due to the reduction in flow capacity. This restriction of core flow capacity through the engine reduces the compressor pressure ratio, ultimately resulting in flow reversal and surge [19].
The compressor surge margin loss is therefore proportional to the deposition rate on the high pressure turbine NGVs. The rate at which this occurs can be explained using classical fouling theory, which considers the balancing of two phenomena: sticking and shedding of surface deposits [20]. The Kern and Seaton [20] fundamental relationship for modelling the accumulation of particulate has been adapted by Clarkson and Simpson [5] to develop a formulation suited to deposition of particles on nozzle guide vanes. The resulting relationship for the rate of deposit mass evolution as a function of the engine operating state and airborne particulate concentration is given in Equation (1).
m d e p = m 0 e λ t + C p W 1 ζ N G V ρ a i r λ ( 1 e λ t )
The mass accumulated, m d e p , as a function of time, t, is governed by the initial mass of deposit prior to the encounter, m 0 ; core mass flow rate, W 1 ; ambient air density, ρ a i r ; dust cloud concentration, C p ; and the accumulation factor, ζ N G V , which is a function of the operating state of the engine, thermo-mechanical properties of the particles and the nozzle guide vane stage architecture [12]. The term λ is defined as the shedding rate parameter and represents the rate at which a stuck deposit is shed from the vane by aerodynamic re-entrainment of surface deposits by shear flow in the boundary layer, causing molten deposit to run-off the trailing edge of the vane. Additional mechanisms for deposit re-entrainment occur including bombardment ejection, where particles impacting the molten deposit layer ejected additional droplets from the surface in a splashing phenomenon [6]. These short-term effects are included implicitly in the Clarkson and Simpson [5] model through the accumulation factor, with this being an average parameter over the duration of an event and the shedding rate parameter capturing longer term shedding effects such as aerodynamic re-entrainment.
Based on Equation (1), it was proposed by Clarkson and Simpson [5], that for a given dose, there will occur a point in time at which the accumulation and shedding rates are balanced, leading to a fixed mass of deposit on the vane. This is referred to as the asymptotic nature of deposition and is important from a damage tolerance perspective as it suggests that, if the asymptotic mass is reached with the engine still operating, then a surge will not occur. However, if the concentration is relatively high, such as during the Galunggung event, the accumulation rate outweighs the shedding rate throughout, resulting in continued growth of deposit, up to the point that a critical mass is reached and the engine surges. Due to this predictable asymptotic rate, with more accurate predictions of the accumulation rate, it is possible to predict the point at which surge occurs for these high concentration events based on the time constant of the asymptotic deposit growth rate.

2.1.6. The Accumulation Factor
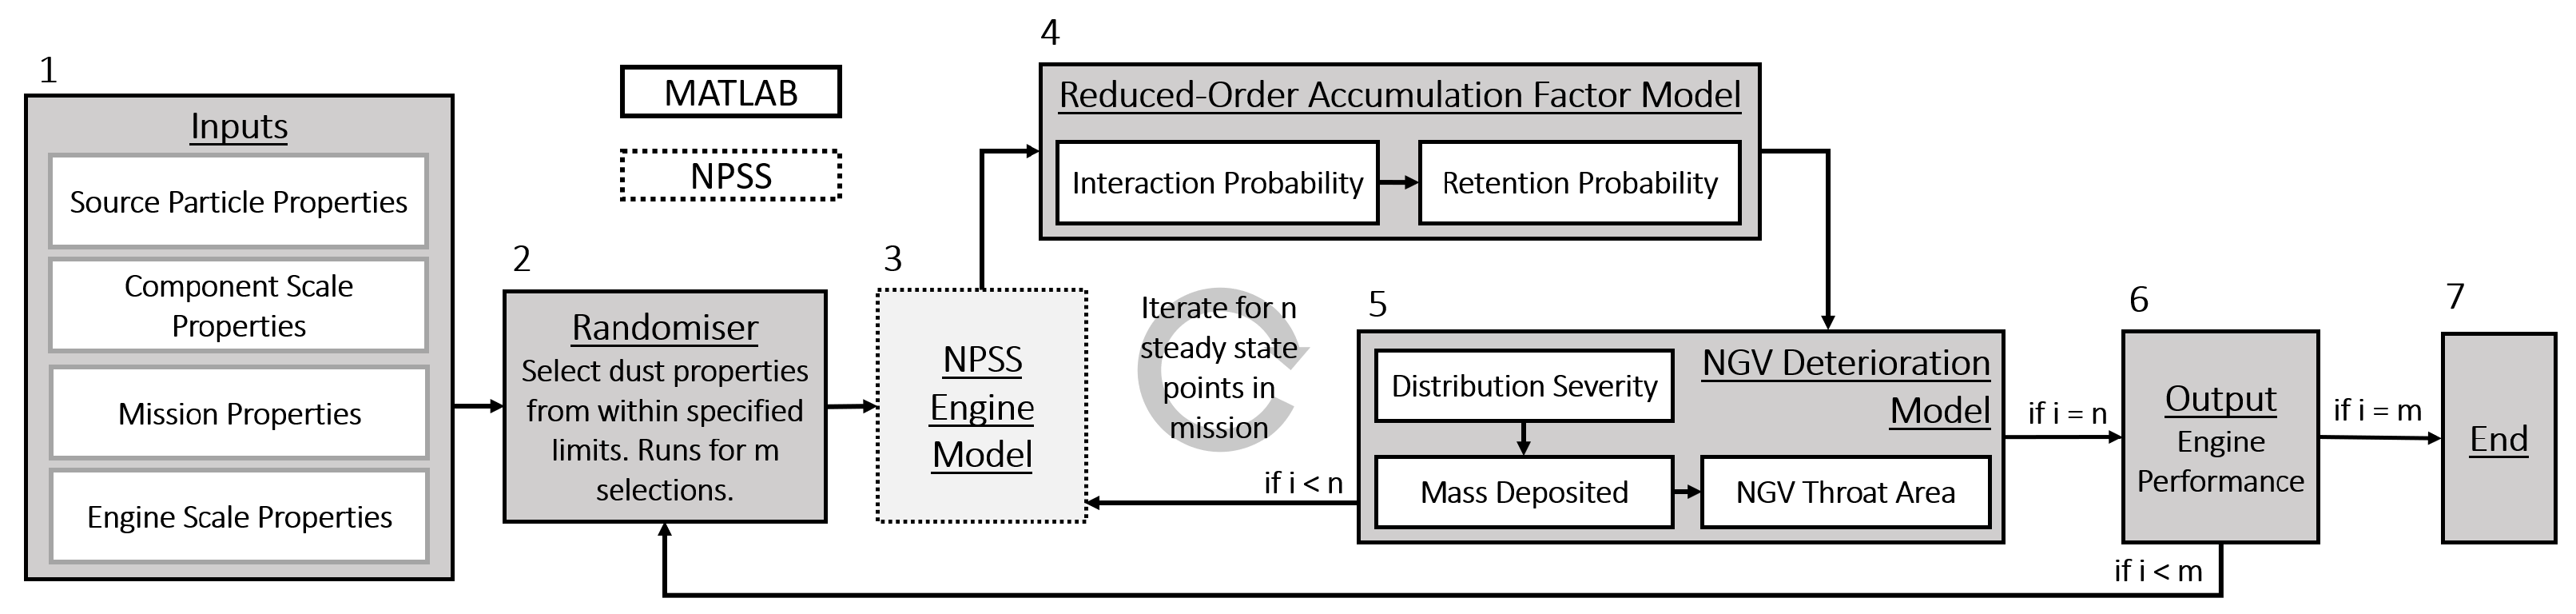
The proportion of ingested particulate that deposits on high-pressure turbine NGVs can be quantified using the Accumulation Factor proposed by Clarkson et al. [1]. This is defined as the ratio between the mass of particles deposited in the NGV stage to the total mass of particles ingested by the engine core during an encounter. The accumulation factor depends on multiple factors including the physical properties of the dust, how these change during particles’ passage through the engine, the flow field and NGV geometry itself. These combined factors determine whether a particle is in either a fully or partially molten state upon impact with the NGV, with the probability of deposition increasing with the proportion of molten phase in the particle. For ash particles, the physical state upon impact is linked to the particle viscosity, which depends on its temperature and chemical composition [21]. As the particle viscosity reduces with increasing temperature, we therefore expect the accumulation factor and severity of deposition to increase with increasing turbine gas temperature.
As deposits build up in the NGV stage, the HPT efficiency reduces and turbine gas temperature increases, producing a commensurate reduction in the viscosity of particles in the NGV stage, increasing their probability of deposition and thus the accumulation factor. Given that the deposits causing this rise in turbine temperature develop over time, it therefore follows that the accumulation factor increases during this same time period. There is also evidence of non-linearity in the relationship between accumulation factor and time, with this thought to be due to the modification of surface properties over time as the deposit layer develops. Initially depositing particles do so against the bare vane surface, but over time, a molten deposit layer develops which subsequently captures particles, which otherwise would not stick to a clean vane leading to an acceleration in the deposition rate [22].
Previous work has assumed the accumulation factor constant for a given particulate type [5,6], based on a mix of engine testing and lab-based experimentation [23,24,25]. In reality, the accumulation factor has complex dependencies on flow conditions, particle properties, time and concentration [26]. Having a numerical model that can predict the accumulation factor whilst incorporating these dependencies can be achieved by allowing engine performance parameters to inform the accumulation factor prediction. In this work, we present a method that allows this iterative calculation of accumulation factor to be carried out, capturing time-dependent changes in the accumulation factor due to variation in the engine operating point with time as a result of both particle deposition and thrust requirement.

2.2. Methodology

As has already been discussed, difficulties in predicting the particle cloud concentration and encounter duration lead to a large uncertainty in the dose received and thus variations in the model predicted accumulation factor and associated performance deterioration. When combined with uncertainty in the physical properties of the dust encountered, which are difficult to predict for an encounter event, this leads to potentially large variations in the engine performance deterioration predictions from existing deterministic models.
The methodology presented in this work presents a Monte Carlo approach, which can be used to carry out a statistical analysis of engine damage, in the absence of discrete particle and dust cloud properties. The approach couples several numerical models operating on three distinct scales. Particle-level deposition modelling is used to inform component scale damage models and to incorporate these into a numerical engine performance prediction, allowing degradation associated with particle deposition to be assessed.

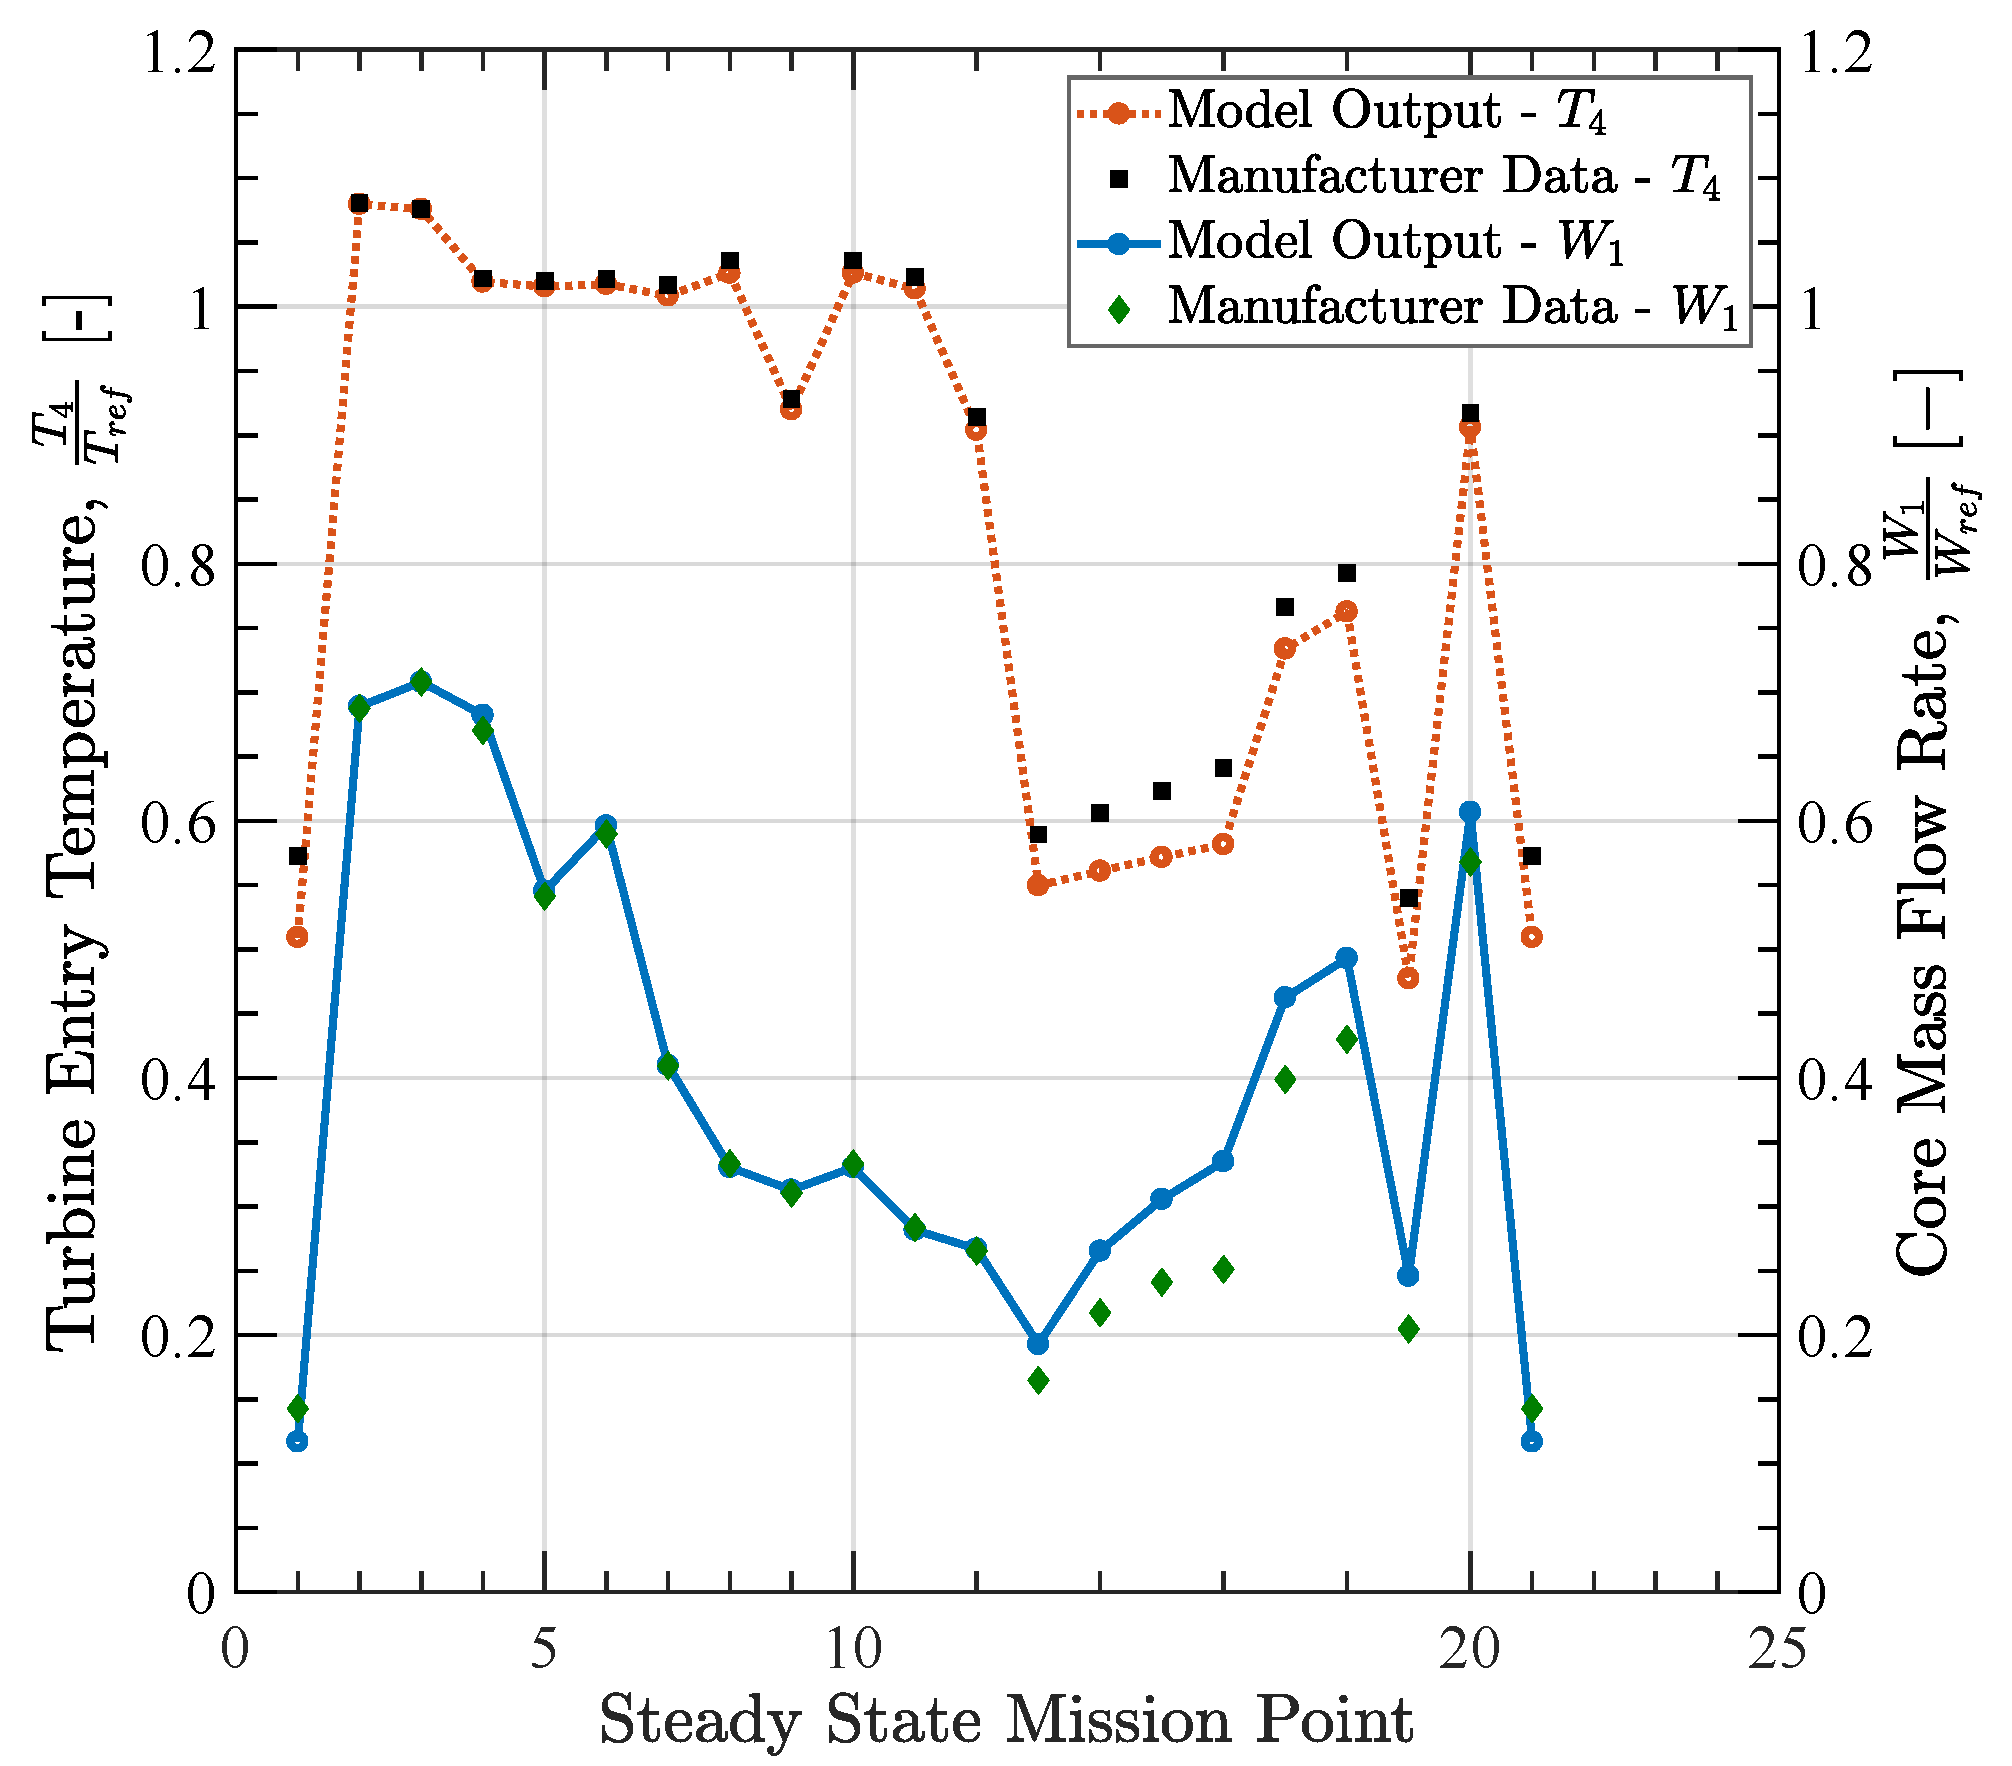
2.2.1. Engine Performance Model

A performance model of the Rolls-Royce RB211-524C was developed using the Numerical Propulsion System Simulation (NPSS), an object-oriented, nonlinear, aero-thermodynamic gas turbine performance code that allows off-design analysis through component map interpolation [27]. The effects of engine deterioration can be incorporated into NPSS performance predictions through the use of scalar audit factors, which modify the high pressure turbine mass flow rate, pressure ratio and efficiency. The methodology presented introduces methods to calculate these factors using numerical models, allowing for the inclusion of deterioration due to particle deposition in the engine performance prediction.
The model mimics the three spool design of the RB211-524C and is fuel flow controlled to obtain a fixed net thrust output. The model was validated using 20 steady-state operating points from an exemplar mission specified by the airframe manufacturer [28], which represents a typical passenger flight for a wide-body commercial aircraft. Each point in the mission corresponds to a fixed altitude and flight Mach number, at which the engine is commanded to provide a constant fuel flow rate. The results of this validation are shown in Figure 3 for the turbine entry temperature ( T 4 ) and core flow rate ( W 1 ). Generally, the model provides a good performance prediction across the operating range of the engine, particularly for high power-setting flight phases such as cruise, during which the two encounter events previously discussed occurred.
The accuracy of this prediction reduces for turbine entry temperatures and flow rates corresponding to flight conditions with low power settings such as during approach and landing phases in the example mission. This is thought to be a result of difficult-to-model shaft inertia terms, in which the influence grows for low power settings. In cases assessing degraded performance, which occurred at high power settings for the two aforementioned volcanic ash encounters reported in References [14,17], the control system response observed was used as inputs into the model. During these encounters, the fuel-to-air ratio and combustor entry pressure were maintained at fixed values by the engine control system.

2.2.2. Reduced-Order Accumulation Factor Model

The accumulation factor of particles ingested by an engine depends on the engine operating state, physical properties of the particles and NGV architecture. Our previous work developed a generalised approach encompassing these variables to predict the accumulation factor of particulate matter in gas turbine engines. This approach is based on two probabilities for a given particle: first, the probability of interaction, a measure of how likely the particle is to come into contact with an NGV during its transit through the engine, and second, the likelihood of an interacting particle sticking to the NGV following interaction, termed the probability of retention.

2.2.3. Interaction Probability

The probability of interaction depends on the inertial response of the particle to changes in the core gas flow and whether the particle retains sufficient inertia that it can deviate from flow streamlines and can interact with an NGV. The particle inertia can be quantified as a function of the fluid properties using the generalised momentum Stokes number, S t k g e n , proposed by Bojdo et al. [12].
S t k g e n = ρ p d p 18 ( R e p ψ ) ( N h ) U W 1
where U and W 1 are the velocity and mass flow rate on entry to the NGV stage; N and h are the number of NGVs and their height; d p , ρ p and R e p are the diameter, density and Reynolds number of the particle, respectively; and ψ is a correction factor to account for drag non-linearity on particles at high Reynolds numbers. Using this corrected form of the traditional Stokes number, Bojdo et al. [12] showed how the interaction probability, η i n t , of a particle can be predicted using a single function, the coefficients of which depend on the particle sphericity and nozzle guide vane geometry only. Thus, the interaction probability given by Equation (3) is independent from engine operating state. Particle shape significantly affects the probability of interaction and is not one of the terms generalised by the momentum Stokes number, leading to different curve fit coefficients a ¯ , b ¯ , c ¯ and d ¯ for particle sphericities, ϕ , of 1.00, 0.75 and 0.54 [12].
η i n t = a ¯ tanh b ¯ S t k g e n c ¯ + d ¯

2.2.4. Retention Probability

The probability of retention is a function of the thermal response of the particle to changes in the core gas path temperature along with its thermal properties of the particle itself. This thermal response can be quantified in terms of the particle properties and engine operating state using the generalised thermal Stokes number, S t k t h , g e n , proposed by Ellis et al. [13].
S t k t h , g e n = c p , p d p 2 ρ p W 1 12 k f N h ρ f T f T * ψ
where c p , p and T * are the particle specific heat capacity and softening temperature and where k f , ρ f and T f are the thermal conductivity, density and temperature of the flow at entry to the NGV stage, respectively. The probability of retention, η r e t , for a particle with a given generalised thermal Stokes number can be calculated using a five parameter sigmoid function based on a non-normalised version of the retention probability proposed by Ellis et al. [13].
η r e t = A A 1 + S t k t h , g e n c d e
This function represents a generalised form of the Energy-Based Fouling of Gas Turbines (EBFOG) particle deposition model derived by Casari et al. [29], which depends upon two empirically determined constants A and C 1 . The curve fit constants c , d and e can be calculated as functions of the constant C 1 using the following equations:
c = 7.85 × 10 7 C 1 2 + 5.86 × 10 4 C 1 + 7.89 × 10 1
d = 0.984 C 1 0.114
e = 3.400 × 10 3 ln ( C 1 ) + 4.101 × 10 1

2.2.5. Accumulation Factor

The final step in the reduced-order accumulation factor model is to combine probabilities of interaction and retention to quantify the likelihood of a single particle depositing and then to apply this to a distribution of sizes corresponding to a range of fixed generalised Stokes numbers. The interaction probability depends on the generalised momentum Stokes number, S t k g e n , and can be multiplied by the retention probability, which depends on the generalised thermal Stokes number, S t k t h , g e n , to give the probability of a particle depositing. The proportion of particles with a given diameter that deposit on the vane can then be determined by multiplying the fraction of each diameter in the normalised mass distribution, n 3 , by the product of its interaction, η i n t and retention, η r e t , probabilities, calculated using Equations (3) and (5), respectively. This gives the proportion of each discrete particle size in the distribution, which deposits on the vane, with examples of this process demonstrated in References [12,13]. From this, the proportion of the size distribution that is retained by the NGV can be derived by integrating the fraction of each particle size, which deposits between the minimum, d p , l o w e r , and maximum, d p , u p p e r , diameters in the distribution (Equation (9)). The ratio between this integral and that of the original distribution (equal to unity for a normalised distribution) yields the accumulation factor, ζ N G V .
ζ N G V = d p , l o w e r d p , u p p e r n 3 η i n t η r e t d ( d p )

2.2.6. NGV Throat Area Reduction

The Clarkson and Simpson [5] NGV deposition model given by Equation (1) permits the mass of particulate that deposits in the nozzle guide vane stage to be calculated but does not account for the influence of this on the flow path area between vanes and, thus, the flow rate through the turbine. This change in nozzle flow path area contributes to overall engine cycle performance loss by reducing the aerodynamic and thermodynamic performance of the high-pressure turbine. Assuming the mass of dust deposited, m d e p is distributed equally across the pressure surfaces of the vanes, the change in throat area, Δ A t h r , between adjacent NGVs can be calculated as a function of the un-degraded throat spacing between vanes, l t h r , as follows:
Δ A t h r = l t h r θ m d e p ρ d e p A N G V N
Equation (10) includes the conversion of the deposit mass to a corresponding volume ( m d e p ρ d e p N ) distributed across the area of each vane pressure surface A N G V . Understanding the bulk density of the deposit ( ρ d e p ) is therefore important in accurately determining the deposit volume and depends on the porosity of the deposits, as highlighted by Pearson and Brooker [30].
Given the functional relationship between the flow area and flow rate, the area change given by Equation (10) is a proxy for the restriction of core flow rate imposed by the deposit. Thus, we assume that the reduction in HPT flow rate is asymptotic with the same time constant as Equation (1). It follows that the assumption made by Döring et al. [6] as discussed in Section 2.1.5 that reductions in high-pressure turbine efficiency and pressure drop follow this asymptotic relationship with deposited mass is appropriate in this instance.

2.2.7. Deposit Distribution Severity

The non-uniform deposit topologies seen in Figure 1 arise due to particle interactions being preferentially concentrated at certain chord-wise positions on the vane depending on their inertia and ability to follow the core flow [26]. Topology variations also result from localised gradients in gas temperature, which promote deposition on relatively hot surfaces such as the section of vane onto which combustor exit nozzles are directed [26]. Surface temperature is also believed to play a role in deposit biasing; however, this is not currently accounted for in the reduced-order accumulation factor model and is therefore excluded from this analysis. Due to the non-uniformity of deposit thickness and an ever-decreasing area in the NGV annulus, it follows that deposition primarily in the NGV throat results in a greater reduction of flow capacity compared to a deposit at the leading edge, where the annulus area is greater. The final parameter in Equation (10), θ is the deposit distribution severity, which represents the extent of this throat area constriction.
Our novel approach numerically predicts the deposit distribution severity such that it takes a value in the range 0–1, representing a normalised chord-wise location at which the peak particle retention rate occurs for each of the generalised thermal Stokes numbers assessed by Ellis et al. [13]. A deposit distribution severity of unity is a worst case scenario in which all deposit occurs at the trailing edge of the vane in the nozzle throat, resulting in the greatest reduction in throat area. This depends on the chord-wise distribution of retention probability, which is a function of the particle thermal response and engine operating state [13] and can therefore be defined as a function of the generalised thermal Stokes number. By determining the chord-wise location of peak retention rate for particles with a range of generalised thermal Stokes numbers and curve-fitting the results, we obtain a five-parameter sigmoidal relationship between generalised thermal Stokes number and its corresponding deposit distribution severity, θ ^ , the coefficients of which are given by Equation (11).
θ ^ ( S t k t h , g e n ) = 0.860 + 1 0.860 ( 1 + ( S t k t h , g e n 0.694 ) 8.593 ) 0.142
The deposit distribution severity of a bulk dust with a range of particle sizes, θ , can be calculated by applying Equation (11). The corresponding generalised thermal Stokes number is calculated for each discrete diameter in the PSD and Equation (11) is used to compute the deposit distribution severity for each generalised thermal Stokes number. This is multiplied by the corresponding mass fraction in the normalised PSD ( n 3 ), giving the contribution of each generalised thermal Stokes number to the deposit distribution severity. Integrating the result over the range of diameters in the PSD as per Equation (12) gives the bulk severity factor.
θ = d p , l o w e r d p , u p p e r θ ^ ( S t k t h , g e n ) n 3 d ( d p )

2.2.8. Coupled Degradation Model

As deposition damage evolves in the high-pressure turbine, we expect the core gas temperature to increase and to in turn modify the inertial and thermal properties of the particles and core gas flow, resulting in varying interaction and retention probabilities. To obtain reliable predictions of NGV deposition damage and subsequent performance loss, the effect that a constantly changing engine operating state has on these variables needs to be accounted for in numerical models. This necessitates coupling the three separate models already described to allow the effect of degradation on the time and temperature dependencies of the accumulation factor to be captured. The model, outlined in Figure 4, achieves this by iterating through a mission specified as a series of time steps, evolving the NGV deposits at each stage and assessing their effect on engine performance and the accumulation factor.

2.2.9. Model Inputs

Configuration files are used to define input properties and constants related to the mission profile, engine, and NGV stage design and properties of the ingested particles (step No.1 in Figure 4). Inputs required for the mission include an altitude–time profile specified as steady-state points separated by a time-step Δ t at which the aircraft maintains a fixed Mach number and thrust requirement. The dust cloud concentration at each point in the mission profile is directly prescribed, but profiles can be specified as a function of altitude. Engine design inputs are required to assess the generalised Stokes numbers of particles and include the throat spacing between adjacent vanes. Additionally required is the geometry of the nozzle guide vane stage, including the number of vanes and vane pressure surface area. Particle inputs cover both inertial and thermal properties along with the particle size distribution. Empirical model constants for the EBFOG particle fate model used to predict the probability of retention are also required. A full list of the required particle properties is given in Table 1.

2.2.10. Coupled Algorithm

The first step in the analysis is to establish engine performance over the desired mission for a clean case in which there is no degradation during the mission. This initial assessment may account for pre-existing degradation if this information is available. The model maintains a fixed thrust specified in the mission profile for each steady-sate point, allowing the fuel–air ratio at each point to be determined.
A degraded instance of the model is then executed by commanding the engine to maintain the fixed air–fuel ratio determined in the clean mission for each steady-state point and thus allowing the net thrust to respond to the new engine condition (step No.3 in Figure 4). This replicates the engine controller behaviour observed during the two encounter events, where thrust gradually deteriorated over time, with the engine maintaining a fixed air–fuel ratio and combustor delivery pressure [14,17]. For a fixed fuel–air ratio, NPSS returns the corresponding core temperatures and pressures, from which fluid properties at the NGV stage inlet such as the gas density and thermal conductivity are derived. These properties are critical in calculating the generalised Stokes numbers used to determine the interaction and retention probabilities. Thus, combining these engine performance derived properties with the particle inputs allows the accumulation (step No.4) and deposit distribution severity at the given time-step to be computed.
The NGV damage model (step No.5) is then used to calculate the total mass deposited and the reduction in high-pressure turbine throat area. This is then used to update the NPSS scalar audit factor terms for the HPT mass flow rate, efficiency and pressure drop following the assumption of Döring et al. [6] that these can be considered equal as a first-order approximation. The engine performance is then updated at the next time-step in the mission accounting for the damage that occurred previously, with the solution proceeding iteratively and evolving NGV damage-induced performance loss through each time-step.

2.2.11. Input Variable Randomisation

The coupled degradation model allows the engine degradation to be calculated over time if the mission profile, dust concentration, encounter duration and properties of the ingested particulate are known. However, in a real encounter event, these variables are not known precisely and can vary significantly, potentially over orders of magnitude, with compounding uncertainties for multiple input variables leading to large errors in the predicted performance deterioration.
The final facet of the coupled algorithm is the randomisation module (step No.2 in Figure 4), which allows Monte Carlo analyses to be carried out to address this uncertainty in the model inputs. The randomisation module allows plausible ranges for each input to be prescribed, from which the algorithm samples a value within the range specified for each variable using a uniformly distributed random number generator, and runs the coupled degradation model. This allows the effect of multiple combinations of ambiguous input variables on engine performance deterioration to be assessed, allowing a statistical approach to be taken in predicting the performance loss experienced by the engine. It is this module that we focus on when assessing the two historic ash encounter events.

2.2.12. Damage Assessment of Historic Encounter Events

In order to apply the methodology to the two volcanic ash encounter events already described, which have uncertainties in the ash cloud concentration and the particle encounter duration, we first define plausible ranges for the two volcanic ashes encountered during the two events. Physical properties of the ash encountered during these two events are also uncertain; however, likely ranges can be estimated based on literature sources for the same types of ash. Empirically determined inputs such as the retention probability model constants A and C 1 are more ambiguous and do not currently have well-defined ranges. As an initial approximation, we constrain these variables over three orders of magnitude, considered a reasonable range based upon the limited literature [29]. A summary of the property input ranges used to emulate the Galunggung and Soputan encounters are shown in Table 1 and Table 2, respectively.

2.2.13. Independence of Outcomes

With the inputs defined in Table 1 and Table 2, we used the randomisation module of the model to carry out a Monte Carlo analysis for different combinations of these input properties. For each event, the model was computed for three cases corresponding to a different average particle sphericity. This is included due to its influence on the probability of interaction of a particle and, hence, the accumulation factor, with the interaction probability being dependent on particle shape [12]. The model was run for 4000 cases, each with a different set of randomly selected inputs based on the input property ranges in Table 1 and Table 2. This was deemed appropriate by successively doubling the number of cases and by observing the average changes in high-pressure turbine throat area change and exhaust gas temperature. Doubling from 2000 to 4000 cases resulted in a 0.5% change in both of these metrics and was deemed sufficient. NPSS is capable of predicting the engine surge margin for a combination of commanded steady state performance and level of degradation and can therefore identify a combination of inputs that are sufficient to surge the engine. Despite this, NPSS still attempts to solve the system of equations to resolve the steady-state engine performance without convergence. To account for this, the algorithm was set up to identify any cases in which the reduction in nozzle throat area was sufficient for surge to be predicted and thus would have resulted in an un-physical performance prediction. These cases are then neglected when predicting degraded performance trends for the engine.

2.2.14. Predicting Empirical Constants

The coupled modelling approach can also be used to estimate the empirical constants that underpin the probability of retention model, A and C 1 . To do this, we execute the Monte Carlo approach for 4000 cases with randomly selected inputs. To estimate the two empirical constants, we first determine the changes in engine performance, specifically the reduction in high-pressure spool speed and rise in exhaust gas temperature for each case. These cases are then filtered to determine those that result in a solution that produces both an EGT rise and HP spool speed reduction that falls within the ranges observed during the encounter event. This is a range of values due to the fact that the four engines involved in each encounter degrade at varying rates and therefore experience different reductions in performance. For these down-selected cases, we then produce histograms of the variables A and C 1 , which were selected as the inputs for each and fit probability distributions to the data, from which a mean and confidence interval for each constant in the retention probability model can be predicted.

3. Results

3.1. Accumulation Factor Model Validation

The Galunggung event provides a means to validate the reduced-order accumulation factor model, as the reported post-event estimations of NGV throat area change for the four engines involved in the encounter can be compared to the Monte Carlo predictions. The histograms shown in Figure 5 can be plotted and represent distributions of post-event nozzle guide vane throat area change for three discrete particle sphericities as predicted by the coupled model. Normal probability density functions have been fit to the data and used to estimate the mean and standard deviation of the NGV throat area change, with a one standard deviation (68%) confidence interval for this prediction defined. These are shown in Figure 5 along with throat area reductions estimated by the OEM for the four engines involved in the event.
For perfectly spherical particles ( ϕ = 1.00 ), the predicted mean throat area reduction is 8.5%, reducing to 7% for a sphericity of ϕ = 0.54 , where particles are less likely to interact with and deposit on the vane due to increased drag [12]. The predicted throat area reductions are generally at the lower limit of the range reported by the OEM, with the mean for sphericities of ϕ = 1.00 , 0.75 falling within the observed range and that for a sphericity of ϕ = 0.54 falling outside. The difference in mean throat area reduction across these three sphericities is less than 1.5% and small in comparison to the 10% area change variation, which defines the 68% confidence interval upper and lower limits, suggesting that particle shape can be considered second-order compared to the other input properties in the Monte Carlo analysis. For all results presented herein, a mean sphericity of ϕ = 0.75 is assumed on the basis of other basaltic–andesite ashes that exhibited mean sphericities between 0.7–0.8 [9] and the implausible proposition that all particles ingested during the event were perfectly spherical.
The calculated one standard deviation confidence intervals in Figure 5 span a relatively large range (10%), which is comparable to the different throat area reductions reported by the OEM for the four engines involved. This indicates that, in the absence of specific inputs relating to the encountered ash, the Monte Carlo approach and coupled degradation model is appropriate and predicts post-event NGV throat area changes that reflect observations from real-life engine operation. Given the relation between standard deviation and input uncertainty, the large confidence intervals in these predictions are likely due to the number of variables and the order of magnitude ranges over which some of these vary. Conservatively defined limits on these ranges lead to widened confidence intervals on the fitted distribution, and it is therefore reasonable to expect that, with more precise input data, the size of these confidence intervals would reduce.
Figure 5 shows a number of cases that result in throat area reductions greater than 20% and predict a surge event. This is higher than the 7–15% range reported for the engines that surged in the encounter [14], likely due to the model results representing a surge margin loss caused by a hypothetical scenario where NGV deposition is the only damage mechanism. In reality, surge margin loss is driven by a combination of turbine deposition and compressor erosion. However, neither the latter nor the effects of deposition on the HPT rotors were considered, but whilst unlikely to significantly change flow path areas, both would have enhanced the reductions in HPT efficiency and pressure drop. It is therefore reasonable to expect that incorporating these additional damage mechanisms would reduce the model predicted throat area change for surge.

3.2. Coupled Algorithm Validation

The results presented in Figure 5 show the ability of the reduced-order accumulation factor model to predict NGV throat area reduction but do not indicate how well the coupling between NGV deposition and engine performance models translates this into a prediction of performance degradation. For the Galunggung and Soputan events, sufficient on-wing data exist to estimate the performance degradation after an encounter, which in both cases manifested as steadily increasing exhaust gas temperature and a gradual reduction in the high-pressure spool speed (See Section 2.1.1). Whilst not explicitly stated in References [14,17], it is also possible to estimate pre-existing degradation prior to the encounters by comparing expected performance in a clean state with measured data prior to divergence during the ash cloud encounters. For each Monte Carlo case, the EGT increase and reduction in HP spool speed have been calculated whilst accounting for pre-existing changes, with the results of this allowing the same statistical analysis used to assess NGV throat area reduction to be carried out for the two events.

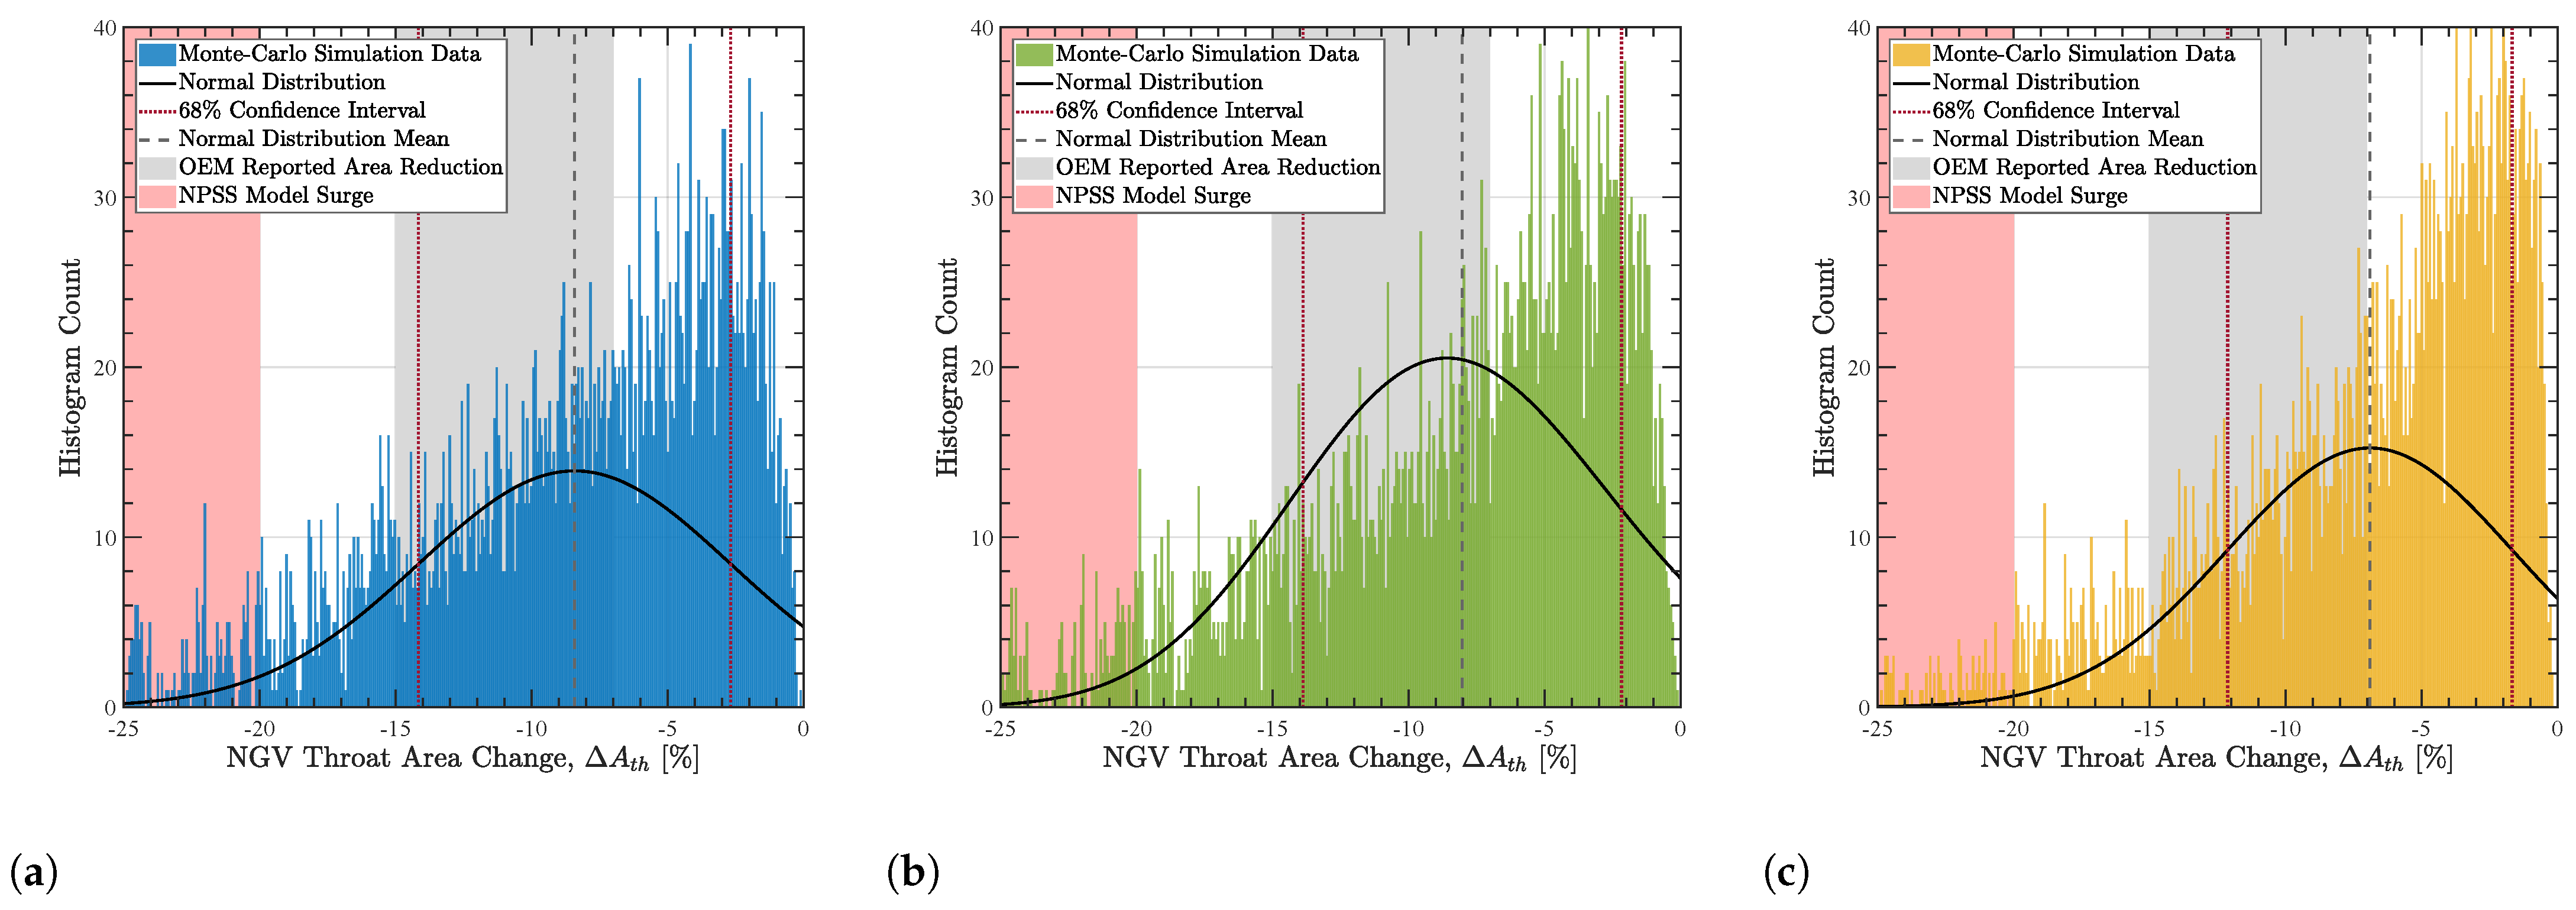
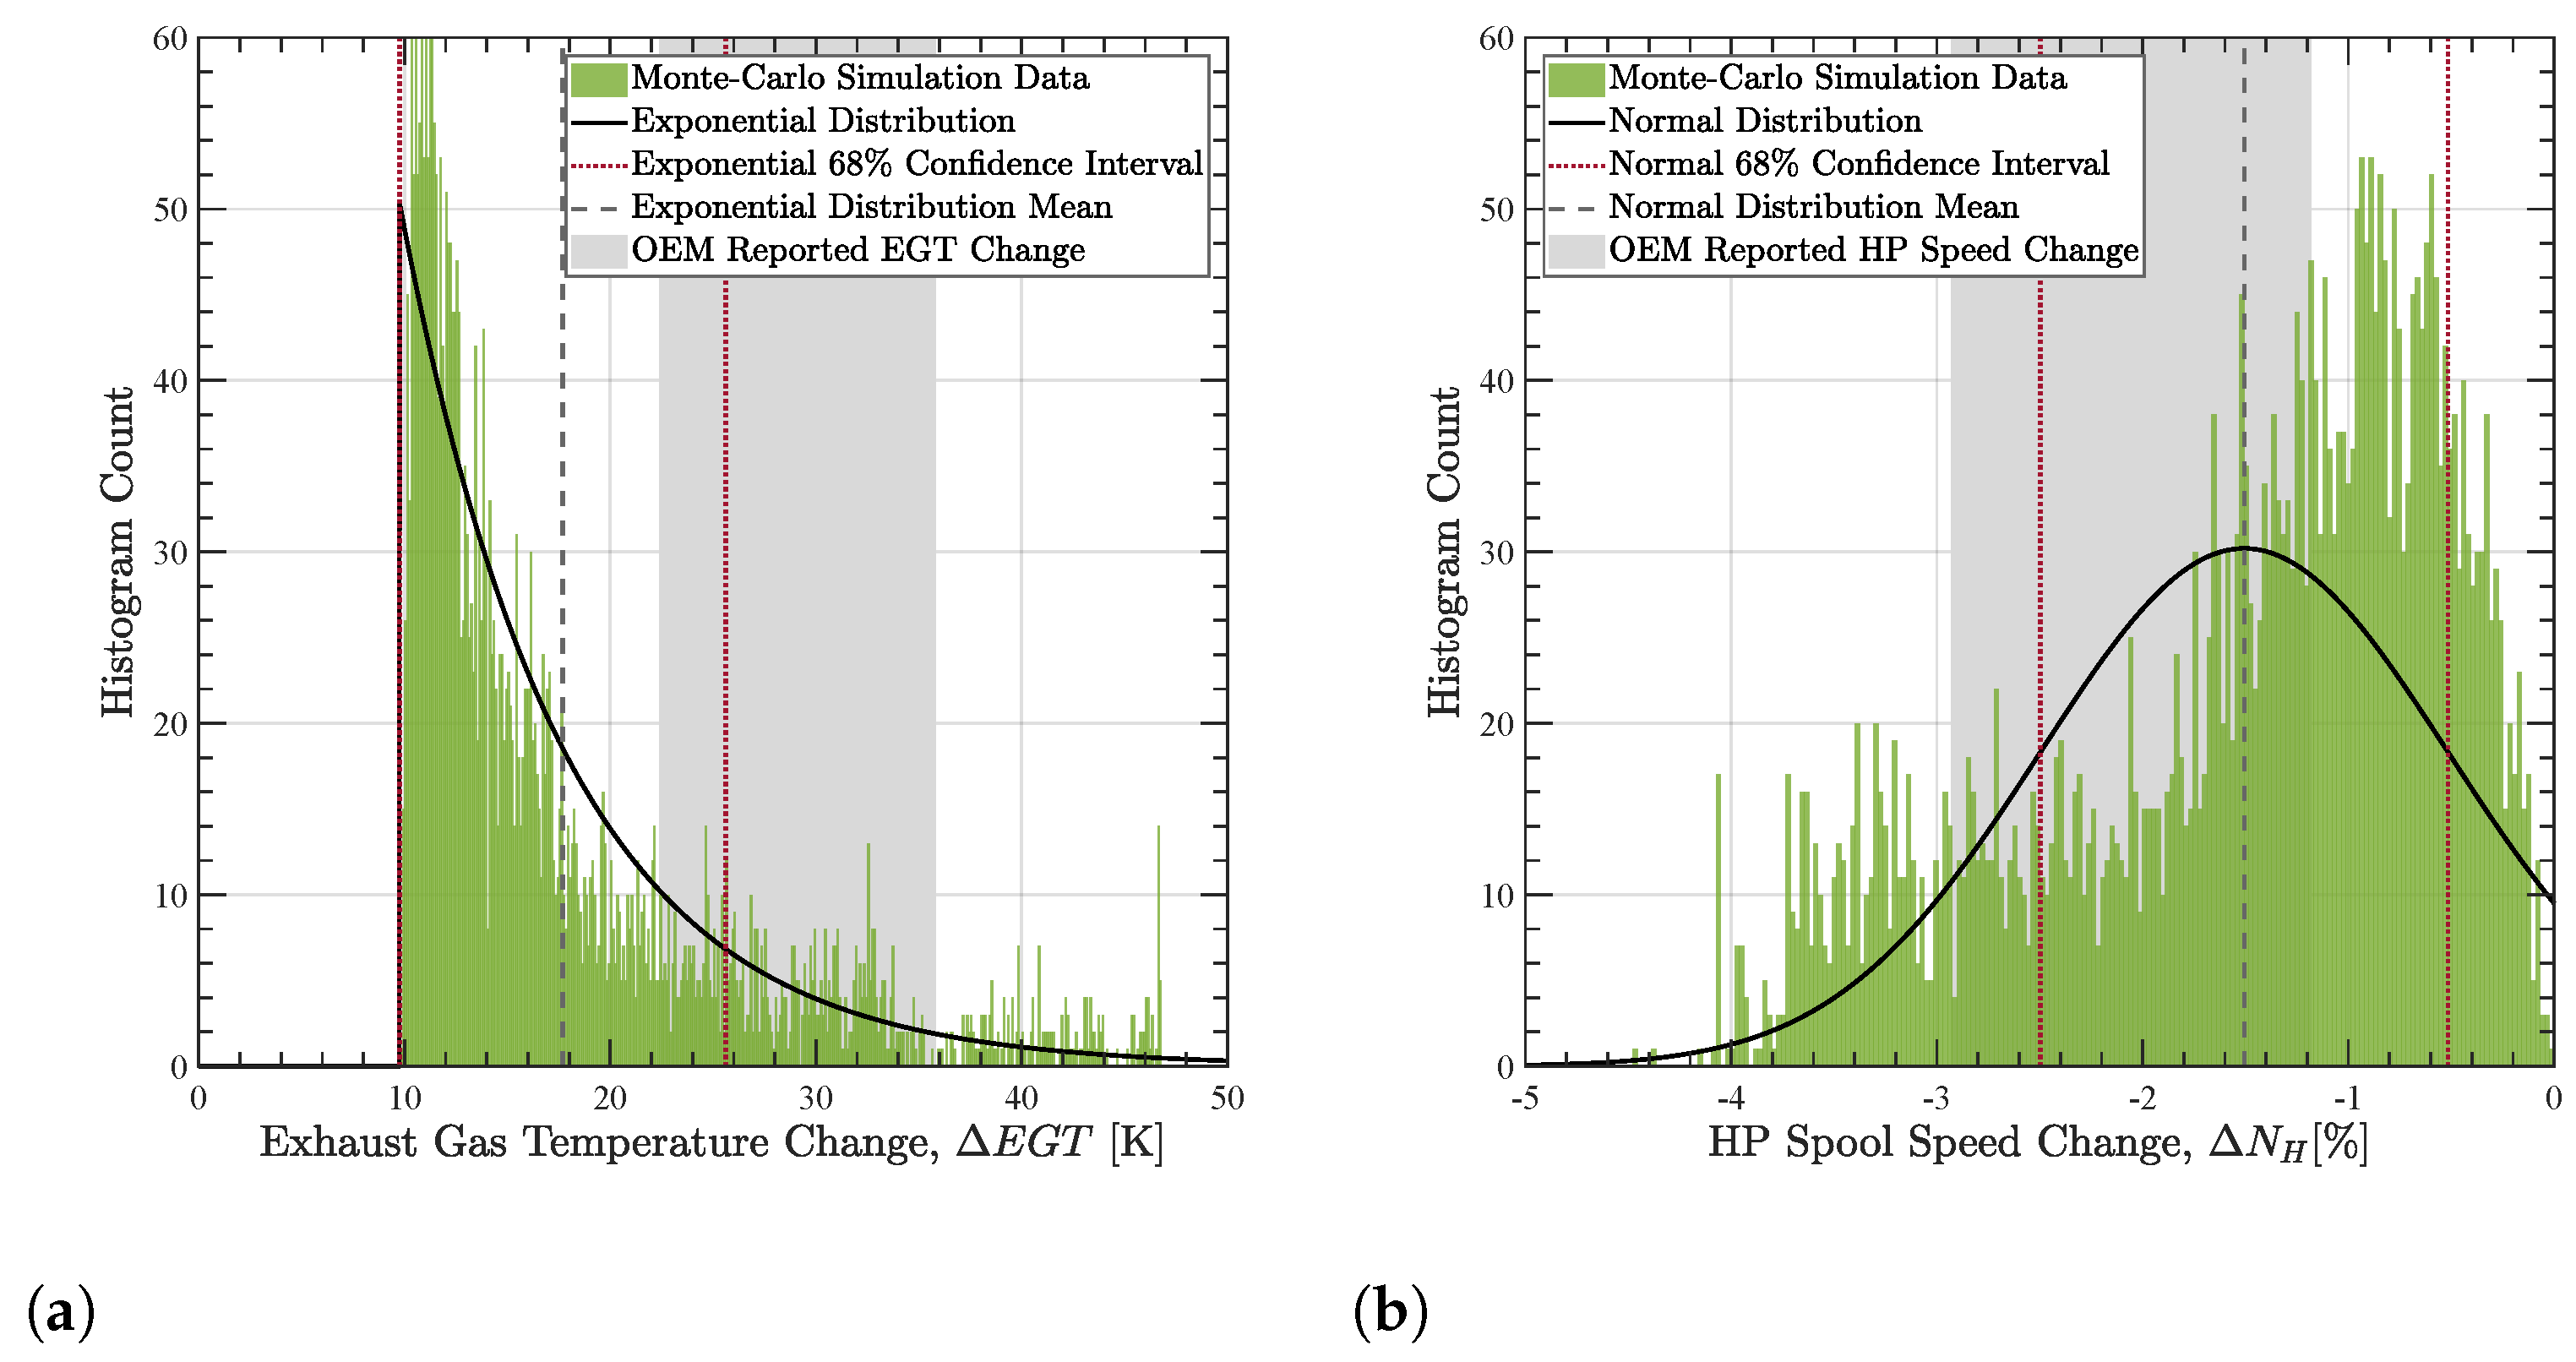
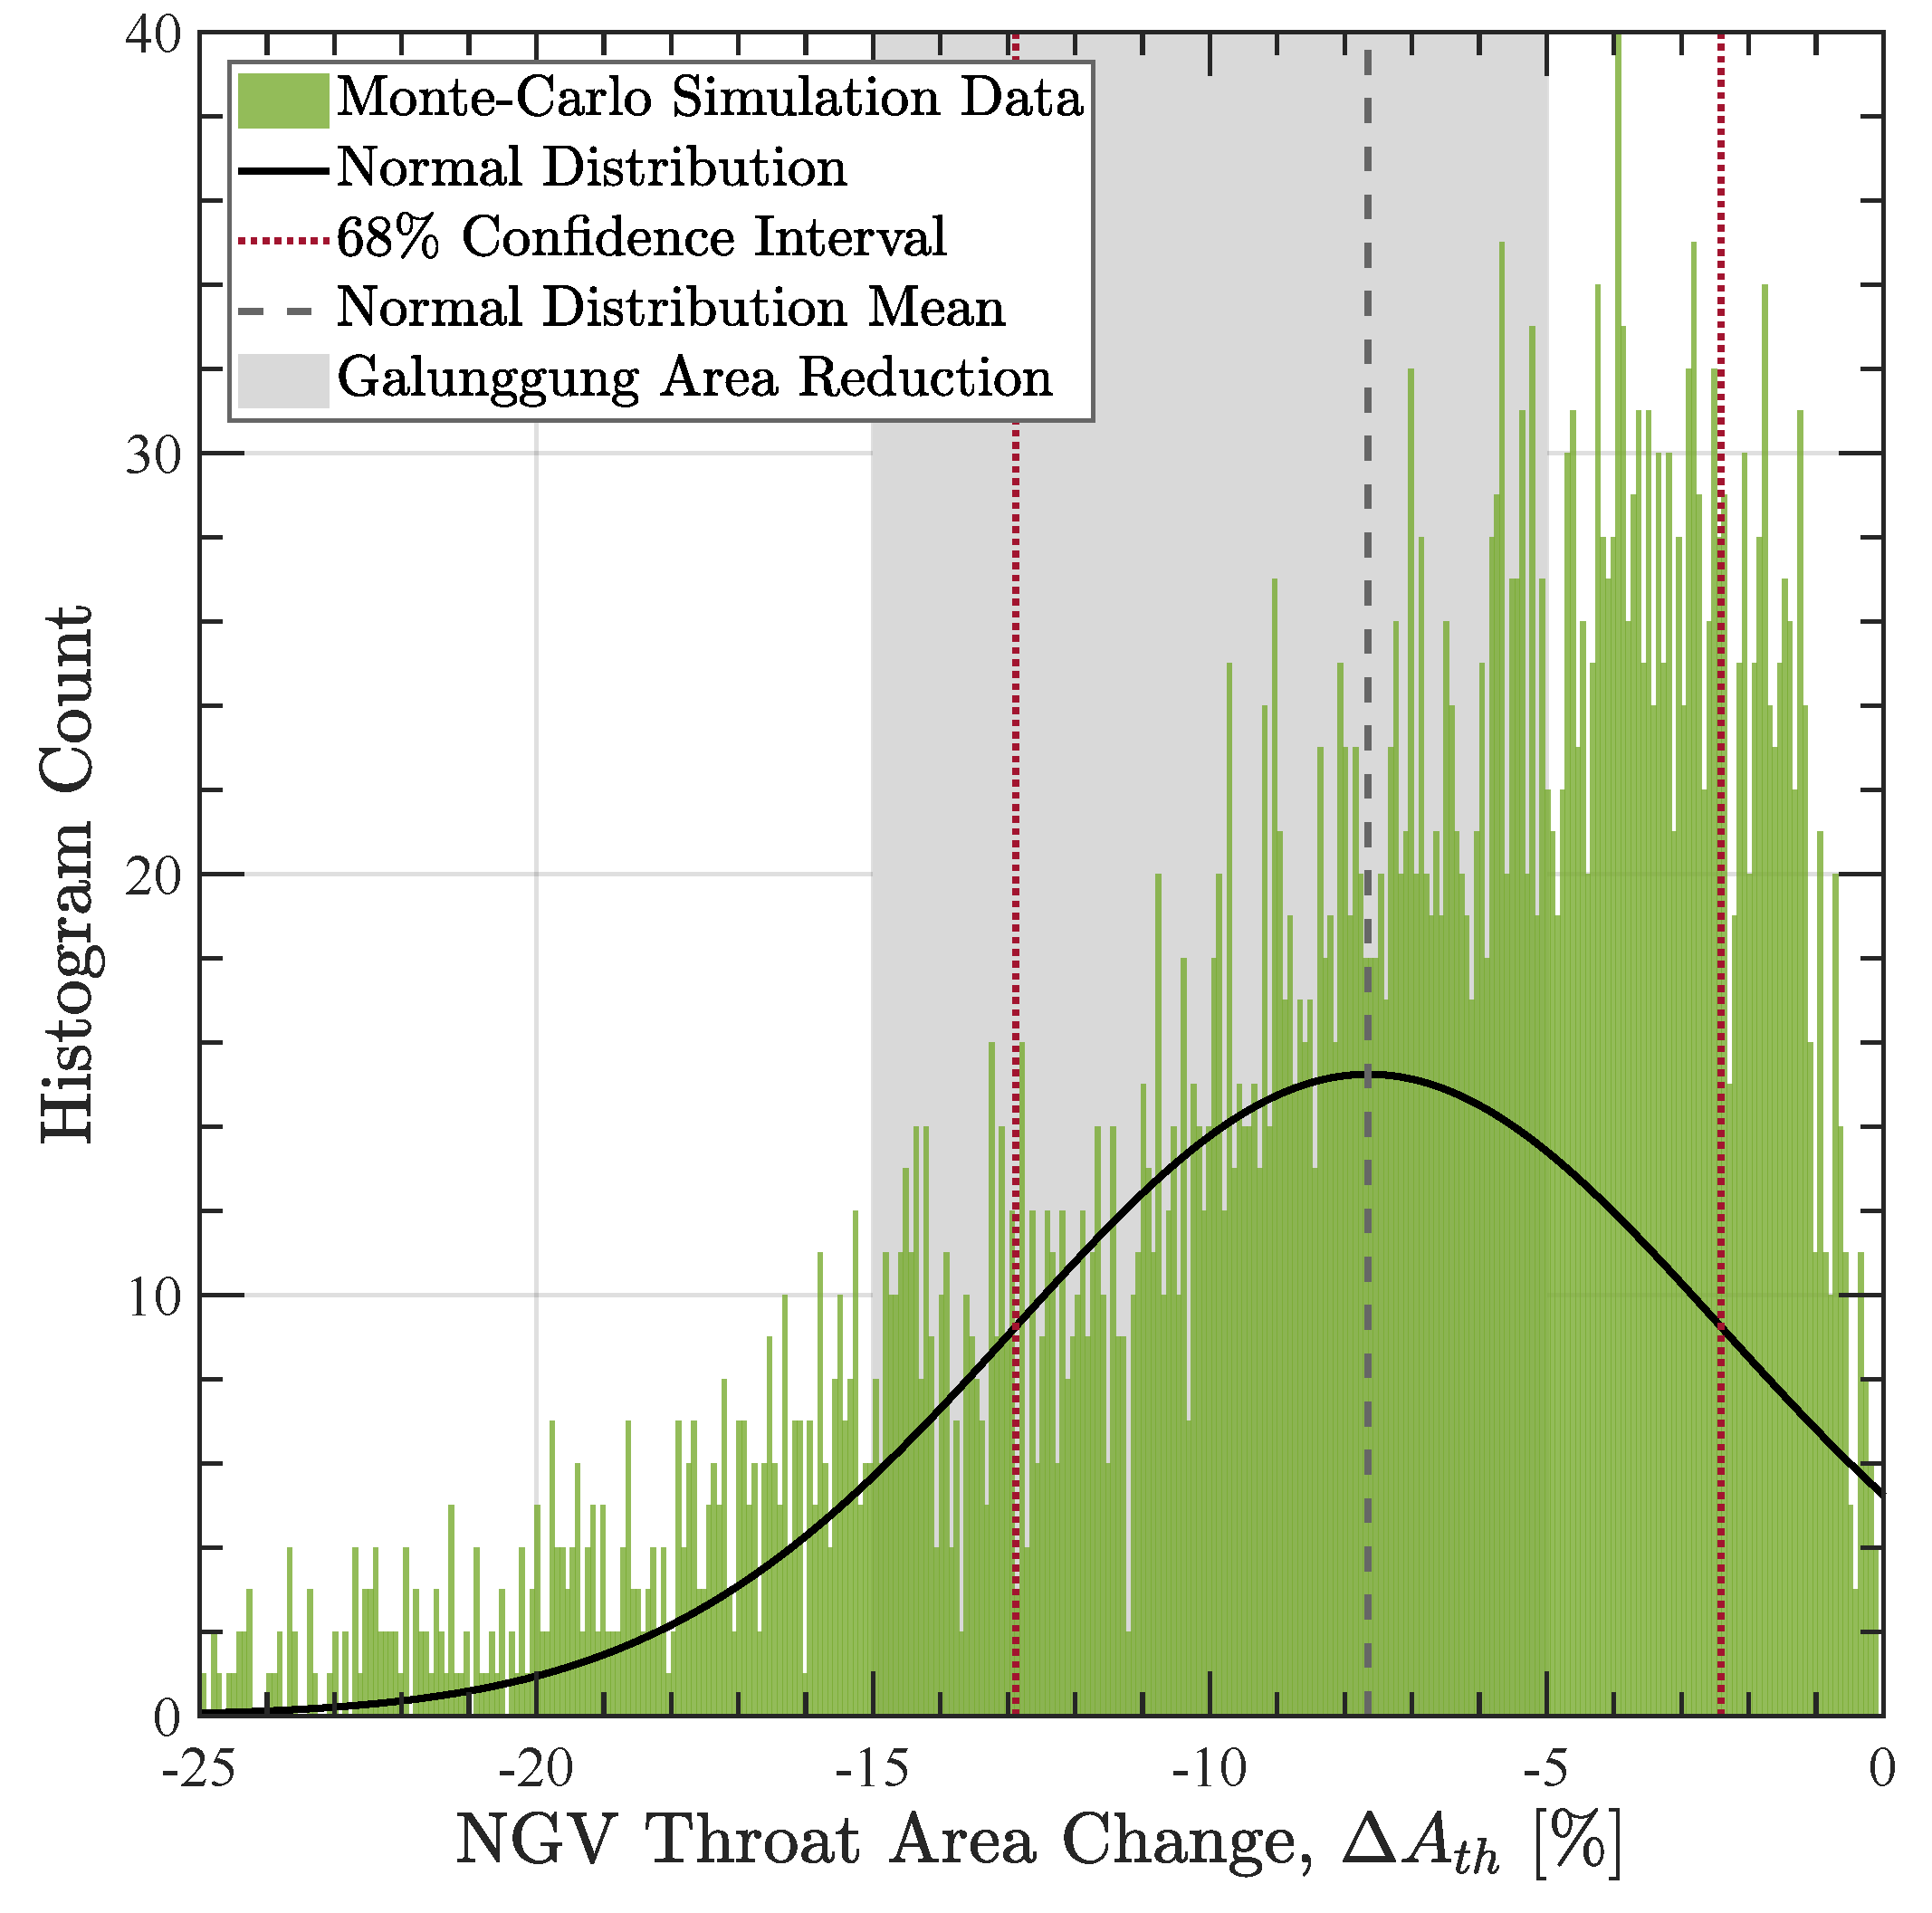
3.2.1. 1982 Galunggung Encounter

The predicted exhaust gas temperature increase and reduction in high-pressure spool speed for the Galunggung event are represented by the histograms in Figure 6a,b, respectively. For each, a probability distribution has been fitted to the histogram data, from which the mean and corresponding one standard deviation confidence intervals for EGT increase and HP spool speed change can be estimated and compared to the performance loss range observed for the four engines involved in the encounter. Figure 6a shows that the coupled model under-predicts changes in EGT, with the distribution mean of 18 K falling outside the range reported for the four engines in the event. However, the upper 68% confidence limit of 26 K falls within the OEM reported range (22–36 K), with the difference between this and the predicted mean being a relatively small discrepancy, around 1% of the total EGT of approximately 1000 K and much lower than a typical installed EGT margin of 100 K. This suggests that all four of the engines surged before the EGT margin could reduce to such a point that the red-line limit was reached and supports the observation of the OEM that all four engines breached their EGT red-line limit but only after the initial surge event [14].
The reduction in high-pressure spool speed is better predicted, as shown by Figure 6b, with the mean reduction in spool speed and over half of the 68% confidence interval falling within the range of HP spool speed reductions reported by the OEM. The predicted mean is at the lower end of the range observed for the four engines, which is understandable given that pre-existing changes in HP spool speed for the four engines were unknown and could not be incorporated in this prediction. It is therefore plausible that the predicted mean in Figure 6b represents an under-prediction of the spool speed reduction, with the confidence in this prediction also expected to improve with reducing ranges for the Monte Carlo algorithm input data.
The range of OEM reported performance changes in Figure 6 reflect differing responses in the four engines when exposed to the same environment, with varying exposure durations and levels of throat area closure required to induce surge. It can be determined how many of the 4000 Monte Carlo simulations provide a set of inputs that satisfy the range of performance degradation reported by the OEM and therefore the changes in NGV throat area that result in surges. An analysis can also be carried out on an engine-by-engine basis with the recorded performance loss for each engine taken and a ± 5 % variation allowed in the reported EGT and HP spool speed for the engine under consideration. Table 3 shows how many of the 4000 computed cases predict EGT rises and HP spool speed reductions that fall within these limits for all engines and then each respective engine along with the number of cases that satisfy both conditions simultaneously.
The cases that satisfy the recorded performance loss for both EGT and N3 can be used to estimate the reduction in NGV throat area at the point of surge and therefore the failure point for each of the four engines. To do this, the mean NGV throat area change of the down-selected cases is computed for each engine and recorded in Table 3, with the predicted range of 12–17% throat area loss for the four engines involved in the event larger than the 7–15% reduction reported by the OEM. This over-estimation of the throat area change required for engine failure is due to the model being limited to NGV deposition damage only, with the throat area reduction for surge expected to reduce as additional damage mechanisms are accounted for.
Table 3 also indicates how the predicted throat area changes for the four engines reflect the failure sequence observed during the event, with the first to fail (engine #4) subject to the lowest predicted area reduction. This engine also had the highest number of completed flight cycles and is likely to have been exhibiting the greatest pre-existing degradation of EGT and surge margins prior to the event. Therefore, the tolerable throat area reduction prior to the remaining surge margin being expended was reduced in comparison to the other engines resulting more rapid failure. By contrast, engine #3 failed last, with a predicted NGV throat area reduction of 17%, suggesting that this engine had a larger remaining EGT and that surge margins on entry to the ash cloud could therefore tolerate further deposition and a greater reduction in throat area before surging.
This observation highlights the importance of understanding how pre-existing degradation contributes to reduced EGT and surge margins prior to an encounter event in order to allow for accurate predictions of the engine failure point, with this prediction required on an engine-by-engine basis. In the future, the initial state of degradation prior to the encounter event should be included in the coupled degradation model in order to account for this additional uncertainty.

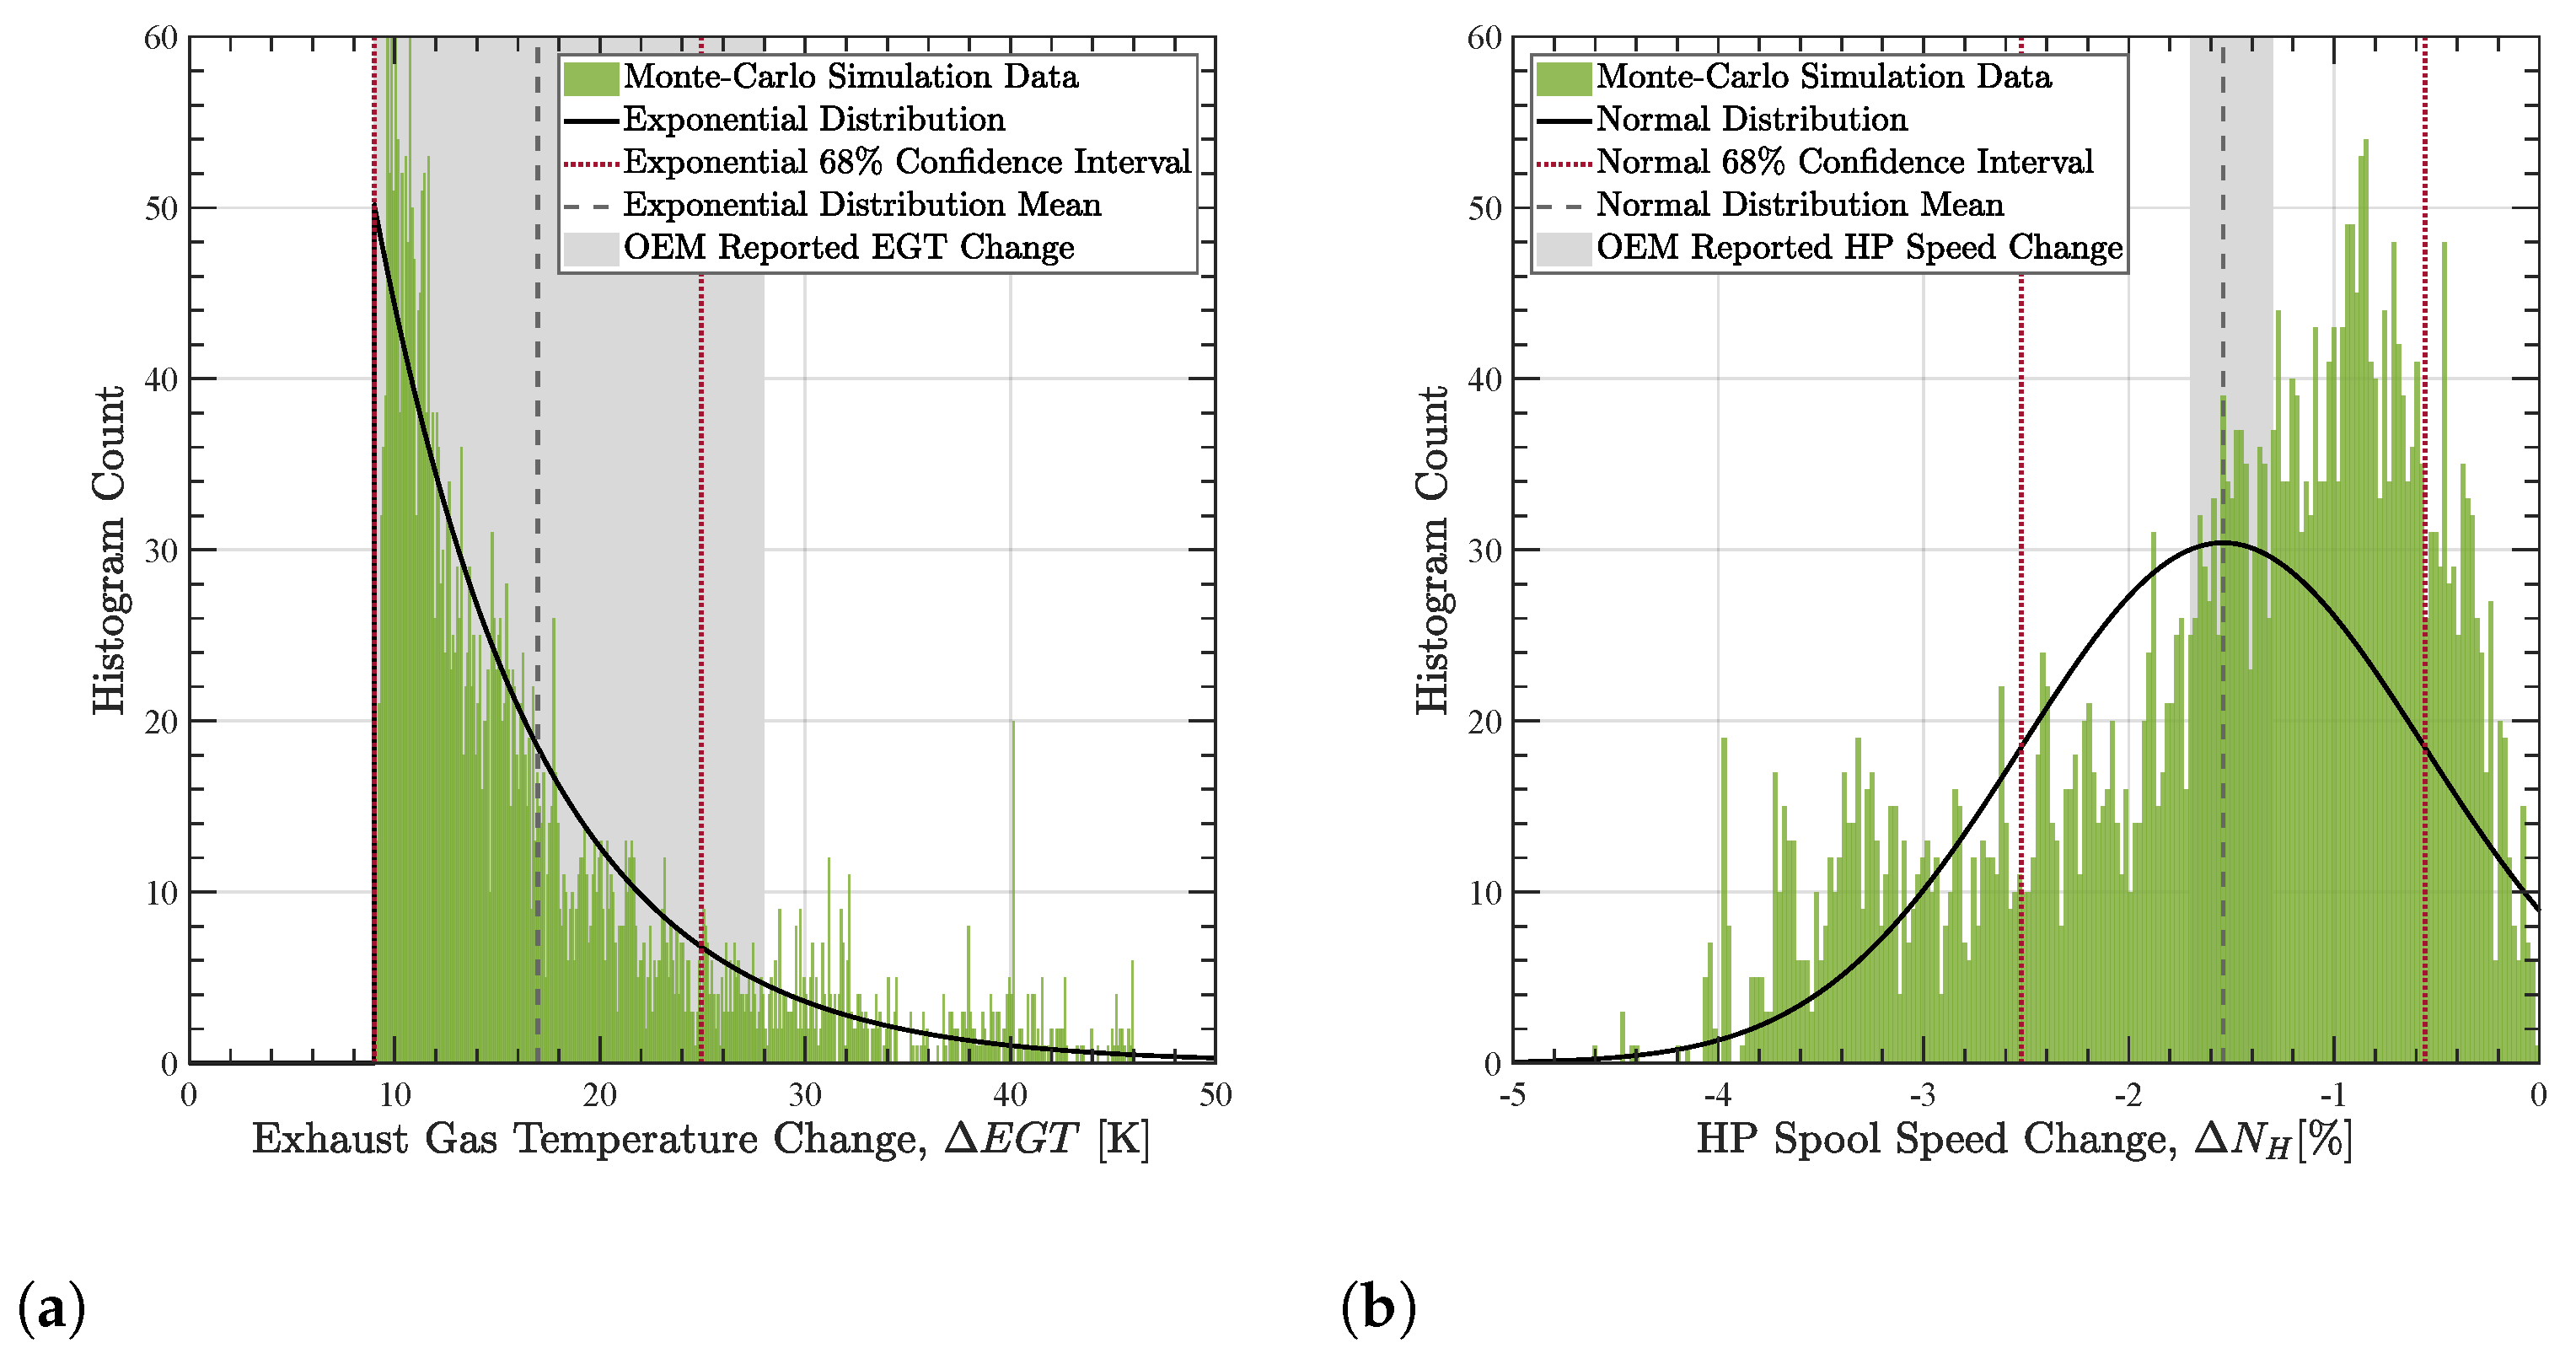
3.2.2. 1985 Soputan Encounter

The same analysis has been carried out for the model predictions of performance degradation during the Soputan event. We see in Figure 7a,b that the predicted mean changes in HP spool speed and EGT are both well captured by the coupled model, with the predictions falling inside the OEM quoted performance loss range. For the HP spool speed, the whole OEM reported range falls within one standard deviation (68% CI) of the mean, suggesting high certainty in the prediction of this parameter. The model predicts an EGT rise of 16 K, which is within the relatively large OEM reported range (9–28 K) and significantly smaller than a typical installed EGT margin (approximately 100 K). It is therefore prudent to assume that, during the event, EGT did not exceed its red-line limit for any of the four engines, a conclusion commensurate with flight crew observations during the event that performance of all four engines remained within specified limits [17].
Generally, for the Soputan event, we observe smaller ranges for the measured performance loss compared to the Galunggung event, particularly in terms of the HP spool speed (Figure 7b). These smaller ranges arise due to the fact that the range of flight cycles since the most recent overhaul for the four engines was over half of that for the Galunggung engines (i.e., the difference between the engine with the maximum and minimum number of cycles). Thus, the state of the four engines on entry to the ash cloud was more closely matched compared to the Galunggung event.
The coupled degradation model approach to predict throat area reduction was verified and the coupling of this with an engine performance model was shown to predict a performance loss that is representative of the limited observations made by the OEM. This allows for a final analysis to be carried out for the Soputan event, which is to predict the throat area reduction experienced during the encounter, something that was not recorded after the event due to the continued operation of the engines for a number of hours after, during which large quantities of the accumulated ash were shed [17].
Figure 8 shows the predicted throat area change for the Soputan event along with its confidence interval, with the mean reduction in throat area predicted to be approximately 8% with a one standard deviation confidence interval of 2.5–13%. Comparing this to the Galunggung event, in which the engines surged after an estimated loss of 7–15% throat area, it is conceivable that engines in the Soputan event could have surged had the exposure duration lasted just a minute or two longer. However, surge did not happen, and the aircraft continued to its destination, suggesting that, despite being of the same type, the engines involved in this event were more tolerant to damage than those in the Galunggung event. This behaviour can be explained by the relative age of the four engines compared to their counterparts in the Galunggung event, with the Soputan engines having, on average, less than half the number of flight cycles since their most recent overhaul and larger surge margin remain upon entry to the ash cloud. This demonstrates the rapid nature of deposit evolution during these high concentration events, further highlighting the need to understand existing engine degradation prior to an encounter and showing the importance of quantifying the fine margins between areas of possible and probable safety implications in the DEvAC chart (Figure 2).

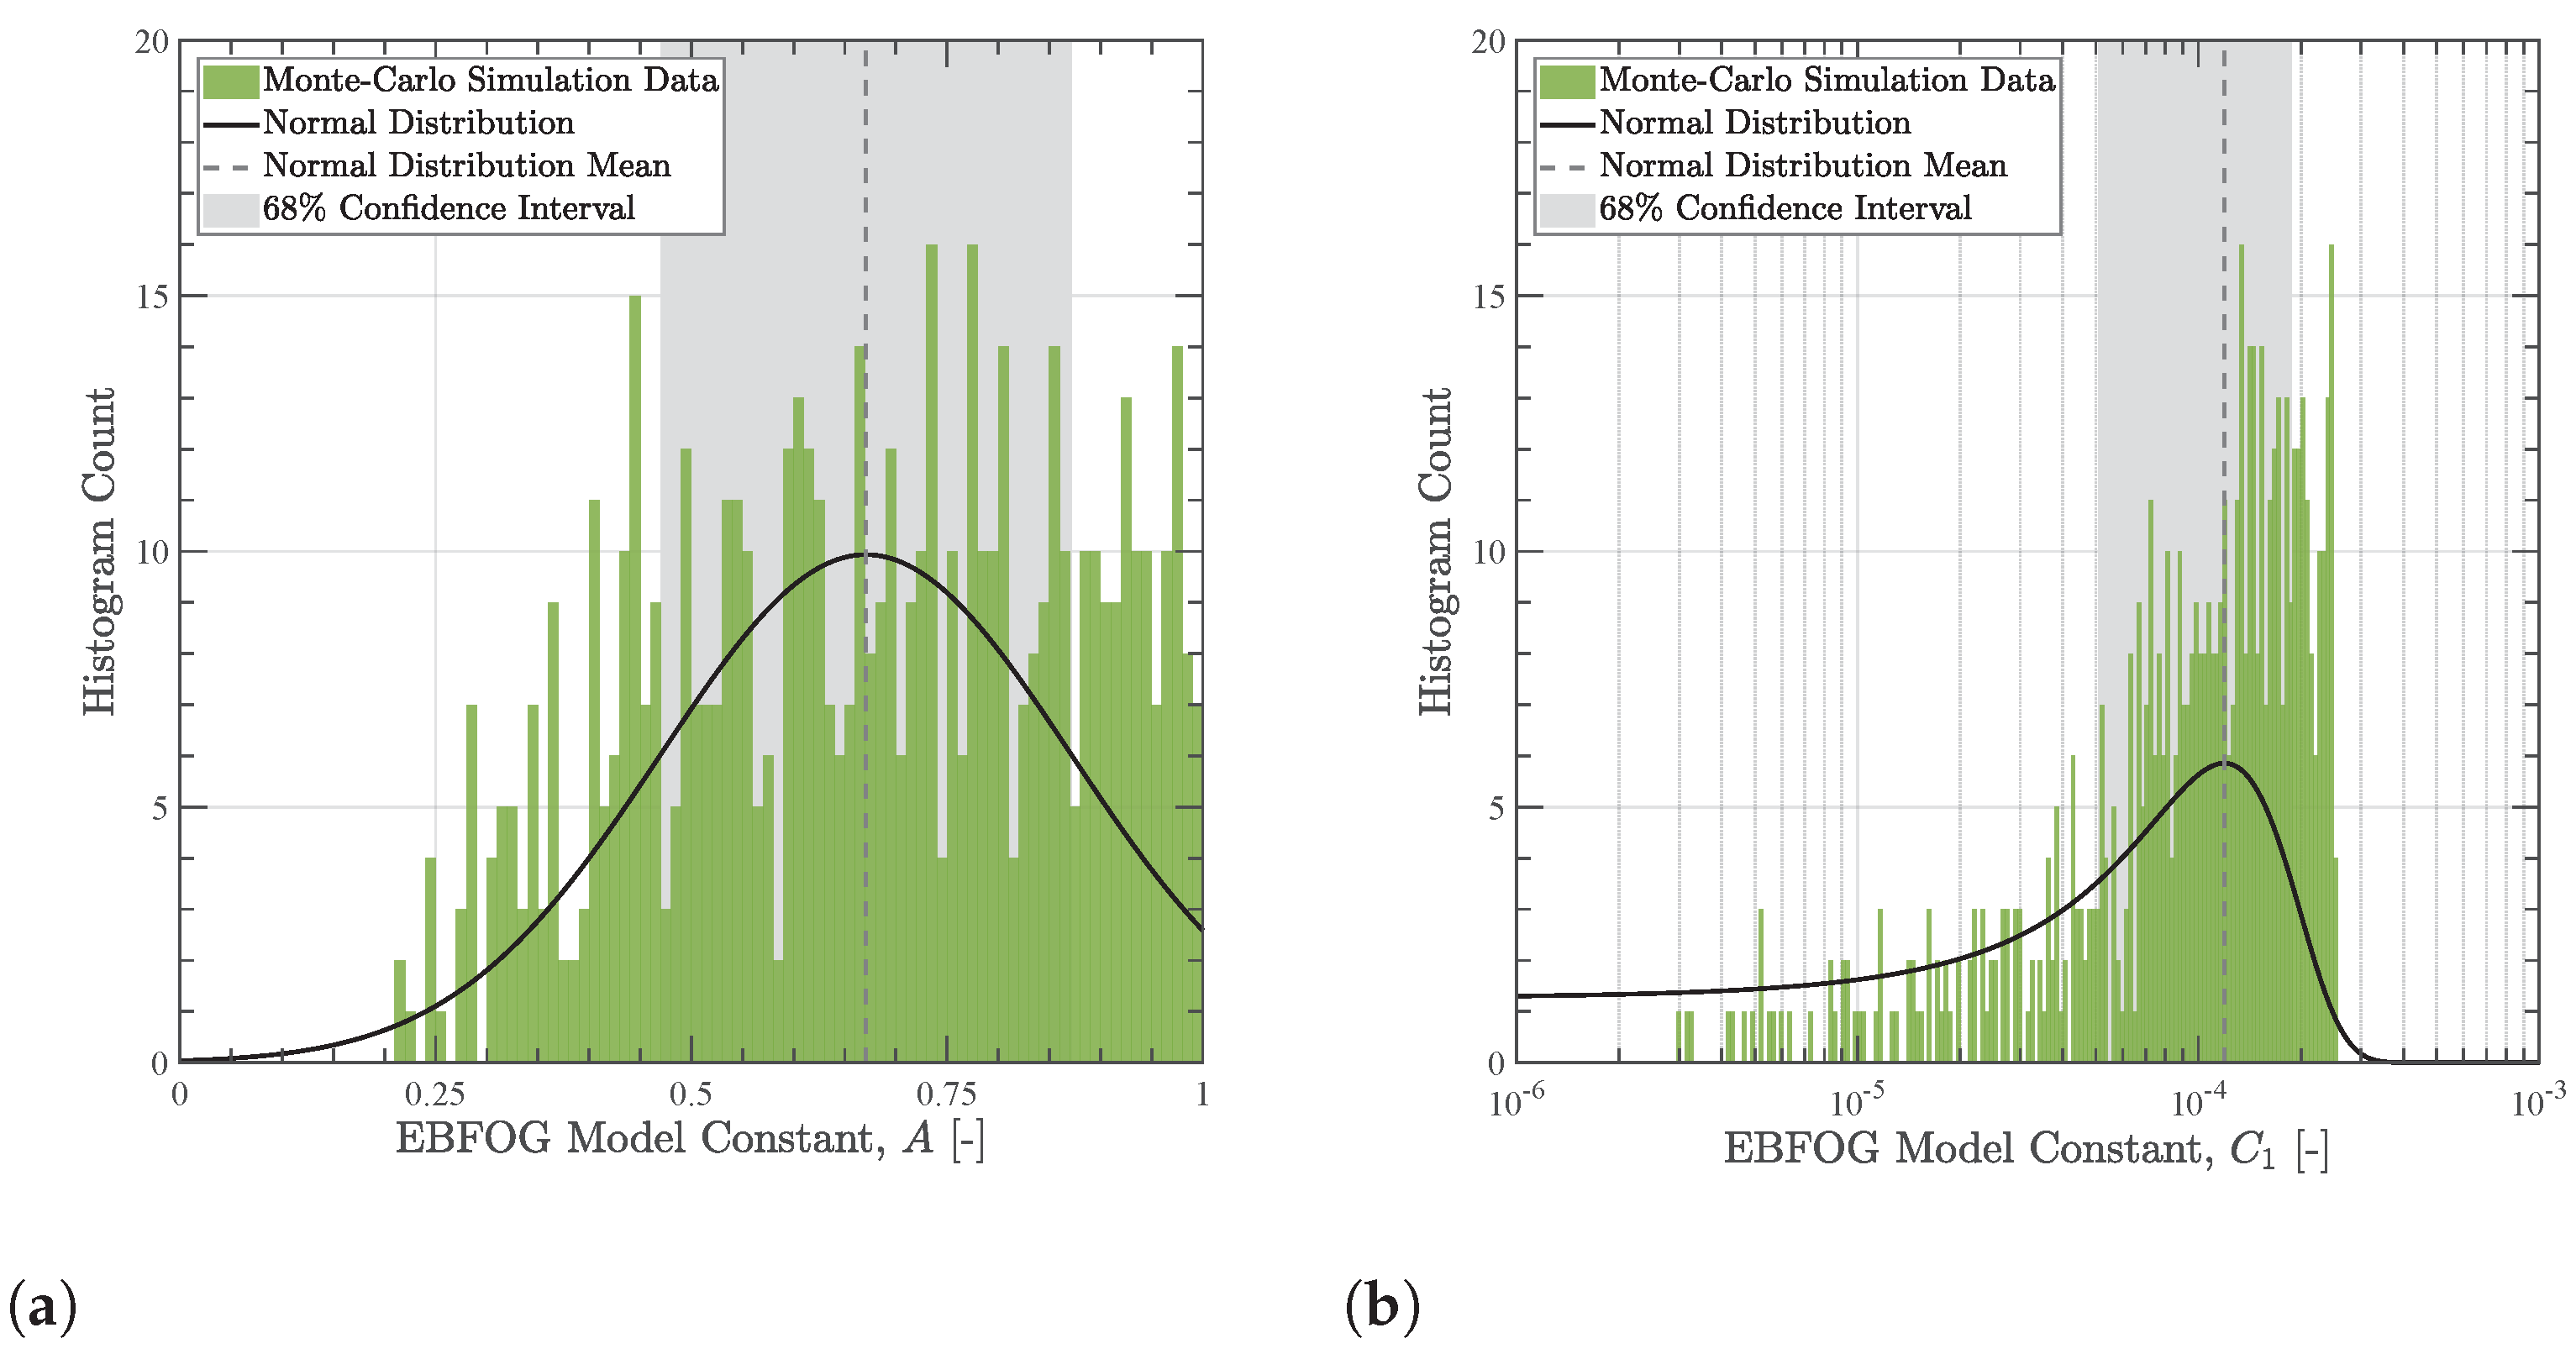
3.3. Empirical Constant Prediction

Applications of the coupled degradation model using Monte Carlo simulations to predict NGV deposition damage are not limited to just replicating historic events. The approach can also be used in conjunction with measured engine performance data to predict properties of the particles encountered, in particular the empirical constants A and C 1 , which underpin the particle retention probability (Equation (5)), as discussed in Section 2.2.14. It is also plausible that the approach presented here could be applied to predict other, unknown properties of the ingested particles. To demonstrate this, we specify three Monte Carlo cases in Table 4:
  • Case 1—the 1982 Galunggung event, as defined in Table 1.
  • Case 2—hypothetical scenario where the constants A and C 1 are the only unknowns.
  • Case 3—hypothetical scenario where the constant A is the only unknown.
It is assumed that all other parameters in the final two events can be resolved to a constant value, which, based on current knowledge, is an optimistic assumption but allows for an investigation of the effect that reducing the number of unknown variables in the analysis has on the confidence in the model predictions.
For the purpose of this demonstrative analysis, we use the measured engine performance loss data from the Galunggung event and follow the approach set out in Section 2.2.14. Retaining only the subset of Monte Carlo cases that predict an EGT rise and HP speed reduction that both fall within the range of measured performance loss, histograms of the randomly selected inputs for the variables A and C 1 are constructed, as demonstrated in Figure 9 for Case 1. Carrying out this process for the three cases defined in Table 4, we obtain three predictions for the model constants A and C 1 along with the confidence interval for the prediction of these constants, which are summarised in Table 5.
The results in Table 5 show that reducing the number of uncertain variables in the Monte Carlo input selection algorithm results in the overall confidence in the prediction of the empirical constants A and C 1 improving. The standard deviation of the predicted mean value of A and therefore size of its confidence interval reduces by 85% between cases 1 and 3, whilst the standard deviation and confidence interval for the prediction of C 1 is reduced by 45% between cases 1 and 2. The result of case 3 is also significant, which shows that, assuming that the constant C 1 has a fixed value and that the results in the retention probability coefficients c e in Equations (6)–(8) are also constant, dependence of the retention probability (Equation (5)) can be reduced to a single empirical constant A, further generalising the reduced-order accumulation factor model when used in this context.

4. Discussion

4.1. Improving Data Quality

Although the Monte Carlo coupled degradation model can predict the performance deterioration and failure point of an engine based on limited, uncertain input data, it has been noted how increasing ranges for these inputs results in wider, less certain confidence intervals for the predicted performance loss. The results presented in Table 5 demonstrate the effect of reducing uncertainty in this input data and show how the ability to resolve particle property inputs to a single value can reduce the size of this confidence interval by over 80%. However, the two hypothetical cases in Table 4 on which these results are based assume that exact particle properties are known, a scenario that is unrepresentative of current capability. Although existing remote and in situ sensing methods can be used to characterise dust cloud properties such as the particle size distribution and concentration, they currently lack the ability to resolve more fundamental properties such as the particle density and composition [16]. Determining these properties currently requires particulate samples to be collected and retrospectively characterised, a process too time consuming for the determined properties to be used in predictions of remaining engine life. Whilst this remains the capability to predict particle properties, the Monte Carlo coupled degradation model is limited to operating with specified ranges for these input variables and, by definition, has a reduced degree of confidence in its predictions compared to when the exact particle properties are known.
The quality of on-wing data used to validate and quantify the confidence in predicted performance degradation is also important. Measured performance degradation of the engines involved in the Galunggung and Soputan events (Figure 6 and Figure 7) varied significantly due to non-uniform EGT and surge margin reductions for the engines prior to the event. These variations introduce difficultly in assessing how well the coupled degradation model predicts engine performance loss and highlights the need to predict degradation on an engine-by-engine basis whilst accounting for pre-existing efficiency losses. To include this in model predictions, additional data, unavailable for the Soputan and Galunggung events, quantifying efficiency reductions prior to the encounter is required or the variability of pre-existing degradation needs to be captured in the coupled degradation model inputs. Combining these more comprehensive validation data with better constrained inputs from remote or in situ sensing capable of resolving fundamental particle properties ultimately improves the robustness of this approach, confidence in the quantification of engine performance degradation, remaining engine life and operational decisions, which are based on these factors.

4.2. Model Applications

The coupled degradation model for predicting NGV deposition damage and resulting degradation in engine performance has a number of potential applications throughout the life-cycle of an aero-engine. At the design stage, this approach has the potential to enable both component and whole engine life to be assessed based on what would, at the time of design, be an unknown use of the engine in dusty environments. This ability to test the response of a proposed design in a range of operating conditions would greatly improve the information available when evaluating and selecting new technologies, leading to a better understanding of how a proposed engine design behaves once in service, where it may encounter a range of different particle laden environments. Ultimately, this enables the design of engines to be more tolerant to the environments in which they operate.
Engines that are more tolerant to particle-induced damage ultimately have reduced maintenance costs compared to their predecessors, and the Monte Carlo approach to predicting degradation provides additional opportunities to further optimise these costs. The predictions of engine damage rates, their accompanying performance degradation and ultimately the points at which EGT or surge margin are expended, which the Monte Carlo-coupled degradation model provides, are valuable pieces of information for operations planners that can be used to optimise maintenance scheduling and, in turn, cost. In particular, the ability to forecast when an engine will fail based on its planned use is a enabling capability in the shift from on-condition, reactive maintenance, where only imminent failures can be identified, to pro-active strategies, where failure is predicted and reacted to well in advance of its occurrence. With the improvements in on-wing data quality already discussed, the coupled degradation model could be combined with sensed performance data to predict future degradation of the engine based on its actual condition. Combining this with the model’s ability to predict particle properties, this approach could be applied as part of a hybrid data and model driven digital twin, with machine learning cycles used to continuously improve model inputs based on a combination of sensed data and model predictions. This would allow for estimations of performance loss, remaining engine life and maintenance intervals to be refined based on both historic and future use of the engine.
A final application of the coupled degradation model is its potential use in the assessment of in-service engine susceptibility to different airborne particle types. For high concentration, short duration volcanic ash encounters, the use of this approach lies in understanding the sensitivity of engine damage rate and failure point to different doses and ash types. The ability to predict, with confidence, a safe dose would allow the boundaries between different damage categories in the DEvAC chart (Figure 2) to be quantified in terms of a dose that can then be correlated to potential risk. Current avoid policies for airborne ash could then be replaced with a graduated risk approach in which safe cumulative dose limits are defined, through which an aircraft can operate safely but with performance and cost penalties. This represents a significant improvement in the operational guidance that can be given to operators and regulators, something that was lacking in the immediate aftermath of the 2010 Eyjafjallajokull eruption.
For the ingestion of airborne dust, which causes a more gradual loss of performance over multiple flight cycles, benefits of a Monte Carlo approach to damage prediction lie in the ability to quantify the economic impacts of proposed flights through dusty environments to aid operational planning. Combining the Monte Carlo coupled degradation model with existing flight trajectory optimisation tools that contain predictions of seasonal and geographical variations in airborne dust would allow the damage associated with flying through airborne particles to be quantified and used as a consideration in the optimisation of route plans. For example, an operator may be able to trade-off the implications of additional maintenance costs to rectify damage due to taking a direct route through relatively high concentrations of airborne dust with increased fuel consumption and additional flight time associated with a less direct route to avoid said cloud. This improves the flexibility that an operator has over their operational capability and maintenance planning; however, substantial work is still required to understand the effect of particle deposition on operating costs before this is feasible.

5. Conclusions

A novel approach that couples particle deposition and gas turbine performance models was developed and used to carry out Monte Carlo simulations that predict, with confidence, the performance degradation and remaining life of aero-engines operating in the presence of an airborne particulate in which the properties are uncertain. The suitability of this approach for predicting the exhaust gas temperature rise, surge margin degradation and therefore failure point of an engine was demonstrated by replicating two volcanic ash encounter events for the Rolls-Royce RB211-524C engine. In general, the model currently under-predicts performance loss and over-predicts the remaining engine life due to the approach being limited to assessing damage in a high-pressure turbine and not accounting for additional damage mechanisms such as compressor erosion, which further reduce surge and EGT margins. Improvements to model fidelity such as incorporating the effect of other damage mechanisms were identified as means to improve predictions of remaining engine life. Potential improvements in the confidence of these predictions through a combination of increased on-wing validation data and the use of novel sensing techniques to reduce the number of variables in the Monte Carlo algorithm were demonstrated, with up to an 80% increase in prediction confidence possible if the problem can be constrained to a single property of the dust, C 1 . The proposed approach will aid engine operation by improving the understanding of damage rates, allowing for better predictions of safe operating conditions in high concentration encounter events and, in the future, enabling the economic impacts of a proposed route through a dusty environment to be quantified. Potential applications of the model in a digital twinning approach have been demonstrated, which would allow remaining engine life to be forecasted based on a combination of sensed engine performance and model predictions of anticipated damage. This will enable a more predictive approach to optimising maintenance in which forecast damage rates and failure points are used to reduce un-planned maintenance, engine down-time and ultimately through-life costs.

Author Contributions

Conceptualization, M.E., N.B. and R.C.; methodology, M.E.; software, M.E.; validation, M.E. and R.C.; formal analysis, M.E.; investigation, M.E.; data curation, M.E.; writing—original draft preparation, M.E.; writing—review and editing, M.E., N.B., A.F. and R.C.; supervision, N.B., A.F. and R.C. All authors have read and agreed to the published version of the manuscript.

Funding

This research was funded by the UK Engineering and Physical Sciences Research Council and the Defence Science and Technology Laboratory, who funded the doctoral studies of the lead author, Matthew Ellis, as part of grant number EP/P510579/1.

Institutional Review Board Statement

Not applicable.

Informed Consent Statement

Not applicable.

Data Availability Statement

Not applicable.

Acknowledgments

The authors wish to thank Rolls-Royce for the permission to validate our engine performance models with their data. The data were sanitised for reasons of confidentiality.

Conflicts of Interest

The authors declare no conflict of interest.

Abbreviations

The following abbreviations are used in this manuscript:
CIConfidence Interval
EGTExhaust Gas Temperature
HPHigh Pressure
HPTHigh-Pressure Turbine
NPSSNumerical Propulsion System Simulation
NGVNozzle Guide Vane
OEMOriginal Equipment Manufacturer
PSDParticle Size Distribution

References

  1. Clarkson, R.J.; Majewicz, E.J.; Mack, P. A Re-Evaluation of the 2010 Quantitative Understanding of the Effects Volcanic Ash Has on Gas Turbine Engines. Proc. Inst. Mech. Eng. Part G J. Aerosp. Eng. 2016, 230, 2274–2291. [Google Scholar] [CrossRef]
  2. Prata, F.; Rose, B. Volcanic Ash Hazards to Aviation. In The Encyclopedia of Volcanoes, 2nd ed.; Elsevier: Amsterdam, The Netherlands, 2015; pp. 911–934. [Google Scholar] [CrossRef]
  3. Bojdo, N.; Filippone, A.; Parkes, B.; Clarkson, R. Aircraft Engine Dust Ingestion Following Sand Storms. Aerosp. Sci. Technol. 2020, 106, 106072. [Google Scholar] [CrossRef]
  4. Li, R.; Verhagen, W.; Curran, R. Toward a Methodology of Requirements Definition for Prognostics and Health Management System to Support Aircraft Predictive Maintenance. Aerosp. Sci. Technol. 2020, 102, 105877. [Google Scholar] [CrossRef]
  5. Clarkson, R.; Simpson, H. Maximising Airspace Use during Volcanic Eruptions: Matching Engine Durability against Ash Cloud Occurrence; Technical Report STO-MP-AVT-272; NATO STO: Porton Down, UK, 2017.
  6. Döring, F.; Staudacher, S.; Koch, C.; Weißschuh, M. Modeling Particle Deposition Effects in Aircraft Engine Compressors. J. Turbomach. 2017, 139, 051003. [Google Scholar] [CrossRef]
  7. Al-Zyoud, S. Thermo-Physical and Mechanical Properties of Al Hashimiyya Basaltic Rocks, Jordan. Int. J. Geosci. 2019, 10, 193–208. [Google Scholar] [CrossRef] [Green Version]
  8. Ebert, H.; Hemberger, F.; Fricke, J.; Büttner, R.; Bez, S.; Zimanowski, B. Thermophysical Properties of a Volcanic Rock Material. High Temp.-High Press. 2002, 34, 561–568. [Google Scholar] [CrossRef]
  9. Vogel, A.; Diplas, S.; Durant, A.J.; Azar, A.S.; Sunding, M.F.; Rose, W.I.; Sytchkova, A.; Bonadonna, C.; Krüger, K.; Stohl, A. Reference Data Set of Volcanic Ash Physicochemical and Optical Properties. J. Geophys. Res. Atmos. 2017, 122, 9485–9514. [Google Scholar] [CrossRef] [Green Version]
  10. Singh, S.; Tafti, D. Particle Deposition Model for Particulate Flows at High Temperatures in Gas Turbine Components. Int. J. Heat Fluid Flow 2015, 52, 72–83. [Google Scholar] [CrossRef]
  11. Bons, J.P.; Prenter, R.; Whitaker, S. A Simple Physics-Based Model for Particle Rebound and Deposition in Turbomachinery. J. Turbomach. 2017, 139, 081009. [Google Scholar] [CrossRef]
  12. Bojdo, N.; Ellis, M.; Filippone, A.; Jones, M.; Pawley, A. Particle-Vane Interaction Probability in Gas Turbine Engines. J. Turbomach. 2019, 141. [Google Scholar] [CrossRef] [Green Version]
  13. Ellis, M.; Bojdo, N.; Covey-Crump, S.; Jones, M.; Filippone, A.; Pawley, A. Generalised Predictions of Particle-Vane Retention Probability in Gas Turbine Engines. J. Turbomach. 2021. [Google Scholar] [CrossRef]
  14. Grayburn, M. British Airways Boeing 747-236 Volcanic Cloud Encounter on the 24 June 1982—Investigation Report; Technical Report SPA 60332; Rolls-Royce: Westhampnett, UK, 1983. [Google Scholar]
  15. Guffanti, M.; Casadevall, T.; Budding, K. Encounters of Aircraft with Volcanic Ash Clouds: A Compilation of Known Incidents, 1953–2009; Technical Report U.S. Geological Survey Data Series 545; US Geological Survey: Reston, VA, USA, 2010.
  16. Witham, C.; Webster, H.; Hort, M.; Jones, A.; Thomson, D. Modelling Concentrations of Volcanic Ash Encountered by Aircraft in Past Eruptions. Atmos. Environ. 2012, 48, 219–229. [Google Scholar] [CrossRef]
  17. Martin, E.; Napier, J. Qantas Airways Boeing 747 Comb. Volcanic Cloud Encounter on 19 May 1985—Investigation Report; Technical Report; Rolls-Royce: Westhampnett, UK, 1985. [Google Scholar]
  18. Kristiansen, N.I.; Prata, A.J.; Stohl, A.; Carn, S.A. Stratospheric Volcanic Ash Emissions from the 13 February 2014 Kelut Eruption. Geophys. Res. Lett. 2015, 42, 588–596. [Google Scholar] [CrossRef] [Green Version]
  19. Cohen, H.; Rogers, G.; Saravanamuttoo, H. Gas Turbine Theory, 4th ed.; Longman: Harlow, UK, 2009. [Google Scholar]
  20. Kern, D.; Seaton, R. A Theoretical Analysis of Thermal Surface Fouling. Br. Chem. Eng. 1959, 4, 258–262. [Google Scholar]
  21. Senior, C.L.; Srinivasachar, S. Viscosity of Ash Particles in Combustion Systems for Prediction of Particle Sticking. Energy Fuels 1995, 9, 277–283. [Google Scholar] [CrossRef]
  22. Whitaker, S.M.; Peterson, B.; Miller, A.F.; Bons, J.P. The Effect of Particle Loading, Size, and Temperature on Deposition in a Vane Leading Edge Impingement Cooling Geometry; ASME Turbo Expo 2016: Turbomachinery Technical Conference and Exposition; ASME: Seoul, Korea, 2016. [Google Scholar] [CrossRef]
  23. Dunn, M. Operation of Gas Turbine Engines in an Environment Contaminated with Volcanic Ash. J. Turbomach. 2012, 134, 051001. [Google Scholar] [CrossRef]
  24. Giehl, C.; Brooker, R.; Marxer, H.; Nowak, M. An Experimental Simulation of Volcanic Ash Deposition in Gas Turbines and Implications for Jet Engine Safety. Chem. Geol. 2017, 461, 160–170. [Google Scholar] [CrossRef]
  25. Dean, J.; Taltavull, C.; Clyne, T. Influence of the Composition and Viscosity of Volcanic Ashes on Their Adhesion within Gas Turbine Aeroengines. Acta Mater. 2016, 109, 8–16. [Google Scholar] [CrossRef] [Green Version]
  26. Ellis, M.; Bojdo, N.; Filippone, A. Influence of Turboshaft Engine Architecture on Ash Particle Deposition-Reduced Order Model Application. In ASME Turbo Expo 2020: Turbomachinery Technical Conference and Exposition; American Society of Mechanical Engineers Digital Collection: New York, NY, USA, 2020; p. 12. [Google Scholar] [CrossRef]
  27. Lytle, J. The Numerical Propulsion Simulation: An Overview; Technical Report NASA/TM-2000-209915; NASA Glenn Research Center: Cleveland, OH, USA, 2000.
  28. Phillips, F. RB 211-524C2 Typical Flight Profiles; Technical Report TDR 60449; Rolls-Royce: Westhampnett, UK, 1979. [Google Scholar]
  29. Casari, N.; Pinelli, M.; Suman, A.; Di Mare, L.; Montomoli, F. An Energy-Based Fouling Model for Gas Turbines: EBFOG. J. Turbomach. 2017, 139, 021002. [Google Scholar] [CrossRef]
  30. Pearson, D.; Brooker, R. The Accumulation of Molten Volcanic Ash in Jet Engines; Simulating the Role of Magma Composition, Ash Particle Size and Thermal Barrier Coatings. J. Volcanol. Geotherm. Res. 2020, 389, 106707. [Google Scholar] [CrossRef]
Figure 1. Deposited volcanic ash on the high pressure turbine nozzle guide vanes of a Rolls-Royce RB211-524C engine involved in an encounter with the volcanic ash plume from the 1982 eruption of Mount Galunggung in Indonesia [14].
Aerospace 08 00146 g001
Figure 2. The Duration of Exposure versus Ash Concentration (DEvAC) chart, showing the two encounter events being investigated and their corresponding concentration and duration ranges [5].
Aerospace 08 00146 g002
Figure 3. Validation of the RB211-524C NPSS engine performance model for turbine entry temperature and core mass flow rate.
Aerospace 08 00146 g003
Figure 4. Block diagram showing the structure of the coupled degradation model used to carry out the statistical analysis of dust properties for dust cloud encounter events. Step numbers in the model process are indicated above each block.
Aerospace 08 00146 g004
Figure 5. Predicted high-pressure turbine throat area change distributions for particle sphericities of (a) ϕ = 1.00 , (b) ϕ = 0.75 and (c) ϕ = 0.54 comparing the predicted mean throat area change and 68% confidence interval with observations from the four engines involved in the Galunggung event.
Aerospace 08 00146 g005
Figure 6. Model predicted change in exhaust gas temperature (a) and high-pressure spool speed (b) for the Mount Galunggung encounter event, with exponential and normal distributions, respectively, fit to the data and a comparison between the mean performance change predicted by the model and the range observed for the four engines involved in the event.
Aerospace 08 00146 g006
Figure 7. Model-predicted change in exhaust gas temperature (a) and high-pressure spool speed (b) for the Mount Soputan encounter event, with exponential and normal distributions respectively fit to the data and a comparison between the mean performance change predicted by the model and the range observed for the four engines involved in the event.
Aerospace 08 00146 g007
Figure 8. The predicted NGV throat area reduction for the Soputan encounter during which engines did not surge, indicating how this was comparable to that observed for the Galunggung event in which all four engines experienced surge.
Aerospace 08 00146 g008
Figure 9. Histogram of outputs showing the distribution of input values for the empirical constants A (a) and C 1 (b) that resulted in a simulation predicting both EGT rise and HP speed reduction that fall within the ranges observed during the Galunggung encounter event. The predicted mean value from the simulations carried out and the confidence interval for this prediction are also presented.
Aerospace 08 00146 g009
Table 1. Dust property ranges for the basaltic–andesite ash encountered during the 1982 Mount Galunggung encounter.
PropertyUnitUpper LimitLower LimitRefs.
Concentration, C p mg · m 3 1000100[1,16]
Event Duration, Dmin42[1]
Particle Heat Capacity, c p , p J · kg 1 · K 1 1600510[7,8]
Particle Density, ρ p kg · m 3 29002590[7,9]
Particle Softening Temperature, T * K1420923[25]
Deposit Density, ρ d e p kg · m 3 24001430[30]
Particle Size DistributionLog-Normal[9]
Geometric Mean Diameter, μ g e o 3.251.50[9]
Geometric Standard Deviation, σ g e o 2.001.00[9]
EBFOG Model Constant, A1.000.10
EBFOG Model Constant, C 1 2.51 × 10 4 2.51 × 10 6
Shedding Rate Parameter, λ s 1 5.00 × 10 4 2.00 × 10 4
Table 2. Dust property ranges for the basaltic ash encountered during the 1985 Mount Soputan encounter.
PropertyUnitUpper LimitLower LimitRefs.
Concentration, C p mg · m 3 40020[16]
Event Duration, Dmin144[15,16]
Particle Heat Capacity, c p , p J · kg 1 · K 1 1600510[7,8]
Particle Density, ρ p kg · m 3 29002590[7,9]
Particle Softening Temperature, T * K1420923[25]
Deposit Density, ρ d e p kg · m 3 24001520[30]
Particle Size DistributionLog-Normal[9]
Geometric Mean Diameter, μ g e o 3.501.50[9]
Geometric Standard Deviation, σ g e o 2.000.50[9]
EBFOG Model Constant, A1.000.10
EBFOG Model Constant, C 1 2.51 × 10 4 2.51 × 10 6
Shedding Rate Parameter, λ s 1 5.00 × 10 4 2.00 × 10 4
Table 3. A summary of the number of Monte Carlo cases (of 4000) that satisfy the recorded performance changes for each engine in the Galunggung event. Additionally indicated are the predicted NGV throat area reductions corresponding to these cases that reflect the order of engine failures during the event.
All EnginesEngine 1Engine 2Engine 3Engine 4
Performance ParameterNumber of Cases Falling in OEM Range
HP Spool Speed Change152216315015186
Exhaust Gas Temperature Change6301489466168
Both HP and EGT Changes262719710
Predicted Throat Area Change [%]−12.3−13.1−16.7−12.0
Event Failure Order3241
Flight Cycles1116232422072605
Table 4. Input data for the three hypothetical cases examined, showing the increase in certainty for each variable between input datasets.
Case 1Case 2Case 3
PropertyUnitUpper LimitLower LimitUpper LimitLower LimitUpper LimitLower Limit
C p mg · m 3 1000100400400
Dmin4244
c p , p J · kg 1 · K 1 1600510800800
ρ p kg · m 3 2900259026802680
T * K142092311001100
ρ d e p kg · m 3 2400143019151915
DistributionLog-NormalLog-NormalLog-Normal
μ g e o 3.251.501.8251.825
σ g e o 2.001.001.501.50
A1.000.101.000.11.000.1
C 1 2.51 × 10 4 2.51 × 10 6 2.51 × 10 4 2.51 × 10 6 5.00 × 10 5
λ s 1 5.00 × 10 4 2.00 × 10 4 4.00 × 10 4 4.00 × 10 4
Table 5. Predicted model constants A and C 1 for the three hypothetical cases defined in Table 4.
CaseOptimisation
Variables
MeanStandard
Deviation
68% Confidence Interval
A C 1 ( 10 5 ) A C 1 ( 10 5 ) A C 1 ( 10 5 )
Case 1 C p , D , c p , p , ρ p , T * ,
ρ d e p , μ g e o , σ g e o , A , C 1 , λ
0.6611.90.216.760.45–0.875.16–13.5
Case 2 A , C 1 0.827.380.133.700.95–0.703.68–7.40
Case 3A0.750.030.79–0.72
Publisher’s Note: MDPI stays neutral with regard to jurisdictional claims in published maps and institutional affiliations.

