Abstract
4D flight trajectory optimization is an essential component to improve flight efficiency and to enhance air traffic capacity. this technique not only helps to reduce the operational costs, but also helps to reduce the environmental impact caused by the airliners. This study considers Dynamic Programming (DP), a well-established numerical method ideally suited to solve 4D flight Trajectory Optimization Problems (TOPs). However, it bears some shortcomings that prevent the use of DP in many practical real-time implementations. This paper proposes a Modified Dynamic Programming (MDP) approach that reduces the computational effort and overcomes the drawbacks of the traditional DP. In this paper, two numerical examples with fixed arrival times are presented, where the proposed MDP approach is successfully implemented to generate optimal trajectories that minimize aircraft fuel consumption and emissions. Then the obtained optimal trajectories are compared with the corresponding reference commercial flight trajectory for the same route in order to quantify the potential benefit of reduction of aircraft fuel consumption and emissions.
1. Introduction
Improving aircraft operational efficiency has become a dominant topic in today’s air transportation system, as airlines around the world have seen the price of fuel rise sharply during the past decade. Moreover, the Air Transport Action Group (ATAG) estimated that the aviation sector accounts for about 2% of total man-made global CO2 emissions, including both international and domestic aviation, and about 12% of the CO2 emissions from all transportation sources [1]. With air traffic growth forecast to increase by an average of 4.3% per year for the next 20 years, the aviation sector will play a major role in increasing global warming.
The increased fuel prices and environmental concerns have pushed airlines to reduce fuel consumption and emissions and to find margins for performance improvements. Efforts to modernize aircraft are limited by an extremely slow and expensive process of new aircraft adoption, which can take decades. Consequently, it is important to find different alternatives to reduce the fuel consumption and emissions in current aircraft, which will likely share the sky with most modern aircraft in near future. One of these alternatives is by optimizing flight trajectories and Air Traffic Control (ATC) procedures. Jensen et al. reported that the existing flight-planning techniques are mostly suboptimal, and most commercial flights do not fly at the optimal speed or altitude [2]. Hence, aircraft trajectory optimization is a crucial ingredient to reduce fuel consumption and emissions in current aircraft.
Currently, the reduction of fuel consumption and emissions of flights mostly have been dealt with in the context of 2D and 3D trajectory optimization, which is inefficient and far from being optimal, since actual flight plan fulfillment requires 4D navigation. 4D navigation appears as a solution for self-delivering to a time tolerance at a sequence of waypoints; thus, this is necessary for reducing flight delays and for increasing predictability for both air traffic service users and providers. The present study deals with optimal fuel-saving and emissions reduction in the framework of 4D trajectory optimization.
The Trajectory Optimization Problem (TOP) can be formulated as an Optimal Control Problem (OCP), which can be solved by various kinds of numerical methods. These methods can be separated into two basic approaches: indirect and direct [3,4,5].
The TOP is solved by the Pontryagin Maximum Principle (PMP) in an indirect approach [6,7], where the original TOP is converted into a Boundary Value Problem (BVP) by analytically formulating the first-order necessary condition for optimality that derived from PMP. The main advantages of indirect methods are that they lead to high-accuracy solutions and guarantee that the solution satisfies the optimality condition. However, they require a good initial approximation of the co-state, which is difficult to guess [8]. Besides, the BVPs that arise for many practical TOPs in indirect methods are quite difficult to solve, because of the complex dynamics and constraints structure of the problem. In the early 1980s, several studies were done to solve aircraft TOPs by applying the PMP to minimize fuel consumption [9,10,11].
On the other hand, the direct methods discretize the infinite-dimensional original TOP into a finite-dimensional Nonlinear Programming (NLP) problem [12,13], which is then solved numerically by the well-established optimization techniques. At present, the direct methods are widely used for solving TOPs, since not only do these methods not require an analytic expression for the necessary conditions of optimality, which can be a daunting task for complicated nonlinear dynamics, but they also tend to have better convergence properties over indirect methods. Another great advantage of direct methods is that they do not need an initial guess of the co-state like the indirect methods. The direct methods have been used extensively to solve aircraft TOPs [14,15,16,17,18,19].
Aside from direct and indirect methods, Dynamic Programming (DP) is another well-established method to solve TOPs [20]. The numerical framework of DP is very suitable to handle discrete-time dynamic systems with nonlinear characteristics [21]. Moreover, the 4D waypoint representation of the flight trajectory is similar to the discretization of the states grid system; consequently, DP is a natural numerical method to deal with the 4D flight-trajectory optimization. Other great advantages of using DP are that it not only guarantees an absolute (global) optimum, but it also can easily handle equality and inequality constraints of the system. Traditional DP has many appealing features as mentioned, and some authors have applied the method to solve aircraft TOPs [22,23,24]. It is still not widely used in many practical applications due to the computational burden, known as the curse of dimensionality, and the interpolation problem (when the trajectory from a grid point does not reach exactly the next grid point), known as the menace of the expanding grid.
Several studies have been done to overcome the limitations of traditional DP. Hagelauer and Mora-Camino presented a Soft Dynamic Programming (SDP) approach by using a neural network to reduce the computational time of traditional DP [25]. Luus proposed a class of DP called Iterative Dynamic Programming (IDP) that solves the menace of the expanding grid problem and shows better performance than the traditional DP; however, the curse of dimensionality remained [26]. Later on, IDP was extended to Single Grid-Point Dynamic Programming (SGDP), which can be used to solve online TOPs with accuracy [27]. Miyazawa et al. proposed a Moving Search Space Dynamic Programming (MS-DP) to reduce the computation time of traditional DP and applied it to the generation of a conflict-free and minimum-fuel 4D optimal trajectory [28]. Harada et al. proposed a method by using the piecewise linear approximation to overcome the limitation of the menace of the expanding grid problem of DP [29].
The continuous analog of DP, the Hamilton–Jacobi–Bellman (HJB) approach, is also used by some authors to solve aircraft TOPs. Khardi used the HJB approach to minimize aircraft noise, fuel consumption, and air pollution around airports [30]. Parzani and Puechmorel applied the HJB approach to generate a conflict-free minimum-time aircraft trajectory [31].
This paper proposes a Modified Dynamic Programming (MDP) approach to solve the aircraft 4D TOP. This MDP approach reduces the computational effort and overcomes the drawbacks of the traditional DP, which allows it to be applied in high-dimension problems such as 4D TOP. The proposed method has been successfully applied to generate optimal trajectories that minimize aircraft fuel consumption and emissions in the global trajectory (i.e., climb, cruise, and descent phases). Afterward, the obtained fuel and emissions optimal trajectories are compared with the corresponding commercial airliner flight trajectory.
The paper is organized as follows: Section 2 describes the trajectory optimization problem, aircraft fuel consumption model, emissions models, performance index, and the constraints. Then, Section 3 presents the traditional dynamic programming approach and also describes the modified dynamic programming approach. Section 4 demonstrates the simulation and results of the proposed method on fuel- and emissions-optimal trajectory generation for commercial flight. Finally, conclusions and future work directions are presented in Section 5.
2. Problem Statement
The main goal of this paper is to develop a Modified Dynamic Programming (MDP) approach to solve the 4D Trajectory Optimization Problem (TOP), and to validate the proposed method by generating fuel-optimal and emissions-optimal trajectories between 4D waypoints with fixed arrival times. A representation of a 4D trajectory is given in Figure 1, which is defined by a set of 4D waypoints.
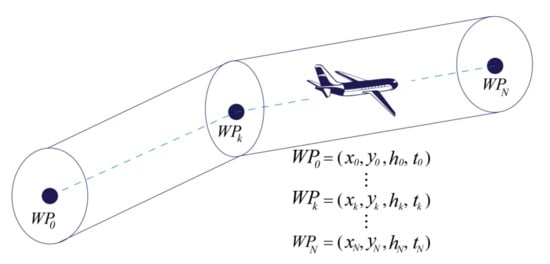
Figure 1.
Representation of 4D trajectory.
Most of the approaches consider the waypoints defined by tridimensional coordinate positions , where , and do not consider the arrival time at the waypoint . By adding the arrival time restriction to the tridimensional waypoint, it is possible to define the 4D waypoints as , where and are respectively the position of the aircraft and arrival time at the waypoint .
The next subsection presents the Trajectory Optimization Problem. This study is based on minimizing fuel consumption and emissions. The aircraft fuel consumption and emissions model are described in the next subsections, along with the performance index that needs to be minimized.
2.1. Trajectory Optimization Problem
Trajectory optimization is a class of Optimal Control Problem (OCP) where the main objective is to optimize a measure of performance (e.g., minimum fuel consumption, minimum emissions, etc.) over a trajectory of a vehicle (e.g., aircraft, spacecraft, etc.) while satisfying a set of constraints.
Considering a nonlinear system whose dynamics is modeled by a set of ordinary differential equations:
where is the time (time is the independent variable), is the state vector, is the control vector, is a compact domain of feasible controls, is a vector-valued function, and both the state and control are dependent on .
The general TOP is to find an admissible control , and the corresponding admissible state trajectory that optimizes the Performance Index (PI):
This TOP may be subject to the equality and the inequality constraints on the state and the control along the trajectory:
It may also be subject to the nonlinear boundary condition , which enforces restrictions on the initial and final states of the system:
2.2. Aircraft Dynamics Model
Generally, the aircraft system dynamics are modeled by a set of nonlinear Equations of Motion (EOMs). In this paper, a simplified version of the Three Degrees of Freedom (3DOF) EOMs are considered, where the state vector is represented by the position, velocity, flight path angle, and heading of the flight vehicle.
The following differential equations are the dynamic model used to model the problem:
where is the three dimensional position of the aircraft; and are respectively the velocity, flight path angle, and heading; and the variables and are respectively the acceleration, the flight path angle rate, and the heading rate. The state vector is composed by and the control vector is composed by .
2.3. Aircraft Fuel-Consumption Model
The Base of Aircraft Data (BADA) provides aircraft fuel consumption models. BADA is maintained by EUROCONTROL through active cooperation with aircraft manufacturers [32]. In this paper, two turbofan/turbojet engine subsonic aircraft are considered.
The fuel consumption of commercial flights depends on ambient temperature, true airspeed, and aircraft altitude. The BADA model provides the thrust-specific fuel consumption that allows the calculation of the fuel consumption for turbofan/turbojet engines. The thrust-specific fuel consumption describes the fuel efficiency of an engine design with respect to thrust output, and is specified as a function of true airspeed as follows:
where and are the thrust-specific fuel consumption coefficients specified for several specific aircraft in the BADA Operations Performance File (OPF).
The climb fuel-flow rate can be calculated using the maximum climb thrust and thrust-specific fuel consumption as follows:
The maximum climb thrust is calculated as a function of geo-potential pressure altitude as follows:
where are the climb thrust coefficients and are the thrust temperature coefficient specified in the BADA OPF.
To calculate the fuel-flow rate of the cruise phase of flight, a cruise fuel-flow correction coefficient is added as follows:
where is the cruise fuel-flow correction coefficient. For the moment, the cruise fuel-flow correction factor has been established for a number of aircraft types whenever the reference data for cruise fuel consumption is available and is specified in the BADA OPF. This factor has been set to 1 (one) for all the other aircraft models.
The cruise thrust is equal to drag in the cruise phase of flight as follows:
The aerodynamic drag is directly dependent on the air density and commonly modeled by using the drag coefficient as follows:
where is the air density, is the true airspeed, is the drag coefficient, and is the wing surface area.
For different phases of flight, the drag coefficient is specified as a function of lift coefficient as follows:
where is the parasite drag coefficient and is the induced drag coefficient. The values of these coefficients vary depending on the flap configuration in different phases of flight. The BADA provides the values of these coefficients for a number of specific aircraft in the OPF.
During idle thrust descent, the fuel flow for turbofan/turbojet engines is specified as a function of the geopotential pressure altitude as follows:
where and are the descent fuel flow coefficients specified in the BADA OPF.
2.4. Aircraft Emissions Model
Principle greenhouse gas emissions resulting from aircraft in flight that impacts the environment most are carbon dioxide (CO2), water vapor (H2O), sulfur dioxide (SO2), oxides of nitrogen (NOx), carbon monoxide (CO), and hydrocarbons (HC). Typically, these aircraft emissions are modeled by the Emission Index (EI), which has units of grams of emission per kilogram of fuel burned.
The carbon dioxide, water vapor, and sulfur dioxide emissions , , and of commercial aircraft can be defined by the EI of the respective greenhouse gases and fuel burn FB as follows:
where , , and are respectively the emission index of carbon dioxide, water vapor, and sulfur dioxide in grams per kilogram and fuel burn FB in kilograms [33]. The fuel burn can be defined as:
where FF is the fuel flow and t is the time.
The emissions of NOx, CO, and HC can be modeled using the Boeing Fuel Flow Method 2 (BFFM2). The BFFM2 uses the International Civil Aviation Organization (ICAO) emission data bank to determine the reference emission indices, which eventually allow the calculation of the emissions of these gases [34].
The first step to model the emissions of NOx, CO, and HC is to correct the fuel flow by taking into account the ambient temperature, pressure, and Mach number:
where is the corrected fuel flow and M is the Mach number. is the temperature ratio and is the pressure ratio, which can be defined as follows:
where and are the standard atmospheric temperature and pressure, respectively.
The BFFM2 uses the ICAO emission data bank to determine the reference emission index , , and for NOx, CO, and HC, which then can be used to determine the emission indices as follows:
where is the humidity correction factor, which can be calculated using specific humidity as follows:
By using the emission indices of NOx, CO, and HC from Equations (27)–(29) and fuel burn FB, the emissions of these gases can be defined as follows:
where , , and are respectively the emissions of NOx, CO, and HC in grams.
2.5. Performance Index
A Performance Index (PI) is a function that defines a system’s physical requirements into mathematical terms. When the PI is optimized, it indicates that the system is performing in the most desirable manner.
In this study, the first Performance Index is considered to optimize the fuel consumption of the aircraft, which can be defined by the following equation:
where [kg/s] is fuel flow, which can be determined using Equations (13), (15) and (19); [min] is flight time; and [kg/min] is the Cost Index [35], which is an adjustable constant parameter that represents the cost associated with fuel burn and flight time. For all aircraft models, the minimum value (zero) of the Cost Index results in maximum range airspeed and minimum trip fuel, but ignores the time-related cost. When the Cost Index is maximum, it results in minimum flight time but ignores the fuel cost. In this PI, the Cost Index is assumed to be zero, as only the fuel cost is taken into consideration.
Principle Aircraft Emissions (AE) that impact the environment most are carbon dioxide (CO2), water vapor (H2O), sulfur dioxide (SO2), oxides of nitrogen (NOx), carbon monoxide (CO), and hydrocarbons (HC). In this study, the sum of all the aircraft emissions are minimized in order to reduce the environmental impact caused by the aircraft. So, the AE can be described as follows:
The second Performance Index that needs to be optimized to reduce the aircraft emissions can be defined by the following equation:
Typically, these Aircraft Emissions AE are modeled by the Emission Index (EI), which shows units of grams of emission per kilogram of fuel burned. So, Equation (36) can be rewritten as follows:
The EI of the CO2, H2O, and SO2 can be found in Section 2.4, and the EI of NOx, CO, and HC are given in Equations (27)–(29).
2.6. Boundary and Path Constraints
Real-world flight operates under several constraints, due to aerodynamic, structural, and propulsive limitations, so bound constraints are imposed on the state and control variables as follows:
3. Dynamic Programming
Dynamic Programming (DP) was first proposed by Richard E. Bellman in the 1950s, based on a simple intuitive concept called the Principle of Optimality (PO). The PO is used as a necessary condition of optimality to solve the Trajectory Optimization Problem (TOP) in DP, where it splits the global optimization problem into local optimization subproblems and explores all the feasible state candidates that satisfy the necessary conditions.
The basic approach to apply the numerical procedure of DP consists of approximating the system differential equations of a continuous system by the difference equations and approximating the integral in the Performance Index (PI) by a summation.
Considering a nonlinear system whose dynamics is modeled by a set of ordinary differential equations as in Equation (1), this can be approximated by a set of difference equations as follows:
where and are respectively the state and control vector with appropriate boundary conditions at any stage with .
The PI of Equation (2) can be approximated by a summation as follows:
This assumes that the optimal control, state, and cost are known from initial stage 0 to any stage . Then, at any stage , the PO states that whatever the initial state and the initial decision, in this case, and , the remaining decision must be optimal with regard to the state that results from the first decision . Thus, the PI can be rewritten as:
Equation (45) is the mathematical form of PO; it is also known as the functional equation of DP [36], where represents the cost of the optimal path from initial stage 0 to any stage , and is the optimal cost from initial stage 0 to any stage . DP has many appealing features to solve the TOP as follows:
- The solution obtained by the DP is guaranteed to be the absolute (global) optimum, as the method uses direct search to solve the recurrence equation.
- The numerical framework of DP is ideally suited to handle equality or inequality constraints and nonlinear characteristics of the system.
- DP splits a complex optimization problem into a sequence of simple optimization subproblems; this stage-by-stage optimization procedure is ideally suited for digital computers.
Although DP has many appealing features, it is not widely used in many practical applications due to the computational burden (the curse of dimensionality) and the interpolation problem (the menace of the expanding grid). However, the proposed Modified Dynamic Programming (MDP) approach can be used to resolve these limitations and can be used to successfully solve 4D flight TOP. This is described in the next subsection.
Modified Dynamic Programming
This subsection proposes a Modified Dynamic Programming (MDP) approach to solve the flight Trajectory Optimization Problem (TOP). The computational procedure of MDP greatly reduces the computational burden of the traditional DP and resolves the limitation of the menace of the expanding grid problem while retaining its appealing features. Similar to the traditional DP approach, the MDP approach is also based on the application of Bellman’s Principle of Optimality (PO) concept, which allows it to split the complex optimization problem into a sequence of simple optimization subproblems and solve the problem stagewise. There are mainly two basic differences between the traditional and modified approaches; they are the reduction of search space and the determination of the control values in each stage.
The MDP approach is based on the reduction of grid points at each stage, which in turn reduces the search space and required computational time. The reduction is accomplished by considering a block of grid points in each stage, instead of considering the whole state space of all possible grid points, where the block in each stage only contains the grid points that are reachable from the grid points of the block in the previous stage. Assuming that the initial and final conditions of the problem are known, the block of the first stage only contains the grid point of the initial or final state, depending on the manner (i.e., forward or backward) of the computation procedure. Another feature of the proposed MDP is that instead of applying random quantized control values at any stage, the MDP approach generates the control values inside the allowable range that leads the states from a grid point to exactly a grid point at the next stage. This generation of control values eliminates the limitation of the menace of the expanding grid, as it guarantees reachable grid points for the states at any stage. However, because this approach does not consider all the possible quantized states and control values, it is not possible to guarantee global optimum. However, the proposed MDP approach can successfully find the optimal trajectory within the considered region of search space and can be used to solve the real-time optimal trajectory generation problem.
Like the traditional DP, the numerical procedure of MDP also consists of approximating the system differential equations of a continuous system by the difference equations and approximating the integral in the Performance Index (PI) by a summation.
The forward MDP computational procedure to solve the problem outlined in Equations (43) and (44) is described below:
- Define the initial condition and final condition of the problem.
- Starting at the stage , calculate the minimum range of each state variable and the maximum range of each state variable at the stage that are reachable from the initial state , where the number of state variables is .
- Define the block of grid points at the stage .
The states inside the block are considered the admissible states.
- 4.
- Generate the number of grid points for each state variable , inside the block at the stage , as follows:
- 5.
- Generate the trail control values for each control variable that lead the state variables from a grid point at the stage to exactly another grid point at the stage , where is a compact domain of feasible controls, with .
- 6.
- Now at the stage , for each admissible states of at this stage, try all the trail control values and choose the control that optimizes the PI Equation (44), and store the value of control and performance index to use in the next steps.
- 7.
- Step forward at the stage , then again calculate the minimum range of each state variable and maximum range of each state variable at the stage that are reachable from the admissible states of , and repeat the procedure from step 3 to step 5. Then, again for each admissible state of at this stage , try all the trail control values. Now, by using Bellman’s PO as the traditional DP method, the optimal control and optimal value of the performance index from the previous stage for each admissible states can be used to calculate the values of PI from the initial stage to the stage . Compare the values of PI for each state x-grid point and store the value of control that optimizes it along with the value of PI.
- 8.
- Repeat the procedure until the last stage , where the trajectory reaches the final condition . This stage has only a single grid point, since the final condition is specified. Store the control policy that optimizes the performance index and store the corresponding -trajectory.
Figure 2 illustrates the stagewise optimization procedure of the MDP approach. A problem where the system has 2 state variables is shown in the figure. The initial state and final state are shown by the red dot points at the initial stage and final stage .
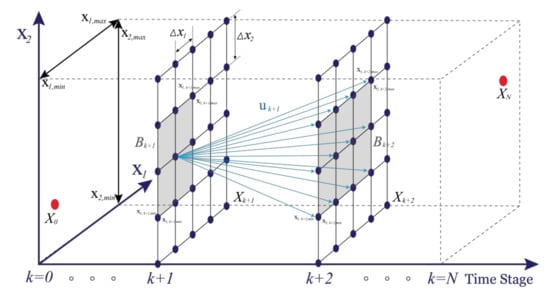
Figure 2.
Stagewise optimization procedure of the modified dynamic programming approach.
The dark blue dotted points in Figure 2 are all the grid points in the full state space. The highlighted grey area in each stage is the block of grid points in that stage, which is defined by the state space that is reachable from the admissible states of the previous stage. Only the grid points inside this highlighted grey area are considered for the MDP optimization process. This reduction in search space in the optimization procedure reduces the computational space and time complexity. Figure 2 also illustrates the control values that are being generated in the stage in light blue, which guarantees that the states from a grid point in a stage reach another grid point in the next stage .
4. Simulation and Results
This section presents the simulation and results of the aircraft fuel and emissions optimal trajectories generated by the Modified Dynamic Programming (MDP) approach for two case studies. The first case study is based on obtaining the fuel optimal trajectories of a commercial flight from Lisbon to Paris. The second case study is based on obtaining the minimum aircraft emissions trajectories of a commercial flight from Lisbon to Munich.
In both cases, the optimal trajectories were compared with a reference commercial flight trajectory for the same route. The flight information was taken from the FlightAware website (https://flightaware.com; accessed on 09 December 2019 (1st case study) and 29 December 2020 (2nd case study)). This website allows tracking a flight online, and the flight data are available for free. For each flight, the aircraft type, time, position, orientation, speed, and altitude are provided. However, the website does not provide the take-off weight of the aircraft. Since the same model is used to calculate the fuel consumption and emissions of both commercial flight trajectory and proposed optimal trajectory, the model error does not directly affect the difference in fuel consumption and emissions. The analysis of the simulation was done using Python 3.7.
4.1. Fuel-Optimal Trajectory
In the first case study, a flight from Lisbon to Paris and a twinjet aircraft was considered to analyze the fuel-optimal trajectories. In this study, the reference mass of this aircraft was considered as the take-off weight, which was 60,000 kg, and it was assumed there was no wind condition. The performance operational data of the aircraft is provided in Appendix A Table A1. To determine the potential benefit of reduction of fuel consumption, the obtained fuel optimal trajectory was compared with a commercial flight trajectory for the same route. The constraints of the case study were selected according to the reference commercial flight trajectory for the same route as shown in Table 1.

Table 1.
Constrains of the flight of the case study.
In this case study, the intervals between the states grid points were , , and , and the interval between the stages was .
This case study considered the global trajectory, which consists of the climb, cruise, and descent phases of flight. The initial and final waypoints of the problem were set identical to the initial and final waypoint of the reference commercial flight trajectory. The initial and final 4D waypoints are shown in Table 2.

Table 2.
Initial and final waypoints of the reference commercial trajectory.
Figure 3, Figure 4 and Figure 5 show the comparison between the fuel-optimal and reference commercial trajectories, where the orange line represents the time history of the optimal trajectory and the blue line represents the time history of reference commercial trajectory as exported from FlightAware.
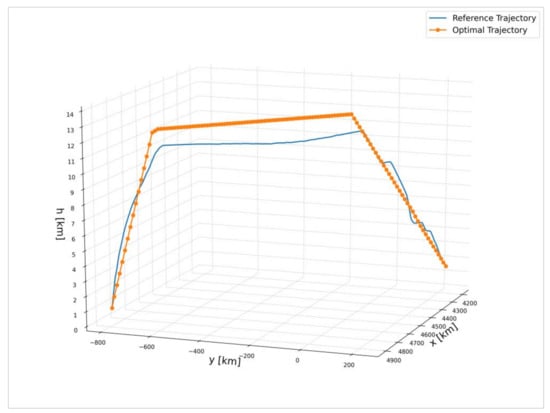
Figure 3.
Comparison of reference and fuel optimal 3D trajectories.
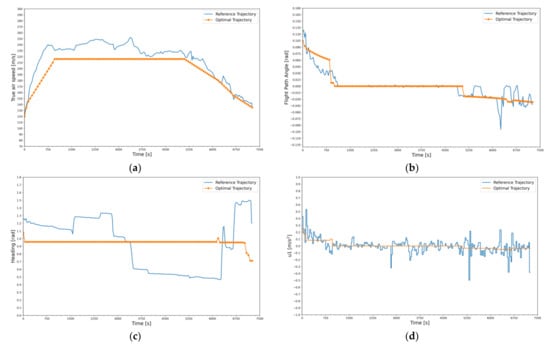

Figure 4.
Comparison of reference and fuel-optimal trajectories: (a) true air speed vs. time; (b) flight path angle vs. time; (c) heading vs. time; (d) control vs. time; (e) control vs. time; and (f) control vs. time.
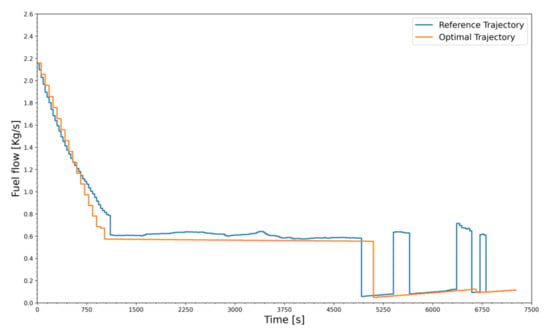
Figure 5.
Comparison of fuel-flow rate vs. time of reference and fuel-optimal trajectory.
Figure 3 shows the three-dimensional positions of the reference and optimal global trajectories, where the aircraft reached the Top of Climb (ToC) at 1020 s and the Top of Descent (ToD) at 5100 s in the optimal trajectory. The cruise altitude of the optimal trajectory was 12,500 m, with a constant speed of 216 m/s.
Figure 4a–c show the time history of the true airspeed, the flight path angle, and the heading angle between the reference and optimal trajectories, respectively. Figure 4d–f represent the time history of controls and of the trajectories, respectively. Figure 5 shows the aircraft fuel-flow rate comparison between the trajectories.
Table 3 compares the fuel consumption of the reference and fuel-optimal trajectories. The results suggested that the fuel-optimal trajectory reduced the fuel consumption by 439.326 kg, which was an approximately 10.1% reduction of aircraft fuel consumption by flying the optimal trajectory.

Table 3.
Fuel consumption of reference and fuel optimal trajectories.
4.2. Emissions-Optimal Trajectory
In the second case study, a flight from Lisbon to Munich and a twinjet aircraft were considered to analyze the emissions-optimal trajectories. In this study, the reference mass of this aircraft was considered as the take-off weight, which was 64,000 kg, and it also was assumed there was no wind condition. The performance operational data and the reference emissions indexes of oxides of nitrogen, carbon monoxide, and hydrocarbons of the aircraft are provided in Appendix A Table A2. To determine the potential benefit of reduction of aircraft emissions, the obtained emissions-optimal trajectories were compared with a commercial flight trajectory for the same route. The constraints of the case study were selected according to the reference commercial flight trajectory for the same route as shown in Table 4.

Table 4.
Constrains of the flight of the case study.
The intervals between the states grid points were , , , and the interval between the stages was . This case study considered the global trajectory consisting of all three climb, cruise, and descent phases of flight. The initial and final waypoints of the problem were set identical to the initial and final waypoints of the reference commercial flight trajectory. The initial and final 4D waypoints are shown in Table 5.

Table 5.
Initial and final waypoints of the reference commercial trajectory.
Figure 6, Figure 7 and Figure 8 show the comparison between the emissions-optimal and reference commercial trajectories, where the orange line represents the time history of the optimal trajectory and the blue line represents the time history of reference commercial trajectory as exported from FlightAware.
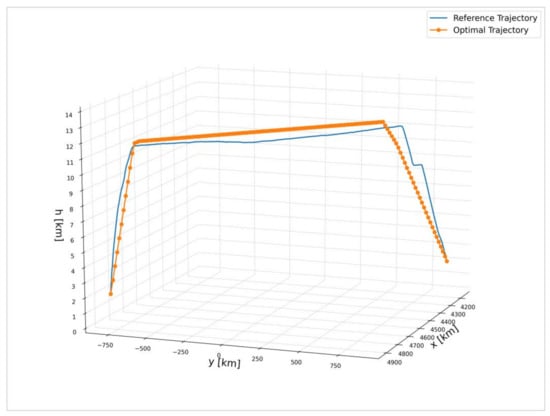
Figure 6.
Comparison of reference and emissions-optimal 3D trajectories.
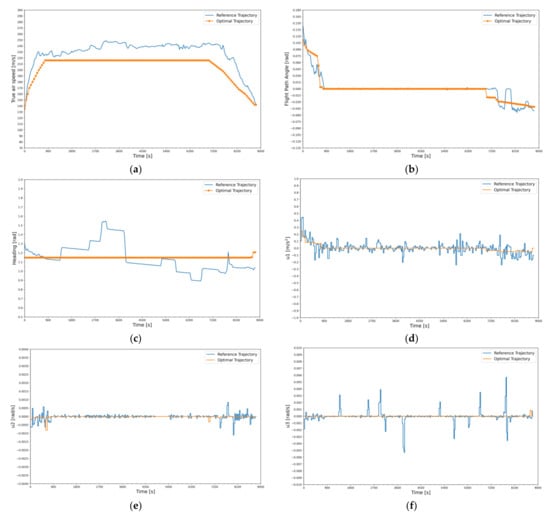
Figure 7.
Comparison of reference and emissions-optimal trajectories: (a) true air speed vs. time; (b) flight path angle vs. time; (c) heading vs. time; (d) control vs. time; (e) control vs. time; and (f) control vs. time.
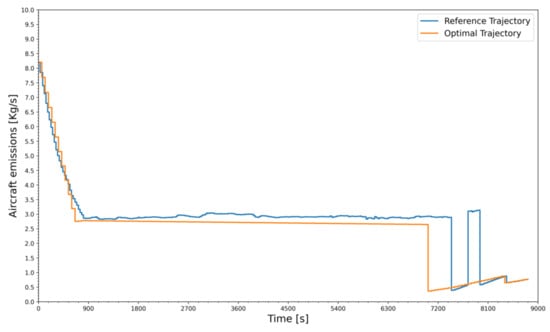
Figure 8.
Comparison of emissions rate vs. time of reference and emissions-optimal trajectory.
Figure 6 shows the three-dimensional position of the reference and optimal global trajectories, where the aircraft reached the ToC at 780 s and the ToD at 7020 s in the optimal trajectory. The cruise altitude of the optimal trajectory was 11,850 m, with a constant speed of 216 m/s.
Figure 7a shows the comparison of true airspeed between the trajectories. Figure 7b,c show the time history of the flight path angle and heading angle between the reference and optimal trajectories. Figure 7d–f represents the time history of controls and of the trajectories, respectively. Figure 8 shows the aircraft emissions rate comparison between the trajectories.
The aircraft emissions of the reference and emissions-optimal trajectories are presented in Table 6. The emissions of CO2, H2O, and SO2 were calculated using Equations (20)–(22), and the emissions of NOx, CO, and HC were calculated using Equations (31)–(33). Based on the results shown in Table 6, the aircraft emissions were 2730.551 kg less in the optimal trajectory, which was an approximately 10.99% reduction of aircraft emissions by flying the emissions-optimal trajectory.

Table 6.
Aircraft emissions of reference and emissions-optimal global trajectories.
5. Conclusions
In this paper, a Modified Dynamic Programming (MDP) approach was proposed to solve the 4D Trajectory Optimization Problem (TOP). The proposed MDP approach addressed the two serious drawbacks of traditional DP. It reduced the first drawback of the curse of dimensionality by limiting the search space at each stage and considering only the grid points of that reduced search space. The second drawback of the menace of the expanding grid also was solved by the MDP approach by generating the control values inside the allowable range. This generation of the control values guaranteed reachable grid points for the states at any stage.
The proposed MDP approach was applied to two case studies to validate its applicability. In the first case study, the MDP was applied to generate optimal trajectories that minimized aircraft fuel consumption. The generated fuel-optimal trajectories were compared to the corresponding reference airliner trajectories. The results suggested that the optimal trajectories improved the flight efficiency by reducing fuel consumption by 10.1% over the reference airliner flight trajectory. In the second case study, the MDP approach was applied to generate an aircraft emissions-optimal trajectory. The results suggested that the optimal trajectories reduced aircraft emissions by a margin of 10.99% over the reference airliner flight trajectory.
This new modified approach of DP has the potential to become one of the core components of a future autonomous air transportation system, as the numerical examples demonstrated it could successfully generate fuel- and emissions-optimal trajectories with little computational effort, which implies it can also be applied to online trajectory generation.
Future work will include consideration of the dynamic weather information and air traffic regulation in the trajectories. In addition, consideration of other performance indexes to reduce the environmental impact caused by airlines, such as noise emissions, would be of interest.
Author Contributions
Conceptualization, K.A. and K.B.; methodology, K.A. and K.B.; investigation, K.A.; data curation, K.A.; validation, K.A. and M.d.F.C.; writing—original draft preparation, K.A.; writing—review and editing, K.A., K.B. and M.d.F.C.; supervision, K.B.; funding acquisition, K.B. All authors have read and agreed to the published version of the manuscript.
Funding
This study was financially supported by the BID/ICI-FE/Santander Universidades-UBI Ph.D. scholarship and the Portuguese Foundation for Sciences and Technology (FCT) Ph.D. scholarship (reference SFRH/BD/140577/2018).
Institutional Review Board Statement
Not applicable.
Informed Consent Statement
Not applicable.
Data Availability Statement
The data presented in this study are available on request from the corresponding author.
Acknowledgments
This research work was conducted in the Laboratory of Avionics and Control of the University of the Beira Interior, Covilhã, Portugal, and supported by the Aeronautics and Astronautics Research Group (AeroG) of the Associated Laboratory for Energy, Transports, and Aeronautics (LAETA).
Conflicts of Interest
The authors declare no conflict of interest.
Abbreviations
The following abbreviations are used in this manuscript:
| 3DOF | – | Three Degrees of Freedom |
| ATC | – | Air Traffic Control |
| ATAG | – | Air Transport Action Group |
| BADA | – | Base of Aircraft Data |
| BFFM2 | – | Boeing Fuel Flow Method 2 |
| BVP | – | Boundary Value Problem |
| DP | – | Dynamic Programming |
| EI | – | Emission Index |
| EOMs | – | Equations of Motion |
| HJB | – | Hamilton–Jacobi–Bellman |
| ICAO | – | International Civil Aviation Organization |
| IDP | – | Iterative Dynamic Programming |
| MDP | – | Modified Dynamic Programming |
| MS-DP | – | Moving Search Space Dynamic Programming |
| NLP | – | Nonlinear Programming |
| OCP | – | Optimal Control Problem |
| OPF | – | Operations Performance File |
| PI | – | Performance Index |
| PMP | – | Pontryagin Maximum Principle |
| SDP | – | Soft Dynamic Programming |
| SGDP | – | Single Grid-Point Dynamic Programming |
| ToC | – | Top of Climb |
| ToD | – | Top of Descent |
| TOP | – | Trajectory Optimization Problem |
Appendix A. Performance Operational Data

Table A1.
Performance operational data of aircraft A1.
Table A1.
Performance operational data of aircraft A1.
| Performance Parameters | Value | Units |
| Reference mass mref | 60,000 | kg |
| Reference wing surface area s | 124.65 | m2 |
| Parasitic drag coefficient (cruise) | 0.0235 | N/A |
| Induced drag coefficient (cruise) | 0.0445 | N/A |
| 1st maximum climb thrust coefficient | 145,730 | N |
| 2nd maximum climb thrust coefficient | 55,638 | ft |
| 3rd maximum climb thrust coefficient | 0.14200 × 10⁻¹⁰ | 1/ft2 |
| 1st thrust temperature coefficient | 10.7 | K |
| 2nd thrust temperature coefficient | 0.0075 | 1/K |
| 1st thrust-specific fuel consumption coefficients | 0.9468 | kg/(min·kN) |
| 2nd thrust-specific fuel consumption coefficients | 0.1000 × 10¹⁵ | knots |
| 1st descent fuel-flow coefficients | 11.031 | kg/min |
| 2nd descent fuel-flow coefficients | 54,252 | ft |
| Cruise fuel-flow correction coefficient | 0.9737 | N/A |

Table A2.
Performance operational data of aircraft A2.
Table A2.
Performance operational data of aircraft A2.
| Performance Parameters | Value | Units |
| Reference mass mref | 64,000 | kg |
| Reference wing surface area s | 122.6 | m2 |
| Parasitic drag coefficient (cruise) | 0.024 | N/A |
| Induced drag coefficient (cruise) | 0.0375 | N/A |
| 1st maximum climb thrust coefficient | 136,050 | N |
| 2nd maximum climb thrust coefficient | 52,238 | ft |
| 3rd maximum climb thrust coefficient | 2.6637 × 10⁻¹¹ | 1/ft2 |
| 1st thrust temperature coefficient | 10.29 | K |
| 2nd thrust temperature coefficient | 0.005845 | 1/K |
| 1st thrust-specific fuel consumption coefficients | 0.94 | kg/(min·kN) |
| 2nd thrust-specific fuel consumption coefficients | 100,000 | knots |
| 1st descent fuel-flow coefficients | 8.89 | kg/min |
| 2nd descent fuel-flow coefficients | 81,926 | ft |
| Cruise fuel-flow correction coefficient | 1.06 | N/A |
| Reference emission index of oxides of nitrogen | 21.1 | g/kg |
| Reference emission index of carbon monoxide | 0.9 | g/kg |
| Reference emission index of hydrocarbons | 0.2 | g/kg |
References
- ATAG. Aviation: Benefits Beyond Borders; Air Transport Action Group: Geneva, Switzerland, 2018. [Google Scholar]
- Jensen, L.; Hansman, R.J.; Venuti, J.C.; Reynolds, T.G. Commercial Airline Speed Optimization Strategies for Reduced Cruise Fuel Consumption. In Proceedings of the AIAA Aviation Technology, Integration, and Operations Conference, Los Angeles, CA, USA, 12–14 August 2013. [Google Scholar] [CrossRef]
- Bryson, A.E.; Ho, Y.C. Applied Optimal Control: Optimization, Estimation and, Control; Taylor & Francis: New York, NY, USA, 1975; ISBN 0-89116-228-3. [Google Scholar]
- Betts, J.T. Survey of numerical methods for trajectory optimization. J. Guid. Control Dyn. 1998, 21, 193–207. [Google Scholar] [CrossRef]
- Rao, A.V. A survey of numerical methods for optimal control. Adv. Astronaut. Sci. 2009, 135, 497–528. [Google Scholar]
- Pontryagin, L.S. The Mathematical Theory of Optimal Processes; John Wiley & Sons: New York, NY, USA, 1962; ISBN 2-88124-077-1. [Google Scholar]
- Athans, M.A.; Falb, P.L. Optimal Control: An Introduction to The Theory and Its Applications; Dover Publications: Mineola, NY, USA, 2007; ISBN 0-486-45328-6. [Google Scholar]
- Stryk, O.V.; Bulirsch, R. Direct and indirect methods for trajectory optimization. Ann. Oper. Res. 1992, 37, 357–373. [Google Scholar] [CrossRef]
- Burrows, J.W. Fuel-optimal aircraft trajectories with fixed arrival times. J. Guid. Control Dyn. 1983, 6, 14–19. [Google Scholar] [CrossRef]
- Neuman, F.; Kreindler, E. Minimum-fuel, three-dimensional flight paths for jet transports. J. Guid. Control Dyn. 1985, 8, 650–657. [Google Scholar] [CrossRef]
- Chakravarty, A. Four-dimensional fuel-optimal guidance in the presence of winds. J. Guid. Control Dyn. 1985, 8, 16–22. [Google Scholar] [CrossRef]
- Hull, D.G. Conversion of optimal control problems into parameter optimization problems. J. Guid. Control Dyn. 1997, 20, 57–60. [Google Scholar] [CrossRef]
- Bazaraa, M.S.; Sherali, H.D.; Shetty, C.M. Nonlinear Programming: Theory and Algorithms, 3rd ed.; Wiley Interscience: Hoboken, NJ, USA, 2006; ISBN 978-0-471-48600-8. [Google Scholar]
- Houacine, M.; Khardi, S. Gauss pseudospectral method for less noise and fuel consumption of aircraft operations. J. Aircr. 2010, 47, 2152–2159. [Google Scholar] [CrossRef]
- Bousson, K.; Machado, P. 4D trajectory generation and tracking for waypoint-based aerial navigation. WSEAS Trans. Syst. Control. 2013, 8, 105–119, E-ISSN: 2224-2856. [Google Scholar]
- Soler, M.; Olivares, A.; Staffetti, E. Multiphase Optimal Control Framework for Commercial Aircraft Four-Dimensional Flight-Planning Problems. J. Aircr. 2015, 52, 274–286. [Google Scholar] [CrossRef]
- Ahmed, K.; Bousson, K.; Coelho, M. Spline parameterization based nonlinear trajectory optimization along 4D waypoints. Adv. Aircr. Spacecr. Sci. 2019, 6, 391–407. [Google Scholar] [CrossRef]
- Hartjes, S.; Visser, H.G.; van Hellenberg Hubar, M.E.G. Trajectory Optimization of Extended Formation Flights for Commercial Aviation. Aerospace 2019, 6, 100. [Google Scholar] [CrossRef]
- Tian, Y.; He, X.; Xu, Y.; Wan, L.; Ye, B. 4D Trajectory Optimization of Commercial Flight for Green Civil Aviation. IEEE Access 2020, 8, 62815–62829. [Google Scholar] [CrossRef]
- Bellman, R.E. Dynamic Programming; Dover Publications: New York, NY, USA, 1959; ISBN 0-486-42809-5. [Google Scholar]
- Kirk, D.E. An introduction to dynamic programming. IEEE Trans. Educ. 1967, 4, 212–219. [Google Scholar] [CrossRef]
- Waller, M.C.; Rigopoulos, J.G.; Blackman, D.R.; Berreen, T.F. Considerations in the application of dynamic programming to optimal aircraft trajectory generation. In Proceedings of the IEEE Conference on Aerospace and Electronics, Dayton, OH, USA, 21 May 1990; pp. 574–579. [Google Scholar] [CrossRef]
- Miyamoto, Y.; Wickramasinghe, N.K.; Harada, A.; Miyazawa, Y.; Funabiki, K. Analysis of fuel-efficient airliner flight via dynamic programming trajectory optimization. Trans. Jpn. Soc. Aeronaut. Space Sci. Jpn. 2013, 11, 93–98. [Google Scholar] [CrossRef][Green Version]
- Grabbe, S.; Sridhar, B.; Cheng, N. Central East Pacific Flight Routing. In Proceedings of the AIAA Guidance, Navigation, and Control Conference and Exhibit, Keystone, CO, USA, 21 August 2006. [Google Scholar] [CrossRef][Green Version]
- Hagelauer, P.; Mora Camino, F. A soft dynamic programming approach for on line aircraft 4D trajectory optimization. Eur. J. Oper. Res. 1998, 107, 87–95. [Google Scholar] [CrossRef]
- Luus, R. Iterative Dynamic Programming; Chapman & Hall/CRC: London, UK, 2000; ISBN 1-58488-148-8. [Google Scholar]
- Bousson, K. Single gridpoint dynamic programming for trajectory optimization. In Proceedings of the AIAA Atmospheric Flight Mechanics Conference and Exhibit, San Francisco, CA, USA, 15–18 August 2005. [Google Scholar] [CrossRef]
- Miyazawa, Y.; Wickramasinghe, N.K.; Harada, A.; Miyamoto, Y. Dynamic programming application to airliner four-dimensional optimal flight trajectory. In Proceedings of the AIAA Guidance, Navigation, and Control (GNC) Conference, Boston, MA, USA, 19–22 August 2013. [Google Scholar] [CrossRef]
- Harada, A.; Matsuda, H.; Miyazawa, Y. Dynamic programming trajectory optimization by piecewise linear approximation. In Proceedings of the AIAA Guidance, Navigation, and Control Conference, Kissimmee, FL, USA, 5–9 January 2015. [Google Scholar] [CrossRef]
- Khardi, S. Aircraft Flight Path Optimization. The Hamilton-Jacobi-Bellman considerations. Appl. Math. Sci. 2012, 6, 1221–1249, hal-00987163. [Google Scholar]
- Parzani, C.; Puechmorel, S. On a Hamilton-Jacobi-Bellman Approach for Coordinated Optimal Aircraft Trajectories Planning. Optim. Contr. Appl. Met. 2018, 39, 933–948. [Google Scholar] [CrossRef]
- Eurocontrol. User Manual for the Base of Aircraft Data (BADA); Revision 3.11; Eurocontrol Experimental Centre (EEC) Technical/Scientific Report No. 13/04/16-01; Eurocontrol Experimental Centre (EEC): Brétigny-sur-Orge, France, 2013. [Google Scholar]
- Sutkus, D.J.; Baughcum, S.L.; DuBois, D.P. Scheduled Civil Aircraft Emission Inventories for 1999; Database Development and Analysis NASA/CR-2001-21121; NASA: Washington, DC, USA, 2001. [Google Scholar]
- Baughcuma, S.L.; Tritz, T.G.; Henderson, S.C.; Pickett, D.C. Scheduled Civil Aircraft Emission Inventories for 1992; Database Development and Analysis, Project Report NASA CR 4700; NASA: Washington, DC, USA, 1996. [Google Scholar]
- Robenson, B. Fuel Conservation Strategies: Cost Index Explained. Boeing Aero Q. 2007, 2, 26–28. [Google Scholar]
- Naidu, D.S. Optimal Control Systems; CRC Press: Boca Raton, FL, USA, 2003; ISBN 0-8493-0892-5. [Google Scholar]
Publisher’s Note: MDPI stays neutral with regard to jurisdictional claims in published maps and institutional affiliations. |
© 2021 by the authors. Licensee MDPI, Basel, Switzerland. This article is an open access article distributed under the terms and conditions of the Creative Commons Attribution (CC BY) license (https://creativecommons.org/licenses/by/4.0/).