
Methodology for Evaluating Risk of Visual Inspection Tasks of Aircraft Engine Blades


Abstract

1. Introduction
2. Literature Review
2.1. Extended Risk Constructs Using n-Tuples
2.2. Specific Frameworks for Visual Inspection Risk
2.3. Representation of Inspection Risk for Decision-Making
2.4. Gaps in the Body of Knowledge Regarding Visual Inspection
3. Methods
3.1. Research Objective
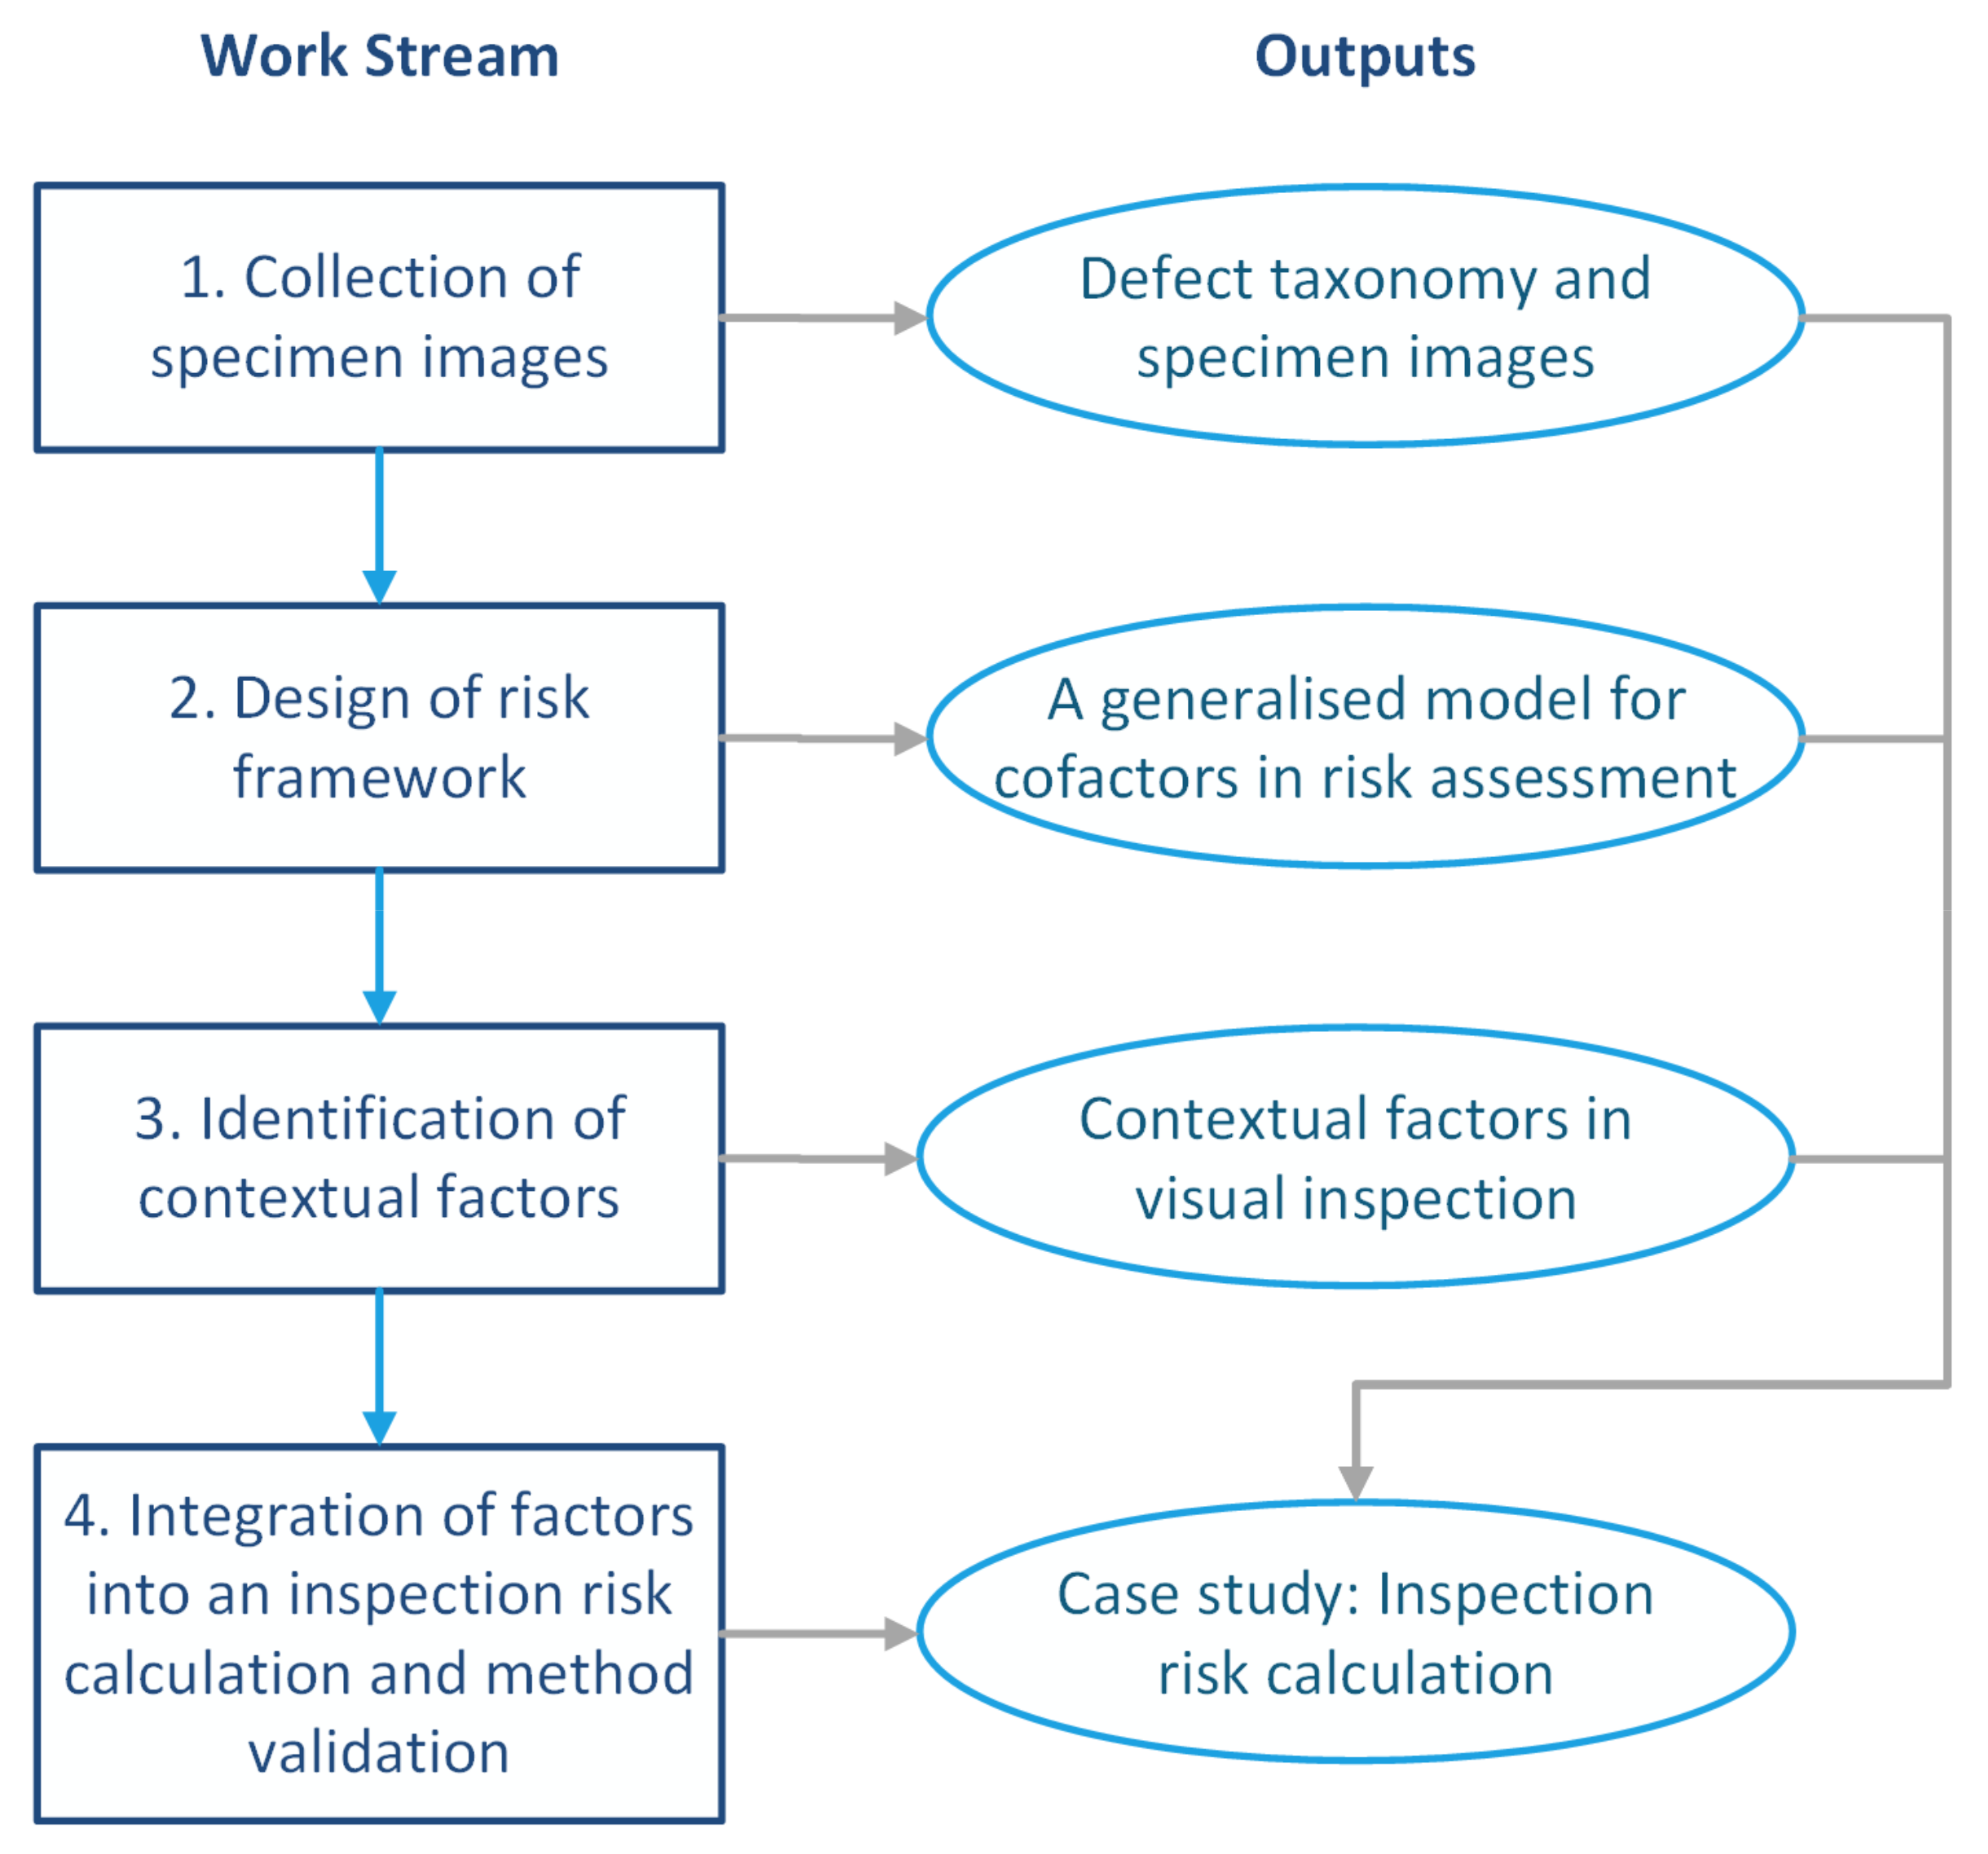
3.2. Approach
3.2.1. Work Stream 1: Collection of Specimen Images
3.2.2. Work Stream 2: Design of Risk Framework
3.2.3. Work Stream 3: Identification of Contextual Factors
3.2.4. Work Stream 4: Integration of Factors into an Inspection Risk Calculation and Method Validation
4. Results
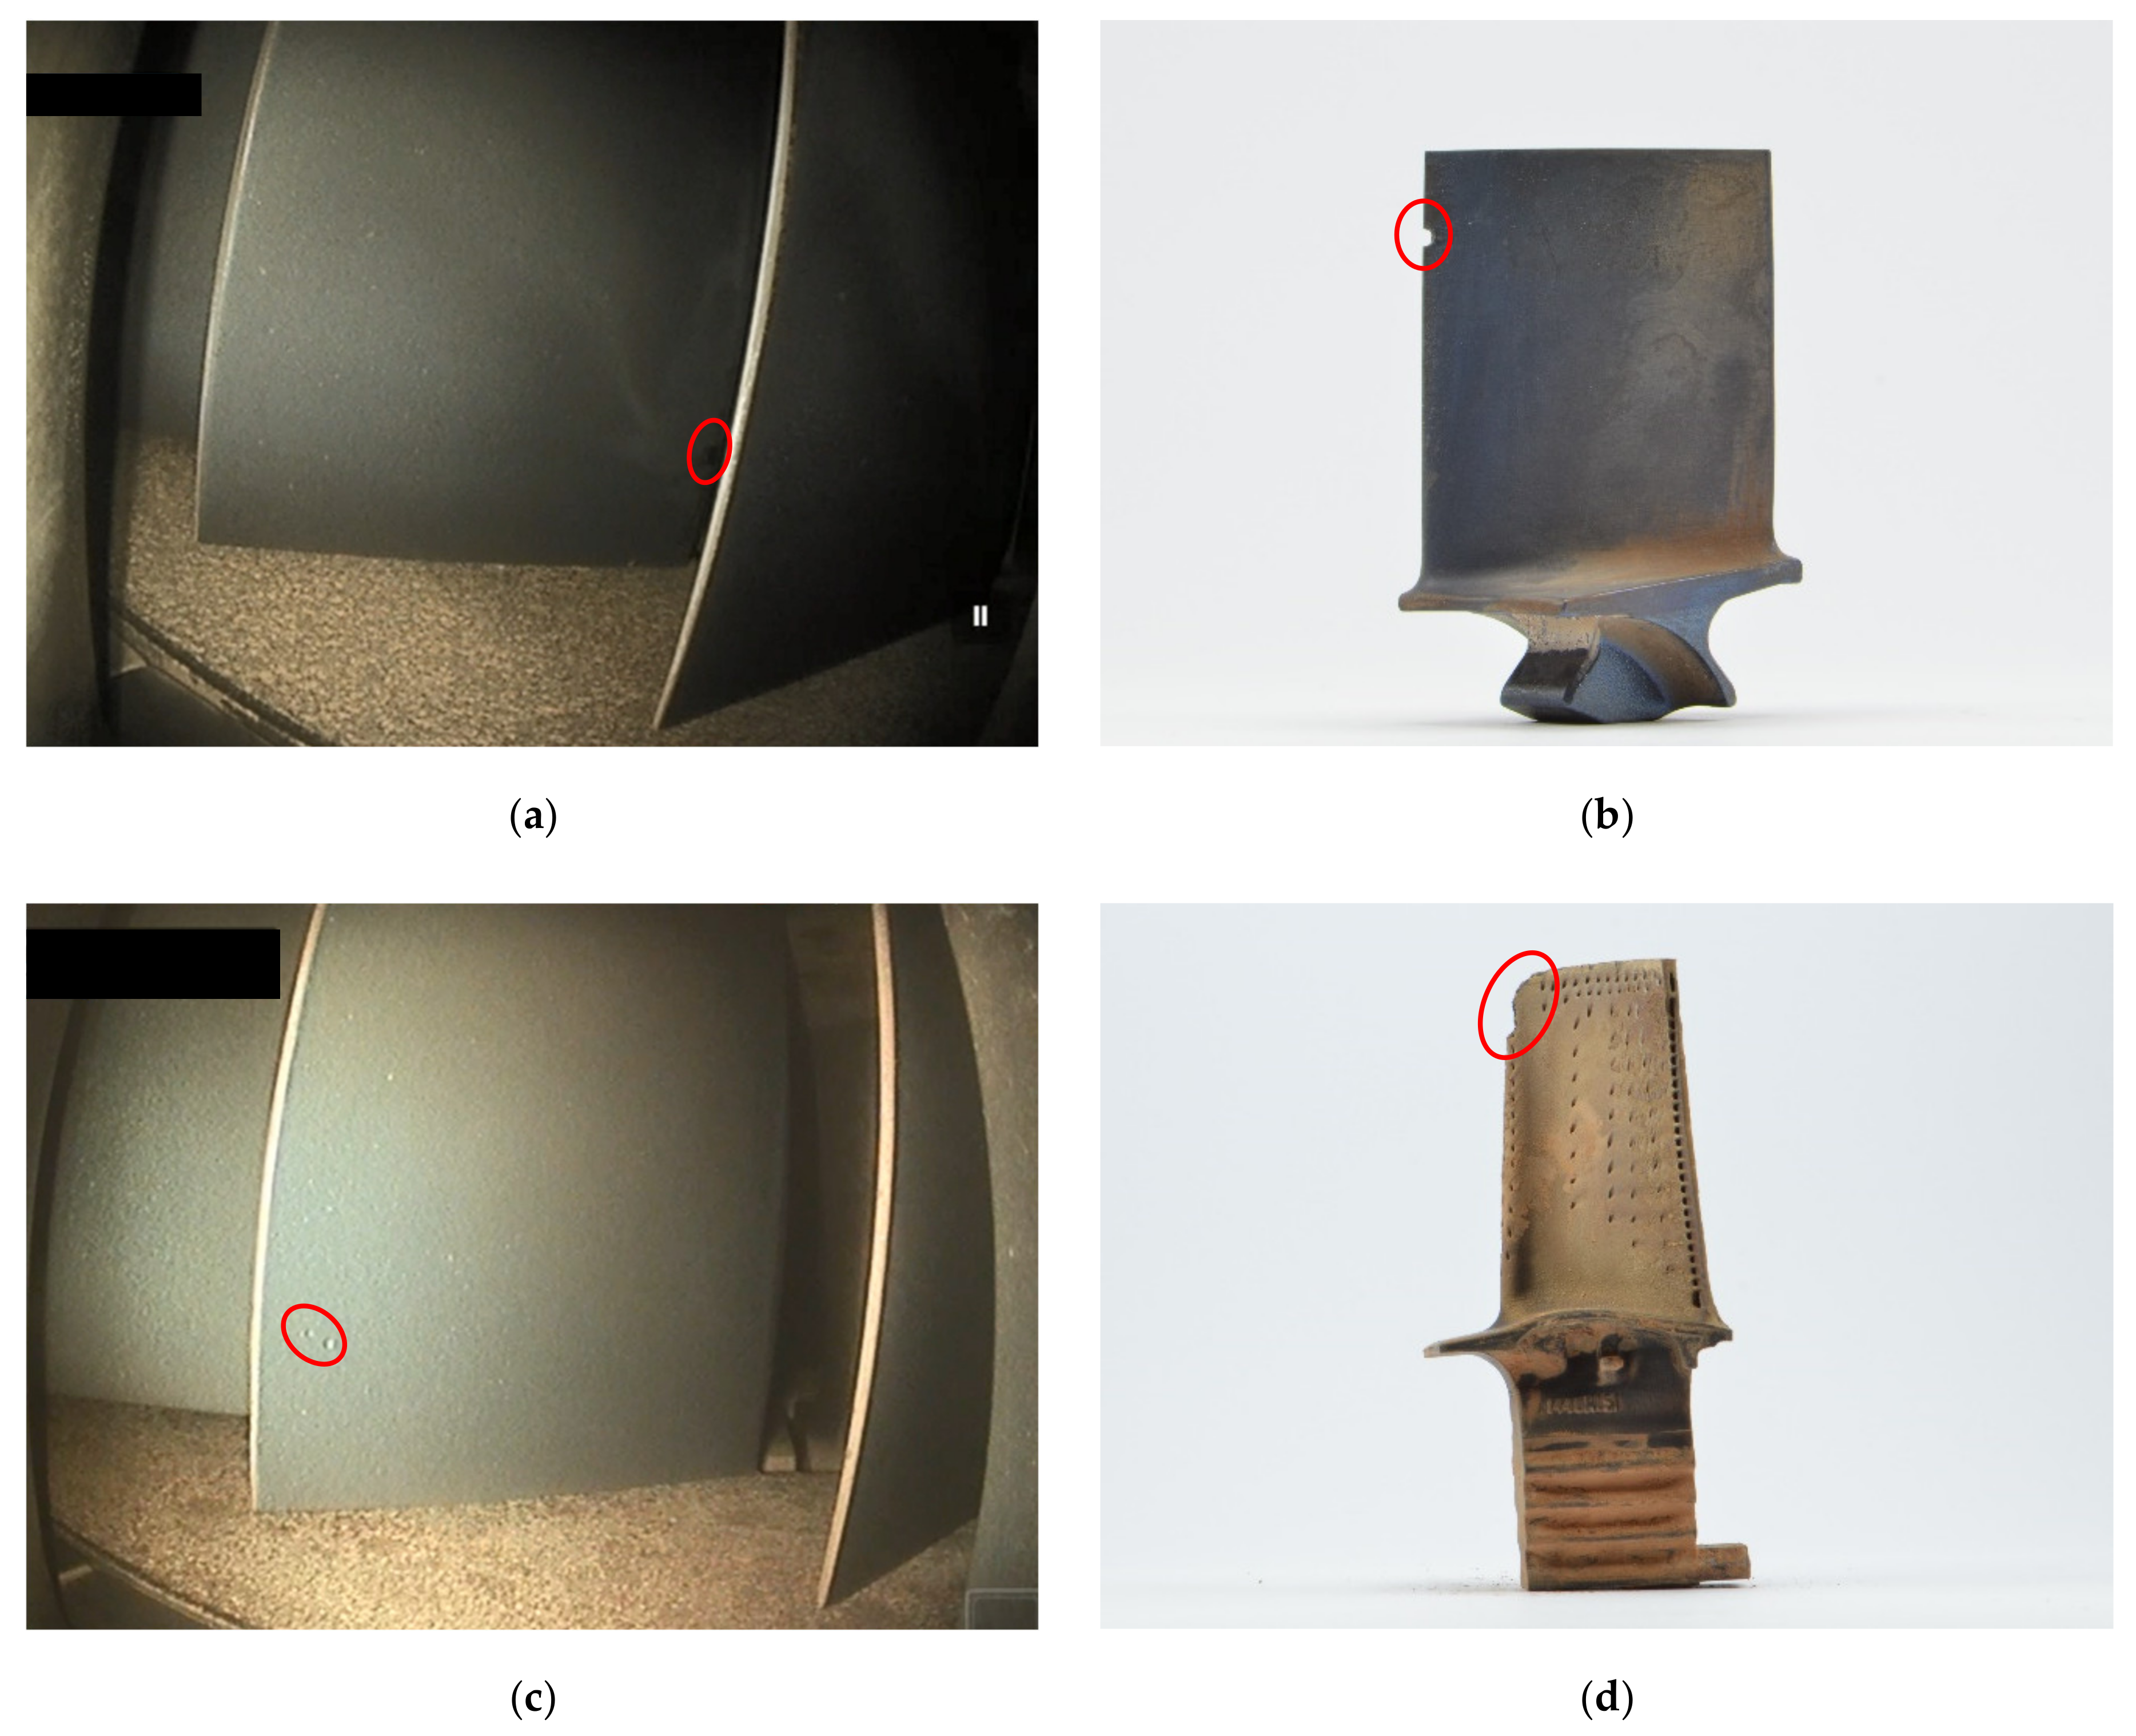
4.1. Defect Taxonomy and Specimen Images
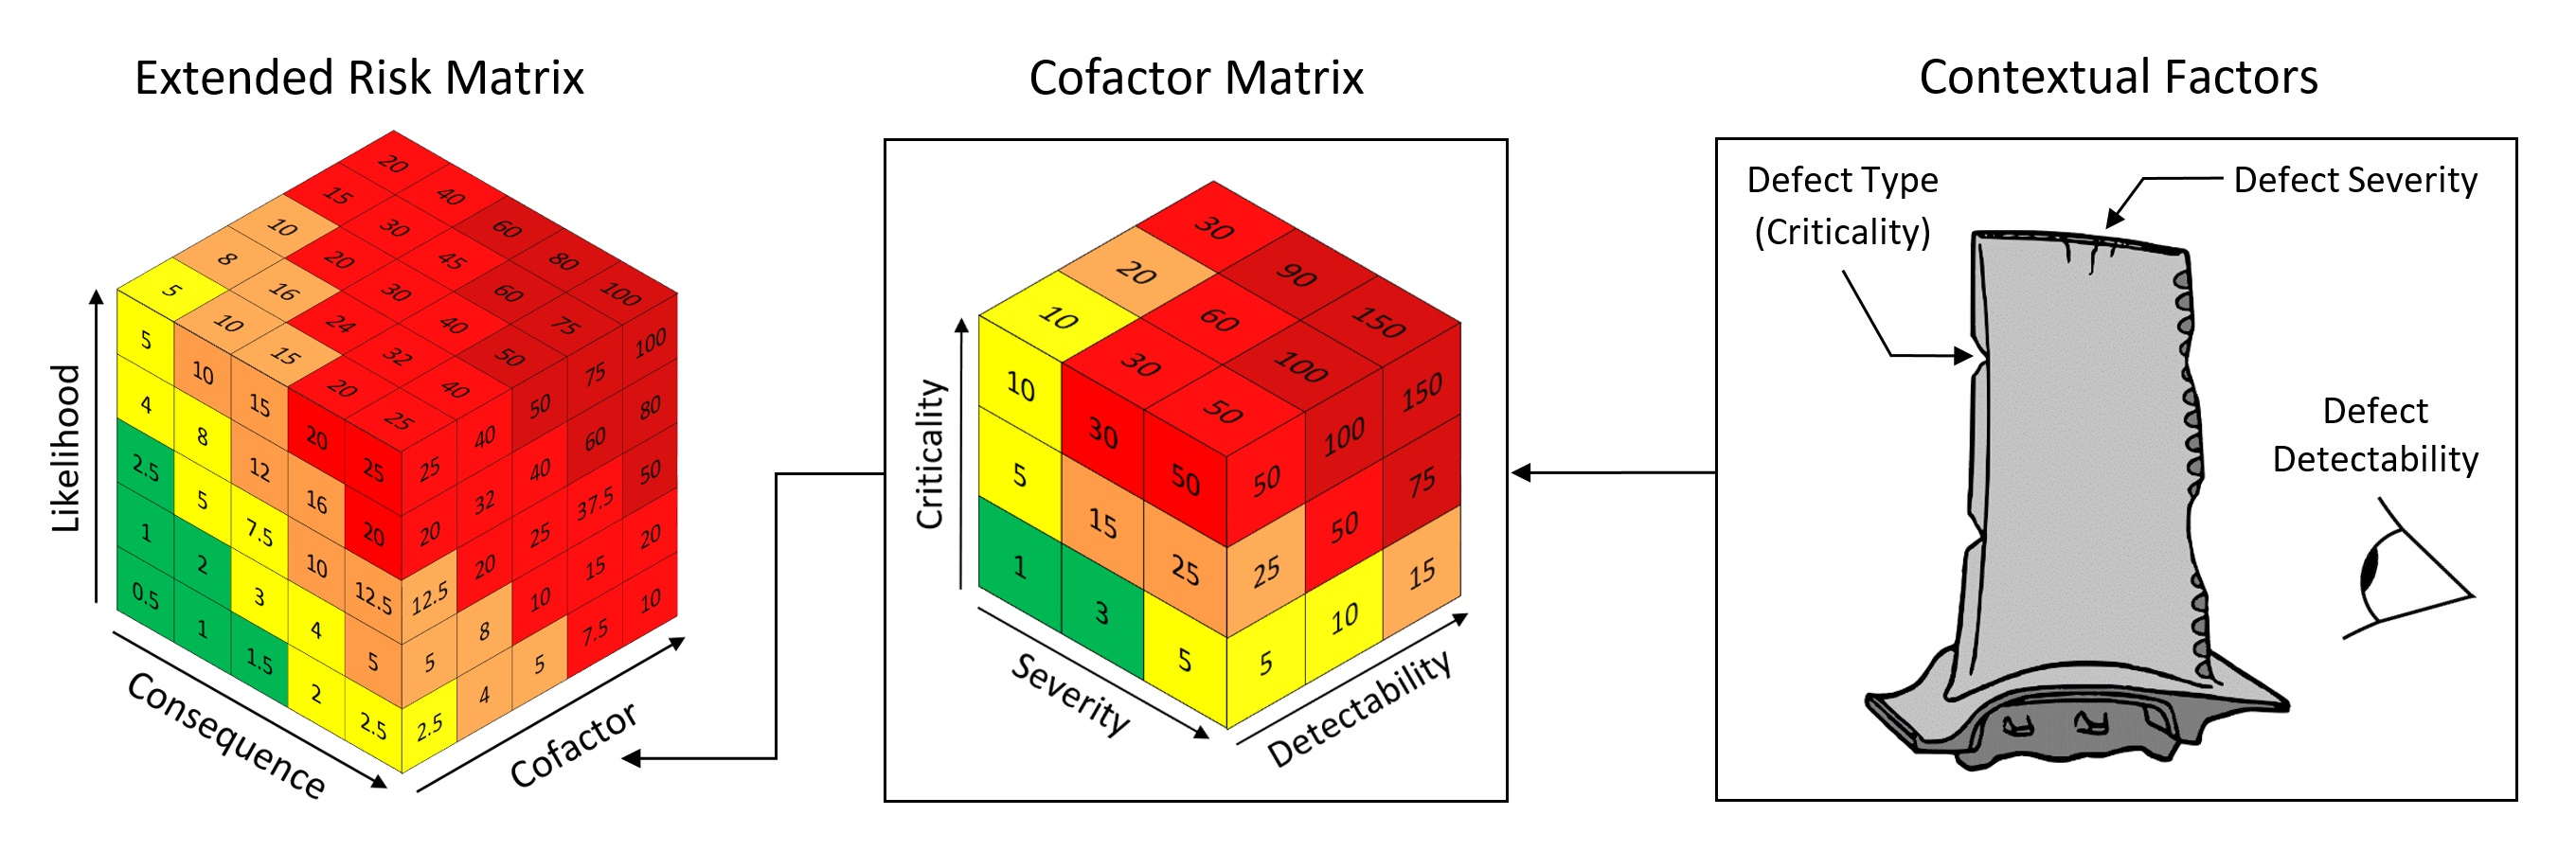
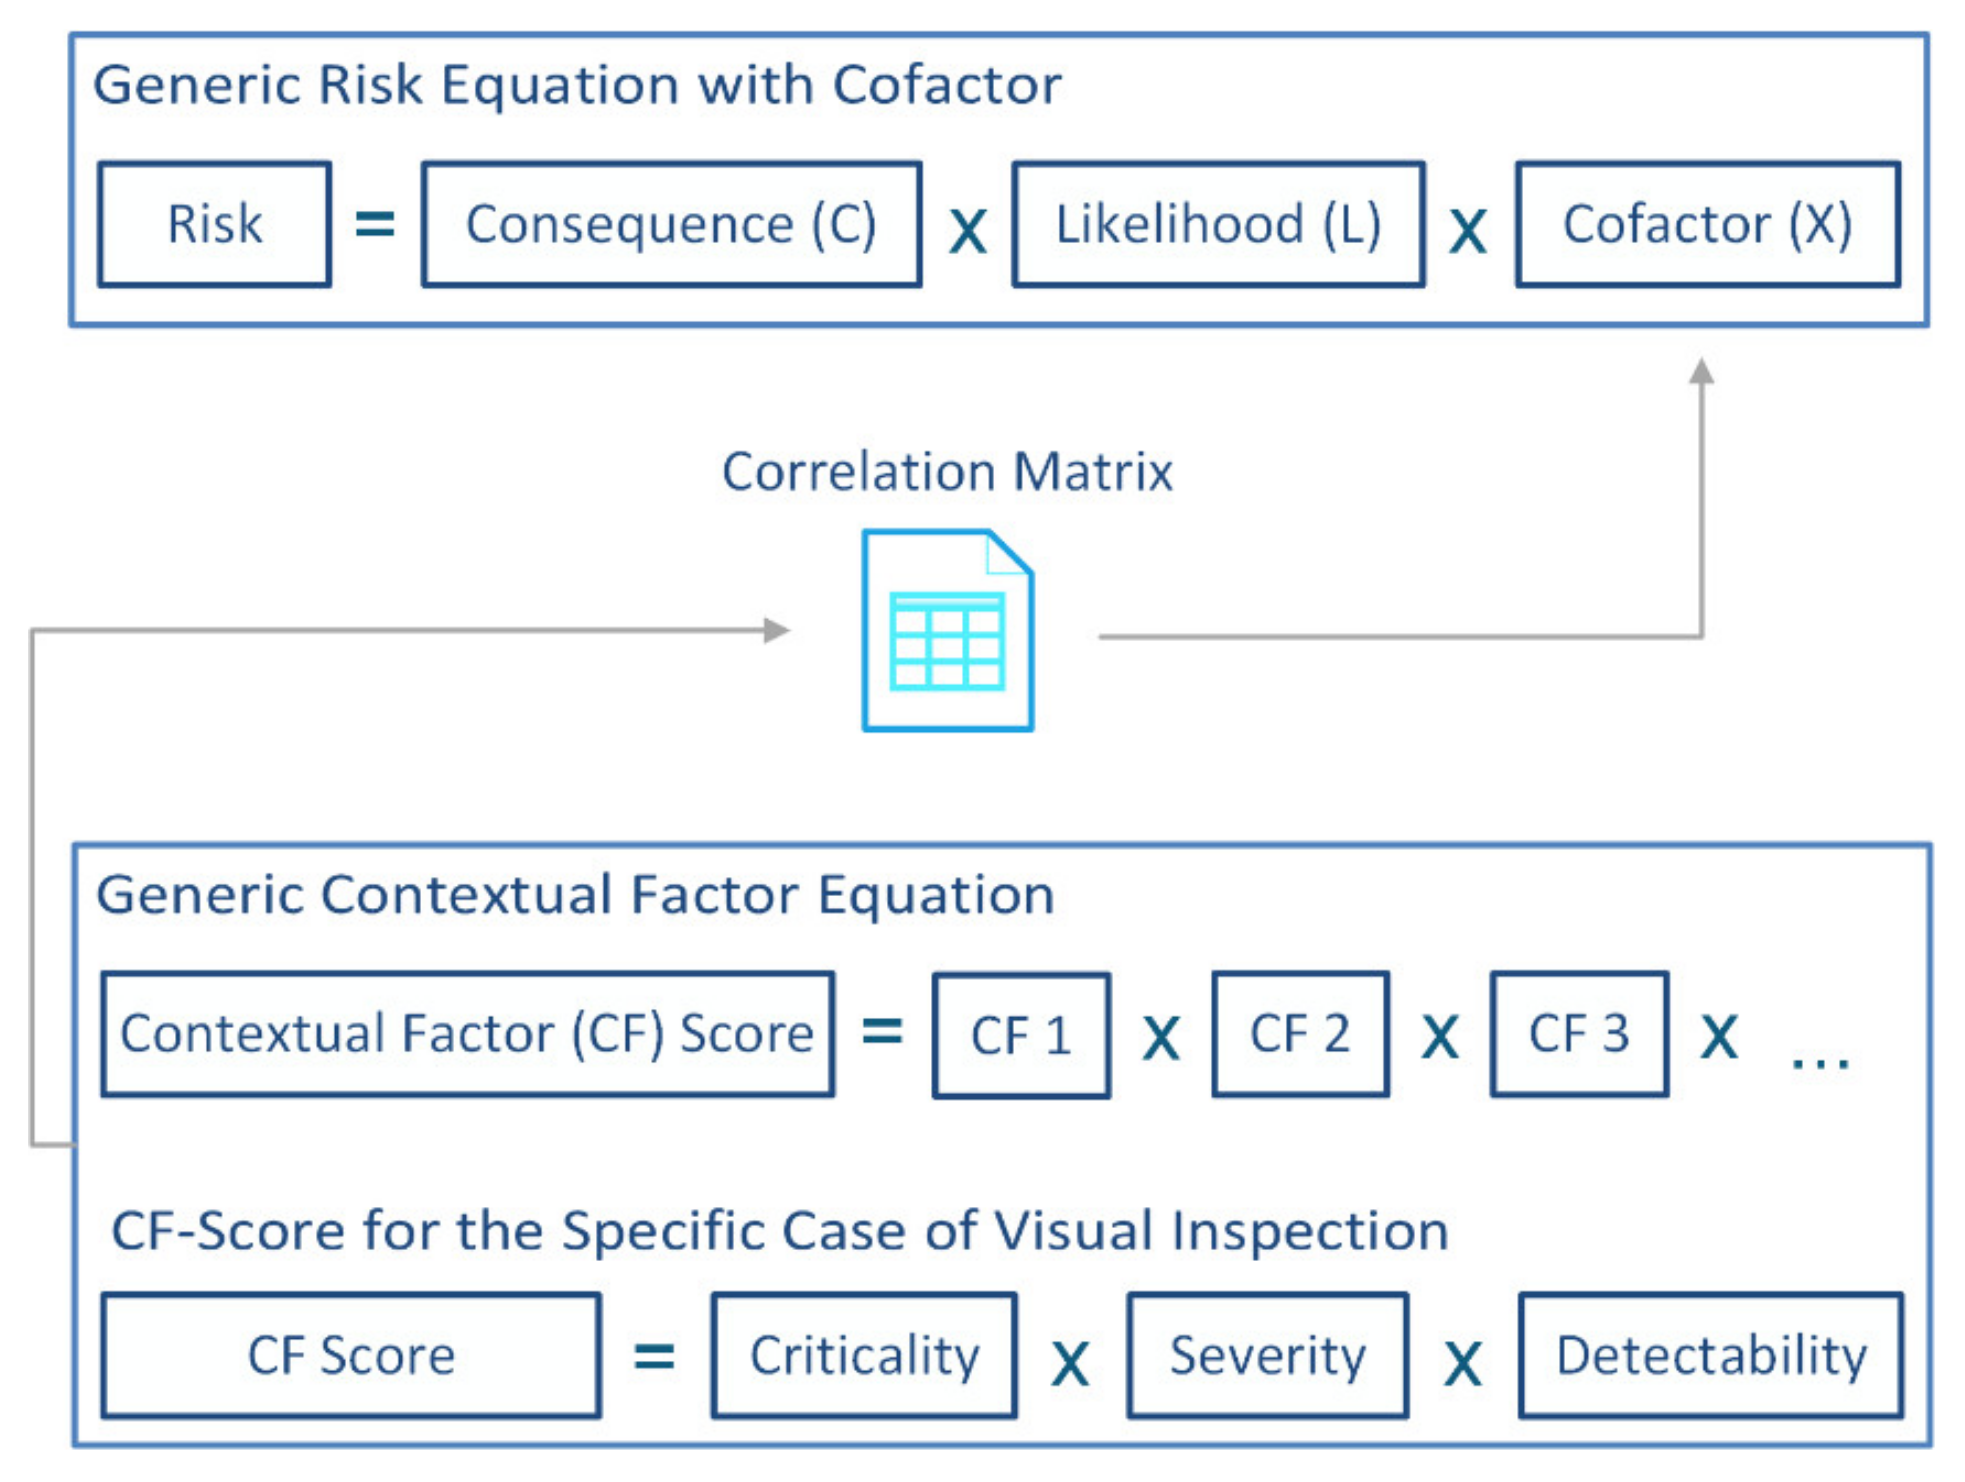
4.2. A Generalised Model for Cofactors in Risk Assessment
4.3. Contextual Factors in Visual Inspection
- The criticality of the defect if it stays undetected and the part is being released back to service, with the risk of propagating and cascading towards severe damage and harm.
- The severity and characteristics of the defect shape.
- The ability to detect the defect with the selected inspection method before the engine returns to service.
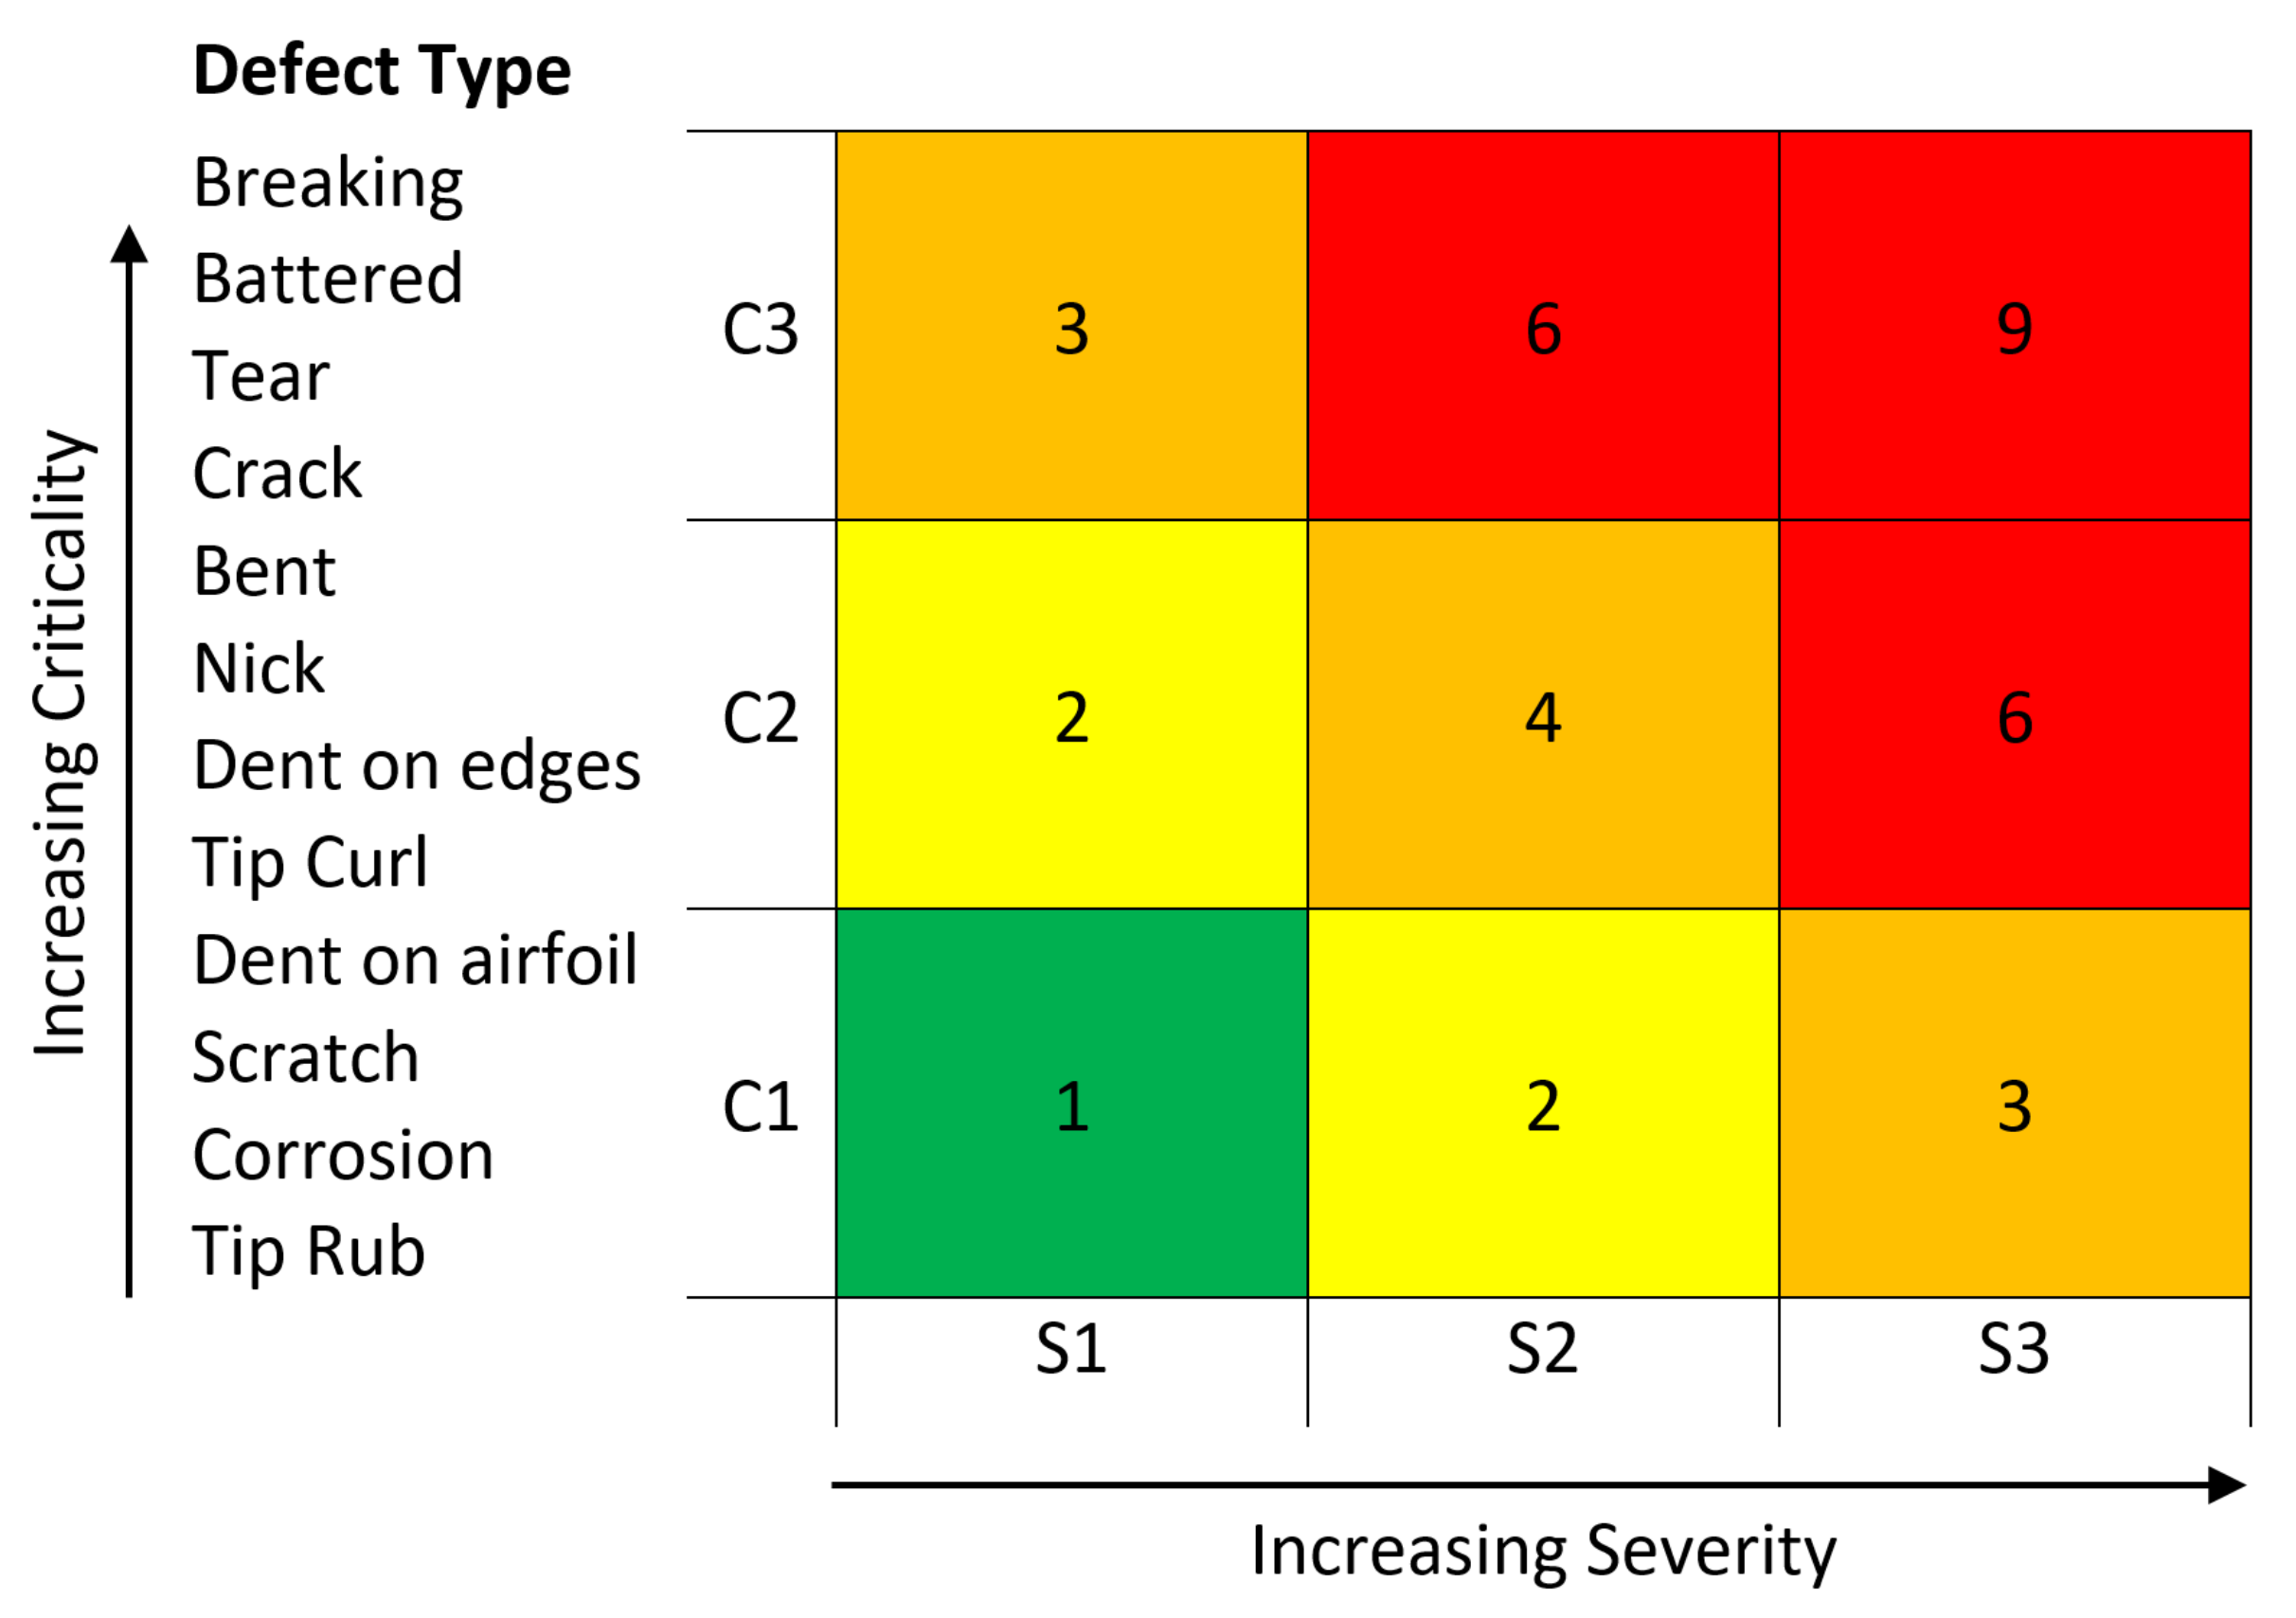
4.3.1. Defect Class Type—Criticality Factor
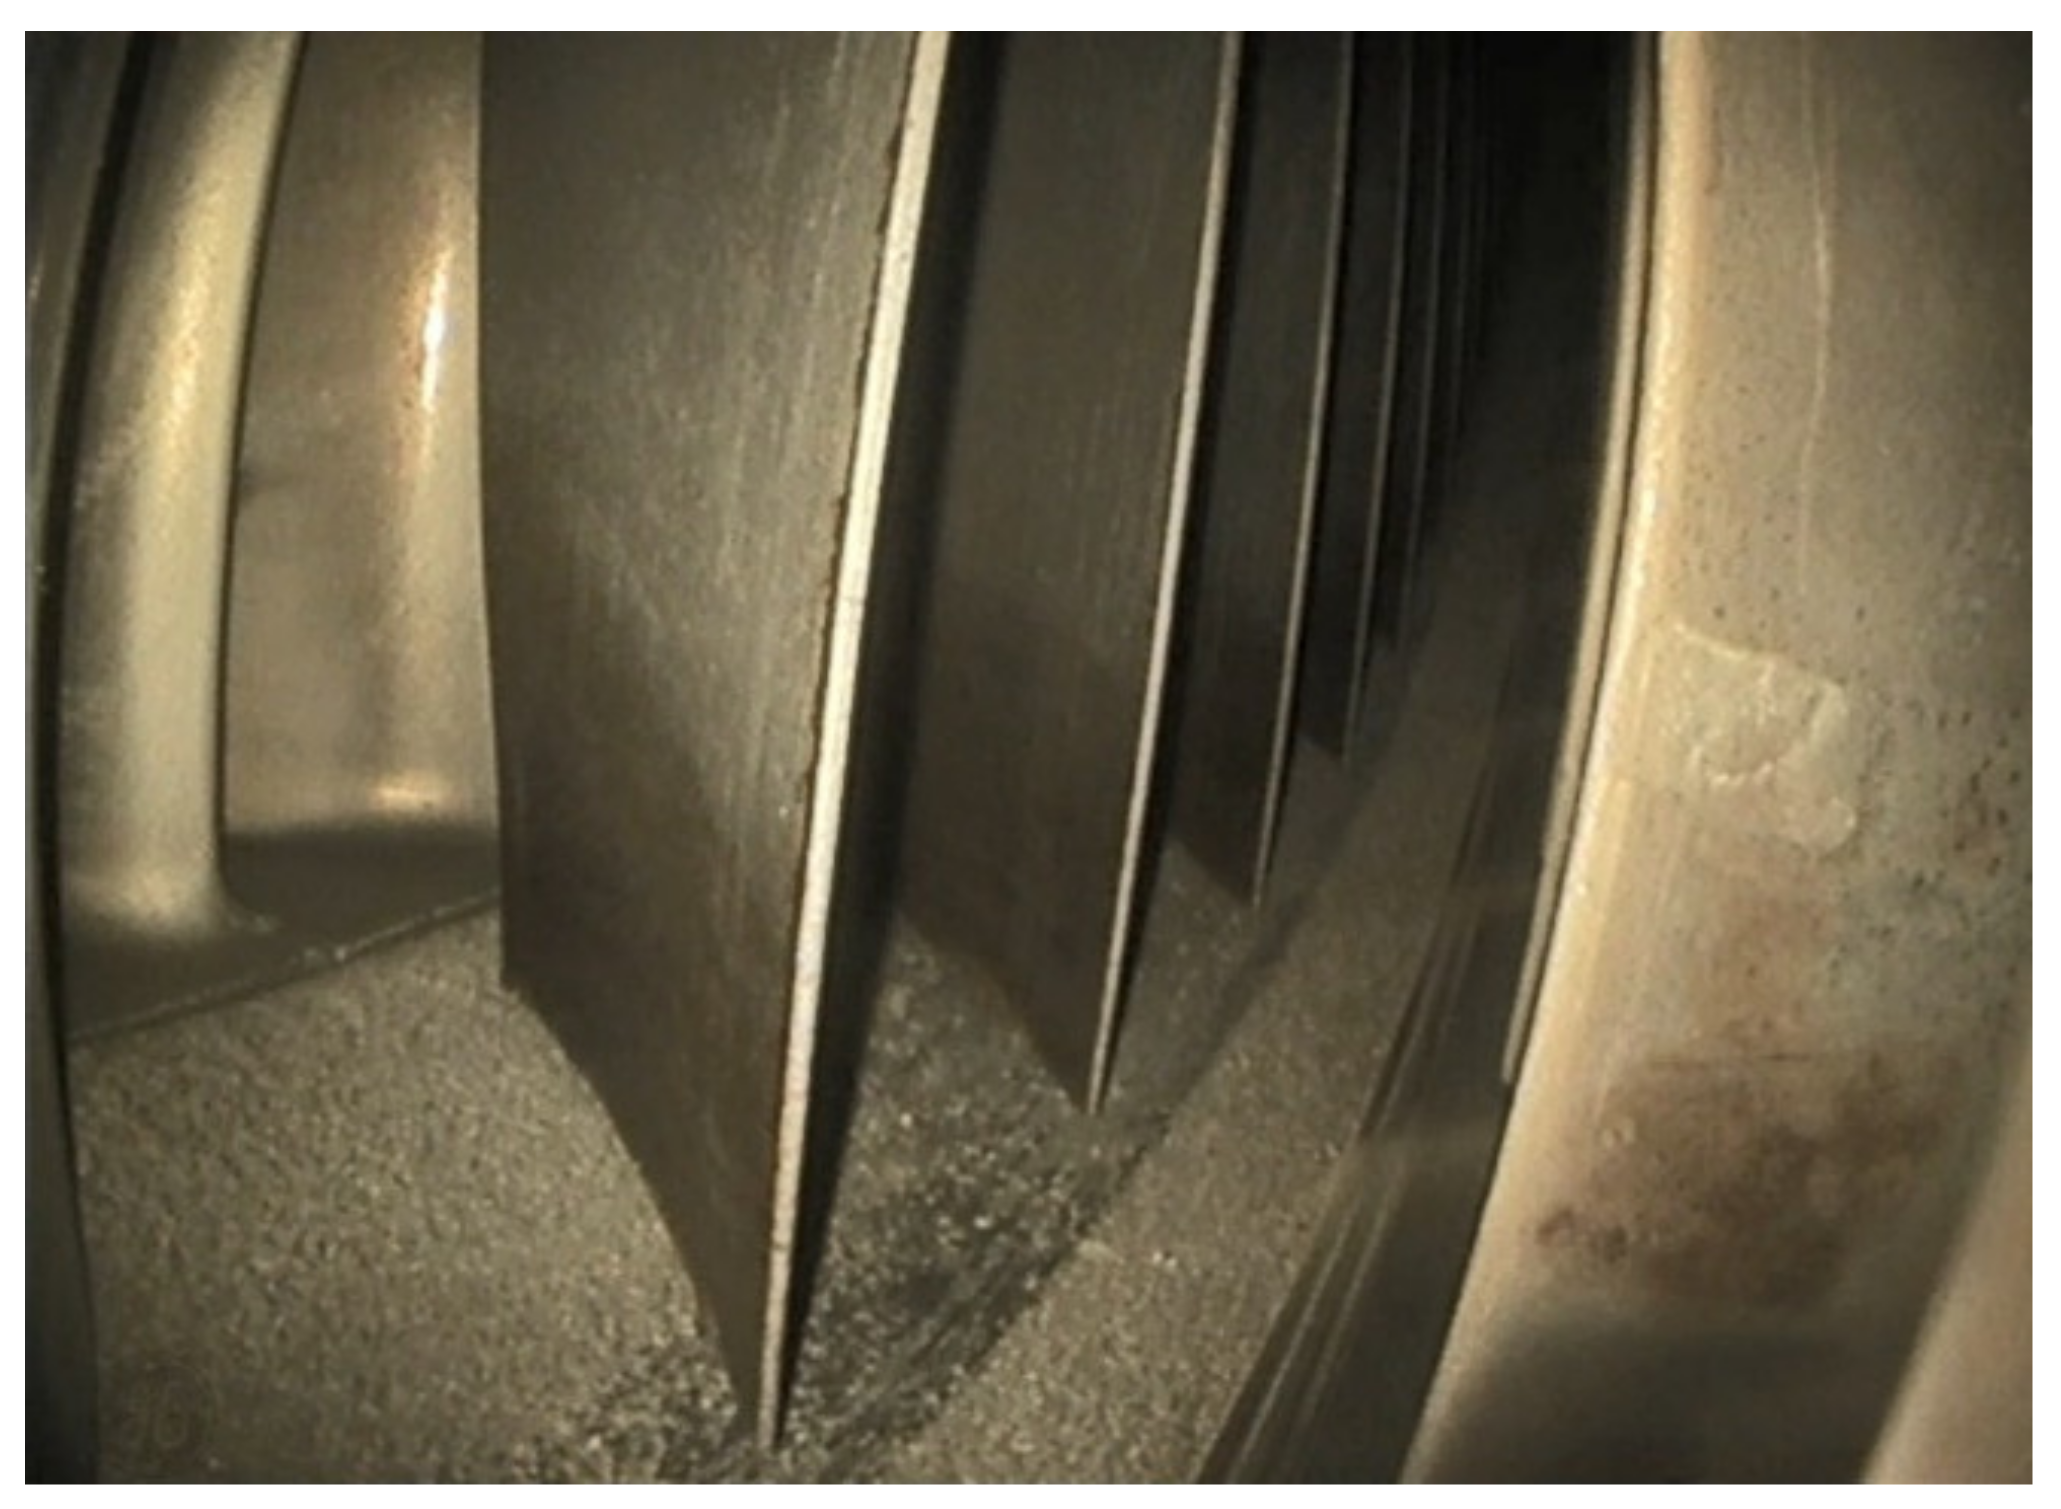
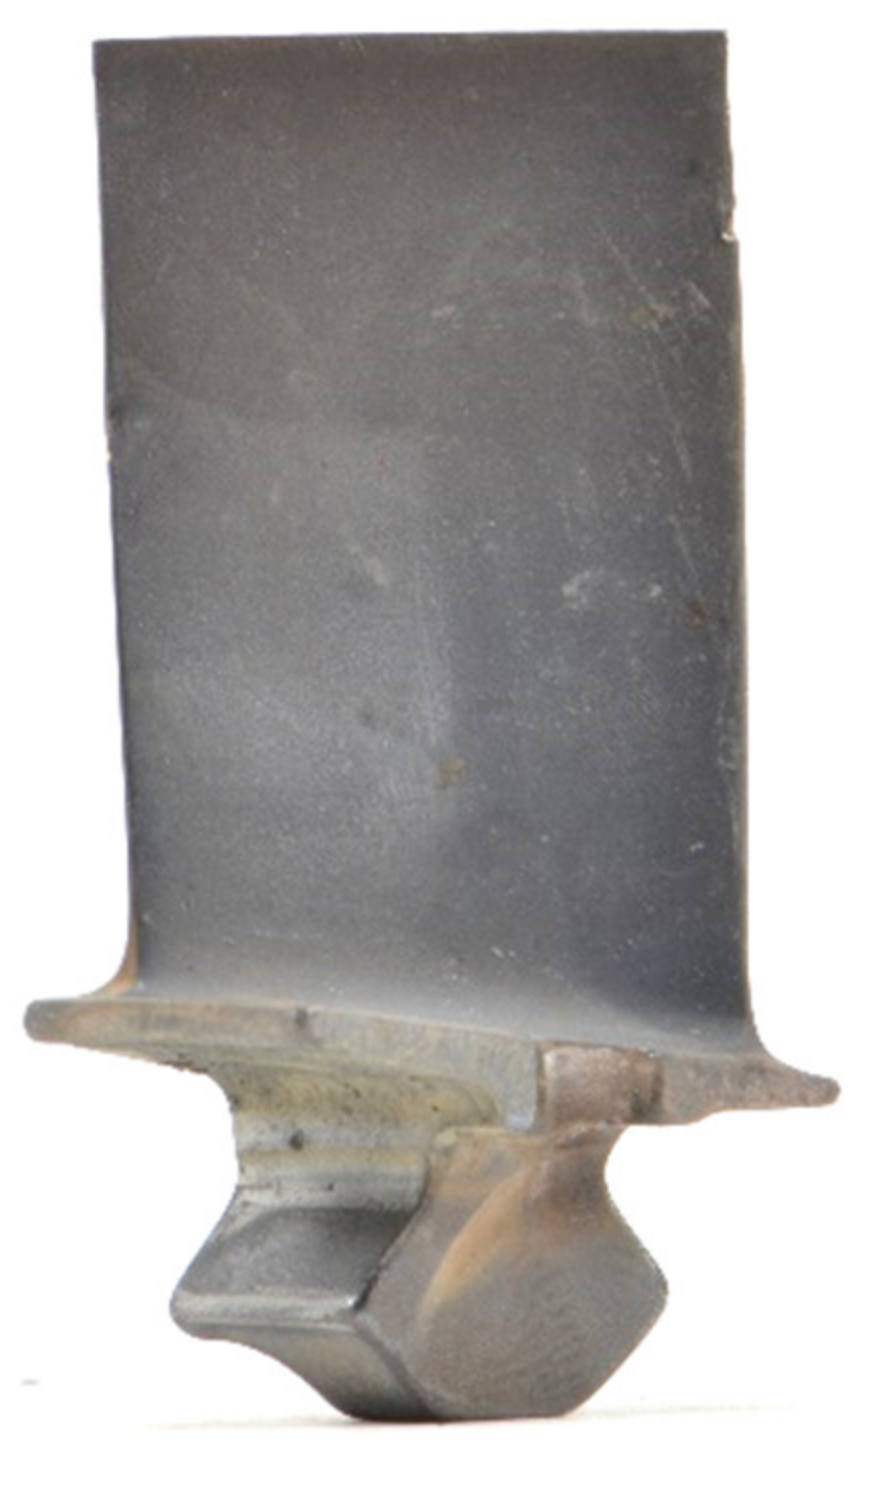
4.3.2. Propagation Characteristics—Severity Factor
4.3.3. Detection of the Defect—Detectability Factor
Representative Blade Views
Defect View Scale
Correlation Between View and Type of Defects
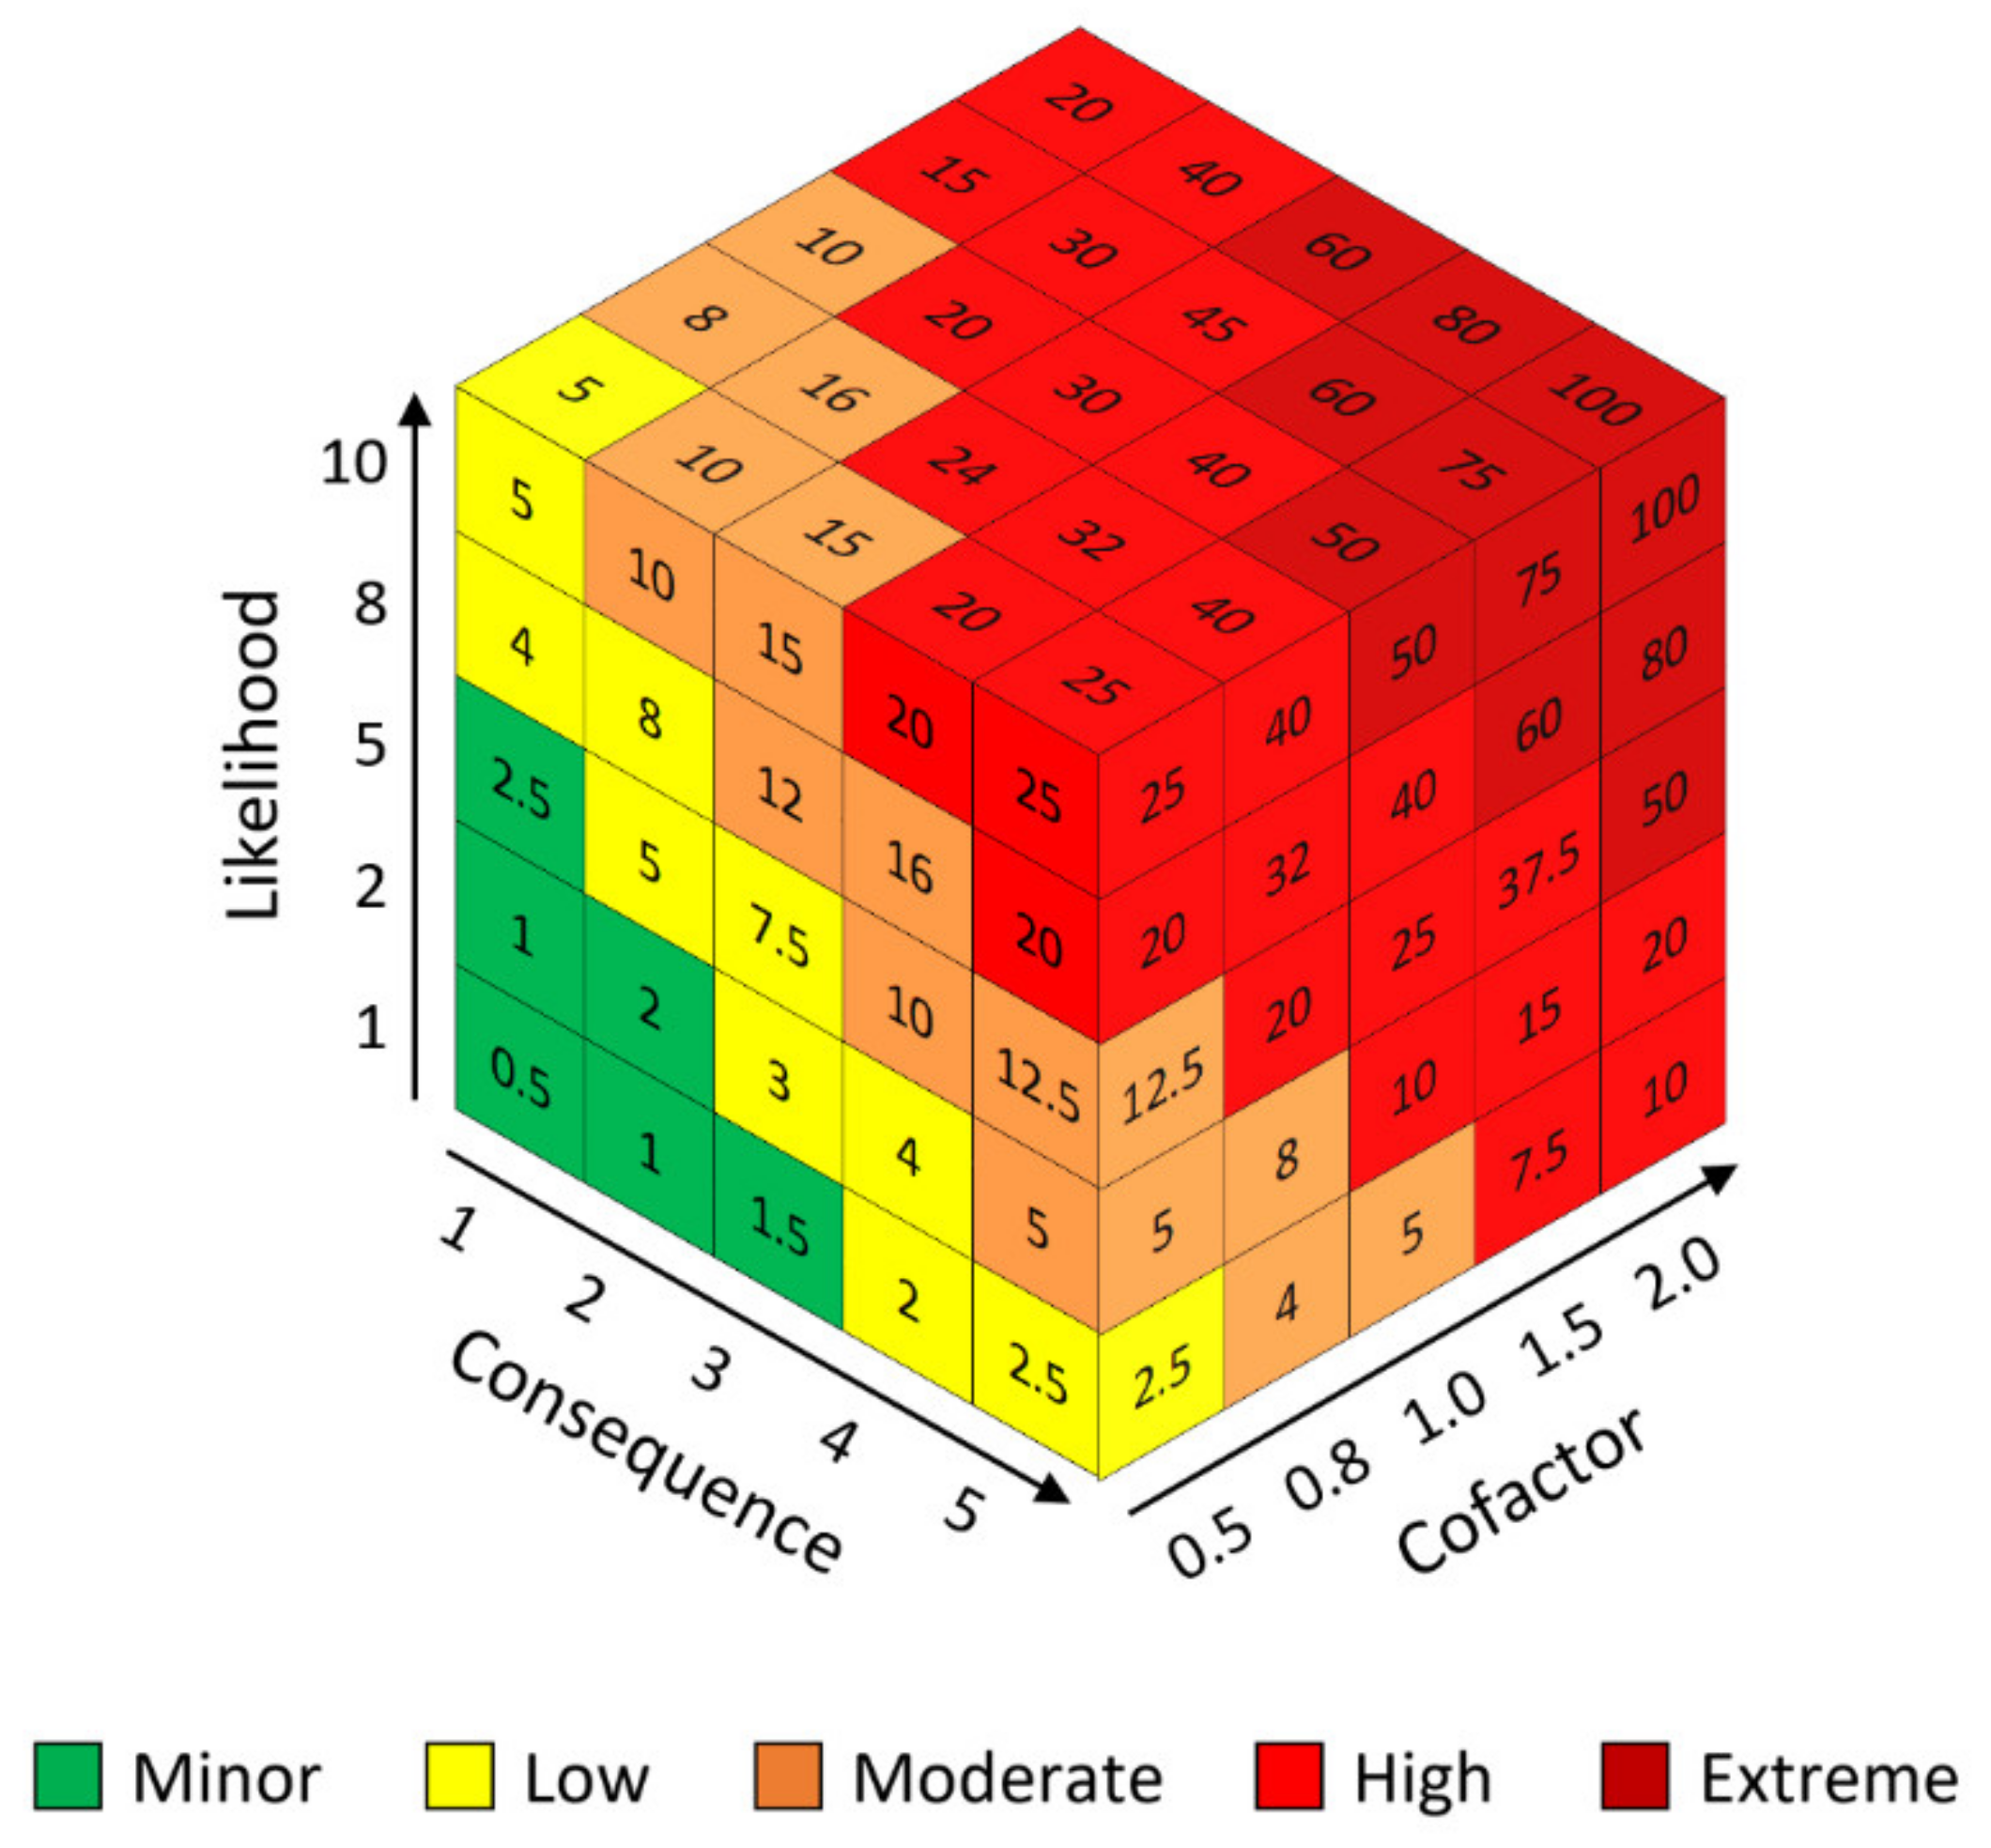
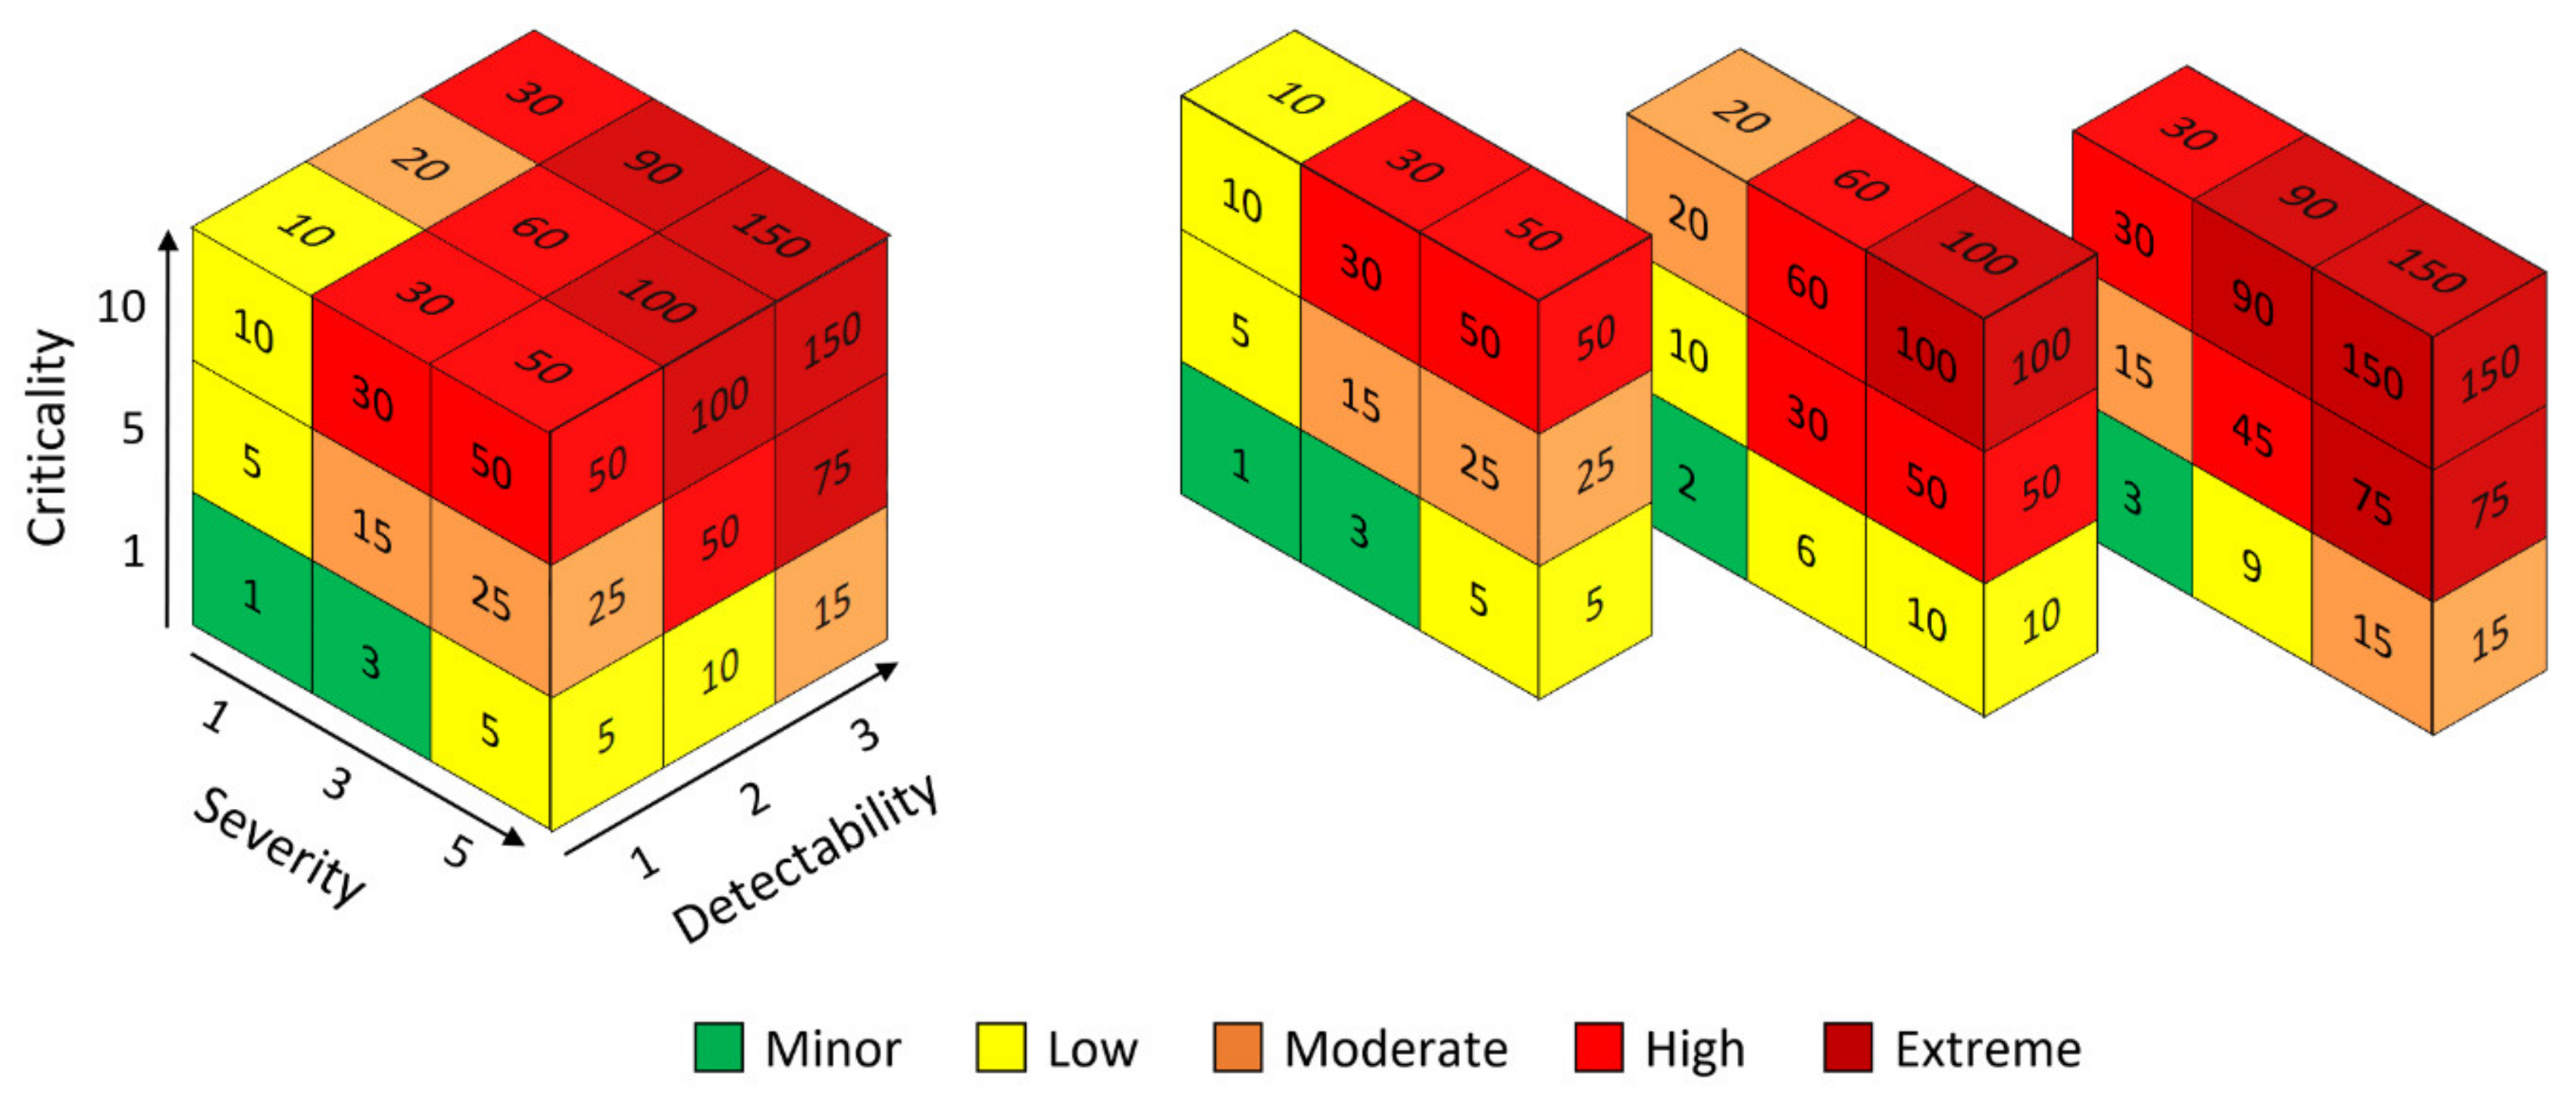
4.4. Inspection Risk Calculation
4.4.1. Determination of the Cofactor for Blade Visual Inspection
4.4.2. Case Study
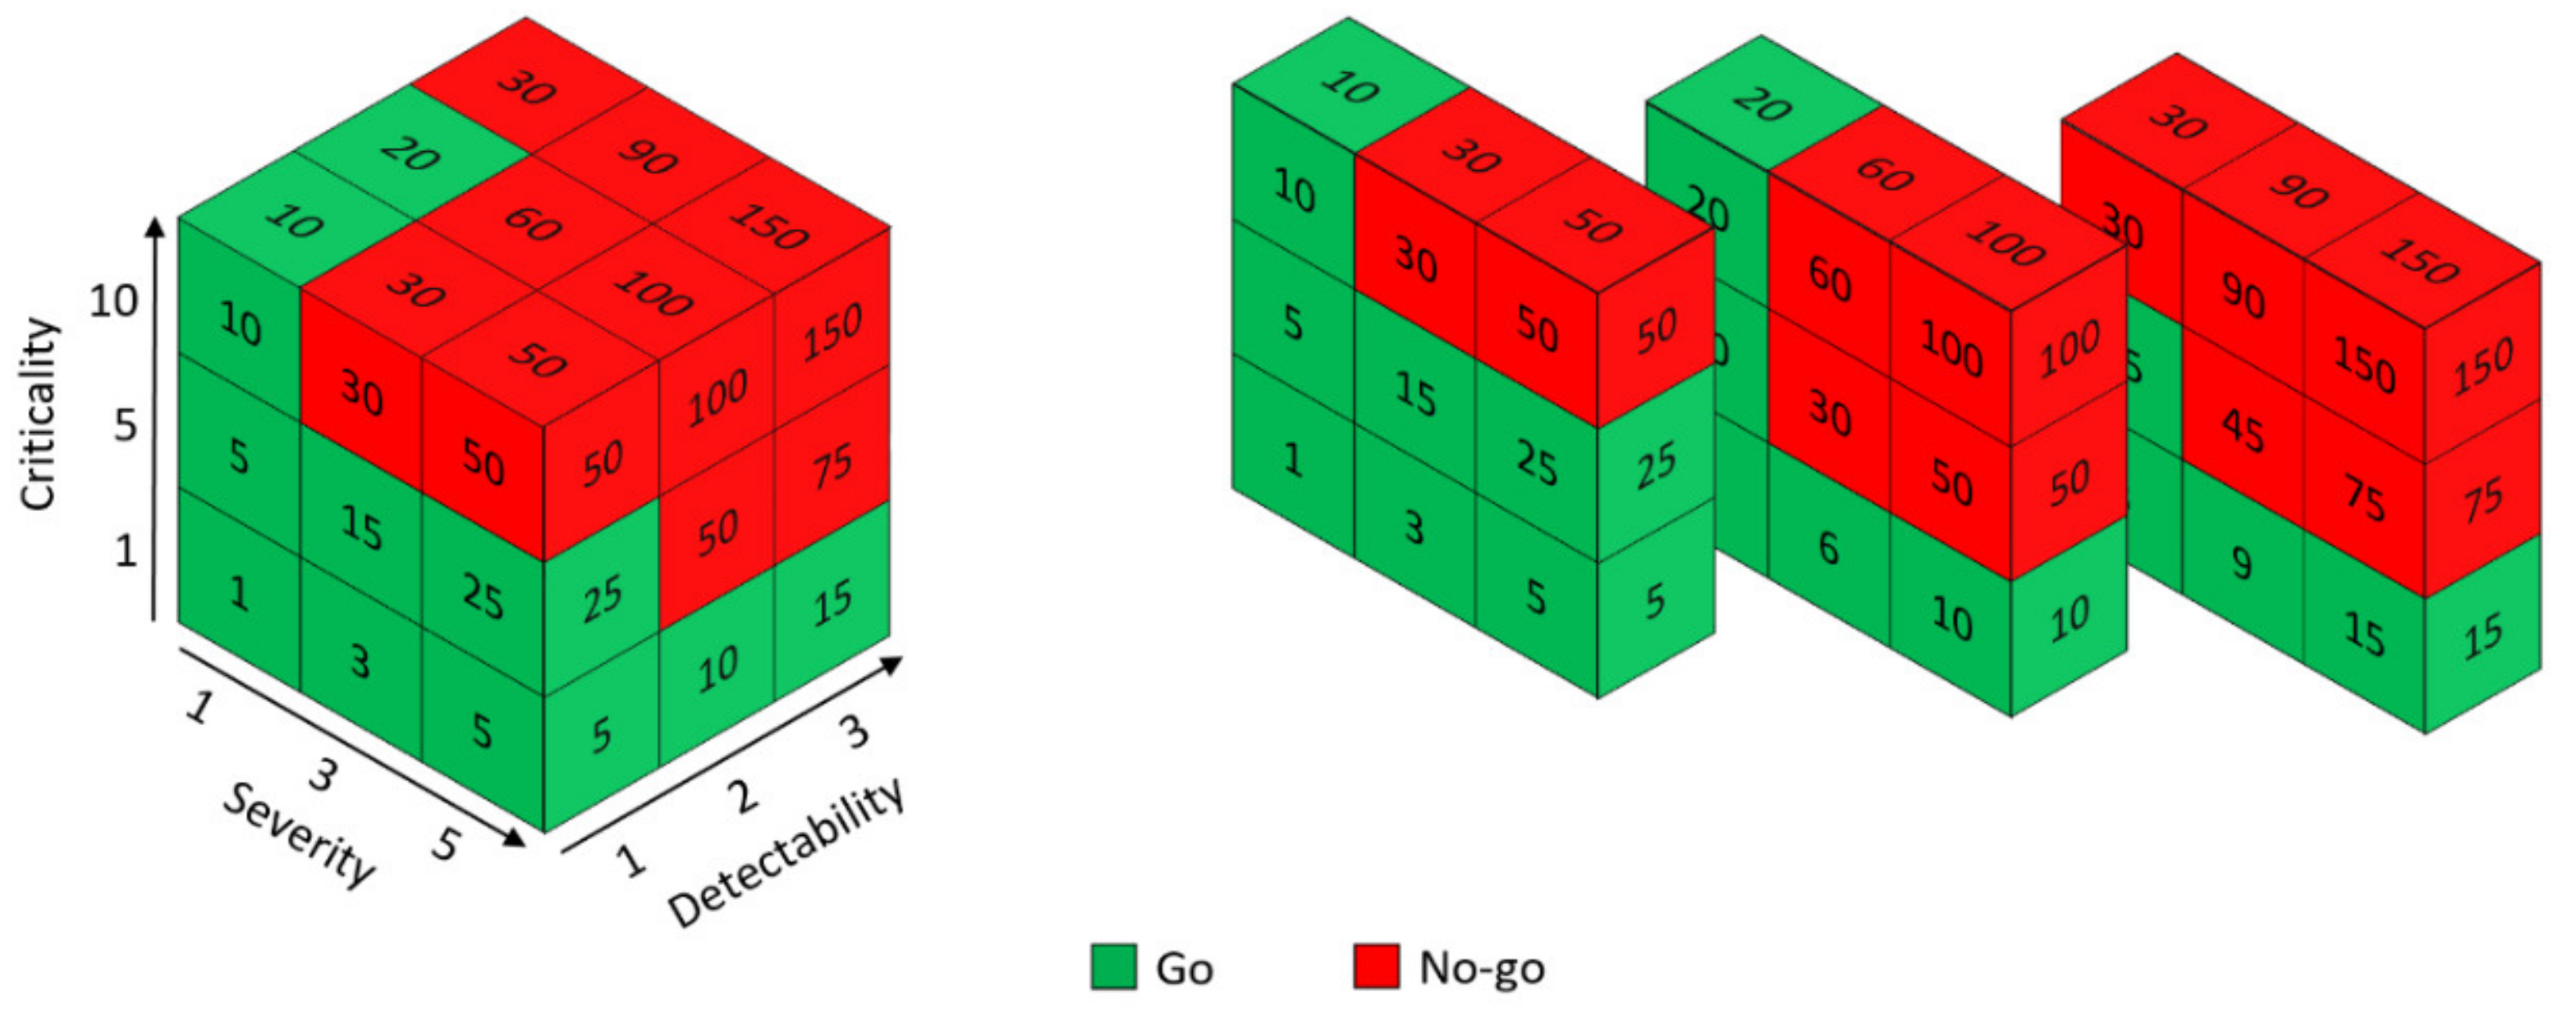
4.4.3. Go/No-Go Matrix
4.4.4. Optimal Viewing Perspectives
Dents
Tears
Nicks
5. Discussion
5.1. Summary of Outcomes
5.2. Implications for Practitioners
5.3. Limitations
5.4. Future Research Opportunities
6. Conclusions
Author Contributions
Funding
Institutional Review Board Statement
Informed Consent Statement
Data Availability Statement
Acknowledgments
Conflicts of Interest
References
- Marais, K.; Robichaud, M. Analysis of trends in aviation maintenance risk: An empirical approach. Reliab. Eng. Syst. Saf. 2012, 106, 104–118. [Google Scholar] [CrossRef]
- Rankin, W.L.; Shappell, S.; Wiegmann, D. Error and error reporting systems. In Human Factors Guide for Aviation Maintenance and Inspection; FAA Safety: Washington, DC, USA, 2003. Available online: https://www.faa.gov/about/initiatives/maintenance_hf/training_tools/media/hf_guide.pdf (accessed on 17 November 2018).
- Qin, Y.; Cao, J. Application of Wavelet Transform in Image Processing in Aviation Engine Damage. Appl. Mech. Mater. 2013, 347, 3576–3580. [Google Scholar] [CrossRef]
- Li, Y.; Zhang, C. Automated vision system for fabric defect inspection using Gabor filters and PCNN. SpringerPlus 2016, 5, 765. [Google Scholar] [CrossRef] [PubMed]
- Drury, C.G.; Gramopadhye, A.K. Training for visual inspection. In Proceedings of the 3rd FAA Meeting on Human Factors in Aircraft Maintenance and Inspection: Training Issues, Atlantic City, NJ, USA, 12–13 June 1990. [Google Scholar]
- Hobbs, A.; Williamson, A.; Van Dongen, H.P. A circadian rhythm in skill-based errors in aviation maintenance. Chronobiol. Int. 2010, 27, 1304–1316. [Google Scholar] [CrossRef] [PubMed]
- Gramopadhye, A.K.; Drury, C.G. Human factors in aviation maintenance: How we got to where we are. Int. J. Ind. Ergon. 2000, 26, 125–131. [Google Scholar] [CrossRef]
- Latorella, K.; Prabhu, P. A review of human error in aviation maintenance and inspection. Int. J. Ind. Ergon. 2000, 26, 133–161. [Google Scholar] [CrossRef]
- Civil Aviation Authority (CAA). CAP 715-An Introduction to Aircraft Maintenance Engineering Human Factors for JAR 66. 2002. Available online: https://publicapps.caa.co.uk/docs/33/CAP715.PDF (accessed on 23 October 2018).
- Hradecky, S. Incident: United B772 over Pacific on Feb 13th 2018, Fan Blade, Engine Cowl and Inlet Separated in Flight, Blade Debris Impacted Fuselage. Available online: http://avherald.com/h?article=4b4e8ca7&opt=0 (accessed on 26 February 2021).
- Habib, K.A.; Turkoglu, C. Analysis of Aircraft Maintenance Related Accidents and Serious Incidents in Nigeria. Aerospace 2020, 7, 178. [Google Scholar] [CrossRef]
- Federal Aviation Administration (FAA). Aircraft Accident Report: Left Engine Failure and Subsequent Depressurization; Southwest Airlines Flight 1380, Boeing 737-7H4, N772SW, Philadelphia, Pennsylvania, 17 April 2018; National Transportation Safety Board (NTSB): Washington, DC, USA, 2019.
- Mishra, R.; Thomas, J.; Srinivasan, K.; Nandi, V.; Raghavendra Bhatt, R. Failure analysis of an un-cooled turbine blade in an aero gas turbine engine. Eng. Fail. Anal. 2017, 79, 836–844. [Google Scholar] [CrossRef]
- Nickles, G.; Him, H.; Koenig, S.; Gramopadhye, A.; Melloy, B. A Descriptive Model of Aircraft Inspection Activities. 2019. Available online: https://www.faa.gov/about/initiatives/maintenance_hf/library/documents/media/human_factors_maintenance/a_descriptive_model_of_aircraft_inspection_activities.pdf (accessed on 28 September 2018).
- Błachnio, J.; Spychała, J.; Pawlak, W.; Kułaszka, A. Assessment of Technical Condition Demonstrated by Gas Turbine Blades by Processing of Images for Their Surfaces/Oceny Stanu Łopatek Turbiny Gazowej Metodą Przetwarzania Obrazów Ich Powierzchni. J. Konbin 2012, 21. [Google Scholar] [CrossRef]
- Melloy, B.J.; Harris, J.M.; Gramopadhye, A.K. Predicting the accuracy of visual search performancein the structural inspection of aircraft. Int. J. Ind. Ergon. 2000, 26, 277–283. [Google Scholar] [CrossRef]
- Cooper, T.; Smiley, J.; Porter, C.; Precourt, C. Fleet & MRO Forecast 2018-2028. Forecast of Aircraft Fleet Growth and Related Trends Affecting Aftermarket MRO Demand. 2018. Available online: https://www.oliverwyman.com/content/dam/oliver-wyman/v2/publications/2018/January/2018-2028_Global_Fleet_MRO_Market_Forecast_Commentary_Public_Final_web.pdf (accessed on 4 April 2021).
- Yuan, Z. Borescope inspection for HPT blade of CFM56-7B engine. IOP Conf. Ser. Mater. Sci. Eng. 2018, 382. [Google Scholar] [CrossRef]
- Aven, T. The risk concept—historical and recent development trends. Reliab. Eng. Syst. Saf. 2012, 99, 33–44. [Google Scholar] [CrossRef]
- International Organization for Standardization (ISO). Risk Management: Principles and Guidelines; ISO 31000: Montreal, QC, Canada, 2009. [Google Scholar]
- Pons, D.J. Alignment of the Safety Assessment Method with New Zealand Legislative Responsibilities. Safety 2019, 5, 59. [Google Scholar] [CrossRef]
- Waldron, K. Risk Analysis and Ordinal Risk Rating Scales-A Closer Look. J. Valid. Technol. 2016, 22, 14–21. Available online: https://www.ivtnetwork.com/article/risk-analysis-and-ordinal-risk-rating-scales%E2%80%94-closer-look (accessed on 7 November 2020).
- Juan, Y.; Liu, H.; Xiao, F. Supply chain hazards identification and a threedimensional risk matrix model for food safety. Rev. Iber. De Sist. E Tecnol. De Inf. (Risti) 2016, 2016, 420–432. [Google Scholar]
- Kolesár, J.; Petruf, M. Safety Management System Protection against Acts of Unlawfull Interference of Civil Airport. J. Logist. Manag. 2012, 1, 6–12. [Google Scholar] [CrossRef]
- Cioaca, C.; Constantinescu, C.G.; Boscoianu, M.; Ramona, L. Extreme risk assessment methodology (ERAM) in aviation systems. Environ. Eng. Manag. J. 2015, 14, 1399–1408. [Google Scholar] [CrossRef]
- United Nations Office for Disaster Risk Reduction (UNDRR). Global Assessment Report on Disaster Reduction; United Nations Office for Disaster Risk Reduction (UNDRR): Geneva, Switzerland, 2015. [Google Scholar]
- Hughes, R. Chapter 11-Intersecting Value Chains for a Stereoscopic Project Definition. In Agile Data Warehousing for the Enterprise; Hughes, R., Ed.; Morgan Kaufmann: Boston, MA, USA, 2016; pp. 215–244. [Google Scholar]
- Youssef, N.F.; Hyman, W.A. Risk analysis: Beyond probability and severity. Med. Device Diagn. Ind. 2010, 32. Available online: https://www.mddionline.com/testing/risk-analysis-beyond-probability-and-severity (accessed on 12 October 2020).
- Project Management Institute (PMI). A Guide to the Project Management Body of Knowledge (PMBOK® Guide), 6th ed.; Project Management Institute: Newtown Square, PA, USA, 2017. [Google Scholar]
- Griffis, S.; Whipple, J. A Comprehensive Risk Assessment and Evaluation Model: Proposing a Risk Priority Continuum. Transp. J. 2012, 51, 428–451. [Google Scholar] [CrossRef]
- Valitov, S.; Sirazetdinova, A. Project Risks’ Management Model on an Industrial Entreprise. Asian Soc. Sci. 2014, 10. [Google Scholar] [CrossRef]
- Lowe, D. Commercial Management: Theory and Practice, 1st ed.; John Wiley & Sons: Hoboken, NJ, USA, 2013. [Google Scholar]
- Aven, T.; Vinnem, J.E.; Wiencke, H.S. A decision framework for risk management, with application to the offshore oil and gas industry. Reliab. Eng. Syst. Saf. 2007, 92, 433–448. [Google Scholar] [CrossRef]
- Xia, N.; Zhong, R.; Wu, C.; Wang, X.; Wang, S. Assessment of Stakeholder-Related Risks in Construction Projects: Integrated Analyses of Risk Attributes and Stakeholder Influences. J. Constr. Eng. Manag. 2017, 143, 04017030. [Google Scholar] [CrossRef]
- Azadeh-Fard, N.; Schuh, A.; Rashedi, E.; Camelio, J.A. Risk assessment of occupational injuries using Accident Severity Grade. Saf. Sci. 2015, 76, 160–167. [Google Scholar] [CrossRef]
- Dobson, M.; Dobson, D. Project Risk and Cost Analysis; American Management Association (AMACOM): New York, NY, USA, 2011. [Google Scholar]
- El-Karim, M.; Elnawawy, O.; Abdelalim, A. Identification and assessment of risk factors affecting construction projects. HBRC J. 2015, 13, 202–216. [Google Scholar] [CrossRef]
- Osundahunsi, A. Effective project risk management using the concept of risk velocity, agility, and resiliency. In Proceedings of the PMI® Research and Education Conference, Limerick, Munster, Ireland, 16–18 July 2012. [Google Scholar]
- Talbot, J.; Jakeman, M. Security Risk Management Body of Knowledge, 2nd ed.; John Wiley & Sons: Hoboken, NJ, USA, 2009; Volume 69. [Google Scholar]
- Jin, J.; Zhao, S.; Hu, B. Defining the Safety Integrity Level of Public Safety Monitoring System Based on the Optimized Three-dimension Risk Matrix. Procedia Eng. 2012, 43, 119–124. [Google Scholar] [CrossRef]
- Chien, L.-K.; Wu, J.-P.; Tseng, W.C. The Study of Risk Assessment of Soil Liquefaction on Land Development and Utilization by GIS in Taiwan. In Geographic Information Systems; Rocha, J., Abrantes, P., Eds.; IntechOpen: London, UK, 2019. [Google Scholar]
- Gray, G.; Bron, D.; Davenport, E.; d’Arcy, J.; Guettler, N.; Manen, O.; Syburra, T.; Rienks, R.; Nicol, E. Assessing aeromedical risk: A three-dimensional risk matrix approach. Heart 2019, 105, 9–16. [Google Scholar] [CrossRef]
- Paltrinieri, N.; Comfort, L.; Reniers, G. Learning about risk: Machine learning for risk assessment. Saf. Sci. 2019, 118, 475–486. [Google Scholar] [CrossRef]
- Aven, T. Practical implications of the new risk perspectives. Reliab. Eng. Syst. Saf. 2013, 115, 136–145. [Google Scholar] [CrossRef]
- Aven, T.; Krohn, B.S. A new perspective on how to understand, assess and manage risk and the unforeseen. Reliab. Eng. Syst. Saf. 2014, 121, 1–10. [Google Scholar] [CrossRef]
- Zhang, Y.-L.; Zhang, H. Assessment research on tourism attractions accident risk based on three-dimensional risk matrix. Tour. Res. 2014, 6, 69–74. [Google Scholar] [CrossRef]
- Marin-Ferrer, M.; Vernaccini, L.; Poljansek, K. Index for Risk Management INFORM Concept and Methodology Report; European Commission: Luxembourg, 2017. [Google Scholar]
- Boudreau, T. Solving the risk equation: People-centred disaster risk assessment in Ethiopia; Humanitarian Practice Network (HPN): London, UK, 2009; Available online: https://www.files.ethz.ch/isn/103306/networkpaper066.pdf (accessed on 9 October 2020).
- Luquetti dos Santos, I.; França, J.; Santos, L.; Haddad, A. Allocation of performance shaping factors in the risk assessment of an offshore installation. J. Loss Prev. Process Ind. 2020, 64, 104085. [Google Scholar] [CrossRef]
- Higbee, G. Human Factors Contribute a Third Dimension to All Errors; Industrial Safety & Hygiene News (ISHN): Troy, MI, USA, 2017; pp. 82–83. [Google Scholar]
- Liu, H.-T.; Tsai, Y.-L. A fuzzy risk assessment approach for occupational hazards in the construction industry. Saf. Sci. 2012, 50, 1067–1078. [Google Scholar] [CrossRef]
- Fargnoli, M.; Lombardi, M.; Haber, N.; Guadagno, F. Hazard function deployment: A QFD-based tool for the assessment of working tasks–a practical study in the construction industry. Int. J. Occup. Saf. Ergon. 2020, 26, 348–369. [Google Scholar] [CrossRef] [PubMed]
- Fargnoli, M.; Lombardi, M.; Haber, N.; Puri, D. The Impact of Human Error in the Use of Agricultural Tractors: A Case Study Research in Vineyard Cultivation in Italy. Agriculture 2018, 8, 82. [Google Scholar] [CrossRef]
- Bas, E. An integrated quality function deployment and capital budgeting methodology for occupational safety and health as a systems thinking approach: The case of the construction industry. Accid. Anal. Prev. 2014, 68, 42–56. [Google Scholar] [CrossRef] [PubMed]
- The University of Mebourne. Risk Assessment 3D Model. Environment Health and Safety Manual Procedure 3.2 Hazard Identification, Assessment and Control-Application 2004. Available online: https://www.cab.unimelb.edu.au/pdf/ra11.pdf (accessed on 9 October 2020).
- Arjmandi, S.; Tabesh, M.; Esfahani, S. Risk Analysis of Water Reuse for Industrial Cooling Water Consumptions. J. Environ. Eng. 2019, 145. [Google Scholar] [CrossRef]
- Spreafico, C.; Russo, D.; Rizzi, C. A state-of-the-art review of FMEA/FMECA including patents. Comput. Sci. Rev. 2017, 25, 19–28. [Google Scholar] [CrossRef]
- Stamatis, D.H. Failure Mode and Effect Analysis: FMEA from Theory to Execution, 2nd ed.; American Society for Quality Press: Milwaukee, WI, USA, 2003. [Google Scholar]
- Bell, D.; Wilson, G.; Mcbride, P.; Cairns, N. Managing Quality, 1st ed.; Routledge: London, UK, 2012. [Google Scholar]
- Chang, K.-H.; Wen, T.-C. A novel efficient approach for DFMEA combining 2-tuple and the OWA operator. Expert Syst. Appl. 2010, 37, 2362–2370. [Google Scholar] [CrossRef]
- Oldenhof, M.T.; van Leeuwen, J.F.; Nauta, M.J.; de Kaste, D.; Odekerken-Rombouts, Y.M.C.F.; Vredenbregt, M.J.; Weda, M.; Barends, D.M. Consistency of FMEA used in the validation of analytical procedures. J. Pharm. Biomed. Anal. 2011, 54, 592–595. [Google Scholar] [CrossRef]
- Spies, M.; Rieder, H. Synthetic aperture focusing of ultrasonic inspection data to enhance the probability of detection of defects in strongly attenuating materials. NDT E Int. 2010, 43, 425–431. [Google Scholar] [CrossRef]
- Zhongda, Y. Borescope Inspection Management for Engine. IOP Conf. Ser. Earth Environ. Sci. 2018, 128, 012013. [Google Scholar] [CrossRef]
- Sun, J.; Chen, D.; Li, C.; Yan, H. Integration of scheduled structural health monitoring with airline maintenance program based on risk analysis. Proc. Inst. Mech. Eng. Part O J. Risk Reliab. 2018, 232, 92–104. [Google Scholar] [CrossRef]
- Tian, Y.; Maitra, R.; Meeker, W.Q.; Holland, S.D. A Statistical Framework for Improved Automatic Flaw Detection in Nondestructive Evaluation Images. Technometrics 2017, 59, 247–261. [Google Scholar] [CrossRef]
- International Civil Aviation Organization (ICAO). Safety Management Manual; International Civil Aviation Organization (ICAO): Montreal, QC, Canada, 2018; pp. 2-16–12-17. [Google Scholar]
- Vatanpour, S.; Hrudey, S.; Dinu, I. Can Public Health Risk Assessment Using Risk Matrices Be Misleading? Int. J. Environ. Res. Public Health 2015, 12, 9575–9588. [Google Scholar] [CrossRef] [PubMed]
- Elmabrouk, S. Aviation Risk Management Strategies, Case Study. In Proceedings of the 2015 International Conference on Industrial Engineering and Operations Management, Dubai, United Arab Emirates, 3–5 March 2015. [Google Scholar]
- Standards New Zealand. HB 436:2004 Risk Management Guidelines-Companion to AS/NZS 4360:2004; Standards Australia: Sydney, Australia; Standards New Zealand: Wellington, New Zealand, 2004. [Google Scholar]
- Harrer, K.; Yniguez, D.; Majar, M.; Ellenbecker, D.; Estrada, N.; Geiger, M. Whole Body Vibration Exposure for MH-60S Pilots. 2005. Available online: https://www.researchgate.net/publication/228976687_Whole_Body_Vibration_Exposure_for_MH-60S_Pilots (accessed on 11 August 2020).
- Lukasiewicz, A.; Finlayson, M.; Pittock, J. Synthesis and Integrative Research Final Report Identifying Low Risk Climate Change Adaptation in Catchment Management While Avoiding Unintended Consequences. 2013. Available online: https://www.researchgate.net/publication/248390555_Synthesis_and_Integrative_Research_Final_report_Identifying_low_risk_climate_change_adaptation_in_catchment_management_while_avoiding_unintended_consequences (accessed on 12 October 2020).
- LaConte, G. How to Calculate the Impact and Probability of Business Risk. Available online: https://laconteconsulting.com/2018/12/02/calculate-impact-and-probability/ (accessed on 17 November 2020).
- Vose, D. Risk Analysis: A Quantitative Guide, 3rd ed.; John Wiley & Sons: Hoboken, NJ, USA, 2008. [Google Scholar]
- McGuinness, L.A.; Higgins, J.P. Risk-of-bias Visualization (robvis): An R package and Shiny web app for visualizing risk-of-bias assessments. Res. Synth. Methods 2020, 12. [Google Scholar] [CrossRef] [PubMed]
- Higgins, J.; Altman, D.; Sterne, J. Assessing risk of bias in included studies. In Handbook for Systematic Reviews of Interventions, 5th ed.; Higgins, J., Green, S., Eds.; The Cochrane Collaboration: London, UK, 2011. [Google Scholar]
- Hobbs, A.; Avers, K.; Hiles, J. Fatigue Risk Management in Aviation Maintenance: Current Best Practices and Potential Future Countermeasures; Federal Aviation Administration: Washington, DC, USA, 2011; 42p. Available online: https://www.researchgate.net/publication/235031612_Fatigue_Risk_Management_in_Aviation_Maintenance_Current_Best_Practices_and_Potential_Future_Countermeasures (accessed on 4 April 2021).
- Bussier, M.J.P.; Chong, H.-Y. Relationship between safety measures and human error in the construction industry: Working at heights. Int. J. Occup. Saf. Ergon. 2020, 1–12. [Google Scholar] [CrossRef] [PubMed]
- Fargnoli, M.; Lombardi, M. Preliminary Human Safety Assessment (PHSA) for the Improvement of the Behavioral Aspects of Safety Climate in the Construction Industry. Buildings 2019, 9, 69. [Google Scholar] [CrossRef]
- Irwin, A.; Caruso, L.; Tone, I. Thinking Ahead of the Tractor: Driver Safety and Situation Awareness. J. Agromedicine 2019, 24, 288–297. [Google Scholar] [CrossRef] [PubMed]
- Rhodes, W.; Lounsbury, R.; Steele, K.; Ladha, N. Fatigue Risk Assessment of Aircraft Maintenance Tasks 2003. Available online: https://www.bainessimmons.com/wp-content/uploads/Fatigue-Risk-Assessment-of-Aircraft-Maintenance-Tasks-Transport-Canada.pdf (accessed on 4 April 2021).
- Aust, J.; Pons, D. Bowtie Methodology for Risk Analysis of Visual Borescope Inspection during Aircraft Engine Maintenance. Aerospace 2019, 6, 110. [Google Scholar] [CrossRef]
- Lee, W.-K. Risk assessment modeling in aviation safety management. J. Air Transp. Manag. 2006, 12, 267–273. [Google Scholar] [CrossRef]
- Chakib, M. Safety Management System. Uniting Aviation. 2018. Available online: https://www.icao.int/MID/Documents/2018/Aerodrome%20SMS%20Workshop/M2-1-SMS_Aerodrome_Risk%20Assessment.pdf (accessed on 4 April 2021).
- Mostafa, A. Safety and Risk Assessment of Civil Aircraft during Operation. In Safety and Risk Assessment of Civil Aircraft during Operation, 1st ed.; Li, L., Ed.; IntechOpen: London, UK, 2020. [Google Scholar]
- European Aviation Safety Agency (EASA). EHEST Pre-departure Risk Assessment Checklist. Available online: https://www.easa.europa.eu/document-library/general-publications/ehest-pre-departure-risk-assessment-checklist (accessed on 4 April 2021).
- Federal Aviation Administration (FAA). Risk Management Handbook (FAA-H-8083-2). 2016. Available online: https://www.faa.gov/regulations_policies/handbooks_manuals/aviation/media/FAA-H-8083-2.pdf (accessed on 4 April 2021).
- Civil Aviation Safety Authority (CASA). SMS for aviation: A practical guide. Saf. Manag. Syst. Basics; Civil Aviation Safety Authority (CASA): Woden, Australia, 2012. Available online: www.casa.gov.au/sites/default/files/_assets/main/sms/download/2012-sms-book3-safety-risk-management.pdf (accessed on 4 April 2021).
- Aust, J.; Pons, D. Taxonomy of Gas Turbine Blade Defects. Aerospace 2019, 6, 58. [Google Scholar] [CrossRef]
- Aust, J.; Pons, D. A Systematic Methodology for Developing Bowtie in Risk Assessment: Application to Borescope Inspection. Aerospace 2020, 7, 86. [Google Scholar] [CrossRef]
- Lee, J.; Bong, W.; Lee, S.; Han, C.; Ko, K. Development of the Vision System and Inspection Algorithms for Surface Defect on the Injection Molding Case. In Advances in Computer Science and Ubiquitous Computing, 1st ed.; Park, J.J., Pan, Y., Yi, G., Loia, V., Eds.; Springer: Singapore, 2017; pp. 963–970. [Google Scholar]
- Li, C.; Zhang, Z.; Nakamura, I.; Imamura, T.; Miyake, T.; Fujiwara, H. Developing a new automatic vision defect inspection system for curved surfaces with highly specular reflection. Int. J. Innov. Comput. Inf. Control 2012, 8, 5121–5136. [Google Scholar] [CrossRef]
- Zhang, Z.; Li, C. Defect Inspection for Curved Surface with Highly Specular Reflection. Adv. Comput. Vis. Pattern Recognit. 2015, 48, 251–317. [Google Scholar] [CrossRef]
- Aust, J.; Shankland, S.; Pons, D.; Mukundan, R.; Mitrovic, A. Automated Defect Detection and Decision-Support in Gas Turbine Blade Inspection. Aerospace 2021, 8, 30. [Google Scholar] [CrossRef]
- Amirshenava, S.; Osanloo, M. Mine closure risk management: An integration of 3D risk model and MCDM techniques. J. Clean. Prod. 2018, 184, 389–401. [Google Scholar] [CrossRef]
- Keeney, R.L.; von Winterfeldt, D. Improving Risk Communication. Risk Anal. 1986, 6, 417–424. [Google Scholar] [CrossRef] [PubMed]
- Palenchar, M.J. Historical Trends of Risk and Crisis Communication. In Handbook of Risk and Crisis Communication, 1st ed.; Heath, R.L., O’Hair, H., Eds.; Routledge: Abingdon, Oxfordshire, UK, 2008. [Google Scholar]
- Hameed, A.; Khan, F.; Ahmed, S. A risk-based shutdown inspection and maintenance interval estimation considering human error. Process Saf. Environ. Prot. 2016, 100, 9–21. [Google Scholar] [CrossRef]


| Author(s) | Consequence Metric | Likelihood Metric | Other Metrics | Application |
|---|---|---|---|---|
| Chien et al. [41] | Hazard | Vulnerability | Resilience | Soil liquefaction on land development and utilisation |
| UNDRR [26] | Hazard | Vulnerability | Exposure | Natural disasters |
| Marin-Ferrer et al. [47], Boudreau [48] | Hazard and Exposure | Vulnerability | Lack of coping capacity | Disaster risk assessment |
| Cioaca et al. [25] | Consequence | Threat probability | Vulnerability probability | Aviation systems |
| Azadeh et al. [35] | Severity | Frequency | Preventability | Occupational injuries |
| Higbee [50] | Severity | Likelihood | Human factors | Welding and assembly operations |
| Gray et al. [42] | Severity | Likelihood | Occupational role | Aero medical risk |
| Jin et al. [40] | Occurrence consequence | Occurrence likelihood | Independent protection layers | Public safety monitoring system |
| The University of Mebourne [55] | Consequence | Likelihood | Exposure | Knife cuts and cold burns in university laboratories |
| Juan et al. [23] | Severity | Possibility | Vulnerability | Food quality and safety and supply chain |
| Talbot and Jakeman [39] | Consequence | Likelihood | Time × Incidence | Dying in a car crash |
| Project Management Institute [29] | Impact | Probability | Time × Frequency | Project risk (generally applicable) |
| Talbot and Jakeman [39] | Consequence | Likelihood | Volatility × Confidence in risk rating | Security risk management |
| Project Management Institute [29], Valitov and Sirazetdinova [31], Lowe [32], Aven et al. [33] | Impact | Probability | Manageability/ Controllability | Enterprise and commercial risks |
| Xia et al. [34] | Impact | Probability | Stakeholder attributes × Manageability | Stakeholder-related risks in construction projects |
| Dobson and Dobson [36] | Impact | Probability | Time × Remediation | Project risk (generally applicable) |
| Osundahunsi [38] | Impact | Occurrence | Velocity (speed) | Enterprise and project risk management |
| El-Karim et al. [37] | Impact (cost) | Probability | Impact (schedule) | Construction projects |
| Kolesar and Petruf [24] | Consequence severity | Threat (perceived likelihood) | Vulnerability (probability of breach of failure) | Acts of Unlawful Interference of Civil Airport |
| Paltrinieri et al. [43], Aven [44] Aven and Krohn [45] | Consequence | Probability | Knowledge | Oil and Gas drilling rig, High Reliability Organisations (HROs) |
| Griffis and Whipple [30] | Potential Impact | Likelihood of Occurrence | Probability of detection | Supply chain risk assessment |
| Hughes [27] | Impact | Probability | Undetectability | Risk of developer stories |
| Youssef and Hyman [28], Project Management Institute [29] | Severity | Probability | Hazard detectability × Hazard correctability × Product utility | Medical devices |
| Zhang and Zhang [46] | Loss | Accident rates | Social impact of accidents | Tourism attractions accident risk |
| Arjmandi et al. [56] | Consequence | Probability | Weight of application-specific parameters (here: chemical composition of wastewater) | Wastewater treatment |
| Luquetti dos Santos et al. [49] | Consequence | Frequency | Performance-shaping factors | Offshore installation |
| Cascading correlation matrices, e.g., quality function deployment (QFD). Liu and Tsai [51], Fargnoli et al. [52,53], Bas [54] | Consequence | Probability | Various combinations of work activities, tasks, hazard causes, hazard types | Occupational safety |
| Defect Type | Sample Image | Defect Type | Sample Image |
|---|---|---|---|
| Battered |  | Bent |  |
| Breaking |  | Corrosion |  |
| Crack |  | Dent on Airfoil |  |
| Dent on Leading edge |  | Nick |  |
| Scratch |  | Tear |  |
| Tip Curl |  | Tip Rub |  |
| Consequence | Score | Likelihood | Score | Contextual Factor | Score |
|---|---|---|---|---|---|
| Hazard in control: Defect present but existing barriers prevent progression | 1 | Rare: Theoretically possible but not expected to occur | 1 | Minor: Defect always detected | 0.5 |
| Incident without harm: Incident occurs with no harm (system failure) | 2 | Unlikely: Did happen in other industries | 2 | Low: Defect detectable and rarely missed | 0.8 |
| Minor harm: Incident occurs and minor harm arises | 5 | Possible: Event does occur in the industry from time to time | 3 | Moderate: Certified inspector should be able to detect this defect | 1 |
| Serious harm: Incident results in serious harm | 8 | Likely: Has occurred at least once in the company’s history | 4 | High: Defect difficult to detect during visual inspection | 1.5 |
| Fatality: Fatalities and possibly catastrophe; recovery systems inadequate | 10 | Almost certain: Annual occurrence in this situation | 5 | Extreme: Defect visually not detectable | 2 |
| Risk Score (RS) | Risk Level (RL) | Colour Scheme |
|---|---|---|
| RS < 3 | Minor | Green |
| 3 ≤ RS < 8 | Low | Yellow |
| 8 ≤ RS < 20 | Moderate | Orange |
| 20 ≤ RS < 50 | High | Red |
| RS ≥ 50 | Extreme | Burgundy |
| Criticality Score | Criticality Descriptor | Description |
|---|---|---|
| 1 | Low criticality | Serviceable as long as the defect does not propagate to a more severe defect, e.g., a scratch might be acceptable, but once propagated into a crack it must be removed. Unlikely to propagate. |
| 2 | Moderate criticality | Serviceability depending on defect location and severity. Often can be repaired. |
| 3 | High criticality | Parts need always be removed from service if this defect is found. Typically not repairable. |
| # | Defect Type | Criticality Rating |
|---|---|---|
| 1 | Breaking | 3 |
| 2 | Battered | 3 |
| 3 | Tear | 3 |
| 4 | Crack | 3 |
| 5 | Bent | 2 |
| 6 | Nick | 2 |
| 7 | Dent on edges | 2 |
| 8 | Tip Curl | 2 |
| 9 | Dent on airfoil | 1 |
| 10 | Scratch | 1 |
| 11 | Corrosion | 1 |
| 12 | Tip Rub | 1 |
| Severity Score | Severity Descriptor | Description |
|---|---|---|
| 1 | Low severity | Retained defect will not cause an engine failure before the next shop visit (6–12,000 cycles). |
| 2 | Moderate severity | Defect has the potential to increase and propagate towards a more severe damage and has the potential to cause engine failure during test or operation. The latter can lead to loss of engines, aircraft, and even lives. |
| 3 | High severity | Obvious defects that can cause damage to the engine and test cell, or subsequently in service cause severe damage and harm to aircraft, engine or passengers. |
| Defect Type | Severity Level 1 | Severity Level 2 | Severity Level 3 |
|---|---|---|---|
| Battered | Refer to Level 3 Bent |  |  |
| Bent |  |  |  |
| Breaking | Refer to level 3 Nick |  |  |
| Corrosion |  |  | Typically, deposits on the blade corrode and not the blade material, which is why it is superficial and no level 3 exists |
| Crack | Not detectable by purely visual means |  |  |
| Dent |  |  |  |
| Nick |  |  |  |
| Scratch |  |  |  |
| Tear |  |  |  |
| Tip Curl |  |  |  |
| Tip Rub |  |  |  |
| Detectability Score | Detectability Descriptor | Description | Confidence of Detection | Level of Inspection |
|---|---|---|---|---|
| 1 | High detectability | Defect detectable and classifiable with full dimension visible | >80% | Detailed visual inspection (DET), i.e., on-bench piece-part inspection |
| 2 | Moderate detectability | Defect type just detectable | ≈50% | General visual inspection (GVI), i.e., module inspection |
| 3 | Low detectability | Some visual anomaly detectable but not sure whether it is a defect | <25% | General borescope inspection (GBI) |
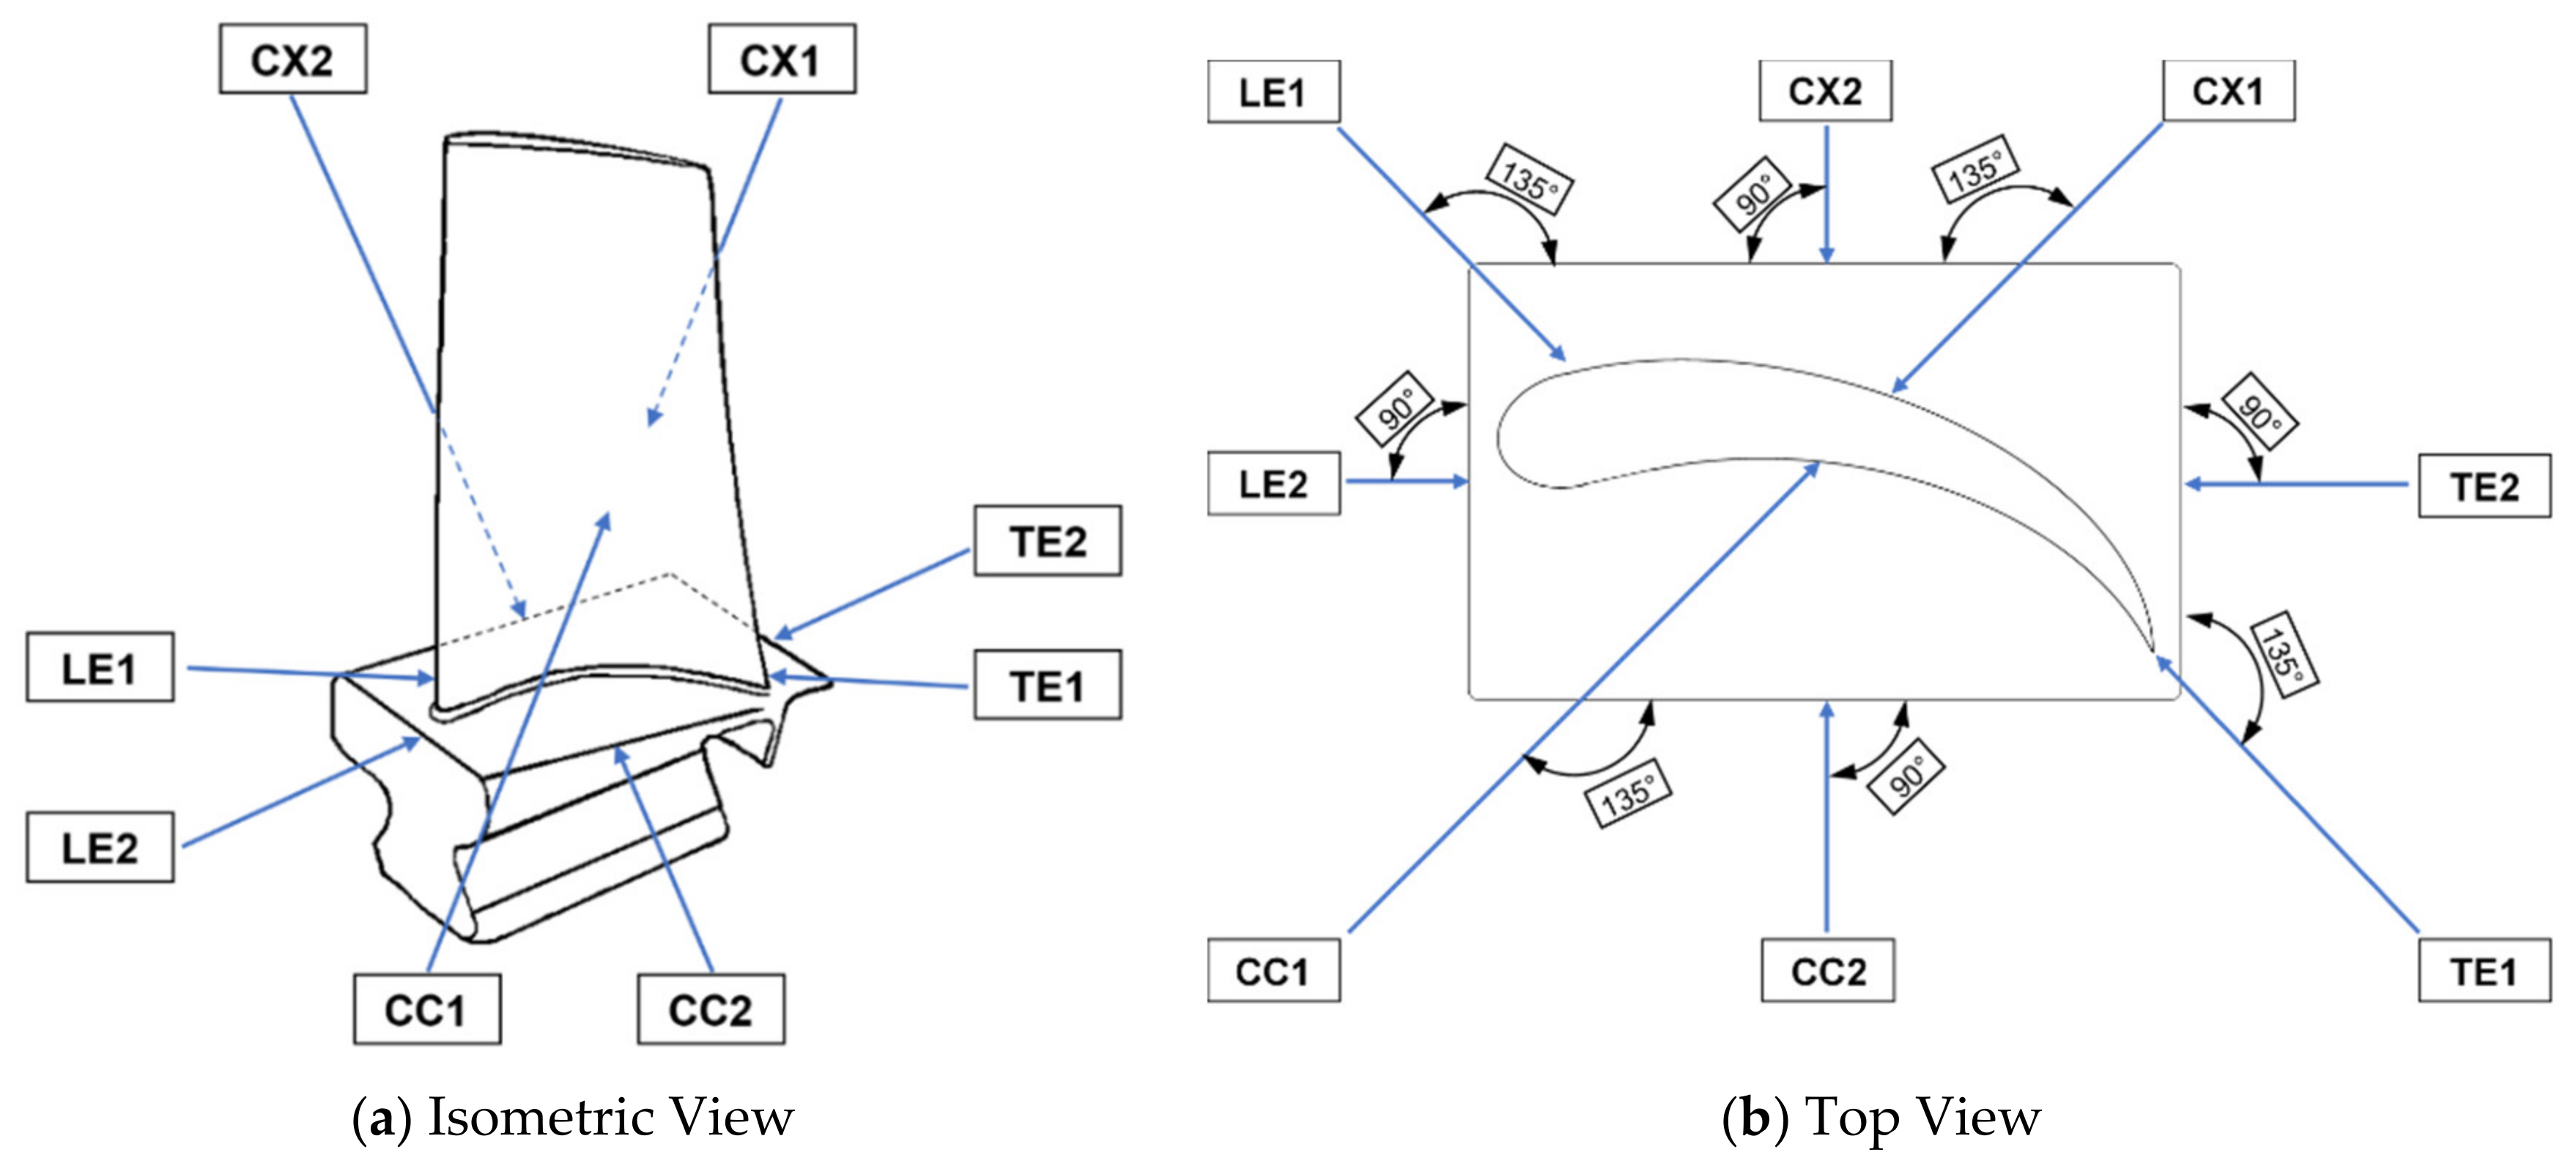
| Defect Type | CC1 | CC2 | LE1 | LE2 | CX1 | CX2 | TE1 | TE2 |
|---|---|---|---|---|---|---|---|---|
| Battered | 2 | 1 | 1 | 1 | 3 | 1 | 1 | 1 |
| Bent | 2 | 1 | 3 | 1 | 3 | 1 | 1 | 1 |
| Breaking | 1 | 1 | 2 | 1 | 1 | 2 | 3 | 1 |
| Corrosion | 1 | 1 | 3 | 1 | 1 | 1 | 3 | 1 |
| Crack | 1 | 1 | 3 | 1 | 1 | 1 | 2 | 2 |
| Dent on Airfoil | 1 | 1 | 2 | 3 | 3 | 3 | 1 | 1 |
| Dent on LE | 2 | 1 | 1 | 1 | 3 | 3 | 3 | 1 |
| Nick | 1 | 1 | 1 | 2 | 1 | 1 | 3 | 2 |
| Scratch | 1 | 1 | 3 | 1 | 1 | 1 | 3 | 1 |
| Tear | 1 | 1 | 2 | 1 | 1 | 1 | 2 | 1 |
| Tip Curl | 2 | 1 | 1 | 1 | 2 | 1 | 2 | 2 |
| Tip Rub | 1 | 2 | 3 | 1 | 1 | 1 | 3 | 1 |
| CF-Score | Influence Level | Colour Coding | Action by borescope inspector | Cofactor Score |
|---|---|---|---|---|
| 1–4 | Minor | Green | No action required | 0.5 |
| 5–14 | Low | Yellow | Flag for next service | 0.8 |
| 15–29 | Moderate | Orange | Monitor – recheck after × h | 1.0 |
| 30–74 | High | Red | Remove as soon as possible | 1.5 |
| 75–150 | Extreme | Burgundy | Immediate removal of engine from service | 2.0 |
| Risk Score | Decision Output | Colour |
|---|---|---|
| 1–29 | Go | Green |
| 30–150 | No-go | Red |
| Defect Type | CR | CC1 | CC2 | LE1 | LE2 | CX1 | CX2 | TE1 | TE2 | ||||||||
|---|---|---|---|---|---|---|---|---|---|---|---|---|---|---|---|---|---|
| DR | WS | DR | WS | DR | WS | DR | WS | DR | WS | DR | WS | DR | WS | DR | WS | ||
| Battered | 3 | 3 | 9 | 4 | 12 | 4 | 12 | 4 | 12 | 2 | 6 | 4 | 12 | 5 | 15 | 4 | 12 |
| Bent | 2 | 3 | 6 | 4 | 8 | 1 | 2 | 4 | 8 | 2 | 4 | 4 | 8 | 5 | 10 | 4 | 8 |
| Breaking | 3 | 5 | 15 | 4 | 12 | 3 | 9 | 5 | 15 | 5 | 15 | 3 | 9 | 2 | 6 | 4 | 12 |
| Corrosion | 1 | 5 | 5 | 5 | 5 | 2 | 2 | 4 | 4 | 5 | 5 | 5 | 5 | 2 | 2 | 5 | 5 |
| Crack | 3 | 4 | 12 | 4 | 12 | 2 | 6 | 4 | 12 | 5 | 15 | 4 | 12 | 3 | 9 | 3 | 9 |
| Dent on Airfoil | 1 | 4 | 4 | 5 | 5 | 3 | 3 | 1 | 1 | 1 | 1 | 1 | 1 | 4 | 4 | 4 | 4 |
| Dent on LE | 2 | 3 | 6 | 5 | 10 | 5 | 10 | 4 | 8 | 2 | 4 | 2 | 4 | 1 | 2 | 4 | 8 |
| Nick | 2 | 5 | 10 | 4 | 8 | 4 | 8 | 3 | 6 | 5 | 10 | 4 | 8 | 2 | 4 | 3 | 6 |
| Scratch | 1 | 5 | 5 | 4 | 4 | 1 | 1 | 4 | 4 | 5 | 5 | 4 | 4 | 1 | 1 | 4 | 4 |
| Tear | 3 | 4 | 12 | 4 | 12 | 3 | 9 | 5 | 15 | 4 | 12 | 5 | 15 | 3 | 9 | 5 | 15 |
| Tip Curl | 2 | 3 | 6 | 4 | 8 | 5 | 10 | 4 | 8 | 3 | 6 | 4 | 8 | 3 | 6 | 3 | 6 |
| Tip Rub | 1 | 2 | 2 | 5 | 5 | 2 | 2 | 5 | 5 | 4 | 4 | 5 | 5 | 2 | 2 | 5 | 5 |
| Overall Score | 92 | 101 | 74 | 98 | 87 | 91 | 70 | 94 | |||||||||
Publisher’s Note: MDPI stays neutral with regard to jurisdictional claims in published maps and institutional affiliations. |
© 2021 by the authors. Licensee MDPI, Basel, Switzerland. This article is an open access article distributed under the terms and conditions of the Creative Commons Attribution (CC BY) license (https://creativecommons.org/licenses/by/4.0/).
Share and Cite
Aust, J.; Pons, D. Methodology for Evaluating Risk of Visual Inspection Tasks of Aircraft Engine Blades. Aerospace 2021, 8, 117. https://doi.org/10.3390/aerospace8040117
Aust J, Pons D. Methodology for Evaluating Risk of Visual Inspection Tasks of Aircraft Engine Blades. Aerospace. 2021; 8(4):117. https://doi.org/10.3390/aerospace8040117
Chicago/Turabian StyleAust, Jonas, and Dirk Pons. 2021. "Methodology for Evaluating Risk of Visual Inspection Tasks of Aircraft Engine Blades" Aerospace 8, no. 4: 117. https://doi.org/10.3390/aerospace8040117
APA StyleAust, J., & Pons, D. (2021). Methodology for Evaluating Risk of Visual Inspection Tasks of Aircraft Engine Blades. Aerospace, 8(4), 117. https://doi.org/10.3390/aerospace8040117