Article

Transient Dynamic System Behavior of Pressure Actuated Cellular Structures in a Morphing Wing

1
Institute of Mechanics and Adaptronics, Technische Universität Braunschweig, Langer Kamp 6, 38106 Braunschweig, Germany
2
Institute of Jet Propulsion and Turbomachinery, Technische Universität Braunschweig, Hermann-Blenk-Straße 37, 38108 Braunschweig, Germany
3
Institute of Composite Structures and Adaptive Systems, German Aerospace Center, Lilienthalplatz 7, 38108 Braunschweig, Germany
*
Author to whom correspondence should be addressed.
Aerospace 2021, 8(3), 89; https://doi.org/10.3390/aerospace8030089
Submission received: 16 February 2021 / Revised: 15 March 2021 / Accepted: 16 March 2021 / Published: 20 March 2021
(This article belongs to the Special Issue Adaptive/Smart Structures and Multifunctional Materials in Aerospace)

Abstract

:
High aspect ratio aircraft have a significantly reduced induced drag, but have only limited installation space for control surfaces near the wingtip. This paper describes a multidisciplinary design methodology for a morphing aileron that is based on pressure-actuated cellular structures (PACS). The focus of this work is on the transient dynamic system behavior of the multi-functional aileron. Decisive design aspects are the actuation speed, the resistance against external loads, and constraints preparing for a future wind tunnel test. The structural stiffness under varying aerodynamic loads is examined while using a reduced-order truss model and a high-fidelity finite element analysis. The simulations of the internal flow investigate the transient pressurization process that limits the dynamic actuator response. The authors present a reduced-order model based on the Pseudo Bond Graph methodology enabling time-efficient flow simulation and compare the results to computational fluid dynamic simulations. The findings of this work demonstrate high structural resistance against external forces and the feasibility of high actuation speeds over the entire operating envelope. Future research will incorporate the fluid–structure interaction and the assessment of load alleviation capability.

1. Introduction

High aspect ratio (HAR) aircraft are in the focus of current research for their potential to significantly reduce induced drag [1]. The resulting long and slender wings provide little space for control surfaces, especially near the wingtip. The highest aspect ratios can be achieved with folding wingtips (FWT), which ensure the aircraft comply with airport gate size restrictions on ground. FWT are already installed on the Boeing 777X [2] and they are also under development in Europe [3,4]. The installation space in the FWT is particularly limited and the mass of the secondary systems must also be kept to a minimum. In HAR wings, conventional linear hydraulic and electro-mechanical actuators reach their limits regarding installation space and accessibility.
Shape-variable structures require a comparatively small installation space. Such structures integrate the actuator into the functional surface, which result in a small and lightweight component. Highly dynamic multi-functional movables on the trailing edge enable active load alleviation and, therefore, the design of lighter wings. Additional efficiency improvements arise by continuously adapting the wing geometry to changing flight conditions. The design of the wings flight shape is a compromise of the changing optimal wing shapes during the mission. The continuous adaption of shape-variable structures to each particular flight situation offers a potential for both increasing efficiency and enlarging the optimum flight envelope [5]. Thill et al. [6] describe the advantages of morphing wing technologies, as follows: reduction in drag and noise due to gapless high lift systems, reduction in mass and costs by decreased overall system complexity, extended range and flight envelope, stealth capability, and improved behavior regarding vibration and flutter. The literature presents a variety of approaches to achieve shape variability [7], e.g., the gapless smart droop nose device [8] and the FlexFloil adaptive compliant trailing edge [9] that use kinematic mechanism. Piezoelectric actuators drive the adaptive Flexspar stabilator [10] and shape memory alloys actuate a vertebrate structure [11]. Barbarino et al. present a comprehensive review of morphing concepts with conventional and smart material-based actuation [12]. However, all of the morphing approaches have to deal with the same challenge, i.e., a conflict between minimizing actuating forces on the one hand, and maximizing structural deflections and resistance to external forces on the other. Moreover, Barbarino et al. claim that successful morphing has to overcome weight penalties that result from the additional actuation mechanism [12], which is a drawback of many morphing concepts.
The conflict of minimal actuating forces and maximum deflections requires the structure to be both rigid and flexible. At the same time, the aerodynamic shape must be accurately controlled over the entire deformation range. Plant-inspired adaptive structures that combine the advantages of fluidic actuators and compliant mechanisms provide a feasible solution [13]. High power density, large stroke, and high positioning accuracy are characteristics of pneumatic and hydraulic actuators [14]. Their application in morphing structures offers great potential for lightweight design [15]. Different shape-adaptive cellular concepts with pneumatic actuation and morphing wing application are published: the cellular actuator device [16], the pressure adaptive honeycomb [17], a topology-optimized pressure-driven trailing edge [18], a simplified geometry with voids and pressure cells for large actuation strain [19], a multi-scale optimization method for fluidic polygonal motor cells [20], and the fluid actuated morphing unit structure [21]. Several more approaches with fluidic actuation for large deformation are published in the field of soft robotics [22].
This paper addresses a biomimetic approach of shape variability that is based on pressure-actuated cellular structures (PACS). These structures consist of multiple rows of polygonal cells with rigid walls and flexible hinge areas [23]. Pagitz et al. first investigated the concept of PACS theoretically and developed a numerical design framework to derive the deformation-optimized PACS geometry [24]. Gramüller et al. further developed the theoretical concept by considering manufacturing-related constraints. The authors were the first to experimentally prove the outstanding deformation capabilities of PACS [25]. In addition, they presented a holistic design process for PACS on the example of a variable-camber wing when considering aeronautical constraints, such as aerodynamic pressure distributions and other sources of external loads [26]. The design methodology of PACS is based on the optimization of a two-dimensional truss geometry that is composed of cells with rigid walls and discrete joints. By optimizing the cell wall lengths for any combination of polygonal cells, arbitrary target shapes can be achieved. Gramüller et al. also developed an axial sealing concept for PACS. These deformation supportive end caps offer an energy- and weight-efficient solution for the cell pressurization [27].
The concept of PACS can undergo high structural deformations and bear high external loads at the same time, as the structural stiffness mainly results from the applied internal pressure. The combination of actuator and functional surface into a single component reduces the system complexity and it offers potential for lightweight design. The next step towards implementing PACS as pressure-driven flight control surfaces raises new research questions. These include the flow inside the cells and thus the feasible actuation speed, the source of the pressure supply, as well as the transient dynamic system behavior, together with interactions with other subsystems. Adami et al. present a review on various on-board pressure generation methods for the application of soft robotics [28]. Although, these pressure generation methods do not meet performance requirements, such as maximum pressure and continuous flow rate, which are essential for the intended aeronautical application. Vasista et al. evaluate different pneumatic and hydraulic system architectures for a fluid-driven morphing winglet trailing edge at an early conceptual stage [29]. However, none of the pressure-driven concepts has, so far, been investigated with regard to the flow inside the structure and transient dynamic behavior.
The overall aim of this paper is the multidisciplinary design of a shape-variable PACS-driven aileron, with particular focus on the transient flow within the cellular actuator. This leads to the following three main research objectives: (1) determination of the structural, dynamic, and systemic demands on the shape-variable aileron and associated actuator design requirements for a HAR wing with limited installation space; (2) investigation of the dynamic performance of the actuator limited by the internal flow during the fast filling process; and, (3) design of a wind tunnel experiment to study the structural resistance against transient external loads. First, the reduced-order PACS design methodology is described (Section 2.1) and then applied to the example of a morphing aileron (Section 2.2). The authors derive a two-dimensional geometry for a shape-variable aileron, which is structurally integrated into a NACA 0012 airfoil starting behind the wing rear spar. A reduced-order model that is based on the Pseudo Bond Graph methodology is developed to realize an efficient simulation of the internal flow (Section 2.3). Subsequenty, the results from the transient simulations on the pressurization process are presented and verified with state of the art computational fluid dynamics (CFD) simulations, and the effects of duct geometry and pressurization speed are investigated (Section 3.1). Finally, the influence of external pressure loads that are caused by the flow around the airfoil is evaluated for the entire operating envelope and the reduced-order results are compared to finite element analysis (FEA) results (Section 3.2). The article concludes with a discussion of the main findings and an outlook on realizing a wind tunnel test with a PACS-driven aileron as well as on further extending the reduced-order simulation models (Section 4).

2. Methods and Tools

2.1. PACS—Concept and Approach

This section gives a brief summary about the working principles of PACS and the underlying design methodology. The concept of PACS is based on a biomimetic approach that mimics the nastic movement of plants. The Venus flytrap (Dionaea muscipula) or the sensitive plant (Mimosa pudica), for example, are able to quickly and powerfully fold their leaves by varying the cells’ turgor pressure. This change in turgor pressure in combination with flexible cell walls allows for the plant to move without the presence of muscles or rigid mechanisms. The transfer of this working principle into a technical system results in a cellular structure that is composed of polygonal cells with rigid cell walls and compliant hinge areas. An increase in cell pressure causes a deformation of each cell into a state of minimal internal energy, which occurs when all joints lie on a circular arc and the cross-section becomes maximum. Any further increase in pressure no longer leads to a change in geometry, but to a stiffening of the structure. The maximum angular deflection per cell is solely determined by the ratio of the cell wall lengths; the total deformation of the cellular structure is then described by the sum of the angular deflections of each individual cell.
Using an iterative form-finding algorithm allows for the design of arbitrary polygonal cell structures that can move between two predefined target shapes. A reduced-order PACS model is developed based on a truss structure that consists of rigid cell walls and discrete joints. The compensatory stiffness of each joint is derived from a bending beam with the flexural stiffness E I , the length l, and a constant thickness h. The approach of virtual work is then utilized to calculate the pressure-dependent state of equilibrium for the polygonal cell structure. For given external loads and maximum cell pressure, the length of each cell wall is iteratively adjusted until the deformed shape at equilibrium matches the predefined target shapes. Subsequently, the truss structure is translated into a cross-sectional design when considering flexure hinges and cell wall geometries. A comprehensive description of the holistic design approach of PACS, which is applied and extended in this work, is presented in [26].
When compared to previous publications, an enhanced geometric model is used in the work presented in this paper. For the first time, a tetragonal cell geometry is implemented for the outer cell row, whereas all previous realizations of PACS utilized a pentagonal geometry for these cells. The advantages of the tetragonal cell geometry are investigated in a preliminary study and they are pointed out by Gramüller et al. [30]: a significant increase in deformation capacity; a smooth and gapless outer surface for improved aerodynamic efficiency; lower deformation deviations between the reduced-order truss model and FEA results; and, local reduction of stress peaks due to the parallel alignment of the upper hinge and the resultant force vector.

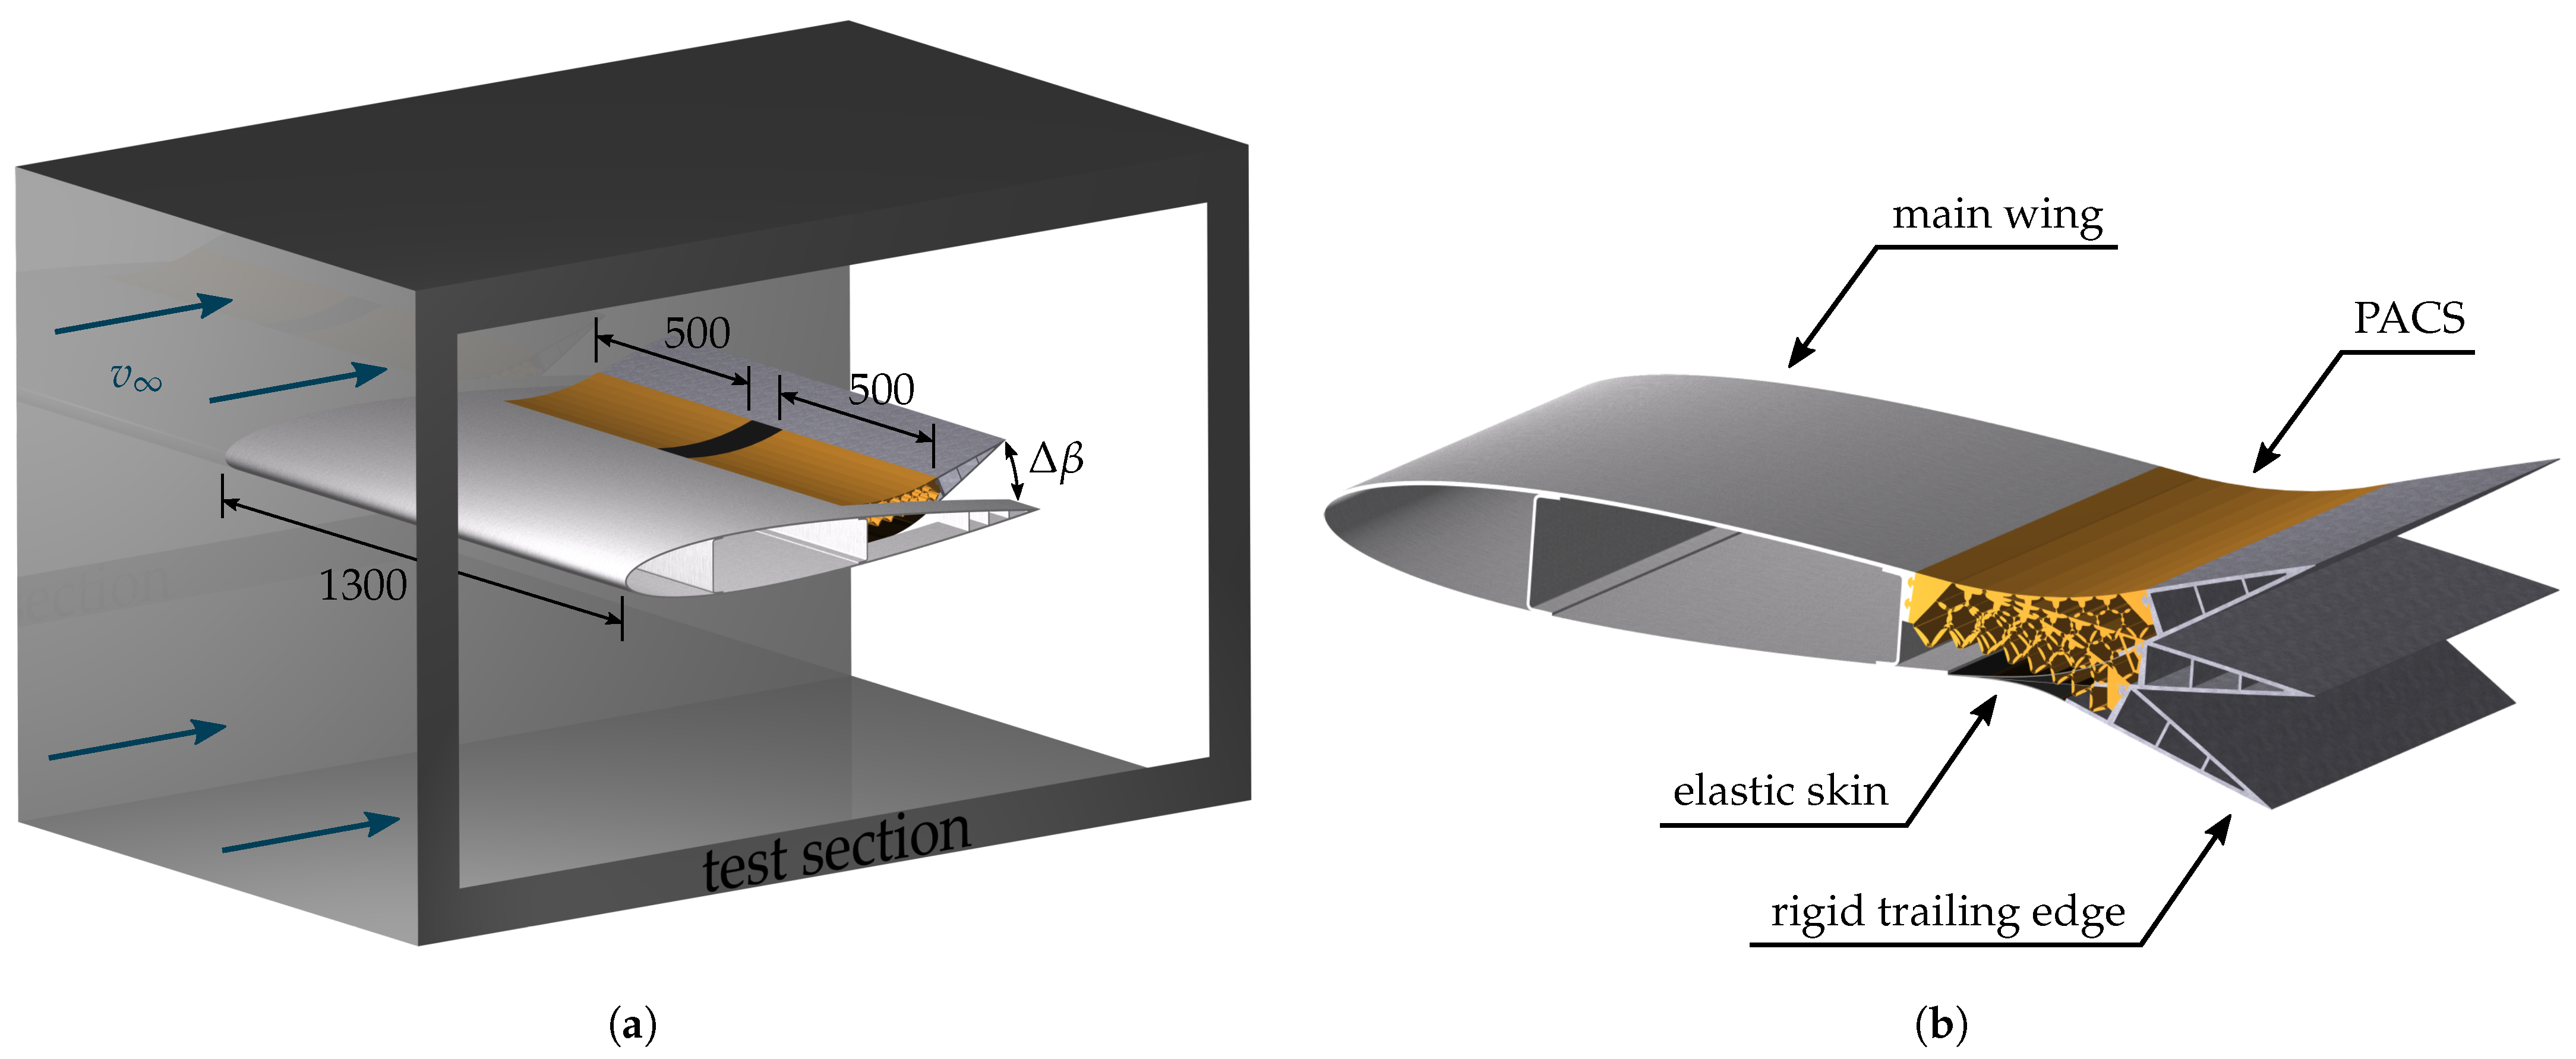
2.2. Design of a Morphing PACS-Driven Aileron

In the following, the design of a shape-variable multi-functional aileron is described by applying the PACS design process that is presented in Section 2.1. The chosen application of a morphing aileron makes high structural and systemic demands on the actuator concept (high dynamic loads, high actuation speed, and fail-safe design). This application is intended to assess the conceptual limits of PACS with regard to the dynamic behavior under aeronautical operating conditions.

2.2.1. Operating Conditions and Design Constraints

The shape-variable PACS-driven aileron is designed in the context of a future wind tunnel test. The wind tunnel test will be conducted in a low speed closed-circuit wind tunnel (Göttingen-type) at the Aeronautics Research Centre Niedersachsen at the Technische Universität Braunschweig. The wind tunnel achieves a maximum speed of v = 60   m / s in the closed test section with the size of 1300   mm   ×   1300   mm   ×   3000   mm . Figure 1a shows the schematic integration of a two-dimensional wing model into the tunnel test section. A well-researched symmetrical NACA 0012 airfoil with 1000 mm chord length is chosen to investigate the principle effects of a PACS under the influence of external aerodynamic loads. The wing model with a total width of 1300 mm has two integrated trailing edge PACS actuators, each 500 mm wide. Figure 1b shows a cutout of one actuator section. The model consists of four basic structural elements: (1) the main wing, including leading edge, wing box, and the mounting interface to the wind tunnel walls; (2) the PACS actuator; (3) a rigid trailing edge; and, (4) an elastic skin at the lower surface.
Performance-driven requirements from aileron operation are the maximum deflection angle Δ β m a x and the deflection rate β ˙ . Vechtel et al. examined a modified Airbus A350 system architecture and identified a deflection rate of 16 ° /s to fulfill requirements of the EASA certification specification CS-25 for roll control [31]. Multi-functional control capabilities demand faster actuation. Xu et al. investigated a gust load alleviation system for commercial aircraft, with rate limits of 30 ° /s [32]. Gern et al. state that control surface deflection rates of 90 ° /s are typically for high-performance fighter aircraft [33]. In general, few data on the deflection angles and rates for the latest generation of commercial aircraft are available in published literature. In this paper, the maximum aileron deflection angle is defined to Δ β m a x   =   ± 21 ° . The deflection rate is assumed to be β ˙ = 21 ° /s for a baseline configuration and β ˙ = 42 ° /s for a faster actuation scenario. Higher actuation rates are beneficial for gust load alleviation and flutter suppression, and they are to be investigated in future research.

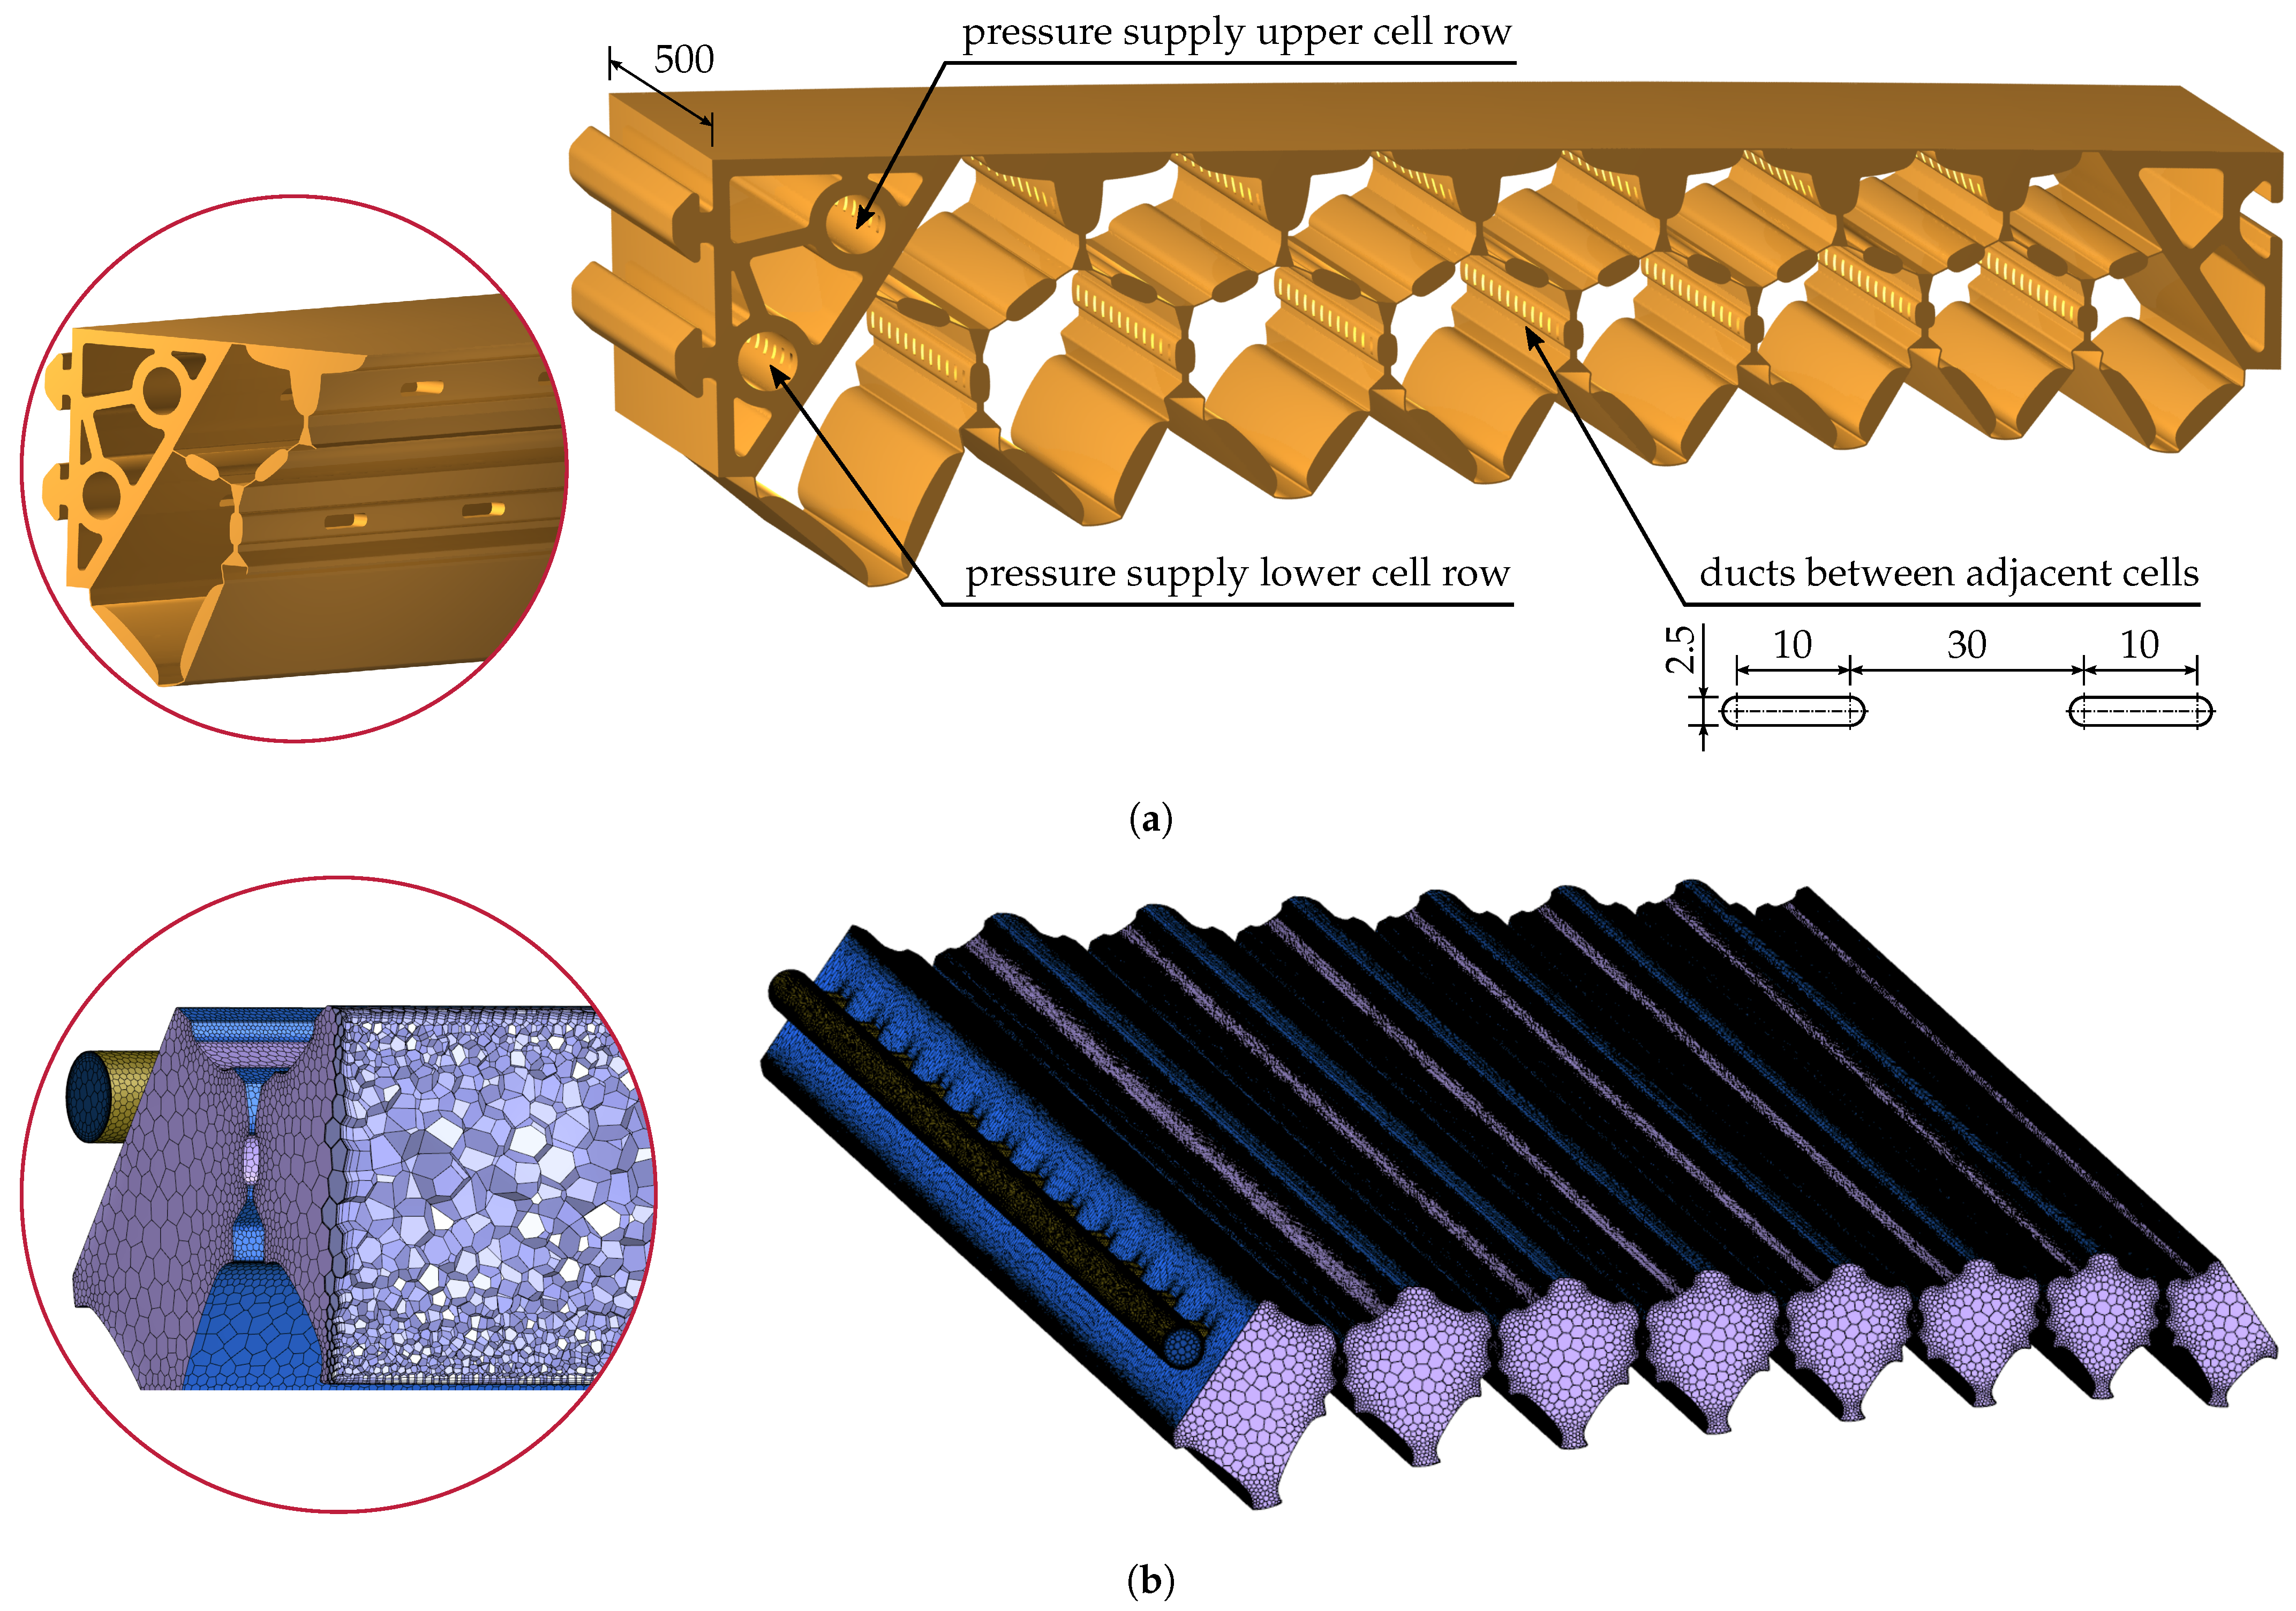
2.2.2. PACS Topology and Initial Shape

The topology and dimensions of the PACS are determined by the available installation space that is prescribed by the cruise shape of the wing. The PACS is attached to the wing trailing edge. The rear spar is placed at 60% chord and no penetration of the wing box is allowed. Taking the mounting interface between actuator and rear spar into account, the actuated surface extents from 65% to 85% chord and the trailing edge behind 85% chord is rigid. The initial geometry is determined for the cruise configuration with zero aileron deflection, so that the outer surface follows the NACA 0012 contour. A suitable PACS topology with two cell rows results in n r o w 1   =   7 and n r o w 2   =   8 cells in upper and lower cell row respectively. A cell size of 32 mm is used for the first cell. Adjacent cells reduce in size with a tapering of 0.75, which describes the length ratio between first and last cell of the upper cell row. Figure 2 shows the resulting cross-sectional design and the integration into the NACA 0012 airfoil. The figure shows the final PACS geometry that is obtained from the optimization process described in the following sections. The demonstrated ability to scale the PACS into almost arbitrary design spaces enables the implementation of PACS as a control surface in HAR wings with limited installation space. Moreover, Figure 2 shows a smooth and gapless outer surface that results from the tetragonal cell design, which provides significant aerodynamic improvements when compared to any previously accomplished PACS design [30].

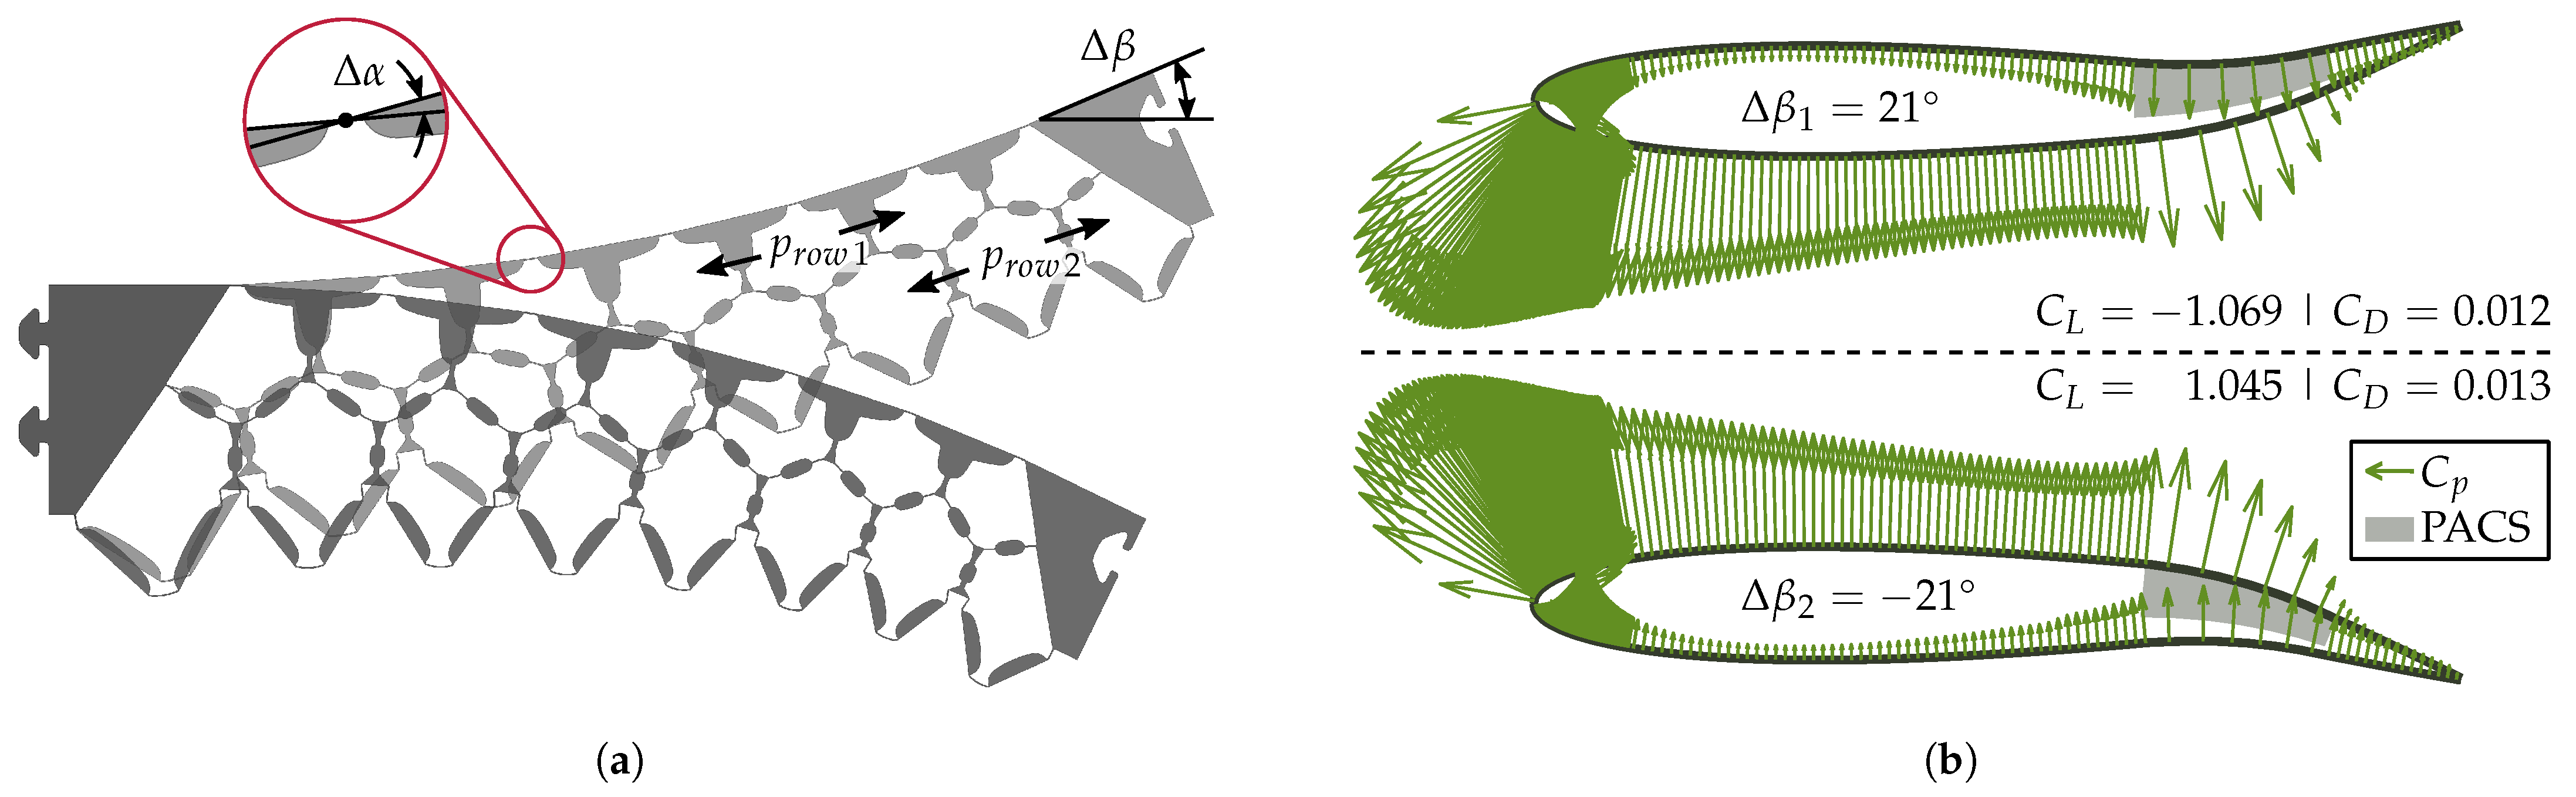
2.2.3. Target Shapes

The target shapes of the PACS actuator are derived based on the aileron operating conditions ( Δ β m a x   =   ± 21 ° , see Section 2.2.1). The aileron deflection angle is assumed to be equal to the angular deflection at the tip of the PACS actuator, using the right mounting frame at 85% chord as a reference point for calculating the angular deflection. A pressurization of the upper cell row causes a downward deflection and a pressurization of the lower cell row an upward deflection. Figure 3a shows the deformed PACS cross section for both of the target shapes. The target shapes are obtained by superimposing a circular arc over the undeformed cruise shape. Under maximum cell pressure, each cell of the upper cell row deflects by the same angle Δ α . Combing the deformations of all n r o w 1 cells results in the total angular deflection of the PACS actuator. Subsequently, the angular deflection per cell used for the PACS design is Δ α   =   Δ β m a x / n r o w 1   =   ± 3 ° .

2.2.4. Loads and Boundary Conditions

The loads acting on the structure can be divided into internal and external loads. The primary source of internal loads results from the cell pressurization. The internal pressure acts on all inner surfaces and causes a deflection of the flexure hinges and, consequently, a global deformation of the structure. Simultaneously, a counteracting bending force occurs due to the inherent stiffness of the hinges. The maximum hinge deflection is mainly defined by the geometric dimensions of the cell walls and it will be further discussed in Section 2.2.6. The maximum cell pressure is set to p r o w 1 , m a x   =   p r o w 2 , m a x   =   1   MPa , determined by the applied material (Section 2.2.5), and it is verified by FEA (Section 2.2.7).
External loads can act in the same or opposite direction as the deformation due to the internal pressurization of the PACS. In the presented application, the structure is exposed to aerodynamic loads that result from the external flow field, which counteract the deformation of the PACS actuator. Based on the wind tunnel test parameters, a free stream velocity of v   =   60   m / s , an ambient pressure of p   =   0.1013   MPa , and wind tunnel temperature of T   =   40   ° C are defined. The pressure distribution around the airfoil is calculated with the subsonic analysis tool XFOIL that is based on a 2D panel method. The input parameters for XFOIL are a Mach number of M a   =   0.172 and a Reynolds number of R e   =   3.754   ×   10 6 that result for an ideal gas with the values of v , p and T shown above. The angle of attack is set to A O A   =   0 ° to evaluate the performance of the PACS actuator while neglecting the influence of the specific airfoil characteristics. Geometric input data are the NACA 0012 airfoil coordinates that are shown in Figure 2 superimposed with the angular deflection Δ β acting between 65% to 85% chord length. Figure 3b shows the pressure distribution that is given by XFOIL for both target shapes. In the PACS design process, the aerodynamic pressure is applied as surface loads to the outer walls of the upper cell row. Additional aerodynamic loads act on the rigid trailing edge behind 85% chord and on the elastic skin. The bending moment that results from the accumulation of these pressure loads is applied as a discrete pair of forces at the right end of the PACS actuator.
A mounting interface is integrated into both edges of the PACS actuator. The connection to the rear spar of the wing box is made via a fixed bearing at the left end of the PACS. A rigid trailing edge is connected to the actuator on the right side.

2.2.5. Material Selection

Gramüller et al. show that the ratio of squared strength to stiffness R 2 / E provides a decisive criterion for the material selection and, thus, for the entire design [25]. Consequently, flexible but high-strength materials are demanded. Fiber reinforced plastics (FRP) offer the best ratio of R 2 / E , which makes them the most suitable materials for application in PACS. In this study, a glass-fiber reinforced plastic (GFRP)—HexPly913/28%/192/EC9756—is utilized, which has a Young’s modulus of E = 42,000 MPa, a tensile strength of R   =   1200   MPa , and a Poisson’s ratio of ν   =   0.29 . This material is selected inside the group of FRP based on three reasons: (1) glass-fibers have a relatively high elongation at break and they are considerably less sensitive to compression than carbon or aramid fibers. Both is beneficial for the application as highly deflected flexure hinges; (2) the development of an automated manufacturing process for PACS made out of woven GFRP is part of a current research project [34]; and, (3) the usability of HexPly913 in the context of PACS has already been proven during the realization of the first functional demonstrator [25].

2.2.6. Hinge and Cell Wall Sizing

The working principle of PACS is based on the combination of rigid cell walls with high thickness and flexible areas with reduced thickness. Since the entire cell deformation is concentrated on the latter, a key challenge is the design of these flexure hinges. The hinge design is driven by material properties and performance requirements. Each flexure hinge is described by its thickness h, length l, hinge angle u, and eccentricity ζ (see Figure 2). The hinge elements are modeled as bending beams with the deflection Δ u , whereby Δ u is the change in the hinge angle u due to the deformation of the pressurized cell. It is shown in previous publications that an optimum hinge thickness h   =   h o p t exists that allows for applying the maximum pressure to a PACS cell [25]. By superimposing normal stresses that result from the internal pressure p and bending stresses caused by the hinge deflection Δ u , the following equation for the optimum hinge thickness can be derived:
h o p t   =   R · l E · Δ u
For the PACS actuator that is shown in Figure 2, the maximum hinge deflection appears in the bottom hinge in the lower cell row and it amounts to Δ u   =   18.9 ° . Thus, using the material properties from Section 2.2.5 and a hinge length of l   =   3   mm , the optimal hinge thickness for the critical hinge results in h o p t   =   0.26   mm . This constant thickness is applied to all hinges.
The dimensioning of the cell wall thickness is mainly done to fulfill the assumption of rigidity and allow for the axial sealing of the cells (the latter is not presented in this paper). A thickness ratio of about 1:12 between rigid cell walls and flexible hinge areas is chosen, which results in a wall thickness of h w   =   3   mm .
The determination of the cell wall lengths is achieved while using an iterative optimization process. The deformability of each cell is geometrically defined by the ratio of its wall lengths. Under maximum internal pressure, the accumulated deflections of all cells must match the target shape. The cell wall lengths are determined applying the form-finding algorithm that is described in Section 2.1. During form-finding, the lengths are altered until a state of equilibrium is reached between internal and external loads. Table 1 presents a summary of all the design parameters used in the form-finding process. The resulting PACS geometry corresponds to the design that is shown in Figure 2.

2.2.7. Numerical Model for Verification by FEA

The pressure-dependent deformations derived from the reduced-order PACS design tool are numerically verified with FEA. The simulation software ANSYS is utilized to model the 2D solid structure (Figure 2) with plane182-elements applying plain strain behavior. A MATLAB interface directly imports loads and boundary conditions for each load case from the PACS design tool into ANSYS (see Section 2.2.4). A mesh convergence study revealed that an element length that is equal to the hinge thickness h o p t is sufficient to correctly predict the total angular deflection Δ β , which changes by less than 1% with increasing mesh density. However, previous analyses showed that a mesh refinement to at least six elements in the thickness direction of each flexure hinge is required to obtain correct stress values. Therefore, the element length is set to h o p t / 6   =   0.043   mm in the hinge regions, and it is increased in all other areas by a factor of ten. This results in a total number of 61,719 elements. Pressure loads are applied as a structural surface effect via surf153-elements, and the point loads are distributed to the right mounting frame by using MPC style contacts with targe169/conta172-elements.

2.3. Pressurization and Internal Flow Behavior of a PACS

The PACS actuator is a subsystem within the pneumatic system architecture of the wing. Further subsystems are the compressor as a compressed air generating component, tubes, or pipelines for distributing the compressed air and storage tanks for intermediate storage of the fluid during continuous pressurization and depressurization. The PACS actuator has one pressure port per cell row. Internal ducts in the cell walls realize the fluid transfer between the cells of each row (Figure 4a). For reasons of accessibility, the pressure ports are positioned at the mounting frame. Between adjacent cell, there are 12 internal ducts with a cross-sectional area of A D u c t   =   29.91   mm 2 each, which are equally distributed over the total depth of 500 mm. For a better understanding of the transient pressurization process, detailed studies of the flow within the PACS are performed using CFD. The results of the three-dimensional transient CFD simulations are used to verify a reduced-order model (ROM) based on Pseudo Bond Graph notation that is developed within this study. The derived ROM is used within the multidisciplinary PACS design approach to optimize the thermo-fluid dynamic components and gain a deeper understanding of the interaction between the transient internal flow and associated structural deformation.

2.3.1. Numerical Simulation of the Flow inside a PACS Cell Row Using CFD

All the simulations of the present investigations are done with the commercially available three-dimensional (U)RANS solver ANSYS FLUENT. Computational grids of increasing number of cells are generated using the included grid generator FLUENT Meshing. Preliminary simulations are performed with different turbulence models, along with a grid sensitivity analysis. The grid sensitivity analysis shows that at least 9.48 million polyhedrons and prisms are required to achieve (i) a solid resolution of the boundary layers ( y +     3     10 ) and (ii) the overall flow parameters accurately. The standard k- ω turbulence model turns out to be best suited for the present investigation. The computational domain that is regarded here covers the internal volume of the lower cell row of the PACS, including the pressure port and fluid channels that connect the single cells (Figure 4b). Transient simulations are calculated with a time step of 5   ×   10 5 s .
The pressurization is conducted as a fast filling process to simulate almost real operating conditions. Two pressurization scenarios are defined for increasing the cell pressure by p m a x   =   1   MPa in order to deflect the aileron by Δ β m a x   =   ± 21 ° : (i) full deflection in t   =   1   s (corresponds to β ˙ = 21 ° /s), and (ii) full deflection in t   =   0.5   s (corresponds to β ˙ = 42 ° /s). The filling process is realized using a linear pressure ramp of the total pressure from p t , s t a r t   =   0.1   MPa to p t , e n d   =   1.1   MPa at the inlet of the computational domain. Furthermore, a constant total temperature of T t , s t a r t   =   T t , e n d   =   288.15   K and low turbulence intensity ( T u = 0.5%) are specified at the inlet, and no reverse flow is assumed.

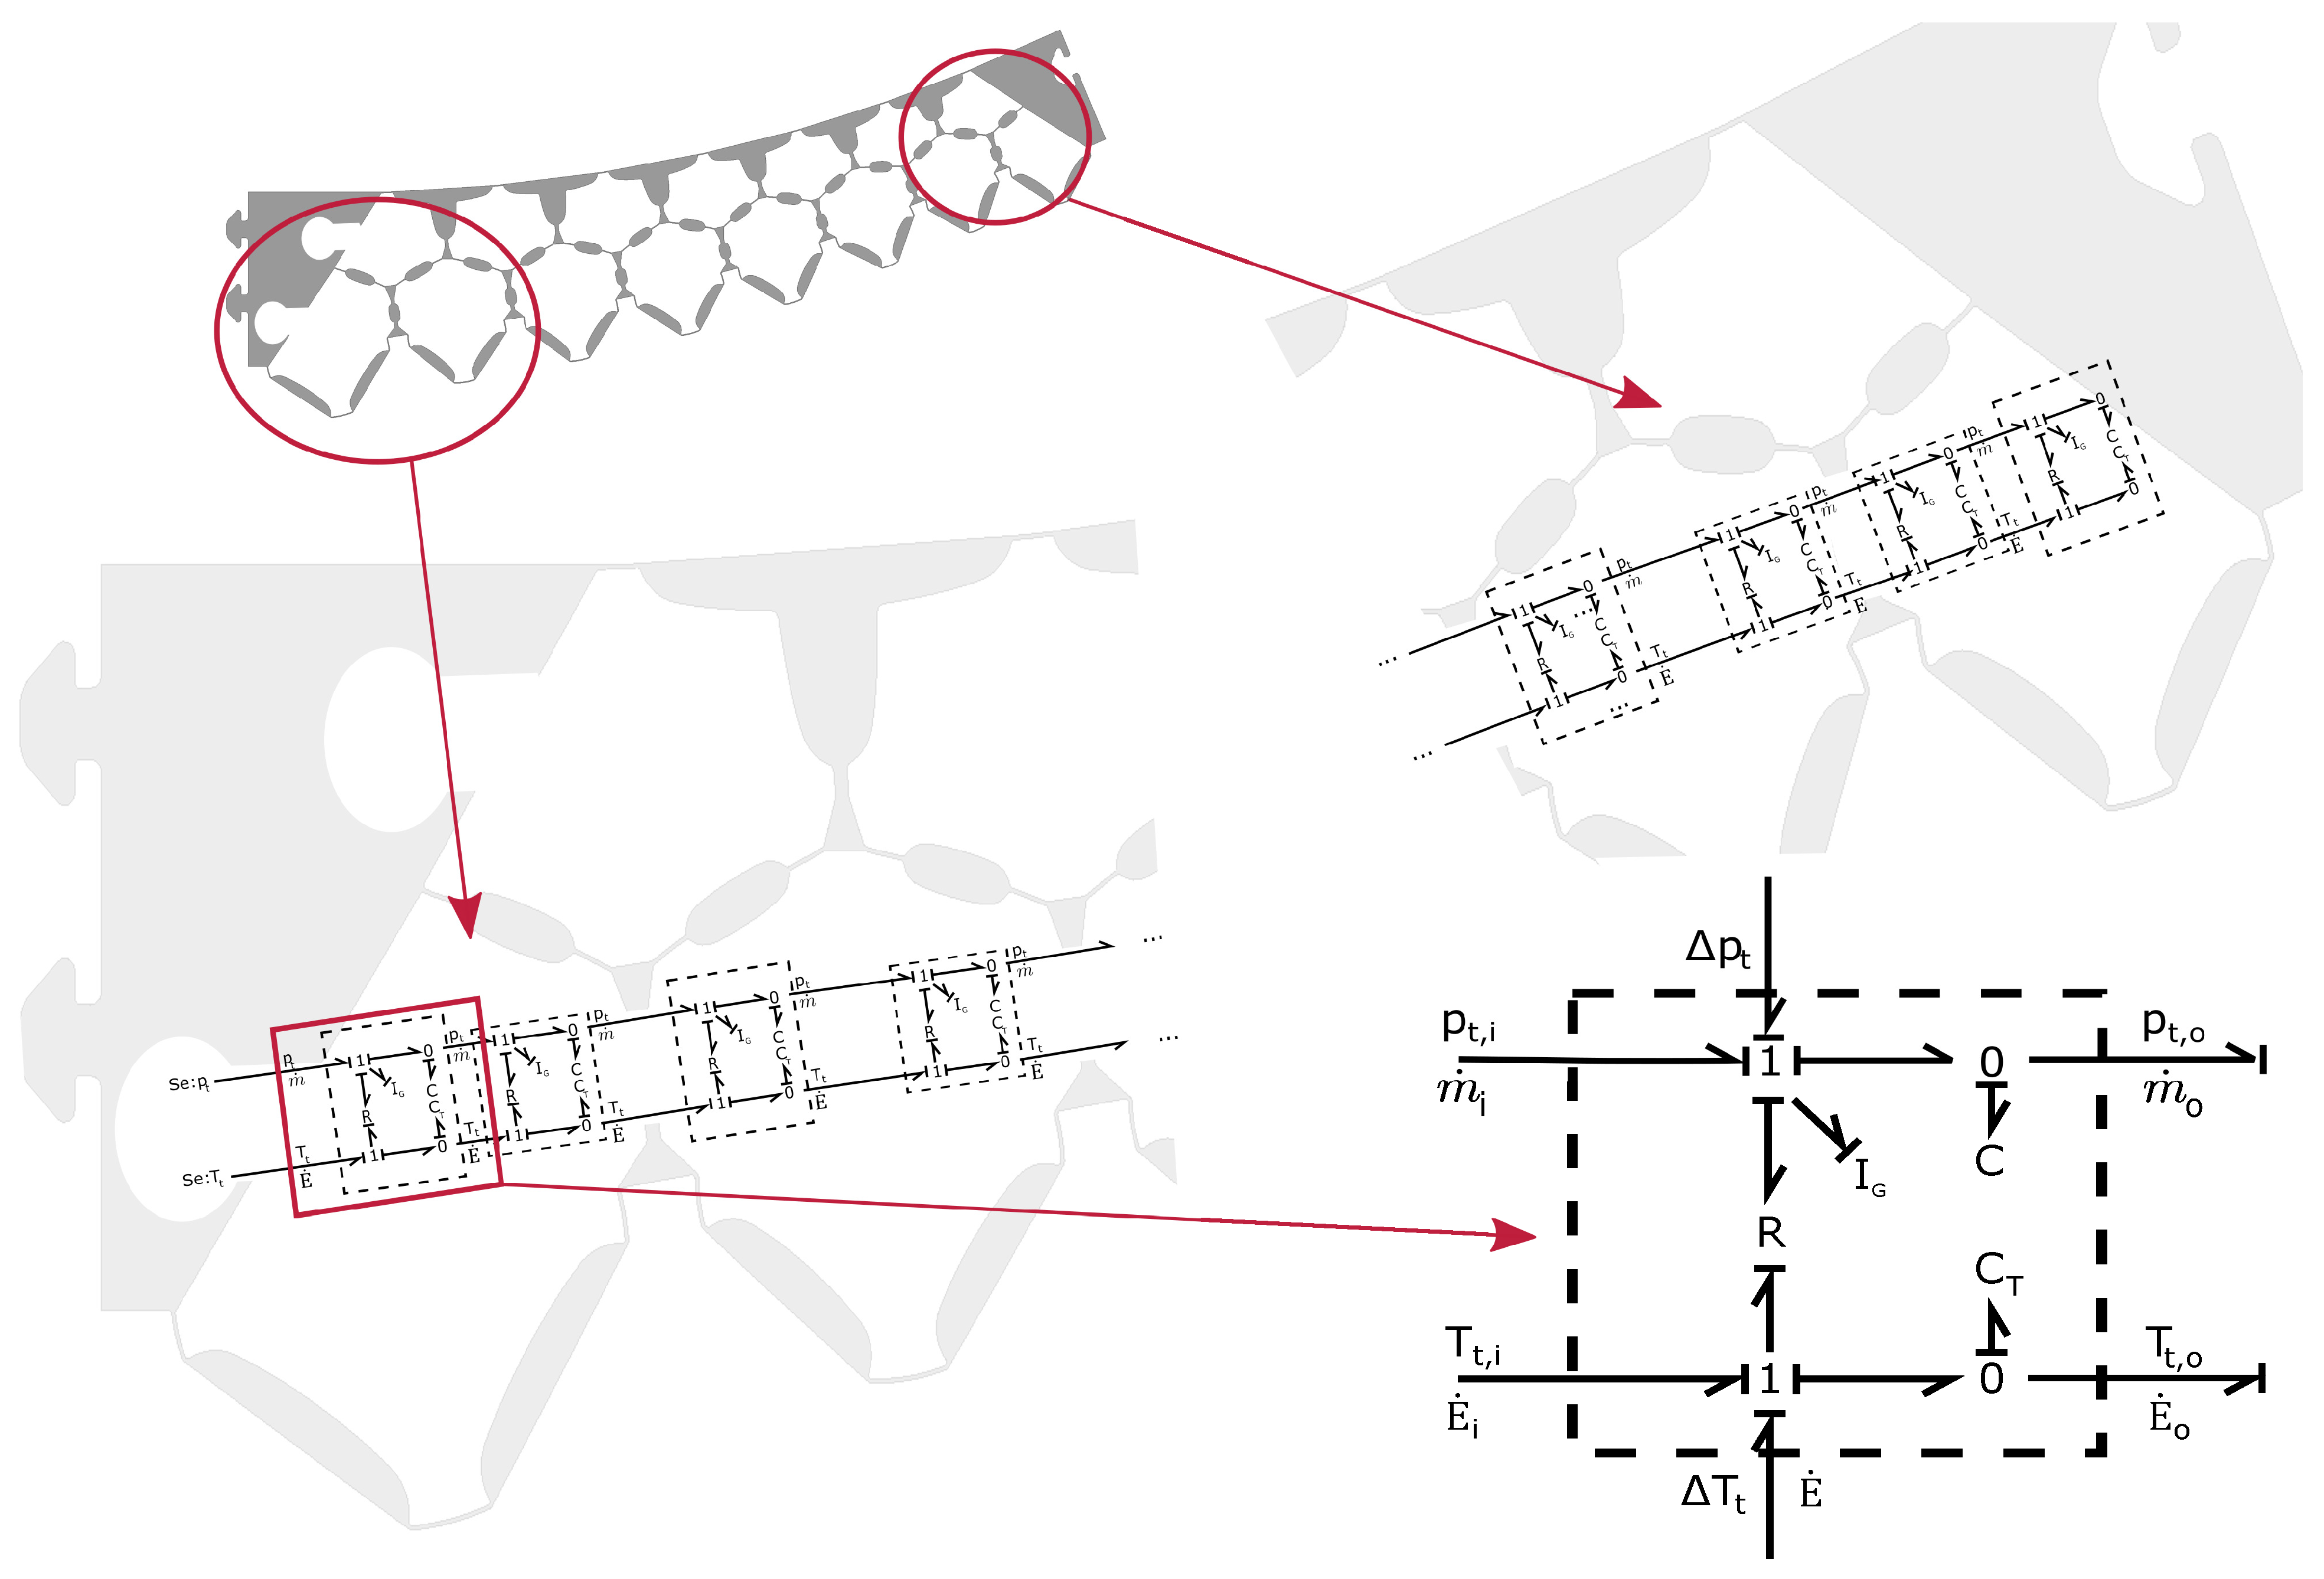
2.3.2. PACS-Driven Aileron as a Reduced-Order Model by Pseudo Bond Graph Approach

State of the art high fidelity and high resolution tools are available for most of the physical domains that are involved in PACS. These include FEA for structural and thermal calculations as well as CFD methods for flow simulation inside the structure. While offering a high degree of detail, they require extensive sets of boundary conditions as well as computation time. Simulations of numerous PACS-setups during the design process are not currently feasible and there is a need for a reduced-order model. The Bond Graph theory features less level of detail but a higher degree of flexibility than the previously mentioned high-fidelity tools. The simulation tool ASTOR (Aircraft Engine Simulation for Transient Operation Research) that was developed at Technische Universität Braunschweig is based on the Pseudo Bond Graph theory, which is an extension of the Bond Graph theory. It can be used to develop reduced-order models for multiphysical systems, such as jet engines [35], electric air compressors [36], or other fluid dynamic systems [37]. An application towards PACS is also feasible, as the Pseudo Bond Graph theory on the one hand provides the ability to derive sketches of complex multiphysical systems with the advantage of giving clear instructions on the interconnections of the miscellaneous components. On the other hand, it enables the easy conversion of power flows in various physical domains and the derivation of a system of ordinary differential equations. ASTOR has been extensively described in the field of turbomachinery. The tool is used in this study to investigate transient phenomena in the field of PACS by deriving a ROM for the given structure.
In the following, the elements used in the Bond Graph theory are explained in more detail. Figure 5 shows a schematic drawing of a gas path element used in PACS. The product of effort e (e.g., a temperature T) and flow f (e.g., volume flow V ˙ ) of a single bond have the physical dimension of a power, as per the Bond Graph formalism. However, this cannot be achieved easily in compressible flows. Therefore, the Pseudo Bond Graph notation introduces a second pair of effort and flow. With this extension, the Pseudo Bond Graph that is depicted at the bottom right of Figure 5 can fulfill the fundamental requirement of the Bond Graph theory. The upper bond provides mass flow m ˙ and pressure p, while the lower bond provides temperature T and energy flow E ˙ .
Subsequently, the simplified equations of motions, which are solved for the flow of process gas within the structure, are being described in more detail [37]. At the upper 1-junction, the conservation of momentum (Equation (2)) is enforced by using the inertia storage I.
d ρ v V d t   =   1 I ( ρ i n A i n v i n 2     ρ o u t A o u t v o u t 2   +   p i n A i n     p o u t A o u t ) ) with I   =   V · ρ
At the following 0-junction, the balance of efforts is calculated, as shown in Equation (3) using the conservation of mass. The change in density can be obtained by balancing the incoming and outgoing mass flow. By incorporating the capacitive storage volume C, the volume dynamic effects can be modeled.
d p t d t   =   1 C ( ρ i n A i n v i n     ρ o u t A o u t v o u t ) with C   =   κ · R · T V
Finally, temperature changes are obtained at the lower 0-junction using the conservation of energy (Equation (4)) and the thermal capacity C T of the process gas that is currently stored within the components volume. By adding a heat flow Q ˙ from the inside of the component to the environment or vice versa, free or forced convective cooling can be simulated, but it is neglected in this study.
d T t , o d t   =   1 C T [ c p ρ i n A i n v i n T t , i n     c p ρ o u t A o u t v o u t T t , o u t Q ˙ ] with C T   =   c v · V · ρ
The temporal derivatives from Equations (2)–(4) are integrated and a temporal resolution of the quantities under investigation can be obtained. Currently, no fluid–structure interaction is modeled in ASTOR and the aileron’s inertia is disregarded. Nevertheless, the coupling of internal pressure forces, structure deformation, and external aerodynamic loads will be included in future studies. This includes accurate aerodynamic loads (e.g., from XFOIL), together with the overall cellular structures represented as a truss model. The interfaces of the miscellaneous components and their interconnection are presented in, e.g., Karnopp [38].

3. Results

3.1. Studies on the Transient Internal Flow

The following results describe the transient system behavior of the case of maximum aileron deflection for one PACS cell row. Only the lower cell row is pressurized and the upper cell row is kept at an ambient pressure. Fluid-structure interaction is neglected here. A goal of the work presented in this paper is to create a ROM for representing the three-dimensional time-dependent flow within the cell rows of the PACS that can be integrated into the holistic design process. First, the three-dimensional time-dependent behavior of a fast filling process of the lower cell row is investigated while using CFD. Subsequently, the ability of a ROM that is based on the Pseudo Bond Graph approach for representing the transient system behavior of the PACS is described. ROM results are shown for a 2D section and compared to the three-dimensional time-dependent CFD results.

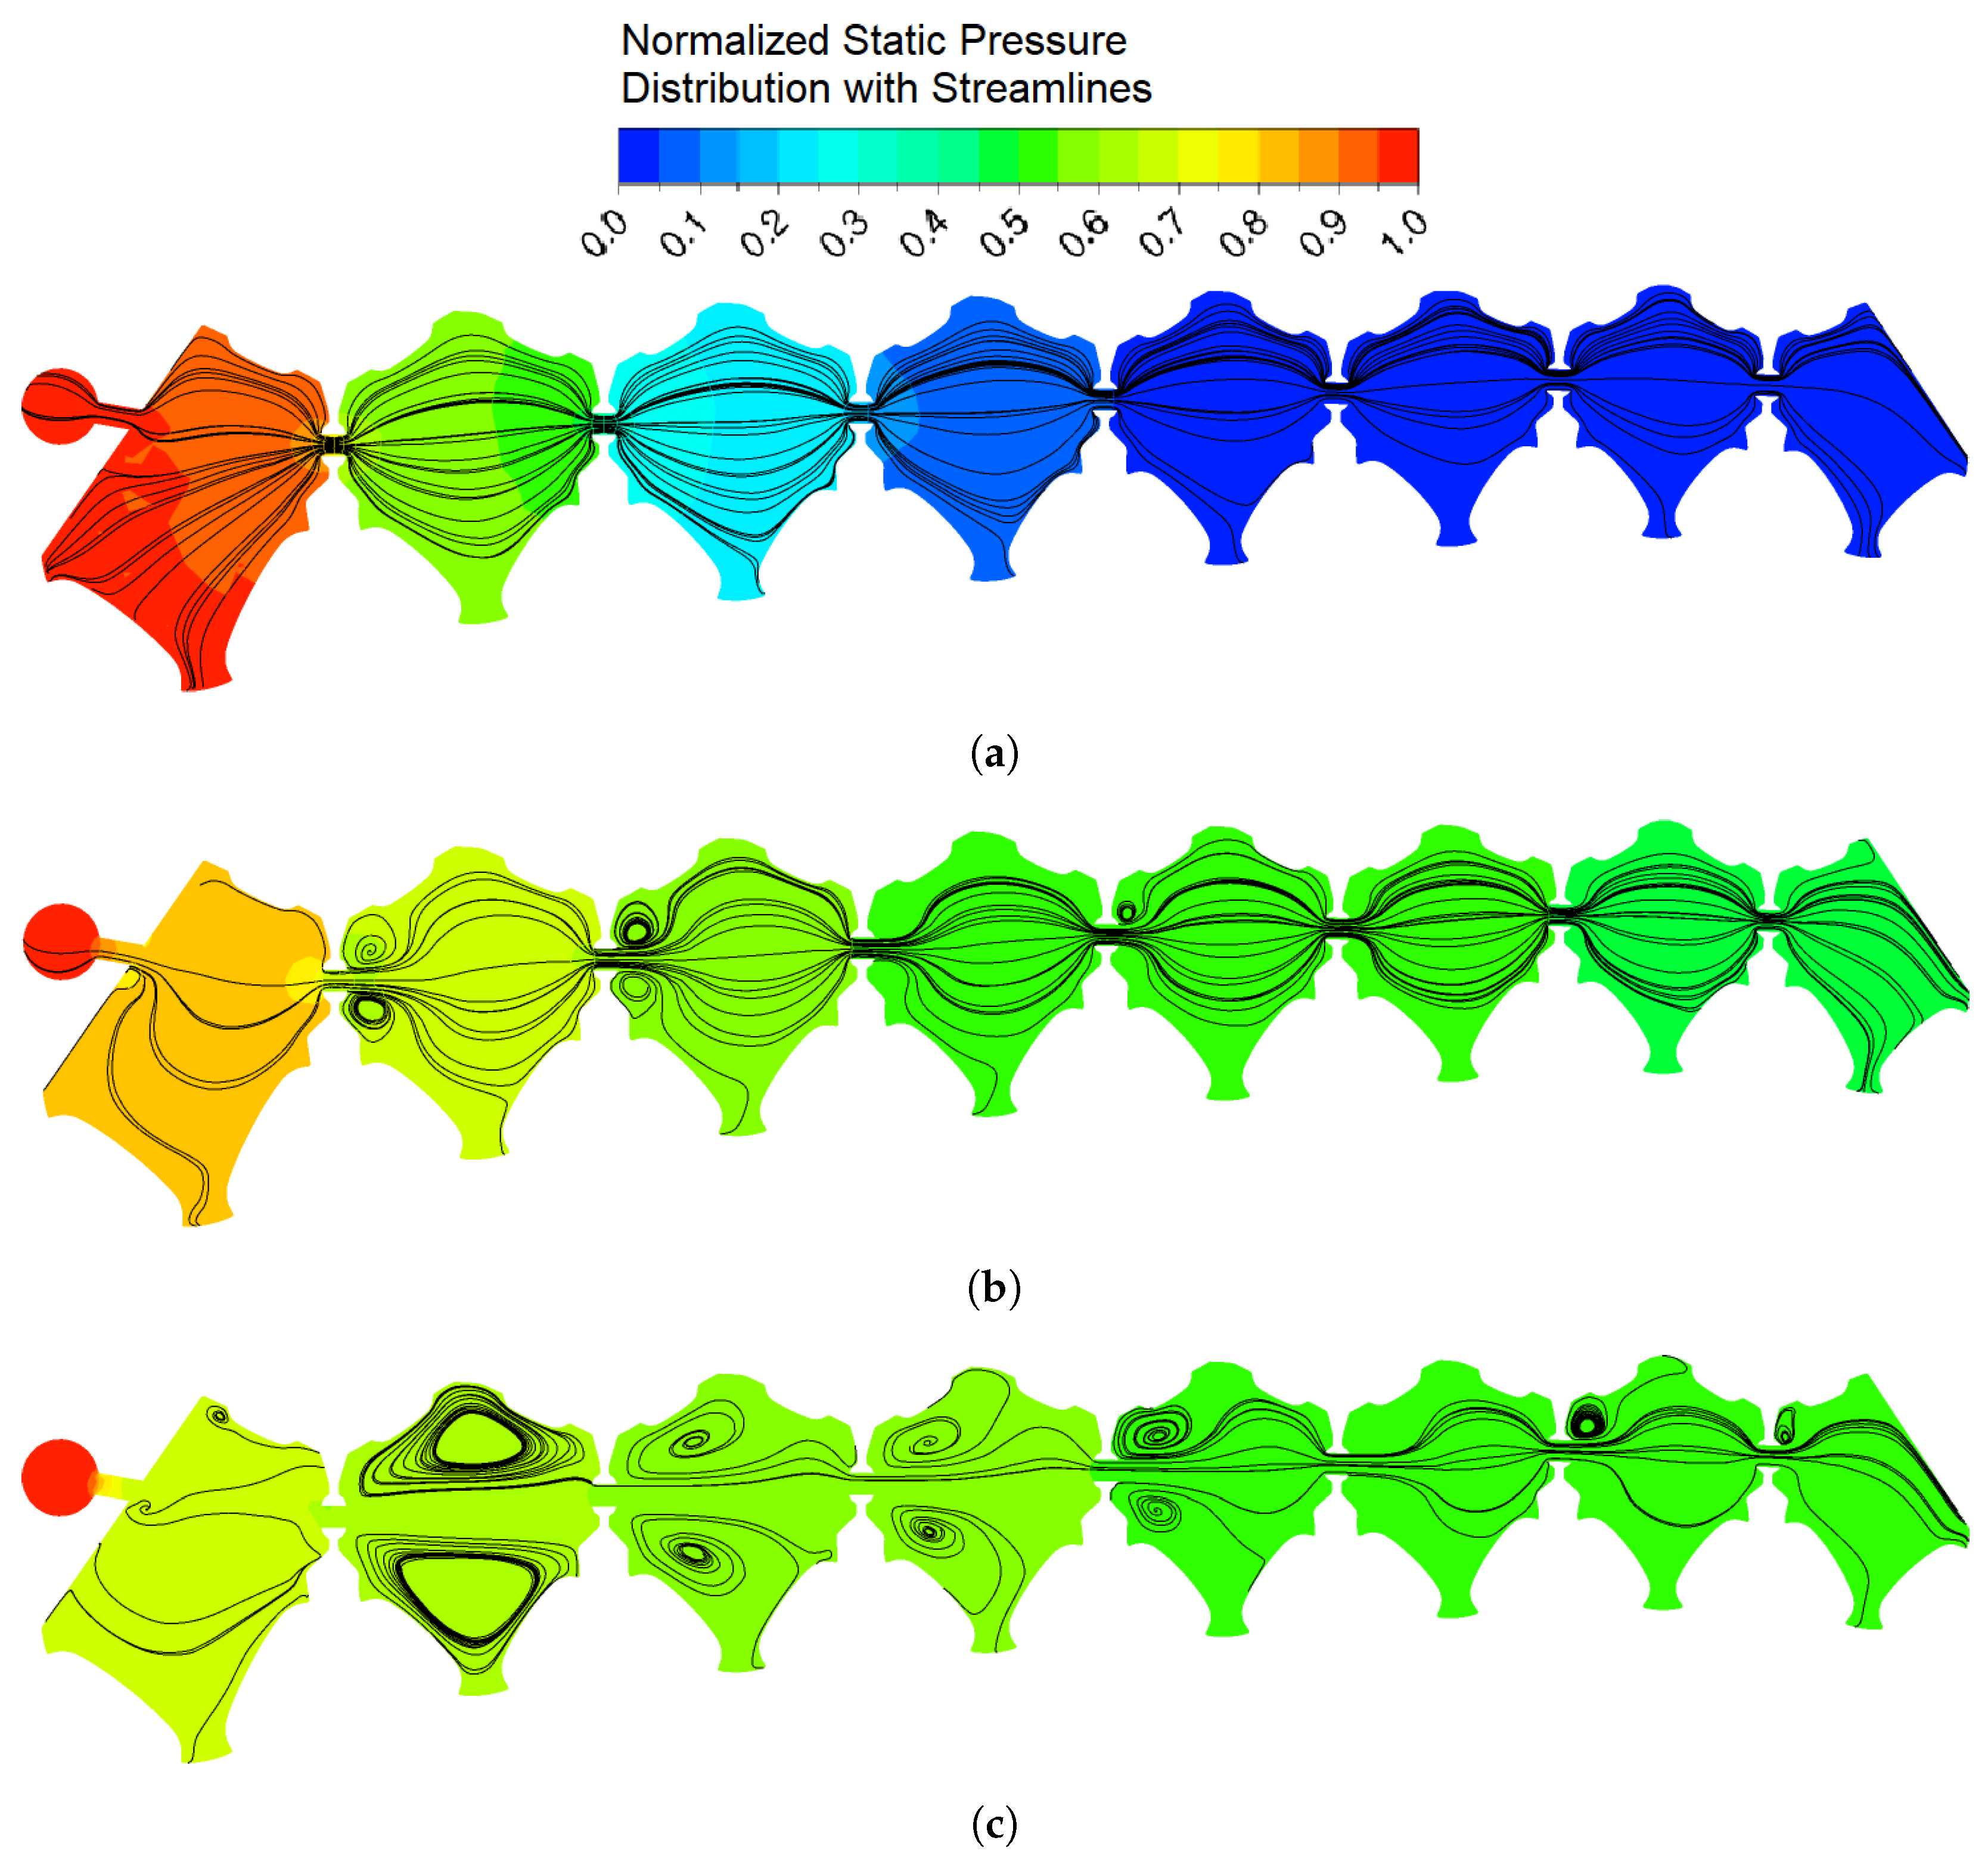
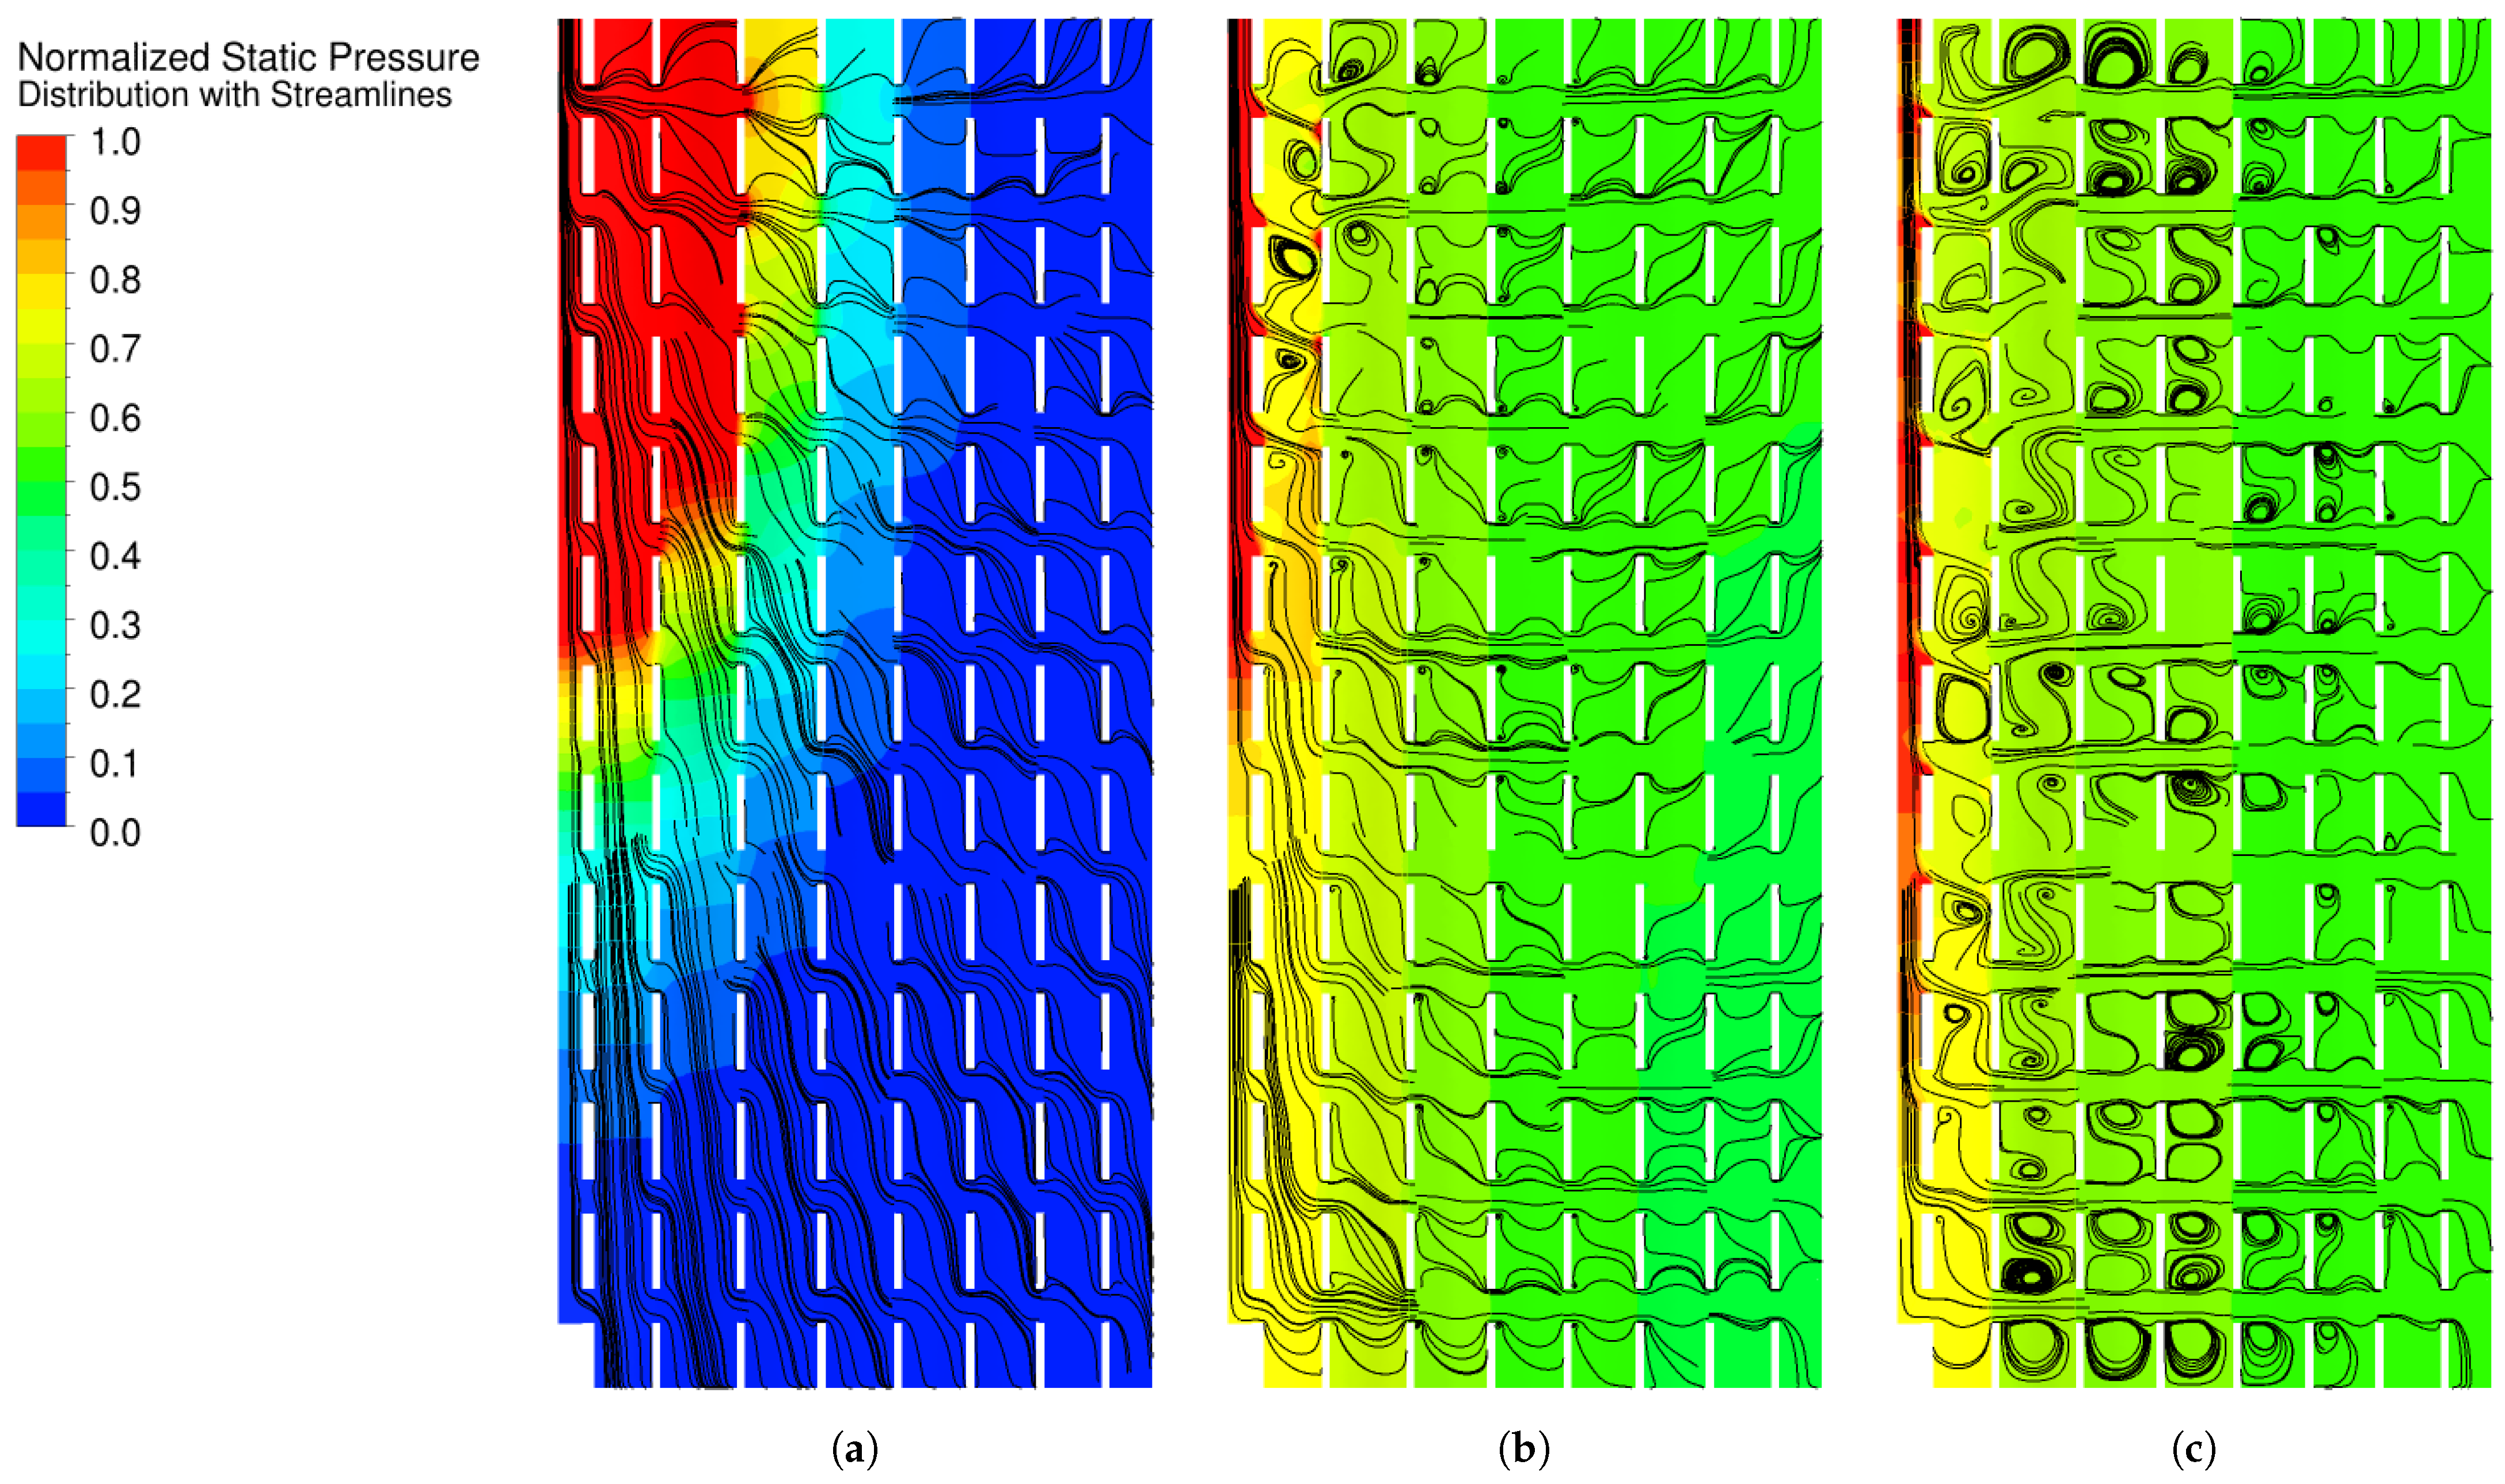
3.1.1. Flow Behavior Through Ducts and Cells

CFD simulations of the PACS are performed for a pressurization process corresponding to a deflection rate of β ˙ = 21 ° /s, as described in Section 2.3. The fast filling process is prescribed here as a linear pressure ramp from p t , s t a r t to p t , e n d within t   =   1   s (cf. Figure 8a). The time-dependent three-dimensional flow behavior for the x-y and x-z plane can be seen in Figure 6 and Figure 7, respectively. The normalized static pressure, including streamlines, is shown in Figure 6 as contour plots at mid-span of the lower cell row for three different time steps. It can be seen that the fast filling process within the first time steps t   = 0.001 s to 0.005 s results in an uneven distribution of the normalized static pressure throughout the single cells. The pressurization needs some time to proceed through the PACS, resulting in a delayed deformation of the cells and, hence, deflection of the cell row. The delay in pressure within the last cells is overcome after a certain time step of t   =   0.010   s . Here, the velocity direction of the main flow indicated by the streamlines also shows the end of a homogenization process resulting in recirculating zones in each cell, where the dynamic pressure is transferred in static pressure.
Figure 7 shows the normalized static pressure contour plot in a x-z view through the lower cell row for three different time steps. It can be seen that the fast filling process, initializing mass flow at the inlet duct, as seen in the top left of the figures, results in a second uneven pressurization of the cell rows. Within the first time steps t   = 0.001 s to 0.005 s , not much fluid is transported through the whole PACS system. The transient pressurization results in a diagonal filling, which can result in an uneven deflection of the HAR wing aileron.

3.1.2. Variation of Pressurization Time

Two scenarios with different pressurization times are analyzed. The baseline scenario (Section 3.1.1) is compared to a scenario with doubled actuation speed ( β ˙ = 42 ° /s), i.e., half pressurization time ( t   =   0.5   s ). The transient flow behavior turned out to be comparable for both of the pressurization scenarios. For faster filling speeds, locally increased flow velocities up to critical flow conditions inside the internal ducts lead to increased total pressure loss. The faster filling leads to higher temperatures, hence having an impact on material selection. Overall, the results show a potential for improving the internal flow by finding an optimal duct geometry (see Section 3.1.4).

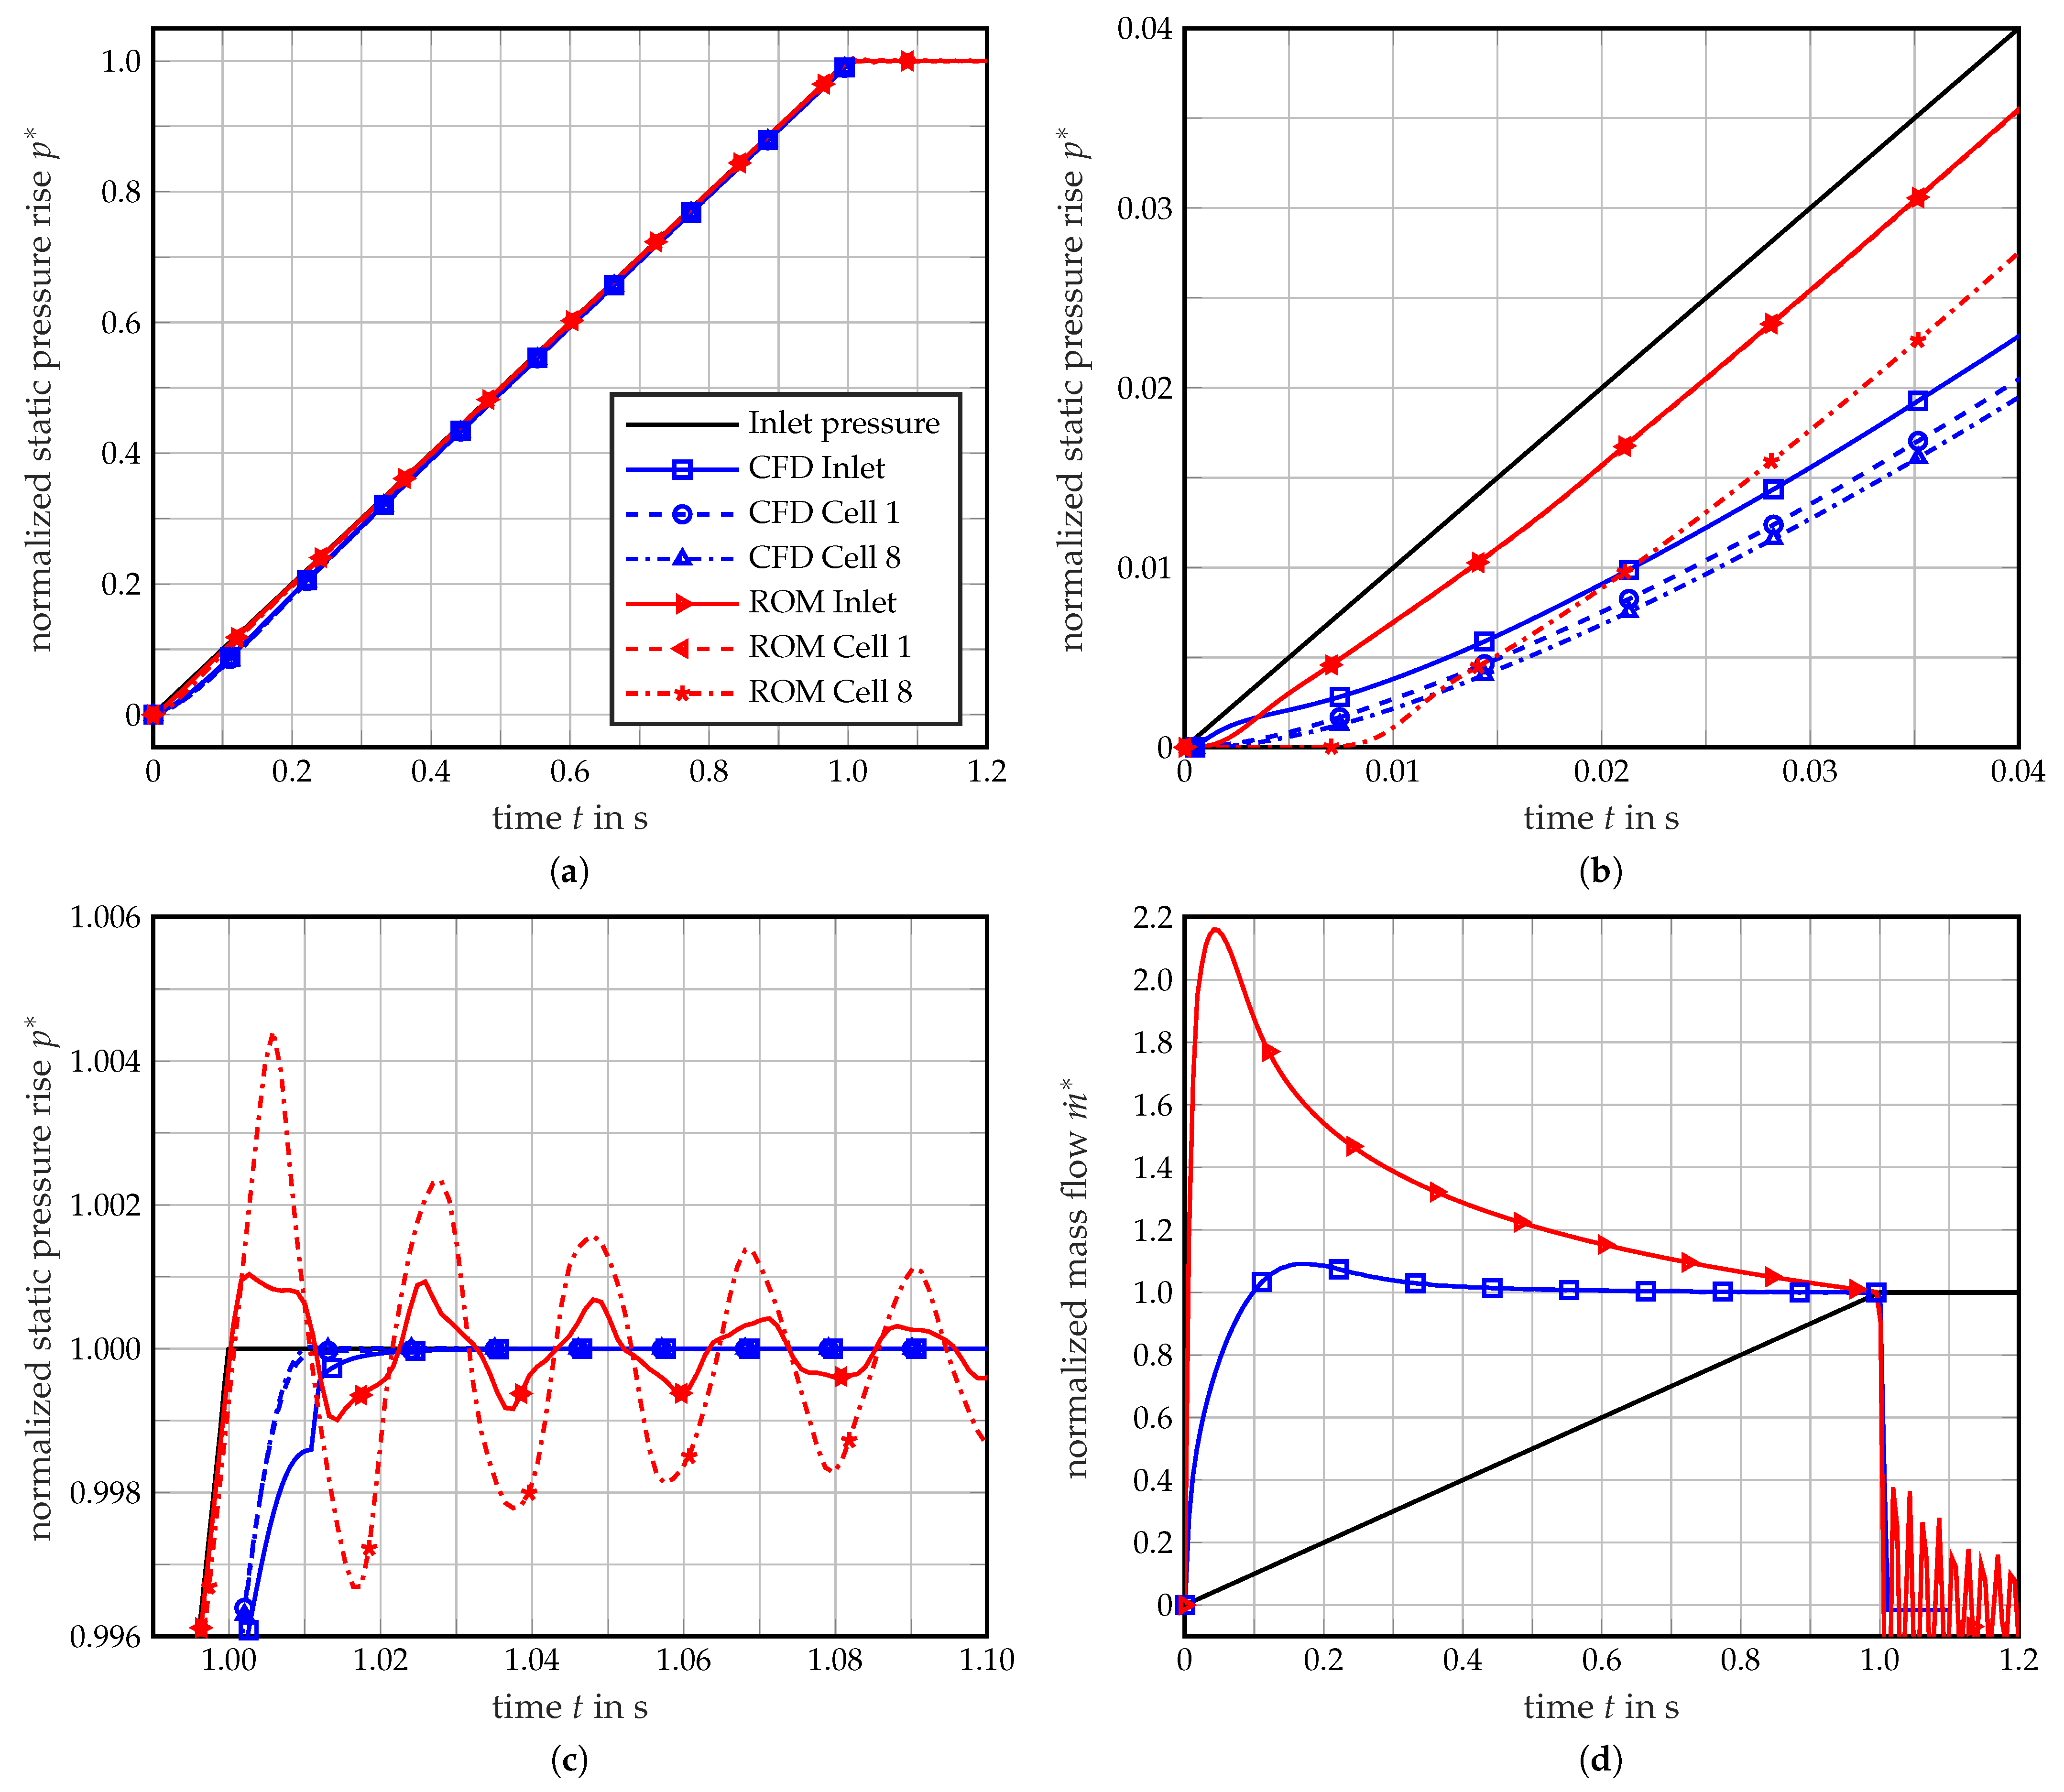
3.1.3. Pseudo Bond Graph Methodology vs. CFD

The three-dimensional time-dependent flow behavior is represented by a ROM using the Pseudo Bond Graph methodology. Figure 8 compares the filling process that was calculated with the spatially and time resolved CFD and the time resolved ROM simulation. The results have been normalized with the steady-state value at the end of the simulation duration. The overall performance of the filling process presented in Figure 8a is similar throughout the majority of the simulation time. However, the predicted behavior during the beginning (Figure 8b) and end (Figure 8c) of the filling process deviates significantly. On the one hand, the responsiveness of the ROM is much better when compared to CFD. On the other hand, a series of over- and undershoots occurs at the end of the simulation. These phenomena are both due to the reduced damping of the ROM. The highly three-dimensional flow characteristics with large vortices, as visible in Figure 7, are not accurately captured in the ROM. This accounts for large deviations at the start of the filling process as well as at the end. Furthermore, the ROM approach, which only considers 1/12th of the 3D-system as a simplification, cannot capture the highly three-dimensional character of the flow propagation visible in Figure 7a. Therefore, further efforts are required in the future to assess how to correct the single-passage ROM for 3D filling phenomena.

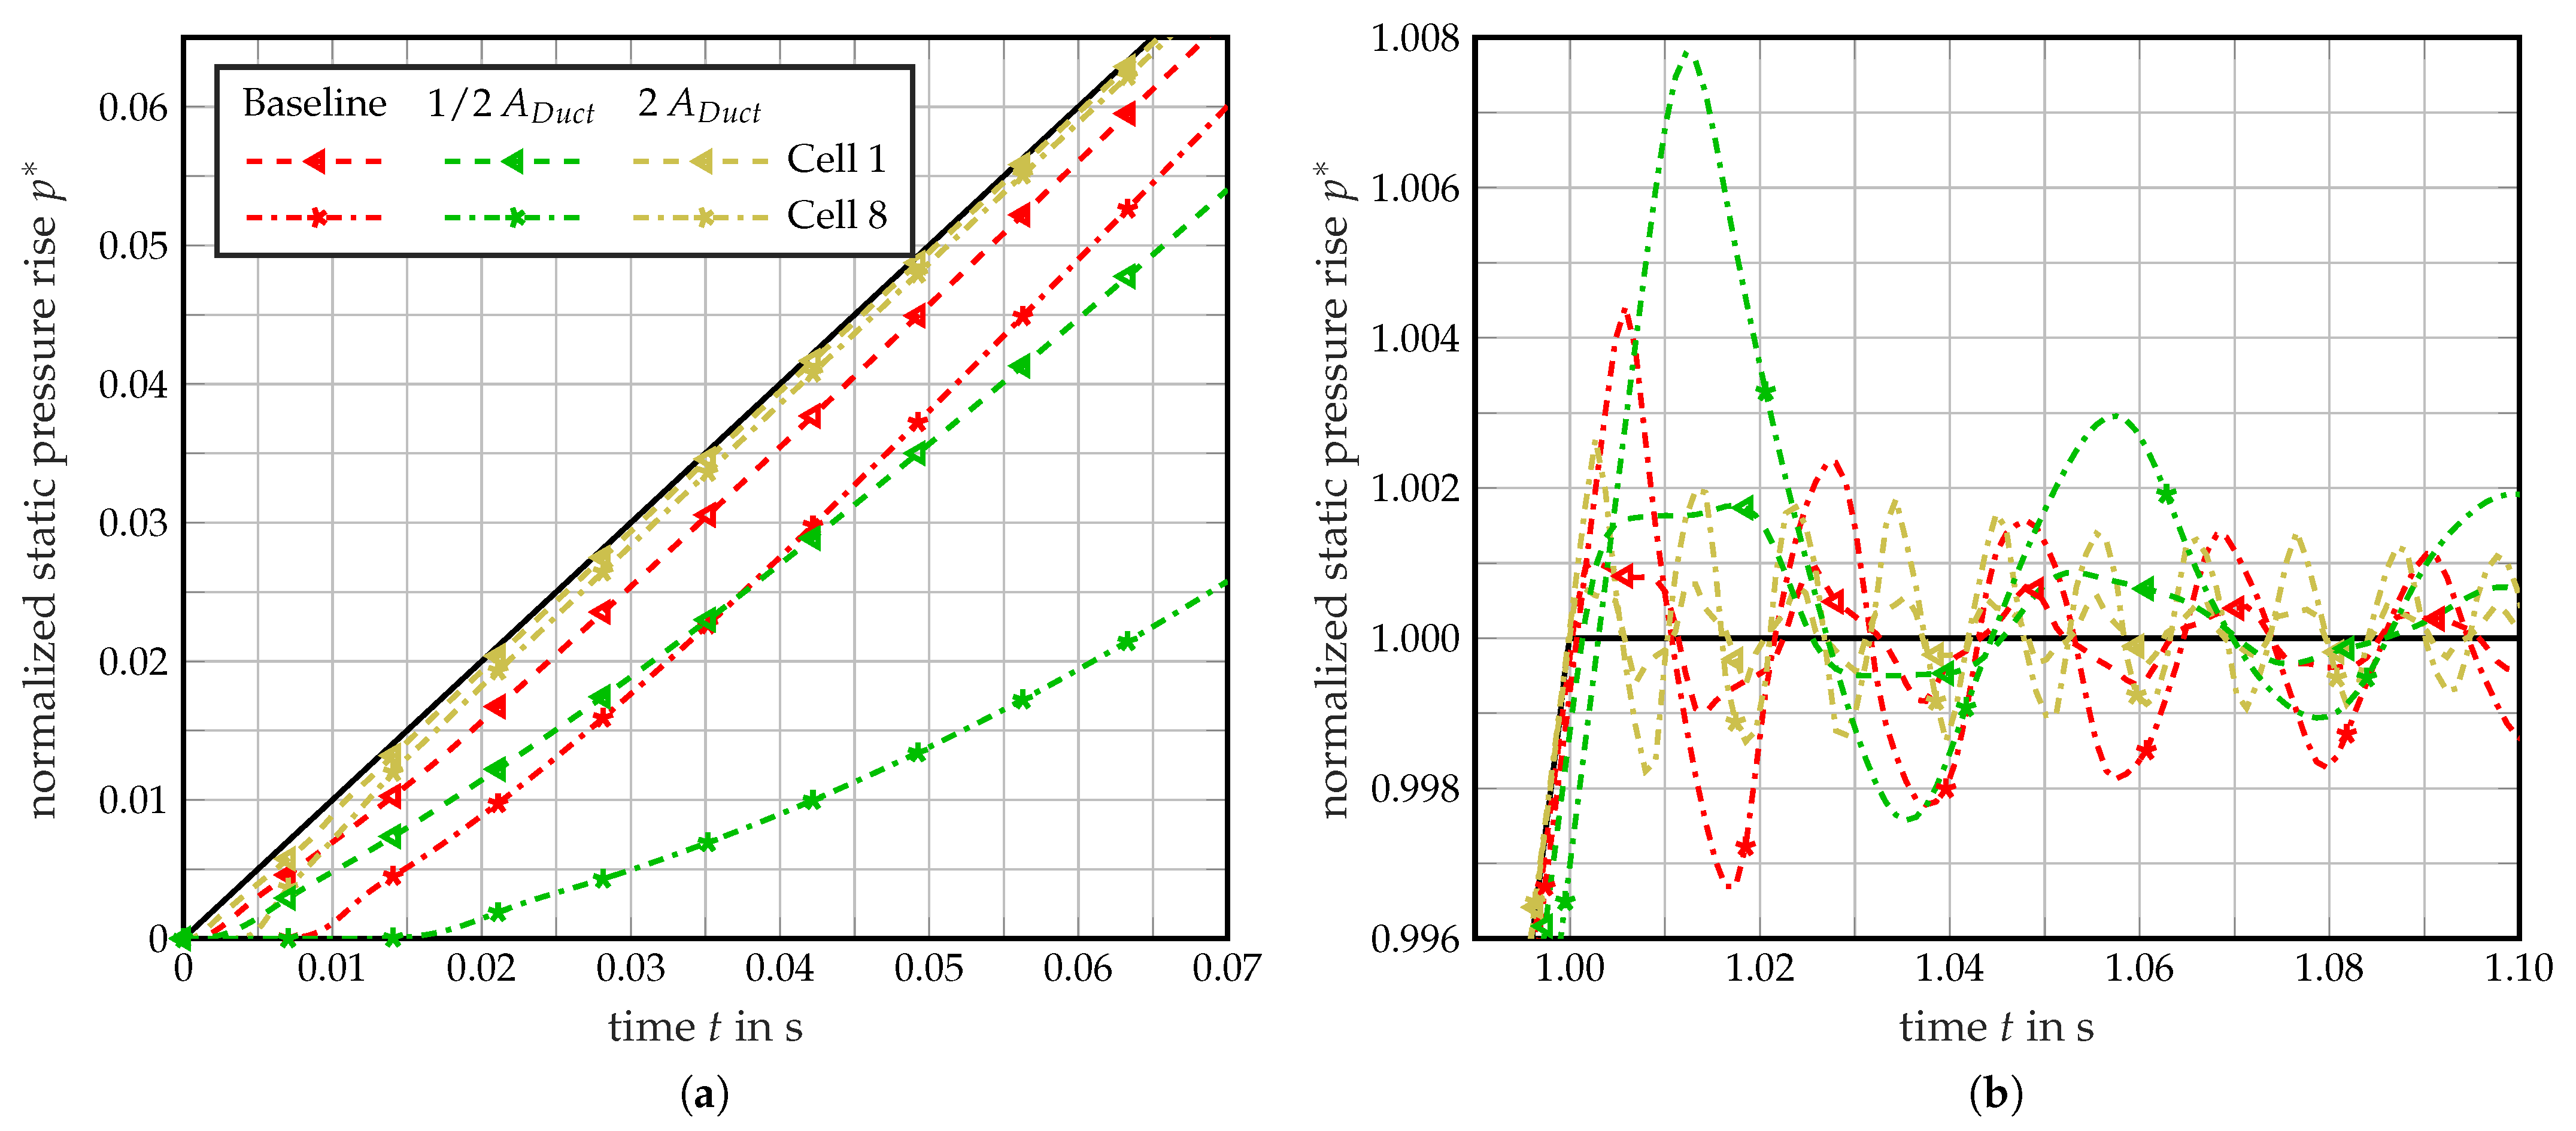
3.1.4. Comparison of Duct Cross-Section Geometries

A study on the influence of cross-sectional area of the connecting ducts is performed using the ROM. With short simulation run-times, this type of model is of good use for parameter studies. Therefore, the area of the connecting ducts has been doubled and halved in order to study the impact on the pressurization performance (Figure 9). The duct geometry significantly influences the performance of the pressure build up, both during the beginning and the end of the filling process. At the beginning, an increased area leads to almost immediate response of the pressure inside the cells with very small deviations between the first and the last cell. However, with reduced area, the initial delay is approximately doubled and the overall pressure gradient is smaller. At the end of the filling process, an increased duct area leads to less oscillation in the last cell, while a reduced area increases them significantly. Because this study has been conducted without the feedback loop from a structural perspective, evaluations of the feasibility regarding structural requirements will have to be conducted in the future.

3.2. Studies on Structural Behavior

3.2.1. Reduced-Order Truss Model vs. FEA

In this section, the results from the reduced-order truss model and the high-fidelity 2D finite element model are compared, characterizing the static deformation behavior of the PACS by varying internal and external loads. The PACS design is conducted for two design points at p r o w 1   =   [ 1   MPa , 0   MPa ] , p r o w 2   =   [ 0   MPa , 1   MPa ] and Δ β   =   [ 21 ° , 21 ° ] . Figure 10a shows the deformation of the PACS for a pressurization of only one cell row at a time. The figure demonstrates that the reduced-order truss model exactly predicts both of the design points. A comparison between the reduced-order truss model and the high-fidelity finite element model shows a difference in deflection of 12.8% for the first design point and 14.7% for the second design point. A smaller deflection is shown than in the FEA, as the reduced-order truss model neglects the deformation of the cell walls and does not consider the hinge transition zones.
Furthermore, the resistance of the structure against external aerodynamic loads is evaluated. Three load scenarios are considered. The baseline scenario with design loads from XFOIL is compared to a scenario with loads increased by a factor of 1.5 and to a scenario with zero aerodynamic loads. For each deformation state, the subsonic analysis tool XFOIL iteratively recalculates the aerodynamic pressure distribution. Neglecting the external loads leads to an increased deformation (dashed lines), since the aerodynamic loads counteract the deflection. Increasing the external loads by a factor of 1.5 reduces the deflection (dotted lines). The difference in deflection due to the 50% load increase amounts to 3.5%, respectively, 10.6% for both of the design points. The influence of the external loads is less pronounced at higher cell pressures, because higher pressures lead to a stiffening of the structure.
Figure 10b presents the angular deflection Δ β covering the entire operating envelope of the PACS. The surface plot is obtained for different pressure combinations in both cell rows from a total of 625 data points per calculation model. The figure indicates a deformation neutral line formed by the intersection with a plane through Δ β   =   0 ° . The cruise configuration is specified by an aileron deflection of 0° and, thus, can be achieved by any pressure combination on this line. A shift of this deformation neutral line towards small cell pressures in the lower cell row can be justified by a larger lever arm as compared to the bending neutral axis. In order to achieve a high resistance to external loads and, at the same time, allow for a fast deflection into both target shapes, the cruise design point is set to p r o w 1   =   0.8   MPa and p r o w 2   =   0.35   MPa .
Figure 10c shows an evaluation of the structural stresses for a pressurization of only the lower cell row, since this is the critical load condition. All other pressure combinations cause lower stresses, because pressurizing both cell rows counteracts the deformation, and less bending stresses are experienced by the flexural hinges. For the same reasons, an increase in aerodynamic loads results in lower structural stress. The maximum equivalent stress σ m a x that is caused by stress concentrations in the hinge transition regions is evaluated by means of FEA and normalized to the material strength R. A safety factor of 1.14 is achieved at the design point at p r o w 1   =   0   MPa and p r o w 2   =   1   MPa .

3.2.2. Pseudo Bond Graph Methodology vs. CFD

Figure 10d presents the angular deflection Δ β over time for the pressurization of the lower cell row with the upper row remaining at ambient conditions. In addition, the linear pressure rise at the inlet is plotted in black. A highly nonlinear deflection characteristic of the structure can be observed, even though the pressure rise is almost linear according to Figure 8a. Deviations between the reduced-order model and CFD simulation are limited to the initial deformation, where the ROM predicts a higher deflection due to the increased responsiveness. Howeber, at the end of the maneuver, discrepancies diminish due to the almost identical pressure rise as well as the stiffening characteristics of the PACS cells at near maximum pressure. The overshoots that are predicted by the ROM do not appear to have great influence on the deflection, as they are in the stiffening zone of the PACS, where angular deflections due to pressure changes diminish.

4. Discussion and Conclusions

The objective of this work is developing a multidisciplinary design methodology for PACS-driven morphing ailerons, with a focus on the transient dynamic behavior of the cellular structure. A challenge with HAR wings is the small installation space, especially near the wingtip or in the FWT. In the scope of this paper, the almost arbitrary scalability of PACS to the limited installation space at a wing trailing edge is demonstrated. Decisive design aspects for an overall PACS system are pointed out in the context of a future wind tunnel test. The resistance of the structure to changing external loads on the one hand and the dynamic performance of the flight control surface on the other are the main research questions. Two reduced-order models are developed to assess both questions: one for the structural design and one for the simulation of the flow inside the structure.
A characterization of the PACS deflection under varying external loads shows a high structural stiffness, which is more pronounced with increasing internal pressure. Using the PACS design tool that is based on a reduced-order truss model, feasible deformations are calculated for the entire operating envelope. For each deformation state, the subsonic analysis tool XFOIL iteratively recalculates the aerodynamic loads. A load increase of 50% results in a change of deflection angle of 3.5% to 10.6% for the two target shapes. For the cruise configuration, a pressure state of p r o w 1   =   0.8   MPa and p r o w 2   =   0.35   MPa is identified, as it provides high structural stiffness and simultaneously allows for rapid actuation into both target shapes.
Numerical verification utilizing FEA shows that the reduced-order truss model predicts 12.8% to 14.7% lower deflection. The deviations result from the model assumptions of rigid cell walls and the neglect of hinge transition zones. Comparing the results presented here with the variable-camber PACS wing of Gramüller et al. shows an increased model accuracy resulting from the improved hinge alignment in the tetragonal cell design. The relative deviation in the publication of Gramüller et al. ranges from 15.1% to 79.9% between the reduced-order truss model and FEA for both target shapes [26]. A similar improvement due to the tetragonal cell design over the pentagonal one is also shown in [30]. An extended calculation approach that is presented by Pagitz et al. further increases the prediction accuracy by taking the cell wall compliance into account [39]. The subject of the current work is the design of flexure hinges considering manufacturing constraints that are specific to automated textile fabrication [34]. Based on these findings, an improved modeling approach can be implemented to account for the hinge transition geometry.
The presented results from the flow simulation inside the pressure-driven structure allow for the assessment of its dynamic performance. A multi-functional aileron with the capability of active load alleviation and flutter suppression places high demands on actuating speeds. The response time of the PACS actuator is mainly limited by the transient pressurization process, which is investigated with state of the art CFD simulations. Calculations of the most unfavorable operating points show that a deflection rate of β ˙ = 42 ° /s is achievable in the entire operating range. In all cases, inflation from ambient pressure to the maximum cell pressure is considered and, thus, an actuator deflection from the neutral position to the maximum deflection angle of Δ β   =   21 ° . However, during flight operations, there is always a certain internal pressure to maintain structural stiffness (cf. cruise configuration). In addition, full actuator deflection is not necessary for the purpose of gust load alleviation and deflections angles are therefore limited to ±10° in this case [32]. With these adjustments and while taking improvements in the flow channel geometry into account, the authors consider the operation of PACS as a highly dynamic gust load alleviation system as feasible. Further investigations on higher deflection rates for load alleviation and flutter suppression are part of the current work.
The results from CFD calculations point out the transient behavior of the pressurization, leading to a transient, non-uniform aileron deflection. Local critical flow conditions can be observed in the inlet duct between the piping and the first cell for the fastest filling process investigated. Because the study presented here has so far neglected the fluid–structure interaction, the influence of dynamic pressure from the airflow around the model, and the connection to the upper cell row, the results should be verified using an enhanced CFD model. Dynamic effects from structural damping and inertia are also to be investigated in the future.
The authors introduce a reduced-order model that is based on the Pseudo Bond Graph methodology enabling efficient flow simulation. Thus, the application of the Pseudo Bond Graph method allows the calculation of a large number of conceptual variants for the optimization of the internal flow using minimal computational resources. In future research, the flow simulation will be extended to include fluid–structure interaction. The Bond Graph methodology will provide a good basis, as it clearly specifies the interconnections of the fluid and structural domains via corresponding 1- and 0-junctions. Thus, the consideration of variable volumes in the Pseudo Bond Graph model with corresponding models of structural stiffness, like beams representing the PACS structure, are going to be incorporated. A more detailed discretization in the third dimension allows for representing the diagonal flow component during the filling process. In addition, losses due to three-dimensional flow effects encountered in the CFD simulations have to be modeled. Finally, the enhanced model accounting for fluid–structure interaction has to be extended by external aerodynamic forces. These forces can either be generated by XFOIL for steady-state loads or by unsteady CFD for time-varying loads, like gusts.
The realization of the wind tunnel model requires the design of further components. These include the elastic skin at the lower surface and the main wing, together with sensor technology, like static pressure taps and force measurement. A review on approaches for elastic skins can be found in [6]. Moreover, the axial cell closure is to be designed for the given PACS structure. A method for determining the shape of a deformation supportive end cap for PACS is described in [27]. Future research includes the development of a holistic system architecture that considers the pressure supply in the overall aircraft system. Next to performance-related studies, the backlash between PACS and the pressure supply system is investigated by extending the Pseudo Bond Graph method to include these components.

Author Contributions

Conceptualization, P.M., C.B., C.H. and J.F.; methodology, P.M., C.B., S.L. and T.S.; software, P.M., S.L. and T.S.; validation, P.M., C.B. and S.L.; formal analysis, P.M., C.B., S.L. and T.S.; investigation, P.M., C.B., S.L. and T.S.; resources, C.H., J.F. and M.S.; data curation, P.M. and C.B.; writing—original draft preparation, P.M., C.B. and S.L.; writing—review and editing, P.M., C.B., S.L., T.S., C.H., J.F. and M.S.; visualization, P.M., C.B., S.L. and T.S.; supervision, C.H., J.F. and M.S.; project administration, P.M., C.B. and C.H.; funding acquisition, C.H., J.F. and M.S. All authors have read and agreed to the published version of the manuscript.

Funding

This research was funded by the Deutsche Forschungsgemeinschaft (DFG, German Research Foundation) Grant No. 280656304. The APC was funded by the German Research Foundation and the Open Access Publication Funds of Technische Universität Braunschweig.

Acknowledgments

The authors thank Jan Göing for sharing his insight into the Pseudo Bond Graph theory and Hendrik Traub for helpful discussions on the topic of PACS, which greatly improved this manuscript.

Conflicts of Interest

The authors declare no conflict of interest. The funders had no role in the design of the study; in the collection, analyses, or interpretation of data; in the writing of the manuscript, or in the decision to publish the results.

Abbreviations

The following abbreviations are used in this manuscript:
ASTORAircraft engine simulation for transient operation research
CFDComputational fluid dynamics
FEAFinite element analysis
FRPFiber reinforced plastic
FWTFolding wingtip
GFRPGlass-fiber reinforced plastic
HARHigh aspect ratio
PACSPressure-actuated cellular structure
ROMReduced-order model

Nomenclature

The following nomenclature is used in this manuscript:
ACross-sectional area
A O A Angle of attack
C, C T Capacitive or thermal storage
c p , c v Specific heat capacity
EYoung’s modulus
E ˙ Energy flow
eEffort
E I Flexural stiffness
fFlow
h h , h w Hinge or cell wall thickness
IInertia storage
i, oIncoming or outgoing
lHinge length
m ˙ Mass flow
M a Mach number
nNumber of cells
p, p t Static or total pressure
Q ˙ Heat flow
RResistor
RTensile strength
R e Reynolds number
r o w 1 , r o w 2 Upper or lower cell row
T, T t Static or total temperature
T u Turbulence intensity
tTime
uHinge angle
VVolume
V ˙ Volume flow
vVelocity
y + Wall distance
β ˙ Deflection rate
Δ p t , Δ T t Total pressure or total temperature rise
Δ u Hinge deflection
Δ α Angular deflection per cell
Δ β Total angular deflection
ζ Hinge eccentricity
ν Poisson’s ratio
ρ Density
σ m a x Maximum equivalent stress

References

  1. Afonso, F.; Vale, J.; Oliveira, É.; Lau, F.; Suleman, A. A review on non-linear aeroelasticity of high aspect-ratio wings. Prog. Aerosp. Sci. 2017, 89, 40–57. [Google Scholar] [CrossRef]
  2. Cheung, R.C.M.; Rezgui, D.; Cooper, J.E.; Wilson, T. Testing of Folding Wingtip for Gust Load Alleviation of Flexible High-Aspect-Ratio Wing. J. Aircr. 2020, 57, 876–888. [Google Scholar] [CrossRef]
  3. Pattinson, J.; Wilson, T.; Herring, M. High Fidelity Simulation of the Folding Wing Tip for Loads Alleviaton. In Proceedings of the International Forum on Aeroelasticity and Structural Dynamics (IFASD 2015), Petersburg, Russia, 28 June–2 July 2015; IFASD, Ed.; Curran Associates: Red Hook, NY, USA, 2015; pp. 805–820. [Google Scholar]
  4. Airbus, S.A.S. Wing of the Future: No Winging It Here. 2017. Available online: https://www.airbus.com/newsroom/news/en/2017/01/Wings-of-the-future.html (accessed on 16 February 2021).
  5. Sanders, B.; Eastep, F.E.; Forster, E. Aerodynamic and Aeroelastic Characteristics of Wings with Conformal Control Surfaces for Morphing Aircraft. J. Aircr. 2003, 40, 94–99. [Google Scholar] [CrossRef]
  6. Thill, C.; Etches, J.; Bond, I.; Potter, K.; Weaver, P.M. Morphing skins. Aeronaut. J. 2008, 112, 117–139. [Google Scholar] [CrossRef]
  7. Sinapius, M.; Monner, H.P.; Kintscher, M.; Riemenschneider, J. DLR’s Morphing Wing Activities within the European Network. Procedia IUTAM 2014, 10, 416–426. [Google Scholar] [CrossRef] [Green Version]
  8. Kintscher, M.; Wiedemann, M.; Monner, H.P.; Heintze, O.; Kühn, T. Design of a smart leading edge device for low speed wind tunnel tests in the European project SADE. Int. J. Struct. Integr. 2011, 2, 383–405. [Google Scholar] [CrossRef]
  9. Kota, S.; Flick, P.; Collier, F.S. Flight Testing of FlexFloil™Adaptive Compliant Trailing Edge. In Proceedings of the 54th AIAA Aerospace Sciences Meeting, San Diego, CA, USA, 4–8 January 2016; American Institute of Aeronautics and Astronautics: Reston, VA, USA, 2016. [Google Scholar] [CrossRef]
  10. Barrett, R.M. Active aeroelastic tailoring of an adaptive Flexspar stabilator. Smart Mater. Struct. 1996, 5, 723–730. [Google Scholar] [CrossRef]
  11. Elzey, D.M.; Sofla, A.Y.N.; Wadley, H.N.G. A bio-inspired, high-authority actuator for shape morphing structures. In Proceedings of the Smart Structures and Materials 2003: Active Materials: Behavior and Mechanics, San Diego, CA, USA, 3–6 March 2003; Lagoudas, D.C., Ed.; SPIE: Bellingham, WA, USA, 2003; pp. 92–100. [Google Scholar] [CrossRef]
  12. Barbarino, S.; Bilgen, O.; Ajaj, R.M.; Friswell, M.I.; Inman, D.J. A Review of Morphing Aircraft. J. Intell. Mater. Syst. Struct. 2011, 22, 823–877. [Google Scholar] [CrossRef]
  13. Li, S.; Wang, K.W. Plant-inspired adaptive structures and materials for morphing and actuation: A review. Bioinspir. Biomimet. 2017, 12, 011001:1–011001:17. [Google Scholar] [CrossRef]
  14. Huber, J.E.; Fleck, N.A.; Ashby, M.F. The selection of mechanical actuators based on performance indices. Proc. R. Soc. A Math. Phys. Eng. Sci. 1997, 453, 2185–2205. [Google Scholar] [CrossRef]
  15. Barrett, R.M.; Barrett, C.M. Biomimetic FAA-certifiable, artificial muscle structures for commercial aircraft wings. Smart Mater. Struct. 2014, 23, 074011:1–074011:15. [Google Scholar] [CrossRef]
  16. Dittrich, K. Cellular Actuator Device and Methods of Making and Using Same. U.S. Patent US7055782B2, 6 June 2006. [Google Scholar]
  17. Vos, R.; Barrett, R.M. Mechanics of pressure-adaptive honeycomb and its application to wing morphing. Smart Mater. Struct. 2011, 20, 094010. [Google Scholar] [CrossRef]
  18. Vasista, S.; Tong, L. Topology-Optimized Design and Testing of a Pressure-Driven Morphing-Aerofoil Trailing-Edge Structure. AIAA J. 2013, 51, 1898–1907. [Google Scholar] [CrossRef]
  19. Luo, Q.; Tong, L. Adaptive pressure-controlled cellular structures for shape morphing I: Design and analysis. Smart Mater. Struct. 2013, 22, 055014:1–055014:16. [Google Scholar] [CrossRef]
  20. Lv, J.; Ren, X.; Song, C.; Zhang, H. Two-Scale Topology Optimization of the 3D Plant-Inspired Adaptive Cellular Structures for Morphing Applications. J. Aerosp. Eng. 2020, 33, 04020032. [Google Scholar] [CrossRef]
  21. Vasista, S.; Riemenschneider, J.; Mendrock, T.; Monner, H.P. Pressure-Driven Morphing Devices for 3D Shape Changes with Multiple Degrees-of-Freedom. In Proceedings of the ASME 2018 Conference on Smart Materials, Adaptive Structures and Intelligent Systems, San Antonio, TX, USA, 10–12 September 2018; American Society of Mechanical Engineers: Fairfield, NY, USA, 2018; pp. 1–11. [Google Scholar]
  22. Boyraz, P.; Runge, G.; Raatz, A. An Overview of Novel Actuators for Soft Robotics. Actuators 2018, 7, 48. [Google Scholar] [CrossRef] [Green Version]
  23. Hühne, C.; Boblenz, J.; Meyer, P. Cellular Structures Actuated by Internal Pressure and Variable in Shape. In Adaptronics—Smart Structures and Materials; Sinapius, M., Ed.; Springer: Berlin, Germany, 2021; pp. 189–204. [Google Scholar]
  24. Pagitz, M.; Lamacchia, E.; Hol, J.M.A.M. Pressure-actuated cellular structures. Bioinspir. Biomimet. 2012, 7, 016007:1–016007:19. [Google Scholar] [CrossRef]
  25. Gramüller, B.; Boblenz, J.; Hühne, C. PACS—Realization of an adaptive concept using pressure actuated cellular structures. Smart Mater. Struct. 2014, 23, 115006:1–115006:17. [Google Scholar] [CrossRef]
  26. Gramüller, B.; Köke, H.; Hühne, C. Holistic design and implementation of pressure actuated cellular structures. Smart Mater. Struct. 2015, 24, 125027:1–125027:28. [Google Scholar] [CrossRef]
  27. Gramüller, B.; Tempel, A.; Hühne, C. Shape-variable seals for pressure actuated cellular structures. Smart Mater. Struct. 2015, 24, 095005:1–095005:20. [Google Scholar] [CrossRef]
  28. Adami, M.; Seibel, A. On-Board Pneumatic Pressure Generation Methods for Soft Robotics Applications. Actuators 2019, 8, 2. [Google Scholar] [CrossRef] [Green Version]
  29. Vasista, S.; Titze, M.; Schäfer, M.; Bertram, O.; Riemenschneider, J.; Monner, H.P. Structural and Systems Modelling of a Fluid-driven Morphing Winglet Trailing Edge. In Proceedings of the AIAA Scitech 2020 Forum, Orlando, FL, USA, 6–10 January 2020; American Institute of Aeronautics and Astronautics: Reston, VA, USA, 2020; pp. 1–19. [Google Scholar] [CrossRef]
  30. Gramüller, B.; Hühne, C. Enhanced design methods for pressure actuated cellular structures and evaluation. In Proceedings of the SAMPE Long Beach 2016, Long Beach, CA, USA, 23–26 May 2016. [Google Scholar]
  31. Vechtel, D.; Hauber, B.; Looye, G. Analysis of a multi-functional high-lift system driven by an active differential gear box. CEAS Aeronaut. J. 2014, 5, 227–238. [Google Scholar] [CrossRef]
  32. Xu, J.; Kroo, I. Aircraft Design with Active Load Alleviation and Natural Laminar Flow. J. Aircr. 2014, 51, 1532–1545. [Google Scholar] [CrossRef]
  33. Gern, F.H.; Inman, D.J.; Kapania, R.K. Computation of Actuation Power Requirements for Smart Wings with Morphing Airfoils. AIAA J. 2005, 43, 2481–2486. [Google Scholar] [CrossRef]
  34. Meyer, P.; Boblenz, J.; Sennewald, C.; Vorhof, M.; Hühne, C.; Cherif, C.; Sinapius, M. Development and Testing of Woven FRP Flexure Hinges for Pressure-Actuated Cellular Structures with Regard to Morphing Wing Applications. Aerospace 2019, 6, 116. [Google Scholar] [CrossRef] [Green Version]
  35. Göing, J.; Kellersmann, A.; Bode, C.; Friedrichs, J. Jet Propulsion Engine Modelling Using Pseudo Bond Graph Approach. In Proceedings of the ASME Turbo Expo 2019: Turbomachinery Technical Conference and Exposition, Phoenix, AZ, USA, 17–21 June 2019; American Society of Mechanical Engineers: Fairfield, NY, USA, 2019; pp. 1–11. [Google Scholar] [CrossRef]
  36. Lück, S.; Göing, J.; Bode, C.; Friedrichs, J. Pseudo Bond Graph System Modelling of Electric Air Compressors With Energy Recovery for Fuel Cell Applications. In Proceedings of the ASME Turbo Expo 2020: Turbomachinery Technical Conference and Exposition, London, UK, 22–26 June 2020; American Society of Mechanical Engineers: Fairfield, NY, USA, 2020; pp. 1–12. [Google Scholar] [CrossRef]
  37. Margolis, D.L. Bond Graph Fluid Line Models for Inclusion with Dynamic Svstems Simulations. J. Frankl. Inst. 1979, 308, 255–268. [Google Scholar] [CrossRef]
  38. Karnopp, D.; Margolis, D.L.; Rosenberg, R.C. System Dynamics: Modeling, Simulation, and Control of Mechatronic Systems, 5th ed.; Wiley: Hoboken, NJ, USA, 2012. [Google Scholar]
  39. Pagitz, M.; Leine, R.I. Shape optimization of compliant pressure actuated cellular structures. Int. J. Non Linear Mech. 2017, 94, 268–280. [Google Scholar] [CrossRef] [Green Version]
Figure 1. Wind tunnel model of a morphing aileron based on pressure-actuated cellular structures (PACS): (a) Model with two PACS actuators and a total width of 1300 mm, integrated in wind tunnel test section. (b) Cutout of one actuator section.
Aerospace 08 00089 g001
Figure 2. NACA 0012 airfoil with integrated PACS. The actuated surface extents from 65% to 85% chord. The detail views show the PACS dimensions and the design parameters of the flexure hinges.
Aerospace 08 00089 g002
Figure 3. Target shapes for Δ β 1   =   21 ° and Δ β 2   =   21 ° : (a) Deformed PACS cross section and definition of performance driven design parameters. (b) Aerodynamic loads (lift coefficient C L , drag coefficient C D and pressure coefficient C p ) calculated with XFOIL for M a   =   0.172 , R e   =   3.754   ×   10 6 and A O A   =   0 ° .
Aerospace 08 00089 g003
Figure 4. Fluid distribution within the cellular structure: (a) Detailed 3D model of the PACS actuator with 500 mm depth. Flow channels and mounting interface are structurally integrated. (b) Polyhedron mesh of the lower cell row for computational fluid dynamics (CFD), with side cut through second cell.
Aerospace 08 00089 g004
Figure 5. Schematic drawing of the internal flow of a PACS structure in Pseudo Bond Graph notation.
Aerospace 08 00089 g005
Figure 6. Normalized static pressure distribution for the fast filling process in x-y plane view at mid-span at different time steps: (a) t   =   0.001   s . (b) t   =   0.005   s . (c) t   =   0.010   s .
Aerospace 08 00089 g006
Figure 7. Normalized static pressure distribution for the fast filling process in x-z plane view at different time steps: (a) t   =   0.001   s . (b) t   =   0.005   s . (c) t   =   0.010   s .
Aerospace 08 00089 g007
Figure 8. Comparison of CFD and reduced-order model (ROM) filling processes: (a) Normalized pressure rise p * during overall filling process. (b) Start of filling process. (c) End of filling process. (d) Normalized mass flow m ˙ * at inlet.
Aerospace 08 00089 g008
Figure 9. Scaling of duct cross-sectional area ADuct using the ROM: (a) Start of filling process. (b) End of filling process.
Aerospace 08 00089 g009
Figure 10. Structural characterization of the PACS actuator and comparison of results from the reduced-order and highfidelity model: (a) Angular deflection Δβ for a pressurization of only one cell row, while the pressure in the other cell row is set to zero. The aerodynamic loads are varied between zero and 1.5 times the design loads. (b) Angular deflection Δβ for arbitrary pressure combinations in both cell rows at aerodynamic design loads. (c) Maximum stress σmax normalized to the material strength R for a pressurization of only the lower cell row. (d) Temporal angular deflection Δβ during the inflation maneuver, comparing Pseudo Bond Graph and CFD results (deflection calculation based on solid red line in (a) for pressurizing only the lower cell row).
Aerospace 08 00089 g010
Table 1. PACS design parameters for the reduced-order truss model.
CategoryParameterValue
GeometryNumber of cells nupper row: 7, lower row: 8
Size of the first cell32 mm
Taper factor0.75
Cell wall thickness h w 3.0   mm
Hinge thickness h h 0.26   mm
Hinge length l h 3.0   mm
Hinge eccentricity ζ 3.5   mm
PerformanceMaximum cell pressure p m a x 1.0   MPa
Angular deflection per cell Δ α ±3°
Total angular deflection Δ β ±21°
MaterialYoung’s modulus E42,000 MPa
Tensile strength R1200 MPa
Poisson’s ratio ν 0.29
Publisher’s Note: MDPI stays neutral with regard to jurisdictional claims in published maps and institutional affiliations.

