Article

Constrained Urban Airspace Design for Large-Scale Drone-Based Delivery Traffic

1
Control and Simulation, Faculty of Aerospace Engineering, Delft University of Technology, Kluyverweg 1, 2629 HS Delft, The Netherlands
2
Transport and Planning, Faculty of Civil Engineering and Geosciences, Delft University of Technology, Stevinweg 1, 2628 CN Delft, The Netherlands
*
Author to whom correspondence should be addressed.
Aerospace 2021, 8(2), 38; https://doi.org/10.3390/aerospace8020038
Submission received: 11 December 2020 / Revised: 21 January 2021 / Accepted: 25 January 2021 / Published: 1 February 2021

Abstract

:
Large-scale adoption of drone-based delivery in urban areas promise societal benefits with respect to emissions and on-ground traffic congestion, as well as potential cost savings for drone-based logistic companies. However, for this to materialise, the ability of accommodating high volumes of drone traffic in an urban airspace is one of the biggest challenges. For unconstrained airspace, it has been shown that traffic alignment and segmentation can be used to mitigate conflict probability. The current study investigates the application of these principles to a highly constrained airspace. We propose two urban airspace concepts, applying road-based analogies of two-way and one-way streets by imposing horizontal structure. Both of the airspace concepts employ heading-altitude rules to vertically segment cruising traffic according to their travel direction. These airspace configurations also feature transition altitudes to accommodate turning flights that need to decrease the flight speed in order to make safe turns at intersections. While using fast-time simulation experiments, the performance of these airspace concepts is compared and evaluated for multiple traffic demand densities in terms of safety, stability, and efficiency. The results reveal that an effective way to structure drone traffic in a constrained urban area is to have vertically segmented altitude layers with respect to travel direction as well as horizontal constraints imposed to the flow of traffic. The study also makes recommendations for areas of future research, which are aimed at supporting dynamic traffic demand patterns.

1. Introduction

The current advancement in unmanned aerial vehicles, which is commonly referred to as drones, has potential applications in agriculture, research, inspection, health-care, urban air mobility [1,2,3,4,5,6,7], and logistics, especially in the transport of small express packages of consumer goods and fast-food meals within cities [8,9,10,11]. Recently, this demand has been exemplified by commercial logistics companies conducting drone delivery test flights in dense urban areas [12,13]. One reason for this interest is the potential environmental benefit [14] and the attractive economics of drone-based delivery [15,16]. However, if the large-scale adoption of drone-based delivery does begin to unfold, safely organising such traffic in the low altitude urban airspace, which is highly constrained by existing street networks and buildings, will be one of the main challenges to overcome.
In order to cope with the future demand for drone-based services, previous research, such as the Metropolis project, has demonstrated that vertically segmenting the airspace in order to separate cruising traffic with respect to travel directions at different altitudes, leads to high levels of safety [17,18]. The study revealed that two factors, segmentation of traffic and the reduction of relative velocities (i.e., alignment of traffic), between cruising traffic at the same altitude were the main contributors to lowering the conflict probability and, thus, an increase in airspace safety [19]. In a follow-up study, these principles were formalised in a concept, called Geovectoring, as a means to define airspace designs [20,21]. However, all of these past studies have been limited to unconstrained airspace environments, which is, airspace above buildings or free of any built-up areas.
Other recent studies have investigated different risk-based path-planning algorithms for drones in constrained urban environments [22,23,24]. Studies have also been done in finding the optimal three-dimensional (3D) paths with respect to the locations of charging stations for a limited number of drones in built-up areas [25]. While a fair amount of work has been done in proposing airway routes for drones in cities [23], they are mainly policy-based studies. Further, unmanned traffic management programs, such as U-Space, are supporting the use of four-dimensional (4-D) trajectory and detect-and-avoid technologies to navigate the urban environment [26].
This study will investigate approaches to structure the urban airspace to facilitate large-scale drone delivery traffic by applying the principles of traffic alignment and segmentation to a constrained urban area. For this purpose, two en-route urban airspace concepts will be presented: a two-way and one-way concept. By using fast-time simulations, the performance of the two concepts are compared for multiple traffic demand scenarios with respect to safety, stability, and efficiency metrics.
The research that is described in this study is performed within the context of a futuristic drone-based delivery mission. This is done in order to mimic one example of a potential scenario for autonomous flying entities operating in a constrained urban environment in high traffic densities, which allows for evaluating and comparing the two airspace concepts. Drone-based delivery is just one side of the spectrum of potential users of the urban airspace. There also exist other candidates, such as flying taxis [7], which may also manifest in high traffic densities. Therefore, the aim of this research is not to provide an operational-ready urban airspace design solution for a particular type of drone; instead, the study focuses on the effect of high traffic densities and how it may influence the constrained urban airspace concepts.
The remainder of this paper is structured, as follows: Section 2 outlines essential background material. Section 3 and Section 4 present the methodology of the study. In particular, Section 3 describes the design of the two urban airspace concepts for constrained environments and Section 4 explains the simulation set-up that was used to compare the performance of the concepts. In Section 5, we present the results of the simulations. We then discuss the key findings, outline the limitations of the study, and present avenues for future research in Section 6. Finally, Section 7 summarises the main conclusions of this study.

2. Background

In this section, a summary of relevant background material is presented. The section begins with a quick overview of common traffic structuring concepts found in manned aviation and road-based transport. Next, a description of the relationship between conflicts and intrusions is given. Thereafter, we discuss how traffic segmentation and alignment help to mitigate conflict probability and how they can be applied to a constrained environment.

2.1. Airspace Structure

The function of airspace structure is to provide a priori separation and the organisation of traffic [17,18,27]. The hemispheric rule is a widely used airspace structuring example found in manned aviation. This rule ensures that cruising aircraft above flight level FL240 with respective travel directions in ranges of 000–089 and 090–179 are assigned to odd flight-levels in multiples of 10, while cruising aircraft with headings between 180–269 and 270–360 are also allocated to fly at even flight-levels in multiples of 10 [28,29]. Similar to the hemispheric rule, there also exists a more finer-grained airspace concept known as the quadrantal rule, which is enforced within the altitude range of 3000 ft to FL240 [28]. In the quadrantal rule, aircraft with headings between 000–089 are required to fly at odd altitudes in multiples of 1000 ft , while aircraft with headings 090–179 are instructed to also fly at odd altitudes in multiples of 1500 ft [28]. Similarly, flights with headings between 180–269 must utilise even altitudes in multiples of 1000 ft , while flights with headings in the range of 270–359 are allocated to fly at even altitudes in multiples of 1500 ft [28]. Both methods of airspace structure lead to lower conflict probability and thus higher airspace safety and capacity. Note that the hemispheric rule is similar to the ’layers’ airspace concept in the Metropolis study, which promoted traffic alignment and segmentation [17,18].

2.2. Road and Street Structure

Road and urban street networks contain a great deal of structure that is largely shaped by the physical layout of cities [30]. Current road and street networks are primarily structured with channelisation planes, which define flow paths for traffic using road markings, islands, and raised medians [31]. Such structuring modes help to lower the occurrence of conflicts, especially at intersections where conflicts are widely prevalent [31,32]. These measures also help to define and segregate two-way and one-way streets (see Figure 1), which are proven techniques for increasing the safety and throughput of the street network [31,33].

2.3. Conflicts and Intrusions

The number of conflicts and intrusions are important metrics that describe the safety of an airspace. An intrusion, i.e., a loss of separation, occurs when the separation requirements, both in the horizontal and vertical plane between aircraft, are violated. In contrast, a conflict, which is defined as a predicted loss of separation, occurs when the horizontal and vertical separation distances between two aircraft, in this case, drones, are expected to be less than the established separation requirements within a prescribed ’look-ahead’ time. This means that a conflict is an expected/anticipated intrusion (see Figure 2).

2.4. Traffic Segmentation and Alignment

The effect of traffic segmentation and alignment can aptly be described while using the mathematical combinatorics that are expressed by Equation (1), which has been extensively validated in recent airspace studies [19,20].
C R g l o b a l = 1 2 N ( N 1 ) p 2
Using the above equation, it can be seen that, for a given volume of airspace, increasing the number of possible drone combinations (N) causes a quadratic increase in the global conflict rate ( C R ) or conflict probability. Increasing the probability of conflict of possible drone combinations ( p 2 ) increases C R linearly.
The parameters N and p 2 influence the conflict probability of the airspace structure. Therefore, the conflict probability can be mitigated by effectively decreasing N and p 2 . The former is achieved by the segmentation of traffic, while the latter is primarily done by reducing the relative velocities of cruising drones in order to promote traffic alignment [19]. Note that segmentation, as well as relative velocity reduction, have a linear relationship with conflict probability [19]. Therefore, simultaneously influencing the parameters of N and p 2 will have a greater impact to the conflict probability.

2.5. Constrained Urban Airspace

Past research have applied the principles of segmentation and alignment to a unconstrained or free airspace [17,18]. However, the very low altitude urban airspace, where drones are expected to operate, contains operational complexities, due to the presence of dynamic and static obstacles as well as temporary and permanent no-fly-zones [34]. This part of the airspace is also frequently occupied by general aviation aircraft and helicopters. Therefore, the urban airspace is heavily constrained when compared to manned aviation airspace. Nevertheless, many of these operational complexities (and their characteristics) are shared by ground-based traffic, for which there exists a wide body of literature [31,35,36,37].
Similar to road vehicles, drones can employ existing street networks and, thus, ’fly-over-streets’ in constrained urban spaces. However, with the expected large-scale drone traffic volumes, simply flying over streets may not be adequate to ensure airspace safety. When drones fly in competing travel directions in a constrained environment, a large number of conflicts would be triggered, due to high average relative velocities and limited flexibility of the airspace. As a result, applying segmentation and alignment principles to this portion of the airspace, in particular, would organise traffic into different altitude layers with respect to travel directions and, thus, add more structure to the constrained environment.

3. Design of Urban Airspace Concepts for Constrained Environments

In this section, the motivation to fly-over-streets in constrained urban areas is first presented. Before describing the airspace concepts, key observations from the initial experiments are revealed. Thereafter, the section describes and compares the two urban airspace concepts for a constrained environment.

3.1. Flying over Streets

Extrapolating from the research study of Metropolis [17,18] and urban street network studies [33,38,39], we developed a two-way and a one-way airspace configuration. In this sense, the flight routes adhere to the urban street network, i.e., the drone flights are directly guided along the streets. The two-way concept has no horizontal constraints that are imposed to the flow of traffic, while the one-way concept contains horizontal constraints to achieve one-way directional flow. In both of the concepts, the airspace is vertically segmented to form a stack of altitude layers for which traffic is organised in accord to north, east, south, and west directions, which are also known as the cardinal directions.
Having drone flights follow existing street networks offers two main benefits. The first being the relatively lower risk of privacy concerns as drones will not directly fly over private properties. Second, existing parcel transportation modes, such as trucks and vans, can potentially work in tandem with delivery drones in urban areas in order to optimise the last-mile delivery schedule [40].

3.2. Preliminary Investigations and Key Observations

3.2.1. Turning Flights

By applying the two airspace concepts to an actual urban network, our initial trial experiments indicated a strong association between the turning radii at intersections in the urban network and the performance of the drone. Because our initial experiments incorporated a constant drone cruise speed (10.3 m/s) and bank angle (35 ), the trial simulations showed that, when drone flights maintained its cruise speed while executing turns, it caused the drones to deviate from their actual route. In order to address this challenge, the initial investigations revealed the need for drones to decelerate by at least 50 percent (i.e., 5 m/s) of its respective cruise speed in order to safely execute the turns.

3.2.2. Through and Turn Altitude Layers

To cope with turning flights that require reducinf speed to perform safe turns, transition or so-called turn altitude layers are included in both airspace concepts. Therefore, the use of turn altitude layers helps to separate through traffic from turning traffic. In this study, through traffic is defined as the traffic that travels across at least one intersection, while turn traffic is composed of traffic that is turning at an intersection and thus decelerating in order to safely execute the turn. Note that the allocation of the through traffic and turn traffic into different altitude layers mitigates any disruption to the flow of traffic. Consequently, it reduces the probability of conflict between the slow turning traffic and through traffic, which increases the airspace safety. A similar design philosophy is employed in road design to distinguish between different types of traffic on the highway [36].
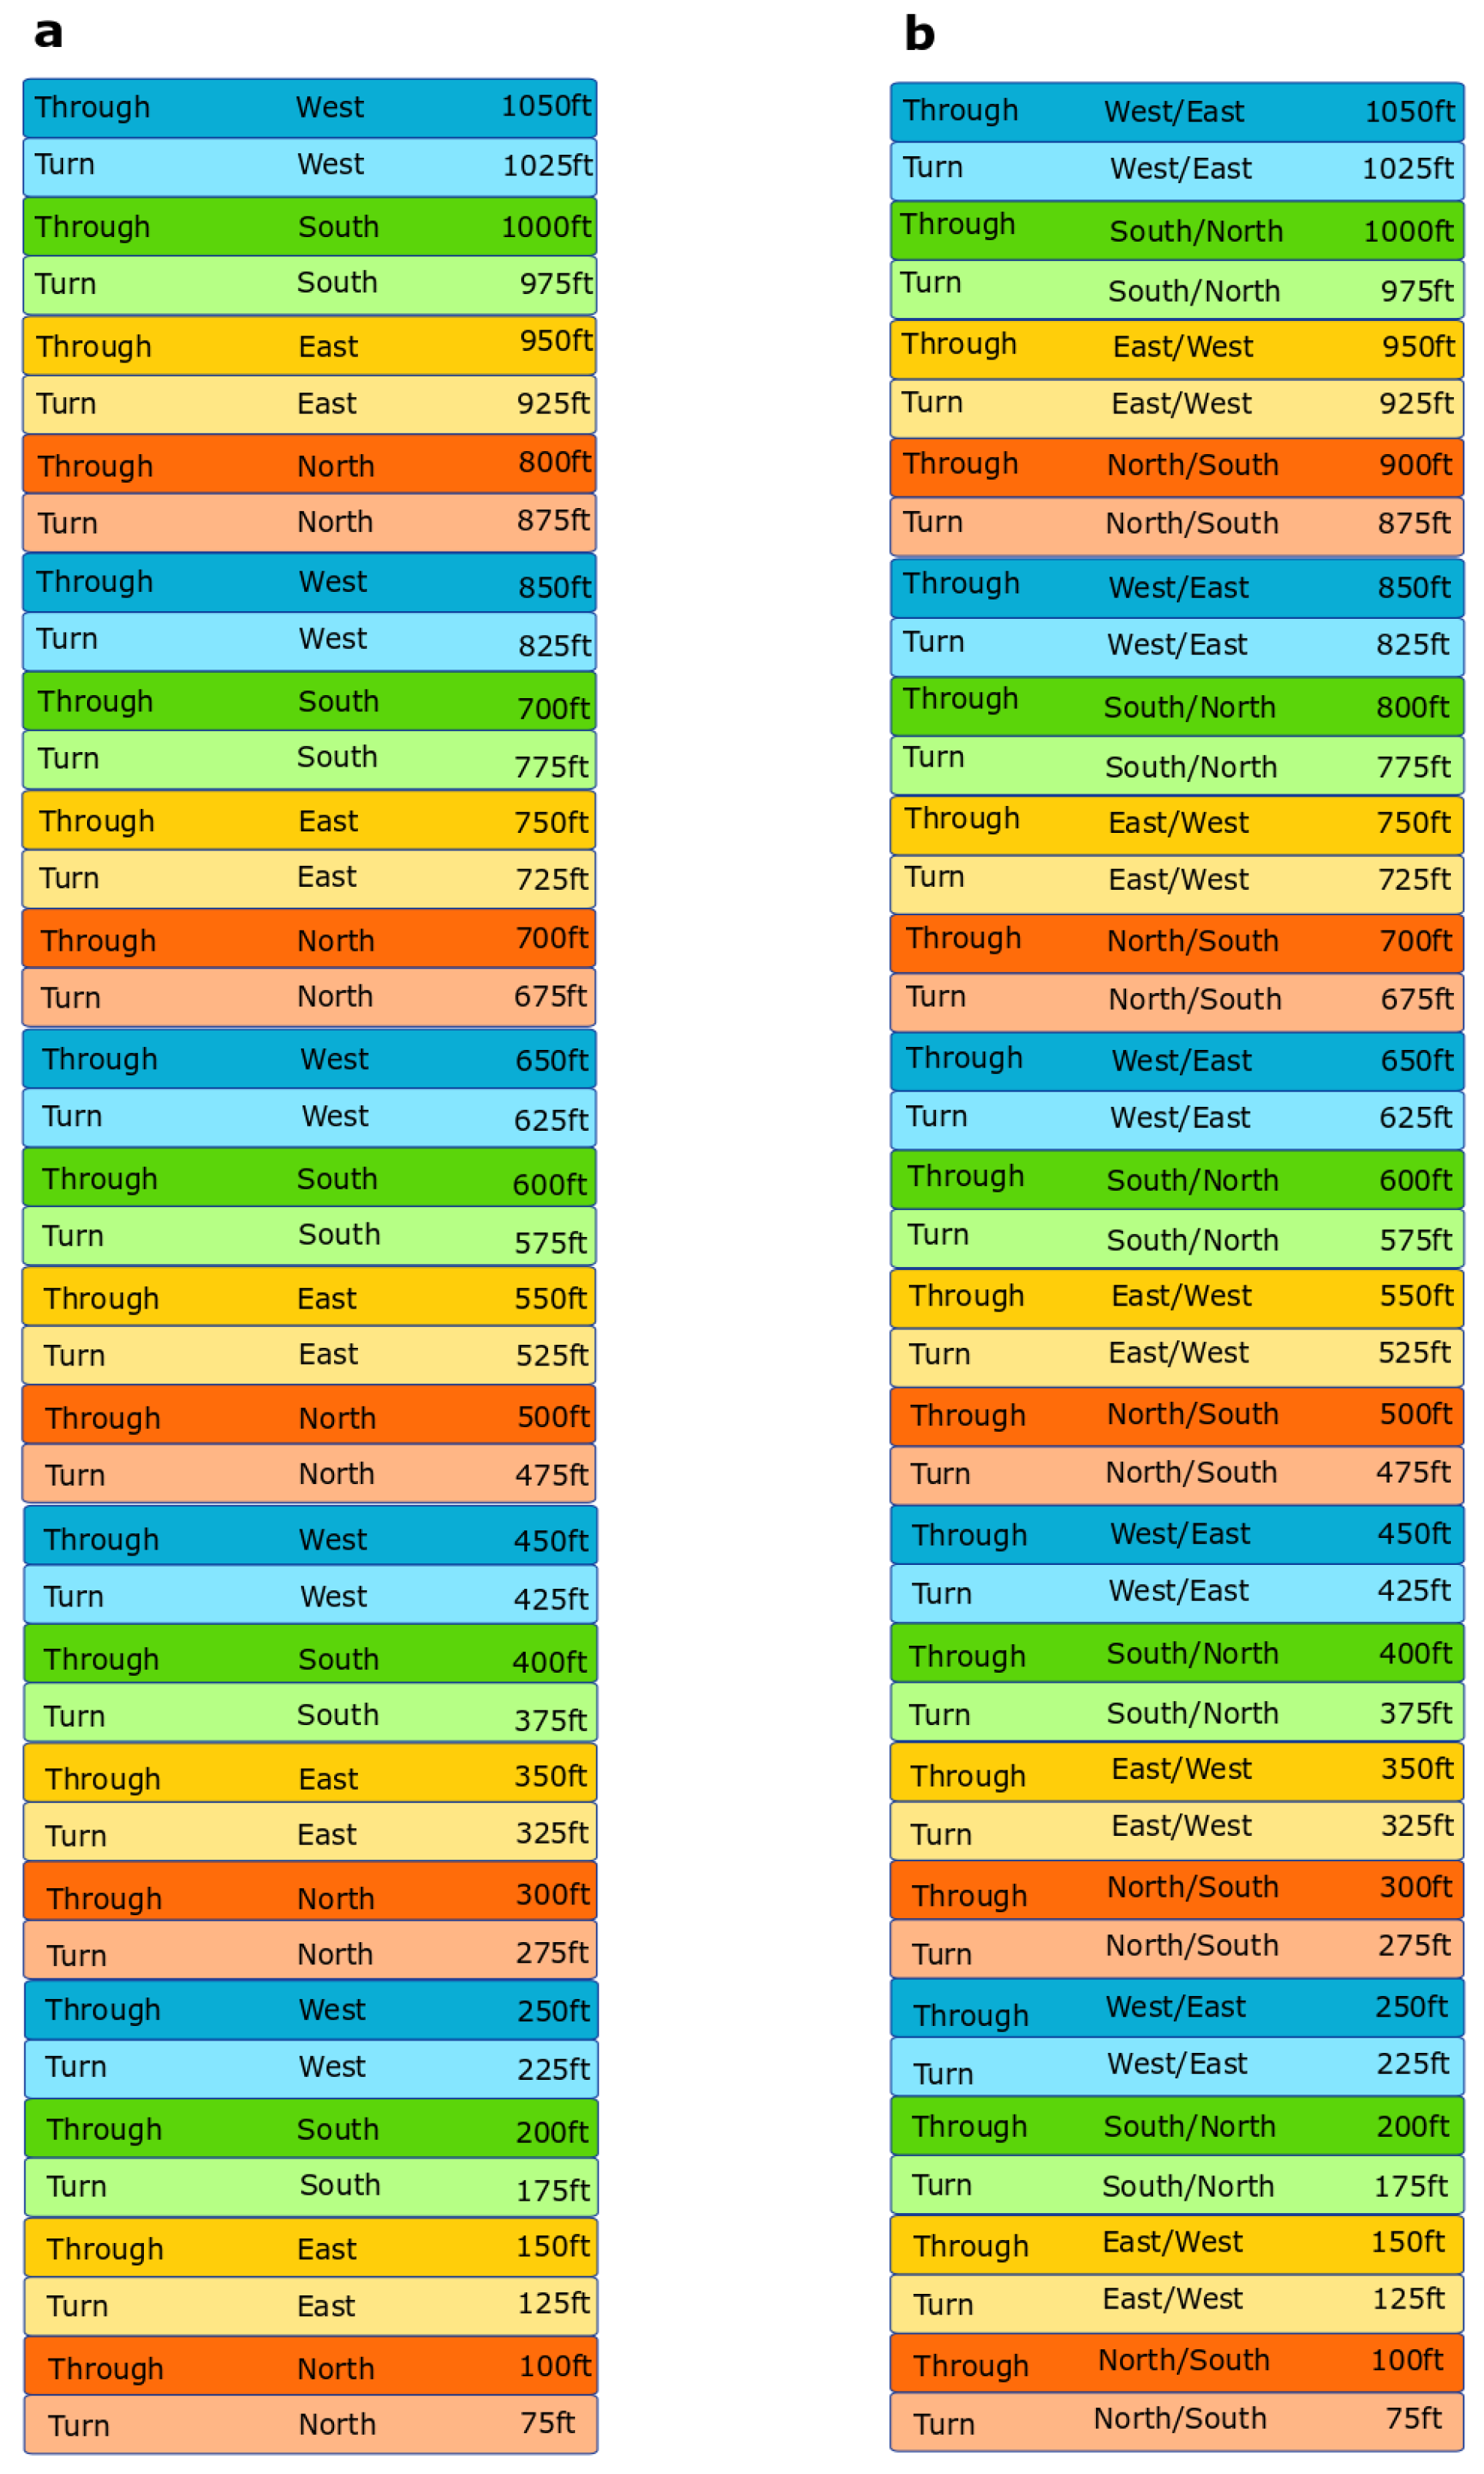
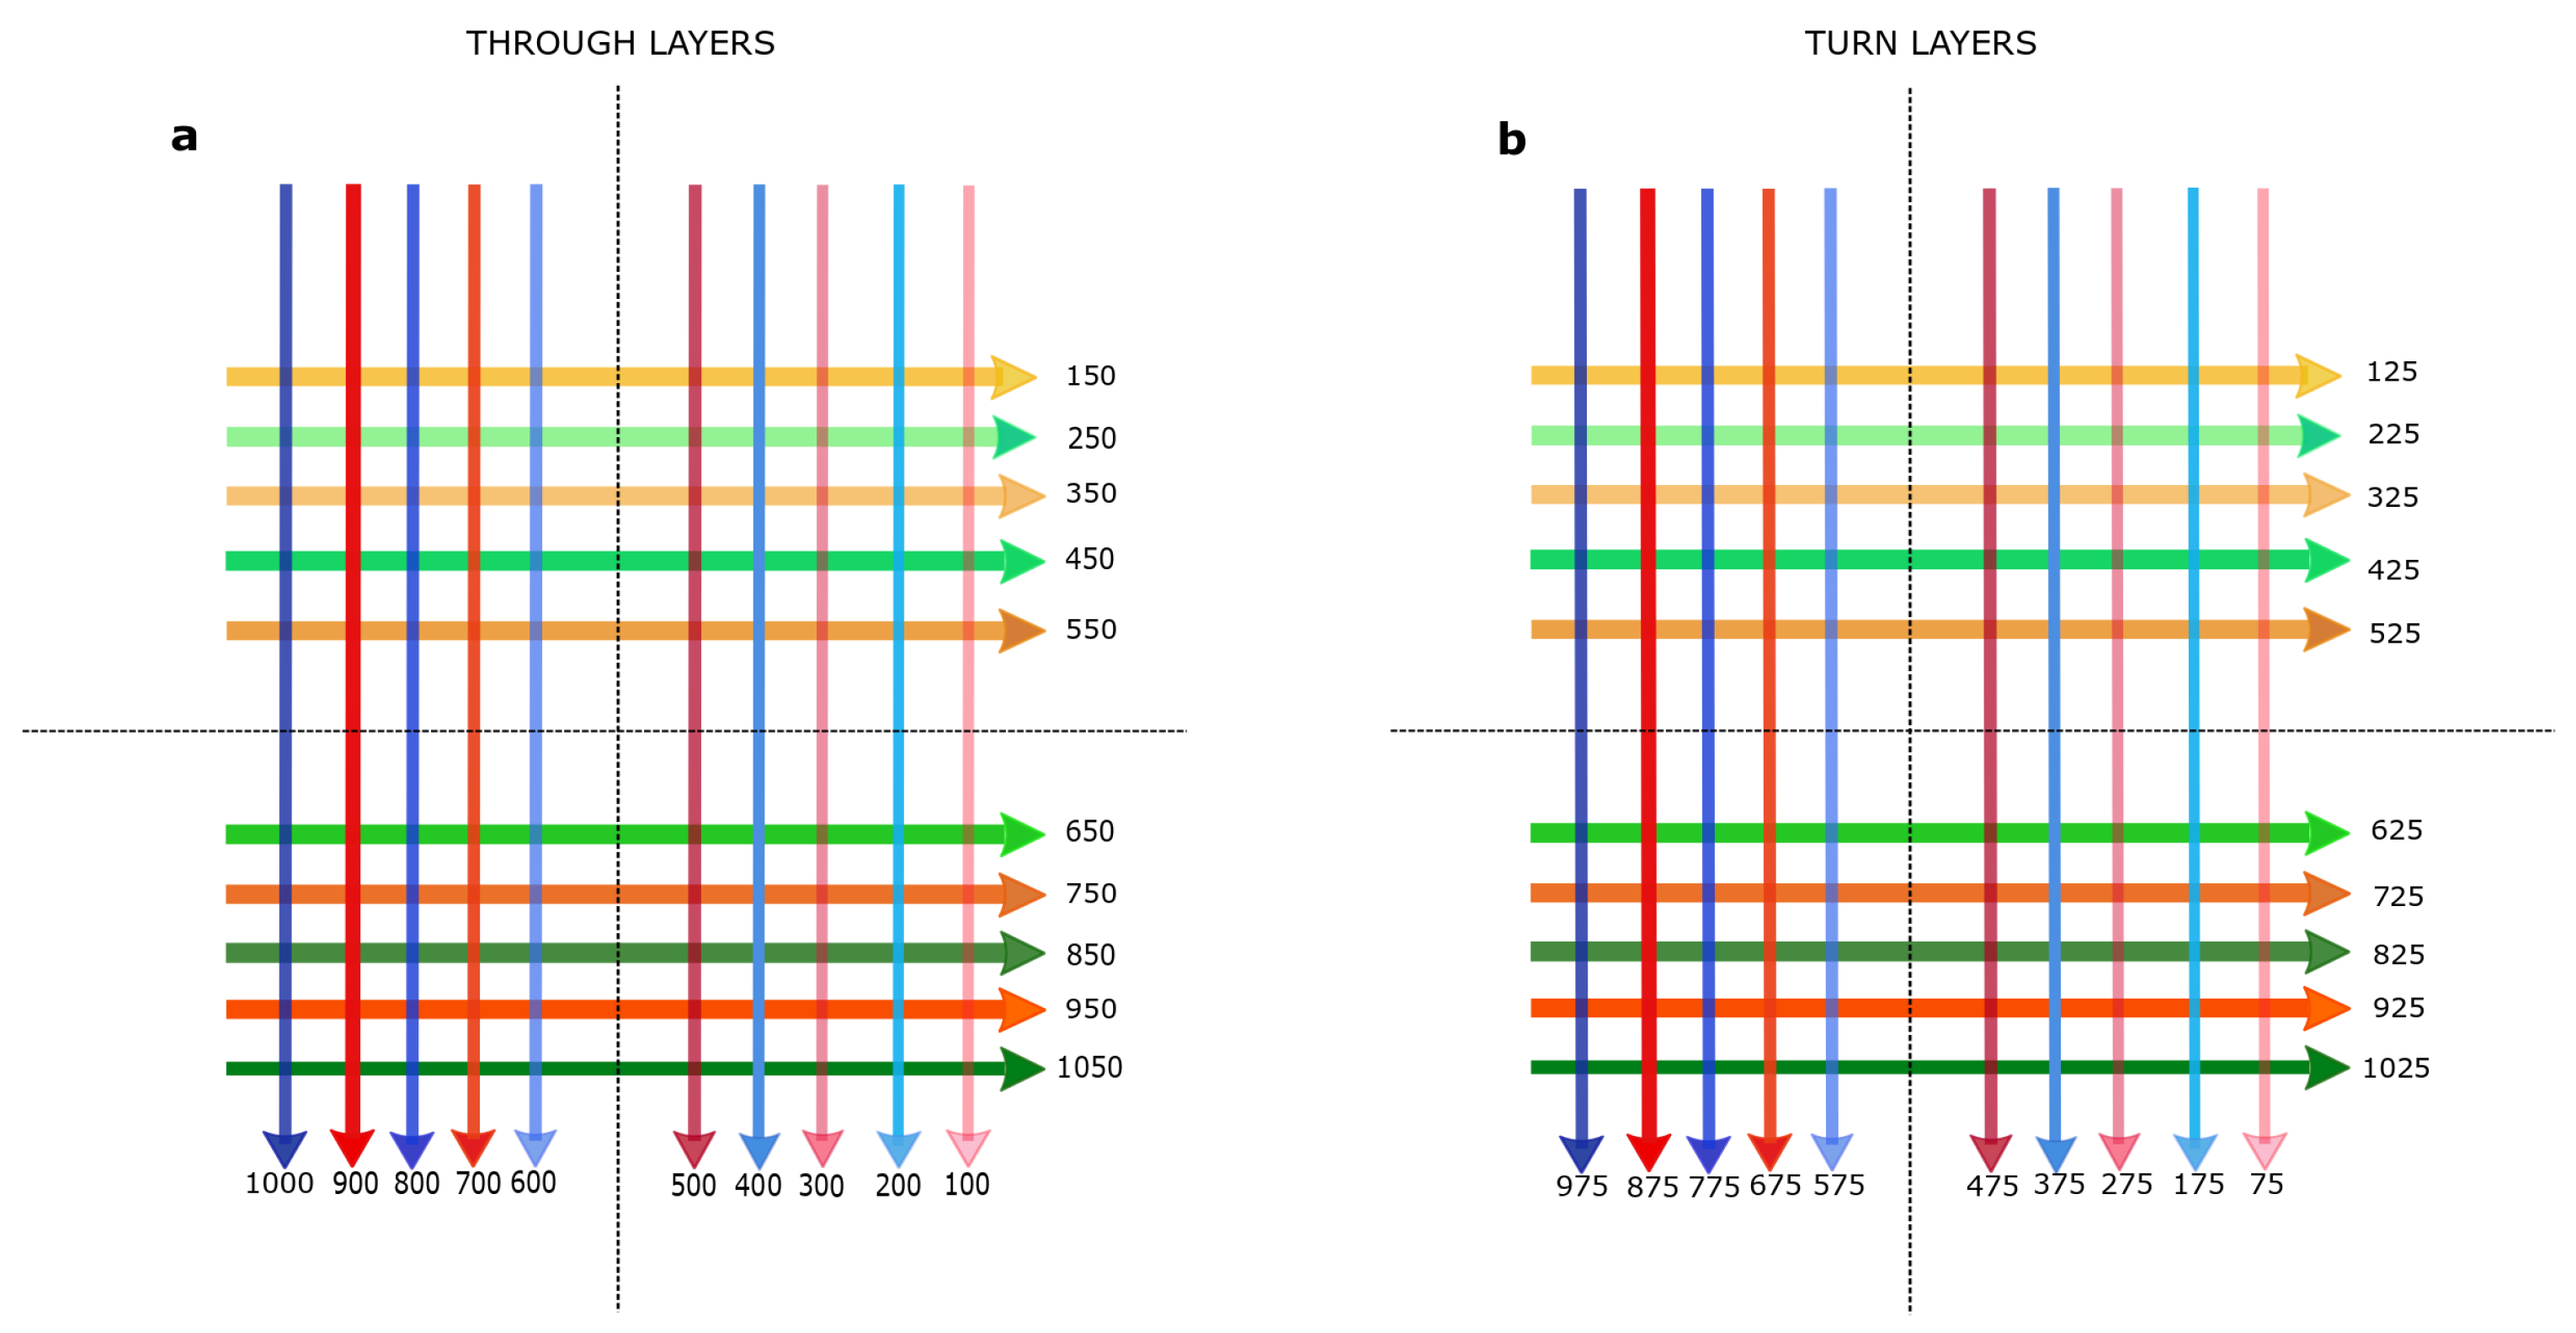
In the current study, the two-way and one-way airspace concepts both consist of multiple stacks of altitude layers that range from 75 to 1050 ft . Furthermore, the concepts feature through and turn-layers that are vertically spaced at 25 ft , while through-to-through and turn-to-turn layers are spaced at 50 ft , respectively, as illustrated in Figure 3. Of note, we use the current altitude range in this study, as policymakers in U-Space are yet to define the boundaries of low-altitude airspace [26]. This is because future operations, such as urban air mobility and other drone operations, may require much higher altitude boundaries than what has been initially defined [26].

3.3. Concept Design Features

Drone traffic is segmented within altitude layers that are defined between 75 and 1050 ft with respect to their travel directions. Each altitude layer is separated with a vertical distance of 25 ft , as mentioned previously. This means that both of the concepts hold 40 altitude layers, which comprise of 20 through-layers and 20 turn-layers, respectively (see Figure 3). Further, both of the concepts assign flights with shorter trip distances to lower altitudes, while flights with longer travel distances are allocated to higher altitudes.

3.3.1. Two-Way

The traffic in the altitude layers of the two-way airspace concept is organised with respect to a heading range of 90 . This allows for traffic with flight headings ( ψ ) to be assigned to flight levels accommodating the four cardinal directions, as shown below:
  • 315 < ψ ≤ 045 : North bound layers
  • 045 < ψ ≤ 135 : East bound layers
  • 135 < ψ ≤ 225 : South bound layers
  • 225 < ψ ≤ 315 : West bound layers
The two-way airspace concept comprises of a total of 40 altitude layers consisting of both through and turn layers. In this concept, 10 layers are assigned for each of the four directions (Figure 3). The segmentation of traffic in this concept prevents opposite flows of traffic from interacting at the intersections (Figure 4). In this airspace system, short flights are assigned to low altitudes, while longer flights are allocated to higher altitudes. In order to allocate these cruising altitudes, we use the following heading-altitude rule, adopted from [27]:
h T W , i = h m i n + ζ d i d m i n d m a x d m i n κ β + ψ i α
The heading-altitude rule that is described by Equation (2) is a function of the drones’ heading ψ i , its optimal flight path distance, d i , and the minimum and maximum origin-destination (note that the origin is one of the depot location) distance threshold ( d m i n and d m a x ), which is defined at 1 km and 10 km, respectively. The remaining constants are the heading range per flight level, α , which is equal to 90 ; the minimum altitude of the through-layer, h m i n (i.e., 100 ft ); β , which is equal to 4 (i.e., 360 / α ); κ as 5; and, the vertical distance ( ζ ) between through-through-layers, which is equal to 50 ft .

3.3.2. One-Way

The one-way concept consist of 40 altitude layers consisting of both through and turn traffic layers (see Figure 3). In this concept, horizontal constraints are imposed to the direction of travel in order to promote one-way traffic flow. The enforcement of the horizontal constraints culminates in uni-directional traffic flow over a single street. Therefore, a street will either accommodate north, east, south, or westbound traffic, depending on the direction of travel of flight and the use of the one-way directional constraint. This sets the one-way concept apart from the two-way concept, where opposing traffic flows occupy the same street, although in different altitude levels. Thus, the prohibition against having opposing traffic flow within a single street in the one-way concept allows for an additional set of altitude layers to be assigned for uni-directional travel. As a result, twice as many altitude layers per cardinal direction can be assigned to the one-way concept. This means that, in the one-way concept, there exist 20 altitude layers for each cardinal direction as compared to the two-way concept, which has 10 altitude layers per cardinal direction. In order to accommodate the higher number of layers per cardinal direction, the opposite traffic flows are not separated by means of altitude. Instead, the separation is assumed to follow the spatial order of the urban street network, which is comparable to road-based traffic. Similar to the two-way concept, the altitude layers of the one-way airspace concept is also structured with respect to the heading range of 90 , albeit with 10 additional layers per cardinal direction. Therefore, 20 through and turn layers are allocated to each of the four cardinal directions, which allows for traffic with flight headings ( ψ ) to be assigned, as follows:
  • 315 < ψ ≤ 045 : North bound layer
  • 045 < ψ ≤ 135 : East bound layer
  • 135 < ψ ≤ 225 : South bound layer
  • 225 < ψ ≤ 315 : West bound layer
Figure 5 illustrates an example of the traffic flow and its combination of altitude layers at a typical four-leg intersection. The similarity of the direction of the traffic flow can be compared to that of the one-way road-based intersection that is shown in Figure 1. In addition, the properties of one-way network configuration enables a typical four-leg intersection to only accommodate two directions of traffic flow, which is south and east bound traffic, see Figure 5. Note that the remaining traffic flow directions are incorporated into adjacent intersections within the one-way network.
Despite this, the design of the one-way concept ensures that traffic from different directions do not mix at intersections (Figure 5). Furthermore, a simple altitude-heading rule was used to compute the respective cruising altitudes ( h O W , i ):
h O W , i = h m i n + h m a x h m i n d m a x d m i n ( d i d m i n )
Once the cruising altitude per street edge is determined while using the above equation, a simple heuristic is used to ensure the altitudes of the flights are aligned according to their respective heading direction, ψ , as denoted by Algorithm 1:
Algorithm 1: Heuristic to align flight altitudes to their travel direction.
         if 315 < ψ 045 or 135 < ψ 225 then
               h O W , i = h O W , i
         else
              if 045 < ψ 135 or 225 < ψ 315 then
                    h O W , i = h O W , i + ζ
              end if
         end if
In Equation (3), h m a x and h m i n are the maximum and minimum altitude level of the through-layer, d i is the optimal path, and d m i n and d m a x are the minimum and maximum threshold distance to the respective origin-destinations. This equation ensures that shorter flights are allocated to lower altitudes and longer flights are allocated to higher altitudes, respectively.

3.4. Concept Comparison

The main difference between both of the concepts is that the one-way concept has half as many roads available to each cardinal travel direction, albeit with twice as many vertical layers, when compared to the two-way concept. As a result, opposing traffic shares the same flight level, and it is separated by the street layout. Further, the two-way concept has more horizontal distribution of traffic and, therefore, there is no opposite traffic flows on the same altitude layers. Table 1 summarises the main comparisons between the two-way and one-way urban airspace concepts.

4. Simulation Design

The two airspace concepts will be compared in a set of fast-time simulations, in terms of safety, stability, and efficiency. This section describes the design and development of these fast-time simulation experiments.

4.1. Simulation Development

4.1.1. Simulation Platform

The open-source Air Traffic Management simulator BlueSky [41,42] is used as the simulation platform in order to conduct fast-time simulation experiments in this research. The BlueSky traffic simulation tool has been widely used in past ATM related studies [17,18,27]. For the purpose of this study, the tool is adapted to include the elements of the urban airspace concepts. This includes suitable drone models and updating BlueSky’s autopilot module to account for the safe manoeuvrability of drones within the urban layout.
Most of the package delivery drone prototypes that are depicted in the media mainly appear to be multi-copters [11,43,44]. A reason for this may be linked the copters’ agility and manoeuvrability, which allows for it to effectively navigate the complex urban landscape. Therefore, assuming the same trend continues into the foreseeable future, we employ the DJI Matric 600 Pro hexacopter drone model in this study. Table 2 presents the characteristics of the drone model.

4.1.2. Testing Region

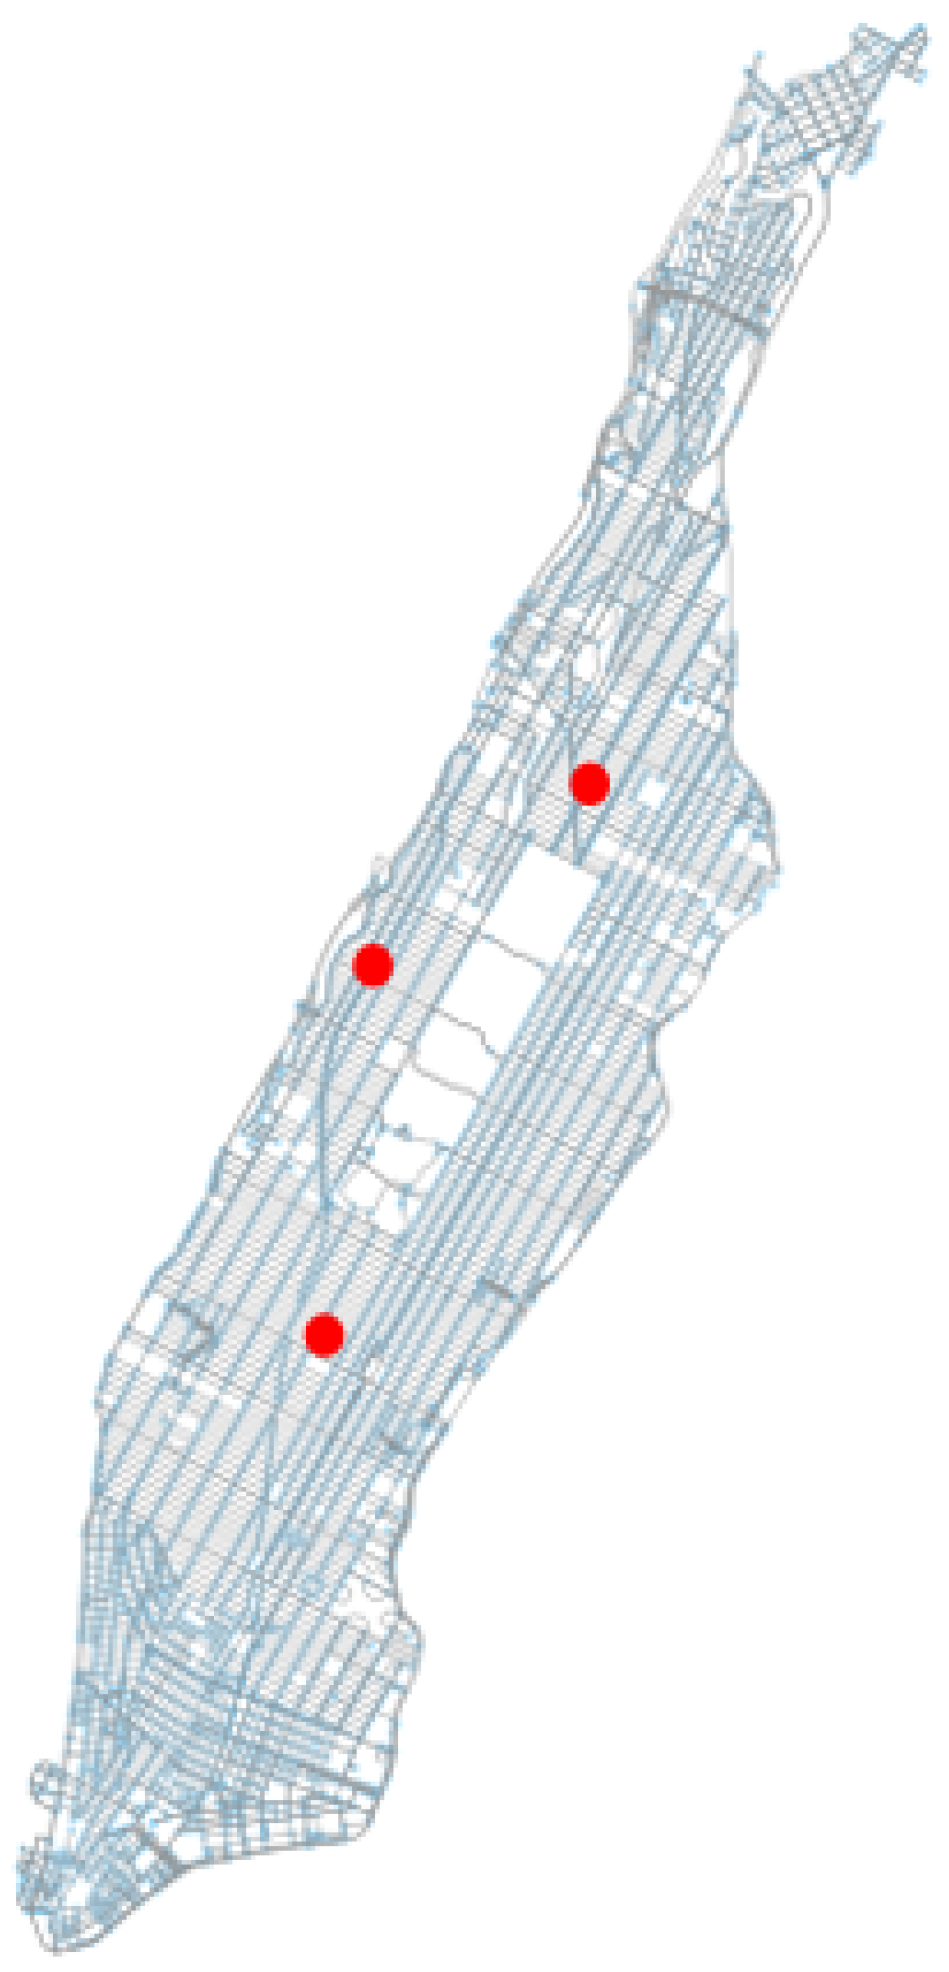
In this study, we investigate the performance of the urban airspace concepts on the urban street network of Manhattan, New York City, as shown in Figure 6. The reason for choosing Manhattan is three-fold. First, Manhattan has an orthogonal or grid-like spatial order, which contains fewer dead-ends, more four-way intersections, as well as less-winding street patterns [39]. In comparison to neighbouring cities, such as New York city and Staten Island, or European cities, such as Amsterdam or Paris, the low entropy and highly-ordered grid-like street orientations of Manhattan [45,46] limit any sort of ambiguity in our findings. Second, newly constructed streets are increasingly grid-like [30,47,48]. Thus, the outcome of the current study would still be valid for future urban street networks. Third, recent urban air mobility studies have also utilised the Manhattan street network as a testing region in their experiments [49,50].

4.1.3. Conflict Detection and Resolution

The two urban airspace concepts relied on a ‘state-based’ conflict detection method for identifying any potential separation violations. The conflict detection was done by performing a linear extrapolation of the drone positions within a predefined ‘look-ahead’ time. However, the use of a linear extrapolation method means that false conflicts would need to be identified in the post-processing phase. Furthermore, the separation requirements of 164 ft horizontally and 25 ft vertically were respectively used in this study. Once conflicts were detected, a basic (1-D) speed control algorithm was used in order to resolve conflicts in a pair-wise manner. Of note, the horizontal separation requirement of 164 ft was adopted in this research, as it was also used in a recent UAV tactical conflict resolution study [52]. In terms of the vertical separation, a range of values have been employed in past studies [53,54,55,56]. However, based on initial test simulations, the vertical separation of 25 ft was found to be suitable for the experiments.

4.1.4. Urban Airspace Concept Implementation

The data to construct the street network of Manhattan were obtained from OpenStreetMap, while using the graph-based method in [51]. Separate graphs were generated for each airspace concept. The graph network of the two-way concept was made by creating an undirected graph that neglects the direction of the edges, while the one-way concept featured a directed graph that enforces the direction of the streets to be one-way. Subsequently, for both concepts, three depot locations (see red circles in Figure 6, where all of the drone flights depart from one of the three depots during the simulation) were selected based on initial experiments that promoted traffic flow convergence. For each depot, random destination locations were selected. To adhere to the range limits of the drone model, the random destination locations were further pruned out in order to meet a minimum and maximum distance of 1 km and 10 km, respectively. Afterwards, for each depot and its respective random destinations, we compute the shortest paths using the method in [57]. The generated shortest paths, consisting of a set of geographical coordinates, are then used to determine the bearing (heading direction) of the streets of each shortest path and the distance of the shortest paths. Subsequently, the cruising altitudes are computed using the heading-altitude rules that are described in Section 3.3.
Given the above flight-plan data, we will assess the location of turns in order to allocate the transition altitudes for the respective flights. This allows the drone flights to descend and decelerate in order to safely turn, within the transition altitude. The generated scenario of flight-plans, comprising of way-points, heading, altitude, and speed were then imported into BlueSky in order to perform fast-time simulations.

4.2. Independent Variables

The experiment in this study featured three independent variables:
  • urban airspace concepts: two-way and one-way designs;
  • airborne separation assurance conditions: with and without tactical conflict resolution; and,
  • traffic demand: low, medium, and high traffic densities.
Here, traffic demand levels are based on the food-delivery scenarios that are described in [16]. Table 3 summarises the resulting traffic demand scenarios.
The combination of these three independent variables results in 12 experiment conditions. For each experiment condition, five repetitions were done, which resulted in 60 simulations runs (two airspace concepts × two conflict resolution conditions × three traffic demand scenarios × five repetitions). Note that, for each simulation run, uniformly random destinations (between 1 km and 10 km) were used, thereby creating different trajectories with every individual simulation run.

4.3. Dependent Measures

Dependent measures are considered in following categories: safety, stability, and efficiency, which includes throughput (or rate of arrivals of drones at its respective destinations), average number of turns per flight, and cumulative travel time.

4.3.1. Safety

The safety of the urban airspace is measured in terms of the number of conflicts and intrusions. An intrusion (loss of separation) occurs when the minimum vertical and horizontal separation requirements are violated, as explained in Section 2.3. A conflict is a predicted intrusion within the prescribed look-ahead time. Based on trial experiments, a look-ahead time of 30 s was chosen for this study, as it demonstrated the optimum balance between the number of false conflicts detected and the number of intrusions prevented.

4.3.2. Stability

The stability of the urban airspace refers to the potential for the creation of new conflicts that are caused by the conflict resolution manoeuvres as a result of the scarcity of airspace. This effect on the airspace has been measured in past research studies using the Domino Effect Parameter (DEP) [17,18,58,59]. The DEP can be calculated as follows:
D E P = C w C w o 1
where C w represents the number of conflicts with conflict resolution enabled and C w o is the number of conflicts without conflict resolution. Note that a larger positive DEP value indicates a higher de-stabilizing airspace concept.

4.3.3. Throughput

The throughput metric measures the number of drones that arrive at its respective destination per minute. In particular, the throughput metric is used to describe the traffic outflow rate with respect to the accumulation of traffic for both of the airspace concepts. As drones depart from their respective depots, at a steady inflow rate, the traffic density will begin to slowly increase. As consequence, a higher proportion of drones will begin to slow down in order to avoid conflicts and, thus, the drones will spend a higher proportion of its time traversing the airspace, which would result in a lower throughput.

4.3.4. Average Number of Turns

The efficiency of the concepts is also assessed while using the average number of turns per flight and the cumulative travel times. Similarly, studies that are related to on-ground transport have employed the notion of the average number of turns to explain the traffic dynamics of two-way and one-way street networks [33,38]. In the current study, the number of turns per flight is expected to influence the performance of the airspace concept. This is because drones are subjected to lower flight speeds when turning. Even though the airspace concepts have turn-layers to accommodate these turning flights, it is likely that in-trail conflicts would be triggered, especially when two or more flights use the same intersection to perform the turns.

4.3.5. Cumulative Travel Time

As a consequence of these lower flight speeds, drone travel times may get prolonged and, thus, result in additional conflicts. Therefore, this is captured by the cumulative travel time metric for both concepts, for low, medium, and high traffic demand.

4.4. Experimental Hypotheses

It is hypothesised that, as traffic demand increases from low to high, the safety, stability, and efficiency metrics will become worse. Therefore, we anticipate to see a greater number of conflicts, intrusions, and conflict chains as traffic demand increases. Furthermore, the one-way concept has twice as many altitude layers and, thus, greater vertical segmentation of traffic distribution, which further reduces the number of possible drone combinations per layer than the two-way concept. For these reasons, we expect the greater vertical segmentation and the horizontal structure to further reduce the probability of conflict when compared to the two-way concept. As a result, it is hypothesised that the one-way concept would have better performance with respect to safety and stability.
In terms of efficiency, it is hypothesised that the one-way concept would have higher traffic throughput than the two-way concept. The one-way concept has additional altitudes layers allocated per cardinal direction and, thus, more traffic flow can be accommodated. Further, it is hypothesised that the one-way concept would result in a higher number of turns per flight than the two-way concept. This hypothesis was developed with support from street network studies (see [33,38]). Similarly, it is hypothesised that the one-way concept would result in greater cumulative travel times when compared to the two-way concept. Because one-way streets contain more circuitry than two-way streets, greater travel time to reach a particular destination can be expected [33,37,38].

5. Results

This section presents the results of the experiment conducted in this study. The effect of the independent variables on safety, stability, and efficiency is presented using box-and-whisker plots. All of the box-and-whisker plots display the median line; interquartile range (IQR), which is represented by the boundary of the box; the minimum and maximum distribution of the data is marked by the whiskers; and, the points greater than ± 1.5 × IQR denote the outliers. Furthermore, the results for throughput efficiency of each urban airspace concept is presented while using scatter plots.

5.1. Safety

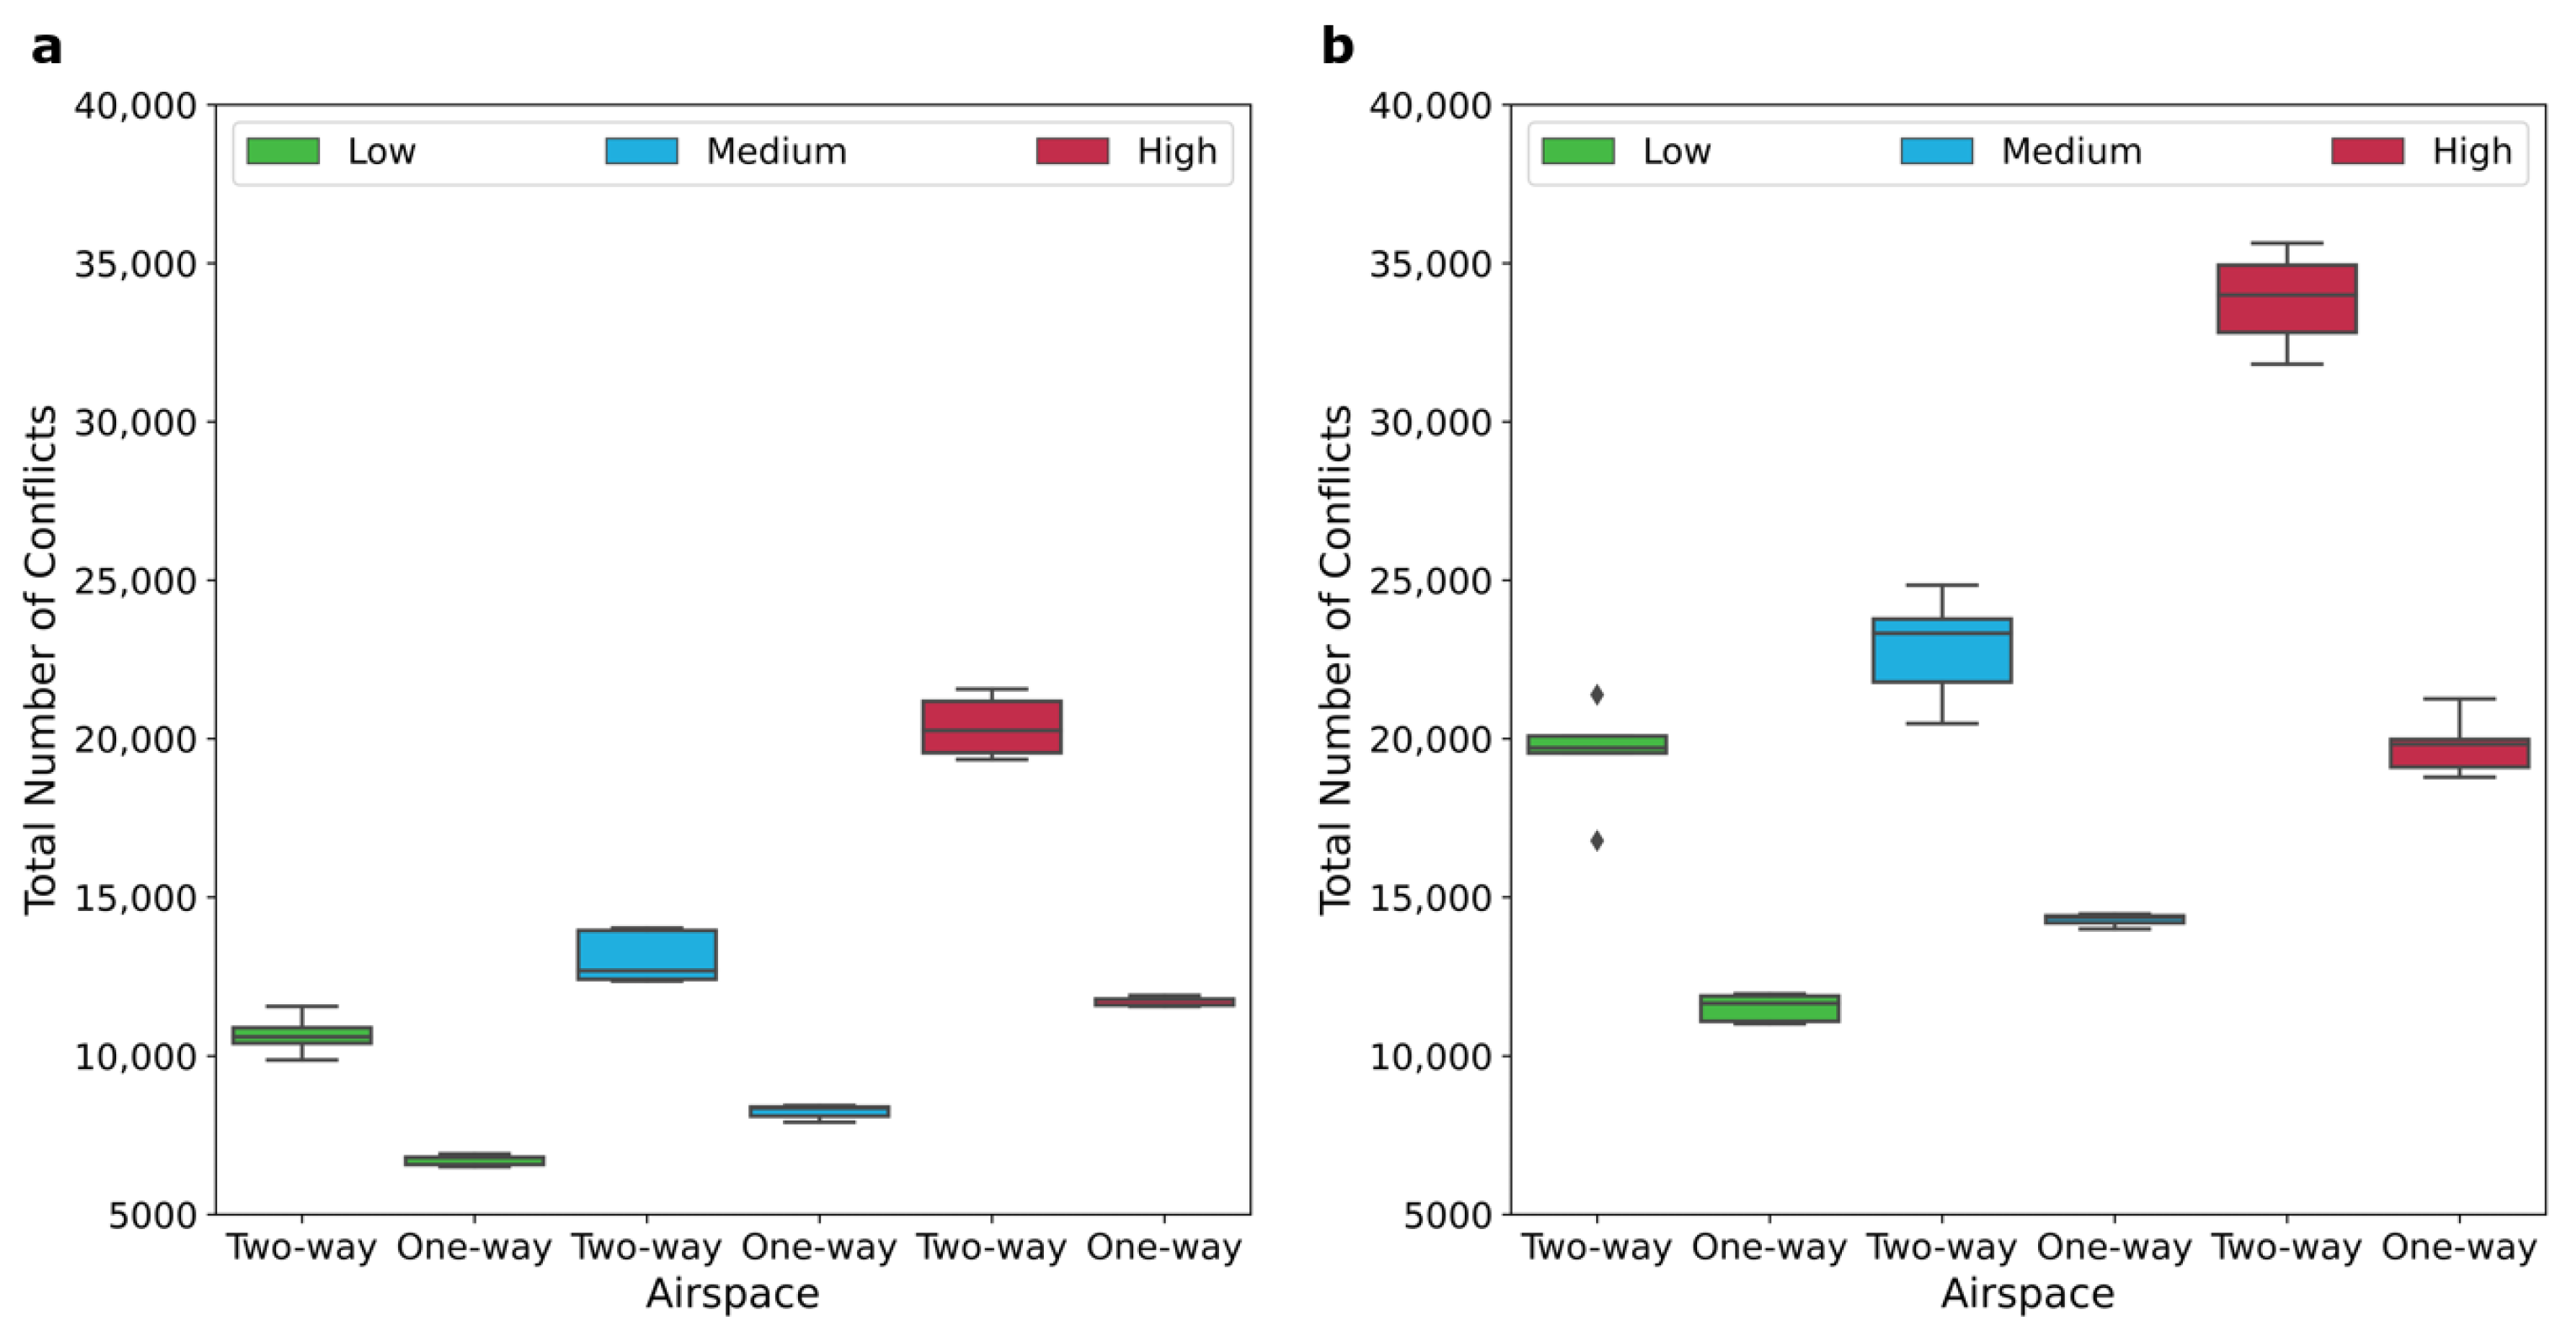
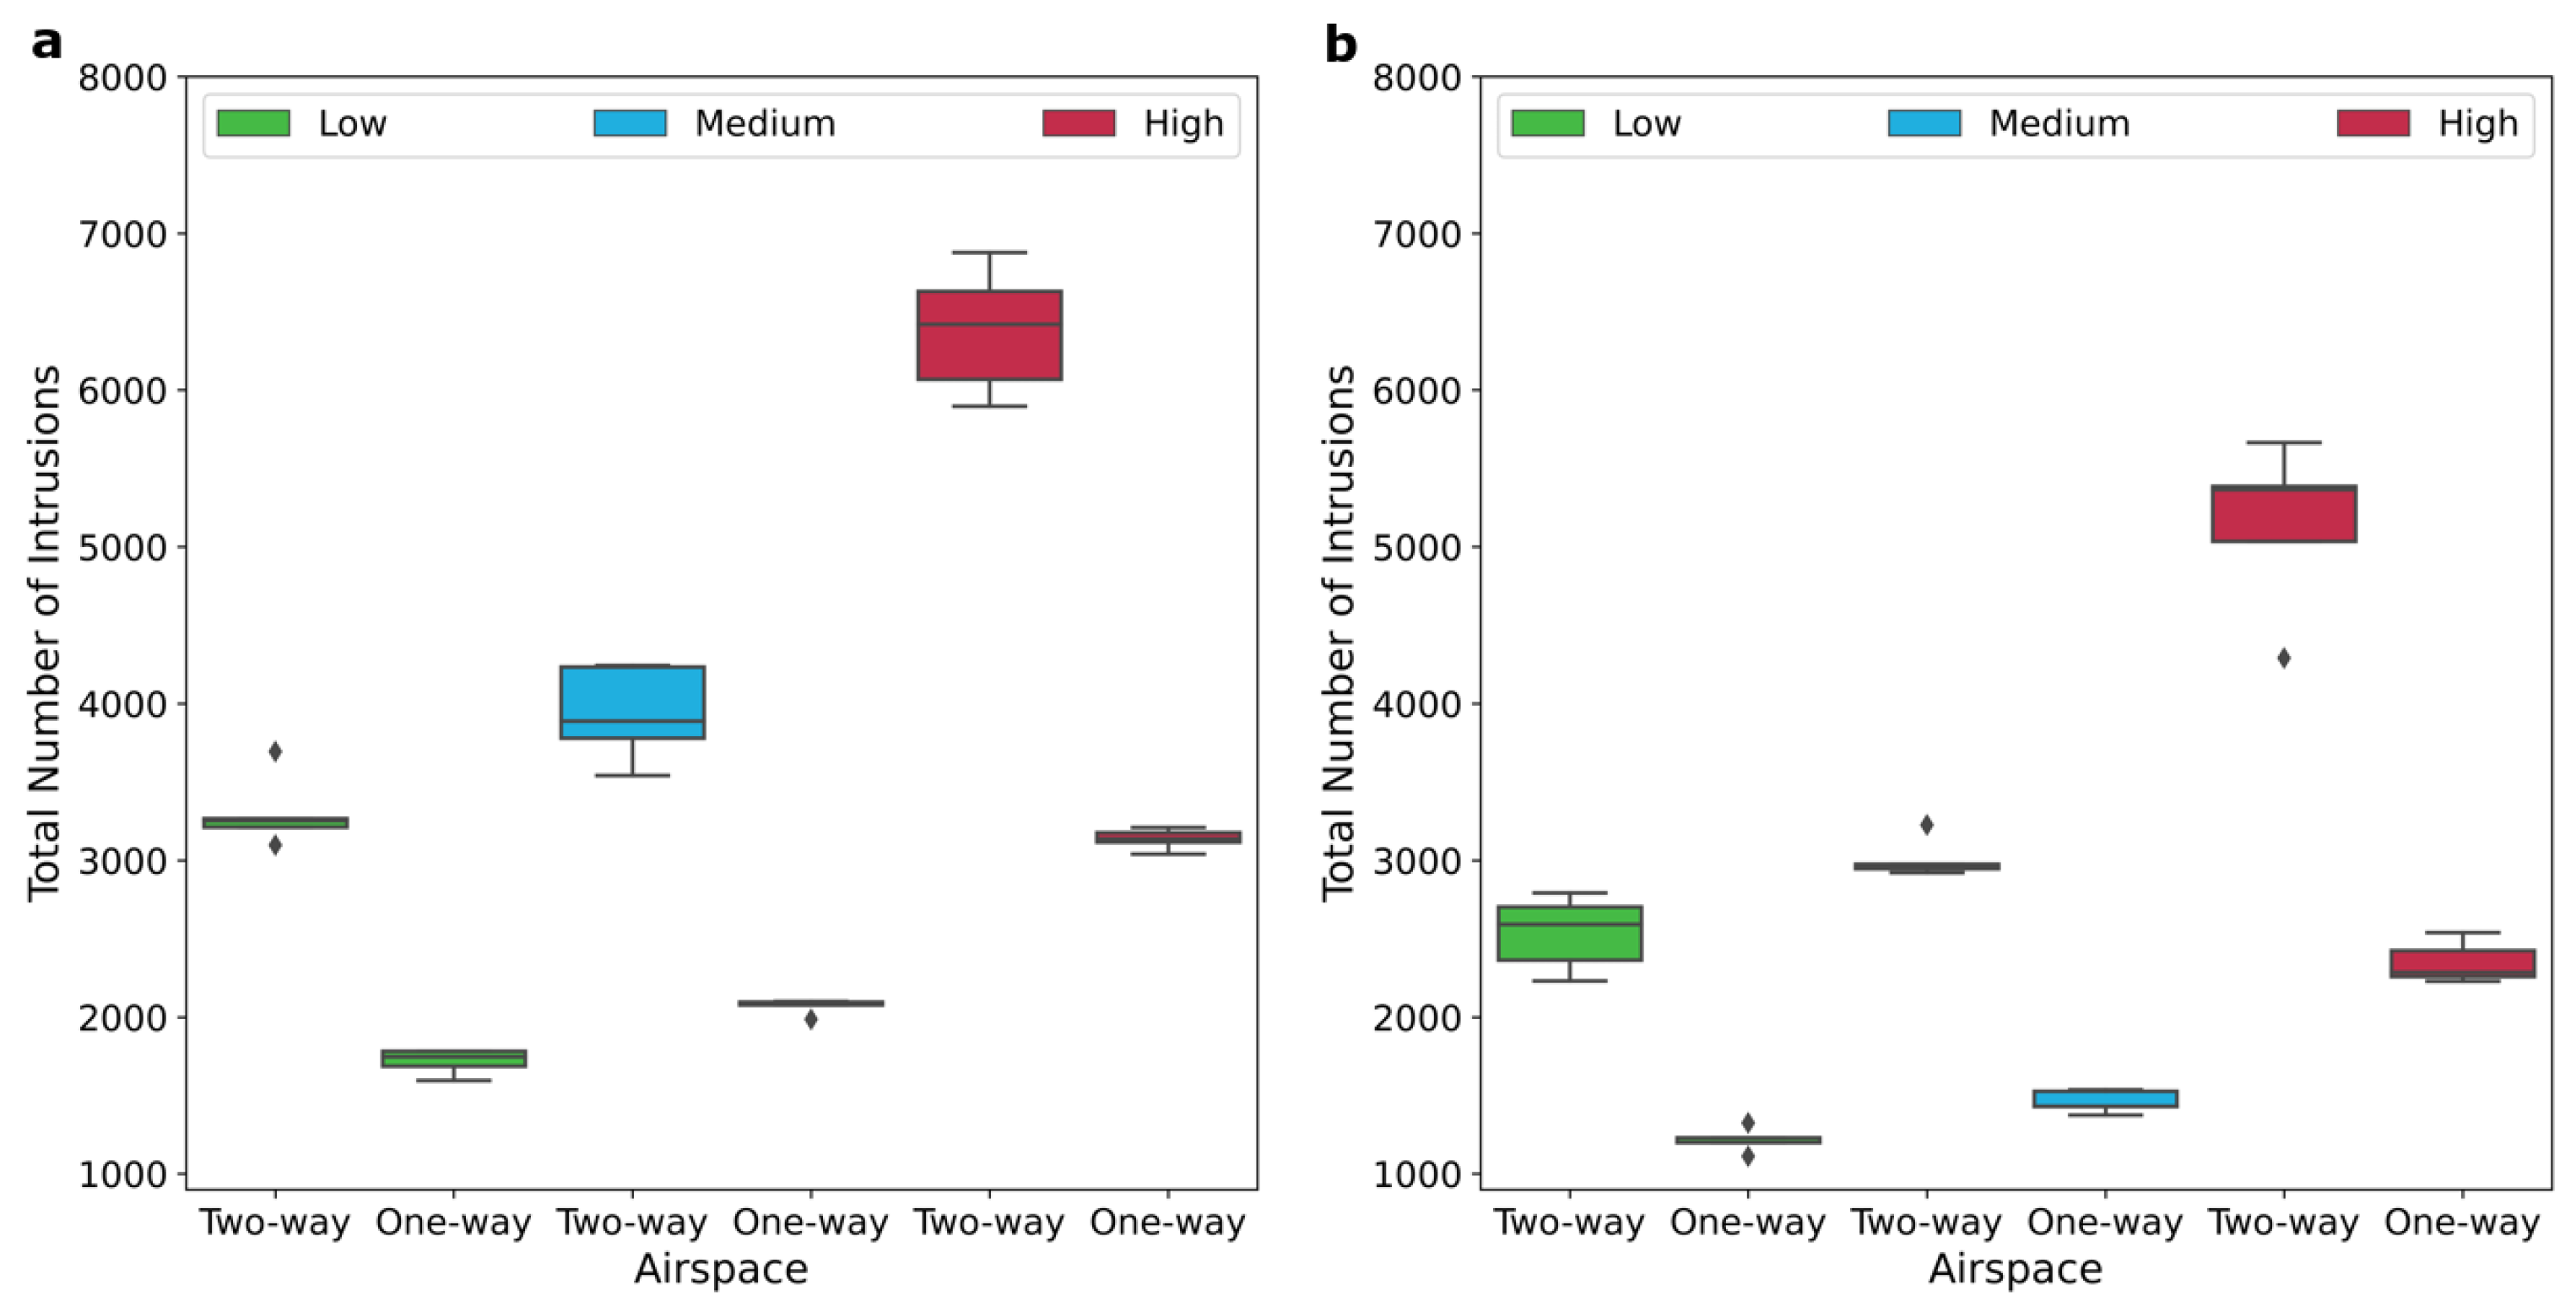
Figure 7 and Figure 8 display the total number of pairwise conflicts and intrusions for each urban airspace concept, with respect to the three traffic demand cases. Note that independent of its duration, a pairwise conflict and intrusion is accounted only once during the simulation while a repeating pairwise conflict and intrusion is recounted. Figure 7 shows an increase in the total number of conflicts with traffic demand for both airspace concepts. The same trend is observed for the total number of intrusions (Figure 8). As hypothesised, the figures indicate that the two-way concept has a higher number of conflicts and intrusions than the one-way concept.
Furthermore, the figures show the effect of tactical conflict resolution for each airspace concept. The results with conflict resolution enabled describe the safety of the urban airspace concept, while the results with conflict resolution switched off indicate the level of conflict prevention. As expected, the results without tactical conflict resolution show that the one-way concept is able to circumvent conflicts from occurring, thus indicating higher intrinsic safety when compared to the two-way concept. For both airspace concepts, the number of intrusions significantly decreased with conflict resolution switched on. Despite this decrease in the number of intrusions, the same trend was not seen for the total number of conflicts. For both airspace concepts, the number of conflicts increased with conflict resolution switched on. This was primarily caused by the highly constrained airspace nature that resulted in less flexibility for resolution manoeuvres. As a consequence, the probability of encountering other drones was increased, which ultimately lead to conflict chain reactions. This notion was further examined by the airspace stability metric.

5.2. Stability

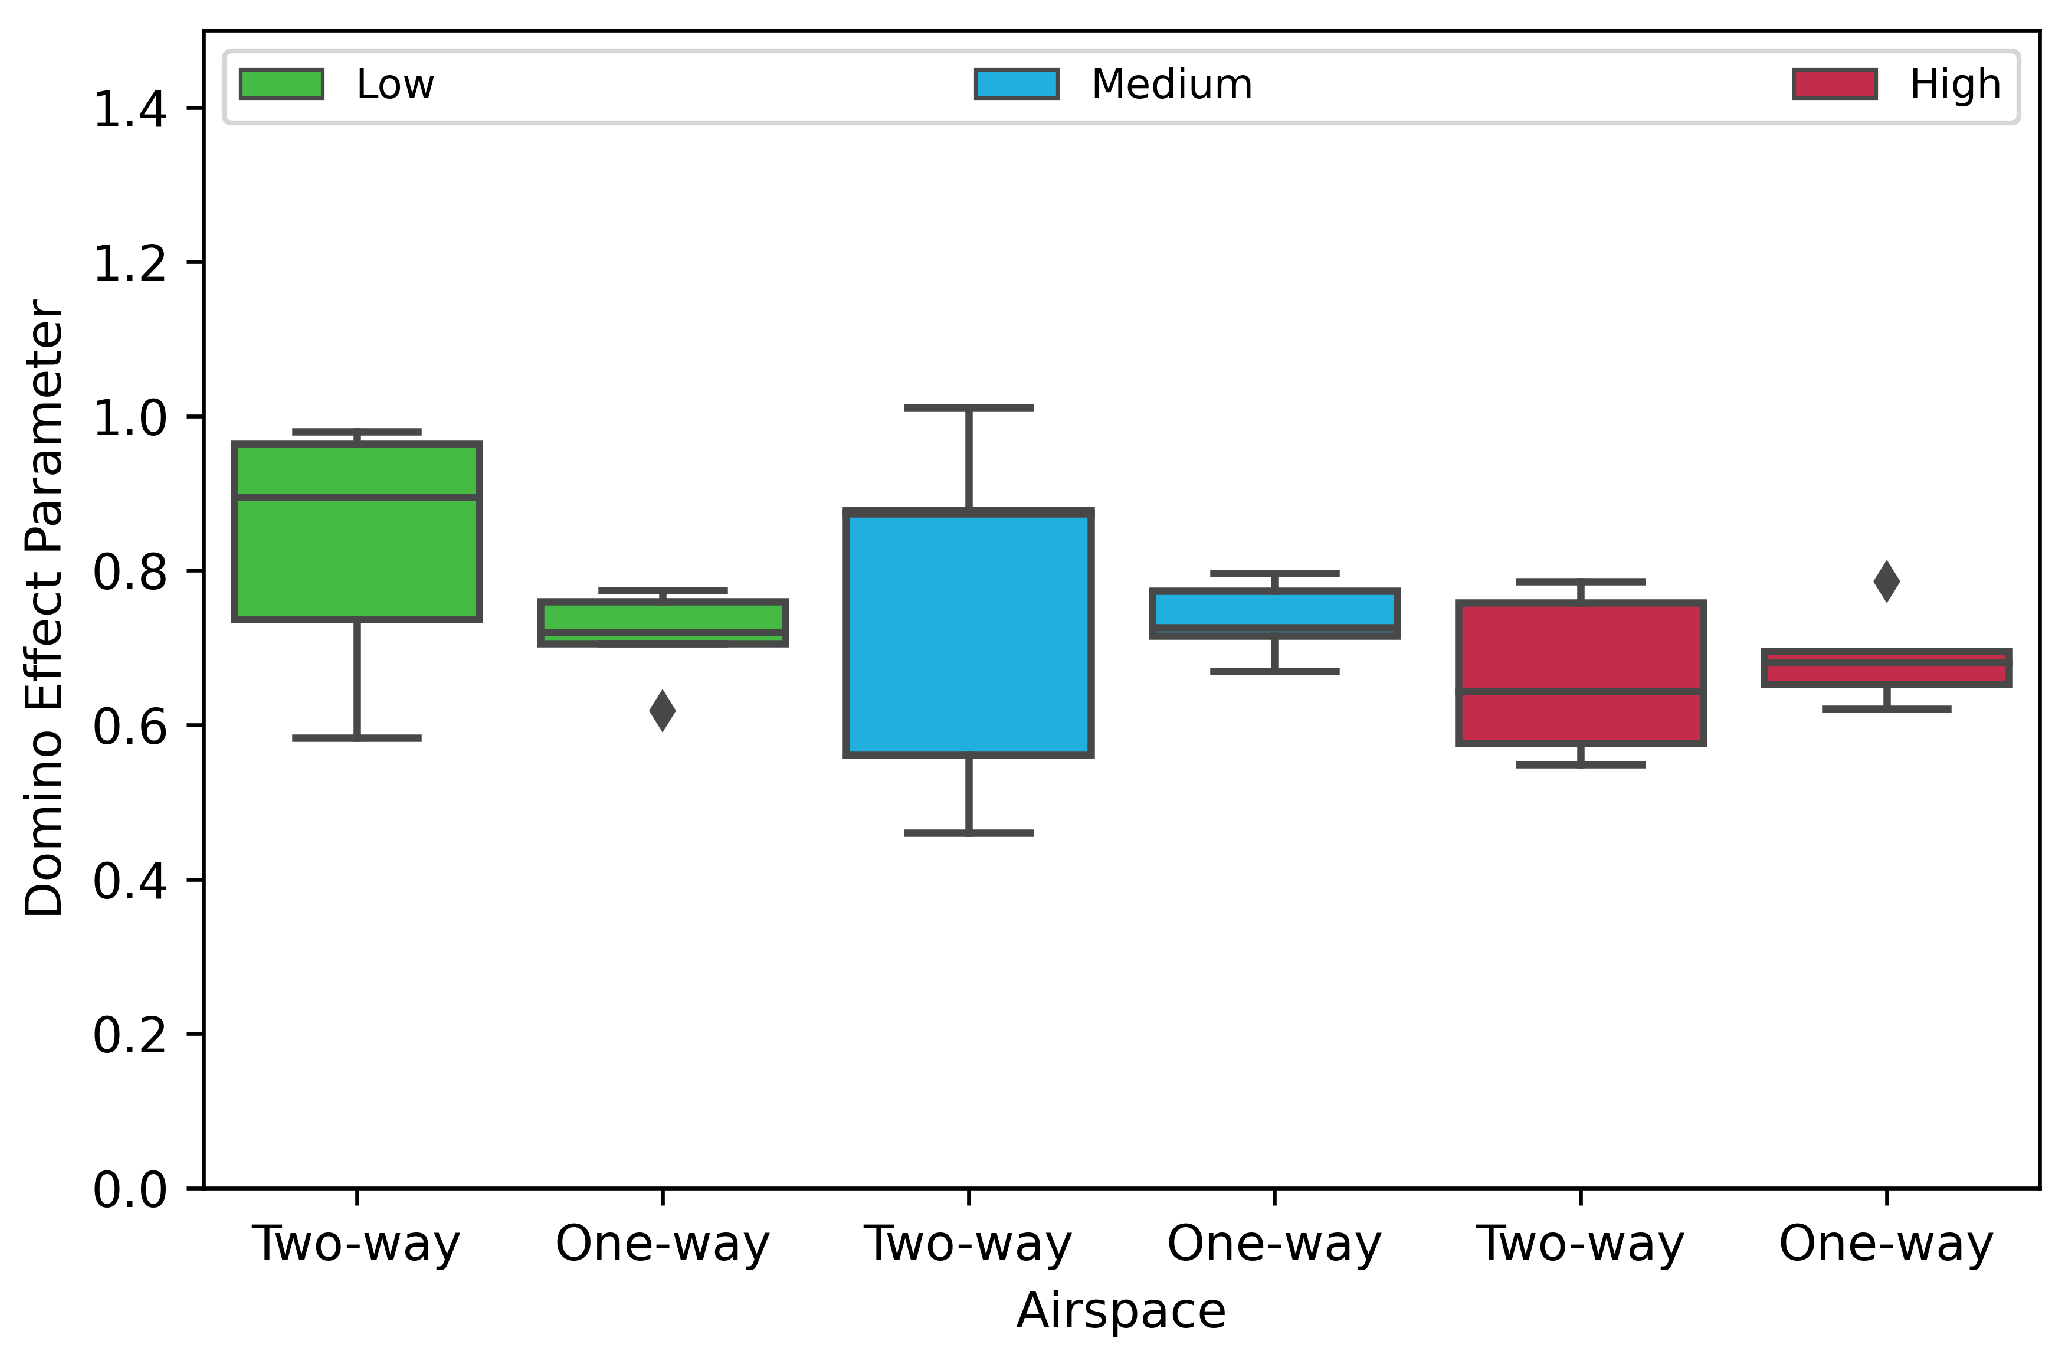
The airspace stability is measured via the Domino Effect Parameter (DEP) [58,59]. A high DEP indicates the presence of conflict chain reactions, thus causing the airspace to become unstable. Figure 9 depicts the DEP values. Notably, the range of DEP values of the one-way concept are slightly lower when compared to the two-way concept, hence indicating a lesser destabilising effect. This trend was also observed in the number of conflicts (see Figure 7). In all conditions, the DEP values are close to one, which indicates that each resolution of a conflict, on average, triggers, at-most, one additional conflict. Contrary to expectations, no effect of traffic density on stability is observed.

5.3. Throughput

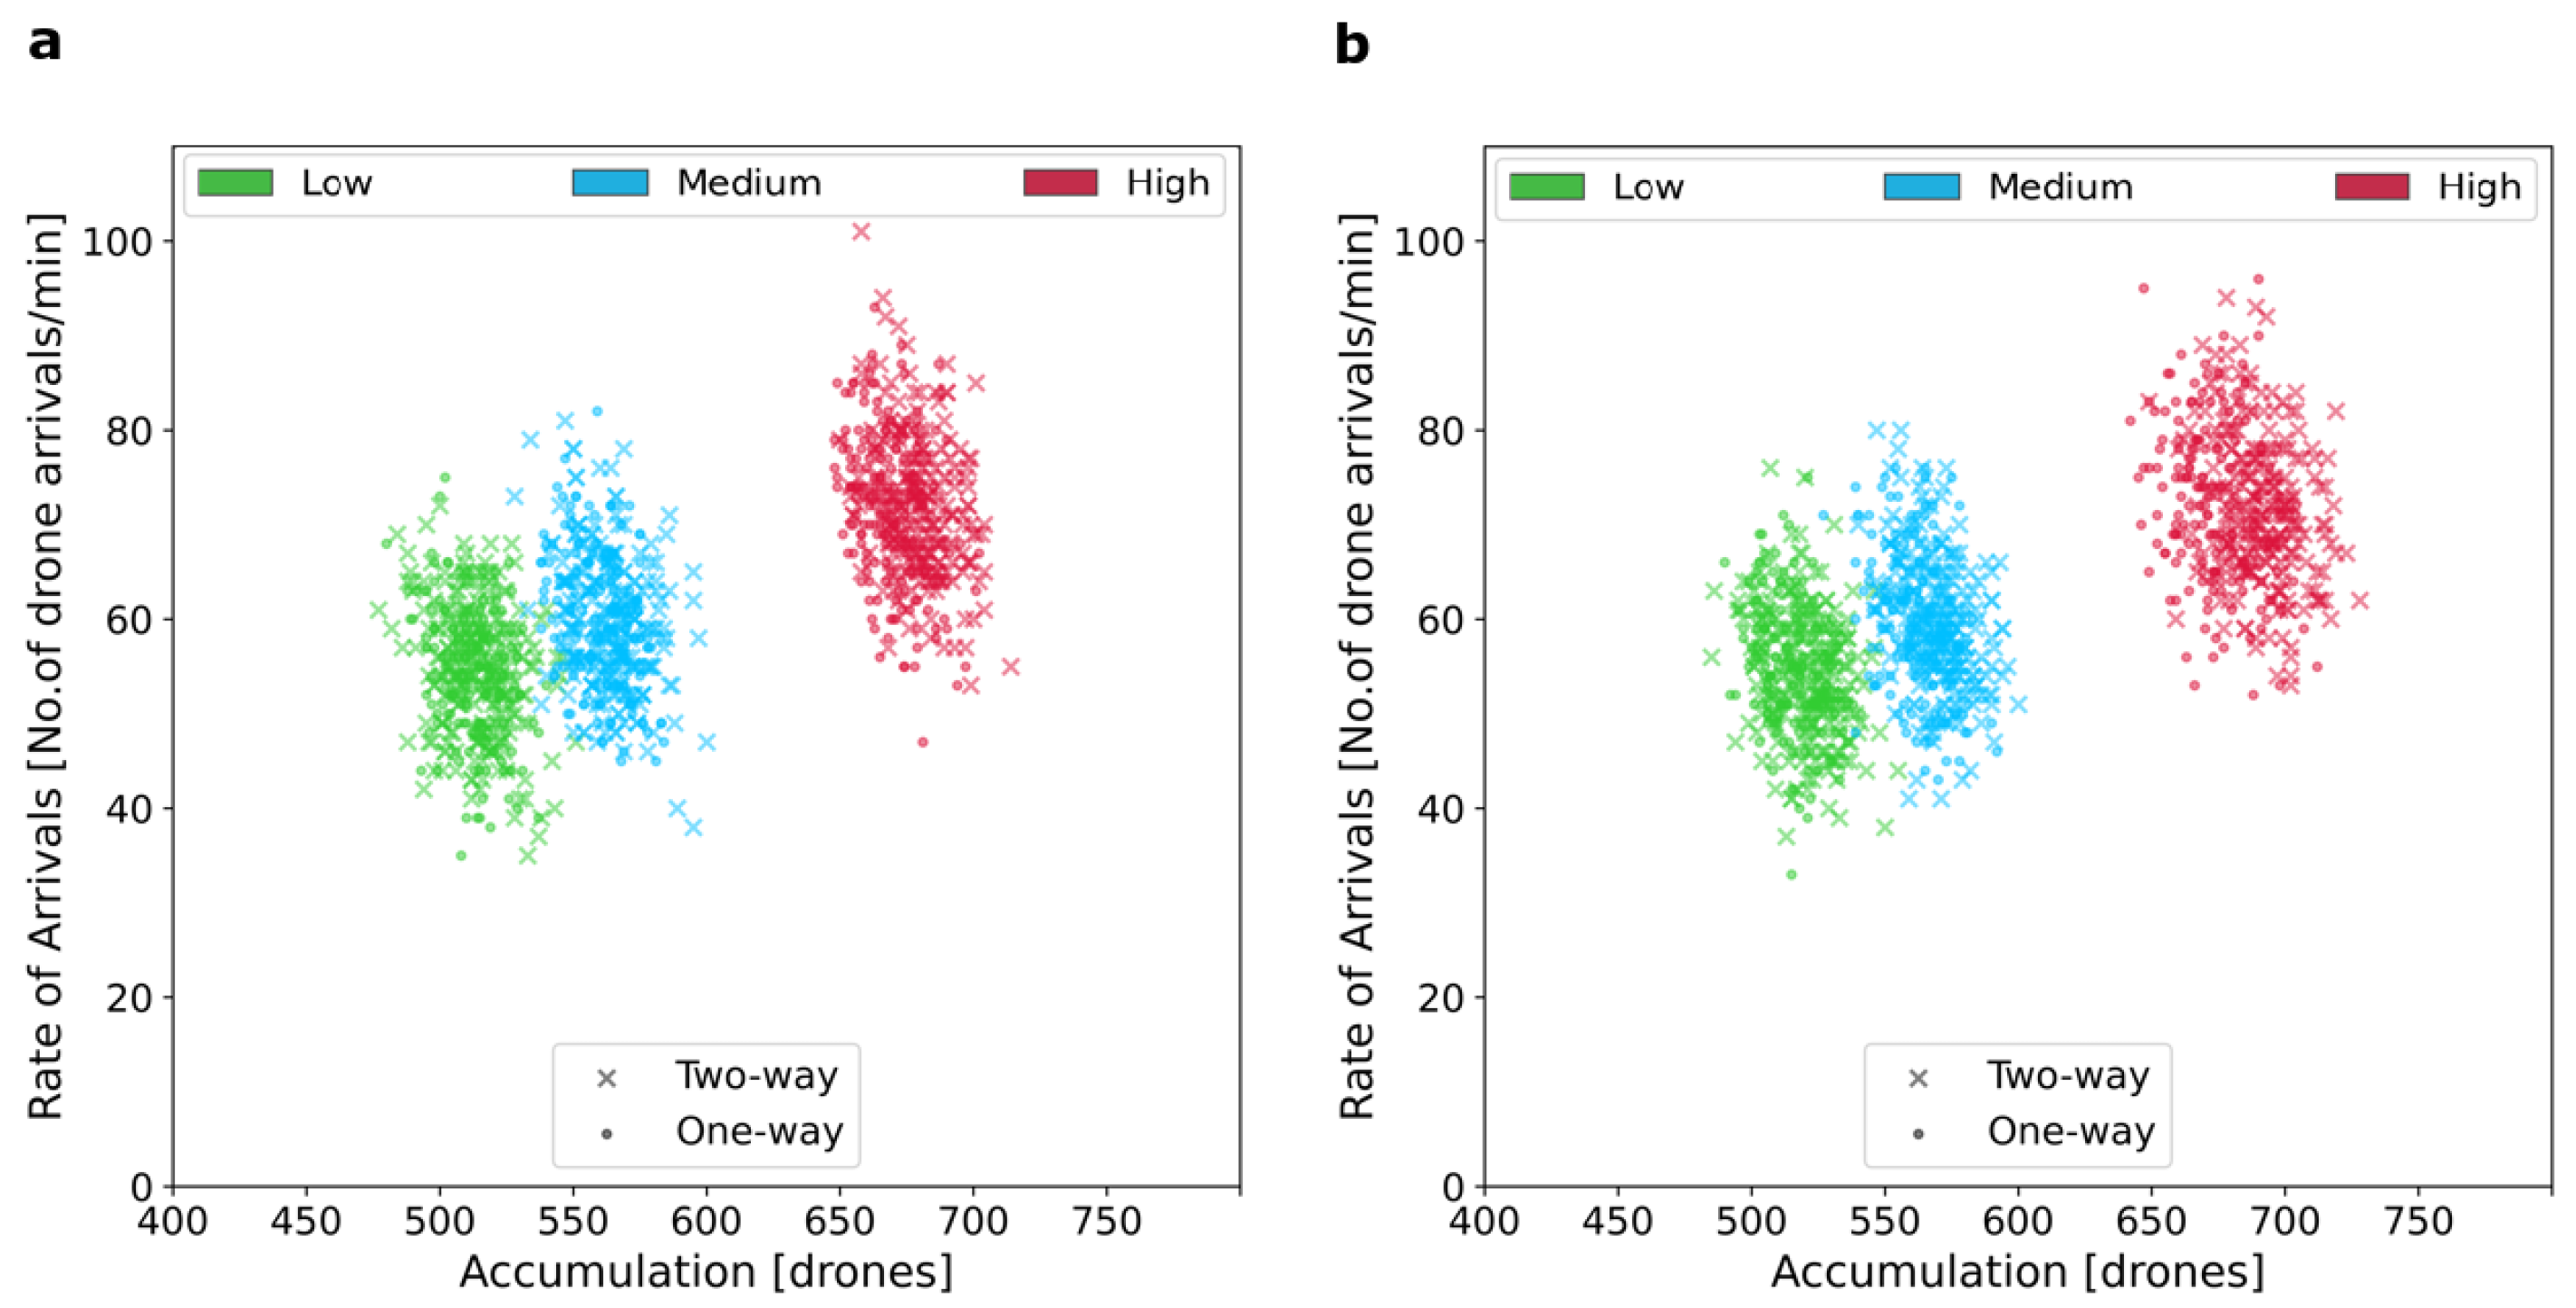
The number of drone arrivals per minute are determined by the rate of traffic demand (Figure 10). It can be seen that the rate of arrival has an upward trend from low to high traffic demand with and without conflict resolution for the two-way and one-way airspace concept. However, on the contrary to the experimental hypothesis, however, both airspace concepts demonstrate similar rate of arrivals for each traffic demand category (Figure 10). This increase in the rate of arrivals across the three traffic demand levels indicates that the network has not reached its maximum capacity [60]. In other words, traffic flow in both concepts is not congested.

5.4. Average Number of Turns

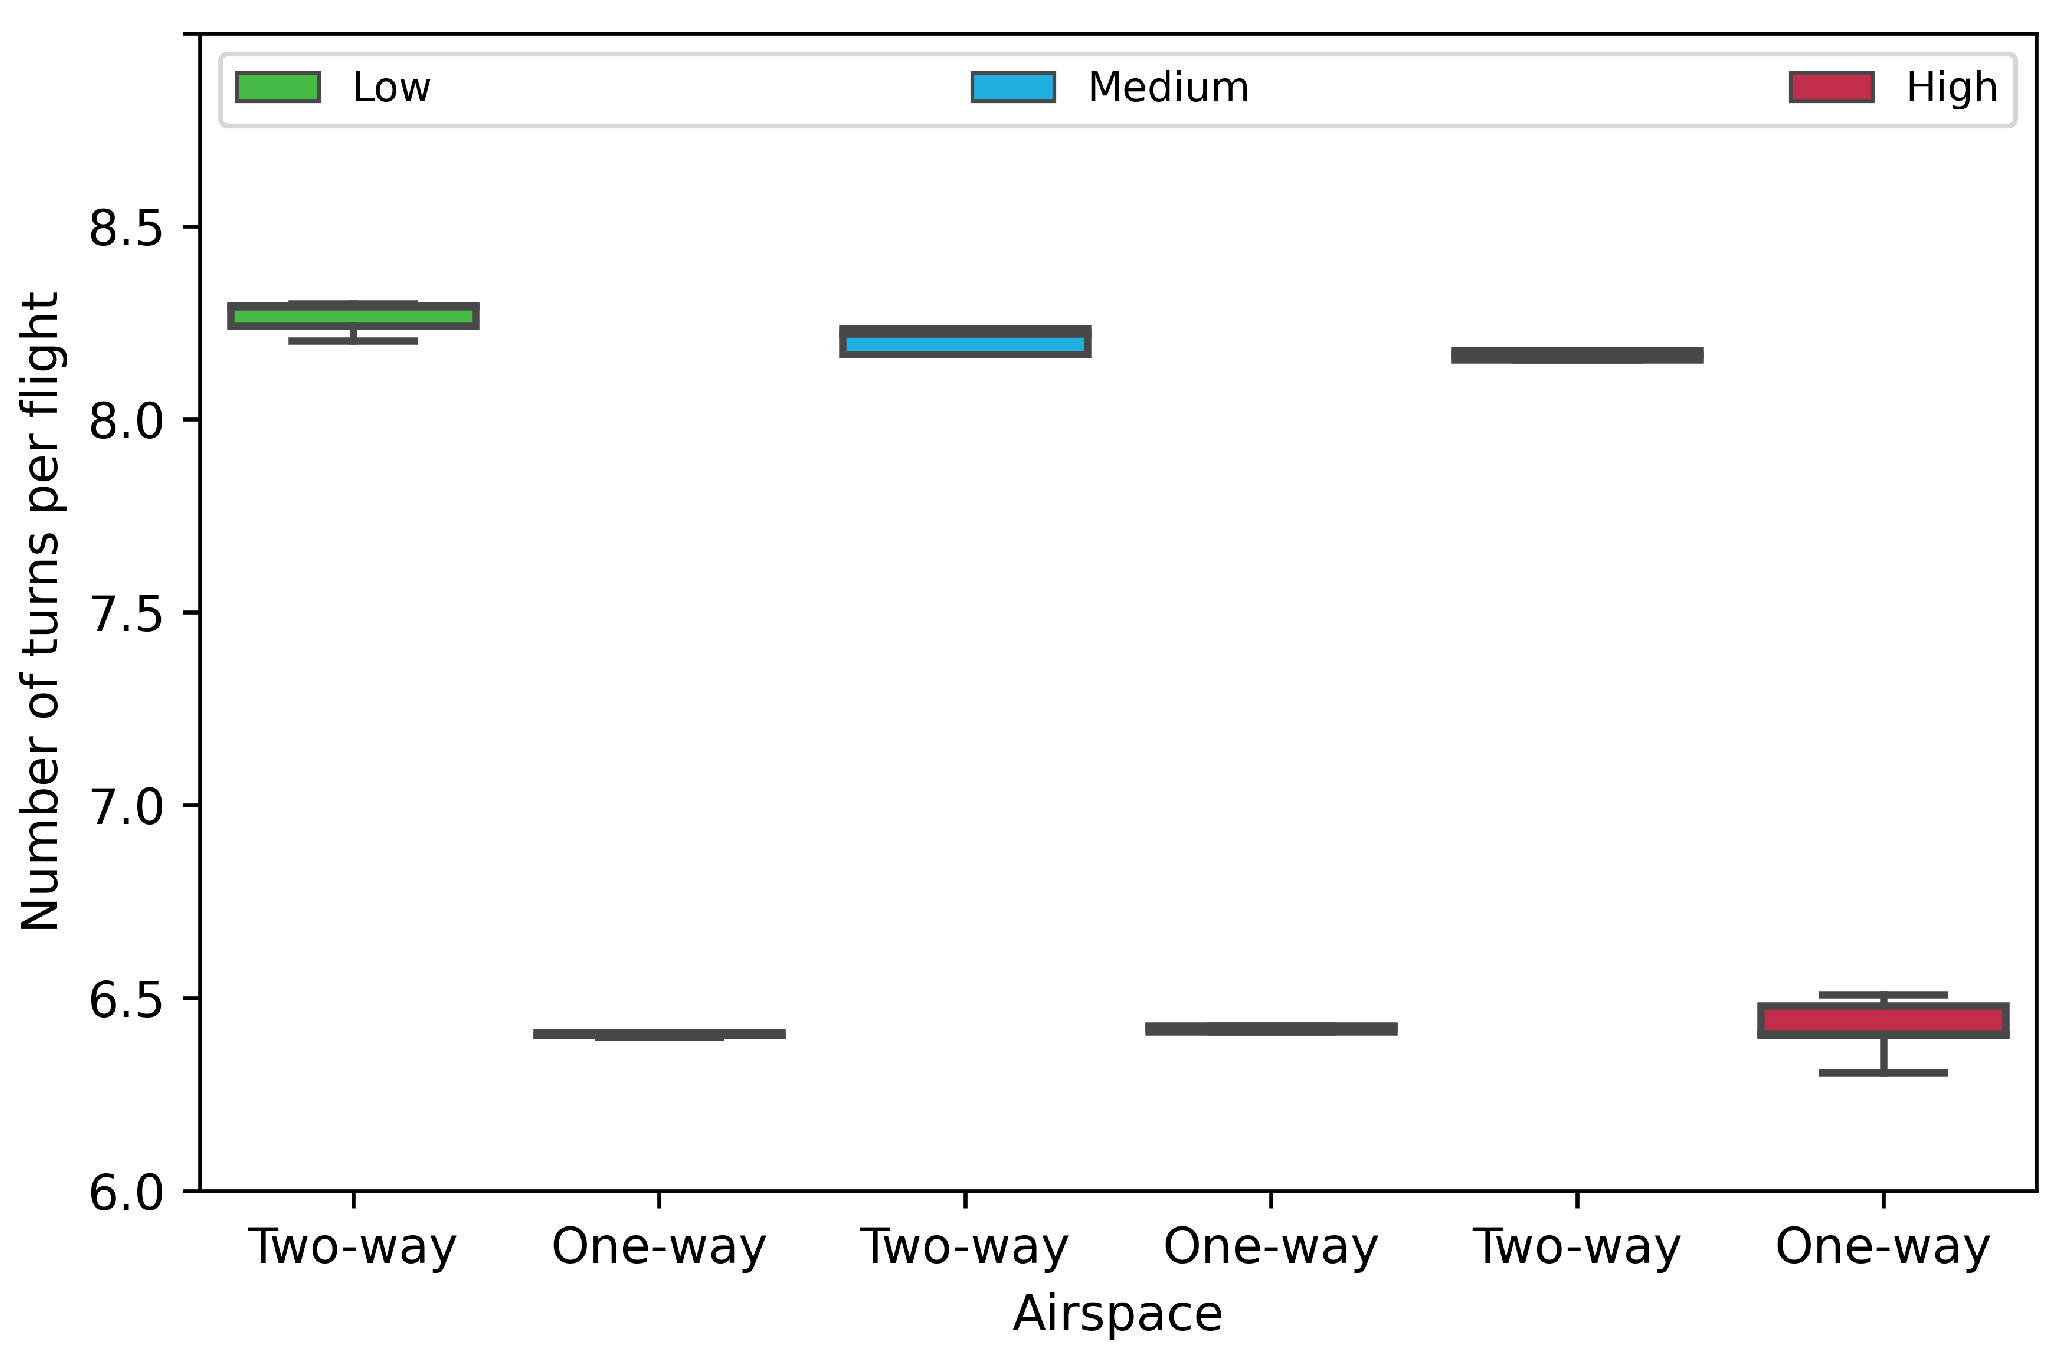
Figure 11 presents the number of turns per flight-plan for both airspace concepts. Interestingly, for uniformly distributed trip distances, the two-way airspace concept contained slightly more than eight turns per flight-plan while the one-way concept had close to six and a half turns per flight-plan, on average.

5.5. Cumulative Travel Time

The relatively higher number of turns, between the two-way and one-way concept, had no significant impact on the cumulative travel times, as illustrated in Figure 12. In addition, the cumulative travel times showed no significant difference with and without conflict resolution (Figure 12). Both of the concepts demonstrate similar cumulative travel times.

6. Discussion

Traffic culminating from drone-based package delivery has the potential to proliferate the very low altitude urban airspace in high densities and accommodating such traffic will become a challenge. Currently, heavy reliance has been placed on measures, such as 4-D trajectory planning and detect-and-avoid technologies [26]. However, employing the latter methods alone may adversely affect the overall safety of the airspace [20,61,62]. What is needed is a concerted effort between the airspace design and the tactical conflict resolution measures. Yet, less is known regarding how the urban airspace can be effectively organised and structured for high-density drone traffic operations. In this current study, we give an example of how the principles of traffic alignment and segmentation can be applied to the heavily-constrained airspace above the existing urban street network, in an effort to facilitate large-scale drone traffic in the constrained very low-altitude airspace.
In this study, we investigated the performance of two concepts: a two-way and one-way urban airspace concept, which were subsequently applied to the street network of Manhattan, New York (encompassing an area of 59.1 km 2 ) in a comparative simulation experiment. With 60 randomised fast-time simulations that involved over 200,000 drone flights, we identified the one-way airspace concept as having better performance when compared to the two-way concept. The performance of both airspace concepts was evaluated while using a set of key metrics: safety, which measured the total number of conflicts and intrusions; stability, which evaluated the stability of the airspace concept using the Domino Effect Parameter; the throughput, which measured the rate of drone arrivals; the average number of turns per flight in each concept; and, the cumulative travel time.
The safety results that are presented in this study indicate that vertically segmenting traffic with respect to travel direction as well as imposing horizontal structure to the flow of drone traffic in a constrained urban environment is beneficial for airspace safety. The one-way concept demonstrated this. Fundamentally, this increase in safety is associated with segmentation and the reduction of relative velocities between cruising traffic as a result of greater alignment of cruising traffic in each respective altitude layer. These observations are consistent with previous studies on air traffic segmentation and alignment [18,27].
Even though the total number of intrusions decreased for both concepts when the tactical conflict resolution algorithm was switched on, the total number of conflicts was higher for both of the concepts. This increase in the total number of conflicts was caused by secondary conflicts or conflict chains due to the scarcity of the airspace, caused by the highly constrained airspace structure, when conflict resolutions take place. Having a constrained airspace limits flexibility for resolution manoeuvres and, therefore, creates secondary conflicts. Similar findings were also reported in the Metropolis airspace design study for two highly structured airspace concepts [17,18]. In this study, the formation of secondary conflicts was confirmed by positive values in the Domino Effect Parameter, which denoted, at most, one additional conflict per conflict resolution, in all three traffic demand cases for both airspace concepts. Such observations can be compared to on-ground highway traffic, for which the braking of a leading vehicle would cause the follower vehicles to brake without creating any instabilities to the traffic flow. However, if highway traffic demand is extreme, then instability to the flow of traffic can be expected. Therefore, in this current study, the one additional conflict per resolution or a Domino Effect Parameter close to one may not necessarily indicate airspace instability. Future studies should include greater traffic demand estimates to investigate whether the Domino Effect Parameter would increase beyond one.
In terms of efficiency, the rate of arrivals (throughput) was proportional to the traffic demand in both airspace concepts. This was opposite to what was initially hypothesised and, therefore, indicates that the network has not reached its maximum capacity. In particular, future work should investigate the performance of the two airspace concepts for much higher traffic demand levels in order to determine whether the network would become congested and, hence, reach its maximum capacity. Furthermore, the one-way concept consisted of additional altitude bands as compared to the two-way concept, on average. However, both of the concepts manifested a similar rate of arrivals, which is in contrary to our initial hypothesis. This means that having a higher number of vertical altitude bands to accommodate additional traffic per cardinal direction may not necessarily lead to higher rate of arrivals or throughput.
The average number of turns in a flight is the main difference between the airspace concepts. The two-way concept resulted in, on average, two additional turns per flight-plan, as compared to the one-way concept. This is in contrary to what was initially hypothesised and opposite to the findings that were reported in past on-ground transport street network studies [33,38]. This difference is a result of the horizontal constraints that are imposed to the traffic flow. When no horizontal structure is imposed to the flow of traffic, the routing algorithm [57], which finds a path from an origin to a given destination with the shortest distance, has many more possible combinations of paths to select. As a result, the chosen shortest-path may be a path with a relatively higher number of turns. However, when horizontal constraints are enforced to achieve one-way directional traffic flow, the possible combinations of shortest-paths to choose from is much lower and, thus, the selected path is one with a relatively lower number of turns.
Note that the routing algorithm causes this difference in the number of turnsy, and therefore not necessarily an inherent difference between the airspace concepts. In principle, the route optimisation algorithm can also be set up to optimise for minimum number of turns, which is known as the simplest path [63,64]. On the other hand, as compared to the two-way concept, the one-way concept provides twice as many vertical layers per allowed flight direction to evenly distribute flights along a given street. In the two-way concept, a similar distribution has to be achieved by spreading traffic over different (parallel) streets. This horizontal distribution has the potential to lead to (slightly) more turns, on average, per flight. The higher number of turns in the two-way concepts resulted in more drone flights reducing speed in order to turn safely. This extra number of turns in the two-way concept can also be traced back to the greater number of conflicts and intrusions, where a reduction of speeds at turns may have triggered a proportion of the conflicts and intrusions.
The findings in this study have some limitations. First, our simulations employed a testing region comprising of an orthogonal grid-like street network (i.e., Manhattan street network). Although orthogonal grid-like street networks are prevalent in many parts of the world [39], there still exist seven other types of common street networks [65]. Therefore, we caution extrapolating the findings to non-orthogonal street networks. Second, in our study the investigation of airspace safety was limited to the number of conflicts and intrusions. However, there are more conflict properties worth analysing, such as the location of where conflicts arise and end and, the type of conflicts, for example, the proportion of head-on, side and rear conflicts. Addressing the latter would further enhance our understanding of the observed differences between the two-way and one-way concept. Third, our study neglected meteorological effects such as hyperlocal wind. Depending on the direction and magnitude of the wind, drones could explore such meteorological effects to their advantage and thus allow for lower travel times and higher drone arrivals per minute. Conversely, hyperlocal wind could also concentrate traffic and force drones to fly off course, thereby reducing the overall safety of the airspace. Fourth, to reduce the complexity of our simulations, take-off and landing phases were not considered. The inclusion of these phases may negatively influence the safety results. Fifth, the findings of our study should not be extrapolated to fixed-wing drones, which have different performance characteristics compared to multi-rotor drones. Sixth, the current study focused on airspace designs that remain static over time and one that has uniform traffic distribution patterns. To cope with the paradigm of on-demand delivery services of express packages and fast-food meals, future drone delivery operations will require to operate in a flexible manner. This means that the traffic demand may evolve within a given time while some regions of the airspace will have more traffic than the rest hence, requiring the airspace to dynamically reconfigure [20].

7. Conclusions

Drone-based delivery of express parcels and fast-food meals is expected to operate in dense cities in high densities. Such applications may present several societal benefits with respect to air pollution, traffic congestion and, cost-savings to logistics providers. However, the urban airspace is heavily constrained because of existing street networks and its associated landform structures. As a result, accommodating large-scale drone traffic in constrained environments will become a major challenge. To better cope with this, the current study investigates two novel airspace design concepts, namely, the two-way and one-way concept, for the constrained urban environment. Based on the principles of traffic alignment and segmentation, both airspace concepts employed heading-altitude rules to vertically separate cruising traffic with respect to their heading directions. To simulate a constrained environment, the airspace concepts were applied to the street network of Manhattan, New York. A comparison of the performance of the two-way and one-way airspace concepts was conducted using 60 randomised fast-time simulations. Our results show that having vertically segmented altitude layers to accommodate traffic with similar directions and some horizontal constraints imposed to the flow of traffic, in a constrained urban environment, is beneficial for safety.
This study provides interesting avenues for future research. We recommend a follow-up study to examine the properties of traffic conflicts between the two-way and one-way concept. In addition, we encourage further studies to investigate dynamic airspace designs to cope with future on-demand drone-based delivery services of express packages and fast-food meal orders. Furthermore, future studies should examine the effect of hyperlocal winds to how it affects the distribution of traffic and the safety of the airspace. Future research should also consider the take-off and landing phases in the simulations.

Author Contributions

Conceptualization, M.D., J.E., V.L.K. and J.M.H.; methodology, M.D., J.E., V.L.K. and J.M.H.; software, M.D., J.E. and J.M.H.; validation, M.D., J.E. and J.M.H.; formal analysis, M.D.; investigation, M.D.; data curation, M.D.; writing—original draft preparation, M.D.; writing—review and editing, M.D., J.E., V.L.K. and J.M.H.; visualization, M.D.; supervision, J.E. and J.M.H. All authors have read and agreed to the published version of the manuscript.

Funding

This research received no external funding.

Institutional Review Board Statement

Not applicable.

Informed Consent Statement

Not applicable.

Data Availability Statement

The data presented in this study can be made available on request from the corresponding author.

Acknowledgments

This work benefited greatly from the open source tools BlueSky, OSMnx and their dependencies. We thank the three anonymous reviewers for their helpful comments and insights on the manuscript.

Conflicts of Interest

The authors declare no conflict of interest.

References

  1. Floreano, D.; Wood, R.J. Science, technology and the future of small autonomous drones. Nature 2015, 521, 460–466. [Google Scholar] [CrossRef] [PubMed] [Green Version]
  2. Candiago, S.; Remondino, F.; De Giglio, M.; Dubbini, M.; Gattelli, M. Evaluating Multispectral Images and Vegetation Indices for Precision Farming Applications from UAV Images. Remote Sens. 2015, 7, 4026–4047. [Google Scholar] [CrossRef] [Green Version]
  3. King, A. Technology: The future of agriculture. Nature 2017, 544, S21–S23. [Google Scholar] [CrossRef] [PubMed] [Green Version]
  4. Coops, N.; Goodbody, T.R.H.; Lin, C. Four steps to extend drone use in research. Nature 2019, 572, 433–435. [Google Scholar] [CrossRef] [PubMed]
  5. Francisco, M. Organ delivery by 1000 drones. Nat. Biotechnol. 2016, 34, 684. [Google Scholar] [CrossRef] [PubMed]
  6. Lin, C.; Shah, K.; Mauntel, C.; Shah, S. Drone delivery of medications: Review of the landscape and legal considerations. Bull. Am. Soc. Hosp. Pharm. 2018, 75, 153–158. [Google Scholar] [CrossRef]
  7. Kasliwal, A.; Furbush, N.J.; Gawron, J.H.; Mcbride, J.R.; Wallington, T.J.; Kleine, R.D.D.; Kim, H.C.; Keoleian, G.A. Role of flying cars in sustainable mobility. Nat. Commun. 2019, 10. [Google Scholar] [CrossRef] [Green Version]
  8. Bamburry, D. Drones: Designed for product delivery. Des. Manag. Rev. 2015, 26, 40–48. [Google Scholar] [CrossRef]
  9. Frachtenberg, E. Practical drone delivery. Computer 2019, 52, 53–57. [Google Scholar] [CrossRef]
  10. Hawkins, A.J. UPS Seeks Government Approval for ‘Advanced’ Drone Delivery Service: The Delivery Giant Could be Permitted to Fly Drones over Populated Areas. 2019. Available online: https://www.theverge.com/2019/7/23/20707470/ups-drone-delivery-faa-certification-approval (accessed on 12 October 2020).
  11. Krader, K. Uber Wants Your Next Big Mac to Be Delivered by Drone. 2019. Available online: https://www.bloomberg.com/news/articles/2019-06-12/uber-announces-plans-to-deliver-big-macs-by-drone-this-summer (accessed on 12 October 2020).
  12. FedEx. Drone Deliveries Coming Soon, as Wing Unveils Plans for First-of-its-Kind Trial with FedEx and Walgreens. 2019. Available online: https://www.freightcomms.net/drone-deliveries-coming-soon-as-wing-unveils-plans-for-first-of-its-kind-trial-with-fedex-and-walgreens/ (accessed on 12 October 2020).
  13. Levin, A. Amazon’s Drone Delivery Fleet Hits Milestone with FAA Clearance. 2020. Available online: https://www.bloombergquint.com/business/amazon-s-drone-delivery-fleet-hits-milestone-with-faa-clearance (accessed on 12 October 2020).
  14. Stolaroff, J.K.; Samaras, C.; Mitchell, A.S.; Ceperley, D.; Neill, E.R.O.; Lubers, A. Energy use and life cycle greenhouse gas emissions of drones for commercial package delivery. Nat. Commun. 2018, 1–13. [Google Scholar] [CrossRef]
  15. Doole, M.; Ellerbroek, J.; Hoekstra, J. Drone delivery: Urban airspace traffic density estimation. In Proceedings of the SESAR Innovation Days, Salzburg, Austria, 3–7 December 2018. [Google Scholar]
  16. Doole, M.; Ellerbroek, J.; Hoekstra, J. Estimation of traffic density from drone-based delivery in very low level urban airspace. J. Air Transp. Manag. 2020, 88, 101862. [Google Scholar] [CrossRef]
  17. Sunil, E.; Hoekstra, J.; Ellerbroek, J.; Bussink, F.; Nieuwenhuisen, D.; Vidosavljevic, A.; Kern, S. Metropolis: Relating Airspace Structure and Capacity for Extreme Traffic Densities. In Proceedings of the 11th USA/Europe Air Traffic Management Research and Development Seminar, Lisbon, Portugal, 23–26 June 2015. [Google Scholar]
  18. Sunil, E.; Hoekstra, J.; Ellerbroek, J.; Bussink, F.; Nieuwenhuisen, D.; Vidosavljevic, A.; Kern, S. Analysis of airspace structure and capacity for decentralised separation using fast-time simulations. J. Guid. Control. Dyn. 2017, 40, 38–51. [Google Scholar] [CrossRef] [Green Version]
  19. Hoekstra, J.M.; Maas, J.; Tra, M.; Sunil, E. How do layered airspace design parameters affect airspace capacity and safety? In Proceedings of the 7th International Conference on Research in Air Transportation, Philadelphia, PA, USA, 20–24 June 2016. [Google Scholar]
  20. Hoekstra, J.M.; Ellerbroek, J.; Sunil, E.; Maas, J. Geovectoring: Reducing Traffic Complexity to Increase the Capacity of UAV airspace. In Proceedings of the 8th International Conference for Research in Air Transportation, Barcelona, Spain, 26–29 June 2018. [Google Scholar]
  21. Sunil, E.; Ellerbroek, J.; Hoekstra, J.M.; Maas, J. Three-dimensional conflict count models for unstructured and layered airspace designs. Transp. Res. Part C Emerg. Technol. 2018, 95, 295–319. [Google Scholar] [CrossRef]
  22. Primatesta, S.; Guglieri, G.; Rizzo, A. A Risk-Aware Path Planning Strategy for UAVs in Urban Environments. J. Intell. Robot. Syst. 2019, 629–643. [Google Scholar] [CrossRef]
  23. Xu, C.; Member, S.; Liao, X. Recent Research Progress of Unmanned Aerial Vehicle Regulation Policies and Technologies in Urban Low Altitude. IEEE Access 2020, 8, 74175–74194. [Google Scholar] [CrossRef]
  24. Pang, B.; Dai, F.; Low, K.H. Risk Assessment Model for UAV Cost-Effective Path Planning in Urban Environments. IEEE Access 2020, 8. [Google Scholar] [CrossRef]
  25. Bahabry, A.; Wan, X.; Ghazzai, H.; Menouar, H.; Vesonder, G.; Massoud, Y. Low-Altitude Navigation for Multi-Rotor Drones in Urban Areas. IEEE Access 2019, 7, 87716–87731. [Google Scholar] [CrossRef]
  26. Barrado, C.; Boyero, M.; Brucculeri, L.; Ferrara, G.; Hately, A.; Hullah, P.; Martin-marrero, D.; Pastor, E.; Rushton, A.P.; Volkert, A. U-Space Concept of Operations: A Key Enabler for Opening Airspace to Emerging Low-Altitude Operations. Aerospace 2020, 7, 24. [Google Scholar] [CrossRef] [Green Version]
  27. Sunil, E. Analyzing and Modeling Capacity for Decentralized Air Traffic Control. Ph.D. Thesis, Delft University of Technology, Delft, The Netherlands, 2019. [Google Scholar] [CrossRef]
  28. Ford, R. On the use of height rules in off-route airspace. J. Navig. 1983, 2, 269–287. [Google Scholar] [CrossRef]
  29. ICAO. Annex 2, Rules of the Air; ICAO: Montreal, QC, Canada, 2005. [Google Scholar]
  30. Barrington-leigh, C.; Millard-ball, A. A century of sprawl in the United States. Proc. Natl. Acad. Sci. USA 2015, 112, 8244–8249. [Google Scholar] [CrossRef] [Green Version]
  31. Chakroborty, P.; Das, A. Principles of Transportation Engineering; PHI Learning Pvt. Ltd.: Delhi, India, 2005; p. 520. [Google Scholar]
  32. Fortuijn, L. Turbo Roundabouts Design Principles and Safety Performance. Transp. Res. Rec. J. Transp. Res. Board 2009, 2096, 16–24. [Google Scholar] [CrossRef]
  33. Gayah, V.V.; Daganzo, C.F. Analytical Capacity Comparison of One-Way and Two-Way Signalized Street Networks. Transp. Res. Rec. J. Transp. Res. Board 2012, 2301, 76–85. [Google Scholar] [CrossRef]
  34. Petrovsky, A.; Doole, M.; Ellerbroek, J.; Hoekstra, J.M.; Tomasello, F. Challenges with obstacle data for manned and unmanned aviation. Int. Arch. Photogramm. Remote Sens. Spat. Inf.-Sci. 2018, 42, 143–149. [Google Scholar] [CrossRef] [Green Version]
  35. Slinn, M.; Matthews, P.; Guest, P. Traffic Engineering Design: Principles and Practice; Butterworth-Heinemann: Oxford, UK, 2005; pp. 76–163. [Google Scholar] [CrossRef]
  36. Garber, N.; Hoel, L. Traffic & Highway Engineering; Cengage Learning: Boston, MA, USA, 2008; p. 937. [Google Scholar]
  37. Kutz, M. Handbook of Transportation Engineering; McGraw-Hill: New York, NY, USA, 2013; Volume 42, p. 363. [Google Scholar] [CrossRef]
  38. Ortigosa, J.; Gayah, V.V.; Menendez, M. Transportmetrica B: Transport Dynamics Analysis of one-way and two-way street configurations on urban grid networks ABSTRACT. Transp. B Transp. Dyn. 2017, 7, 1–21. [Google Scholar] [CrossRef] [Green Version]
  39. Boeing, G. Urban spatial order: Street network orientation, configuration, and entropy. Appl. Netw. Sci. 2019, 4, 1–19. [Google Scholar] [CrossRef] [Green Version]
  40. Agatz, N.; Bouman, P.; Schmidt, M. Optimization Approaches for the Traveling Salesman Problem with Drone Optimization Approaches for the Traveling Salesman Problem with Drone. Transp. Sci. 2018, 52, 965–981. [Google Scholar] [CrossRef]
  41. Hoekstra, J.; Ellerbroek, J.; Hoekstra, J.M. BlueSky ATC Simulator Project: An Open Data and Open Source Approach Three-Dimensional Airborne Separation Assistance Displays View project BlueSky-Open source ATM simulator View project BlueSky ATC Simulator Project: An Open Data and Open Source Approach. In Proceedings of the 7th International Conference for Research on Air Transport (ICRAT), Philadelphia, PA, USA, 20–24 June 2016. [Google Scholar]
  42. BlueSky. TUDelft-CNS-ATM/BlueSky. 2020. Available online: https://github.com/TUDelft-CNS-ATM/bluesky (accessed on 3 March 2020).
  43. Hampson, M. Maryland Test Confirms Drones Can Safely Deliver Human Organs. In IEEE Spectrum; Information Inc.: Bethesda, MD, USA, 2018. [Google Scholar]
  44. Ding, Y. E-Commerce Giant JD.Com’s New Delivery Drone Takes Flight. 2021. Available online: https://www.caixinglobal.com/2020-12-25/e-commerce-giant-jdcoms-new-delivery-drone-takes-flight-101643197.html (accessed on 19 January 2021).
  45. Gudmundsson, A.; Mohajeri, N. Entropy and order in urban street networks. Sci. Rep. 2013, 3, 1–8. [Google Scholar] [CrossRef] [Green Version]
  46. Boeing, G. Exploring Urban Form through OpenStreetMap Data: A Visual Introduction. In Urban Experience and Design: Comtemporary Perspectives on Improving the Public Realm; Routledge: London, UK, 2020; pp. 167–184. [Google Scholar]
  47. Barrington-Leigh, C.; Millard-Ball, A. More connected urban roads reduce US GHG emissions. Environ. Res. Lett. 2017, 12. [Google Scholar] [CrossRef]
  48. Barrington-leigh, C.; Millard-ball, A. Global trends toward urban street-network sprawl. Proc. Natl. Acad. Sci. USA 2020, 117, 1941–1950. [Google Scholar] [CrossRef] [Green Version]
  49. Rajendran, S.; Zack, J. Insights on strategic air taxi network infrastructure locations using an iterative constrained clustering approach. Transp. Res. Part E Logist. Transp. Rev. 2019, 128, 470–505. [Google Scholar] [CrossRef]
  50. Rajendran, S.; Shulman, J. Study of emerging air taxi network operation using discrete-event systems simulation approach. J. Air Transp. Manag. 2020, 87, 101857. [Google Scholar] [CrossRef]
  51. Boeing, G. Computers, Environment and Urban Systems OSMnx: New methods for acquiring, constructing, analyzing, and visualizing complex street networks. Comput. Environ. Urban Syst. 2017, 65, 126–139. [Google Scholar] [CrossRef] [Green Version]
  52. Ribeiro, M.; Ellerbroek, J.; Hoekstra, J.M. Review of Conflict Resolution Methods for Manned and Unmanned Aviation. Aerospace 2020, 6, 79. [Google Scholar] [CrossRef]
  53. Bulusu, V. Urban Air Mobility: Deconstructing the Next Revolution in Urban Transportation—Feasibility, Capacity and Productivity. Ph.D. Thesis, UC Berkeley, Berkeley, CA, USA, 2019. [Google Scholar]
  54. Sacharny, D.; Henderson, T.C. A lane-based approach for lage-scale strategic conflict management for UAS service suppliers. In Proceedings of the 2019 International Conference on Unmanned Aircraft Systems (ICUAS), Atlanta, GA, USA, 11–14 June 2019. [Google Scholar]
  55. Weinert, A.; Campbell, S.; Vela, A.; Schuldt, D.; Kurucar, J. Well-clear recommendation for small unmanned aircraft systems based on unmitigated collision risk. J. Air Transp. 2018, 26. [Google Scholar] [CrossRef] [Green Version]
  56. Alvarez, L.E.; Jessen, I.; Owen, M.; Silbermann, J.; Wood, P. ACAS sXU: Robust decentralized detect and avoid for small unmanned aircraft systems. In Proceedings of the 2019 IEEE/AIAA 38th Digital Avionics Systems Conference (DASC), San Diego, CA, USA, 8–12 September 2019. [Google Scholar] [CrossRef]
  57. Hagberg, A.; Schult, D.; Swart, P. Exploring network structure, dynamics, and function using NetworkX. In Proceedings of the 7th Python in Science Conference (SciPy2008), Pasadena, CA, USA, 19–24 August 2008; Volume 836, pp. 11–15. [Google Scholar]
  58. Krozel, J.; Peters, M.; Bilimoria, K.D.; Field, M.; Lee, C.; Mitchell, J.S.B. System Performance Characteristics of Centralized and Decentralized Air Traffic Separation Strategies. In Proceedings of the 4th USA/Europe Air Traffic Management R&D Seminar, Santa Fe, NM, USA, 3–7 December 2001; pp. 1–11. [Google Scholar]
  59. Jardin, M.R. Analytical Relationships Between Conflict Counts and Air-Traffic Density. J. Guid. Control Dyn. 2005, 28. [Google Scholar] [CrossRef]
  60. Loder, A.; Ambühl, L.; Menendez, M.; Axhausen, K.W. Understanding traffic capacity of urban networks. Sci. Rep. 2019, 9, 1–10. [Google Scholar] [CrossRef] [Green Version]
  61. Hoekstra, J.M.; Ruigrok, R.C.J.; Van Gent, R.N.H.W. Free Flight in a Crowded Airspace? In Proceedings of the 3rd USA/Europe Air Traffic Management R&D Seminar, Naples, Italy, 13–16 June 2000. [Google Scholar]
  62. Hoekstra, J.M.; Van Gent, R.N.; Ruigrok, R.C. Designing for Safety: The ‘Free Flight’ Air Traffic Management Concept. Reliab. Eng. Syst. Saf. 2002, 75. [Google Scholar] [CrossRef] [Green Version]
  63. Viana, M.P.; Strano, E.; Bordin, P.; Barthelemy, M. The simplicity of planar networks. Sci. Rep. 2013, 3, 1–6. [Google Scholar] [CrossRef]
  64. Barthelemy, M. From paths to blocks: New measures for street patterns. Environ. Plan. B Urban Anal. City Sci. 2017, 44, 257–271. [Google Scholar] [CrossRef]
  65. Barrington-leigh, C.; Millard-ball, A. A global assessment of street-network sprawl. PLoS ONE 2019, 14, e223078. [Google Scholar] [CrossRef]
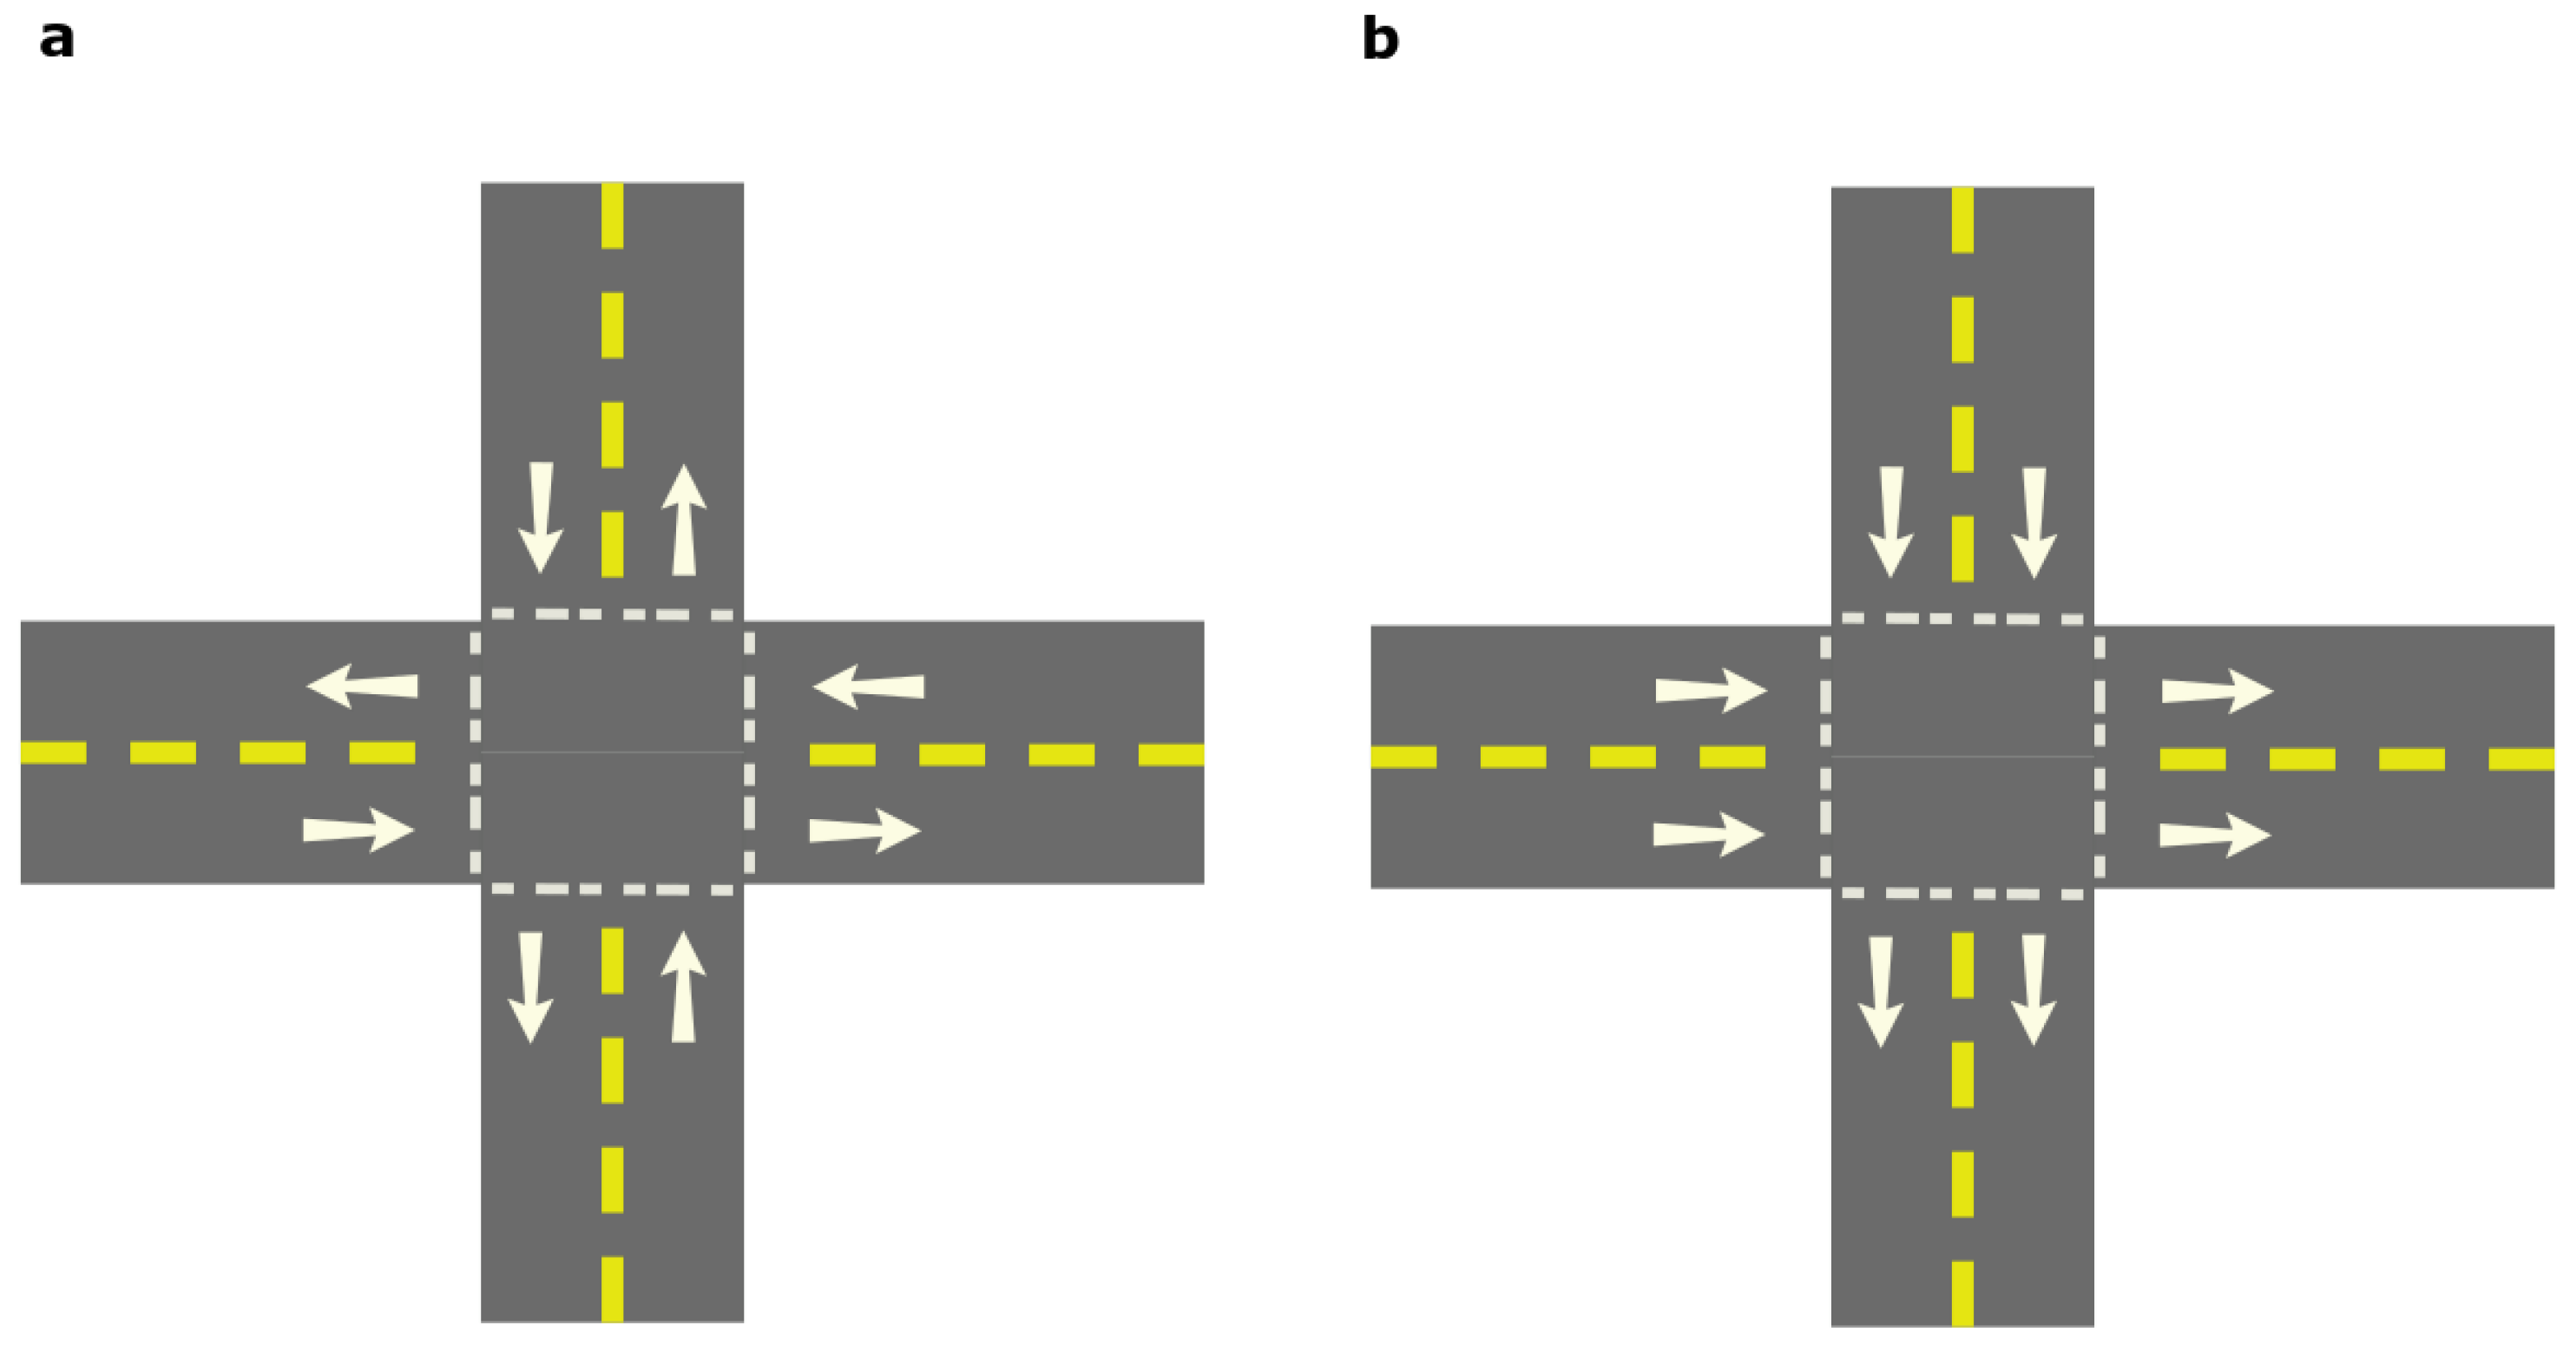
Figure 1. Typical intersection configuration for road-based traffic. (a) Two-way network. (b) One-way network. Note that the arrows depict the direction of traffic flow.
Aerospace 08 00038 g001
Figure 2. Difference between intrusions and conflicts between two drones in the horizontal plane. (a) An intrusion occurs when there is a violation of the separation boundary. (b) A conflict is an anticipated or predicted intrusion.
Aerospace 08 00038 g002
Figure 3. Schematic view for the complete set of altitude bands for the two urban airspace designs, where each altitude layer corresponds to its respective travel direction. Each concept has 40 altitude layers (which consist of 20 altitude layers allocated for through traffic and 20 altitude layers for turn traffic) from 75 to 1050 ft with a vertical spacing of 25 ft , respectively. The turn-layers are used for transitory flights, that is, drones that need to make turns/change direction at intersections. While the through-layers are utilised by through traffic, that is traffic passing through at least one intersection. (a) The two-way concept layer system for which traffic is allocated to the cardinal directions with respect to flight headings ( ψ ): 315 < ψ ≤ 045 headings assigned to north; 045 < ψ ≤ 135 headings to east; 135 < ψ ≤ 225 headings to south; and 225 < ψ ≤ 315 to west bound traffic. (b) One-way layer system where traffic with flight headings: 315 < ψ ≤ 045 and 135 < ψ ≤ 225 are assigned to north and south layers; and, traffic with flight headings between 045 < ψ ≤ 135 and 225 < ψ ≤ 315 are allocated to the east and west bound altitude layers. Of note, recognise that, when compared to the two-way concept, the one-way concept has north/south and east/west traffic assigned to one altitude layer, for which the separation of this traffic is assured by the spatial geometry of the urban street network.
Aerospace 08 00038 g003
Figure 4. Traffic flow at a typical four-leg intersection for the two-way airspace concept. The traffic is vertically segmented into different altitudes with respect to their travel direction. Note that the altitudes are presented in ft . (a) Altitude layers belonging to the through traffic, which 20 altitude layers consist. (b) Altitude layers allocated for turn traffic, which consist of 20 individual altitude layers. Of note, the through-layers accommodate traffic that pass through at least one intersection, while turn-layers accommodate traffic that is decelerating to make a turn at the intersection. Recognise that opposite traffic flows do not intersect at the intersection.
Aerospace 08 00038 g004
Figure 5. Traffic flow at a typical four-leg intersection for the one-way airspace concept. The traffic is vertically segmented into different altitudes with respect to their travel direction. Note that the altitudes are presented in ft . (a) Traffic flows belonging to the through-layers, which consist of 20 layers in total. (b) Traffic flows of the turn-layers, which consist of a total of 20 layers. The through-layers accommodate traffic that pass through at least one intersection, while turn-layers accommodate traffic that is decelerating to make a turn at the intersection. Note that opposite traffic flows do not intersect at the intersection.
Aerospace 08 00038 g005
Figure 6. Urban street network of Manhattan, New York City (with area size of 59.1 km 2 ), obtained from OpenStreetMap via OSMnx Python library [51]. The three red dots represent the (approximate) location of the chosen drone depots in our study.
Aerospace 08 00038 g006
Figure 7. The total number of pairwise conflicts for the two-way and one-way urban airspace concept for low, medium, and high traffic demands. (a) Without conflict resolution. (b) With conflict resolution.
Aerospace 08 00038 g007
Figure 8. The total number of pairwise intrusions for the two-way and one-way urban airspace concept for low, medium, and high traffic demands. (a) Without conflict resolution. (b) With conflict resolution.
Aerospace 08 00038 g008
Figure 9. Domino Effect Parameter (DEP) for the two-way and one-way urban airspace concept for low, medium and high traffic demands. Note that the one-way concept have slightly lower DEP values as compared to the two-way concept.
Aerospace 08 00038 g009
Figure 10. Rate of arrival for the two-way and one-way urban airspace concept for low, medium and high traffic demands. Each point represents the number of drone arrivals per minute. (a) Without conflict resolution. (b) With conflict resolution.
Aerospace 08 00038 g010
Figure 11. The number of turns per cumulative flight-plan for the two-way and one-way urban airspace concept.
Aerospace 08 00038 g011
Figure 12. The total travel time for the two-way and one-way urban airspace concept for low, medium and high traffic demands. (a) Without conflict resolution. (b) With conflict resolution.
Aerospace 08 00038 g012
Table 1. The main pros and cons of the two-way and one-way urban airspace concepts.
ConceptAdvantagesDisadvantages
Two-way• Flight-plans do not have to obey one-way directional constraints and thus no forced horizontal distribution.
• Traffic has less vertical layers per cardinal direction.
One-way• Better airspace utilisation due to additional layers per cardinal direction.
• Due to the imposed horizontal constraints, opposite traffic flows are spatially separated.• Flight routes may be less efficient due to the imposed one-way directional constraints.
Table 2. Performance data for DJI Matrice 600 Pro used in the simulations of this study.
ParameterDJI Matrice 600 Pro
Speed [m/s]5–10.3
Vertical speed [m/s]−5–5
Mass [kg]15
Maximum bank angle [ ]35
Acceleration/deceleration [m/ s 2 ]1.5
Table 3. Traffic density characteristics of the three demand scenarios for the simulation area of Manhattan, New York City, network consisting of an area of 59.1 km 2 .
LowMediumHigh
Traffic density (drones/km 2 )556173
Inflow rate (drones/min)546072
Hourly demand (drones/h)324036004320
Demand per depot (drones/depot)108012001440
Publisher’s Note: MDPI stays neutral with regard to jurisdictional claims in published maps and institutional affiliations.