Article

Fuel Tankering: Economic Benefits and Environmental Impact for Flights Up to 1500 NM (Full Tankering) and 2500 NM (Partial Tankering)

by
Laurent Tabernier
*,†,
Esther Calvo Fernández
,
Andreas Tautz
,
Robin Deransy
and
Peter Martin
European Organisation for the Safety of Air Navigation—EUROCONTROL, 91220 Brétigny/Orge, France
*
Author to whom correspondence should be addressed.
Authors contributed equally to this work.
Aerospace 2021, 8(2), 37; https://doi.org/10.3390/aerospace8020037
Submission received: 14 December 2020 / Revised: 15 January 2021 / Accepted: 26 January 2021 / Published: 31 January 2021

Abstract

:
The majority of emissions from aviation come from the combustion of the fuel required to operate each flight. Keeping the fuel consumption required for a safe flight to the absolute minimum is therefore the simplest and most effective way to ensure that emissions from that flight are kept to a minimum. In practice, however, the fuel load is determined by each aircraft operator on the basis of a number of criteria maximizing first cost efficiency, rather than fuel savings. In this context, tankering is the practice of carrying more fuel than is necessary for the safe execution of the flight to avoid or minimize refueling at the destination airport. It offers an economic advantage when there is a significant difference in fuel prices between the departure and arrival airports, but considerably increases the amount of emissions produced, because the more fuel an aircraft carries, the heavier it is, and carrying this extra weight increases its fuel consumption. This paper presents the steps followed by EUROCONTROL in conducting a first study to estimate the number of times this practice would offer an economic benefit and the amount of extra CO2 emissions that would result. This study, limited to flights up to 1500 and 2500 NM, corresponding mainly to short and medium-haul flights, estimates that, in 2018, 21% of ECAC (In this paper, ECAC refers to the geographical region defined by the 44 member states that signed the European Civil Aviation Conference) flights would perform fuel tankering beneficially. This would represent a net saving of 265 M€ per year for the airlines, but the burning of 286,000 tonnes of additional fuel (equivalent to 0.54% of ECAC jet fuel used), or 901,000 tonnes of CO2 per year. At a time when aviation is challenged for its contribution to climate change, the use of fuel tankering for economic reasons is therefore highly questionable.

1. Introduction

As aviation is a highly competitive market, airlines must do everything possible to minimize their operating costs, in particular regarding fuel cost, which account for 17 to 25% of their operating expenses [1]; this goes even up to 50% for some low-cost carriers. Furthermore, as the majority of aviation emissions come from the combustion of the fuel needed to operate each flight, it would seem logical that keeping the fuel consumption required for each flight to the absolute safe minimum is the simplest and most effective way to ensure that both the emissions from that flight and the total cost of the fuel embarked are minimized. This would mean carrying as little fuel as possible for the safe execution of each flight. This is not the case.
In practice, safety and special considerations at the destination airport aside, the fuel load is determined by each aircraft operator according to a number of criteria that maximize cost savings rather than fuel savings.
Fuel tankering is a practice used in this context.

2. What Is Fuel Tankering

Fuel tankering is a practice whereby an aircraft carries more fuel than required for its safe flight in order to reduce or avoid refueling at the destination airport [2].
Fuel tankering can be done for two reasons:
  • When it is operationally not possible or desirable to refuel at the destination airport, due to circumstances, such as the following:
    social disruption;
    technical failures of the refueling installation;
    fuel shortages;
    contaminated fuel at destination airport;
    very short turnaround times;
    risks of delays.
  • To achieve savings when the cost of fuel and associated services at the departure airport is significantly lower than at the destination airport.
There are two types of fuel tankering:
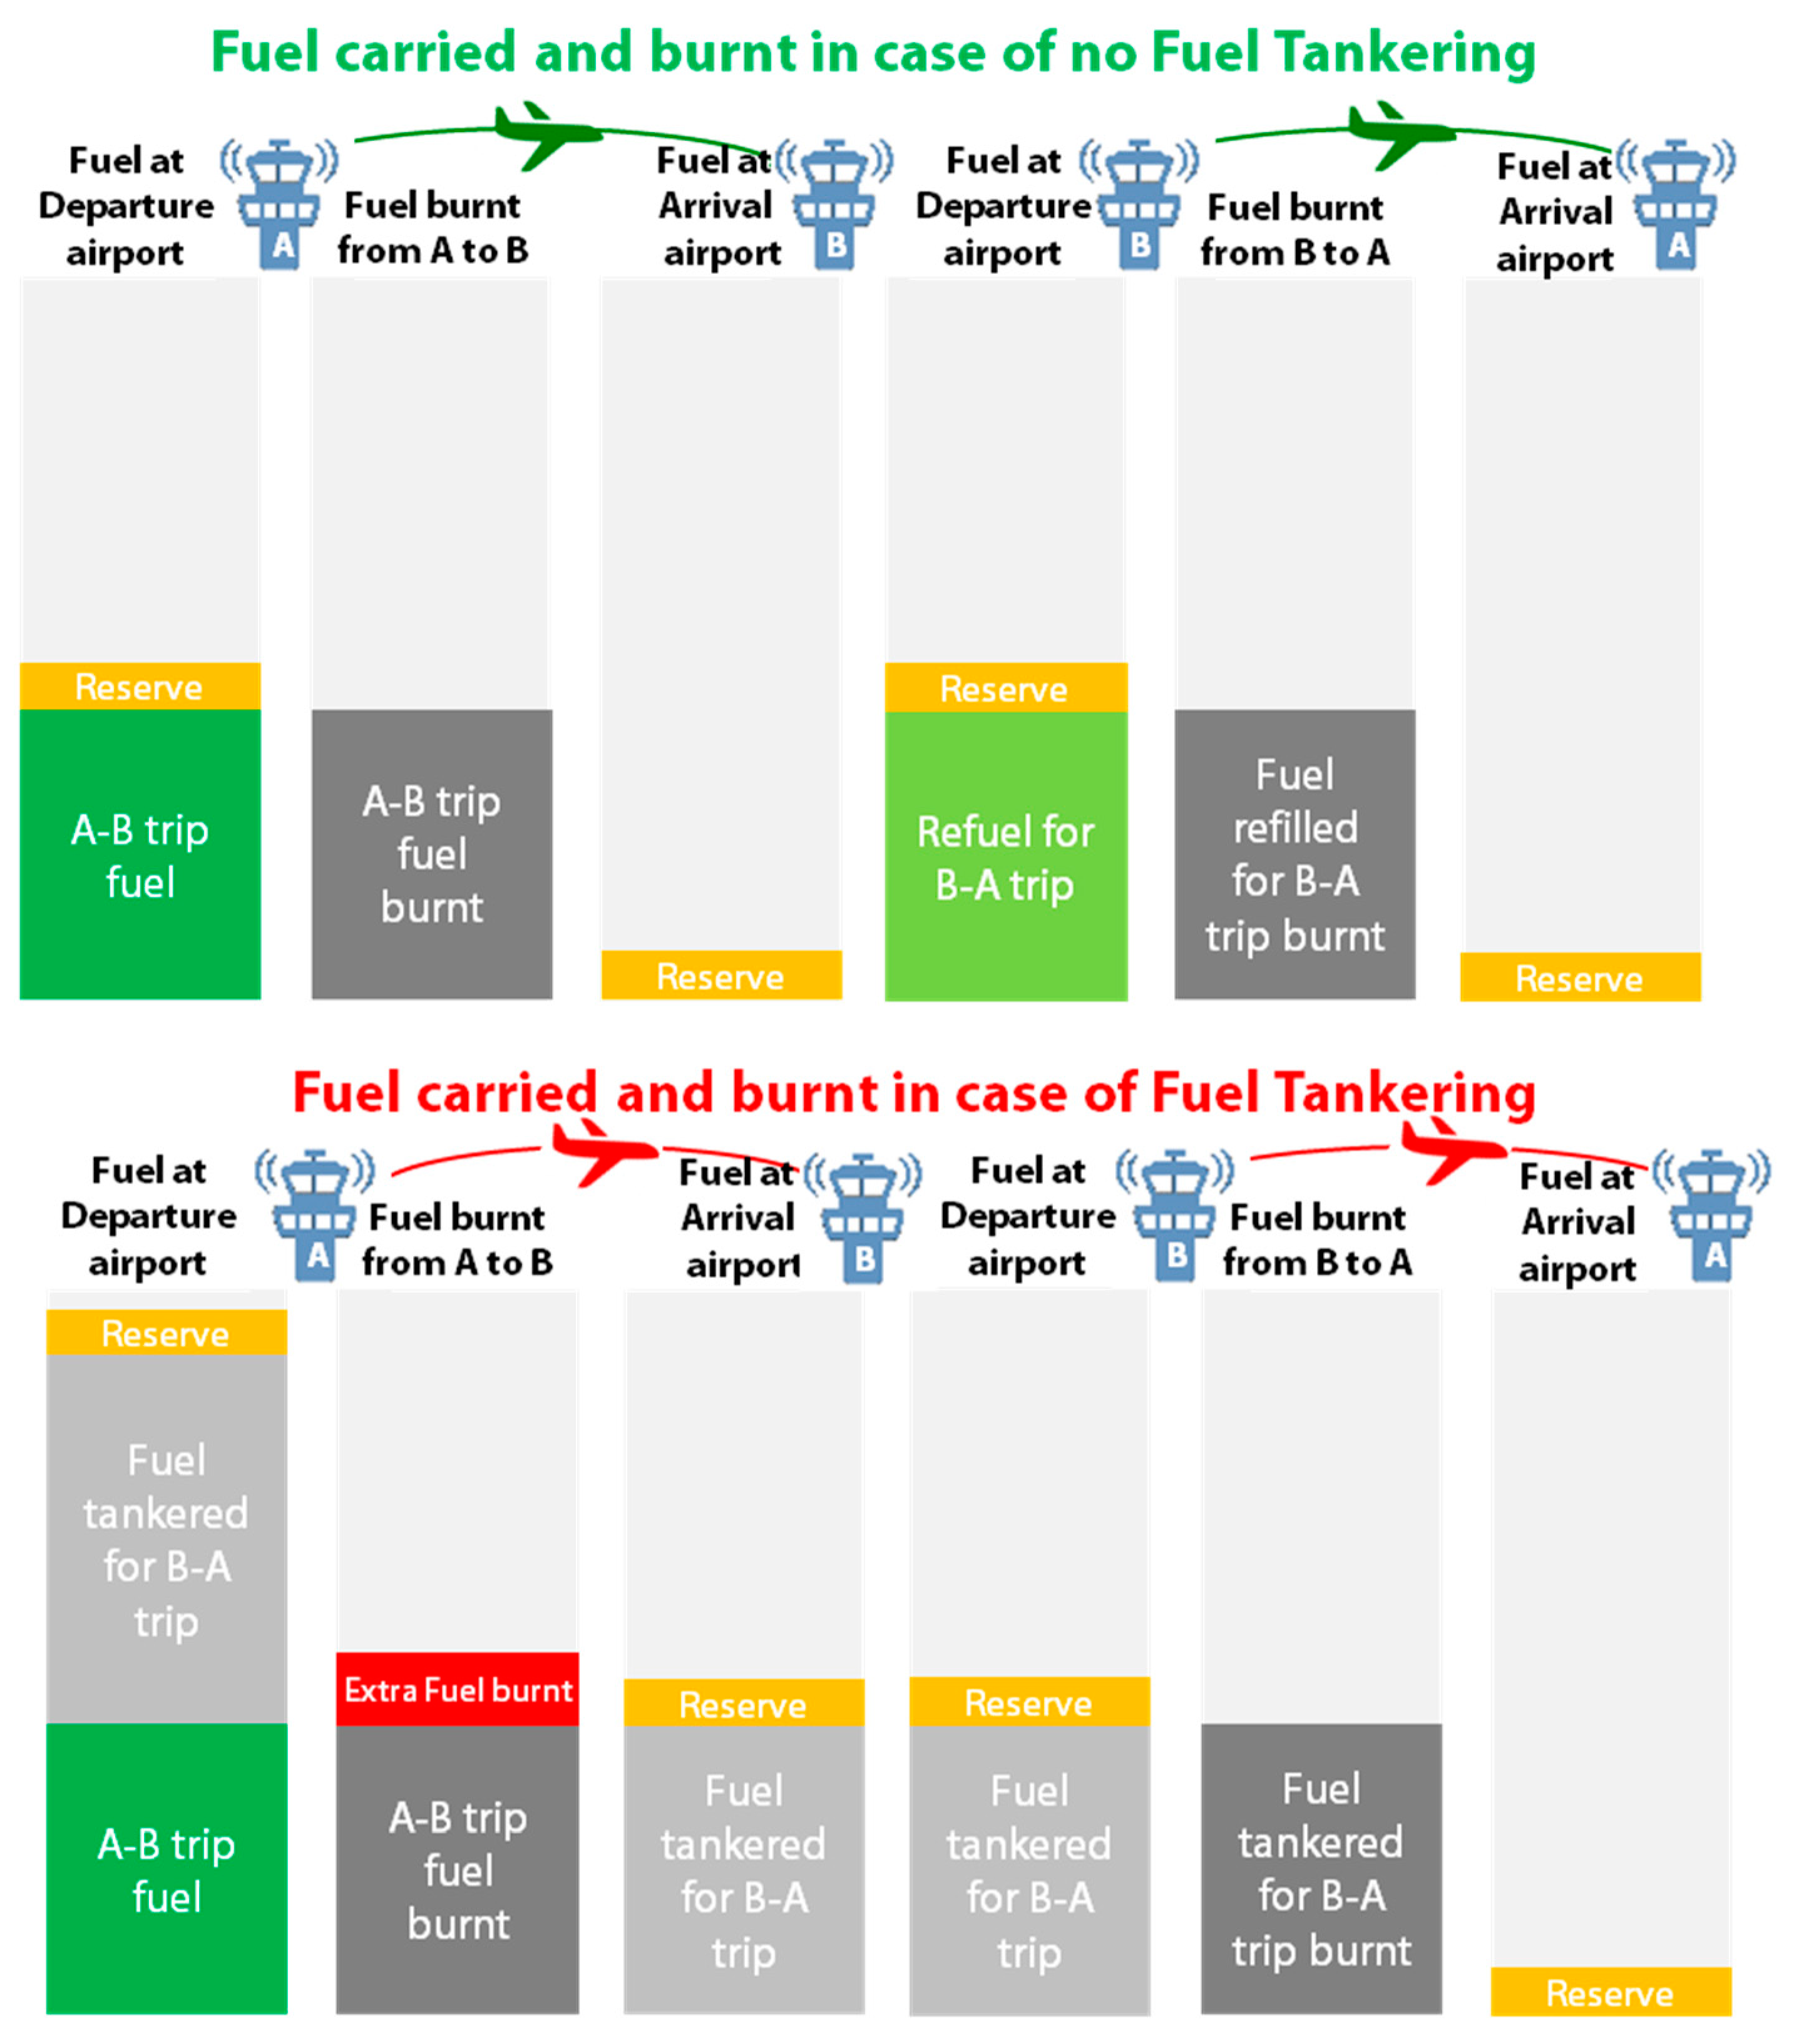
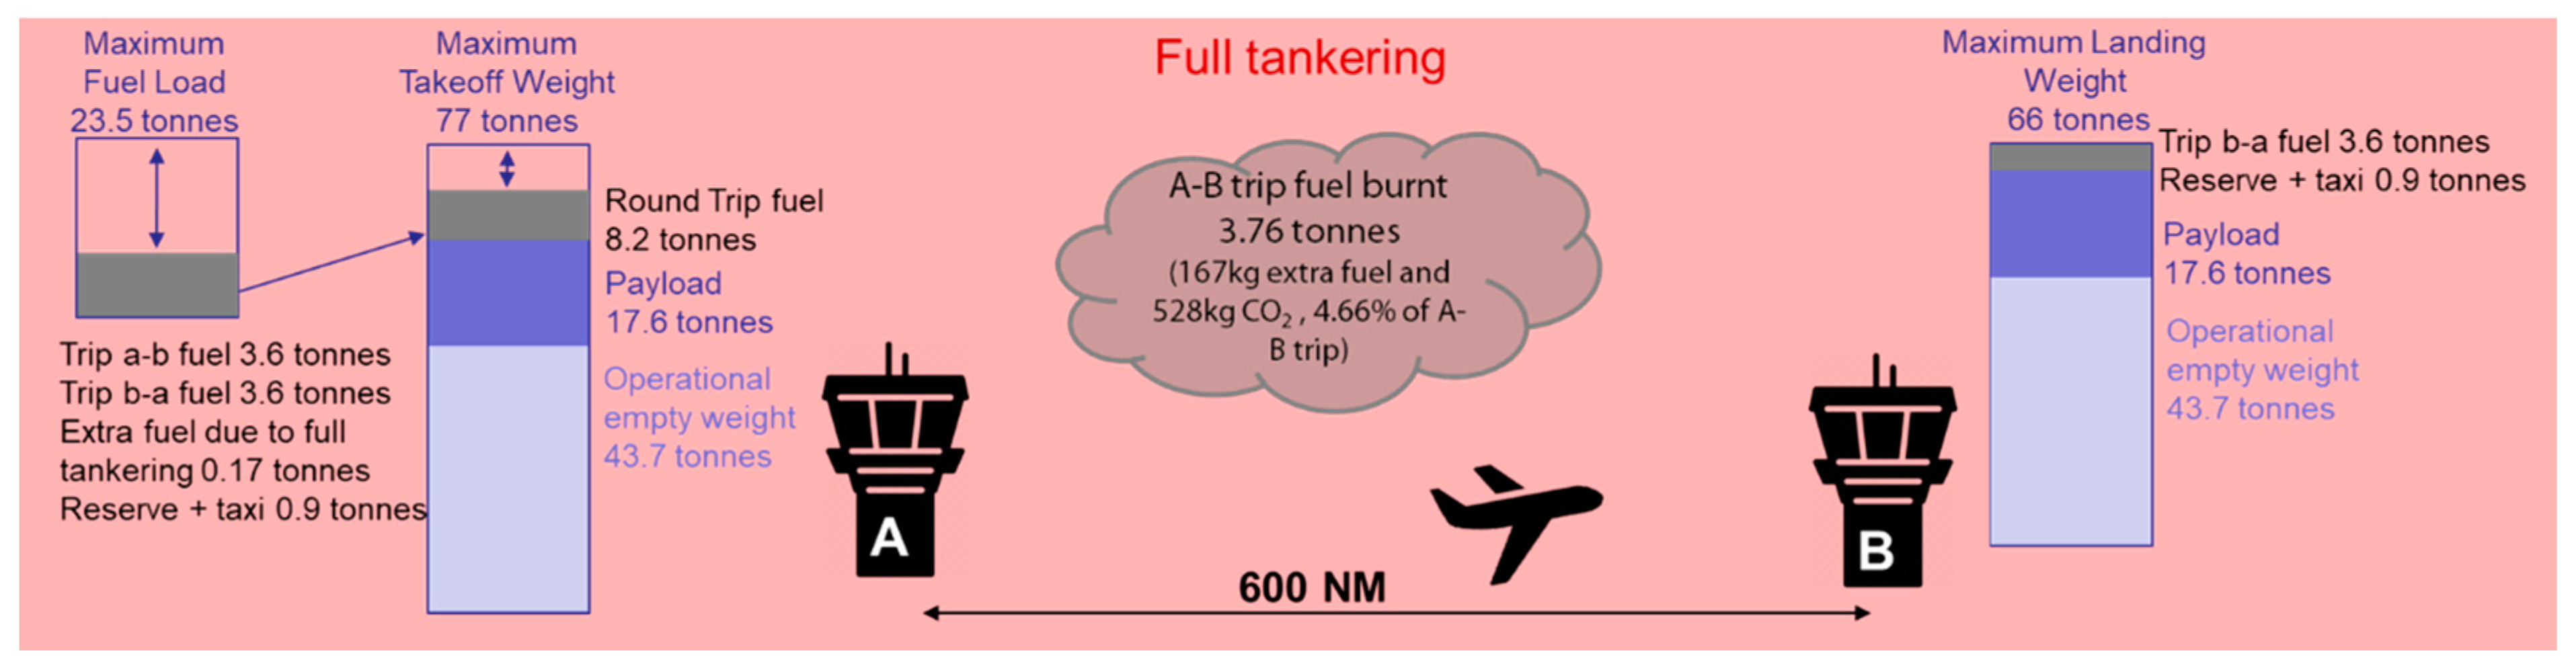
  • Full (fuel) tankering, which consists in transporting all the fuel needed for the return flight from the departure airport to avoid refueling at the destination airport, and
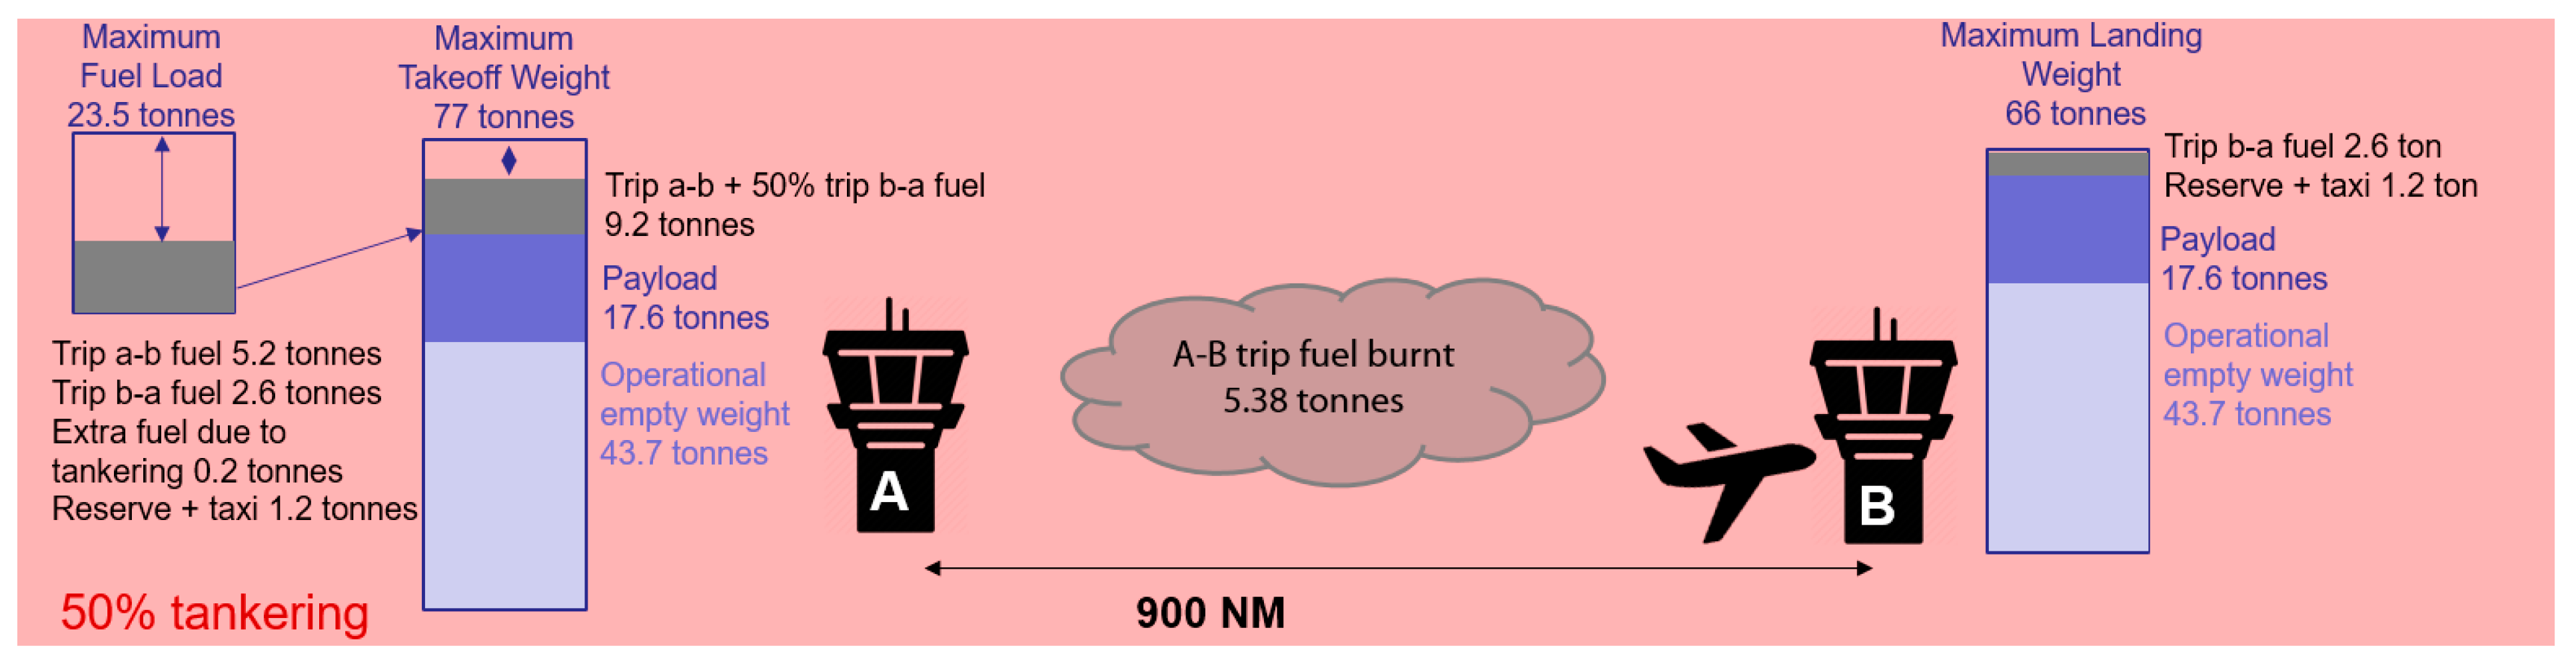
  • Partial (fuel) tankering, which consists in transporting only part of the fuel needed for the return flight and performing only partial refueling at destination.
Under the European Union Aviation Safety Agency regulations (CAT.OP.MPA.150 Fuel policy), before departure, the captain must ensure that every flight carries sufficient fuel for the planned operation and reserves to cover deviations from the planned operation:
  • Taxi fuel: The fuel necessary for taxi, which should not be less than the amount expected to be used prior to take-off;
  • Trip fuel: The fuel required from the start of take-off, through climb, cruise, descent, and approach to touchdown at destination;
  • Reserve fuel consisting of:
    Contingency fuel (3 to 5%): This fuel is carried to cover unforeseen variations from the planned operation. For example, different winds or temperatures from forecast, or air traffic control restrictions on levels and speed. It can be used any time after dispatch (once aircraft moves under its own power). It cannot be planned to use before. More likely, it is used for delays on departure or arrival;
    Alternate fuel: The fuel to cover a possible “Go around” or a landing at an alternate airport;
    Final reserve: For 30 min at International Standard Atmosphere 1500 feet above the alternate airport;
    Discretionary fuel (or 15 min of holding fuel if the flight is planned with no alternate (go-around at destination, climb, cruise, descent, approach, and landing at the selected alternate airport);
    Extra fuel, which should be at the discretion of the commander.
In other words, fuel tankering is the practice of adding more fuel than what is required by the fuel policy for a safe flight.

3. Purpose of This Study

Until now, the very few studies on fuel tankering [3,4,5,6,7,8,9] have focused mainly on its economic benefits for a single or a limited number of flight.
However, as illustrated on Figure 1, when a return flight between two airports A and B, carry part or all of the fuel needed for its return flight (B-A), an “extra” amount of fuel is burnt just to carry that additional fuel on the first leg (A-B). This is because the additional fuel carried when doing fuel tankering increases the weight of the aircraft and thus its fuel consumption, resulting in additional CO2 emissions. ICAO Doc 10013 [2] indicates that “The extra fuel burn attributable to additional weight carried on board an aircraft is typically on the order of 2.5 to 4.5% of the additional weight, per hour of flight, depending on the characteristics of the aircraft.” Fuel tankering has therefore an environmental impact.
As the demand to accelerate the decarbonization of transport becomes more and more pressing, it is relevant to estimate the extent of the environmental impact of fuel tankering. The purpose of this paper is to present the results of a first study whose aim was to estimate what the impact of fuel tankering would be at ECAC level in 2018 on the basis of the actual collected data (i.e.,: fuel prices at airports in June 2018, and passenger load factor at that time, etc.). In the future, it would be interesting to carry out sensitivity analyses to see the economic limits of this practice by varying fuel prices and under different hypotheses of passenger load factor, etc.

4. Study

The study was conducted with the following steps, data, and assumptions.

4.1. Steps of the Study

  • STEP 1: Verify that fuel tankering is a common practice that deserves to be studied and that no regulatory instruments already exist to dissuade airlines from tankering fuel or to compensate for its impact on the environment;
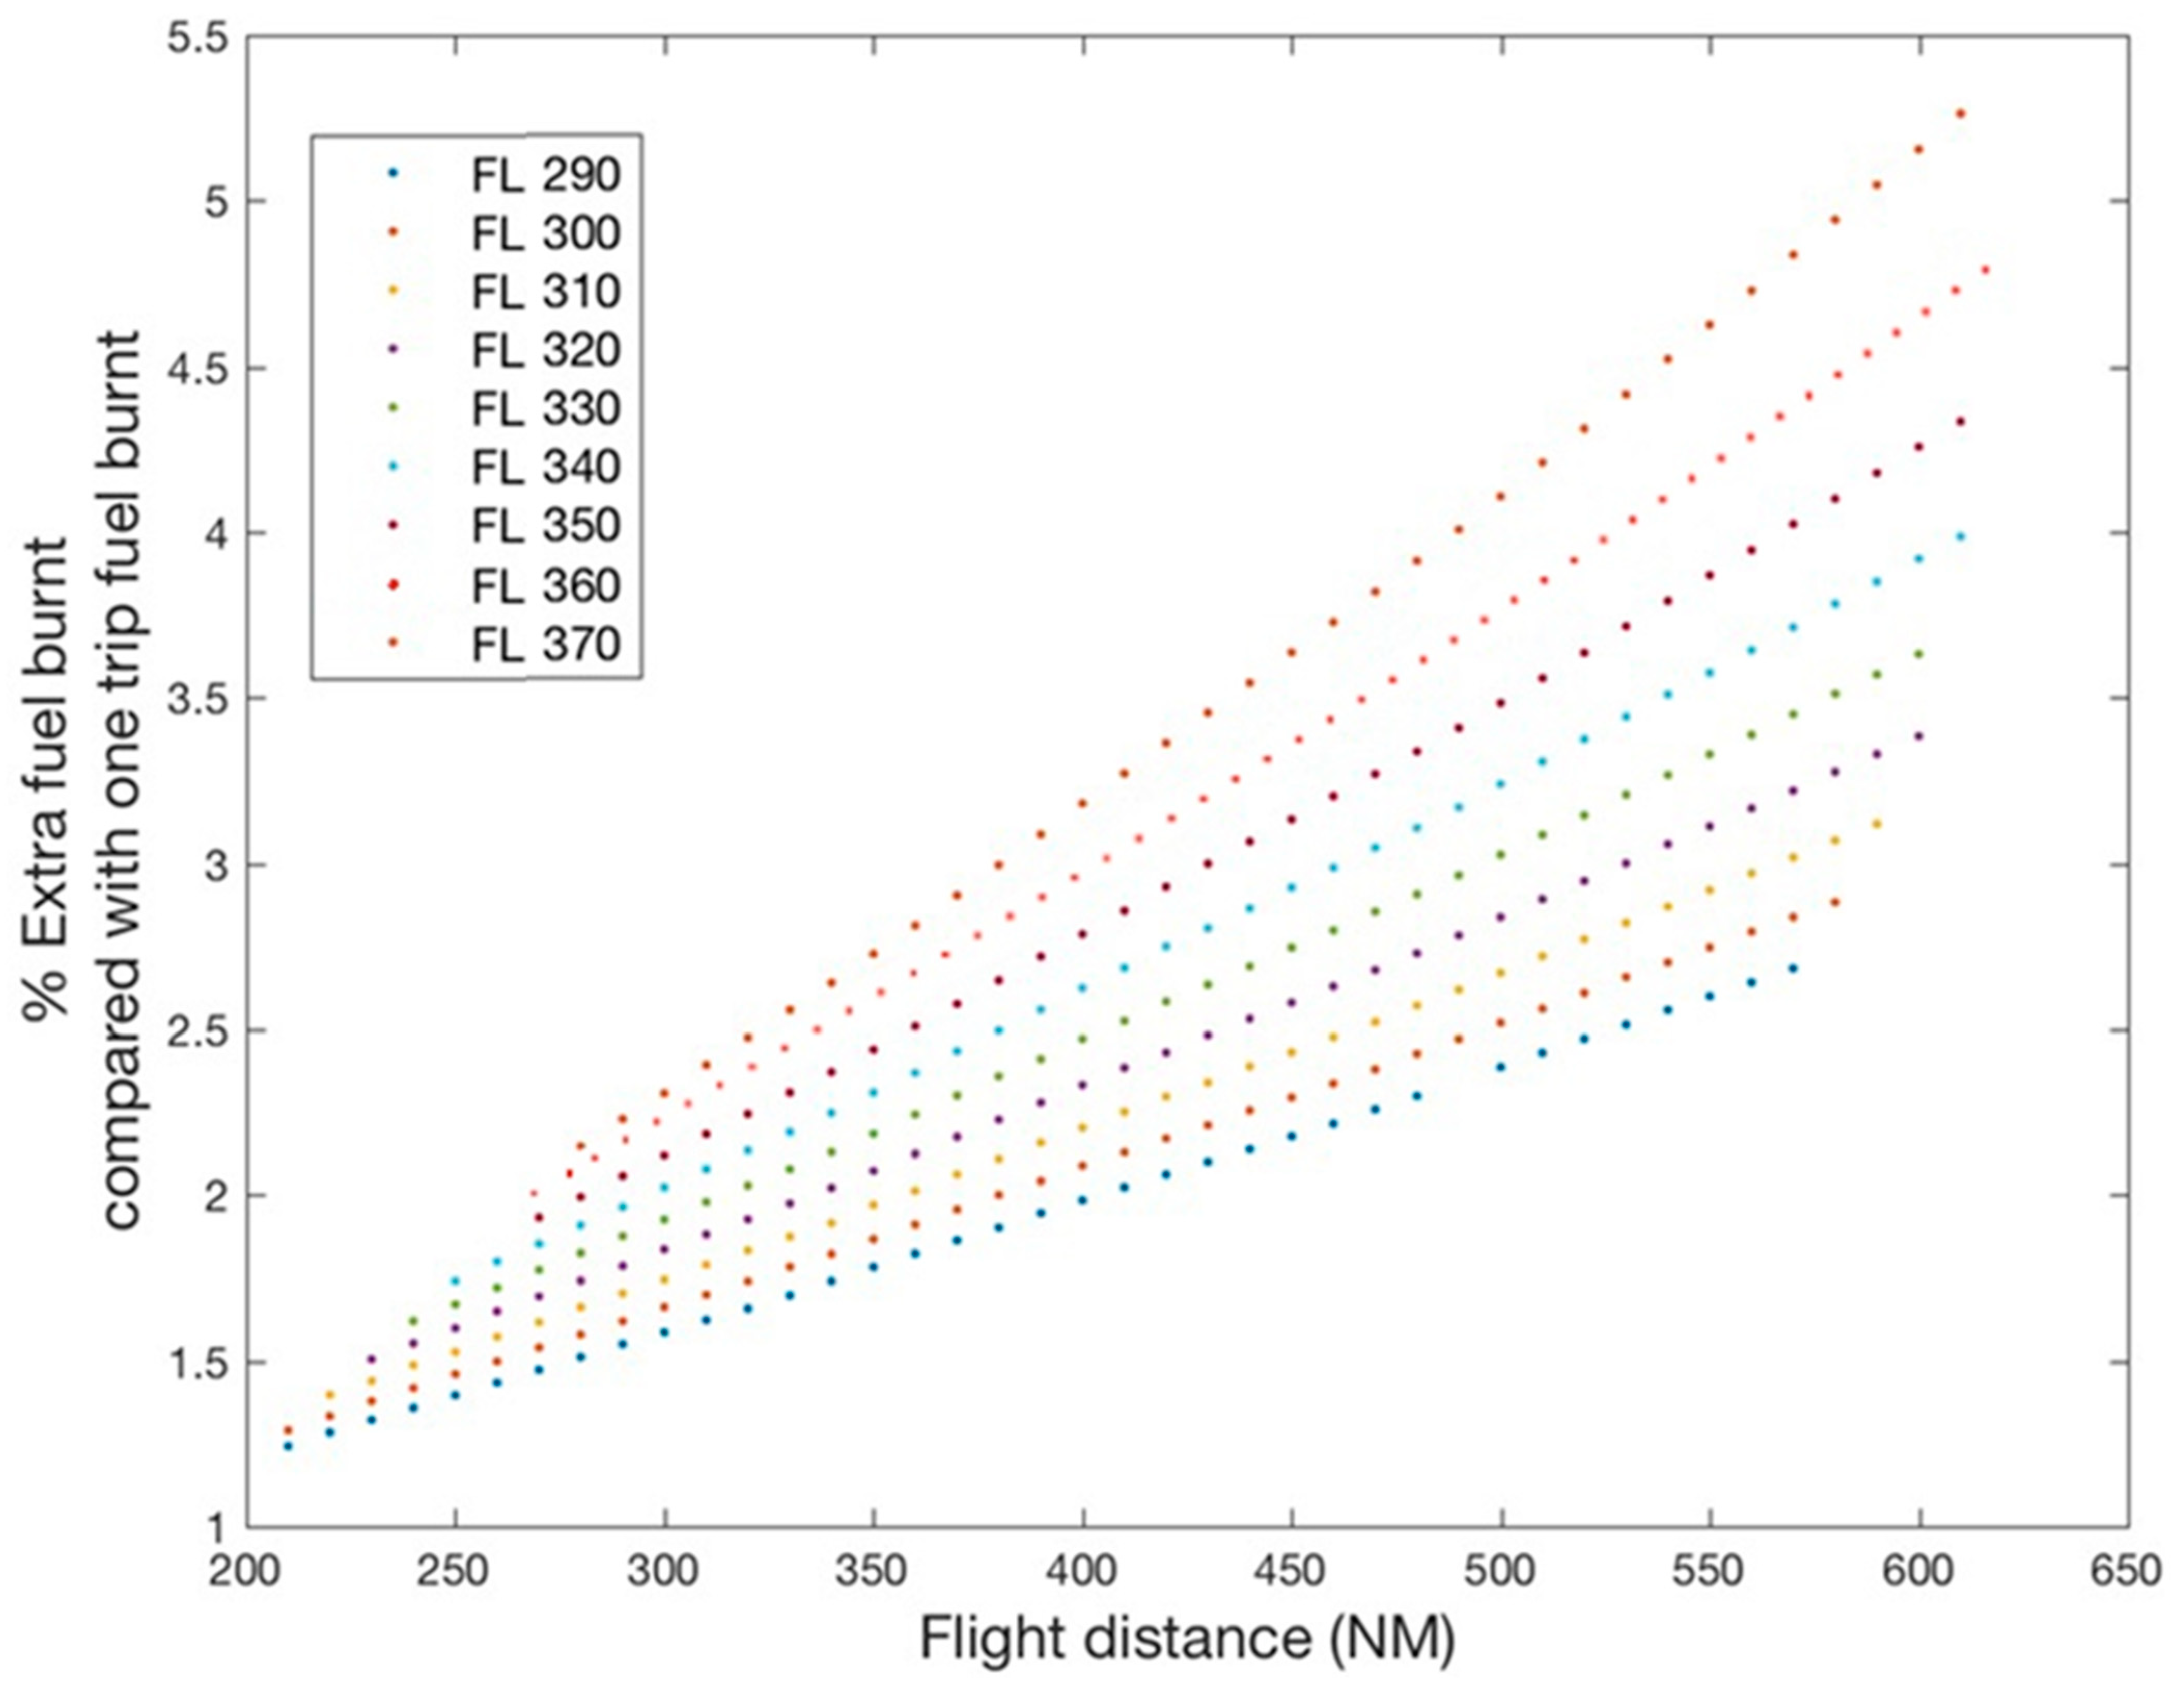
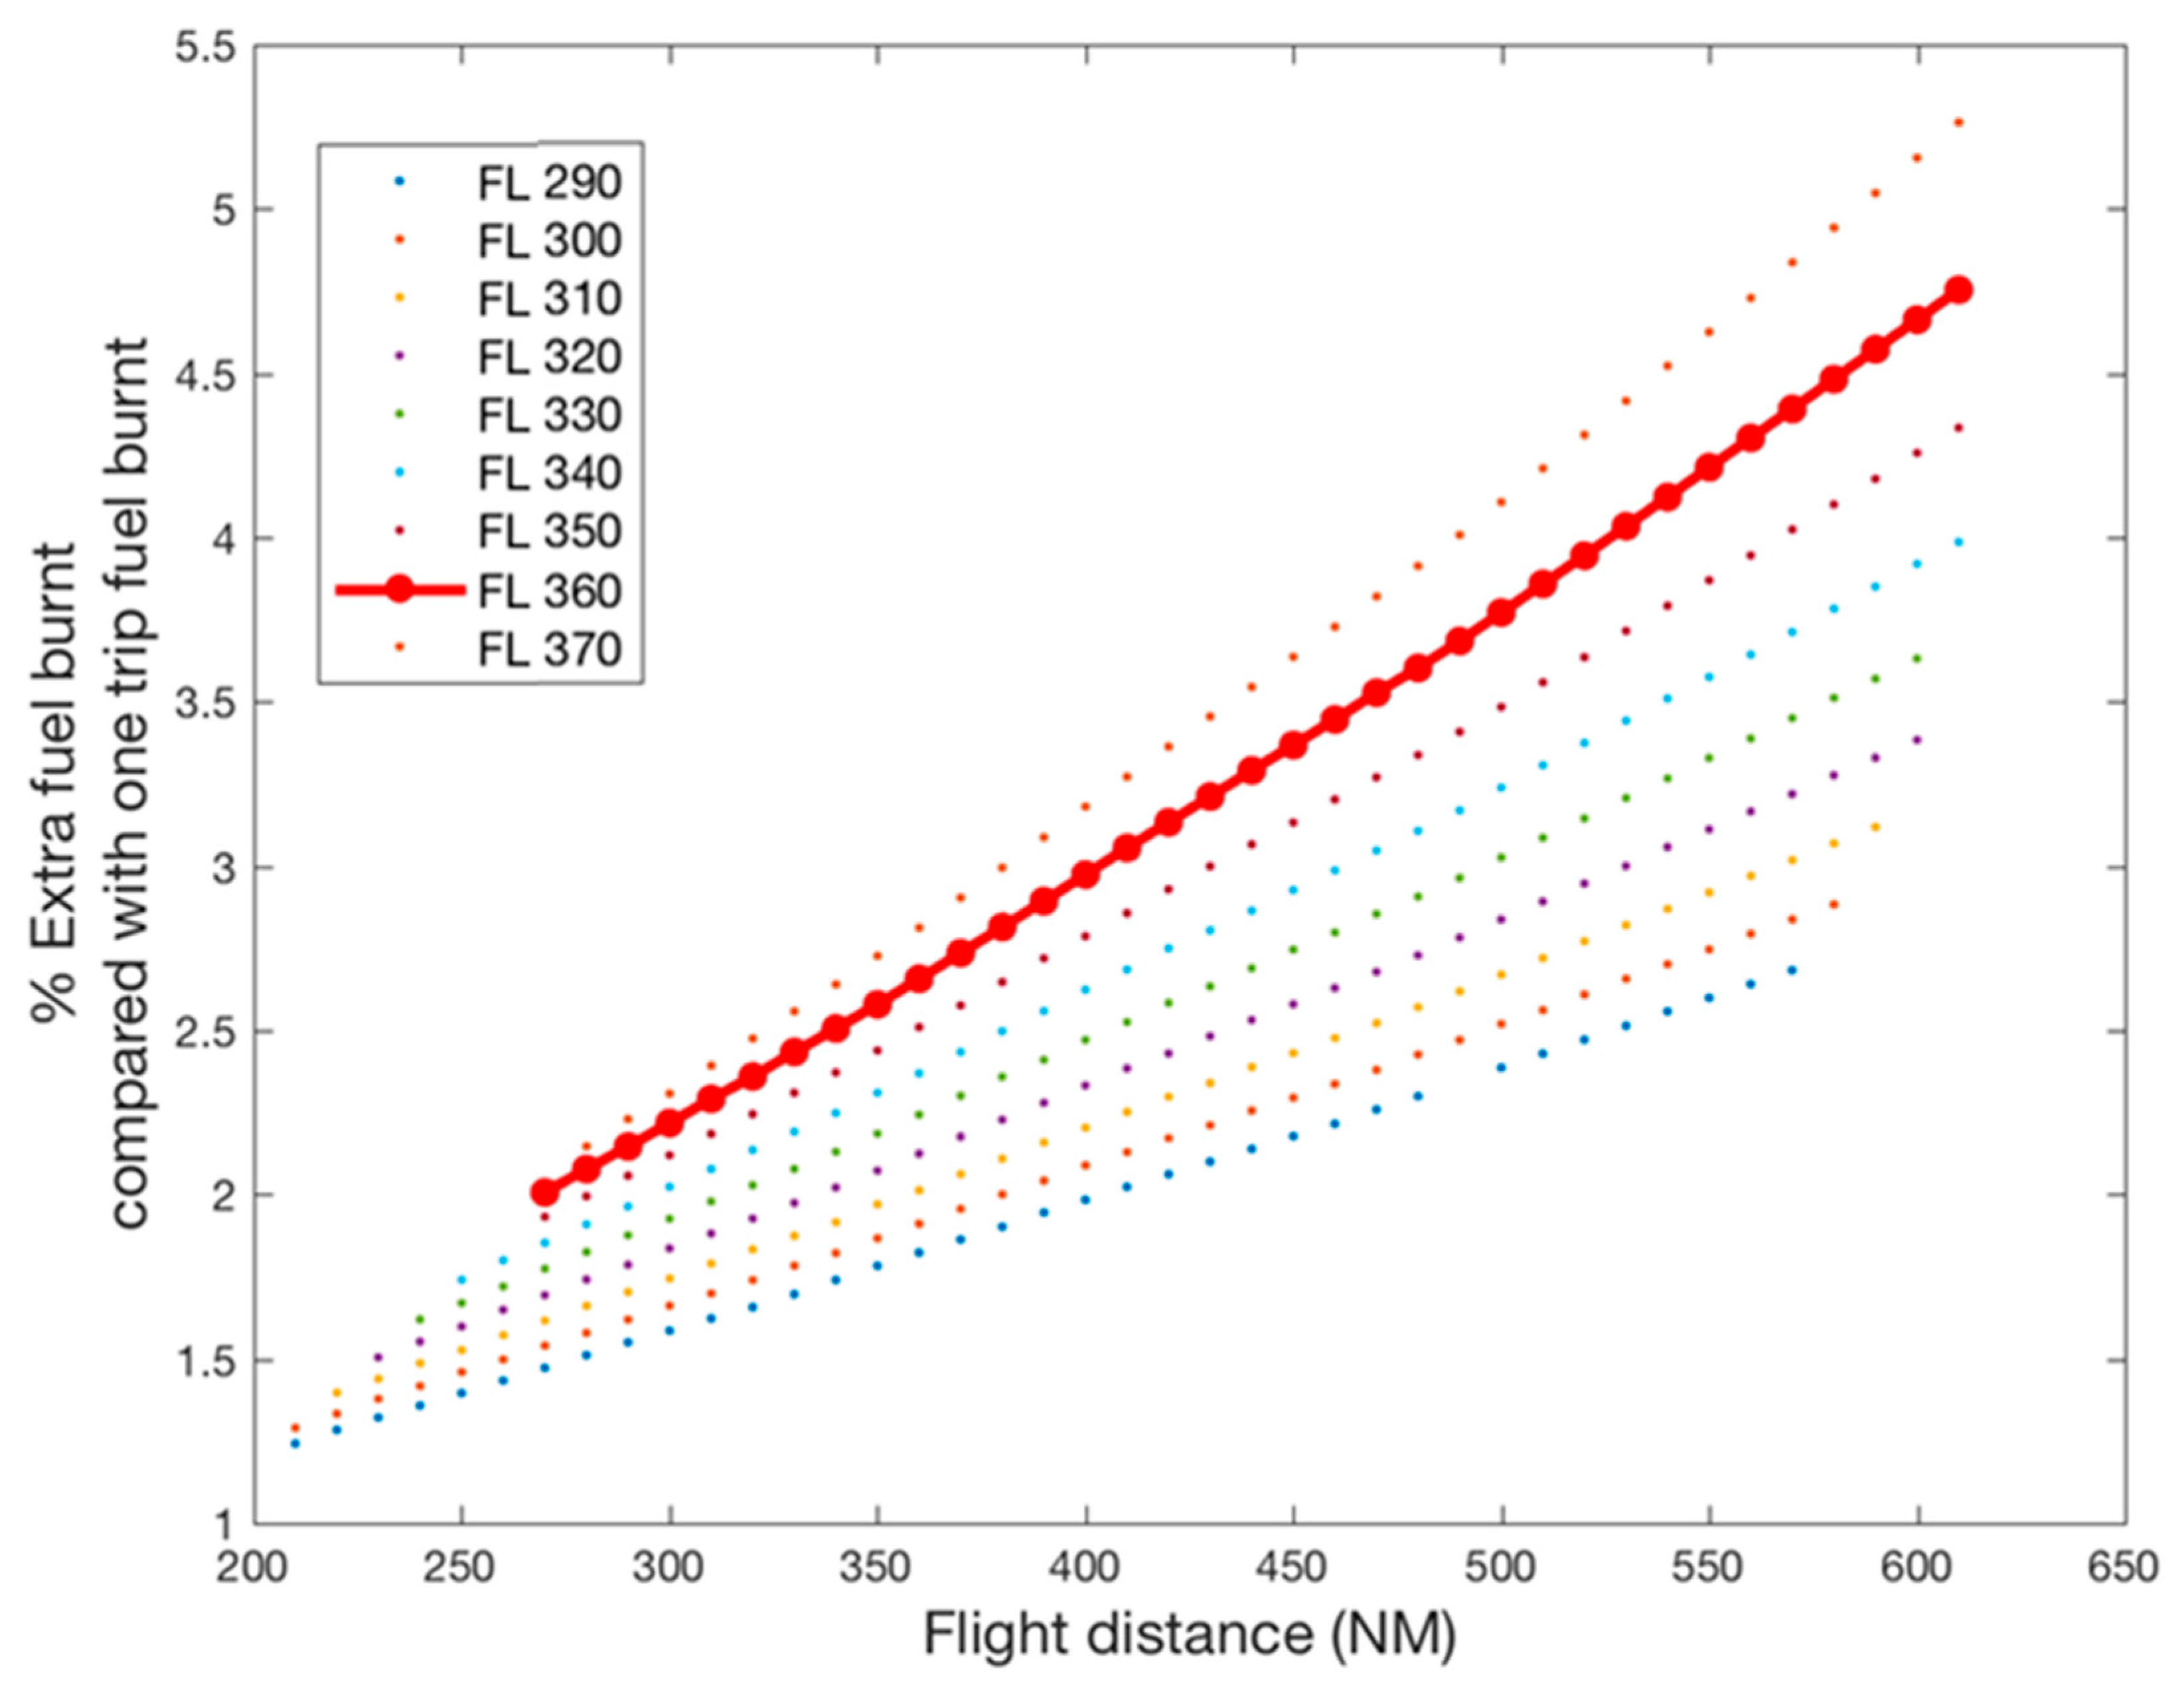
  • STEP 2: Calculate the fuel tankering efficiency with EUROCONTROL Base of Aircraft Data (BADA) models based on typical types of aircraft flying in ECAC airspace and for all the possible distances flown;
  • STEP 3: Calculate the number of flights for which full or partial tankering is operationally possible;
  • STEP 4: Estimate the economic opportunity of tankering.

4.2. Data Used and Assumptions

  • The statistics required for the calculations were derived from June 2018 traffic in the ECAC area;
  • The estimated tankering results for this month has been extrapolated to a year by applying a linear extrapolation based on the number of flights for which fuel tankering was feasible. However, the extrapolation made does not take account of any influence of seasonal traffic patterns;
  • The study covered aircraft models representing 66% of flights in ECAC;
  • Aircraft performance was based on EUROCONTROL BADA model. BADA is the international reference in aircraft performance modeling for trajectory prediction and simulation. Based on the best available reference data on aircraft performance, BADA reproduces realistically the geometric, kinematic and kinetic aspects of aircraft’s behaviour over the entire operational flight envelope and in all phases of flight;
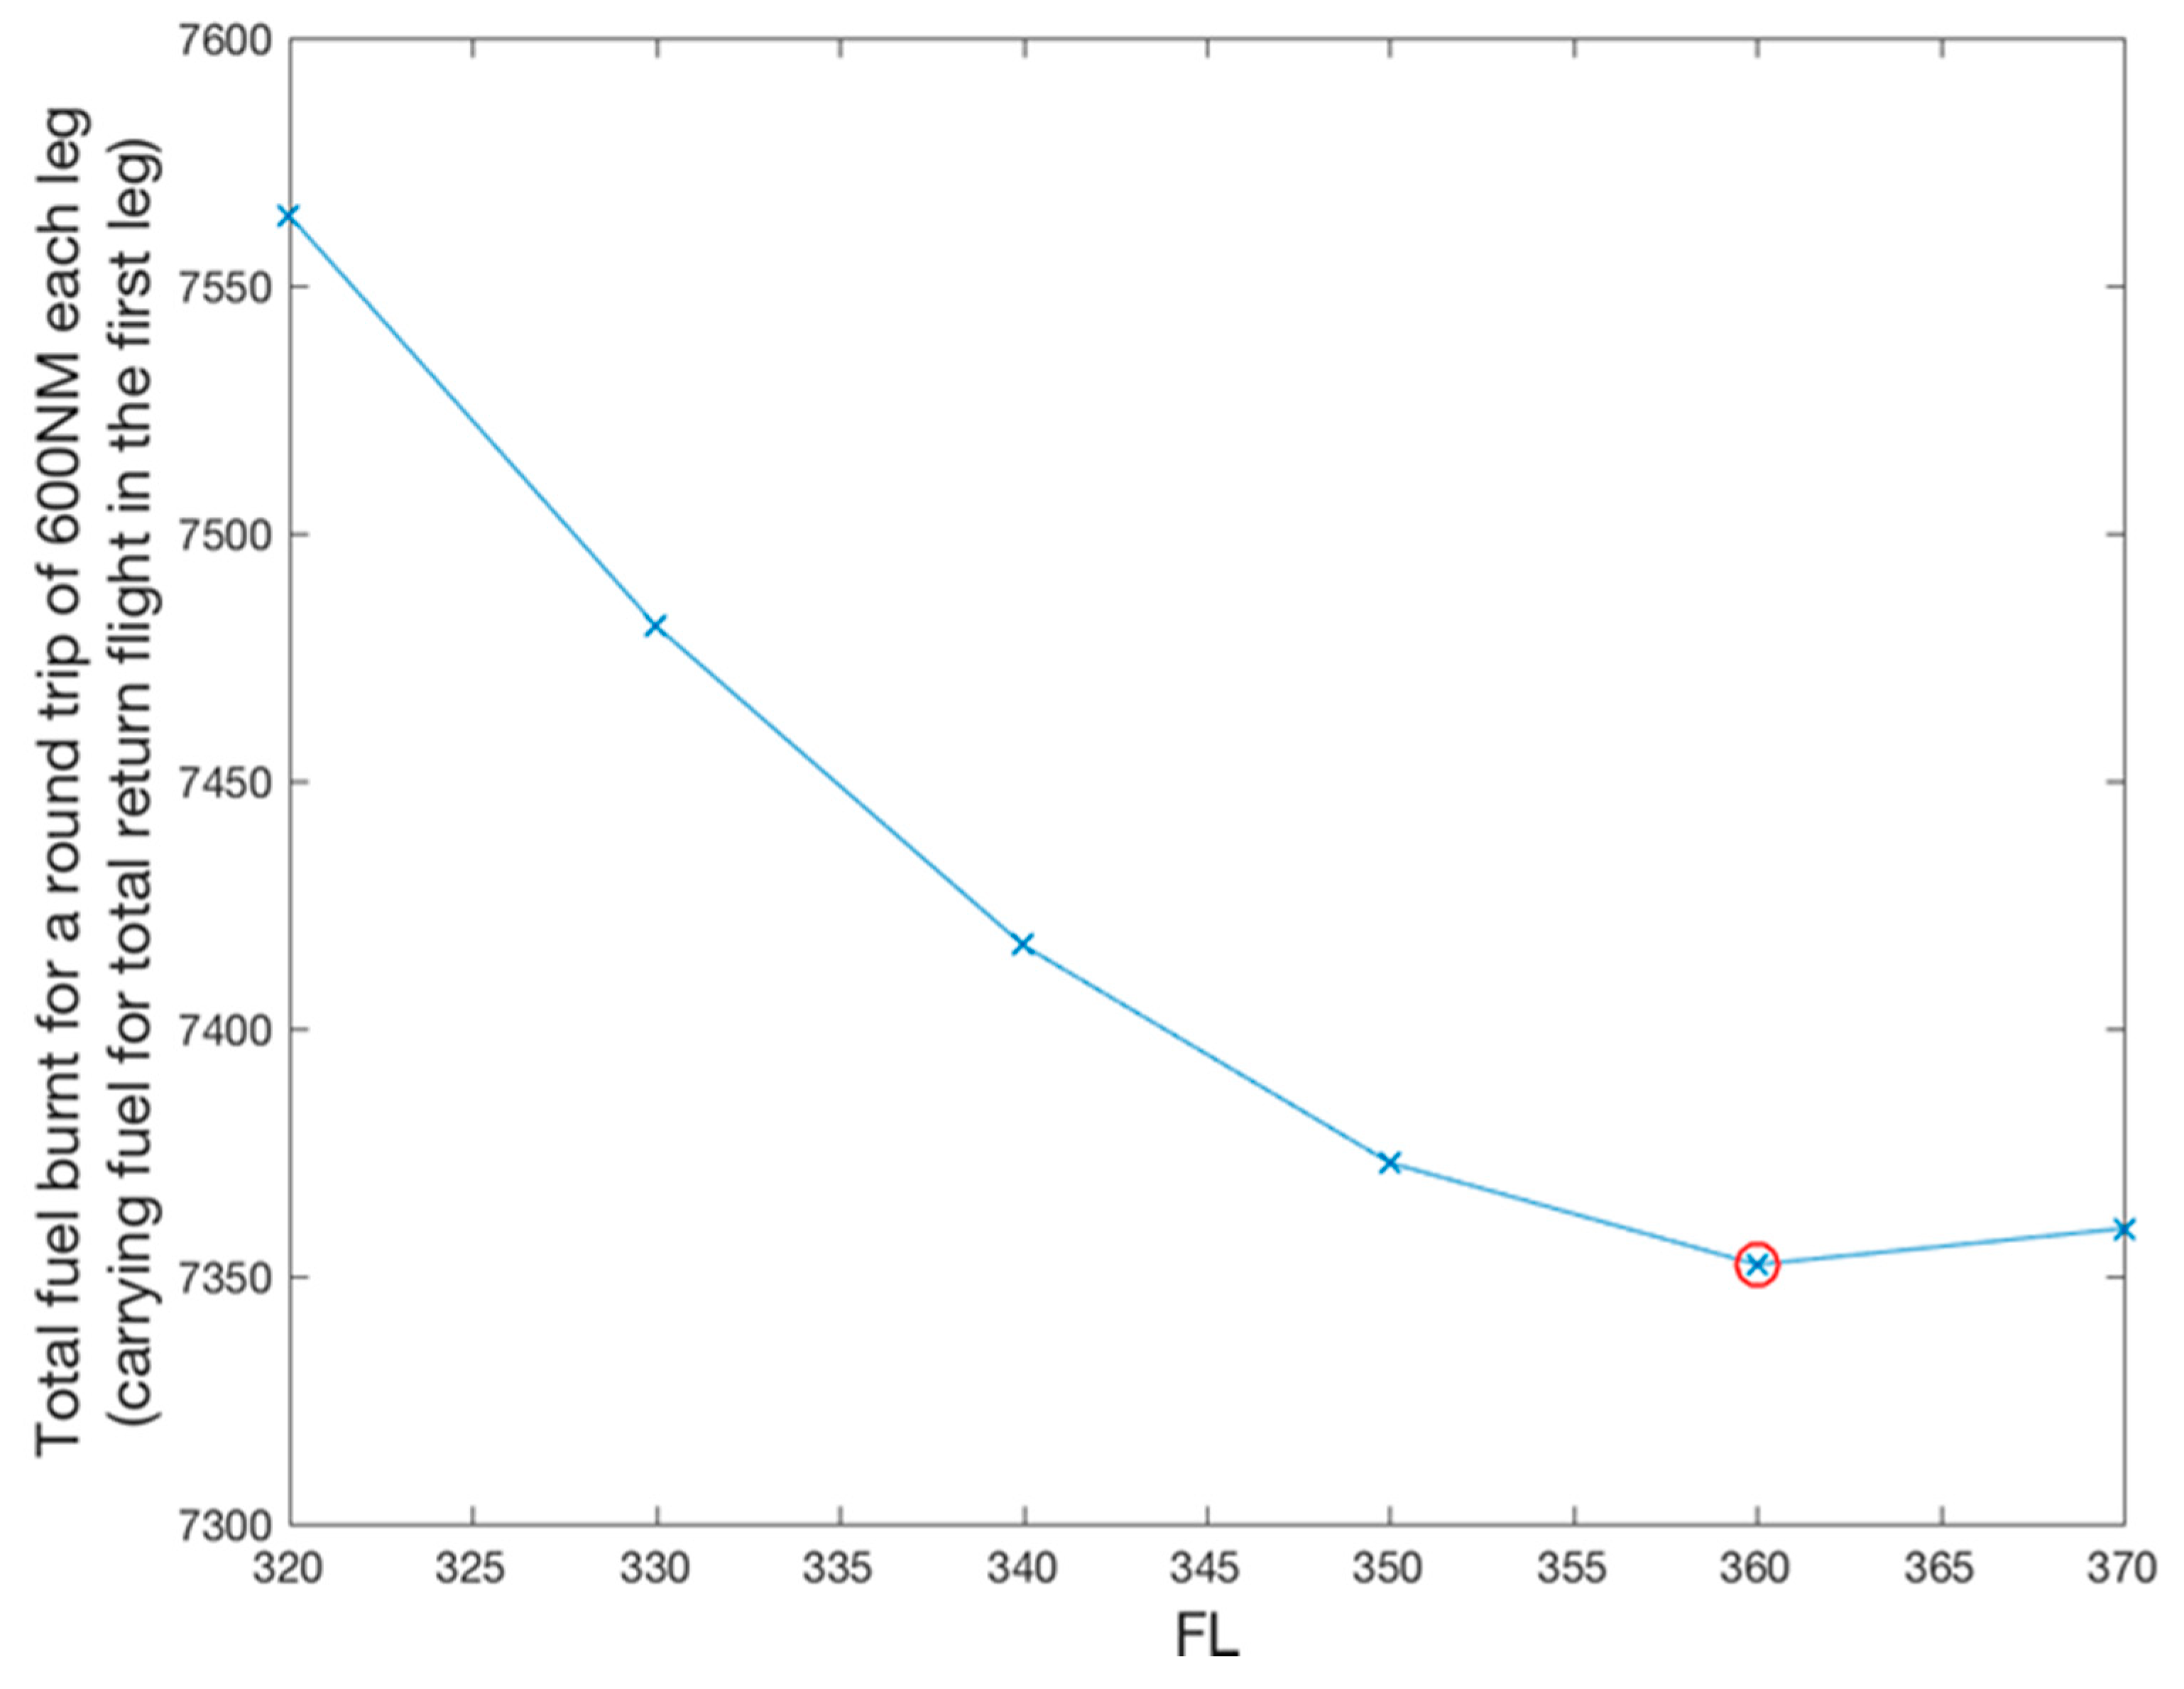
  • The optimal flight level calculated for performing full fuel tankering was used in the model.
  • The following limits have been taken into account: Maximum take-off weight, Maximum landing weight, Maximum fuel load of each aircraft type;
  • An average 20 min was used for the taxi-out; This value was calculated using average taxi-out times provided by EUROCONTROL Central Office of Delay Analysis for the busiest European airports;
  • The CO2 emission factor used is 3.15 kg CO2 per kg of fuel burn;
  • Fuel prices negotiated at 140 airports in ECAC from 2 major airlines were used;
  • The payload was calculated with a load factor of 80.3% [10] and 124 kg/passenger;
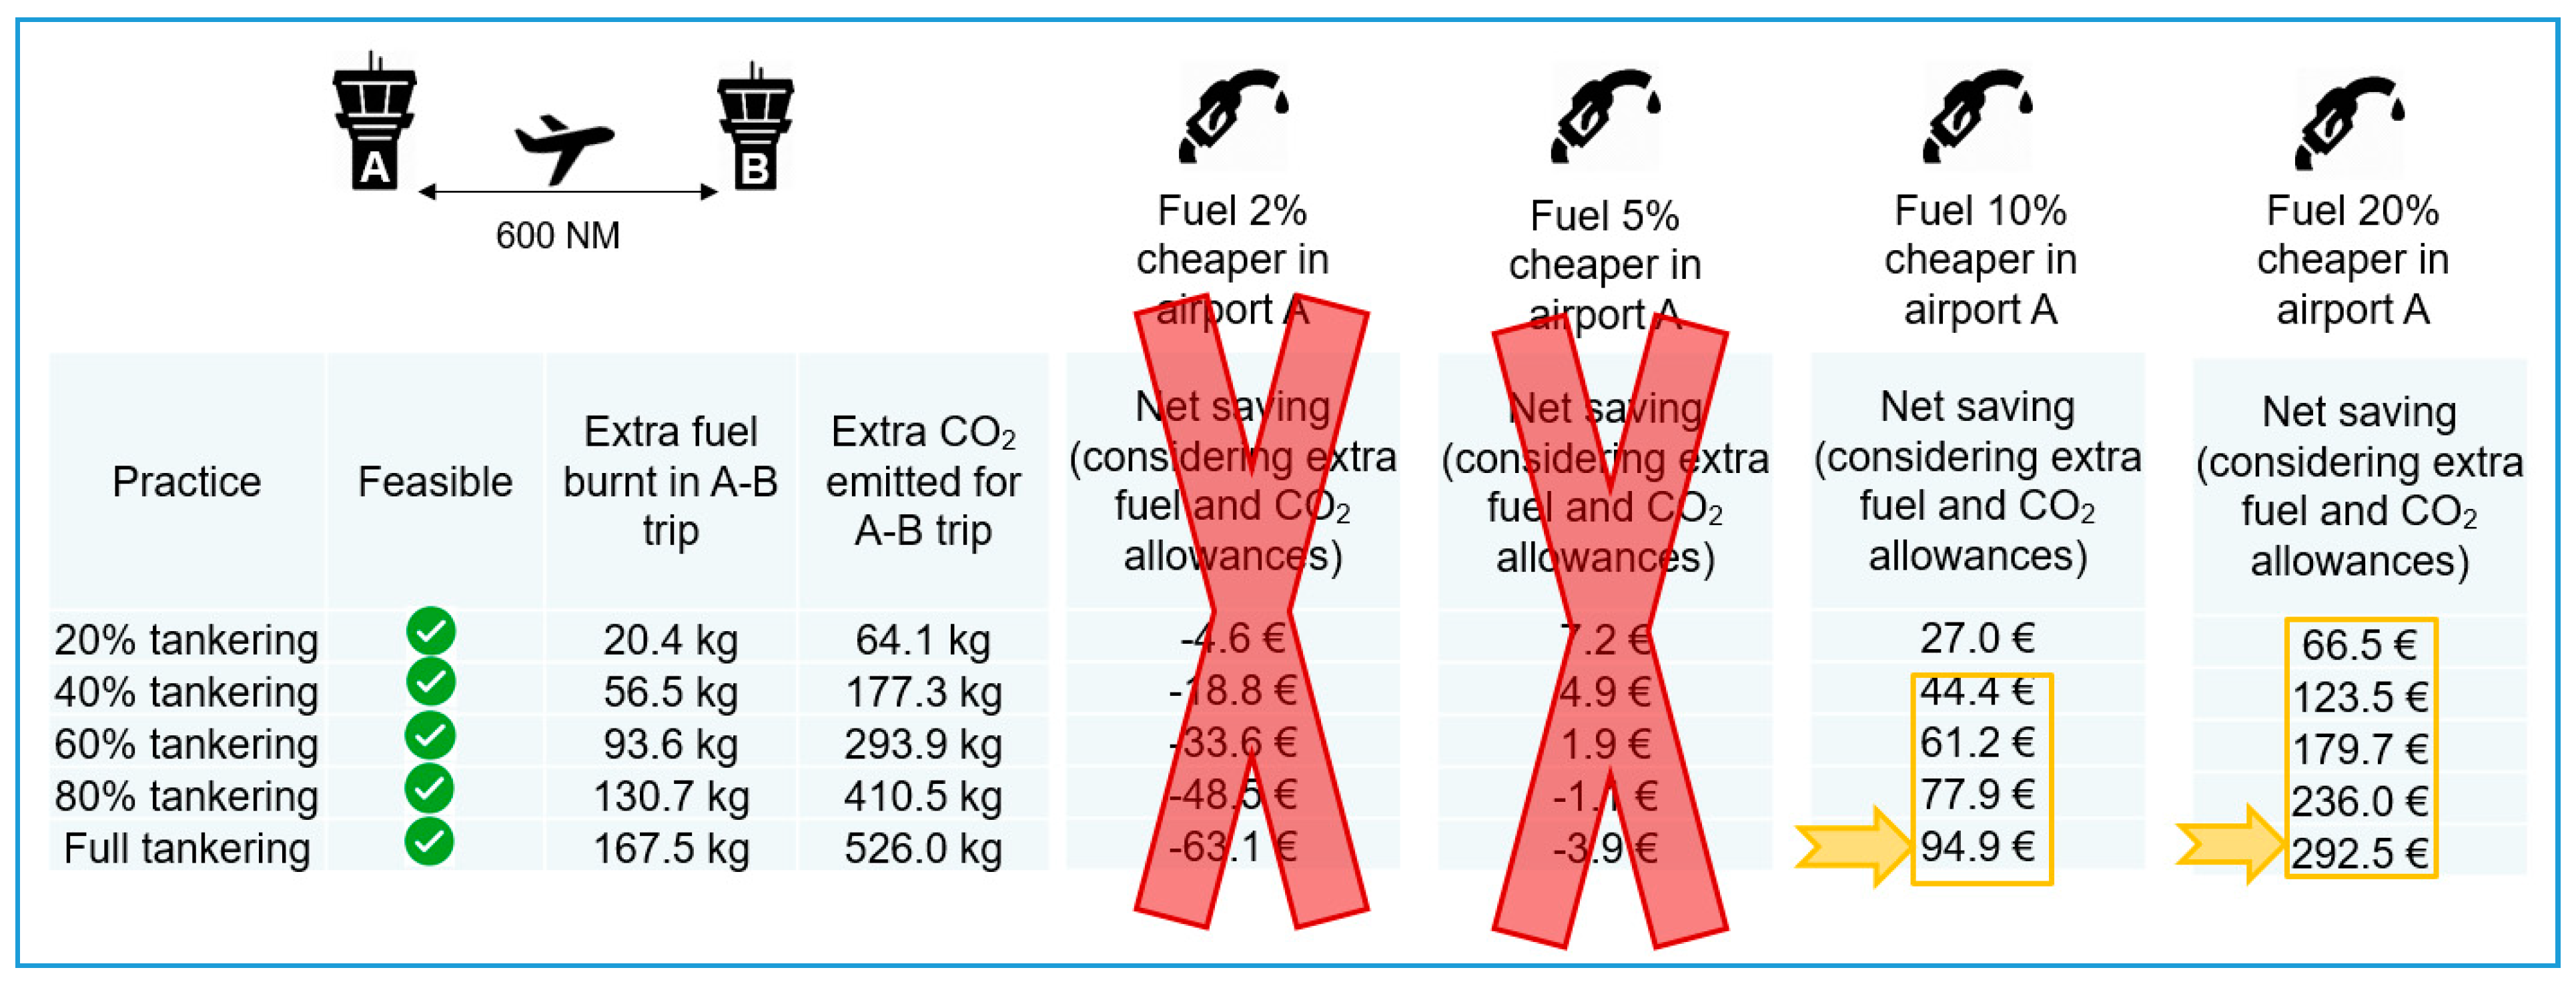
  • A profit threshold of €30 was used as a pivotal point in the decision to go into fuel tankering; but this is a very cautious assumption as some airlines use €15 as a pivotal point;
  • A cost of €20/tonne has been set for a tonne of CO2 allowances; this is also a very conservative assumption because not every tonne of CO2 requires the purchase of CO2 allowances;
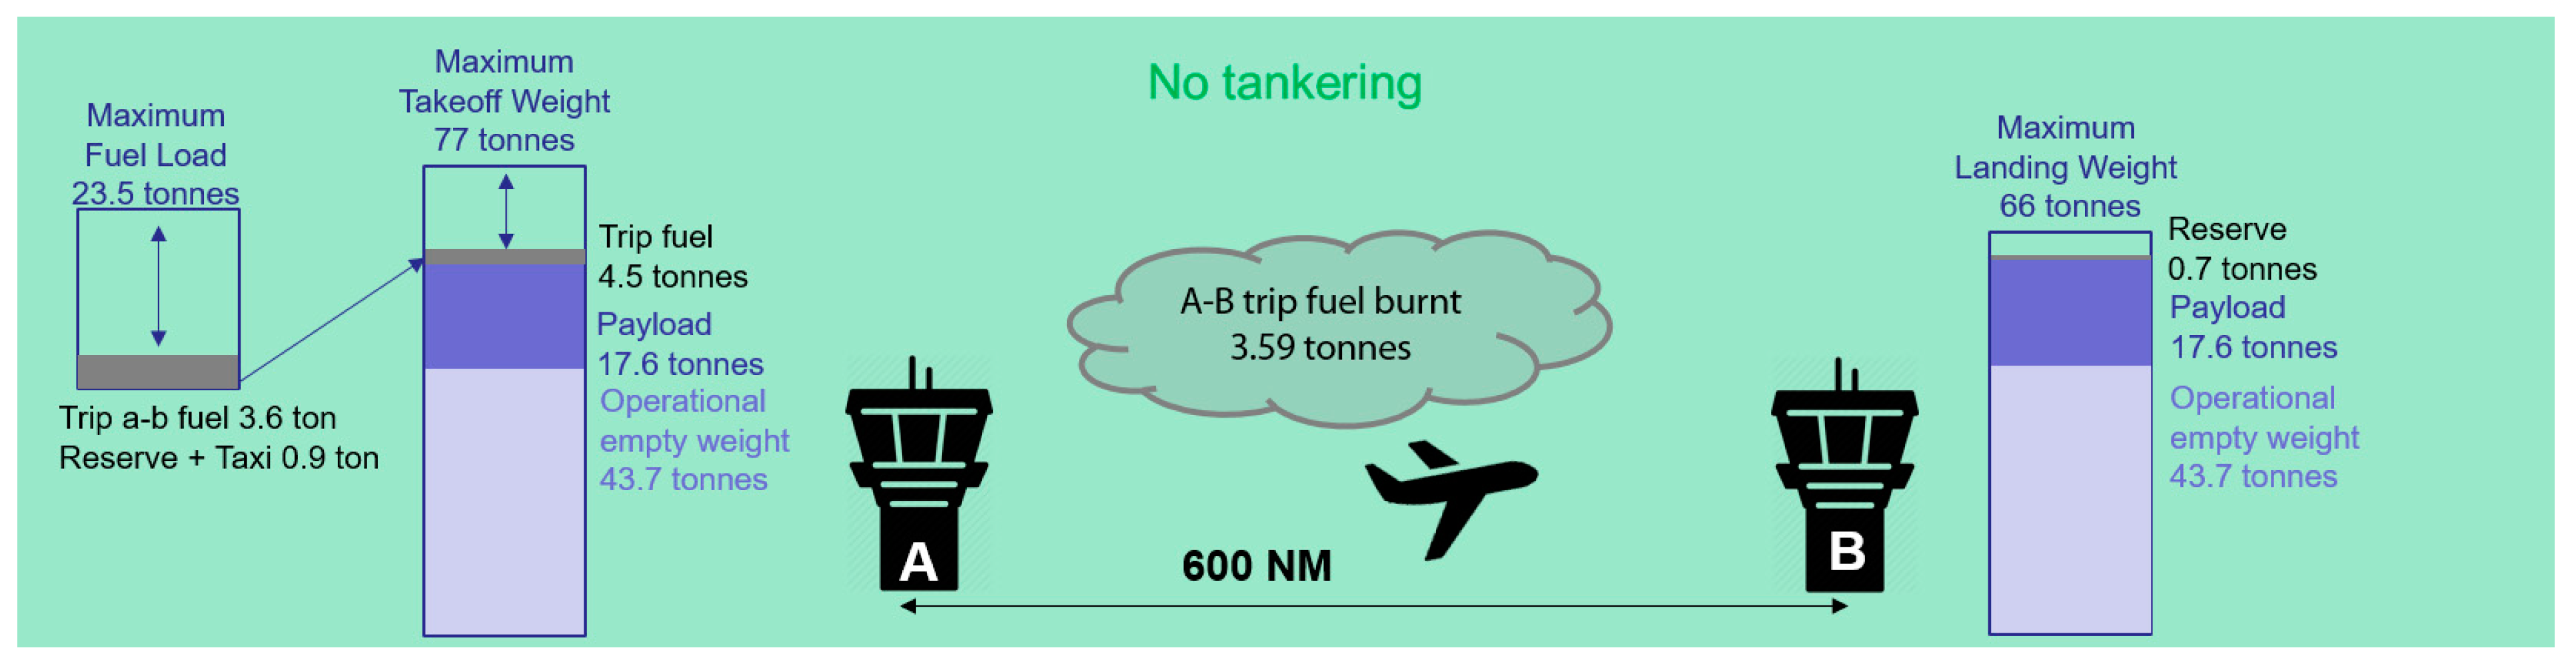
  • In the tables presented in our study “Trip fuel” is composed of the following elements: Taxi + Climb Cruise Descent + Approach to Touchdown. The “Reserve fuel” is composed of the following elements: Contingency + Alternate + Final reserve;
  • When, for a round trip, both full and partial fuel tankering were possible, our model always privileged full fuel tankering.

4.3. Flights Excluded from the Study

  • Military flights performed by military aircraft and customs and police flights; search and rescue; state flights;
  • Flights not performed under instrument flight rules (IFR) only.

4.4. Study Limitations

  • Due to the coverage of airline negotiated fuel price data we were able to access, the study was limited to flights up to 1500 (Full tankering) and 2500 NM (Partial tankering). As a result, the aircraft models considered are mainly operated on short and medium-haul.
  • Furthermore, due to the physical fuel capability of the aircraft models considered:
    For full tankering, flight legs of more than 1500 NM were not considered,
    For partial tankering, flight legs of more than 2500 NM were not considered.
  • The impact of fuel tankering for reasons other than fuel price differences at airports was not considered (e.g., shorten turnaround or fuel shortage).
  • The possibility of tankering fuel for more than one leg, which the software of some airlines is able to calculate, has not been estimated.

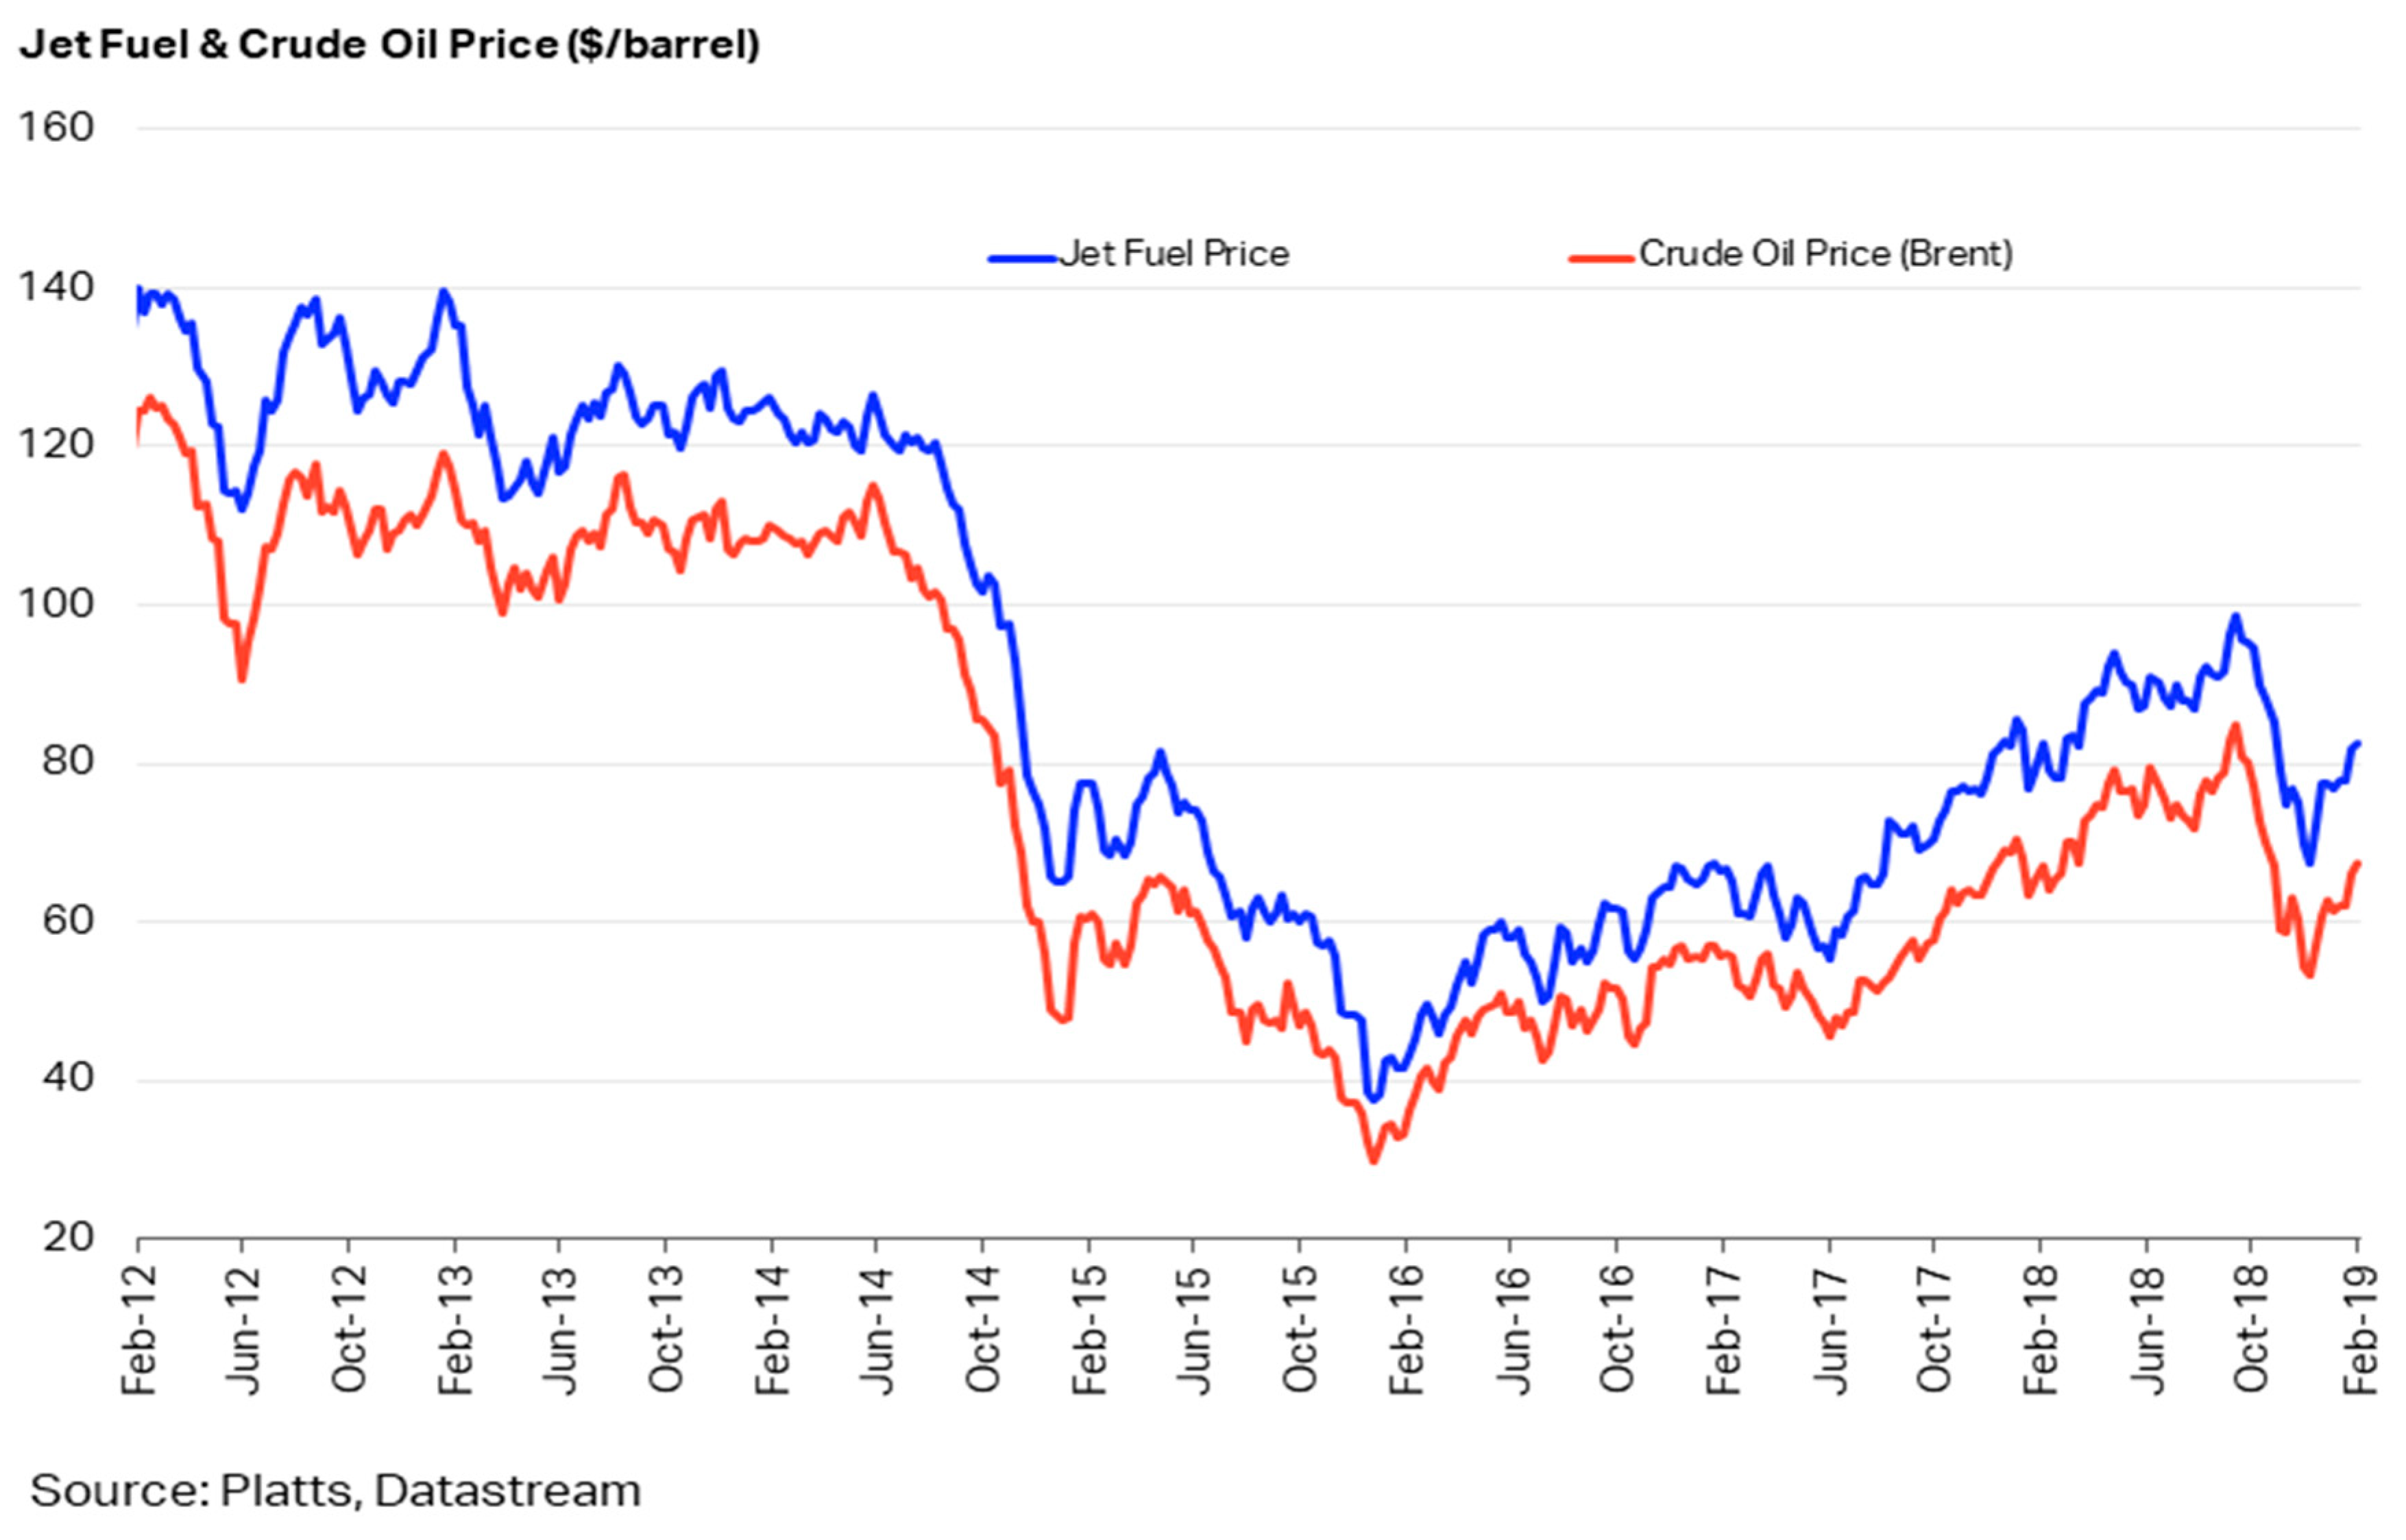
4.5. STEP 1: Verify That Fuel Tankering Is a Common Practice That Deserves to Be Studied and That No Regulatory Instruments Already Exist to Dissuade Airlines from Tankering Fuel or to Compensate for Its Impact on the Environment

We started by conducting a series of interviews of pilots from airlines, business aviation dispatchers and handling agents. They confirmed that fuel tankering was a practice commonly used by airlines. They reported that 15% of the time they are performing full fuel tankering, and another 15% for partial fuel tankering. They also reported that fuel tankering is done in 90% of cases for fuel price reasons, and only in 10% of cases for social disruption, technical failures at the refueling facility, fuel shortages, risks of delays, or contaminated fuel at destination airports.
In fact, this practice is so common that, to assist the captain in calculating the optimum tankering, most airlines use operations centre software (e.g., Lido and Sabre) that ensures compliance with fuel policy but also takes into account the cost of fuel that the airline has negotiated at the airports it serves to determine the maximum amount of fuel that could be added on top if cost-effective. A patent has recently been published by Honeywell for a tool to further enhance fuel tankering and fully exploit its economic benefits [11]. Unexpectedly, in ICAO Doc. 10013 [2], which deals with “Operational Opportunities to Reduce Fuel Burn and Emissions”, the recommendation to reduce the use of fuel tankering is presented as a measure to reduce cost rather than highlighting the amount of additional emissions it generates, particularly CO2 emissions.
Then, we investigated whether instruments already exist to limit its practice or compensate for its environmental impact. The only instrument currently in place that could have had this effect is the European Union Emissions Trading Scheme (EU ETS).
However, the inclusion of aviation in the CO2 European EU ETS currently in place is not sufficient to limit the practice of tankering for economic reasons. First of all, Aviation EU ETS only covers flights within the European Union and therefore excludes flights for which one of the two airports served is located outside this area. For example, flights from Africa, America, Asia, China, Middle East, or Russia, are not subject to the EU ETS. In addition, as of today, 85% of the CO2 emission quotas of the aviation EU ETS, determined when the baseline was established, are still free of charge.
Furthermore, as pointed out by Daley and Preston, in [12], care should be taken to ensure that the introduction of new policies does not amplify the practice of tankering. [12] quotes: “if fuel taxes were not introduced globally, economic distortions could occur, creating an incentive for airlines to uplift cheaper fuel—by tinkering—in countries where the tax did not apply, with the net effect that aviation emissions could increase—hereby negating the original purpose of the tax (Wit et al., 2004, p. 43)”. However, as we observed in STEP 2, even in this case, this phenomenon would be limited by the physical capability of the aircraft to perform tankering and the possibility for airlines to adapt their business model to this new tax and the new possible traffic patterns. The purpose of this study is not to address the influence that new policies could have on the practice of tankering.

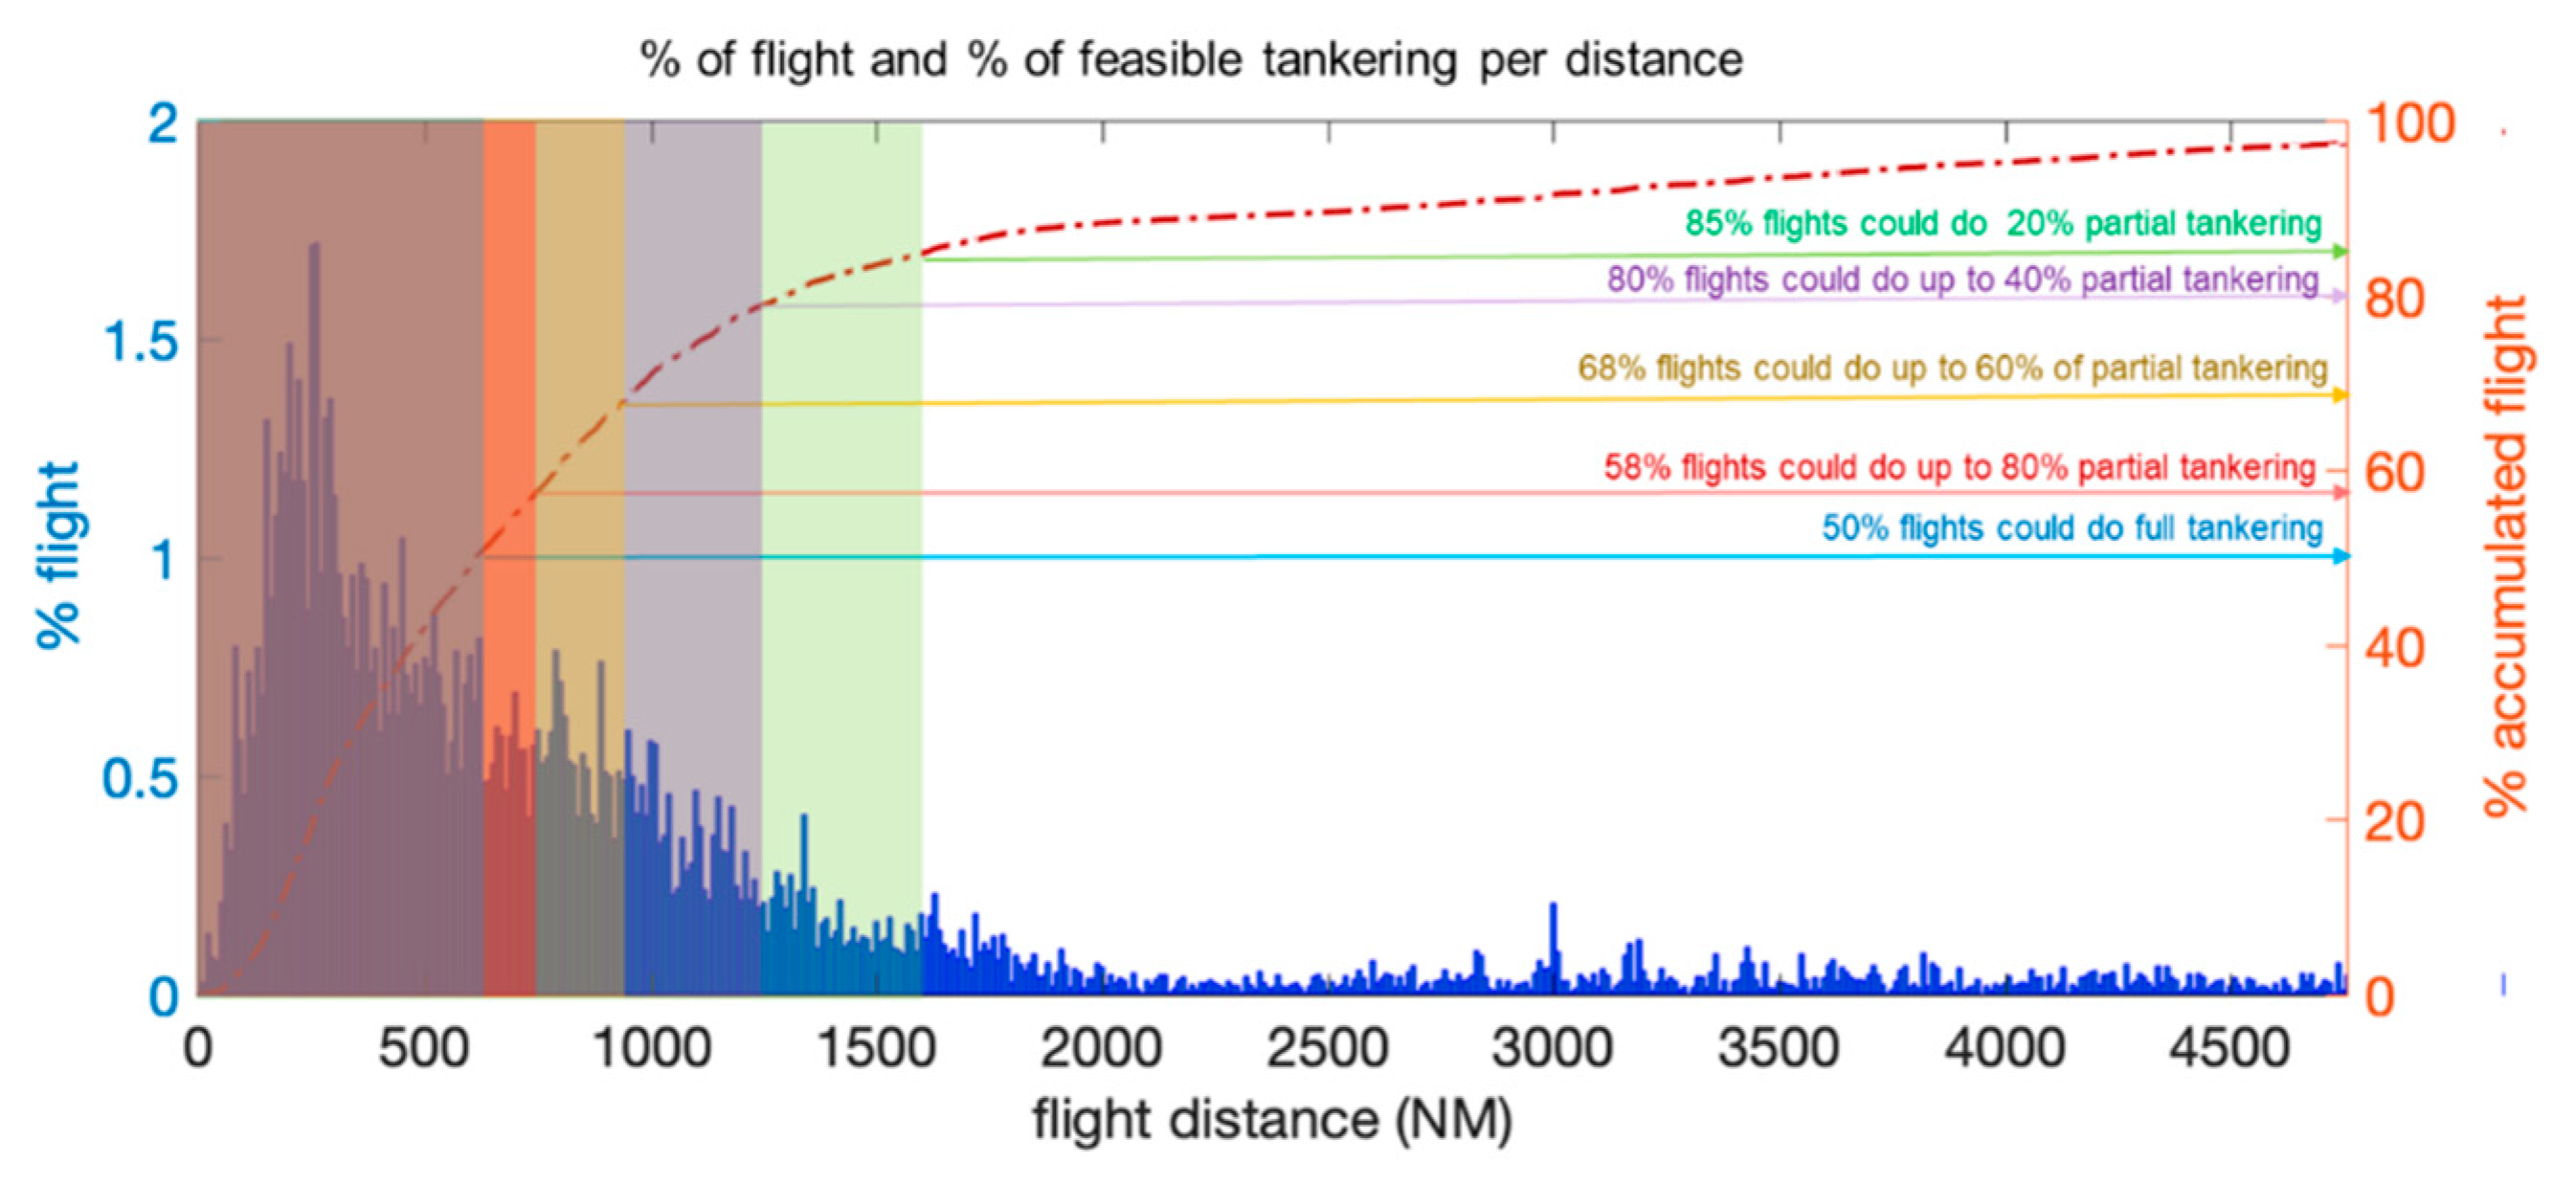
4.6. STEP 2: Identify When Fuel Tankering Is Operationally Feasible in ECAC

The capacity of aircraft to transport fuel is not infinite. Multiple factors influence the amount of fuel an aircraft can carry for a specific flight. It depends on the aircraft model, the type of engines it is equipped with, the size and options of the fuel tank fitted, its maximum take-off and landing weight, the distance flown, the specific conditions and situation at each airport and, most importantly, its payload.
The first step is therefore to estimate, for each type of aircraft, its capacity to carry different amounts of additional fuel (the amount of tankering in % of the fuel necessary for the return flight) over different distances, for different flight levels, and the amount of extra fuel burn due to the transport of this additional fuel. This was established with the help of BADA.
Figure 2 is an example of the “extra” fuel burn for one of the most representative aircraft models flying in ECAC for several distances and flight levels over which it can be operated. It can be seen that the % of extra fuel burnt on the first leg A to B, while carrying the full fuel required for the return leg B to A, varies a lot depending on the flight level, distance flown, and the % of tankering carried (due to the additional weight).
Figure 2 also helps to determine the % of extra fuel burnt at a flight level by a specific aircraft model.
Each aircraft weight has its own optimum flight level for a given distance. This is what is consider here, we determine the optimal flight level taking into account the new aircraft weight when performing full fuel tankering.
However, when reading it, it should not be concluded that the lower % of “extra” fuel burnt at the lowest flight levels (e.g., FL 290) translates into lower overall fuel consumption compared to higher flight levels (e.g., FL 350). Indeed, at these flight levels, the aircraft is well below its optimum cruising level, and will therefore consume much more fuel than at flight levels closer to this optimum. It is therefore necessary to convert to absolute kg of total fuel burnt to determine the optimum flight level to be used for carrying the “extra” fuel tankered.
Figure 3 shows that for a 600 NM flight of this aircraft model, the absolute minimum fuel burnt for carrying all the fuel required for the return flight (“full fuel tankering”) will be obtained if the flight is cruising at 36,000 ft (FL 360). The percentage of extra fuel burn compared to the fuel burn for one trip at its optimum flight level (36,000 ft or FL 360) compared to other possible flight levels is highlighted in Figure 4. This percentage of additional fuel burn is useful in determining the threshold at which it will be cost effective to tanker fuel, as explained below.
In this study, it was assumed that all flights would fly at their optimum flight level, but in reality, this is not always possible due to limited en route capacity or flight level capping between two city pairs (e.g., Between Paris and Frankfurt, flights are capped at 23,000 ft (FL 230) in one direction and 24,000 ft (FL 240) in the other direction, and are therefore burning even more fuel to carry the extra fuel compared to flying closer to 36,000 ft (FL 360) for this distance and weight. Consequently, in this study the extra fuel burn estimates due to tankering are very conservative.
Let us take the example of one of the most representative short-medium haul European aircraft on a 600 NM round trip flight, a distance close to the average distance of 585 NM for ECAC flight, between two airports A and B (Figure 5). The total weight of the aircraft model chosen consists of 43.7 tonnes of empty operating weight, plus 17.6 tonnes of payload, and 4.5 tonnes of fuel consisting of 3.6 tonnes for the flight and 0.9 tonnes of reserve and taxi. This model has a maximum fuel load capacity of 23.5 tonnes of fuel, and a maximum take-off weight of 77 tonnes.
When not doing tankering (Figure 5), the fuel consumption of this aircraft model over this distance is 3.59 tonnes. On arrival at airport B, there is 0.7 tonnes of reserve fuel left, and the total weight of the aircraft does not exceed 66 tonnes certified maximum landing weight for a safe landing.
By tankering all the fuel needed for the return leg (B-A) from airport A over a 600 NM flight (Figure 6), this flight burns 167 kg of fuel on top of the 3.59 tonnes of fuel burnt when not doing tankering. This represents 4.66% more fuel burnt. Consequently, if the fuel price negotiated by its airline operator at the destination airport B is 4.66% more expensive than at the departure airport A, and that the potential cost saving is above the profit threshold, it might be worthwhile for this operator, from an economic point of view, to decide to tanker all the fuel necessary for the return flight (B-A) from the departure airport A.
However, above 600 NM, it is no longer possible for this aircraft model to do full tankering, only partial tankering could be envisaged.
Let us take the example of a 900 NM flight with the same aircraft model as before, same empty operating weight of 43.7 tonnes, same payload of 17.6 tonnes, same maximum fuel load capacity of 23.5 tonnes of fuel, and same maximum take-off weight of 77 tonnes. It will need 6.4 tonnes of fuel to perform this flight, consisting of 5.2 tonnes for the trip and 1.2 tonnes of reserve. When not doing tankering (Figure 7), the fuel consumption of this aircraft model over this distance is now 5.19 tonnes. On arrival at airport B, there is 1 tonne of reserve fuel left, and the total weight of the aircraft does not exceed 66 tonnes certified maximum landing weight for a safe landing.
Under the same operational assumptions mentioned above, this type of aircraft cannot do 100% fuel tankering on a 900 NM flight but only a maximum of 50%, otherwise it would exceed its authorized landing weight at airport B. At 50% fuel tankering (Figure 8), this flight burns 3.66% more fuel than if it had not carried that “extra” fuel. Consequently, if the fuel price negotiated by its airline operator at the destination airport B is 3.66% more expensive than at the departure airport A, it might be worthwhile for this operator, from an economic point of view, to decide to tanker 50% of the fuel necessary for the return flight (B-A) from the departure airport A.

4.7. STEP 3: Calculate the Number of Flights for Which Full or Partial Tankering Is Operationally Possible

After having determined the tankering capability for each aircraft model, it is necessary to estimate how many aircraft of the same model operated in ECAC could potentially do tankering and at what percentage level. This is illustrated in Figure 9, which shows for one specific aircraft model the percentage of fuel tankering possible as a function of the flight distance in NM and the percentage of additional fuel burnt.
Once the percentage of tankering capacity for this aircraft model for several theoretical distance flown are obtained, they have been applied to the real traffic in ECAC grouped by distance flown as illustrated in Figure 10.

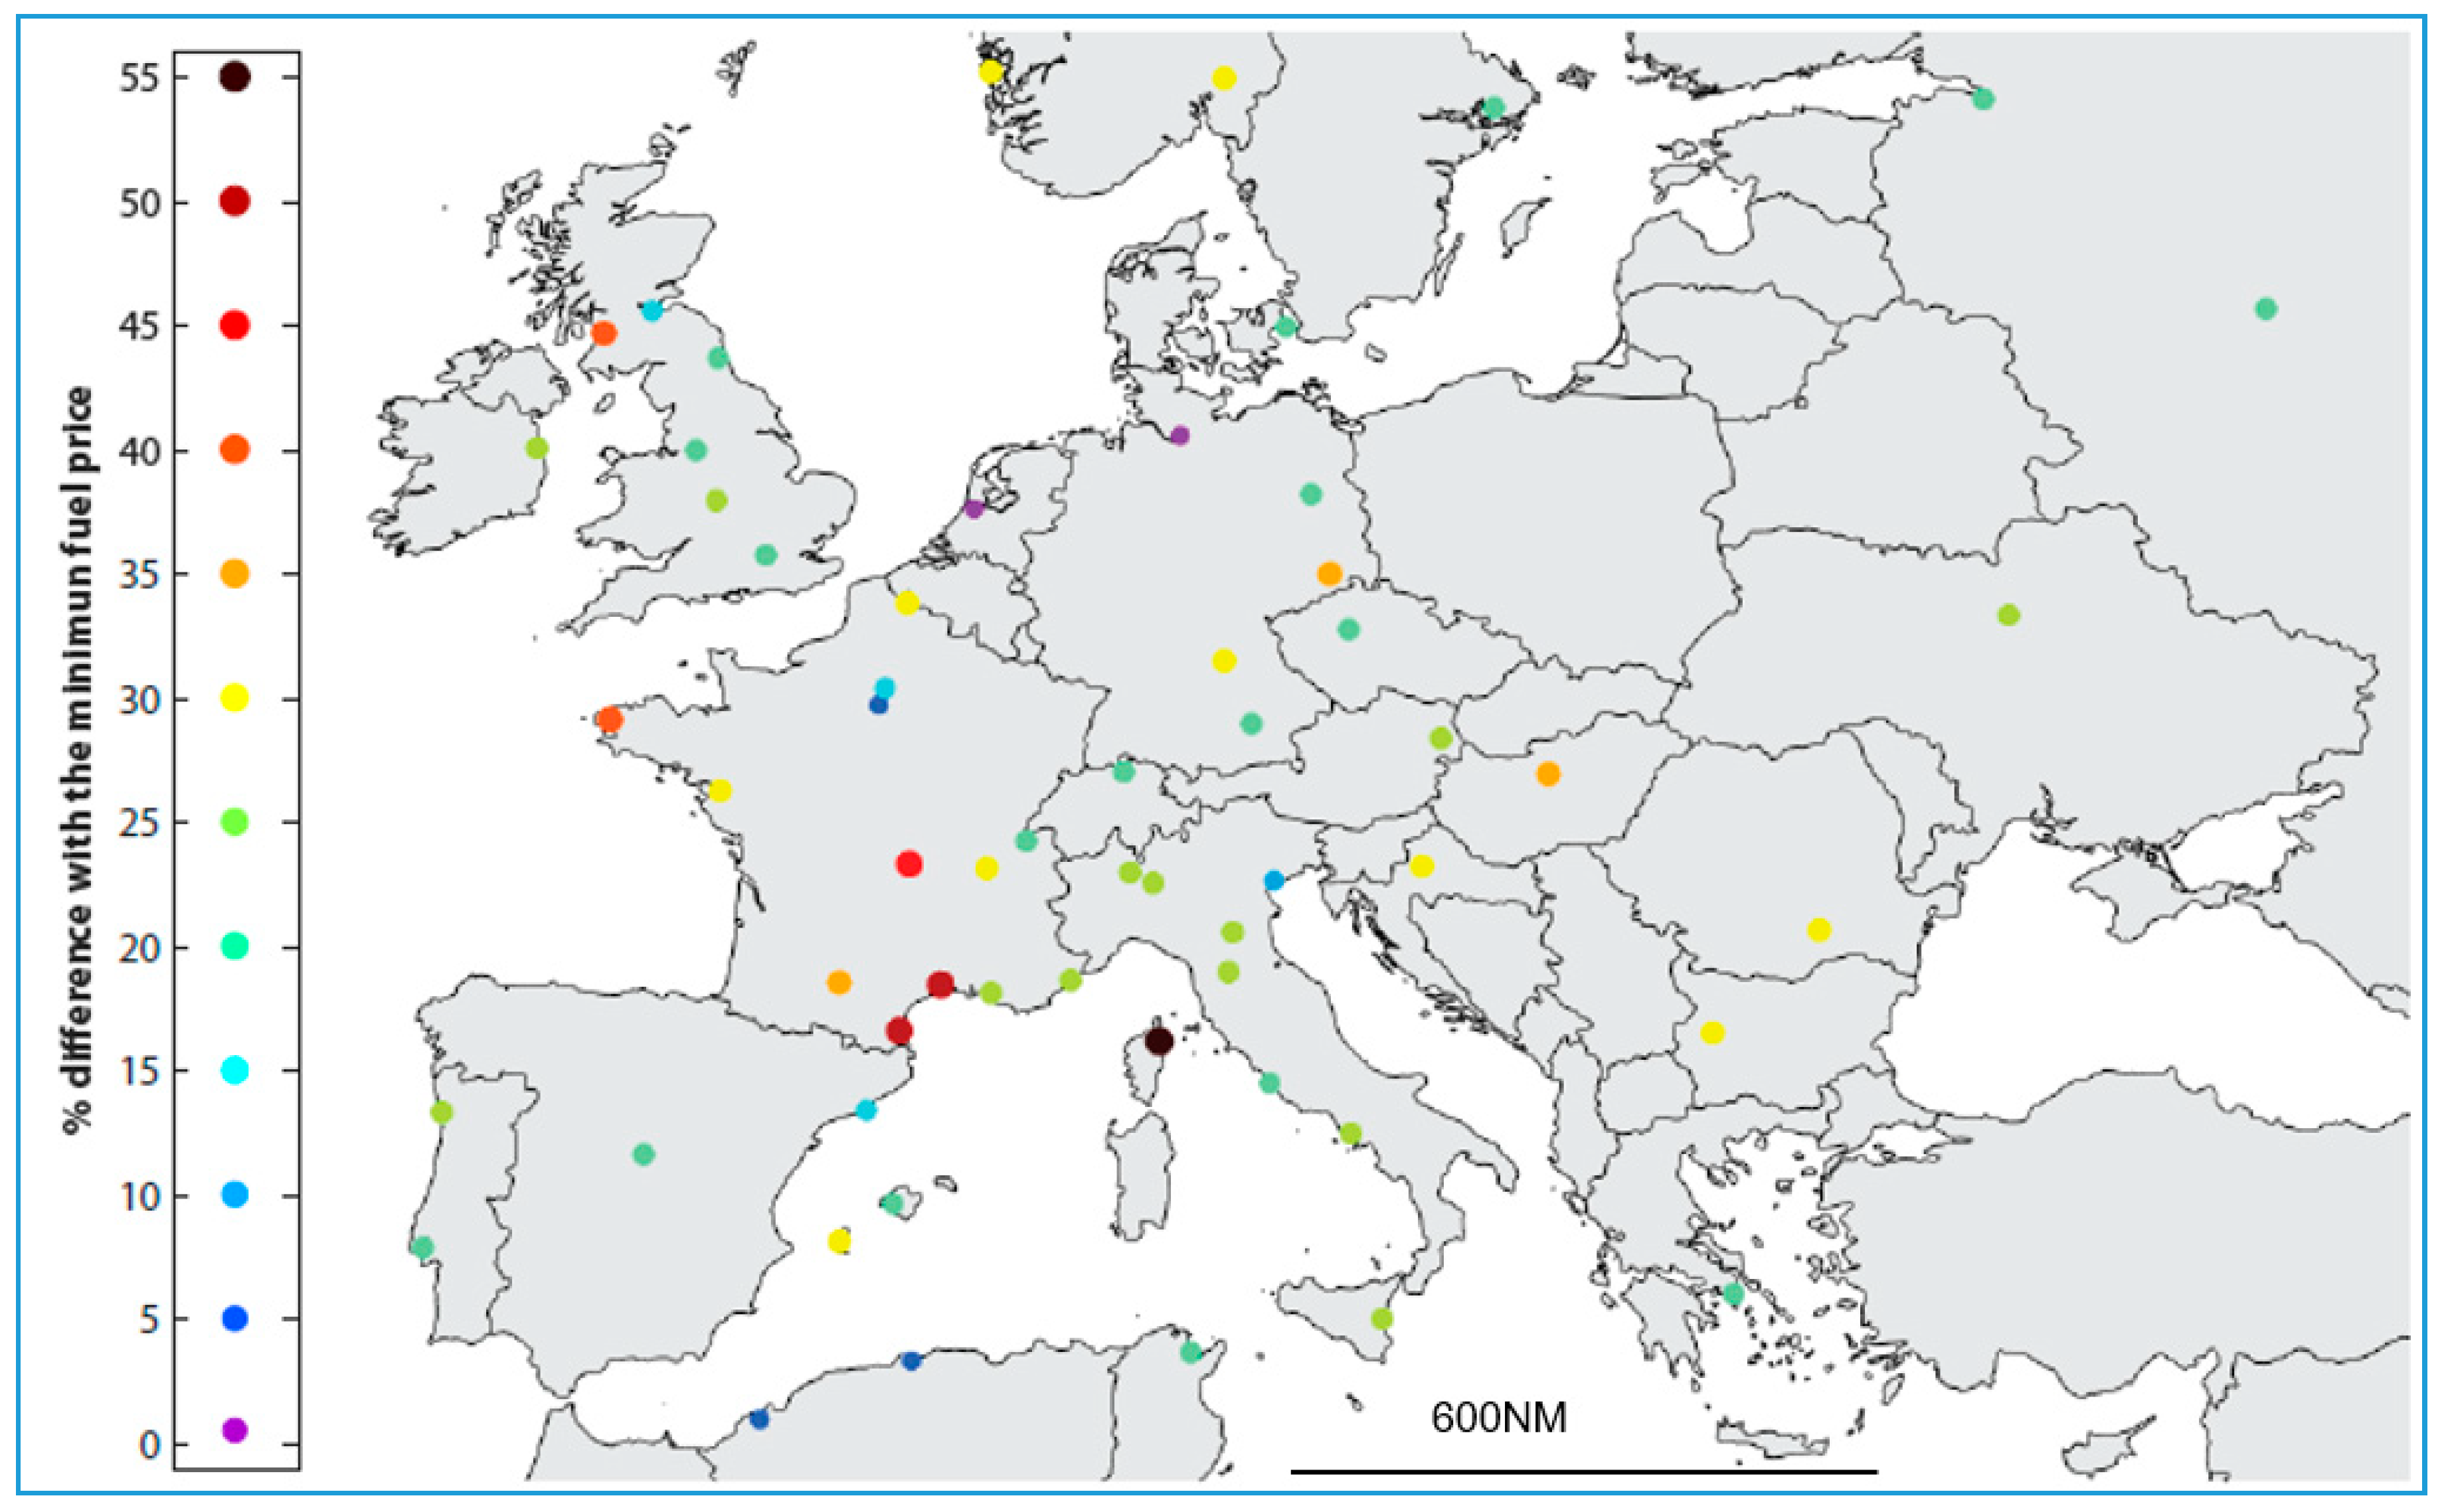
4.8. STEP 4: Estimate the Economic Opportunity of Tankering

The fact that it is “technically possible” for a flight to make a full or partial tankering, does not mean that the airline operating that aircraft will decide to do so. Putting aside safety and special considerations at the destination airport (B), it was assumed in our model that this decision will be based on the cost savings that can be made, thanks to the difference in fuel prices negotiated at airports A and B.
As can be seen in Figure 11, the average worldwide price of jet fuel is not constant. It is largely influenced by the crude oil price.
In addition, the following factors influence also the price of jet fuel in each airport:
  • Country;
  • Taxes (Fuel taxes in some ECAC country only for domestic flights), and refining costs;
  • Negotiation period;
  • Profit, quantities, and supply competition at airports;
  • Distribution technique;
  • Purchasing power and size of the aircraft operator’s fleet.
Generally, each airline negotiates, with a fuel provider, a fuel price at each airport it serves for an agreed duration.
In addition, most airlines protect themselves against major fluctuations in fuel prices for the next six months to two years by using various hedging strategies and instruments. However, “hedging” has no significant effect on existing fuel price differences between airports, and could only marginally reduce the benefit of tankering [13,14].
Airlines negotiated fuel prices are commercially sensitive data and must remain confidential. For this reason, the values presented on the map (Figure 12) are averaged values calculated from the fuel prices negotiated by the airlines for which we were able to obtain this information. Nevertheless, it shows that there are large differences between fuel prices at airports, e.g., Fuel price at Amsterdam (purple dot, so 0%) is among the cheapest in Europe. Fuel price at Ibiza and Hamburg or Oslo (yellow dots) is 30% more expensive than the cheapest airports, such as Amsterdam. Fuel price at Heathrow (light cyan dot) is 20%more expensive than the cheapest airports, such as Amsterdam, but 20% cheaper than Glasgow (red dot, 40%).
In this study, we considered that each tonne of CO2 emitted required the purchase of CO2 allowances, which, as explained in STEP 1, is not the case. This cost is deducted from the benefit of doing tankering.
Figure 13 shows the net savings that could be achieved according to different percentages of fuel tankering and different fuel price for a 600 NM flight. It must be noted that this figure is simplified while in the real processing there was a 10% step for every partial fuel tankering and real fuel price difference from some airlines. In the figure, it can be seen that the economic advantage of fuel tankering is not always possible. For differences in fuel prices between airports (A and B) of 2 and 5% the benefits do not reach the 30€ threshold. For a fuel price difference of 10% and for tankering from 40 to 100% the cost savings range from 44.4 to 94.9€. At a fuel price difference of 20% and tankering from 20 to 100% the cost savings range from 66.5 to 292.5€.
Finally, by applying the Steps 2, 3, and 4 described above to all ECAC flights and aircraft models considered in the simulations, the following results were obtained:
As indicated in the Table 1 fuel tankering could result in a net saving of 265 M€ per year for the airlines, but would generate 286,000 additional tonnes of fuel burnt (equivalent to 0.54% of ECAC jet fuel used) and 901,000 tonnes of CO2 emissions in the ECAC area per year.
Figure 14 shows that on the short and medium-haul fleet, the percentage of flights that could perform full fuel tankering decreases with the distance to be flown. This is mainly due to the fact that as the distance to be flown increases, the aircraft has to carry much more fuel from the departure airport (Airport A), therefore increasing its landing weight at the destination airport (Airport B). When this landing weight exceeds the certified Maximum Landing Weight, full fuel tankering is not possible anymore. Partial tankering in turn takes over until itself reaches its operational limit, for the same reasons, at more than 1500 NM. Besides, it is obvious that the difference in fuel price has also a certain influence.
Figure 15 shows that distance matters, the longer the distance to be covered, the more fuel needs to be tankered, leading to an increase in extra fuel burn. It should be noted that doubling the distance travelled results in more than doubling the fuel needed to carry this extra fuel, and thus the resulting emissions.
Figure 16 shows the distribution of the 160,000 tonnes of additional fuel burnt (505,000 tonnes of CO2) due to full fuel tankering and the 126,000 tonnes of additional fuel burnt (397,000 tonnes of CO2) due to partial tankering per distance flown. It clearly shows that the partial tankering is mainly performed over long distances in ECAC and represents a significant part of the extra fuel burnt. Although only 4.5% of flights perform partial tankering, they account for nearly half of the CO2 emissions (44%) due to this practice.

5. Conclusions

As aviation is a very competitive market, airlines must do everything possible to minimize their operating costs, in particular regarding fuel cost, which represents 17 to 25% of their operating expenses [1]; this goes even up to 50% for some low-cost carriers. Consequently, airlines are using tools for identifying the value of performing fuel tankering, a practice whereby an aircraft carries more fuel than required for its flight in order to save costs. However, fuel tankering is not without environmental consequences, as the more fuel an aircraft carries, the more fuel it burns and the more CO2 it emits. The use of fuel tankering by long-haul flights will be the subject of a future study. This study is limited to flights up to 1500 and 2500 NM, corresponding mainly to short and medium-haul flights. It is estimated that fuel tankering could result in a net saving of 265 M€ per year for the airlines, but would generate 286,000 additional tonnes of fuel burnt (equivalent to 0.54% of ECAC jet fuel used) and 901,000 tonnes of CO2 emissions in the ECAC area per year. This is equivalent to about 2800 round-trips between Paris and New York or the annual emissions of a European city of 100,000 inhabitants. This is a substantial economic benefit but also a significant environmental impact. Consequently, fuel tankering could offset the benefit of initiatives to save fuel and reduce aviation CO2 emissions. At a time when aviation is challenged for its contribution to climate change, a practice, such as fuel tankering, that generates significant additional CO2 emissions is questionable. Unfortunately, the COVID19 crisis has created such economic pressure that airlines have intensified the practice of fuel tankering since then, as reported by some pilots.

Author Contributions

All the authors contributed equally to this work. All authors have read and agreed to the published version of the manuscript.

Funding

This research received no external funding.

Institutional Review Board Statement

Not applicable.

Informed Consent Statement

Not applicable.

Data Availability Statement

The data used to produce this analysis are EUROCONTROL data and are not available in the public domain. In particular, negotiated fuel prices at the airports used in this study remain confidential.

Acknowledgments

This study was carried out with the aim of raising awareness of the considerable environmental impact of a practice such as fuel tankering. It was carried out independently, but required the collection of commercially sensitive information, which we had to anonymize. The results of this study were published in EUROCONTROL’s first “Think Paper”, and subsequently picked up in many newspapers, news feeds and other media [15,16]. Following its publication, a number of airlines had begun to reflect on reducing or even abandoning this economic practice. The authors would like to express their deep gratitude to all colleagues who were directly or indirectly involved in this study, and to the EUROCONTROL top management who had the courage to make it public.

Conflicts of Interest

There are no conflicts of interest whatsoever.

References

  1. Kumar, N.; Frolik, P.; Joshi, G.; Ramadugu, H. World Air Transport Statistics; IATA: Montreal, QC, Canada, 2017. [Google Scholar]
  2. ICAO. Operational Opportunities to Reduce Fuel Burn and Emissions, 1st ed.; Doc 10013; ICAO: Montreal, QC, Canada, 2014. [Google Scholar]
  3. Filippone, A. Case Study Fuel Tankering: Is It Worth It? The University of Manchester, February 2015. Available online: http://www.flight.mace.manchester.ac.uk/aircraft-performance-software/case-studies/by-solution/11_CS_Fuel_Tankering.pdf (accessed on 30 January 2021).
  4. Lindgren, M.; Brynhagen, M. Fuel Tankering. Master’s Thesis, Lund University School of Engineering at Campus Helsingborg, Helsingborg, Sweden, 2012. Available online: https://www.iea.lth.se/publications/BS-Theses/Full%20document/3018_Brynhagen_Lindgren.pdf (accessed on 30 January 2021).
  5. Lesinski, J.W., III. Tankering Fuel: A Cost Saving Initiative. Graduate Research Paper, Department of the Air Force at Air Force Institute of Technology, Wright-Patterson Air Force Base, Ohio, May 2011. Available online: https://apps.dtic.mil/dtic/tr/fulltext/u2/a547625.pdf (accessed on 8 October 2020).
  6. Tavares Guerreiro, J.A.; Muller, C.; Fibeiro Correira, A. A fuel tankering model applied to a domestic airline network. J. Adv. Transp. 2013, 47, 386–398. [Google Scholar] [CrossRef]
  7. Focus on Fuel Part Three: Global Fuel Pricing and Availability. Retrieved March 2019. Available online: https://www.jetex.com/global-fuel-pricing-and-availability/ (accessed on 8 October 2020).
  8. Thurber, M. Tankering Benefits Tangible and Achievable. October 2015, Retrieved March 2019. Available online: https://www.ainonline.com/aviation-news/business-aviation/2015-10-12/tankeringbe-ne_ts-tangible-and-achievable (accessed on 8 October 2020).
  9. Benito Ruiz de Villa, A. Práctica de tankering en las líneas aéreas españolas. In Proceedings of the IX Congreso de Ingeniería del Transporte, CIT2010, Madrid, Spain, 7–9 July 2010; Available online: http://oa.upm.es/9544/ (accessed on 8 October 2020).
  10. EASA (European Aviation Safety Agency); EEA (European Environment Agency); EUROCONTROL. European Aviation Environmental Report 2019. Available online: https://ec.europa.eu/transport/sites/transport/files/2019-aviation-environmental-report.pdf (accessed on 8 October 2020). [CrossRef]
  11. Methods and Apparatus for Providing Fuel Tankering Data Onboard and Aircraft. Pub. No. US 2018/0189704 A1, July 2018. Available online: https://www.freepatentsonline.com/y2018/0189704.html (accessed on 8 October 2020).
  12. Daley, B.; Preston, H. Aviation and climate change: Assessment of policy options. In Climate Change and Aviation. Issues, Challenges and Solutions; Gössling, S., Upham, P., Eds.; Earthscan: London, UK, 2009; pp. 347–372. [Google Scholar]
  13. Morell, P.; Swan, W. Airline Jet Fuel Hedging: Theory and Practice. 24 November 2006. Available online: https://www.researchgate.net/publication/228628896_Airline_Jet_Fuel_Hedging_Theory_and_Practicel (accessed on 8 October 2020). [CrossRef] [Green Version]
  14. Bloomberg Markets and Finance. Ryanair’s O’Leary Says Happy to Continue as CEO for 2 to 3 Years. Available online: https://www.youtube.com/watch?v=PgpwYeEj5Roat0’57” (accessed on 8 October 2020).
  15. BBC Panorama. Can Flying Go Green? Available online: https://www.youtube.com/watch?v=mPhOS4uXkmM (accessed on 8 October 2020).
  16. Rowlatt, J. Climate change: British Airways Reviews ‘Fuel-Tankering’ over Climate Concerns. BBC News. 11 November 2019. Available online: https://www.bbc.com/news/science-environment-50365362 (accessed on 8 October 2020).
Figure 1. Example of extra fuel burn for a return flight between two airports with and without fuel tankering.
Aerospace 08 00037 g001
Figure 2. % of extra fuel burnt for full fuel tankering on various flight distances for a specific aircraft model.
Aerospace 08 00037 g002
Figure 3. Total fuel burnt (kg) for full fuel tankering at various flight levels (hundreds of feet).
Aerospace 08 00037 g003
Figure 4. % of extra fuel burnt for various flight distances for a specific aircraft mode with optimum flight cruise level determined.
Aerospace 08 00037 g004
Figure 5. Example for a 600 NM flight with no tankering.
Aerospace 08 00037 g005
Figure 6. Example for a 600 NM flight performing a full (100%) tankering.
Aerospace 08 00037 g006
Figure 7. Example for a 900 NM flight with no tankering.
Aerospace 08 00037 g007
Figure 8. Example for a 900 NM flight performing a 50% partial fuel tankering.
Aerospace 08 00037 g008
Figure 9. % of extra fuel burn as a function of % of tankering and distance flown for a specific aircraft model.
Aerospace 08 00037 g009
Figure 10. % of flight and % of feasible tankering per distance.
Aerospace 08 00037 g010
Figure 11. Average world price of crude Oil and Jet Fuel (IATA index Platts; https://www.iata.org/en/publications/economics/fuel-monitor/).
Aerospace 08 00037 g011
Figure 12. Illustrative fuel price difference at airports.
Aerospace 08 00037 g012
Figure 13. Net saving and airport fuel price difference vs % of fuel tankering for a 600 NM flight.
Aerospace 08 00037 g013
Figure 14. % of flights which could exercise fuel tankering (and save money by doing so), per distance flown.
Aerospace 08 00037 g014
Figure 15. Extra fuel burn per distance flown.
Aerospace 08 00037 g015
Figure 16. Tonnes of extra fuel burn per distance flown.
Aerospace 08 00037 g016
Table 1. Evaluated Net savings due to tankering versus Extra CO2 emitted.
Extra Fuel Burnt (tonnes/year)Cost to Transport Extra Fuel (M€/year)Extra CO2 Emitted (tonnes/year)Cost of Purchasing CO2 Allowances (M€/year)Net Saving = Tankering Saving − [Extra Fuel + CO2 Cost] (M€/year)
Full tankering160,00088504,00010217
Partial tankering126,00069397,000848
Total tankering286,000157901,00018265
Publisher’s Note: MDPI stays neutral with regard to jurisdictional claims in published maps and institutional affiliations.

