Abstract
Aviation is seeking for ways to reduce its climate impact caused by CO2 emissions and non-CO2 effects. Operational measures which change overall flight altitude have the potential to reduce climate impact of individual effects, comprising CO2 but in particular non-CO2 effects. We study the impact of changes of flight altitude, specifically aircraft flying 2000 feet higher and lower, with a set of global models comprising chemistry-transport, chemistry-climate and general circulation models integrating distinct aviation emission inventories representing such alternative flight altitudes, estimating changes in climate impact of aviation by quantifying radiative forcing and induced temperature change. We find in our sensitivity study that flying lower leads to a reduction of radiative forcing of non-CO2 effects together with slightly increased CO2 emissions and impacts, when cruise speed is not modified. Flying higher increases radiative forcing of non-CO2 effects by about 10%, together with a slight decrease of CO2 emissions and impacts. Overall, flying lower decreases aviation-induced temperature change by about 20%, as a decrease of non-CO2 impacts by about 30% dominates over slightly increasing CO2 impacts assuming a sustained emissions scenario. Those estimates are connected with a large but unquantified uncertainty. To improve the understanding of mechanisms controlling the aviation climate impact, we study the geographical distributions of aviation-induced modifications in the atmosphere, together with changes in global radiative forcing and suggest further efforts in order to reduce long standing uncertainties.
1. Introduction
Aviation contributes to climate change by its emissions of CO2, as well as by the effects of non-CO2 impacts. Hence, aviation contributes to anthropogenic climate change. As sustainable aviation is a strategic goal of the aviation sector, it is aiming to develop efficiently in order to mitigate aviation climate impact. One promising mitigation option is alternative aircraft routing by optimizing aircraft trajectories by operationally adapting flight altitudes.
The climate impact of aviation emissions depends on altitude of emission, as has been shown in several papers, e.g., [1,2,3,4,5,6,7,8]. It has been shown that changing flight altitude modifies the radiative forcing and climate impact of aviation due to a change of both emissions and atmospheric sensitivity at location of emission with regard to climate impact, e.g., [9]. The sensitivity to the altitude of emissions is caused by changes in atmospheric processes, e.g., chemical reaction rates and lifetimes [2,10], contrail ice nucleation and its impact on lifetime [11], and ice supersaturation frequency [12]. However, flying higher causes radiative forcing of one effect to increase, while at the same time causing another effect to decrease. These counteracting effects need to be considered in order to quantify the total radiative impacts of aviation and when developing mitigation options [13]. However, an overall assessment that presents such trade-offs between different effects for flying higher or flying lower in a consistent way, assessing impacts of all effects where now quantitative estimates are available, is missing. An earlier study showed that when aircraft fly lower, the radiative forcing (RF) from nitrogen oxides decreases by about 30% and increases by about 30% when they fly higher [14]. An overview on how the impact of alternative flying altitudes calculated by a set of state-of-the-art atmospheric chemistry models was provided by [15] comprising impacts of nitrogen oxides, contrail cirrus, water vapor, aerosol sulfate, and soot emissions. However, the indirect aerosol effect on warm clouds has not yet been assessed. The applied study concept relies on a perturbation approach, which estimates how the atmosphere responds when emissions from one source are removed from the system. However, these earlier studies have not considered to what extent this kind of method makes it possible to answer the question as to how individual sources contribute to atmospheric impacts and overall climate change. Further analysis on nitrogen oxide impacts considering recent research results [16] require further attention. Additionally, a combined assessment on how individual effects change in individual regions of the globe is still missing. The objective of this paper is (1) to perform a sensitivity study on how radiative impact of aviation changes when aircraft fly higher or lower compared to their standard flight altitude, (2) to assess the behavior of individual non-CO2 effects for flight altitude changes in different regions, comprising NOx and contrail cirrus (CC) impacts, as well as a quantitative estimate of the indirect aerosol effect on warm clouds (AiwC). Finally, this paper (3) provides a comprehensive assessment of aviation radiative forcing and associated temperature change, thereby representing climate impact while incorporating trade-off effects on the set of non-CO2 effects induced by aviation emissions. In the end, we make suggestions as to how to narrow the uncertainties connected with our current estimates.
2. Materials and Methods
2.1. Modelling Concept for Climate Impact Assessment
Quantitative estimates of aviation climate impact are based on numerical simulations with a set of global models, comprising chemistry-transport, chemistry-climate and general circulation models, which represent the atmospheric, physical and chemical processes influenced by aviation emissions, provided as detailed emission inventories. Such models allow the study of transport and transformation of aviation emissions, comprising changes and modifications in atmospheric composition and the impact of the coupling of atmospheric reaction cycles with regard to chemical and physical processes. In this study, we use a set of separate chemistry-climate model simulations, each representing and modelling individual aviation impacts. Such a multi-model concept was used in earlier studies, e.g., [17], to quantify radiative impact of aviation emissions from CO2 and non-CO2 effects. Recently, an updated assessment was presented [18]. In our assessment, we consider the radiative impacts resulting from the emissions of CO2, NOx (via formation of ozone and influence on methane lifetime and secondary induced changes in ozone), SO2 and sulfate particles (resulting in direct radiative effects, as well as indirect impacts due to modifications of liquid water clouds), soot, water vapor, contrails and contrail cirrus. In such numerical modelling studies, distinct emission inventories of aviation are integrated as boundary conditions in order to perform a set of model calculations.
2.2. Emission Inventories for Flying Lower and Flying Higher
As part of the REACT4C project [19] three global emission inventories (Table 1) were developed, which describe a so-called Base Case (reference), and two scenarios with shifted flight levels, Flying Lower and Flying Higher [20]. In the base case (reference), it is assumed that aircraft fly at their optimal altitude, while in the alternative altitude scenarios Flying Higher (Lower) all aircraft are flying 2000 feet (~600 m) higher (lower). In the Flying Higher scenario, only those aircraft that are able to fly higher are shifted to a higher altitude, otherwise they remain at their reference lower flight altitude. Information on flight planning data and assumptions on aircraft trajectories relies on year 2006 conditions. The total flown distance in the inventories is 38.9 × 10⁹ km. The base year 2006 was selected as a reference since it has been adopted by several earlier modelling studies which provided quantitative estimates on emissions and climate impacts, e.g., [14,21,22,23].

Table 1.
Fuel consumption and emission of aviation in the reference case and the scenarios Flying Lower and Flying Higher.
Comparing totals in different inventories, we find that fuel consumption and hence CO2 emissions increase by about 1% if aircraft fly lower, while they decrease by about 1% if aircraft fly higher. Due to large atmospheric lifetime of CO2, impacts do not depend on location of emission; hence, an increase or decrease in emissions is directly associated with an increase or decrease in radiative impacts, hence climate impact. We present the geographical distribution of aviation emissions of distance flown, nitrogen oxides, and soot in these global emission inventories (Figure 1), also comparing the Flying Higher and Flying Lower scenarios with the reference case.
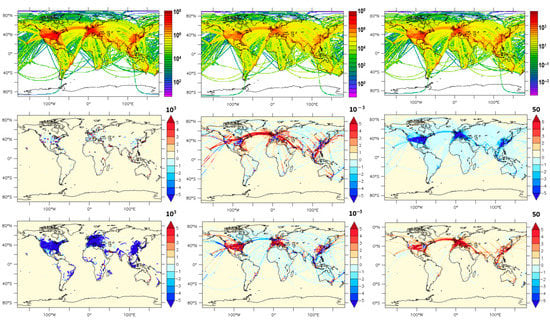
Figure 1.
Global distribution of distance flown (left), nitrogen oxides (middle) and soot emission (right): reference case absolute emissions [kg] (upper row), and difference between inventories Flying Higher (middle row) and Flying Lower (lower row) compared to reference case.
Global total nitrogen oxides emissions increase by about 1% in the Flying Higher scenario. Geographic distribution shows that in some regions the emission increase, e.g., in the North Atlantic Flight corridor, while only in several other regions, a slight reduction is shown, e.g., over Europe and the west coast of the United States of America. In the Flying Lower scenario, nitrogen oxides emissions global totals remain about the same. A geographical redistribution can be observed with increasing emissions, e.g., over Europe and the United States of America, and decreasing emissions, e.g., in the North Atlantic Flight corridor.
The vertical distribution of nitrogen oxides emissions exhibits a partial shift to higher or lower flight altitudes (Figure 2). In the vertical distribution the maximum covers a narrower band in the Flying Higher, compared to reference and Flying Lower, which show a wider maximum band. All three scenarios show a clear maximum in Northern Latitudes at about 30–60° N. Comparing scenarios with the reference case shows that nitrogen oxides in the zonal and latitudinal mean are higher in the Flying Higher scenario, while in the Flying Lower scenario, nitrogen oxides decrease in some regions, e.g., at about 20° N and about 50° N, and increase in other regions, e.g., 40° N.
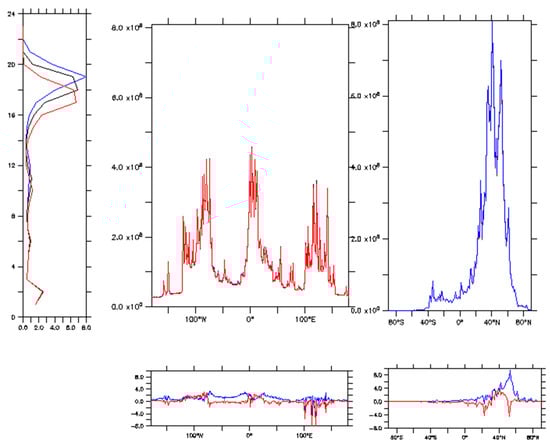
Figure 2.
Global distribution of aviation NOx emission mass flux; vertical distribution representing flight levels in 2000 ft steps [108 g] (left), meridional distribution [g] (middle), zonal distribution [g] (right): reference case (REACT4C, black), Flying Higher (blue), Flying Lower (red) and differences [107g] (bottom row): ‘Higher—reference case’ (blue) and ‘Lower—reference case’ (red).
2.3. Atmospheric Modelling of Aviation-Induced Non-CO2 Impacts
A multi-model concept has been applied in earlier studies [5,14] to quantify the radiative impact of aircraft emissions comprising CO2 and non-CO2 effects of aviation. Here we use a set of different comprehensive global model simulations, each representing the chemical and physical atmospheric processes for an individual aviation impact. Specifically, we apply the following models to investigate radiative impacts of aviation non-CO2 effects: Oslo CTM [14], MOZART-3 [8], EMAC [24,25], EMAC/MADE3 [26], ECHAM4-CCMod [27], ULAQ [21]. Finally, the nonlinear climate chemistry response model AirClim [28] is used to calculate changes in radiative forcing and associated temperature change, and hence the climate impact of aviation emissions. The models used in this study are presented in Table 2, providing information on the type of model, setup, resolution, length of simulation, and offline or online calculation of radiative impacts.
Table 2.
List of global comprehensive atmospheric models used; describing type, setup, horizontal/vertical resolution (this is to follow the columns in the table), setup, simulation length, calculation method for radiative changes and effects investigated.
Aviation effects of nitrogen oxides emissions are calculated with four distinct atmospheric chemistry models, while aerosol cloud interaction effect on warm clouds and contrail cirrus impacts are assessed with individual models. Linear contrails are not mentioned separately, as the contrail cirrus impact comprises the combined effect of linear contrails and those cirrus that develop from them.
The impact of contrails, and the cirrus developing from those contrails, both together termed contrail cirrus, was calculated. In ECHAM4-CCMod [27] an independent cloud class, contrail cirrus, was introduced into the cloud scheme, enabling the simulation of the whole contrail cirrus life cycle. We do not give an independent estimate for line-shaped contrails, as it is not known how long contrails stay line-shaped under certain environmental conditions. The formation of contrails, when hot and moist plume exhaust mixes with environmental air [28], is parameterized. Contrails persist when they form in ice supersaturated air. The simulation of contrail formation and persistence is based on the parameterization of ice supersaturation by [29,30]. ECHAM-CCMod uses a one-moment cloud microphysical scheme, and therefore does not capture the variability in contrail ice nucleation depending on background atmospheric conditions [11,31] and the dependency of contrail cirrus radiative forcing on initially formed ice crystal numbers [29].
2.4. Calculation of Non-CO2 Radiative Impacts
From the simulations with atmospheric models described in Table 2, we determine the influence of aviation emissions on atmospheric composition and cloud properties, with a focus on several key species, on meteorological fields and on the Earth radiative balance. The influence of a mitigation scenario is calculated by comparing an individual scenario simulation (with either flying higher or lower emission altitude) to the reference (base) case considering aircraft emissions with standard flight altitudes, investigating aviation induced perturbation signals. On the basis of this comparison, we can identify the impact of flying higher of flying lower on atmospheric concentrations of radiatively active species and meteorological phenomena, comprising warm and cirrus clouds. Such modifications in atmospheric parameters then result in a changing radiative balance in the atmosphere, which is quantified with the help of physical climate metrics, either calculated online during the model simulations or offline (in Table 2) in separate radiative transfer simulations [14].
3. Changes in Atmospheric Composition and Radiative and Temperature Responses
Within the introduced set of state-of-the-art atmospheric chemistry-climate models, we use the above-described emission inventories and calculate aviation-induced changes in the atmosphere that are radiatively active, comprising greenhouse gases, contrail cirrus and natural clouds. We present the associated changes in radiative forcing, discuss the study design of using perturbation approach when assessing climate impact of aviation, and provide estimates of aviation-induced temperature changes.
3.1. Effect of Aviation Nitrogen Oxides
We analyze the impacts of aviation NOx with a set of CTMs and GCMs using a perturbation approach [14] while providing information on global distribution of aviation-induced modifications. Figure 3 shows aviation-induced modifications in net ozone production when aircraft fly lower or higher in autumn. In the Flying Higher case, net O3 production increases considerably, at 200 hPa, while at 300 hPa, net ozone production decreases or increases, depending on the region. On the other hand, in the Flying Lower case, net ozone production decreases, at 200 hPa, while at lower altitudes (300 hPa), changes in net ozone production also depend on the region, with increases at around 40° N, and decreases at lower latitudes (20–30° N).
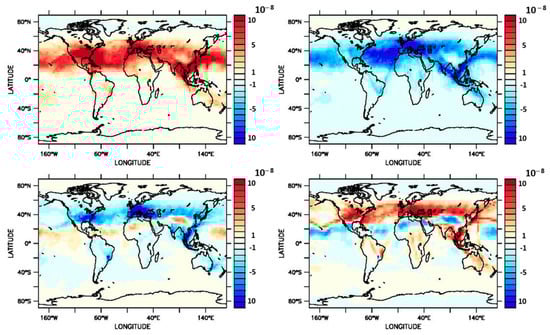
Figure 3.
Change in net ozone production [10−12 mol/s] Flying Higher (left) and Flying Lower (right) compared to reference case in autumn at 200 hPa (upper row) and 300 hPa (lower row).
In the seasonal evolution of aviation-induced changes in partial ozone columns (Figure 4), two distinct maxima in the Northern extra tropics appear in the zonal distribution, one in spring and one on early winter. When aircraft are flying higher, the spring maximum intensifies from April on, increasing ozone induced in polar and low latitudes, while the maximum in early winter only increases in the low latitudes, but aviation-induced modifications in the polar latitudes decrease. When aircraft are flying lower aviation-induced ozone decreases, with the highest decrease of ozone columns in summer in the Northern polar latitudes.
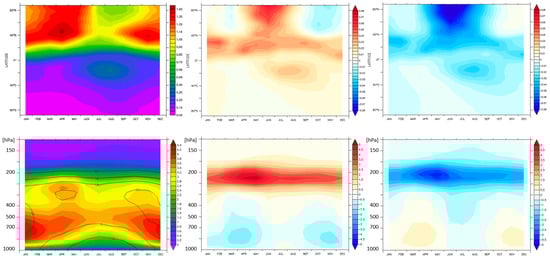
Figure 4.
Aviation-induced ozone and changes when aircraft flying at alternative altitudes: Hovmöller diagram (upper row) of aviation-induced ozone (columns in DU), showing seasonal change (Jan-Dec, x-axis) over latitudes (y-axis) and seasonal change of vertical partial columns (lower row) for Jan-Dec (x-axis) of aviation-induced partial ozone columns (in 0.01 DU) over different altitudes (y-axis): aviation signal comparing reference case with no aviation scenario (perturbation, left), and changes in partial columns (in 0.001 DU) for alternative flight altitude inventories with Flying Higher (middle) and Flying Lower (right).
The vertical distribution of changes of partial ozone columns shows that spring and winter maxima originate from additional ozone induced in upper tropospheric levels (Figure 4). When aircraft are flying higher (lower) in these altitudes throughout the whole year, increased (decreased) partial columns of ozone appear.
Based on a multi-model mean with five different comprehensive chemistry-climate models [14], the radiative impact of NOx induced changes in atmospheric concentration of ozone and methane induced via OH changes are estimated. NOx-induced climate effects in the reference case amount to a direct warming ozone effect of 20 mW/m2. We reassess aviation-induced methane perturbations as described in [16] in order to reflect updated formula to calculate radiative impacts, now including the representation of short-wave radiation effects which increases radiative impacts. Second, we update lifetime estimates of aviation-induced methane changes corresponding to a lower radiative impact, which results in an overall aviation-induced methane effect, which is less cooling by about 20% (see Table A1). Cooling effects of methane, primary ozone (PMO) and water vapor of −7 mW/m2, −3 mW/m2 and −1 mW/m2, respectively. Due to the strong nonlinearity of nitrogen-induced effects, we suggest additionally applying a tagging approach when estimating aviation induced ozone effects in order to provide strategic guidance (Section 3.5). Nevertheless, tagging is particularly helpful when answering the question as to how overall changes can be attributed to different emission sectors, and hence represents an attribution method that treats individual sectors more uniformly (see Appendix B).
3.2. Contrail and Contrail Cirrus Effect
Contrail cirrus are major contributors to aviation climate impact [32]. Using the REACT4C air traffic inventory, we estimate global contrail cirrus radiative forcing to amount to 45 mW/m2 (Table 3, [33]). Contrail cirrus are fairly short lived, with lifetimes of up to one day. Therefore, maxima of contrail cirrus RF are located in the areas of maximum air traffic density over Europe and the Eastern USA (Figure 5). Similar to the study of [4], who considered only line-shaped contrails, we find that when shifting air traffic upwards, contrail cirrus RF is reduced over most of the mid-latitudes while over the southern part of the North American air traffic maximum and over most of the tropics contrail cirrus radiative forcing is increased. The opposite holds for flying lower. The shift in air traffic altitude leads to a change in global contrail cirrus RF of 3 mW/m2 higher and 5 mW/m2 lower when shifting air traffic upwards and downwards, respectively (Table 3). It is important to recognize that the effect in the areas close to the tropics is overestimated by the model. This is because the dependence of contrail ice nucleation on atmospheric conditions, which would lead to lower ice crystal numbers in the tropics [11], is not captured by the model. This would lead to shorter contrail cirrus lifetimes [11], lower optical depth and reduced radiative forcing [34]. Furthermore, the REACT4C flight inventory defined air traffic on great circles, which leads to a smaller contrail cirrus climate impact than when using real air traffic. The contrail cirrus radiative forcing for the reference simulation is smaller than that reported, [23,33] or [17]. The difference when compared to [23,33] is largely due to differences in the air traffic inventories and the use of a single-momentum microphysical scheme in our study. Differences compared to [17] lie additionally in the correction of deficiencies of the broad band radiation scheme guided by comparison to a line-by-line scheme [35] applied in [18]. Furthermore, the RF values of [18] are representative of a multi-model average, whereas here we give the result for ECHAM4-CCMod only. Appropriate corrections are not applied here, since our focus is studying the impact of flying higher or lower and not the size of the overall effect. A large uncertainty is connected with the RF estimates due to uncertainties in the simulated background cloud fields and the upper tropospheric water budget, the properties of the simulated contrails and their radiative impact amounting to about 70% of the globally averaged contrail cirrus radiative forcing [18]. The radiative forcing estimates do not account for the change in natural cloudiness due to contrail cirrus that tend to limit the contrail cirrus radiative impact [32,36,37].
Table 3.
Radiative forcings [mW/m2] of individual effects for reference case and Flying Higher and Flying Lower scenarios, non-CO2 presenting sum of all non-CO2 effects, sensitivity study.
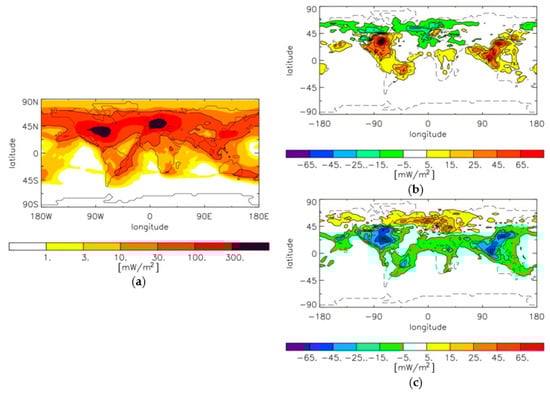
Figure 5.
Contrail cirrus radiative forcing for the control inventory (a) and difference between the Flying higher inventory (b) and the Flying lower inventory (c) as simulated by ECHAM4-CCMod [27].
3.3. Aerosol-Indirect Effect on Warm Clouds (AiwC)
In this section, we analyze the impact of aviation-induced aerosol on warm clouds using the global aerosol-climate model EMAC/MADE [26,38]. The model considers the number concentration, size distribution and composition of atmospheric aerosols in different size ranges, i.e., the Aitken, accumulation, and coarse modes. It further includes a two-moment microphysical cloud scheme, allowing explicit simulations of aerosol-induced modifications to warm clouds. The present simulations consider anthropogenic non-aviation emissions as background conditions representative for the year 2000 [39]. Aviation emissions are included according to the three different scenarios described in Section 2.2. To allow for climatologically representative quantifications, each model experiment covers a period of 15 years (plus 1-year spin-up) from 1996 to 2010. The aviation aerosol impact is quantified by comparing simulations with and without aviation emissions, i.e., using a standard perturbation approach. In addition to these baseline simulations, a sensitivity study is performed assuming increased numbers of aviation-induced ultrafine particles. In contrast to the baseline case, where primary sulfate aerosol emissions are emitted in the form of Aitken- and accumulation-mode-sized particles, it is assumed that all primary sulfate is emitted in the form of an ultrafine particle mode with a median diameter of 2.5 nm. The loss of such ultrafine particles in the plume phase (e.g., via particle coagulation) is currently uncertain and cannot be resolved by global simulations. Hence, the two contrasting particle size assumptions span a range of possible aviation particle size distributions affecting climate in the global simulations. Therefore, the difference between the two simulations may be indicative of the uncertainty connected with this effect.
The indirect effect of aviation aerosol on warm clouds causes a negative forcing, albeit with a relatively low signal-to-noise ratio, as revealed by the results presented in Figure 6. The quantified aerosol effect includes both direct radiative effects and indirect effects due to aerosol-induced cloud modifications, although the latter is found to be dominant. While increasing flight altitudes does not significantly change the overall radiative impact, lowering the flight altitudes causes an increased aerosol-induced cooling especially in the tropics.
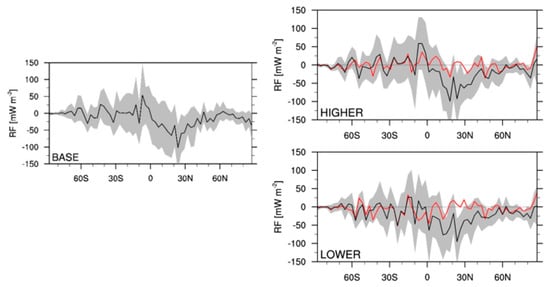
Figure 6.
Zonal mean radiative forcing (black line) of indirect aerosol (warm) cloud effect from EMAC/MADE for the reference (left) and for inventories ‘Flying higher’ (top right) and ‘Flying lower’ (bottom right). The change between reference and scenarios is highlighted (red line). The shaded regions depict the 95% confidence interval. Radiative forcing is calculated as the difference between two distinct simulations, one with and one without aircraft emissions.
3.4. Overview of Climate Impact of Non-CO2 Effects of Aviation
Table 3 summarizes the radiative forcing considering individual non-CO2 effects of aviation for the reference case and both scenarios, providing results from EMAC, EMAC/MADE and ECHAM/CCMod as described in the above sections. From the aviation-induced modifications in atmospheric concentrations caused by aviation emissions we derive radiative forcing from individual components by online or offline radiative transfer calculations (see Table 2). In order to complete the assessment of non-CO2 effects from aviation, we mention also the estimates from direct water vapor effects (1.5 mW/m2 reference case) and the coarse-resolution global model ULAQ studying direct sulfate and soot impacts [15,21], which are on the order of −3.5 and 0.8 mW/m2, respectively. As the estimates of aerosol-cloud effects calculated by EMAC/MADE described above already include direct sulfate effects, these direct aerosol effects are not included in Table 3, in order to avoid double counting. As described in Section 3.3, a sensitivity study was performed with the EMAC/MADE model assuming an increased number of aviation-induced ultrafine particles. Radiative forcings in these sensitivity studies are estimated to be −65.2 mW/m2 in the reference case, and of the alternative altitude scenarios to be 1 mW/m2 more negative when aircraft are flying higher (66.3 mW/m2), while they remain about the same when flying lower (65.5 mW/m2), hence showing less change of the radiative forcing when aircraft are flying at alternative altitudes. In addition to these complex calculations with global chemistry-climate models, we calculated radiative forcing due to CO2 emissions alone using the linear response model AirClim [40,41], which is included in the overall total effect assuming an emission scenario as described in Section 3.6.
Comparing how the radiative impacts of individual effects change due to the changing flight altitude (Figure 7) reveals that when aircraft fly higher, non-CO2 effects generally increase, while they decrease when aircraft fly lower. For CO2 impacts, we find the opposite sign, because when aircraft are flying higher (lower) CO2 emission, and hence associated climate impact, decreases (increases) slightly. It is important to note that the two largest changes in radiative forcing due to flying lower are connected with contrail cirrus and aerosol-cloud interaction. Both of these radiative forcing components are associated with very large uncertainties and a low level of understanding [18]. While [18] estimated the uncertainty in contrail cirrus radiative forcing to be around 70%, no best estimate for the indirect aerosol effect could be given, indicating that the uncertainties are very large, but are unquantified.
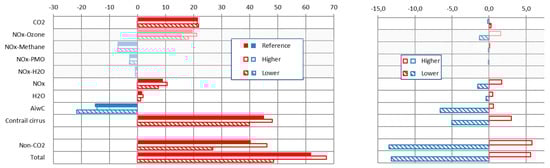
Figure 7.
Global radiative forcing [mW/m2] of aviation emissions for REACT4C scenarios: reference case (filled), Flying Higher (not filled) and Flying Lower (stripes) as absolute radiative forcings (left), and as changes for alternative flight altitudes scenarios compared to reference case (right).
3.5. Assessing Climate Impact of Alternative Routing Concepts in Aviation
In the study design described above, we identify impacts of aviation emission on atmospheric composition, cloud properties and radiative balance by using a perturbation approach addressing the question of the climate impact of changing cruise altitudes while keeping all other emissions constant. However, when dealing with nonlinear effects and mechanisms, the estimates one achieves when quantifying the contributions of individual sources can be highly dependent on the method applied. Specifically, we highlight here that for nitrogen oxides, beside the perturbation method, an attribution method relying on tagging is introduced [42]. This alternative attribution method is equivalent to asking a different scientific question, related to contributions and mitigation options of individual sectors. In fact, this tagging approach has the large advantage that the nonlinearities of the climate-chemistry system are not, based on the experiment design, assigned to the investigated source, which in our study is aviation. In the perturbation approach, the investigated source comes to a polluted atmosphere, which results in considerably lower production efficiencies for atmospheric perturbation. Hence, we investigate in our study how estimates of aviation-induced ozone change when applying an alternative attribution method (tagging) instead of the perturbation method, as ozone formation is strongly impacted by nonlinearity of photochemistry. While earlier studies provided estimates based on a perturbation approach only, we investigate the sensitivity of applying a different attribution method relying on a tagging method. As was presented by [16] for aviation, this alternative attribution method leads to an increased effect ozone formation, resulting in an increase of radiative forcing by about 60%. Estimates of the NOx ozone impact when applying this scaling would amount to 30.6 mw/m2 in the reference case. Assuming a linear behavior leads to estimates in the alternative altitude scenarios, which would assign a slightly larger increase of radiative forcing in the flying higher case and a slightly larger decrease in the flying lower case (see Table A1). We discuss this scaling of results here, in order to highlight that the formulation of the research question to be answered determines the attribution method used, and the corresponding values quantified. Nonlinearities are also present in, e.g., cloud physics, which are the basis of the contrail cirrus and aerosol cloud effects presented in this study. However, the uncertainties in contrail cirrus and aerosol effects are so large that it is questionable whether the application of this method can lead to meaningful results. These estimates when applying a tagging approach to the NOx effects are higher than those impacts calculated by the perturbation approach, as, when using a perturbation approach, nonlinearities in photochemical ozone production are generally assigned to the investigated sector.
3.6. Overview of the Climate Impact of Non-CO2 Effects of Aviation
To compare non-CO2 to CO2 impacts, it is necessary to make assumptions on the underlying temporal evolution of the emissions by defining a dedicated emission scenario. In this study, we analyze an emission scenario assuming that aircraft were always flying at the alternative flight altitudes using temporal evolution of historic aviation emission data for the reference case. Here, we use the linearized climate model AirClim to calculate the radiative forcing of CO2 emissions in the reference and the alternative altitude scenarios (Figure 7). Radiative forcing caused by CO2 emissions is equal to 21.5 mW/m2, which increases to 21.8 mW/m2 when aircraft fly lower, and decreases to 21.3 mW/m2 when aircraft fly higher. Comparing non-CO2 effects with the CO2 effect shows the importance of non-CO2 effects when assessing total climate impacts. In the reference case, non-CO2 effects represent about 71% of the total radiative forcing, while in the Flying Lower and Flying Higher cases they represent 63% and 73%, respectively, showing that non-CO2 effects become more important when flying at higher altitudes. To go beyond radiative forcing in terms of metrics, we calculate how large the aviation-induced temperature change due to CO2 and non-CO2 would be in the year 2006 (Figure 8) assuming similar temporal evolution of (historic) aviation emissions.
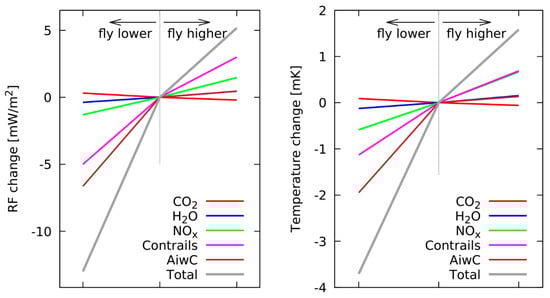
Figure 8.
Change in radiative forcing [mW/m2] (left) and change in temperature [mK] (right) assuming aircraft were always been Flying Lower and Flying Higher by 2000 ft compared to reference (base) case comprising direct water vapor (H2O), net nitrogen oxide induced impact (NOx), contrail cirrus (contrails), aerosol indirect effect on warm clouds (AiwC).
Comparing the climate impact of the Flying Lower scenario given as temperature change with the reference case shows that in our simplified alternative routing study, total impact would be about 4 mK lower, while in the Flying Higher scenario, total climate impact would be about 2 mK higher, noting that large uncertainties remain. In the Flying Lower scenario, we find that for both radiative forcing and temperature change that the CO2 climate impacts slightly increase, while decreasing non-CO2 effects compensate this, resulting in an overall lower climate impact of the Flying Lower scenario. In the Flying Higher scenario, both effects go in opposite directions in a similar way; however, now non-CO2 effects increase, resulting in an overall increase of climate impact. Overall, the aviation-induced temperature change increases by about 10% when aircraft are flying higher, while total temperature change decreases by 20% when aircraft are flying lower. The uncertainty in those changes is very large in particular because they are connected with the cloud related aviation effects that are connected with a very large uncertainty [18].
In our analysis with AirClim, we chose a methodology simulating no internal variability, which avoids detection problems or the necessity of scaling as applied in [7], as we are similarly considering relatively small component forcings and responses. In the sensitivity study presented here, we do not show the uncertainty of results because for some components they are not known or can be only very roughly estimated, which is in particular true for the cloud-related radiation forcing components.
4. Discussion
In this study, we investigated how the climate impact of aviation changes when aircraft fly at alternative flight altitudes, 2000 feet (~600 m) higher or lower, by comparing distinct numerical simulations with different emission inventories using a perturbation approach. We found that when flying higher, CO2 impacts decrease, while non-CO2 impacts increase, causing an overall increase in climate impact. Climate impact can be measured in terms of physical climate metrics which relate the radiative balance at the tropopause or top of the atmosphere to, e.g., the response at the surface temperature. In our study, we calculated the climate impact when aircraft fly using alternative routes both in terms of both radiative forcing and of the associated temperature response. Radiative forcing is the main variable that is calculated in models because the signal-to-noise ratio is much better than for surface temperature. The uncertainty connected with radiative forcing is therefore much smaller than for surface temperature changes. Considering radiative forcing, CO2 impacts decrease by 1% when aircraft fly higher, while non-CO2 effects increase by around 14%, causing an increase in total radiative forcing of 9%. Considering change in temperature, CO2 impacts decrease by about half a percent when aircraft fly higher, while non-CO2 effects increase by about 8%, resulting in an overall climate impact increase of about 7%. When aircraft fly lower, radiative forcing of CO2 impacts increase by 1% and non-CO2 impacts decrease by about 33%, causing a reduction of 21%. Considering change in temperature, CO2 impacts increase by about half a percent when aircraft fly lower, and non-CO2 impacts decrease by 18%, causing a reduction in climate impact of 17%. In terms of how to measure climate impact, our estimates are in line with estimates relying on efficacies and radiative forcing, providing estimates of effective radiative forcings (ERF) [18]. Both metrics, temperature change and ERF, relate more directly to the response of the climate system in terms of temperature change. However, it has to be noted that uncertainties of aviation-induced radiative effects are still known to be large, and uncertainties of effective radiative forcing and surface temperature change are significantly higher.
We provide results by comparing two distinct simulations: calculating aviation-induced perturbation signals of aerosol effects on warm clouds, and from contrail cirrus. When estimating the radiative impacts of methane, we apply revised estimates of NOx-induced forcing on methane, as updates on methane forcing and lifetime of perturbation have been published. This comparable higher radiative impact of nitrogen oxides is in line with recent estimates provided by [16]. We selected the base year in our sensitivity study to be 2006. We acknowledge that more recent estimates on aviation emissions and associated inventories have been published since. However, we estimate that uncertainties in model estimates for a given year are still larger than differences between individual years; hence, using the year 2006 provides us with more consistency when comparing our results with studies of individual effects [14,21,22,23] that also use 2006 inventories. Additionally, the scientific understanding of the effects of nitrogen oxides has progressed recently, requiring our results to be put in the context of the methodology applied and the question investigated. Hence, we additionally reassessed the climate impact of aviation in order to consider the tagging method and its impact on quantitative ozone estimates provided in this paper. For NOx-induced effects on the reactive species ozone, we expand our analysis, which is based on a perturbation method, by investigating sensitivity to usage of an ozone attribution method relying on tagging of reactive species, comprising nitrogen oxides, ozone and hydroxyl radicals [42]. The climate impacts of nitrogen oxide emissions on ozone are estimated to be higher by about 50% when using a tagging approach. The tagging methodology aims to assign the high nonlinearity of ozone production to all sectors, instead of assigning it only to the sector studied (as perturbation), which in turn leads to a smaller ozone increase in the perturbation case. We note that other aviation-related non-CO2 effects are based on nonlinear physics as well, and increased ozone impact would need to be compared with similarly calculated methane and cloud-related impacts.
In terms of an indirect aerosol effect, this study provides additional estimates on the influence of aerosol on low-level liquid clouds. Regarding the aerosol forcing in the base case, our estimates agree with those provided in [26], using a different emission inventory. Sensitivity studies introduced in that study are required, as detailed microphysics of aviation aerosols, especially in the expanding exhaust plumes, are not well known. Hence, assumptions need to be made in order to study the range of possible effects. To this end, an additional sensitivity scenario is considered that implies an increased number of aircraft-induced ultrafine aerosol particles (Section 3.3). In general, the simulations reveal that aviation emissions lead to significant changes in the number concentrations of cloud condensation nuclei as a consequence of downward transport of aircraft-induced aerosol particles to altitude levels of liquid cloud occurrences. This implies modifications of the cloud microphysical and optical properties. In the reference case, aviation aerosol is responsible for a radiative forcing of −15.1 mW/m2. Variations of the flight altitudes can result in important changes to this forcing, especially in the case of flying lower, where the aerosol-induced cooling increases to −21.7 mW/m2. This is probably due to an enhanced downward transport of emissions released at lower altitudes and, therefore, a larger potential for modifying low-level clouds. In the sensitivity study with enhanced particle numbers, the aviation-induced aerosol effect increases strongly to values around −65 mW/m2 (Section 3.4). However, the effects of changing emission altitudes are negligible. This could be an indication that the aerosol impact in the standard case tends to be limited by the emitted particle number while the large particle concentrations in the sensitivity study allow for maximum effects in all three scenarios. Future studies are needed to identify the most realistic case for quantifying the altitude dependence of the aerosol effect in more detail. We stress again that these studies focus on the modifications of warm liquid clouds and do not consider the radiative effects of possible modifications of natural cirrus clouds due to soot particles from aviation, e.g., [22,43,44]. In view of the large persisting uncertainties in the current quantifications of this effect, we leave the integration of this process to future aviation-climate assessments.
Our study examined the change in contrail cirrus radiative forcing due to changing flight altitude instead of the change in line-shaped contrail radiative forcing; as done in earlier studies [4], we used a process-based contrail cirrus parameterization in order to simulate contrail formation and their persistence and evolution. The change in atmospheric conditions, in particular by shifting the air traffic above or below the tropopause, locally has a large impact on contrail formation, persistence and properties, but changes in the tropics and extratropics tend to compensate one another. The absolute estimates for contrail cirrus radiative forcing are lower than those published in [18] due to the fact that we report only ECHAM4-CCMod results using the contrail cirrus parameterization with a single-moment microphysics scheme of [32] so that the life cycle, and in particular the dependency of young contrail properties on the background atmosphere, cannot be captured realistically. Furthermore, we do not correct for deficiencies of the broad band GCM radiation scheme, as done in [18], and we use ground projected air traffic distance and great circle estimates. This use of the single-moment microphysical scheme has important implications for the meridional gradient in contrail cirrus properties and tends to overestimate contrail cirrus radiative forcing and its change in the tropical areas including the southern part of the North American air traffic maximum and air traffic at lower levels. However, the ice nucleation in the extratropics around the main air traffic levels is not as variable, depending less strongly on the atmospheric background conditions, so that in those areas, the contrail cirrus representation is reasonable. Hence, changes in contrail cirrus caused by aircraft flying higher or lower are not expected to look very different in the mid-latitudes. However, in the tropics, life cycle and radiative forcing of contrail cirrus will be overestimated. Furthermore, some effects connected with the formation of contrail cirrus have hardly been studied in climate models and are not considered in our study such as the effect of contrail formation within clouds [45]. Future studies need to revisit the effect of moving air traffic upwards and downwards using a model that captures contrail cirrus microphysical processes in more detail and including additional effects such as contrail formation in natural clouds. The uncertainty in the climate impact of contrail cirrus is very uncertain [18], and it is important to reduce the uncertainty in order to gain confidence in estimates connected with mitigation approaches, such as those described here.
5. Conclusions and Outlook
Our study shows that when aircraft fly higher, non-CO2 effects increase (by ~14%), and when aircraft fly lower, non-CO2 climate impacts decrease (by ~33%). We provide a quantitative aviation climate impact assessment comprising the effects of non-CO2 effects of nitrogen oxides, contrail and contrail cirrus, as well as indirect aerosol effects on warm clouds. Hence, flying lower is expected to reduce non-CO2 effects together with slightly increased CO2 emissions and impacts, assuming that cruise speed is not modified. We did not study the uncertainty connected with our estimates, which is estimated to be very large [18]. The results require re-evaluation once the uncertainty of the aviation-related effects responsible for those changes, mainly the cloud related effects, have been reduced. A modelling concept and scenarios are presented in order to assess how climate impact changes when aircraft fly higher or lower compared to their standard flight altitude. However, no best estimate for the uncertainty can be given, despite our acknowledgement that the uncertainties are considerable [18,46]. The uncertainties connected, for example, with changes in cloudiness (aerosol cloud interaction and contrail cirrus) are very large, while contributing most in the flying higher/lower scenarios. Summarizing the impact of non-CO2 effects with a changing flight altitude, we found a uniform behavior: when aircraft are flying higher, non-CO2 effects are generally increased; when aircraft are flying lower, non-CO2 effects are decreased. Comparing non-CO2 effects to CO2 effects only, our analysis shows that their relative importance increases with increasing flight altitude. To improve understanding of mechanisms of aviation climate impact we have presented geographical distributions of aviation-induced modifications in the atmosphere, together with changes in global climate impact. Since it is mainly the cloud effects that contribute to the reduction of the non-CO2 effects when flying lower and since those effects are still connected with a large uncertainty, it is important to further improve our understanding and to reduce uncertainties.
To fully explore the mitigation potential when aircraft fly at alternative altitudes, a more sophisticated study would be required. For example, it might be beneficial under specific conditions to be flying at alternative altitudes, by exploring in detail specific synoptic situations characterized by the formation of persistent contrails or efficient ozone production, and thereby considering varying sensitivity of the atmosphere to aviation emissions (e.g., [47]). However, such alternative routing studies also require improving our scientific understanding of aviation climate impacts, in particular the aviation-induced impacts of nitrogen oxides, the radiative impacts of contrail cirrus, and the mechanisms of aerosol-induced changes in clouds. It is important to note here that provision of quantitative estimates of climate impact and mitigation potentials, together with quantifying uncertainties, requires particular attention and comprehensive assessment studies, in particular if one intends to estimate not only uncertainty of the selected modelling approach, but the overall uncertainty of aviation impacts, as well as robust mitigation strategies for aviation climate impact.
Considerable progress has been made on quantitative assessments of aviation climate impact, with the availability of a consistent assessment concept for short-lived impacts, while the issue of how to integrate long-term impacts through adequate definition of an emission scenario has not yet been fully resolved. Our study focuses on the identification of efficient mitigation solutions as an initial assessment for performing an assessment, but we need to point out that some issues in particular with respect to CO2 effects require separate consideration.
Author Contributions
Conceptualization, S.M. and L.L.; methodology, all authors; estimates of radiative forcing and temperature change, S.M., K.D., U.B., A.S.H., M.R., J.H. and V.G.; validation, S.M., L.L., U.B., J.H., M.R., and G.P.; formal analysis, S.M., U.B., S.D., M.R., and G.P.; emission data, B.O.; supercomputing, S.M., S.D., A.S., M.R., U.B.; writing—original draft preparation, S.M., L.L., and K.D.; writing—review and editing, S.M., L.L., K.D. and U.B.; project coordination, S.M.; funding acquisition, S.M., V.G. All authors have read and agreed to the published version of the manuscript.
Funding
Individual authors of this study were supported by the European Commission Seventh Framework Project, ‘REACT4C’ (contract no. ACP8-GA-2009-233772) and receive funding from the European Union’s Horizon 2020 research and innovation programme under grant agreement No 875036 within the Aeronautics project ACACIA. Work in this article was supported by DLR project Eco2Fly (2018-2022) and by ECATS (AISBL) working group “Aviation climate impact”. This work was initially supported by the European Commission Seventh Framework Project, ‘REACT4C’ (contract no. ACP8-GA-2009-233772).
Institutional Review Board Statement
Not applicable.
Informed Consent Statement
Not applicable.
Data Availability Statement
Emission inventories of gridded global aviation emissions used in this study are available from the project REACT4C (www.react4c.eu) or from the first author of this study under signature of a data protocol. Model results are available from the authors of his study on request assuring IPR of data for the respective modelling group.
Acknowledgments
Special thanks goes to Ivar Isaksen from University of Oslo for his inspiration and enthusiasm to initiate and to work collaboratively in this European collaborative research Project. We thank David Lee and Robert Sausen for supporting project activities and constructive discussion, and we thank Tina Jurkat-Witschas for her internal review. High performance supercomputing resources were used from the German DKRZ Deutsches Klimarechenzentrum Hamburg.
Conflicts of Interest
The authors declare no conflict of interest. The funders had no role in the design of the study; in the collection, analyses, or interpretation of data; in the writing of the manuscript, or in the decision to publish the results.
Abbreviations
| aCCF | Algorithmic Climate Change functions |
| AiwC | Aerosol indirect effect on warm clouds |
| CTM | Chemistry Transport Model |
| GCM | General Circulation Model |
| AIC | Aviation induced cloudiness |
| ATR | Average Temperature Response |
| ERF | Effective Radiative Forcing |
| RF | Radiative forcing |
Appendix A
Geographic distribution of carbon dioxide emissions and differences between individual inventories and reference case are shown in Figure A1. These inventories correspond to the emission inventories of flight distance, nitrogen oxides, and soot shown in this paper.

Figure A1.
Global distribution of aviation CO2 emission [kg, logarithmic]: reference case (left), and difference between inventories Flying Higher (upper) and Flying Lower (lower) compared to reference case as absolute differences (middle) and relative difference [%] (right).
Additionally, we present for the emission inventories used in this study relative differences of individual emission inventories of flight distance, nitrogen oxides and soot emission in Figure A2 when comparing alternative flight altitude scenarios to the reference case.

Figure A2.
Relative differences of global distribution of aviation flight distance, nitrogen oxides and soot emissions [%]; difference between inventories Flying Higher (upper) and Flying Lower (lower) showing flight distance (left), nitrogen oxides (middle) and soot emissions.
Appendix B
The calculation of aviation climate impact resulting from nitrogen oxides has recently undergone some revisions, suggesting an adjustment of earlier estimates. Hence, in this study, we follow [16], which provides an updated assessment of radiative properties and lifetime of methane, resulting in the methane update shown in Table A1. Additionally, we perform a sensitivity analysis in which we apply a different attribution method, the so-called tagging method. We use the tagging attribution method in order to quantify aviation-induced (short term) ozone changes in the atmosphere, which leads to higher estimates. In Table A1, we present both initial estimates from [14] and estimates from the sensitivity study of nitrogen oxide-induced effect on ozone.
Table A1.
Radiative forcing [mW/m2] of individual aviation-induced nitrogen oxide effects based on REACT4C results ([14]), perturbation approach and updating estimates, following [16]. Absolute forcings and change of radiative forcing due to alternative flight altitudes.
Table A1.
Radiative forcing [mW/m2] of individual aviation-induced nitrogen oxide effects based on REACT4C results ([14]), perturbation approach and updating estimates, following [16]. Absolute forcings and change of radiative forcing due to alternative flight altitudes.
| Impact | REACT4C | CH4 Update | Sensitivity | |||||||
|---|---|---|---|---|---|---|---|---|---|---|
| Attribution | Perturbation | Perturbation | Tagging 1 | |||||||
| Inventory | Ref | Low | High | Ref | Low | High | Ref | Low | High | |
| NOx-Ozone | 19.5 | 18.2 | 21.1 | 19.5 | 18.2 | 21.1 | 30.6 | 28.5 | 33.1 | Tagging 1 |
| NOx-Methane | −8.7 | −8.9 | −8.6 | −7.0 | −7.1 | −6.9 | −7.0 | −7.1 | −6.9 | Rad 2, lifetime 3 |
| NOx-PMO | −4.3 | −4.4 | −4.3 | −2.8 | −2.9 | −2.8 | −2.8 | −2.9 | −2.8 | Lifetime 3 |
| NOx-H2O | −1.3 | −1.3 | −1.3 | −0.8 | −0.8 | −0.8 | −0.8 | −0.8 | −0.8 | Lifetime 3 |
| Net NOx | 5.2 | 3.5 | 6.9 | 8.9 | 7.3 | 10.6 | 20.0 | 17.6 | 22.6 | |
| Altitude effect | −1.8 | 1.8 | −1.6 | 1.7 | −2.4 | 2.6 | ||||
1 Attribution method tagging instead of perturbation (factor 1.56); 2 radiative impacts of methane due to updated IPCC estimates (factor 1.23); 3 lifetime correction (factor 0.65).
It should be noted here that when quantifying impacts with a perturbation approach, a nonlinear behavior can lead to results being dependent on the order in which individual sectors or contributors are analyzed. In the case of a saturation effect, the sector that is added last receives a lower attribution of the overall impacts, while those sectors added previously are attributed a proportional behavior, resulting in a higher efficiency, e.g., for ozone production. In the case of a tagging approach, nonlinearities are evenly distributed over and shared between individual sectors or contributors. From this sensitivity study, we estimate that adjusted radiative impacts of aviation induced effects updates presented in [16], resulting in an overall radiative impact of nitrogen oxides of 20 mW/m2 in the reference case comprising all indirect effects. When aircraft are flying lower, radiative forcing decreases to 17.6 mW/m2, while radiative forcing increases to 22.6 mW/m2 when aircraft are flying higher, as was also presented in [48].
References
- Dameris, M.; Grewe, V.; Köhler, I.; Sausen, R.; Brühl, C.; Grooß, J.-U.; Steil, B. Impact of aircraft NOx emissions on tropospheric and stratospheric ozone. Part II: 3-D model results. Atmos. Environ. 1998, 32, 3185–3199. [Google Scholar] [CrossRef]
- Grewe, V.; Dameris, M.; Fichter, C.; Lee, D.S. Impact of aircraft NOx emissions. Part 2: Effects of lowering the flight altitude. Meteorol. Z. 2002, 11, 197–205. [Google Scholar] [CrossRef]
- Köhler, M.O.; Rogers, H.L.; Pyle, J.A. Modelling the Impact of Subsonic Aircraft Emissions on Ozone: Future Changes and the Impact of Cruise Altitude Perturbations. In Proceedings of the European Conference on Aviation, Atmosphere and Climate (AAC), Friedrichshafen, Germany, 30 June–3 July 2003. [Google Scholar]
- Fichter, C.; Marquart, S.; Sausen, R.; Lee, D.S. The impact of cruise altitude on contrails and related radiative forcing. Meteorol. Z. 2005, 14, 563–572. [Google Scholar] [CrossRef]
- Gauss, M.; Isaksen IS, A.; Lee, D.S.; Søvde, O.A. Impact of aircraft NOx emissions on the atmosphere—Tradeoffs to reduce the impact. Atmos. Chem. Phys. 2006, 6, 1529–1548. [Google Scholar] [CrossRef]
- Rädel, G.; Shine, K.P. Radiative forcing by persistent contrails and its dependence on cruise altitudes. J. Geophys. Res. 2008, 113, D07105. [Google Scholar] [CrossRef]
- Frömming, C.; Ponater, M.; Dahlmann, K.; Grewe, V.; Lee, D.S.; Sausen, R. Aviation-induced radiative forcing and surface temperature change in dependency of the emission altitude. J. Geophys. Res. 2012, 117, D19104. [Google Scholar] [CrossRef]
- Skowron, A.; Lee, D.S.; De León, R.R. The assessment of the impact of aviation NOx on ozone and other radiative forcing responses—The importance of representing cruise altitudes accurately. Atmos. Environ. 2013, 74, 159–168. [Google Scholar] [CrossRef]
- Matthes, S.; Schumann, U.; Grewe, V.; Frömming, C.; Dahlmann, K.; Koch, A.; Mannstein, H. Climate optimized air transport. In Atmospheric Physics, Research Topics in Aerospace; Schumann, U., Ed.; Springer: Berlin/Heidelberg, Germany, 2012; pp. 727–746. [Google Scholar] [CrossRef]
- Matthes, S.; Grewe, V.; Sausen, R.; Roelofs, G.-J. Global impact of road traffic emissions on tropospheric ozone. Atmos Chem. Phys. 2007, 7, 1707–1718. [Google Scholar] [CrossRef]
- Bier, A.; Burkhardt, U. Variability in contrail ice nucleation and its dependence on soot number emissions. J. Geophys. Res. Atmos. 2019, 124, 3384–3400. [Google Scholar] [CrossRef]
- Burkhardt, U.; Karcher, B.; Mannstein, H.; Schumann, U. Climate Impact of Contrails and Contrail Cirrus Research Paper, SSWP No. 6. 2008. Available online: https://rosap.ntl.bts.gov/view/dot/17379 (accessed on 28 January 2021).
- Grewe, V.; Champougny, T.; Matthes, S.; Frömming, C.; Brinkop, S.; Søvde, O.A.; Irvine, E.A.; Halscheidt, L. Reduction of the air traffic’s contribution to climate change: A REACT4C case study. Atmos. Environ. 2014, 94, 616–625. [Google Scholar] [CrossRef]
- Søvde, O.; Matthes, S.; Skowron, A.; Iachetti, D.; Lim, L.; Owen, B.; Hodnebrog, T.; Di Genova, G.; Pitari, G.; Lee, D. Aircraft emission mitigation by changing route altitude: A multi-model estimate of aircraft NOx emission impact on O3 photochemistry. Atmos. Environ. 2014, 95, 468–479. [Google Scholar] [CrossRef]
- Lim, L.L.; Lee, D.S.; Owen, B.; Skowron, A.; Matthes, S.; Burkhardt, U.; Dietmüller, S.; Pitari, G.; Di Genova, G.; Iachetti, D.; et al. REACT4C: Simplified mitigation studies. In Proceedings of the TAC-4 Conference, Bad Kohlgrub, Germany, 22–25 June 2015. [Google Scholar]
- Grewe, V.; Dahlmann, K.; Matthes, S. The contribution of aviation NOx emissions to climate change: Are we ignoring methodological flaws. Environ. Res. Lett. 2019, 14, 121003. [Google Scholar] [CrossRef]
- Lee, D.; Pitari, G.; Grewe, V.; Gierens, K.; Penner, J.; Petzold, A.; Prather, M.; Schumann, U.; Bais, A.; Berntsen, T.; et al. Transport impacts on atmosphere and climate: Aviation. Atmos. Environ. 2010, 44, 4678–4734. [Google Scholar] [CrossRef] [PubMed]
- Lee, D.S.; Fahey, D.W.; Skowron, A.; Allen, M.R.; Burkhardt, U.; Chen, Q.; Doherty, S.J.; Freeman, S.; Forster, P.M.; Fuglestvedt, J.; et al. The contribution of global aviation to anthropogenic climate forcing for 2000 to 2018. Atmos. Environ. 2021, 244, 117834. [Google Scholar] [CrossRef]
- Matthes, S. Climate-optimised flight planning—REACT4C. In Innovation for a Sustainable Aviation in a Global Environment, Proceedings of the Sixth European Aeronautics Days 2011, Madrid, Spain, 30 March – 1 April 2011; IOS Press &: Amsterdam, The Netherlands; European Union: Brussels, Belgium, 2012; ISBN 978-92-79-22968-8. [Google Scholar]
- Owen, B.; Lim, L.L.; Gray, E.; Lee, D.S. Emission Inventories for Sensitivity Studies; CATE, Manchester Metropolitan University: Manchester, UK, 2011. [Google Scholar]
- Pitari, G.; Cionni, I.; Di Genova, G.; Søvde, O.A.; Lim, L. Radiative forcing from aircraft emissions of NOx: Model calculations with CH4 surface flux boundary condition. Meteorol. Z. 2016. [Google Scholar] [CrossRef]
- Zhu, J.; Penner, J.E. Radiative forcing of anthropogenic aerosols on cirrus clouds using a hybrid ice nucleation scheme. Atmos. Chem. Phys. 2020, 20, 7801–7827. [Google Scholar] [CrossRef]
- Bock, L.; Burkhardt, U. Contrail cirrus radiative forcing for future air traffic. Atmos. Chem. Phys. 2019, 19, 8163–8174. [Google Scholar] [CrossRef]
- Jöckel, P.; Tost, H.; Pozzer, A.; Brühl, C.; Buchholz, J.; Ganzeveld, L.; Hoor, P.; Kerkweg, A.; Lawrence, M.; Sander, R.; et al. The atmospheric chemistry general circulation model ECHAM5/MESSy1: Consistent simulation of ozone from the surface to the mesosphere. Atmos. Chem. Phys. 2006, 6, 5067–5104. [Google Scholar] [CrossRef]
- Jöckel, P.; Tost, H.; Pozzer, A.; Kunze, M.; Kirner, O.; Brenninkmeijer, C.A.M.; Brinkop, S.; Cai, D.S.; Dyroff, C.; Eckstein, J.; et al. Earth System Chemistry Integrated Modelling (ESCiMo) with the Modular Earth Submodel System (MESSy, version 2.51). Geosci. Model Dev. 2016, 9, 1153–1200. [Google Scholar] [CrossRef]
- Righi, M.; Hendricks, J.; Sausen, R. The global impact of the transport sectors on atmospheric aerosol: Simulations for year 2000 emissions. Atmos. Chem. Phys. 2013, 13, 9939–9970. [Google Scholar] [CrossRef]
- Burkhardt, U.; Kärcher, B. Process-based simulation of contrail cirrus in a global climate model. J. Geophys. Res. 2009, 114, D16201. [Google Scholar] [CrossRef]
- Schumann, U. On conditions for contrail formation from aircraft exhausts. Meteorol. Z. 1996, 5, 4–23. [Google Scholar] [CrossRef]
- Burkhardt, U.; Kärcher, B.; Ponater, M.; Gierens, K.; Gettelman, A. Contrail cirrus supporting areas in model and observations. Geophys. Res. Lett. 2008, 35, L16808. [Google Scholar] [CrossRef]
- Lamquin, N.; Stubenrauch, C.; Gierens, K.; Burkhardt, U.; Smit, H. A global climatology of upper-tropospheric ice supersaturation occurence inferred from the Atmospheric Infrared Sounder calibrated by MOZAIC. Atmos. Chem. Phys. 2012, 12, 381–405. [Google Scholar] [CrossRef]
- Kärcher, B.; Burkhardt, U.; Bier, A.; Bock, L.; Ford, I.J. The microphysical pathway to contrail formation. J. Geophys. Res. Atmos. 2015, 120, 7893–7927. [Google Scholar] [CrossRef]
- Burkhardt, U.; Kärcher, B. Global radiative forcing from contrail cirrus. Nat. Clim. Chang. 2011, 1, 54–58. [Google Scholar] [CrossRef]
- Bock, L.; Burkhardt, U. Reassessing properties and radiative forcing of contrail cirrus using a climate model. J. Geophys. Res. 2016, 121, D9717–D9736. [Google Scholar] [CrossRef]
- Burkhardt, U.; Bock, L.; Bier, A. Mitigating the contrail cirrus climate impact by reducing aircraft soot number emissions. NPJ Clim. Atmos. Sci. 2018, 37, 1–7. [Google Scholar] [CrossRef]
- Myhre, G.; Kvalevåg, M.; Rädel, G.; Cook, J.; Shine, K.P.; Clark, H.; Karcher, F.; Markowicz, K.; Kardas, A.; Wolkenberg, P.; et al. Intercomparison of radiative forcing calculations of stratospheric water vapour and contrails. Meteorol. Z. 2009, 18, 585–596. [Google Scholar] [CrossRef]
- Schumann, U.; Penner, J.E.; Chen, Y.; Zhou, C.; Graf, K. Dehydration effects from contrails in a coupled contrail-climate model. Atmos. Chem. Phys. 2015, 15, 11179–11199. [Google Scholar] [CrossRef]
- Bickel, M.; Ponater, M.; Bock, L.; Burkhardt, U.; Reineke, S. Estimating the Effective Radiative Forcing of Contrail Cirrus. J. Clim. 2020, 33, 1991–2005. [Google Scholar] [CrossRef]
- Righi, M.; Hendricks, J.; Sausen, R. The global impact of the transport sectors on atmospheric aerosol in 2030—Part 2: Aviation. Atmos. Chem. Phys. 2016, 16, 4481–4495. [Google Scholar] [CrossRef]
- Lamarque, J.-F.; Bond, T.C.; Eyring, V.; Granier, C.; Heil, A.; Klimont, Z.; Lee, D.S.; Liousse, C.; Mieville, A.; Owen, B.; et al. Historical (1850–2000) gridded anthropogenic and biomass burning emissions of reactive gases and aerosols: Methodology and application. Atmos. Chem. Phys. 2010, 10, 7017–7039. [Google Scholar] [CrossRef]
- Grewe, V.; Stenke, A. AirClim: An efficient climate impact assessment tool. Atmos. Chem. Phys. 2008, 8, 4621–4639. [Google Scholar] [CrossRef]
- Dahlmann, K.; Grewe, V.; Frömming, C.; Burkhardt, U. Can we reliably assess climate mitigation options for air traffic scenarios despite large uncertainties in atmospheric processes? Transp. Res. Part D Transp. Environ. 2016, 46, 40–55. [Google Scholar] [CrossRef]
- Dahlmann, K.; Grewe, V.; Ponater, M.; Matthes, S. Quantifying the contributions of individual NOx sources to the trend in ozone radiative forcing. Atmos. Environ. 2011, 45, 2860–2868. [Google Scholar] [CrossRef]
- Hendricks, J.; Kärcher, B.; Lohmann, U.; Ponater, M. Do aircraft black carbon emissions affect cirrus clouds on the global scale? Geophys. Res. Lett. 2005, 32. [Google Scholar] [CrossRef]
- Hendricks, J.; Kärcher, B.; Lohmann, U. Effects of ice nuclei on cirrus clouds in a global climate model. J. Geophys. Res. 2011, 116, 1–24. [Google Scholar] [CrossRef]
- Tesche, M.; Achtert, P.; Glantz, P.; Noone, K.J. Aviation effects on already-existing cirrus clouds. Nat. Commun. 2016, 7, 12016. [Google Scholar] [CrossRef]
- Holmes, C.D.; Tang, Q.; Prather, M.J. Uncertainties in climate assessment for the case of aviation NO. Proc. Natl. Acad. Sci. USA 2011, 108, 10997–11002. [Google Scholar] [CrossRef]
- Matthes, S.; Lührs, B.; Dahlmann, K.; Grewe, V.; Linke, F.; Yin, F.; Klingaman, E.; Shine, K.P. Climate-Optimized Trajectories and Robust Mitigation Potential: Flying ATM4E. Aerospace 2020, 7, 156. [Google Scholar] [CrossRef]
- Matthes, S.; Ling, L.; Burkhardt, U.; Dahmann, K.; Dietmüller, S.; Grewe, V.; Haslerud, A.S.; Hendricks, J.; Lee, D.S.; Owen, B.; et al. Mitigation of aviation’s non-CO2 climate impact by changing cruise altitudes. In Proceedings of the Making Aviation Environmentally Sustainable, ECATS 3rd Conference, online, 13–15 October 2020; ECATS IASBL. pp. 83–89, ISBN 978-1-910029-58-9. [Google Scholar]
Publisher’s Note: MDPI stays neutral with regard to jurisdictional claims in published maps and institutional affiliations. |
© 2021 by the authors. Licensee MDPI, Basel, Switzerland. This article is an open access article distributed under the terms and conditions of the Creative Commons Attribution (CC BY) license (http://creativecommons.org/licenses/by/4.0/).