Author Contributions
Conceptualization, Y.S., G.-N.K. and S.-Y.P.; methodology, Y.S. and D.-G.K.; software, Y.S.; validation, Y.S. and S.-Y.P.; formal analysis, Y.S.; investigation, Y.S., G.-N.K. and D.-G.K.; resources, Y.S., G.-N.K. and S.-Y.P.; writing—original draft preparation, Y.S. and G.-N.K.; writing—review and editing, Y.S. and S.-Y.P.; supervision, S.-Y.P.; project administration, S.-Y.P.; funding acquisition, S.-Y.P. All authors have read and agreed to the published version of the manuscript.
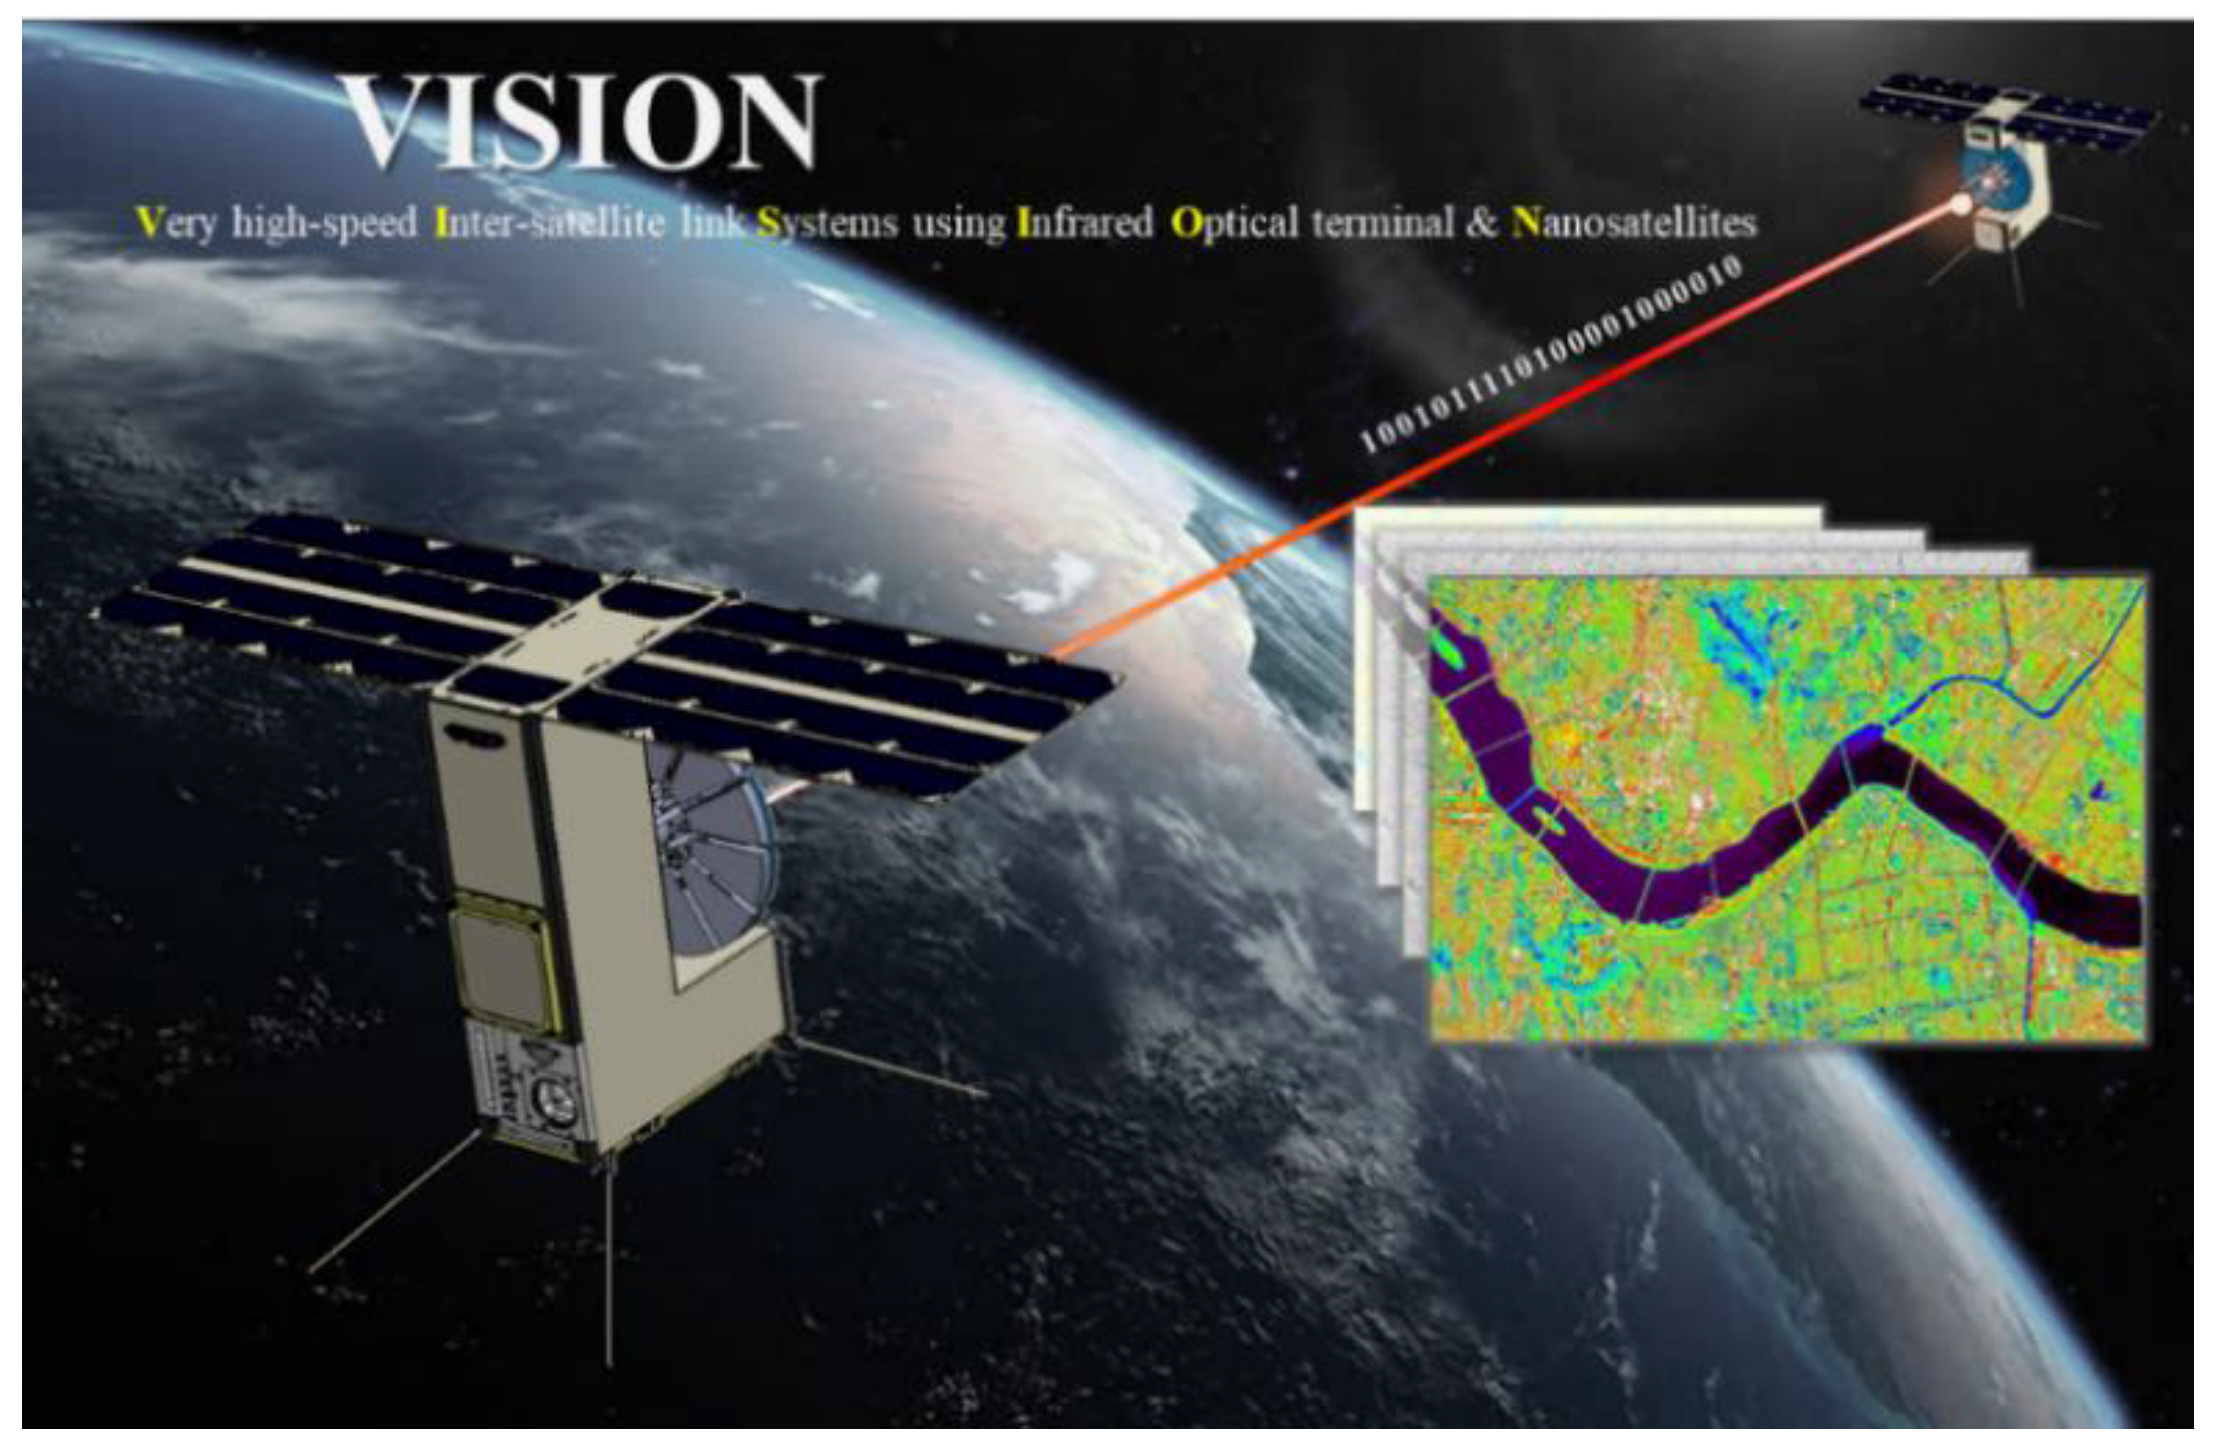
Figure 1.
Conceptual illustration of VISION mission. The mission demonstrates laser communication between CubeSats at various relative distances.
Figure 1.
Conceptual illustration of VISION mission. The mission demonstrates laser communication between CubeSats at various relative distances.
Figure 2.
Definition of the coordinate systems. The inertial coordinate system ([I,J,K] in the figure) is used to express the state vectors of two CubeSats, and the relative coordinate system [R,S,W] is used to derive ΔV for orbit control.
Figure 2.
Definition of the coordinate systems. The inertial coordinate system ([I,J,K] in the figure) is used to express the state vectors of two CubeSats, and the relative coordinate system [R,S,W] is used to derive ΔV for orbit control.
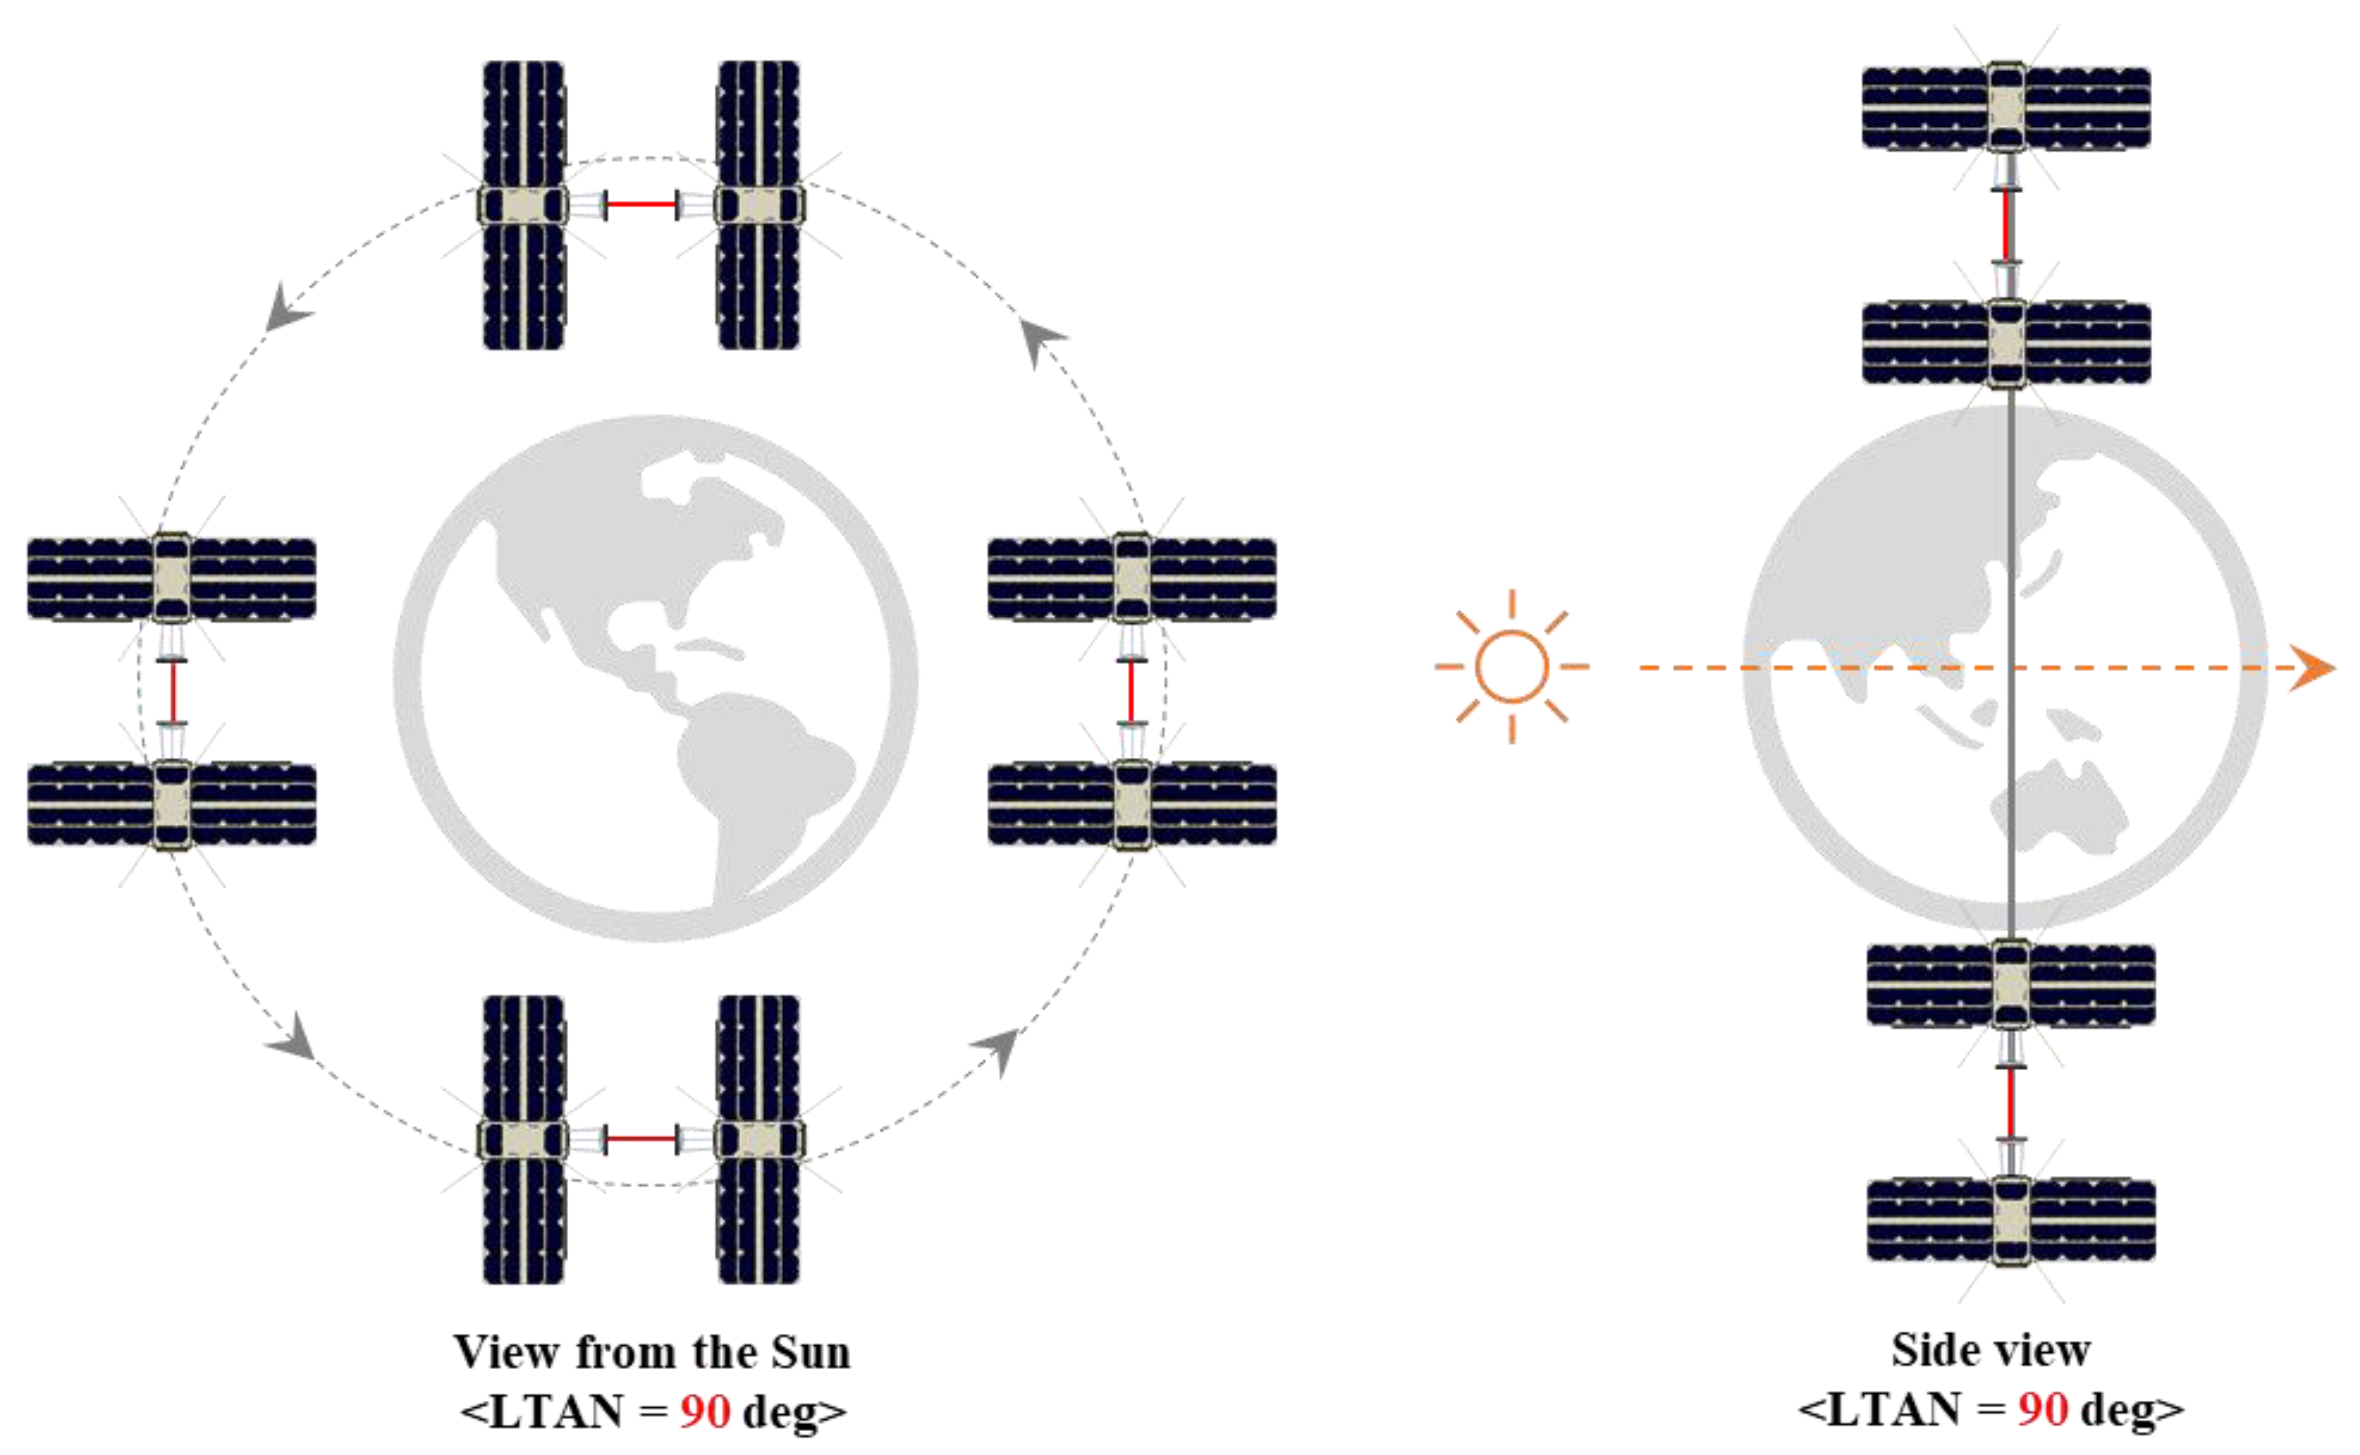
Figure 3.
Requirement in local time of ascending node. To minimize the noise in the laser communication by sunlight, the orbital plane should be perpendicular to the sun vector.
Figure 3.
Requirement in local time of ascending node. To minimize the noise in the laser communication by sunlight, the orbital plane should be perpendicular to the sun vector.
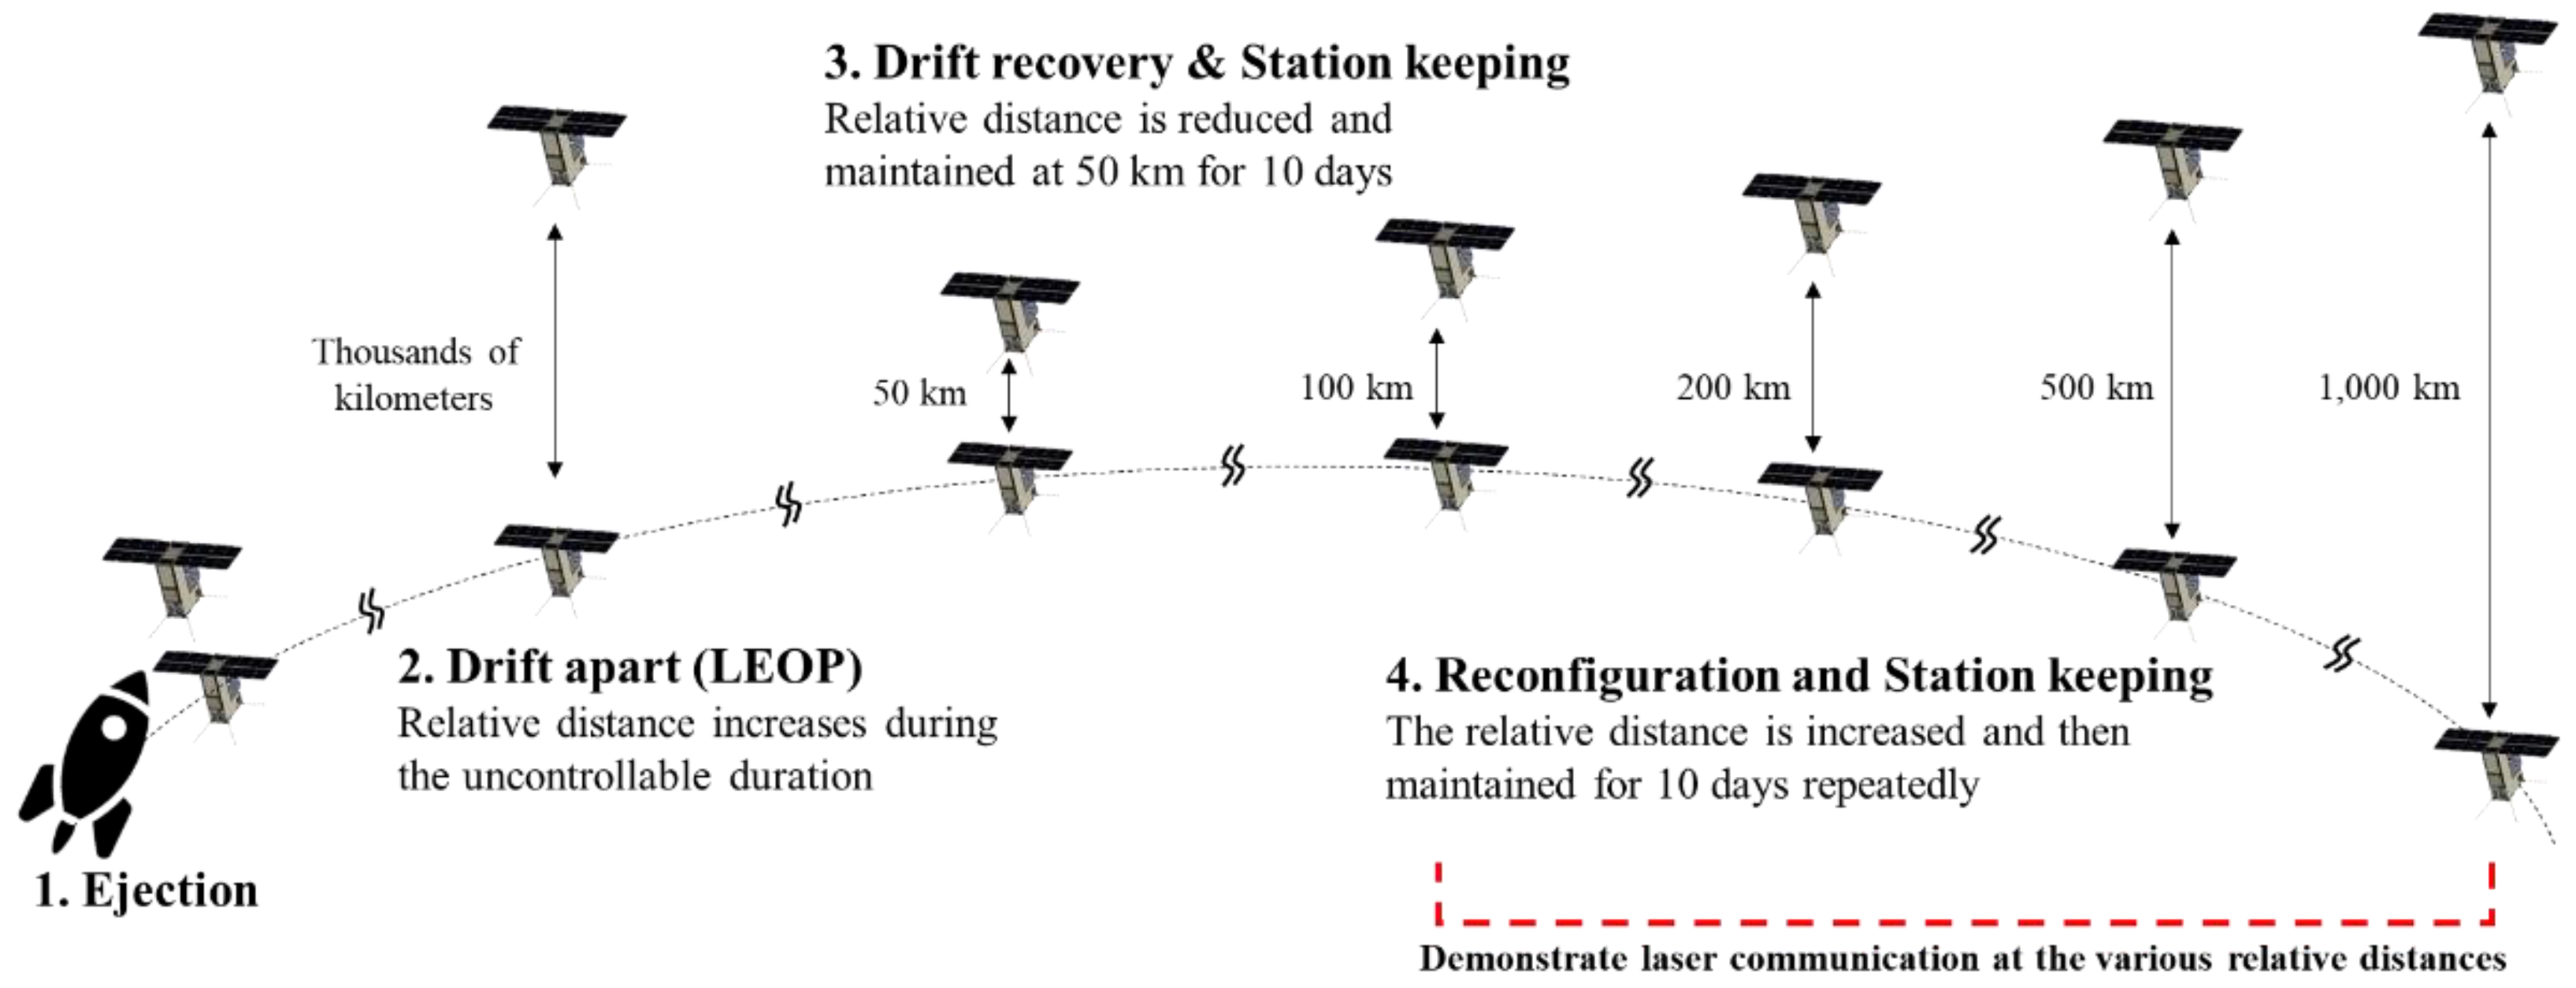
Figure 4.
Orbital operation for VISION mission. The two CubeSats maintained various relative distances and demonstrate laser communication for 10 days at each distance.
Figure 4.
Orbital operation for VISION mission. The two CubeSats maintained various relative distances and demonstrate laser communication for 10 days at each distance.
Figure 5.
Conceptual illustration of desired changes in the relative distance over time between two CubeSats. The relative distance increased within the uncontrollable duration of the launch and early orbit phase. The relative distance was decreased and maintained at 50 km to demonstrate the laser communication. The distance was then increased and maintained by orbit controls. The circle markers indicate the orbit controls. The numbers 1, 2, and 3 indicate drift recovery, station keeping, and reconfiguration, respectively.
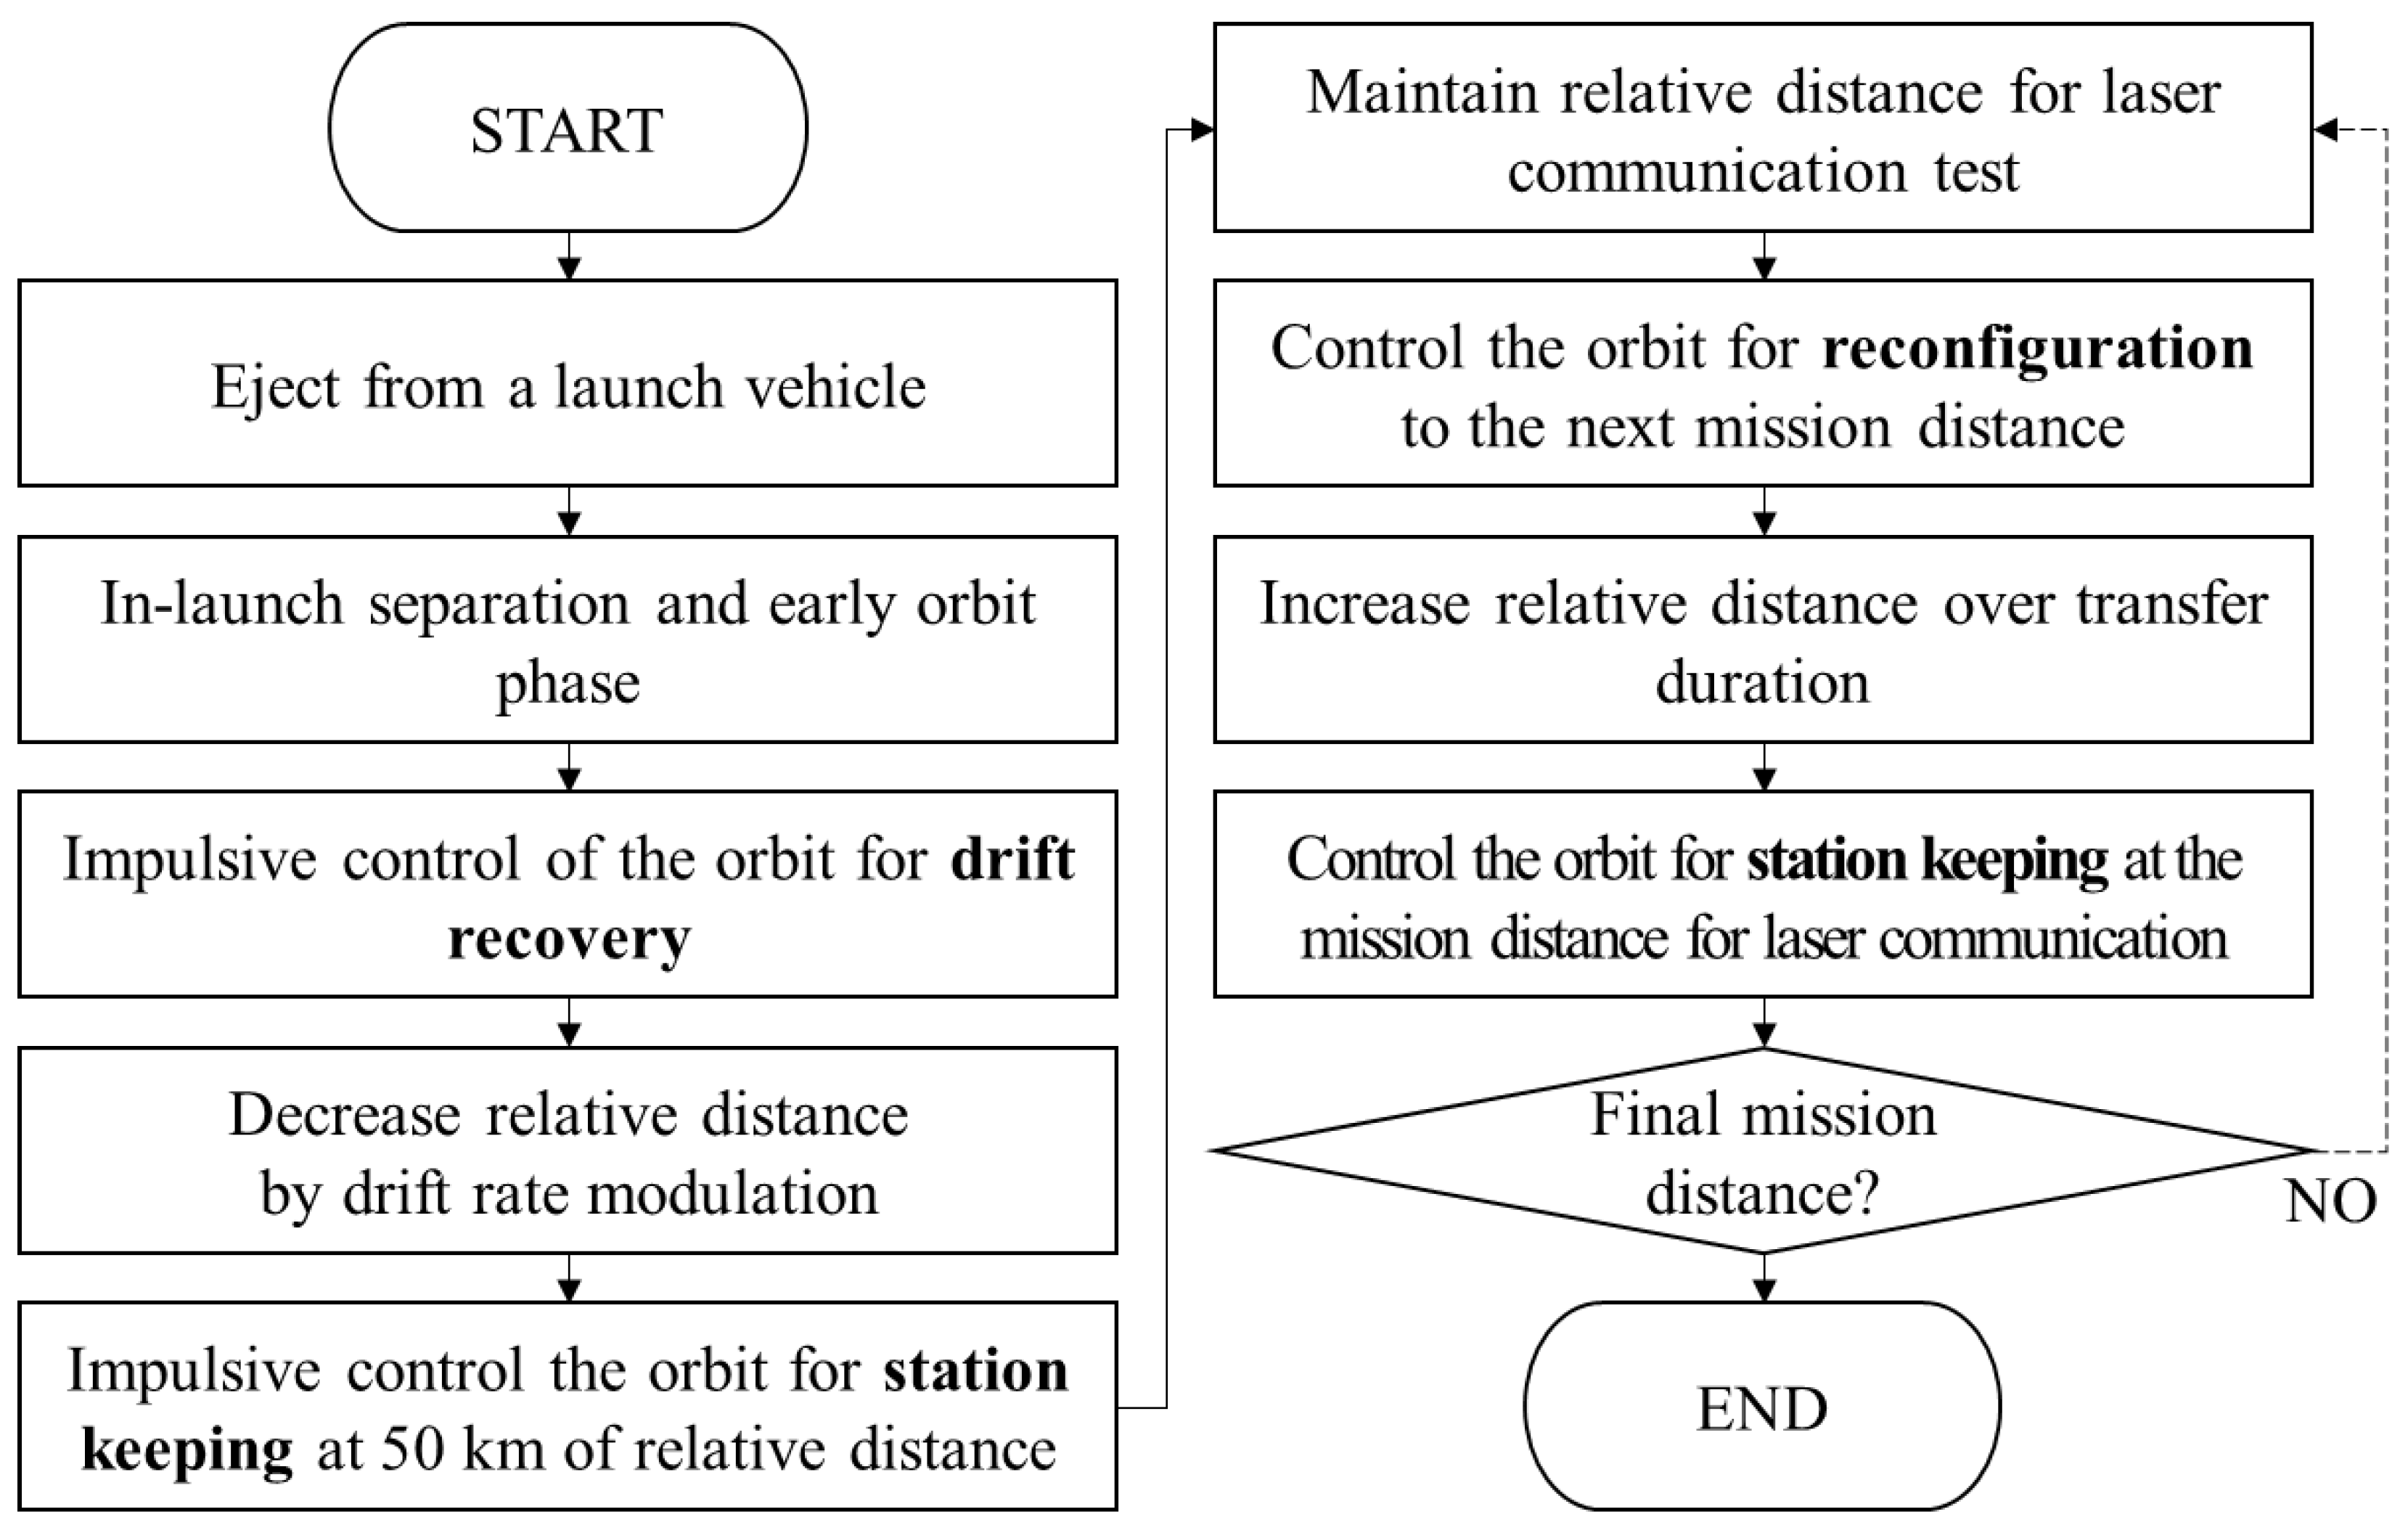
Figure 6.
Flowchart for the numerical simulations of the orbit control scenarios for the VISION mission. The relative distance is modulated by three types of orbit controls: drift recovery, station keeping, and reconfiguration.
Figure 6.
Flowchart for the numerical simulations of the orbit control scenarios for the VISION mission. The relative distance is modulated by three types of orbit controls: drift recovery, station keeping, and reconfiguration.
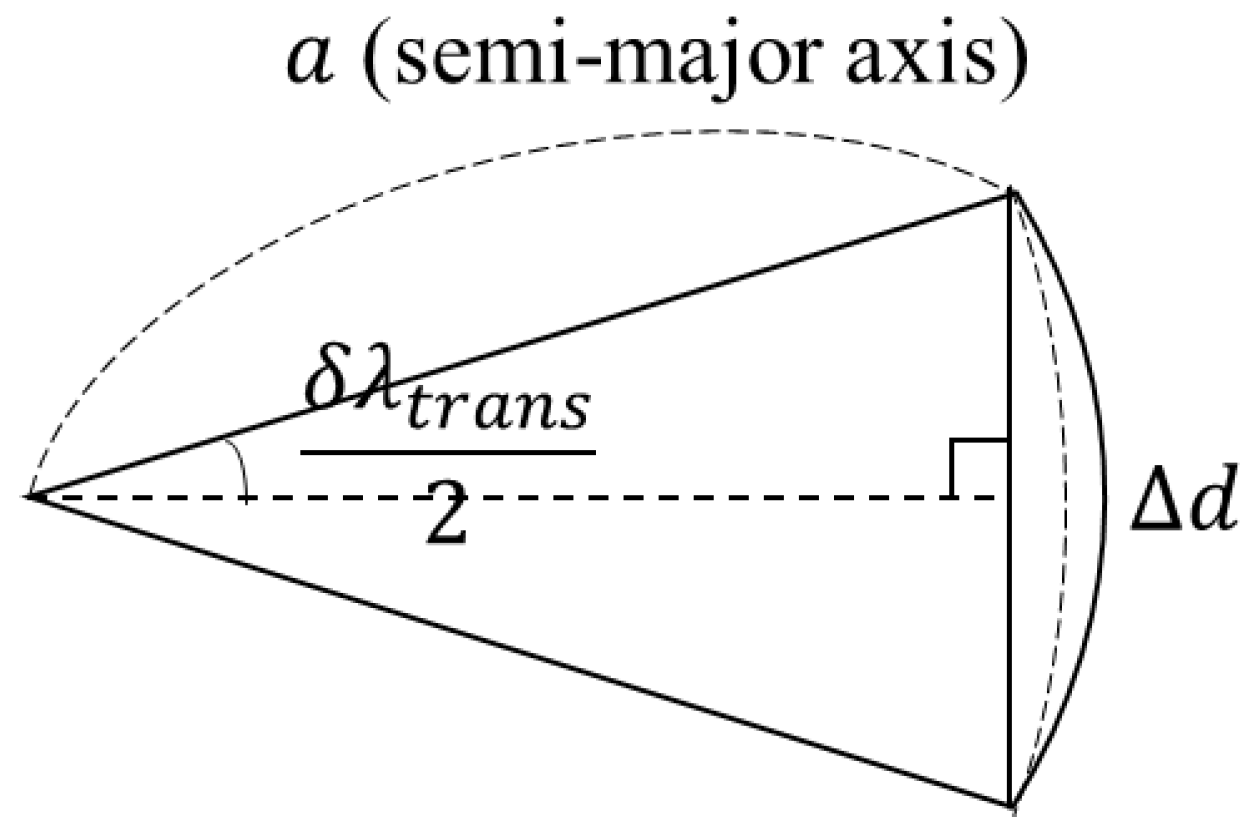
Figure 7.
Geometrical description of δλtrans corresponding to the difference between the set point for the reconfiguration phase.
Figure 7.
Geometrical description of δλtrans corresponding to the difference between the set point for the reconfiguration phase.
Figure 8.
Flowchart of the method to compute ΔV of three types of orbit controls. There are three types of methods to determine the desired drift rate of the deputy CubeSat according to the orbit control types. Moreover, OD denotes orbit determination.
Figure 8.
Flowchart of the method to compute ΔV of three types of orbit controls. There are three types of methods to determine the desired drift rate of the deputy CubeSat according to the orbit control types. Moreover, OD denotes orbit determination.
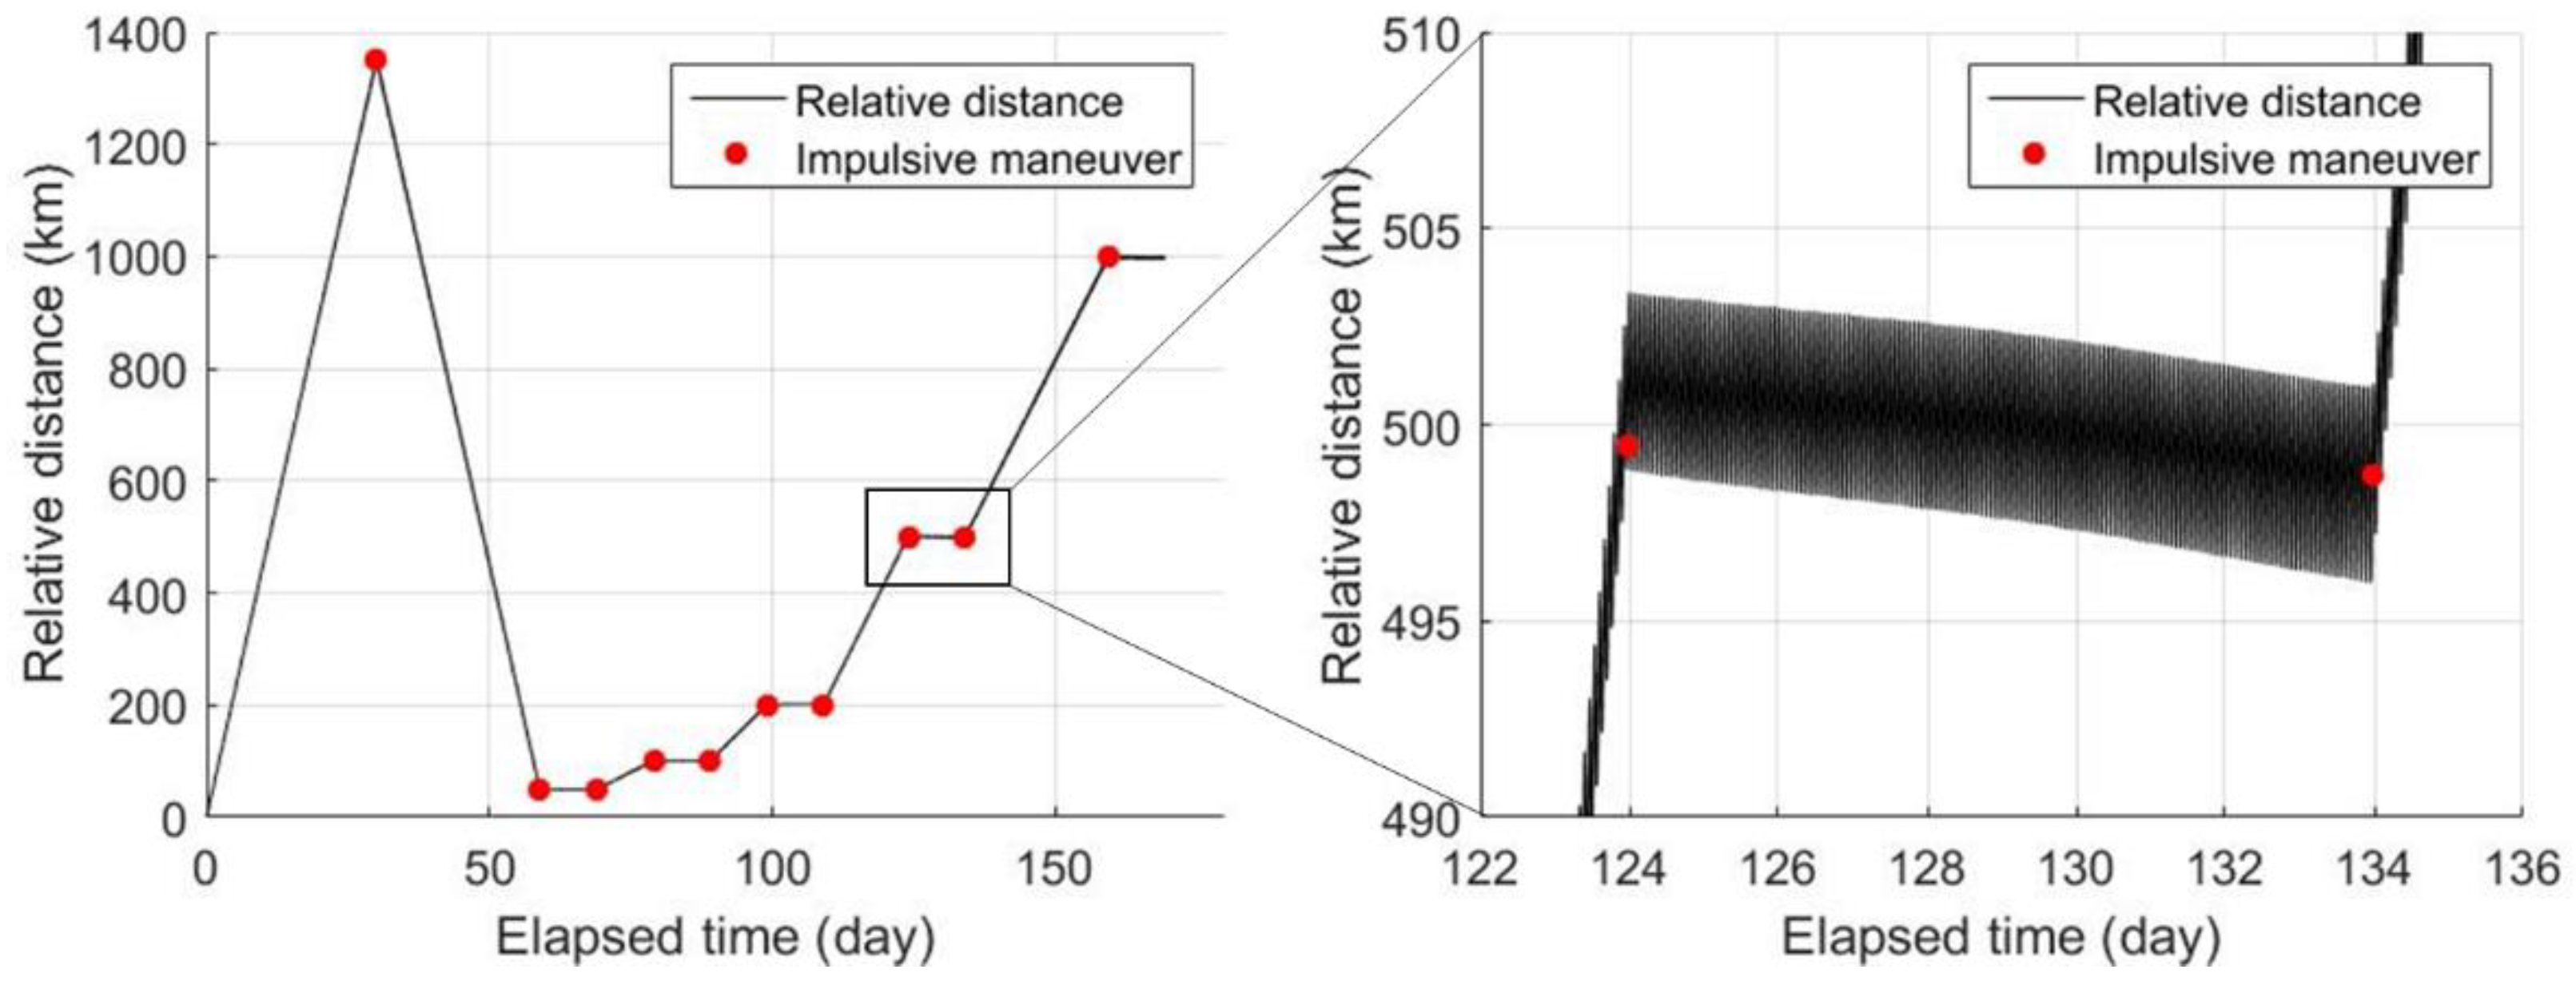
Figure 9.
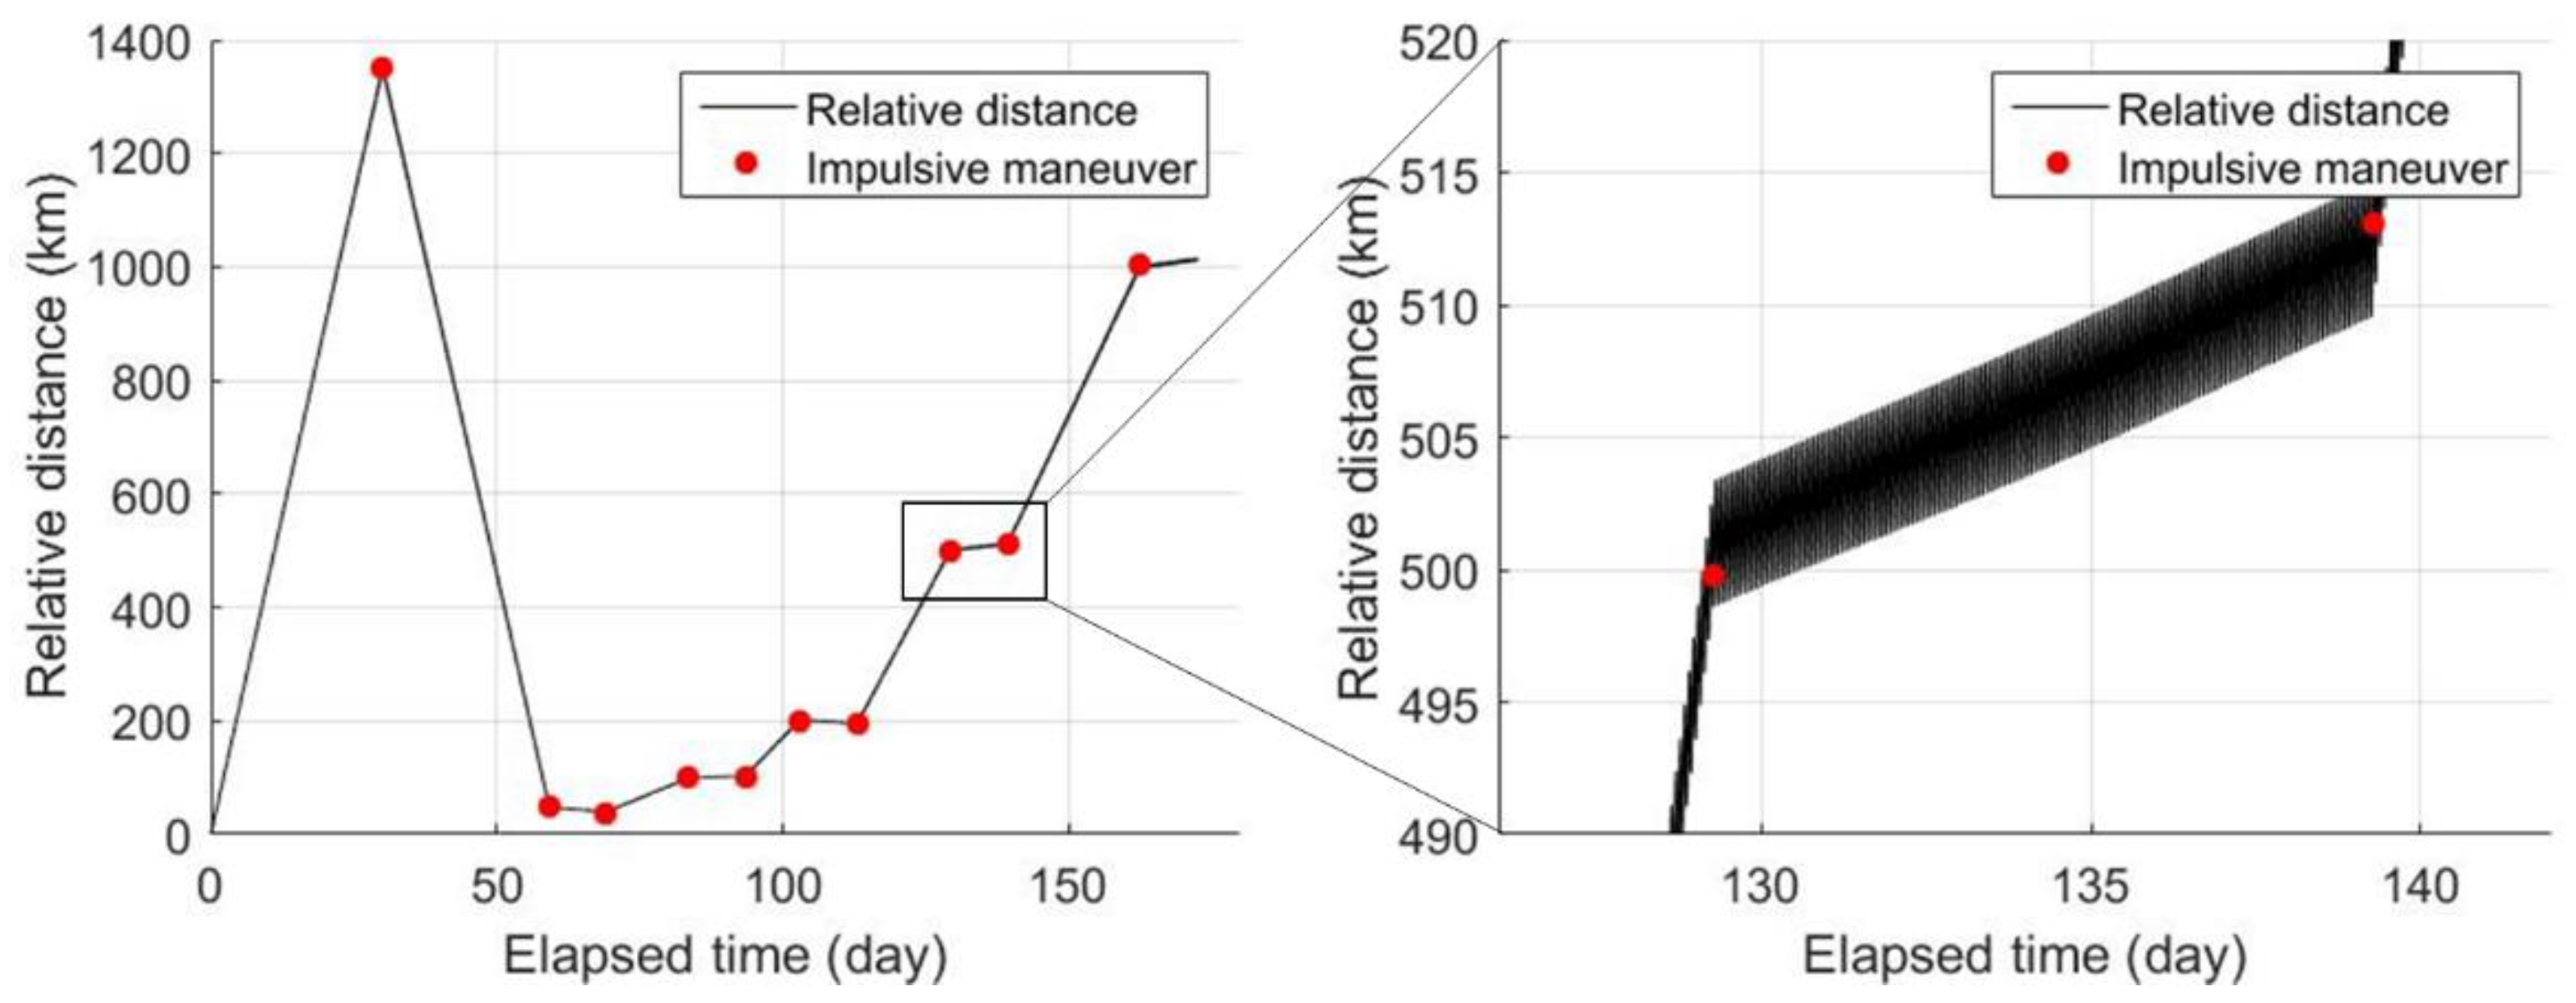
Changes in the relative distance between two CubeSats over time. Ten times of impulsive orbit controls modulated the relative distances and maintained them for 10 days of the demonstration duration at each set point, to demonstrate the laser communication at the various relative distances. The graph on the right-hand side is an enlarged view of the change in the relative distance at 500 km throughout the demonstration duration.
Figure 10.
The angle between the sun vector and relative position vector of the two CubeSats according to the elapsed time. The angles were near 90° for the elapsed time. This indicates that the orbit was maintained to minimize the sunlight incident on the optical system during the mission.
Figure 10.
The angle between the sun vector and relative position vector of the two CubeSats according to the elapsed time. The angles were near 90° for the elapsed time. This indicates that the orbit was maintained to minimize the sunlight incident on the optical system during the mission.
Figure 11.
Changes in the relative distance between two CubeSats over time when the relative speed after the ejection was 1 m/s (assumed worst case) in the along-track direction. The maximum relative distance reached 7400 km. The accumulated magnitude of was 3.45 m/s, which satisfied the given budget.
Figure 12.
Changes in the relative distances between the two CubeSats over time for the case including the orbit determination errors.
Figure 12.
Changes in the relative distances between the two CubeSats over time for the case including the orbit determination errors.
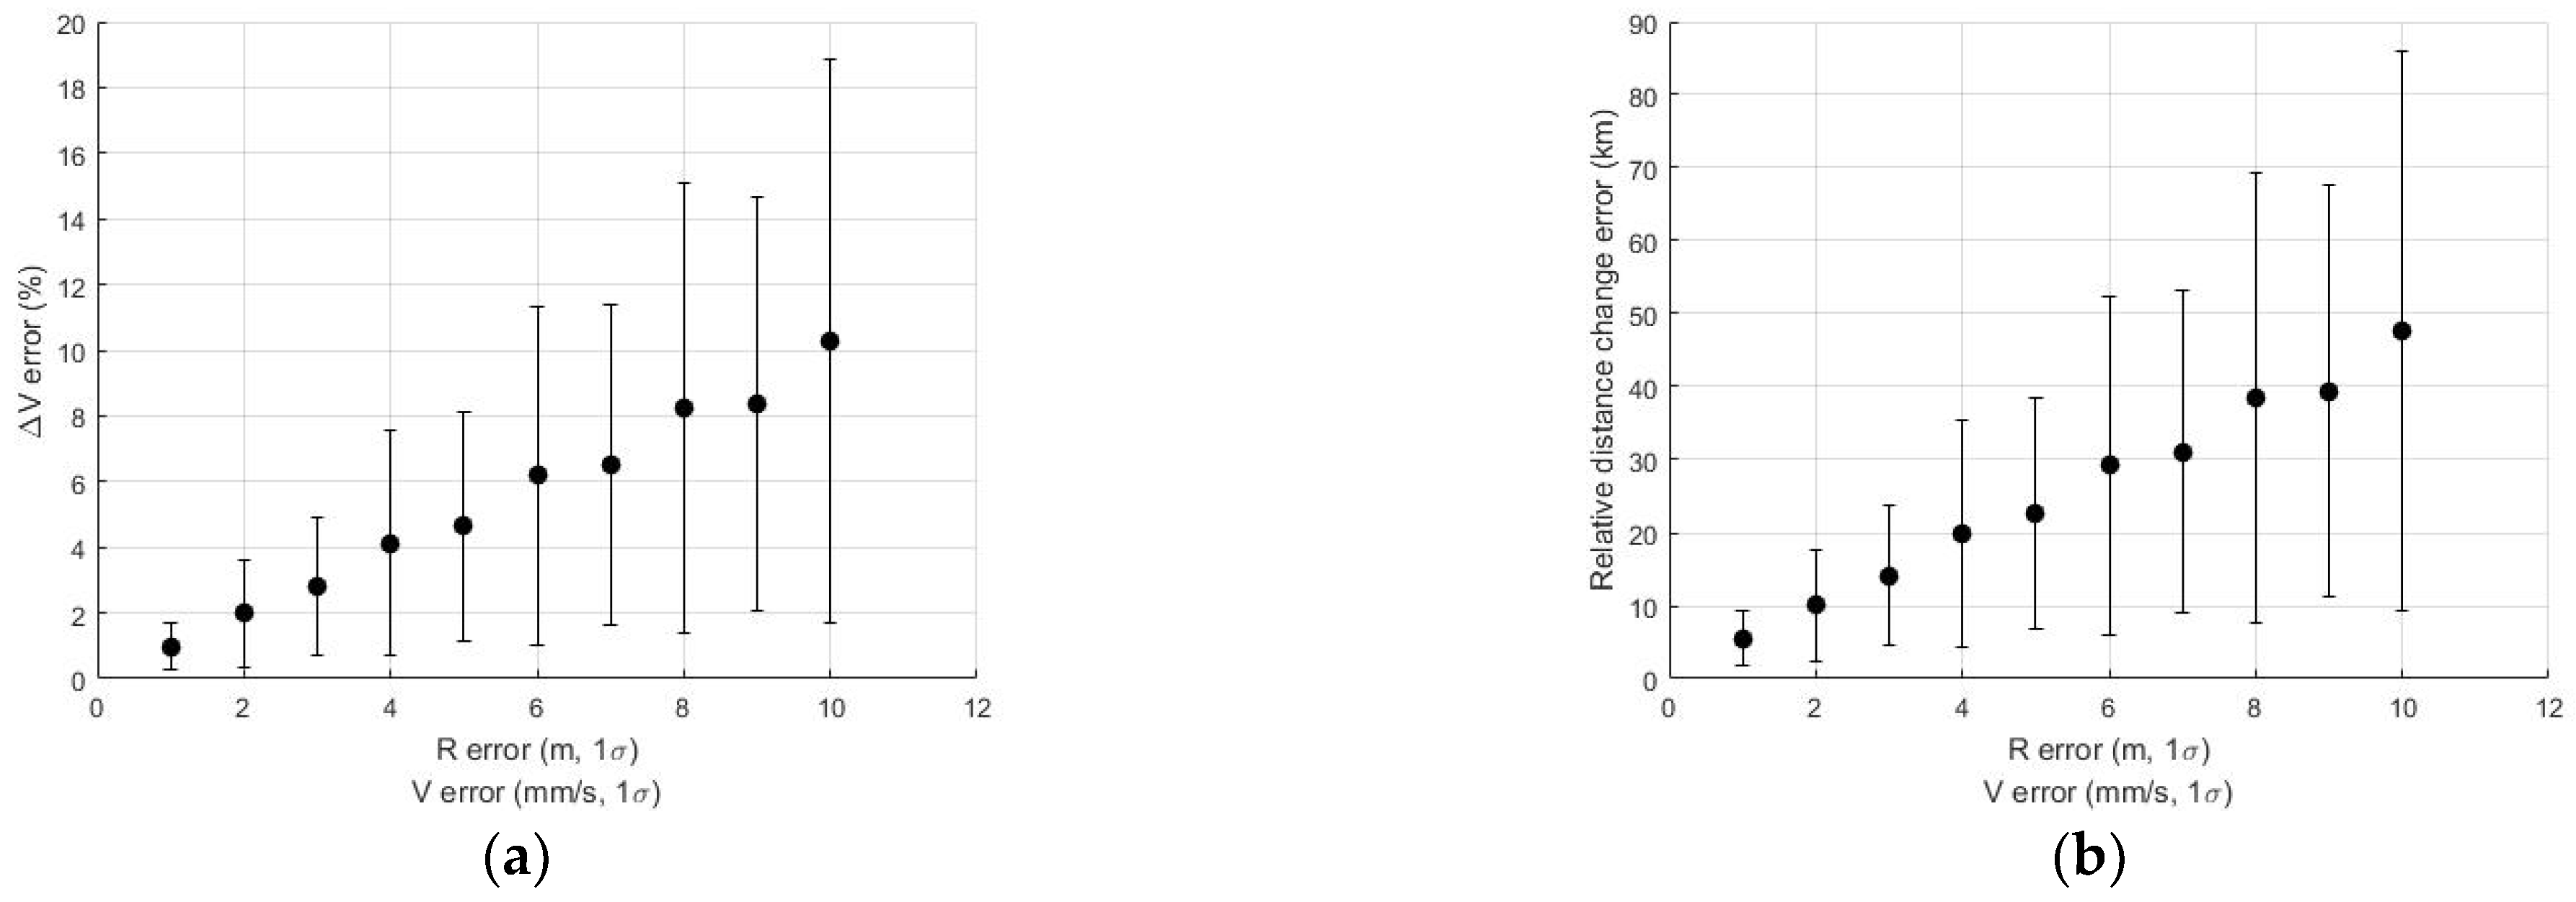
Figure 13.
The errors and changes in the relative distances according to the orbit determination errors. The two parameters increased as the position and velocity errors increased. (a) The differences compared with the ideal case. (b) Changes in the relative distance according to the orbit determination errors.
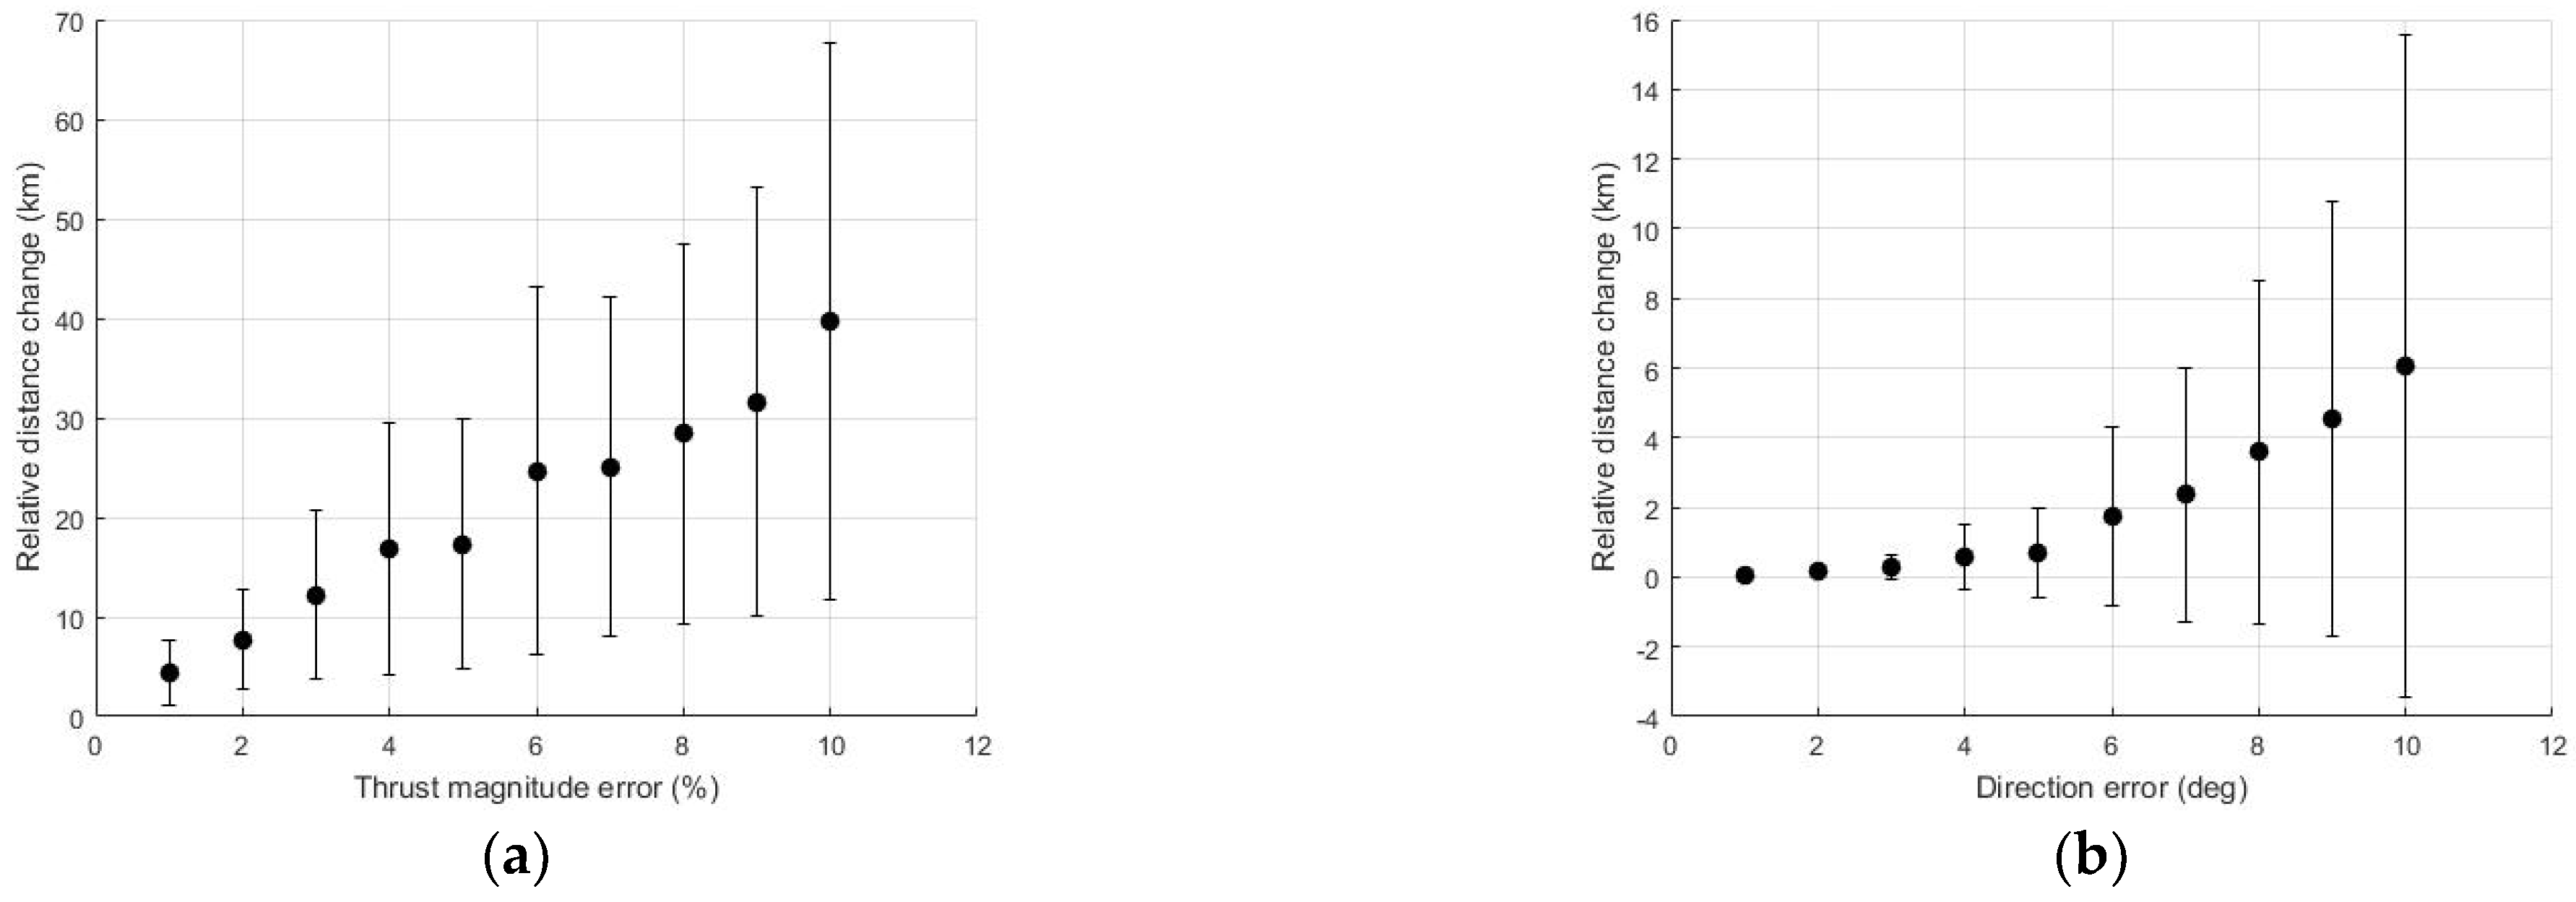
Figure 14.
The changes in the relative distances according to the thrust magnitude error (a) and direction error (b). The thrust magnitude error increased the changes in the relative distances. The thrust direction error changed the relative distances by reducing .
Figure 14.
The changes in the relative distances according to the thrust magnitude error (a) and direction error (b). The thrust magnitude error increased the changes in the relative distances. The thrust direction error changed the relative distances by reducing .
Figure 15.
The changes in the relative distances according to the time synchronization error. The changes in the relative distance due to the error were insignificant.
Figure 15.
The changes in the relative distances according to the time synchronization error. The changes in the relative distance due to the error were insignificant.
Figure 16.
Changes in the relative distance between two CubeSats over time with respect to the errors in the orbit determination and thrust magnitude and direction. The standard deviation () of the position and velocity along each axis was 1.5 m and 0.003 m/s, respectively. The thrust magnitude and direction errors were 1% ( ) and 3° ( ), respectively. The set points were maintained within ±10 km.
Figure 17.
Relative mean orbital elements with respect to the elapsed time. The difference in SMA causes the difference in the drift rate to modulate the relative distance.
Figure 17.
Relative mean orbital elements with respect to the elapsed time. The difference in SMA causes the difference in the drift rate to modulate the relative distance.
Figure 18.
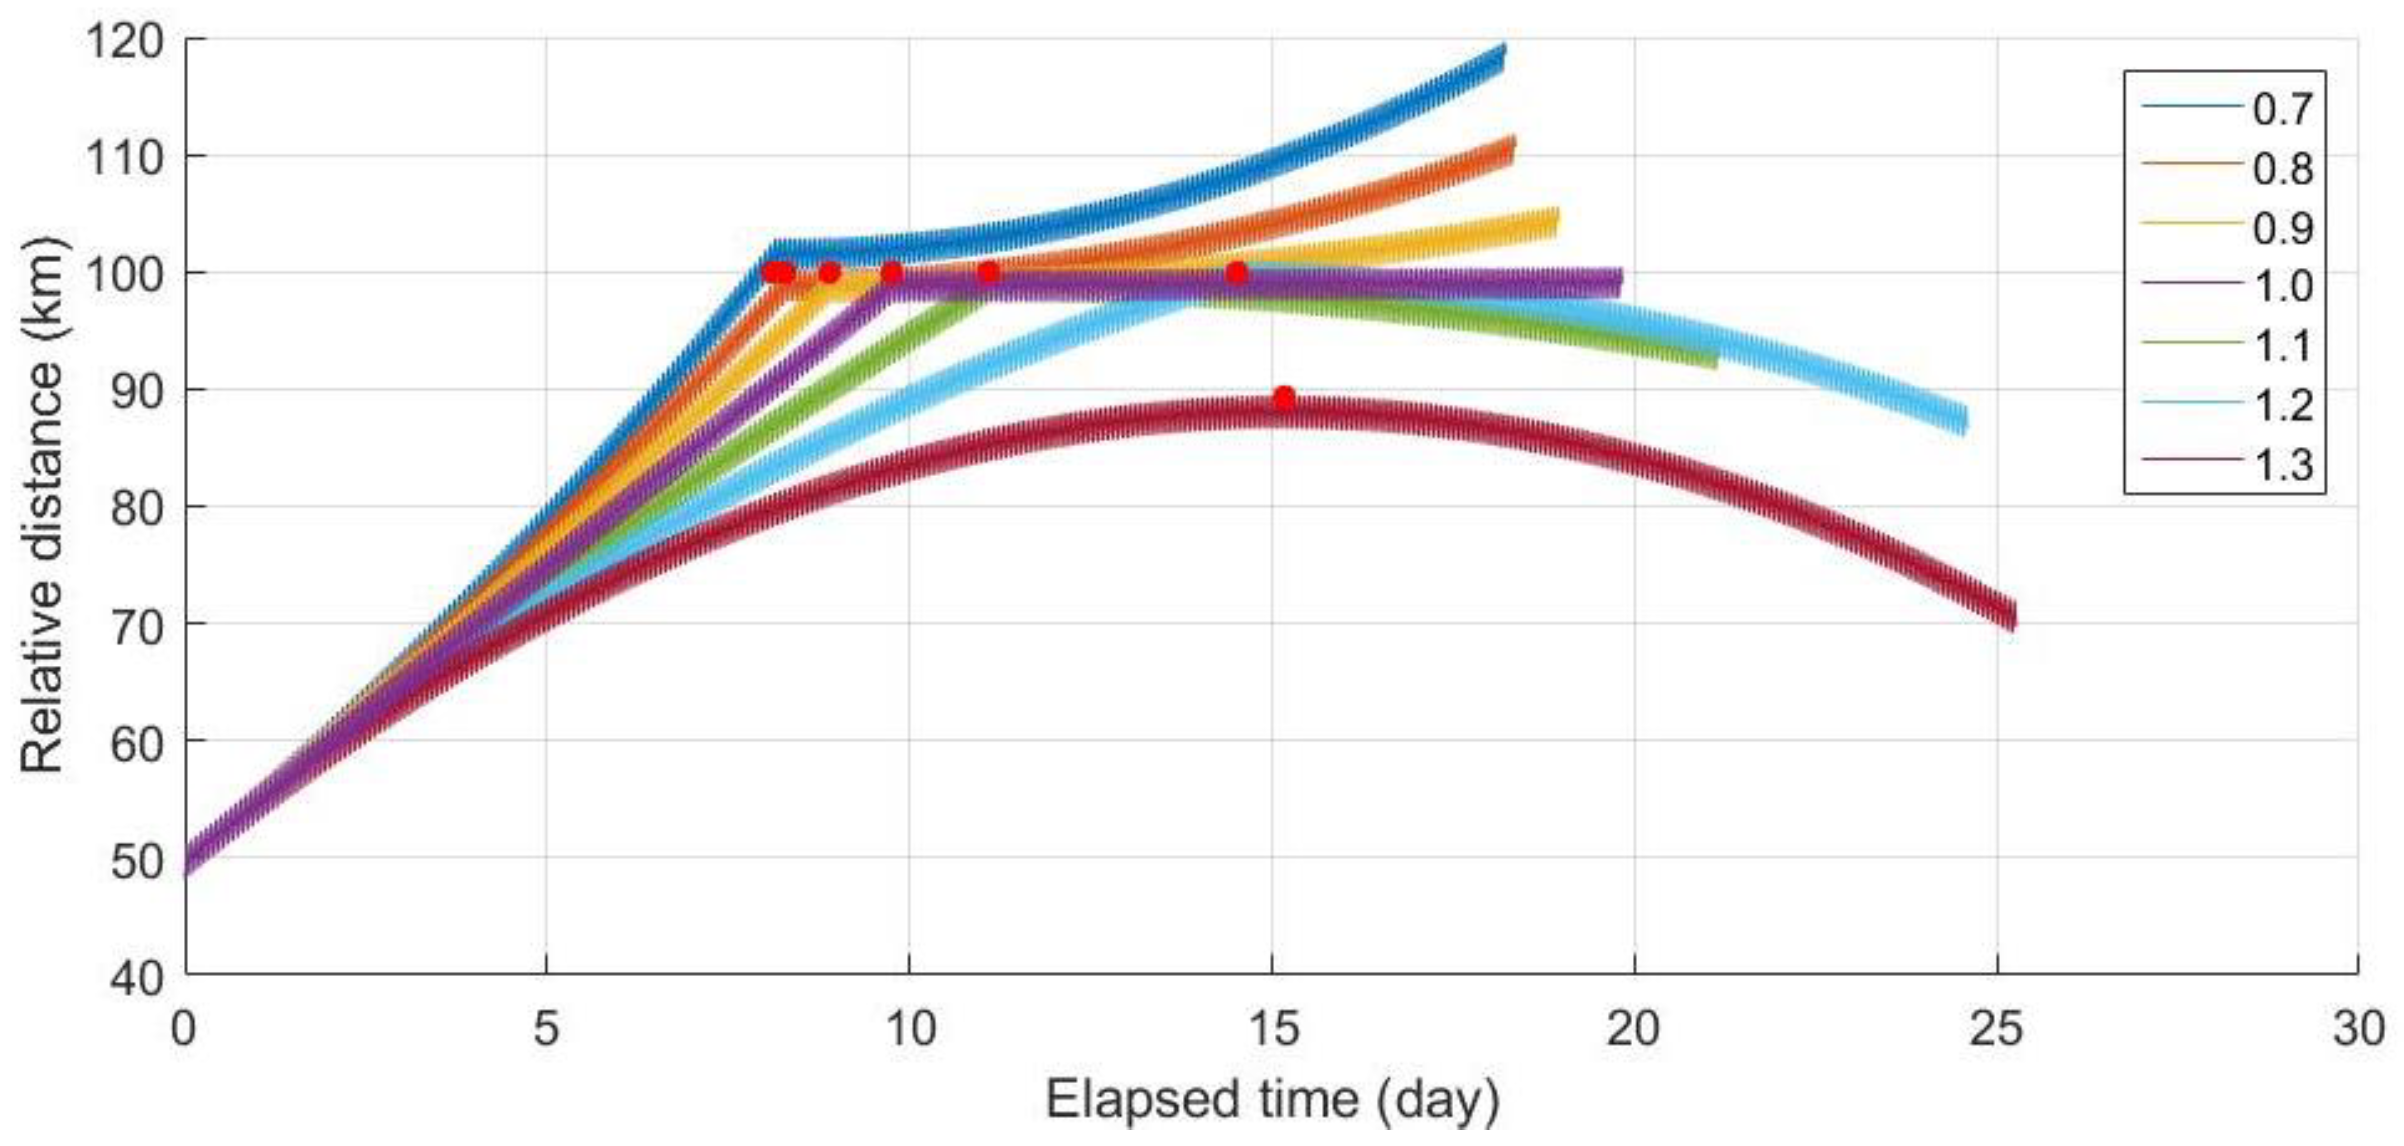
The changes in the relative distance between CubeSats with different mass-to-area ratios over time. The time required to reach a relative distance of 100 km and the changes in the relative distance after the station keeping (red dots on figure) varied according to the mass-to-area ratio.
Figure 18.
The changes in the relative distance between CubeSats with different mass-to-area ratios over time. The time required to reach a relative distance of 100 km and the changes in the relative distance after the station keeping (red dots on figure) varied according to the mass-to-area ratio.
Table 1.
Assumed classical orbital elements of reference CubeSat at the ejection from a launch vehicle. The relative velocity of the deputy CubeSat was 0.17 m/s in the along-track direction. The COE is the classical orbital element, the SMA is the semi-major axis, the ECC is eccentricity, the INC is the inclination, the RAAN is the right ascension of ascending node, the AoP is the argument of perigee, and the MA is the mean anomaly.
| COE | SMA | ECC | INC | RAAN | AoP | MA |
|---|
| Value | 6978 km | 0.0001 | 97.8° | 256° | 315° | 45° |
Table 2.
in each orbit control. All acted in a direction parallel to the -axis. After the drift recovery to decrease the relative distance, the station keeping and reconfiguration were repeated to change and maintain the set point.
Table 2.
in each orbit control. All acted in a direction parallel to the -axis. After the drift recovery to decrease the relative distance, the station keeping and reconfiguration were repeated to change and maintain the set point.
| Orbit Control | Objective | |
|---|
| #1 | Drift recovery | −0.3499 |
| #2 | Station keeping | 0.1761 |
| #3 | Reconfiguration | 0.0194 |
| #4 | Station keeping | −0.0196 |
| #5 | Reconfiguration | 0.0386 |
| #6 | Station keeping | −0.0388 |
| #7 | Reconfiguration | 0.0774 |
| #8 | Station keeping | −0.0784 |
| #9 | Reconfiguration | 0.0774 |
| #10 | Station keeping | −0.0772 |
| Accumulated (magnitude) | 0.9281 m/s |
Table 3.
in each orbit control for the case including the orbit determination error.
Table 3.
in each orbit control for the case including the orbit determination error.
| Orbit Control | Objective | | Differences from
Table 2 (m/s) |
|---|
| #1 | Drift recovery | −0.3542 | −4.3568 |
| #2 | Station keeping | 0.1669 | −9.1752 |
| #3 | Reconfiguration | 0.0193 | −8.8801 |
| #4 | Station keeping | −0.0072 | 1.2367 |
| #5 | Reconfiguration | 0.0387 | 2.7177 |
| #6 | Station keeping | −0.0318 | 7.0297 |
| #7 | Reconfiguration | 0.0775 | 3.1428 |
| #8 | Station keeping | −0.0773 | 1.1510 |
| #9 | Reconfiguration | 0.0774 | −6.9649 |
| #10 | Station keeping | −0.0791 | −1.8690 |
| Accumulated (magnitude) | 0.9293 | 5.1347 |
Table 4.
The simulation results for the relative distance controls between CubeSats with different mass-to-area ratios. The influence of the mass-to-area ratio with respect to the reference CubeSat on the time required to reach the target relative distance and the changes in the relative distance after the station keeping.
Mass-to-Area Ratio
w.r.t Reference CubeSat | Time Required to Reach 100 km (days) | Changes in Relative Distance
after 10 Days (km) |
|---|
| 0.7 | 8.12 | 18.5498 |
| 0.8 | 8.28 | 10.5978 |
| 0.9 | 8.89 | 4.3278 |
| 1.0 | 9.75 | 0.0369 |
| 1.1 | 11.09 | −7.3268 |
| 1.2 | 14.53 | −13.4146 |
| 1.3 | Not reached | −19.7132 |
