Article

Comparison of Visual and Visual–Tactile Inspection of Aircraft Engine Blades

1
Department of Mechanical Engineering, University of Canterbury, Christchurch 8041, New Zealand
2
Department of Computer Science and Software Engineering, University of Canterbury, Christchurch 8041, New Zealand
*
Author to whom correspondence should be addressed.
Aerospace 2021, 8(11), 313; https://doi.org/10.3390/aerospace8110313
Submission received: 29 September 2021 / Revised: 16 October 2021 / Accepted: 17 October 2021 / Published: 22 October 2021
(This article belongs to the Special Issue Aircraft Fault Detection)

Abstract

:
Background—In aircraft engine maintenance, the majority of parts, including engine blades, are inspected visually for any damage to ensure a safe operation. While this process is called visual inspection, there are other human senses encompassed in this process such as tactile perception. Thus, there is a need to better understand the effect of the tactile component on visual inspection performance and whether this effect is consistent for different defect types and expertise groups. Method—This study comprised three experiments, each designed to test different levels of visual and tactile abilities. In each experiment, six industry practitioners of three expertise groups inspected the same sample of N = 26 blades. A two-week interval was allowed between the experiments. Inspection performance was measured in terms of inspection accuracy, inspection time, and defect classification accuracy. Results—The results showed that unrestrained vision and the addition of tactile perception led to higher inspection accuracies of 76.9% and 84.0%, respectively, compared to screen-based inspection with 70.5% accuracy. An improvement was also noted in classification accuracy, as 39.1%, 67.5%, and 79.4% of defects were correctly classified in screen-based, full vision and visual–tactile inspection, respectively. The shortest inspection time was measured for screen-based inspection (18.134 s) followed by visual–tactile (22.140 s) and full vision (25.064 s). Dents benefited the most from the tactile sense, while the false positive rate remained unchanged across all experiments. Nicks and dents were the most difficult to detect and classify and were often confused by operators. Conclusions—Visual inspection in combination with tactile perception led to better performance in inspecting engine blades than visual inspection alone. This has implications for industrial training programmes for fault detection.

Graphical Abstract

1. Introduction

To ensure safe flight operation, it is essential that aircraft, and aircraft engines in particular, are inspected on a frequent basis. In aircraft engine maintenance, approximately 90% of inspection tasks are performed visually [1,2]. Some of the most critical parts that need to be inspected are engine blades and vanes. These are the most rejected, life-limited parts during engine maintenance because of the extreme environment they operate in. Not only do these parts experience inner stresses caused by high rotational speed and high temperatures, but they are also prone to foreign object damage (FOD). Foreign objects can include debris on the runway or particles in the air, ingested wildlife such as birds, or any items left behind in the engine such as tools or clipboards [3,4,5]. Each of these has the potential to cause damage to the engine, and in particular to engine blades. Thus, during engine inspection, it is crucial to find any defects at the earliest stage before they can propagate and cause severe engine failure.
In engine maintenance, there are different types of inspection. First, the engine is borescoped; i.e., a device, the so-called borescope, is inserted into the engine, and the blades are inspected in situ. This inspection is screen-based, and the visual view is quite restricted. Depending on the maintenance level, the engine is sometimes stripped even without a preceding borescope inspection, in which case the process starts with a module inspection. Here, the engine rotor assembly—comprising the shaft and assembled blades—is removed from the engine. While this inspection allows the operator to rotate the shaft and inspect the blades from different angles, the operator cannot hold individual blades in their hands. The next level of inspection is piece–part or on-bench inspection. This is the lowest level of inspection, in which all blades are fully exposed and the inspector can hold the blade in their hands.
Although it is called visual inspection, observations in previous studies [6] suggest that inspectors do not only rely on their vision, but also apply other senses such as their sense of touch (where feasible). Different levels of inspection seem to extend perception and affect inspection ability. Hence, there was an interest to analyse the different stages of the inspection process and what effect the inspection method and accompanying perception have on inspection performance. Does an extended visual view and the use of additional senses improve inspection performance? Are inspection operators more accurate or faster when they can use their tactile sense? This paper addressed these questions and analysed the effect of extended vision and the tactile component in visual inspection.
The results showed that unrestrained vision and the addition of tactile perception improved inspection accuracy significantly, to 76.9% and 84.0%, respectively, compared to screen-based inspection with 70.5% accuracy. An improvement was also noted in classification accuracy, as 39.1%, 67.5%, and 79.4% of defects were correctly classified in screen-based, full vision, and visual–tactile inspection, respectively. The shortest inspection time was measured for screen-based inspection (18.134 s), followed by visual–tactile (22.140 s) and full vision (25.064 s).

2. Literature Review

Examination of the literature on industrial inspection tasks revealed that only a few studies reported on visual inspection extending to encompass some form of tactile component [6,7,8,9,10]. Spencer defined visual inspection as the “process of examination and evaluation of systems and components by use of human sensory systems […] including looking, listening, feeling, smelling, shaking, and twisting” [8]. Drury listed a few common examples in aviation in which these other senses can complement the visual sense [10]. The inspection of fastener and control cables is typically accompanied by a haptic component, while oil leakage might be smelled before it is visually detectable. Noises, such as the specific sound of a bearing or door hinge, can also be indicators for faults.
Tactile inspection describes any form of examination that encompasses active touching of the object under examination, typically using the palm of the hand or fingertips [11]. However, the examination can be accompanied by other senses such as vision, smell, or hearing. Tactile perception can be passive or active, depending on whether the touching motion was intended (active) or not (passive) [12]. In tactile inspection, the hand is moved actively to detect any anomalies. Tactile inspection is used in a variety of conditional assessments, from quality inspection of manufactured parts to examination of the human body in the medical sector [13,14]. In an industrial context, tactile inspections are found in quality checks for a variety of products including textiles [15], injection-moulded parts [11], hydraulic hoses [16], and car tyres [17].
The purpose of tactile inspection is the same as that of any other inspection, i.e., detecting any deviations from an ideal standard that could affect the function, aesthetic, or customer satisfaction in regard to the product under inspection. Thus, the goal of tactile inspection is to detect defects such as distortion in shape or unevenness of surfaces by scanning the part using the palm of the hand, fingertips, or even fingernails to detect discontinuities with sizes on the order of a few micrometres [15]. Such minute irregularities are not always visible to the human eye, and their detectability highly depends on the individual visual acuity of each inspector and the size, contrast, colour, illumination, and shape of the defect [7,18,19]. Likewise, tactile inspection depends on individual touch perception, but also on whether gloves are worn during the inspection process and on defect-related characteristics such as size and shape, e.g., sharp versus soft edges [11]. Since both inspection methods seem to have their advantages and disadvantages, the present study aimed to quantify the differences in terms of inspection performance measured in inspection accuracy and inspection time.
Although it is commonly accepted that visual inspection is accompanied by other senses such as the tactile sense [7,8,9,10], the literature on tactile inspection is still sparse. Spencer emphasised the need for additional research into other sensory systems [8]. Desai and Konz [16] analysed the effect gloves have on the tactile sense during hydraulic hose inspection. The experiment focused purely on the tactile sense, i.e., the participants were blindfolded and used only their hands with and without gloves to make a decision whether the part was acceptable or defective. In practice however, shop floor staff do not operate blindfolded, and the inspections they perform comprise a combination of their tactile sense and vision. The findings are nonetheless relevant since they show that gloves had no effect on the detectability of defects. This was a useful insight when designing our study and deciding whether participants should wear gloves.
Another study by Kleiner et al. [20] investigated the tactile inspection process of metal cylinders. In this study, tactile inspection referred to examining a part using a handheld probe to detect cracks. Hence, the task under examination actually used a combination of the human sensory system (sense of touch) and aiding tools rather than pure tactile inspection. The authors also tested the effect of vision on the tactile inspection. Previous studies compared visual, tactile, and visual–tactile examination and concluded that visual appearance had a major effect on accuracy [21]. However, Kleiner et al. found that additional visual capability did not affect the inspection result. This implies that the effect depends on the inspection task and complexity.
A study by Noro [17] analysed inspection tasks using different senses and combinations thereof. Some process steps involved pure visual inspection, while others relied only on the tactile sense because of restricted views, and still others allowed a combination of both visual and tactile inspection. A comparison of the three different inspection methods was not made by the authors. However, when reviewing their results, it became apparent that the tactile inspections were faster than the visual inspections, and both were completed in less time than the visual–tactile inspection. These results showed that the inspection time was significantly shorter for missed defects than for correct decisions (true positives and true negatives). However, a performance comparison among the different sensory inspections based on inspection accuracy was not presented by the authors and could not be retrieved from the presented results.
When inspecting composite materials, research found that allowing inspectors to run their hands over panels or perform a tactile test (tap test, scratch test, or poke test) increased the detectability of flat dents and other very small damages, which were otherwise hard to detect [7]. While the study included both visual and visual–tactile inspection of dents, the research sample was different for each task. Furthermore, the results of the two experiments were not qualitatively compared. Even though dents also occur on engine blades, the manifestation and shape of such dents differ from those found on composite materials. Moreover, we would expect a different touch perception of worn engine blades compared to smooth composite panel surfaces.
According to previous studies, inspectors need a long time to acquire the skills necessary to perform a tactile inspection reliably [11]. This raises the question of whether inspection experts perform more accurately than non-inspecting staff with less or no experience. Our study aimed to answer this question.
Visual inspection of engine blades has been analysed in [6], which was the first study examining inspection accuracy. The work included eye tracking observation of images that somewhat represented borescope inspection. However, module and piece–part inspection, in which the actual blade can be viewed from different angles and even be touched (piece–part only), were not addressed in the study, nor were they covered elsewhere in the literature. There is also a need to incorporate tactile inspection.

3. Materials and Methods

3.1. Research Objective and Methodology

The objective of this research was to assess the impact the inspection method has on inspection performance. Each method was characterised by the accessibility, visual view, and touchability of the part. There was a particular interest to investigate the extent to which the ability to apply tactile sense affected inspection performance and whether the effect was different for various defect types and levels of expertise.
The study comprised three experiments, each representing an inspection method: (1) screen-based inspection, (2) full vision inspection, and (3) visual–tactile inspection. In the first experiment, images were presented to the participants, while in the second, the actual blade was shown to the participants, and in the third, the blade was handed over to the participants. The inspection results were recorded and analysed statistically and semi-qualitatively and then compared with each other.

3.2. Research Sample

The research sample comprised N = 26 high-pressure compressor (HPC) blades removed from V2500 engines during regular engine maintenance (Figure 1). The blades originated from different engines operated by different airlines around the world. The selected blades covered a variety of defects that can be typically found during engine maintenance and inspection. Defect types included airfoil dents, bends, nicks and dents on the leading or trailing edge, tears, tip rub, and tip curl. Some non-defective blades were also included in the sample.
The research sample was presented in two different ways. In the first task (screen-based inspection), images of the blades were shown to the participants. Those images were taken in a self-developed light tent with surround lighting as per [22]. In the full vision and visual–tactile inspection tasks, the actual parts were presented and handed out, respectively, to the participants.
Since the cleanliness of the blade affects inspection performance, all blades in this study were presented in the clean condition to provide somewhat ideal inspection conditions [6]. Another reason for this decision was the fact that participants would naturally clean the blade by rubbing off the deposit. This would lead to inconsistency of the research sample in terms of cleanliness and thus variation between subjects. Screening analysis using ANOVA (not shown here) identified that the background colour had no significant effect on inspection performance. Hence, the blade images for the screen-based inspection were taken on a white background, and for the full vision and visual–tactile inspections, the blades were placed on a white table and under ceiling lighting to somewhat represent the shop floor environment.

3.3. Research Population

From our industry partner, a Maintenance, Repair, and Overhaul (MRO) facility for V2500 engines, we recruited N = 6 participants, 5 male and 1 female ( M A g e = 41.2 ;   S D A g e = 12.1   y e a r s ) . The participants were sorted into three groups of expertise, determined by their current job position and previous experience in inspection of engine blades: inspectors, engineers, and assembly operators, in descending order of experience. The two participants from each expertise group volunteered in this study without compensation for their time. All experimental procedures and materials were approved by the Human Ethics Committee of the University of Canterbury (HEC 2020/08/LR-PS Amendment 2).
It should be noted that the research population was limited by the availability of participants under Covid-19 restrictions. The limitations of this research are further discussed in Section 5.3.

3.4. Experiment Design

Each experiment (screen-based inspection, full vision inspection, and visual–tactile inspection) represented an inspection method and was designed so as to imitate the restricted part accessibility and the different sensory perceptions, including vision and touch, that characterised each method. The experimental setups are shown in Figure 2 and further discussed in the following paragraphs.
The task was the same in all three experiments. Participants were asked to determine the serviceability of the blade, i.e., to search for any defects. Once a defect was found, the participants had to classify it into one of the following eight categories: airfoil dent, bend, dent, nick, tear, tip curl, tip rub, and non-defective. There was unlimited time to complete the task, but participants could not go back to reinspect a blade. The time for each blade was measured, and the participants were asked to rate their confidence in their assessment after each experiment.
The sample set and research population was the same for all experiments to allow for comparison. However, there was no particular order in which participants were tested. Between each experiment was at least a two-week break to account for any memory effects that might have occurred. The two-week period was also chosen to account for shift rotations, i.e., all experiments were performed at the same time of the day.
In the first experiment, images were presented on a 24.8-inch LED computer screen with a resolution of 1920 × 1080 pixels (FlexScan EV2451, EIZO, Ishikawa, Japan) placed at distance of 65 cm in front of the participants (Figure 2a). For the image presentation, PowerPoint was used, as it allowed the participants to mark their findings on the screen, i.e., drawing a circle around defects using the ‘pen tool’. Participants’ actions, such as mouse clicks and keyboard presses, were recorded to measure the inspection time taken for each blade.
During the second experiment (Figure 2b), the samples were presented one after another on a table in front of the participant. The participants could move their head to view the blade from any angle and distance to gain a 360-degree view of the part, but they were not allowed to touch the blade. Only in the last experiment, the visual–tactile inspection, were the blades were handed out to the participants, who were allowed to use their hands to feel the contour and run their fingers along the edges of the blade while inspecting it visually (Figure 2c).
In the screen-based inspection, participants were asked to draw a circle around defects using the computer mouse, followed by ticking the corresponding defect type. In the full vision and visual–tactile inspections, however, any markings would have required cleaning of the blades after each participant finished the task. Rather than marking the defects, participants were asked to verbalise their findings in Experiments 2 and 3. A review of the recordings showed no notable time difference between marking the defect in Experiment 1 and describing the defect in Experiments 2 and 3. Thus, the recorded inspection times were comparable without any additional editing.

3.5. Data Analysis

This study tested three hypotheses listed in Table 1 below. The inspection results of each participant were extracted from the recordings and subsequently statistically analysed in SPSS Statistics, version 25 (developed by IBM, Armonk, NY, USA). The data in this research were not normally distributed. Hence, a nonparametric test was required. We used the Kruskal–Wallis test followed by Dunn’s pairwise test with the Bonferroni correction to test hypotheses H1 and H2. Hypothesis H3 was analysed semi-quantitatively because of the small research population.
Inspection performance was measured using three different metrics, namely, Inspection Accuracy, Inspection Time, and Classification Accuracy. These were the dependent variables in the study, each of which is further described in Table 2 together with its underlying variables from the confusion matrix. The independent variables were Inspection Method, Defect Type, and Expertise.

4. Results

The three dependent variables—Inspection Accuracy, Inspection Time, and Defect Classification Accuracy—were analysed for the three hypotheses H1, H2, and H3, respectively.

4.1. Hypothesis H1 Testing

This section presents analysis of the effect the inspection method had on inspection performance measured in inspection accuracy, inspection time, and defect classification accuracy.

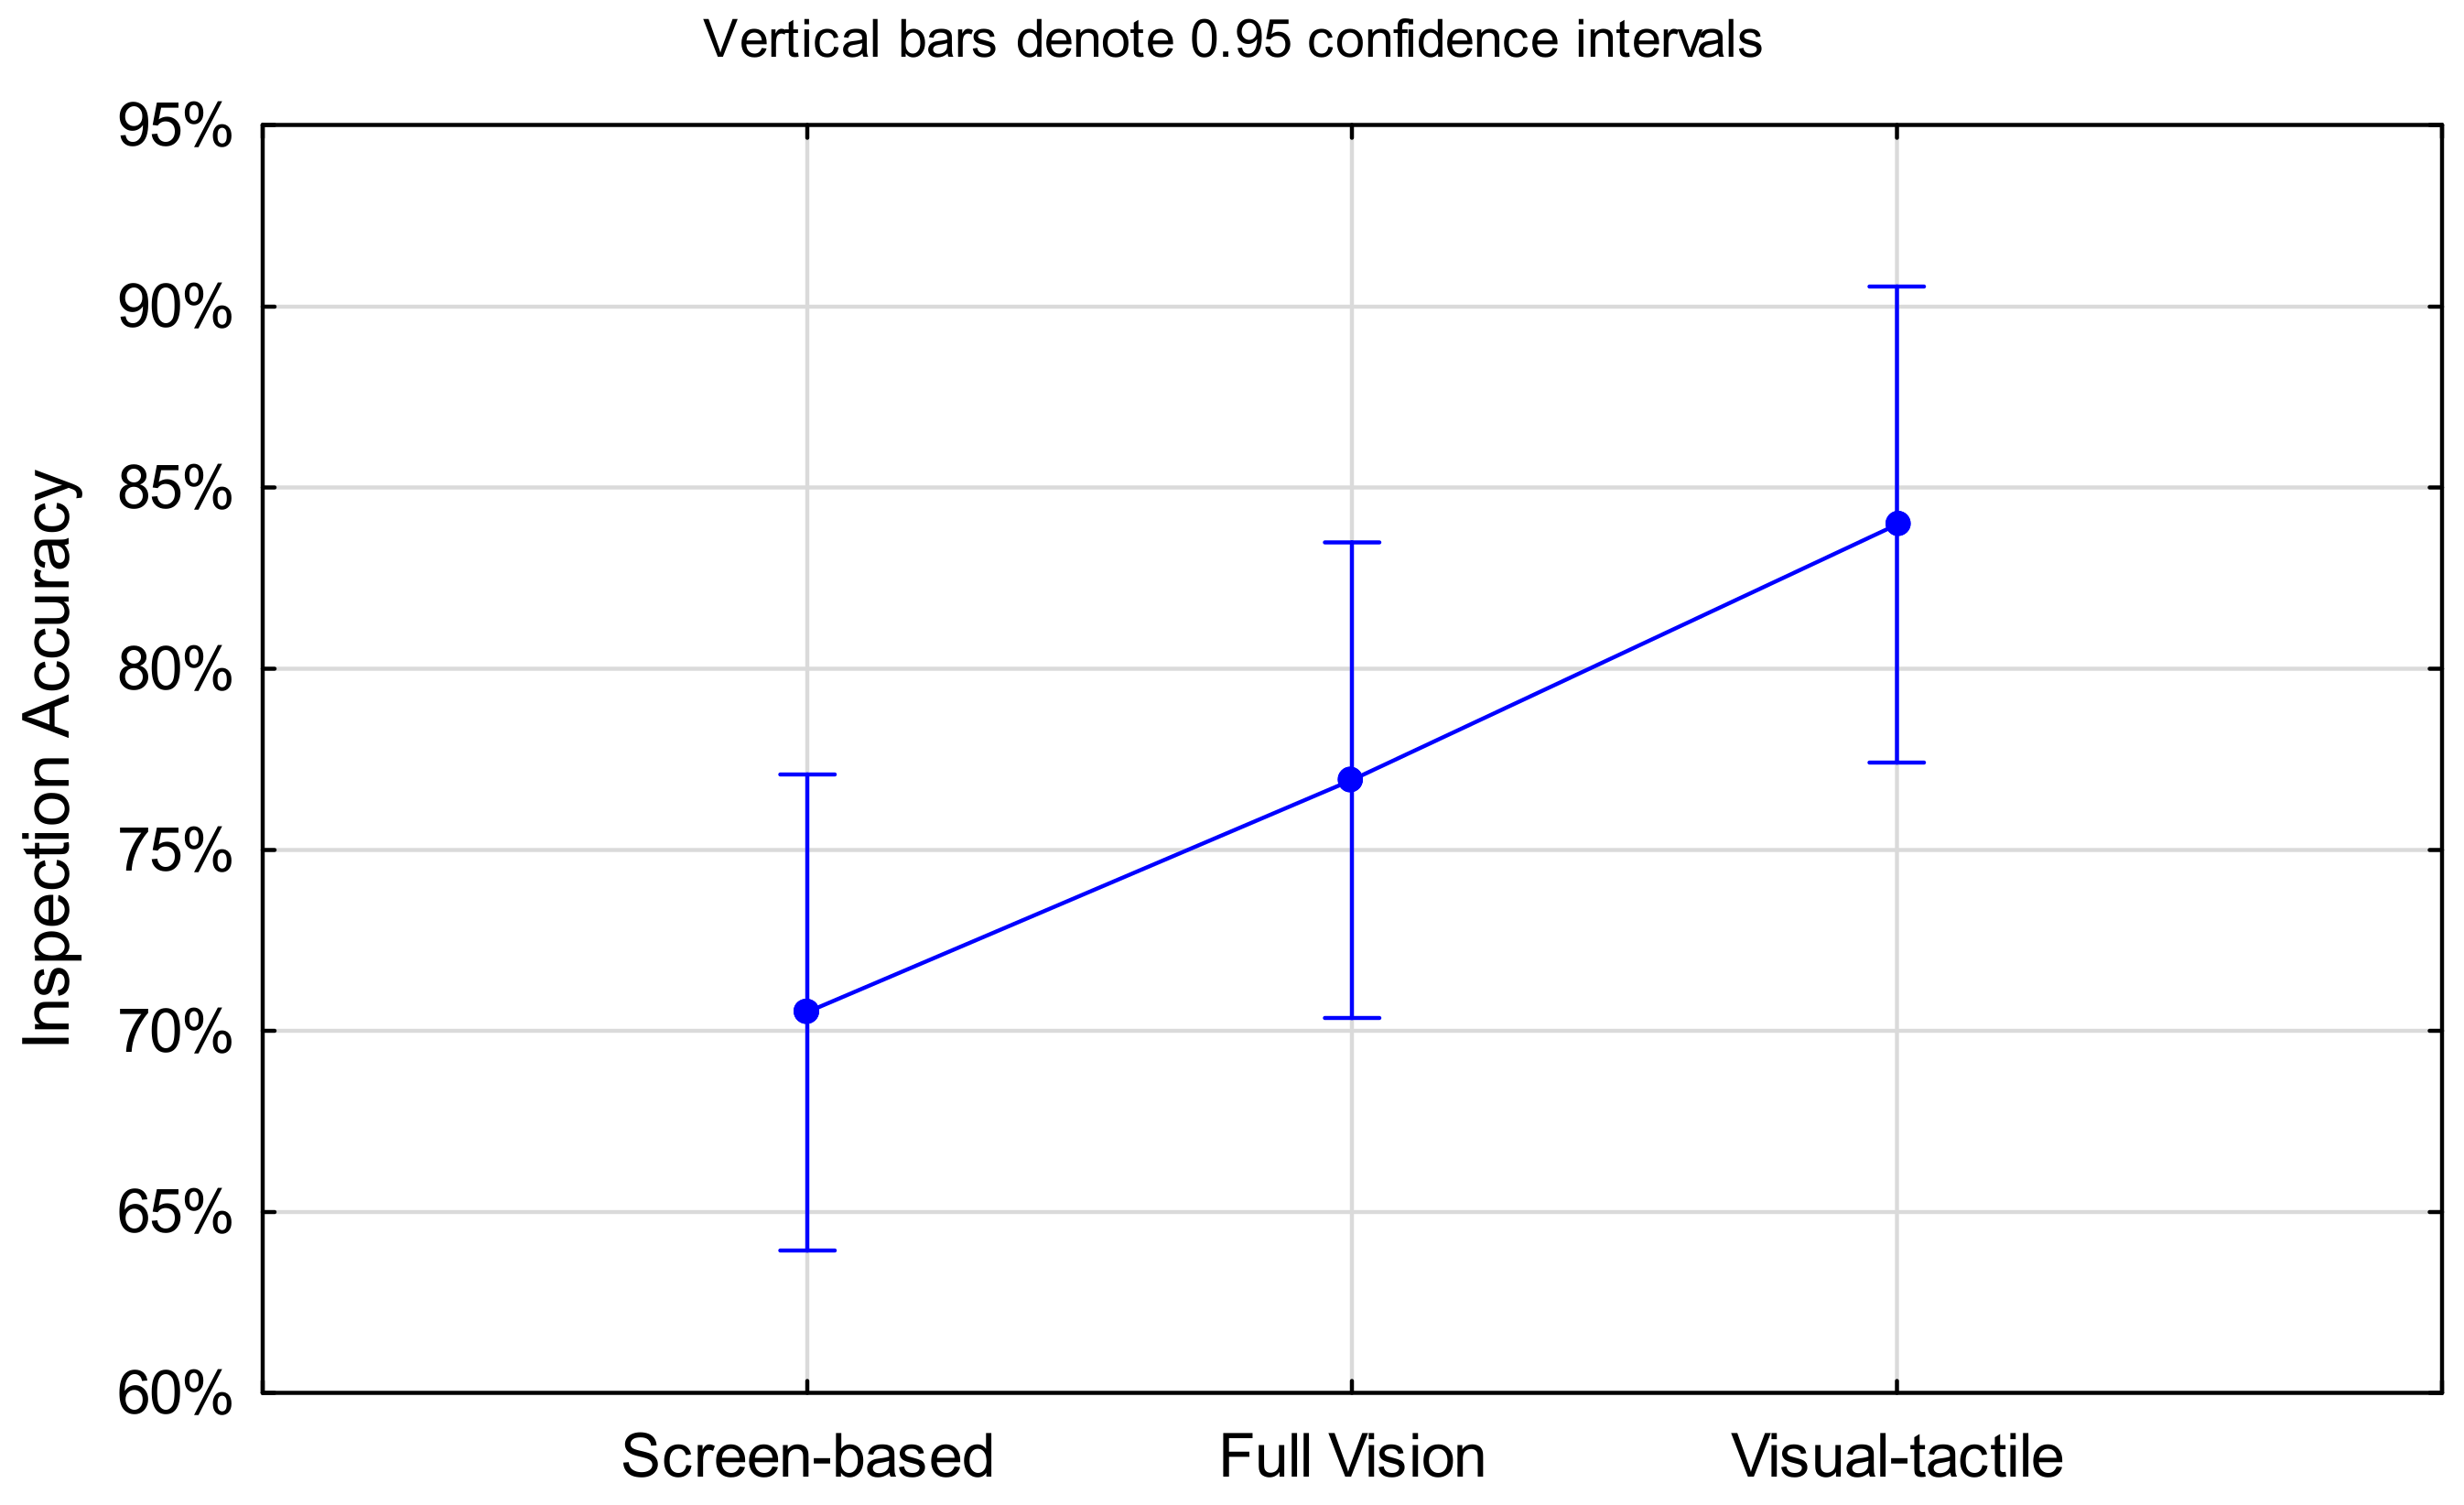
4.1.1. Inspection Accuracy

Inspection accuracy indicates how well participants performed in each inspection experiment. It takes into account the number of correct and incorrect decisions made. A correct decision could be either a true positive (correct detection) or a true negative (correct acceptance). Table 3 shows the inspection accuracies of each participant and in each inspection method.
The results showed that overall, the participants performed worst when presented with an image of the blade. Inspection accuracy improved when participants had unconstrained vision of the part and the ability to view the blade from different perspectives. Only for one participant (Engineer 2) was this not the case; for this participant, the detectability decreased from screen-based to full vision inspection. There might have been other factors that influenced the inspection that were not analysed in this study, e.g., the individual’s daily performance.
The highest number of correct serviceability decisions was achieved when the participants were allowed to use their hands additionally to their vision. The tactile sense led to better inspection results for all participants except one. This exception (Assembly Operator 2) made the most incorrect decisions in the visual–tactile inspection compared to the other two inspection methods. While this is somewhat surprising, a review of the individual results indicated that the decline in inspection accuracy was most likely be caused by an increase in false positives, i.e., non-defective blades being removed from service unjustifiably. The sense of touch might have led to ‘over-inspection’ and sensitisation of defect perception.
Figure 3 provides an overview of the continuous increase in inspection accuracy from screen-based through visual–tactile inspection. The findings were supported statistically. The Kruskal–Wallis H test was chosen because of the non-normally distributed data and showed significance for inspection accuracy, H(2) = 8.004, p < 0.02, with median inspection accuracies of 100% for all three inspection methods. A post hoc pairwise comparison with Bonferroni correction revealed a significant difference between screen-based and visual–tactile inspection, p = 0.014.

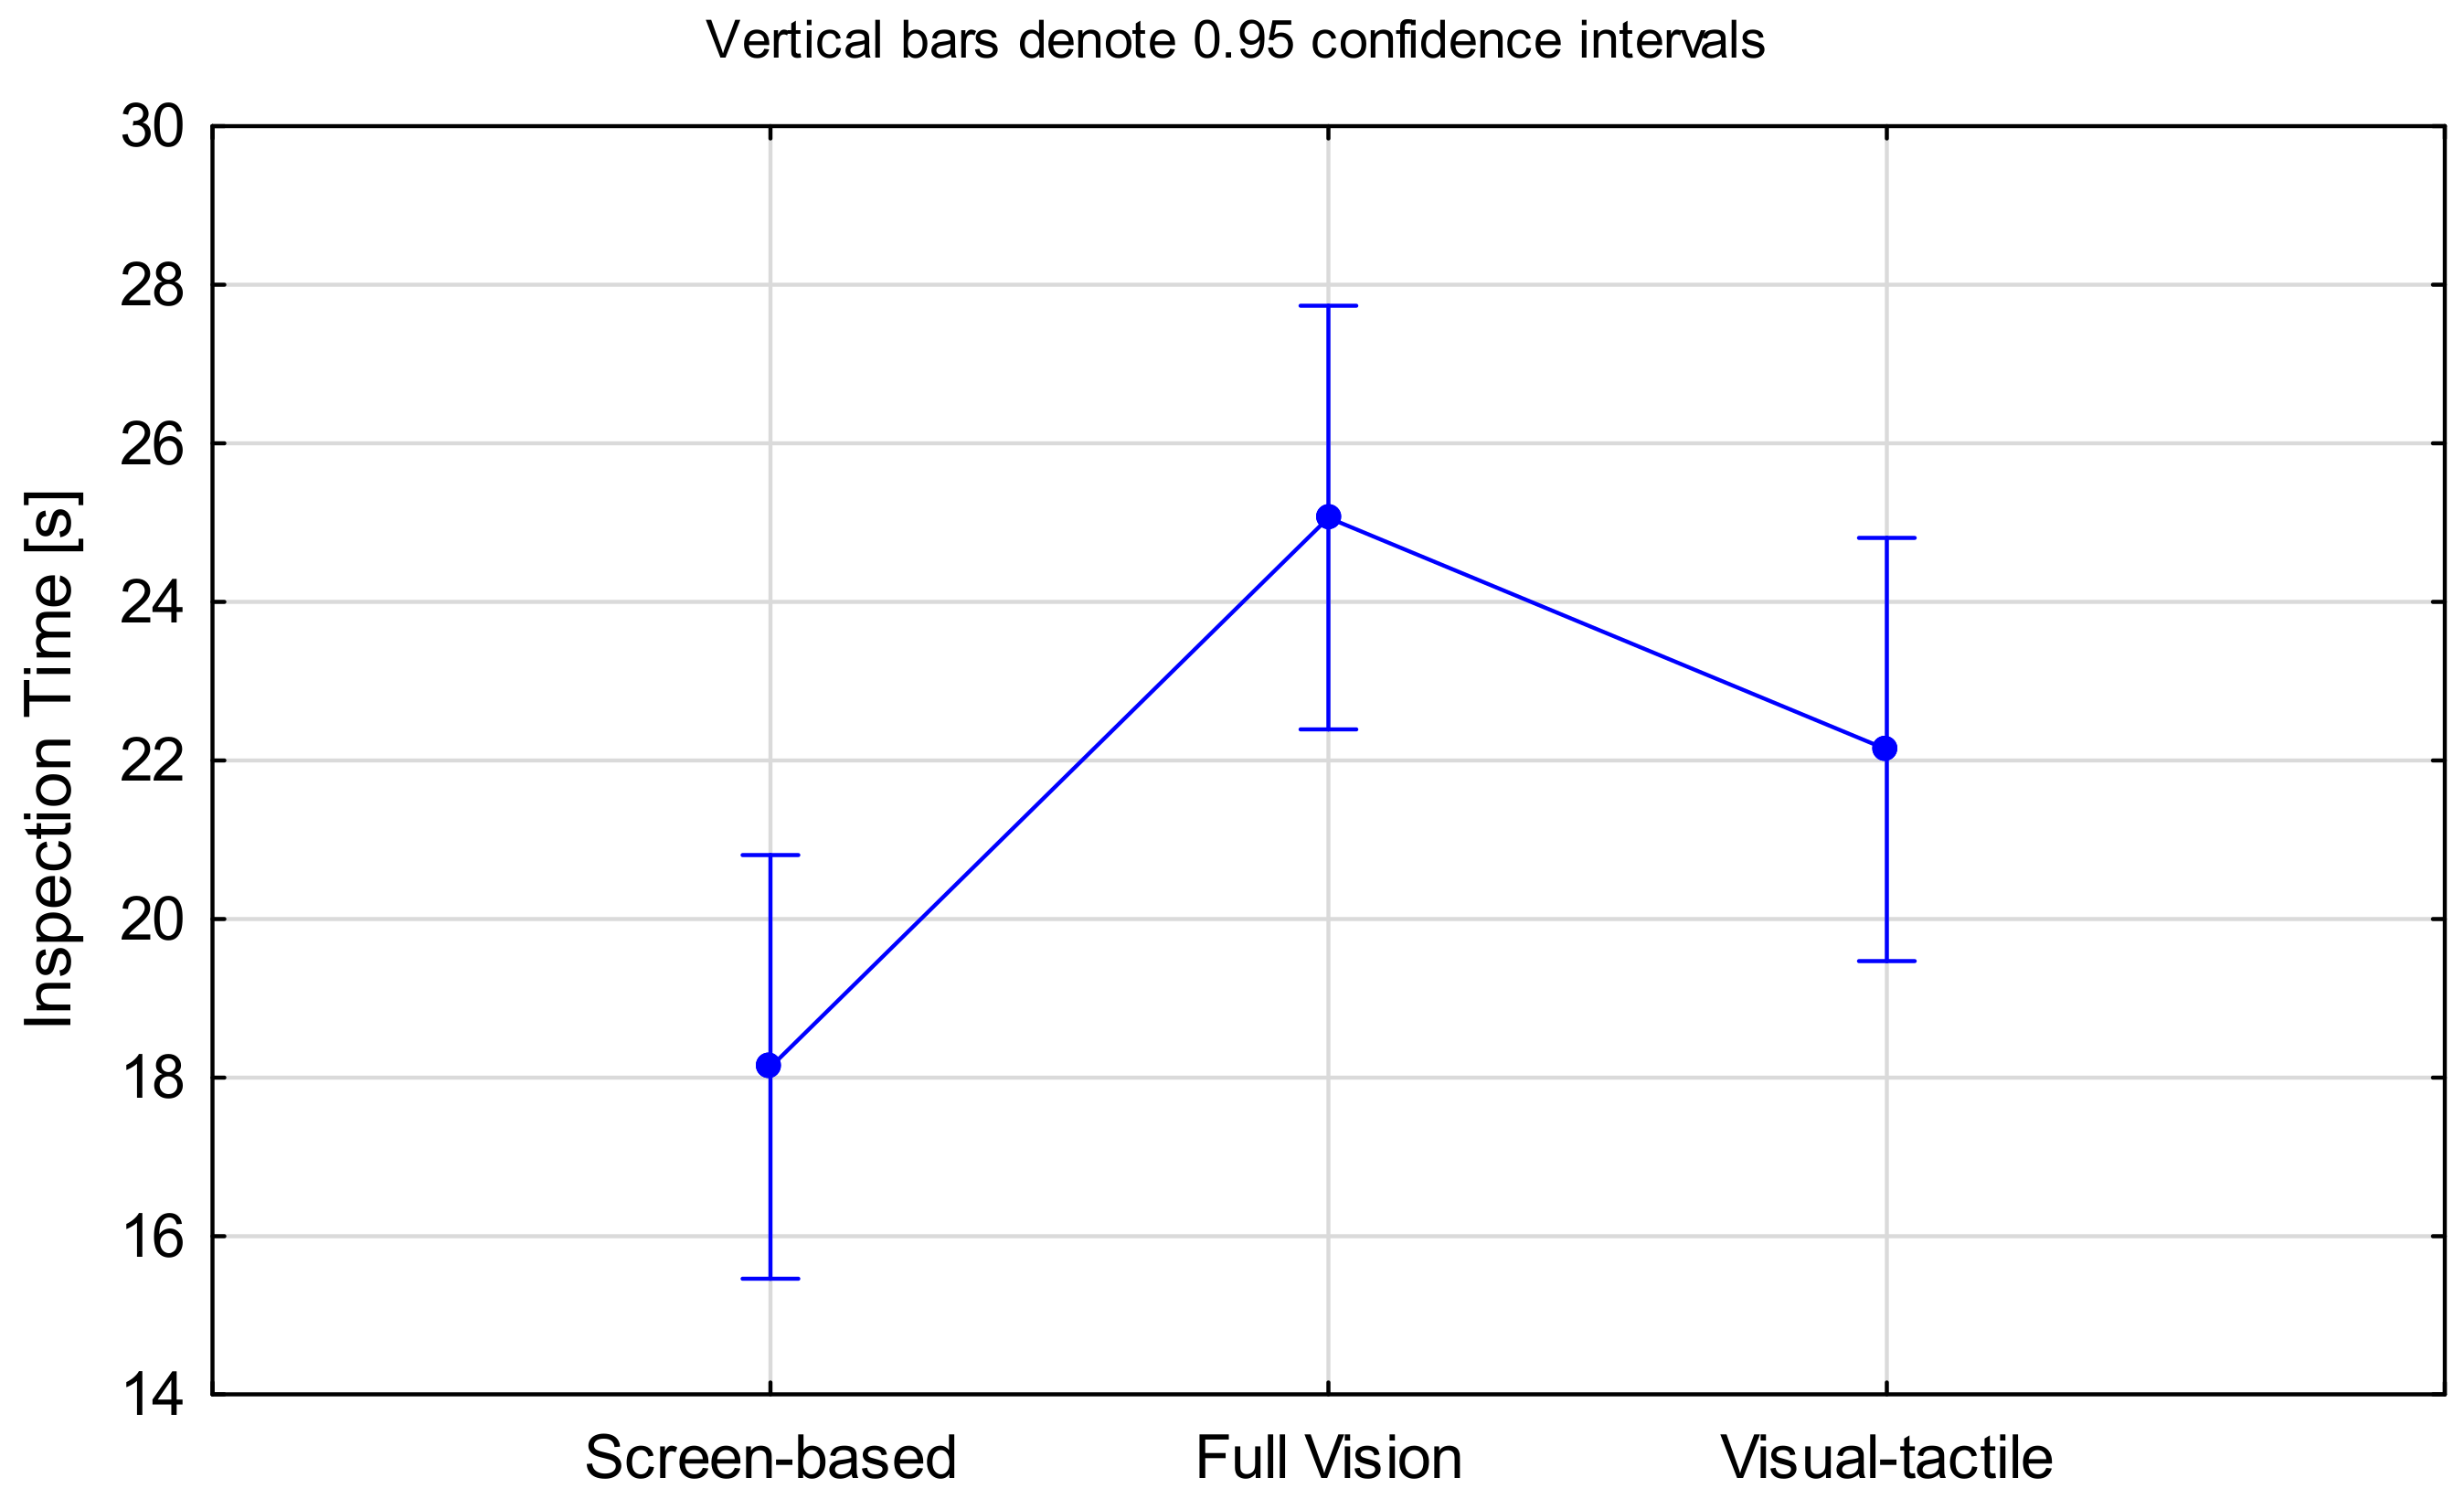
4.1.2. Inspection Time

The mean inspection times of each participant for each inspection method are reported in Table 4. It should be noted that from an operational perspective, a shorter inspection time is favoured.
A statistical analysis was performed on inspection method and inspection time. The Kruskal–Wallis test showed significance, H(2) = 14.15, p = 0.001. As presented in Figure 4, screen-based inspection had the shortest inspection time (median = 13.897), followed by visual–tactile inspection (median = 15.495), while the full vision inspection required most time (median = 21.070). This is not surprising, since the latter two led to infinite possibilities of viewing angles and distances, and thus unlimited perspectives. Each perspective needed to be processed visually and cognitively, and a decision had to be made whether a defect is present on the blade from that perspective. This is likely to have caused longer inspection times. The visual–tactile inspection was on average three seconds (12%) shorter than the full vision inspection. Thus, tactile ability seems to have had a supporting effect on the search and decision-making process.
Dunn’s pairwise tests were carried out for the three inspection methods. There was evidence (p = 0.001, adjusted using the Bonferroni correction) that screen-based inspection was significantly faster than full vision inspection. Likewise, visual–tactile inspection was shorter than full vision inspection, p = 0.021. There was no statistical evidence for a difference between screen-based and visual–tactile inspections.
We also considered another possible reason for the shorter inspection time in the screen-based inspection, i.e., that this inspection method showed the lowest inspection accuracy (see Section 4.1.1) and thus fewer defect markings. A subsequent analysis was performed to test whether inspection time was correlated with inspection accuracy. Pearson’s R showed a significant and negative correlation, r(468) = −0.094, p = 0.041. Correct detections took on average less time, despite the additional marking time, than incorrect decisions without defect marking (Figure 5). Thus, the reasoning that screen-based inspections were significantly shorter because of the low inspection accuracy in this method was not supported.

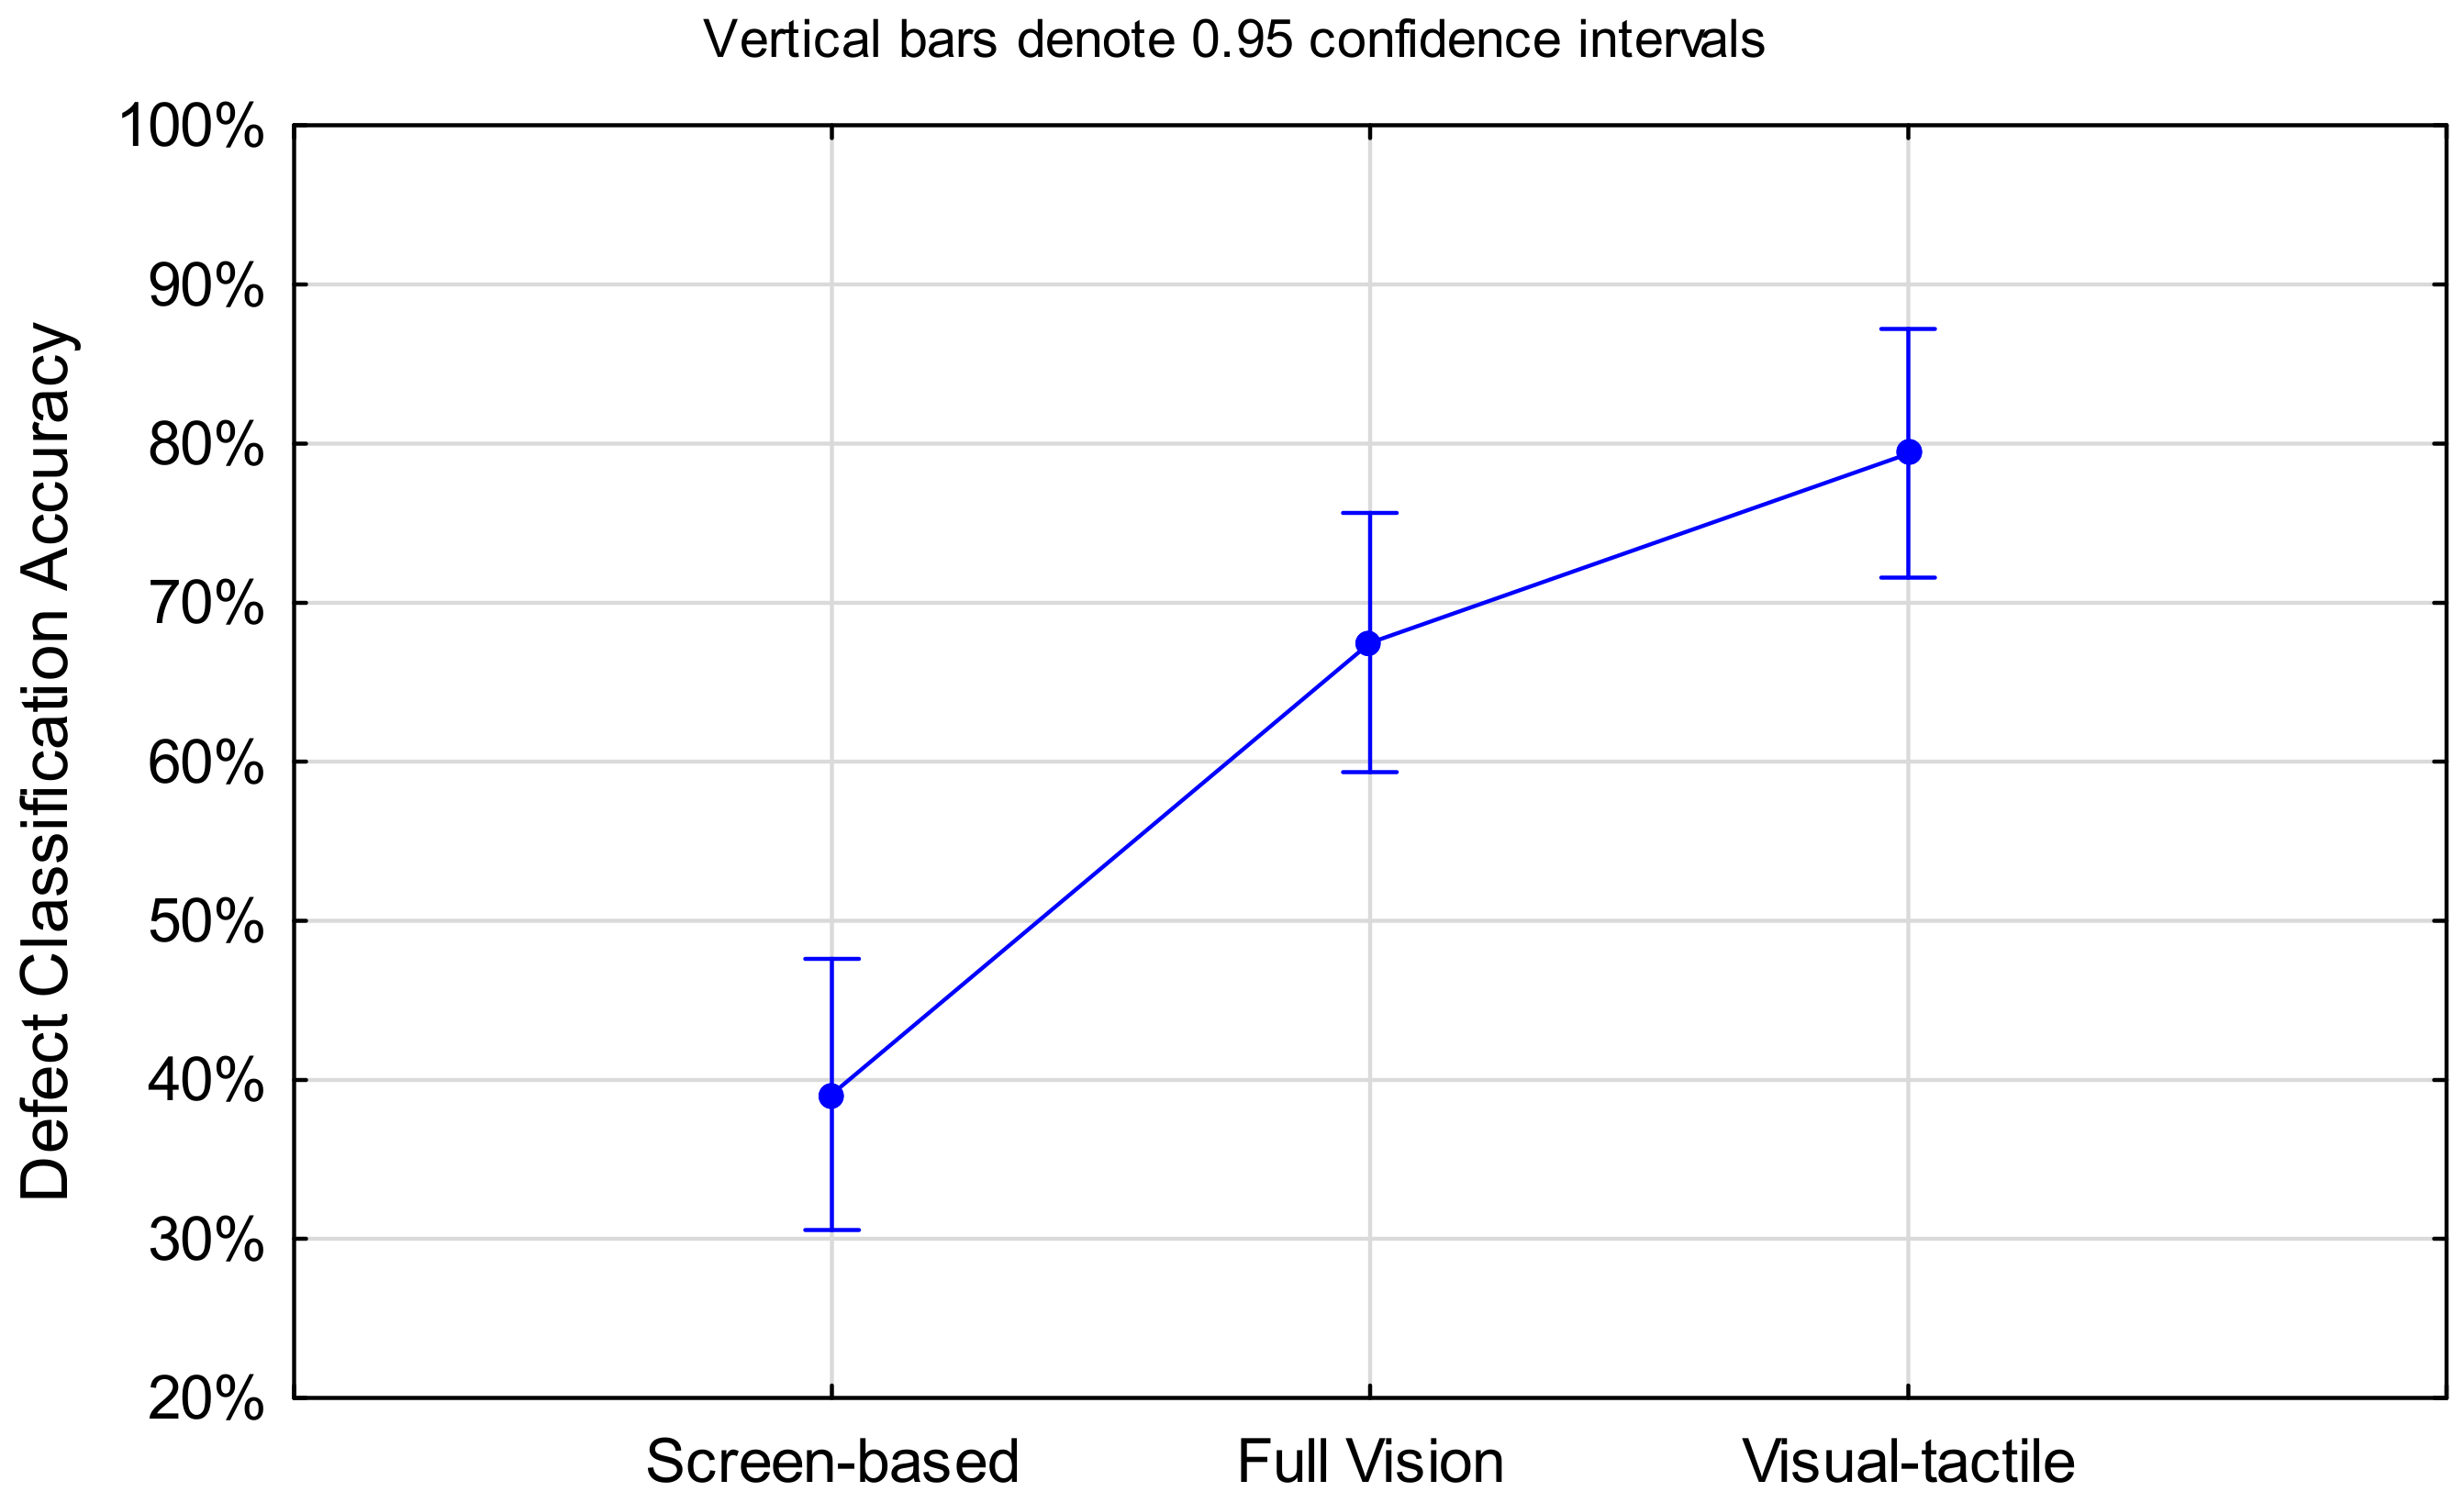
4.1.3. Defect Classification Accuracy

The defect classification accuracies of each participant and for each inspection method are shown in Table 5. The results indicated that defect classification accuracy improved from screen-based through visual–tactile inspection. The only exception for whom classification accuracy worsened was Engineer 2 in the full vision inspection. This aligns with the findings in Section 4.1.1, in which this participant also showed a decreased inspection accuracy in the same experiment. As noted previously, this could be due to daily performance, which might have varied between the experiments.
In the screen-based inspection, 39.1% of defects were correctly classified, while the full vision and visual–tactile inspections showed higher classification rates of 67.5% and 79.4%, respectively (Figure 6). The medians were 100% for all three inspection methods. The effect of the inspection method on the defect classification accuracy was tested with the Kruskal–Wallis test and was significant, H(2) = 43.067, p < 0.001. Subsequent post hoc testing showed that differences occurred between screen-based and full vision inspections (p < 0.001) and between screen-based and visual–tactile inspections (p < 0.001). Viewing the blades from different perspectives, touching the blades, and feeling the defect shapes may have allowed for better differentiation between often-confused defect types such as nicks and dents (further discussed in Section 4.2.3).

4.2. Hypothesis H2 Testing

The following section presents our investigation of whether the defect type affected inspection performance measured in inspection accuracy, inspection time, and defect classification accuracy.

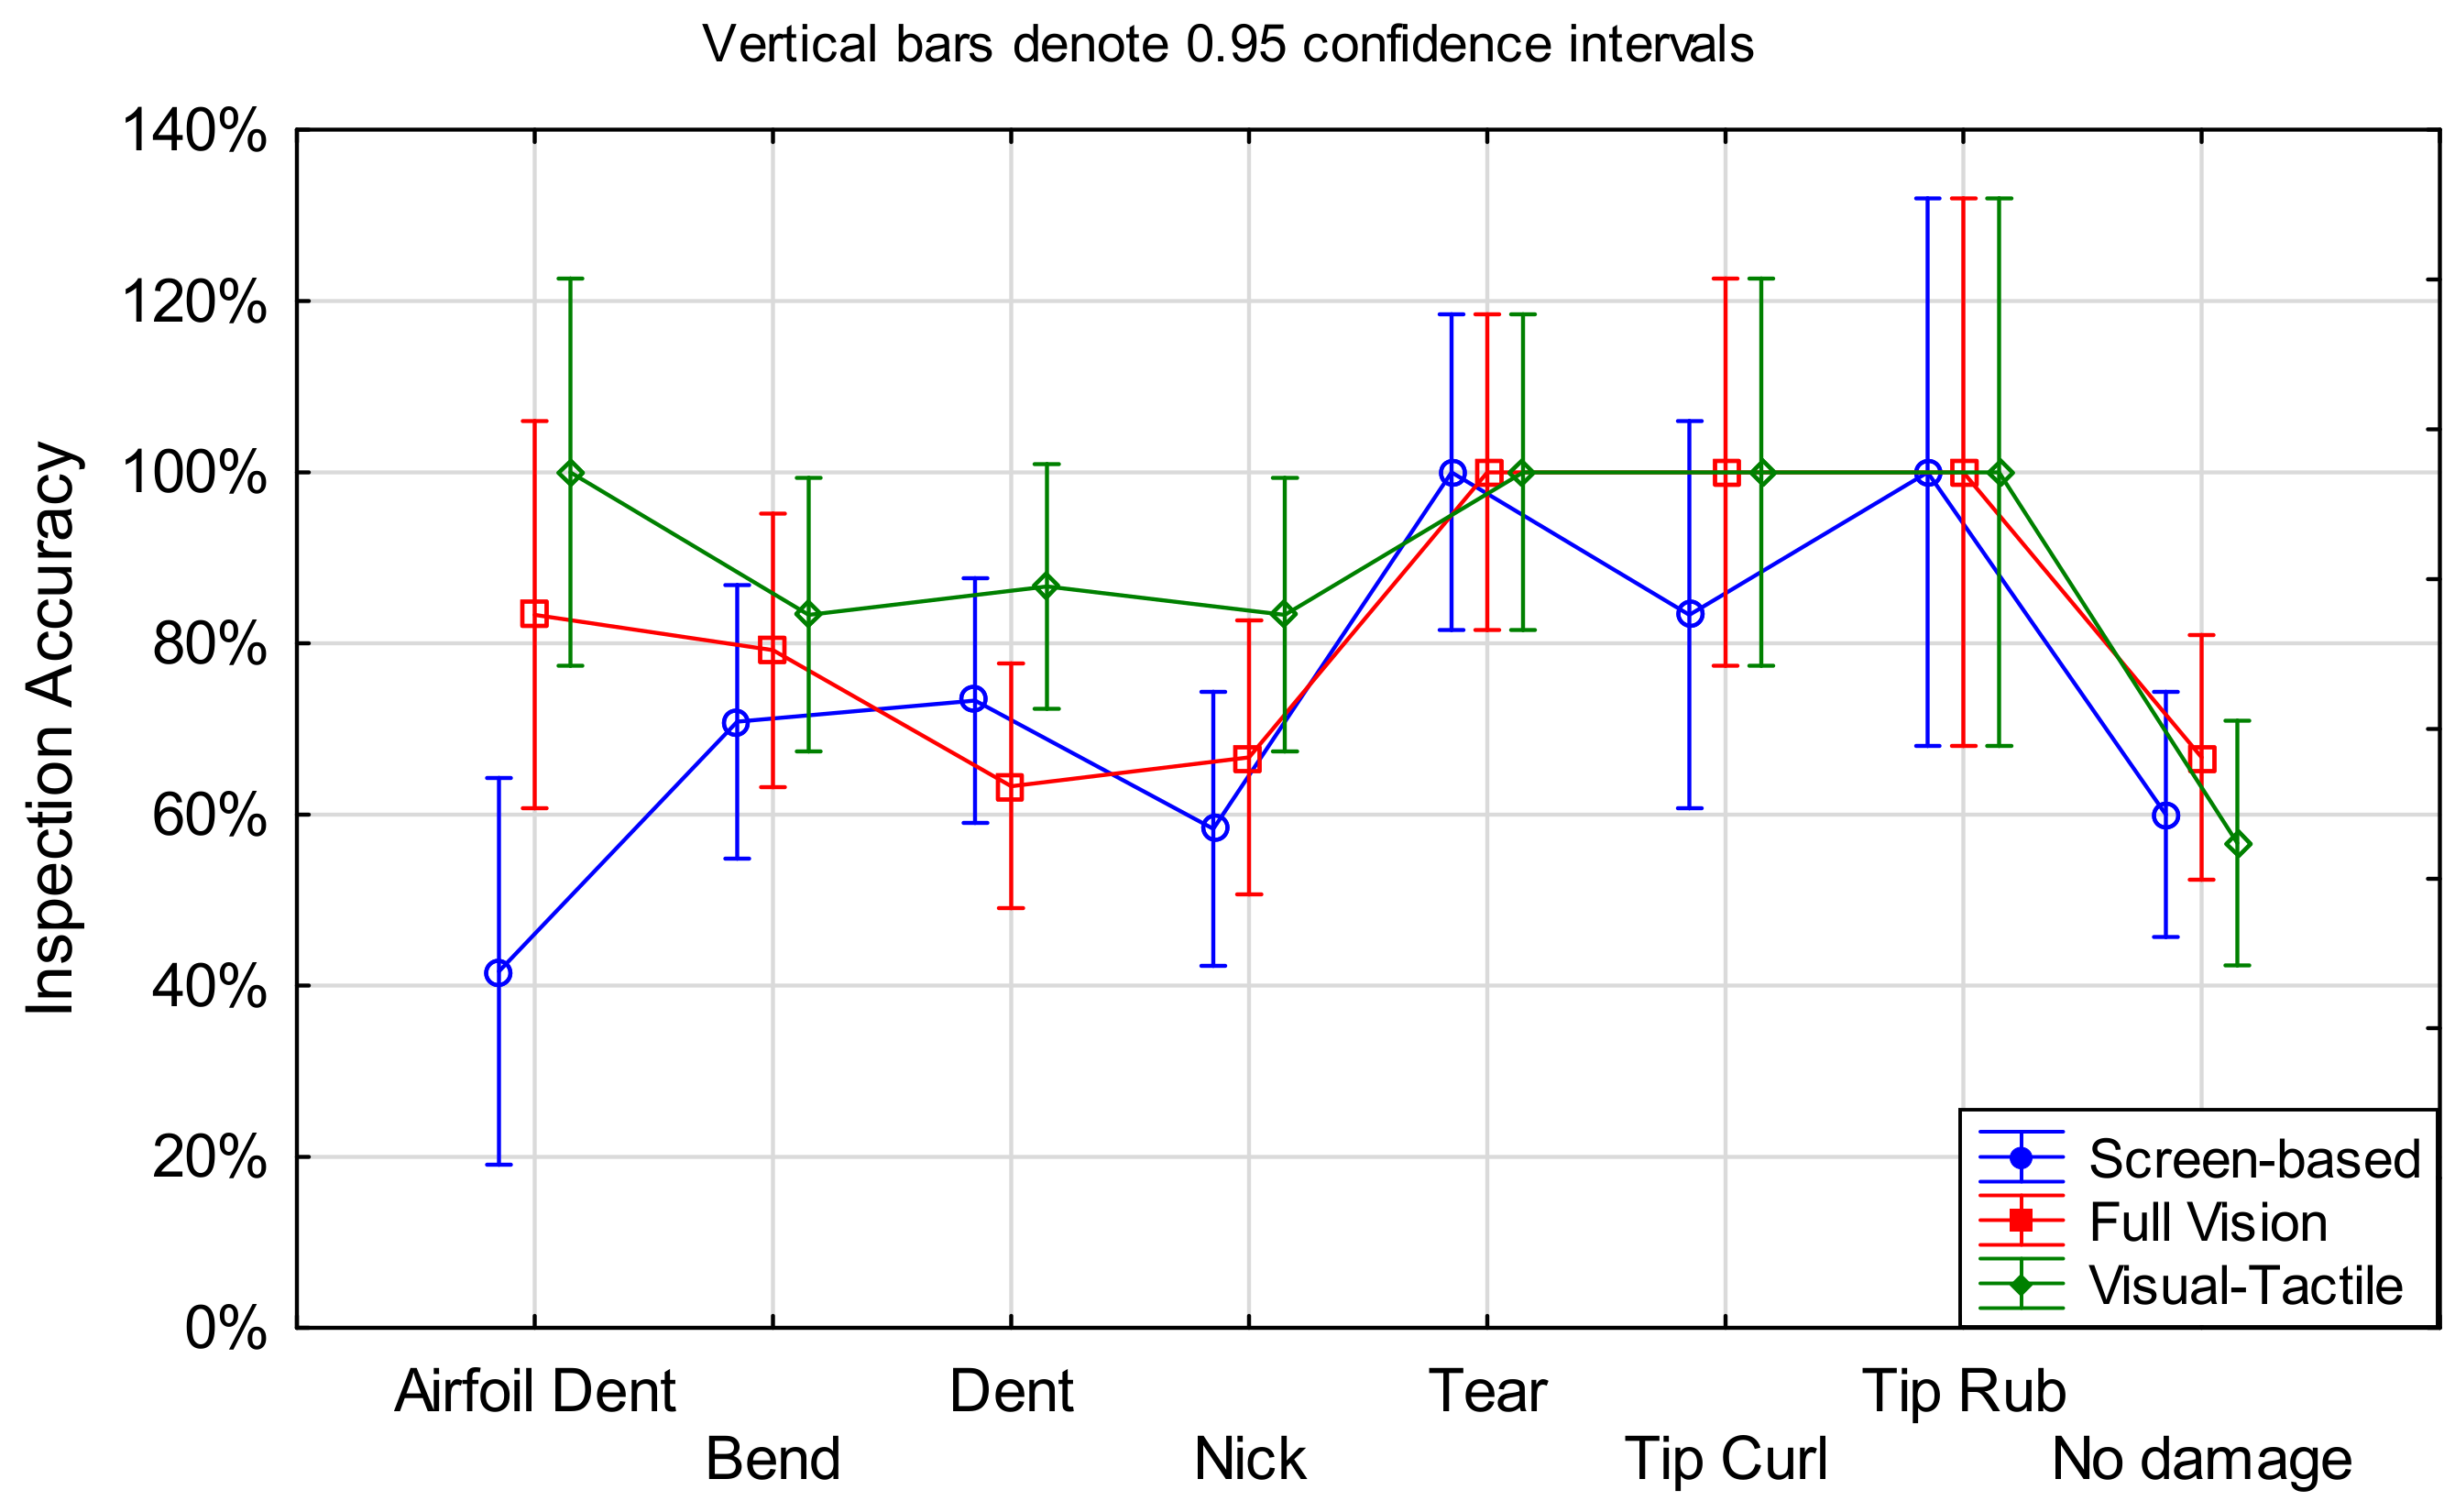
4.2.1. Inspection Accuracy

The inspection rates of each inspection method grouped by defect type, including non-damaged blades, are presented in Table 6.
All defects were more likely to be detected with increasing inspectability (screen-based < full vision < visual–tactile) (Table 6). This supports hypothesis H1 in Section 4.1.1. The greatest detection increase was noted for airfoil dents. For this defect type, the perception of depth plays a crucial role, which was given only in the full vision and visual–tactile inspections.
There was one exception for which inspection accuracy decreased in the visual–tactile inspection, and that was non-defective blades. While inspection accuracy improved from screen-based to full vision inspection, it declined from the full vision to the visual–tactile inspection. This indicates an increasing false-positive rate; i.e., participants removed more non-defective blades from service than they should have. A possible cause might be that the participants felt some irregularities in the surface that were residuals from operation but did not warrant unserviceability. While a high false-positive rate is not safety critical, it does induce needless maintenance and repair costs to the MRO provider.
It stands out that the easiest defects to detect were tears, tip curls, and tip rubs, with a 100% detection rate in almost all three inspection methods. Those were the defects with the most salient visual appearance and were also the most severe defects [23]. Tears imply the greatest risk as far as safety is concerned, since they have a high chance to propagate, cause material separation, and subsequent damage of the engine. As this experiment showed, the risk of missing a tear is quite low, and thus the risk score L i k e l i h o o d   o f   m i s s i n g   a   d e f e c t × C o n s e q u e n c e   t h i s   d e f e c t   i m p l i e s is low. Nicks, however, can propagate to cracks and also cause material separation with equally severe consequences. The data showed that the detectability of nicks was among the lowest for the defects studied. This is concerning from a safety perspective.
To find out whether there was significant differences in inspection accuracy between the different defect types, a Kruskal–Wallis H test was carried out, H(7) = 43.36, p < 0.001. Subsequent pairwise comparisons revealed that inspection accuracy was significantly higher for tears (p < 0.001), tip curls (p = 0.002), and tip rubs (p = 0.01) when compared to non-defective blades. Moreover, tears had a higher detection rate than nicks (p = 0.002) and dents (p = 0.012). No other significant differences were found after Bonferroni adjustment (all p > 0.093). TA mean plot of inspection accuracy by defect type is shown in Figure 7.

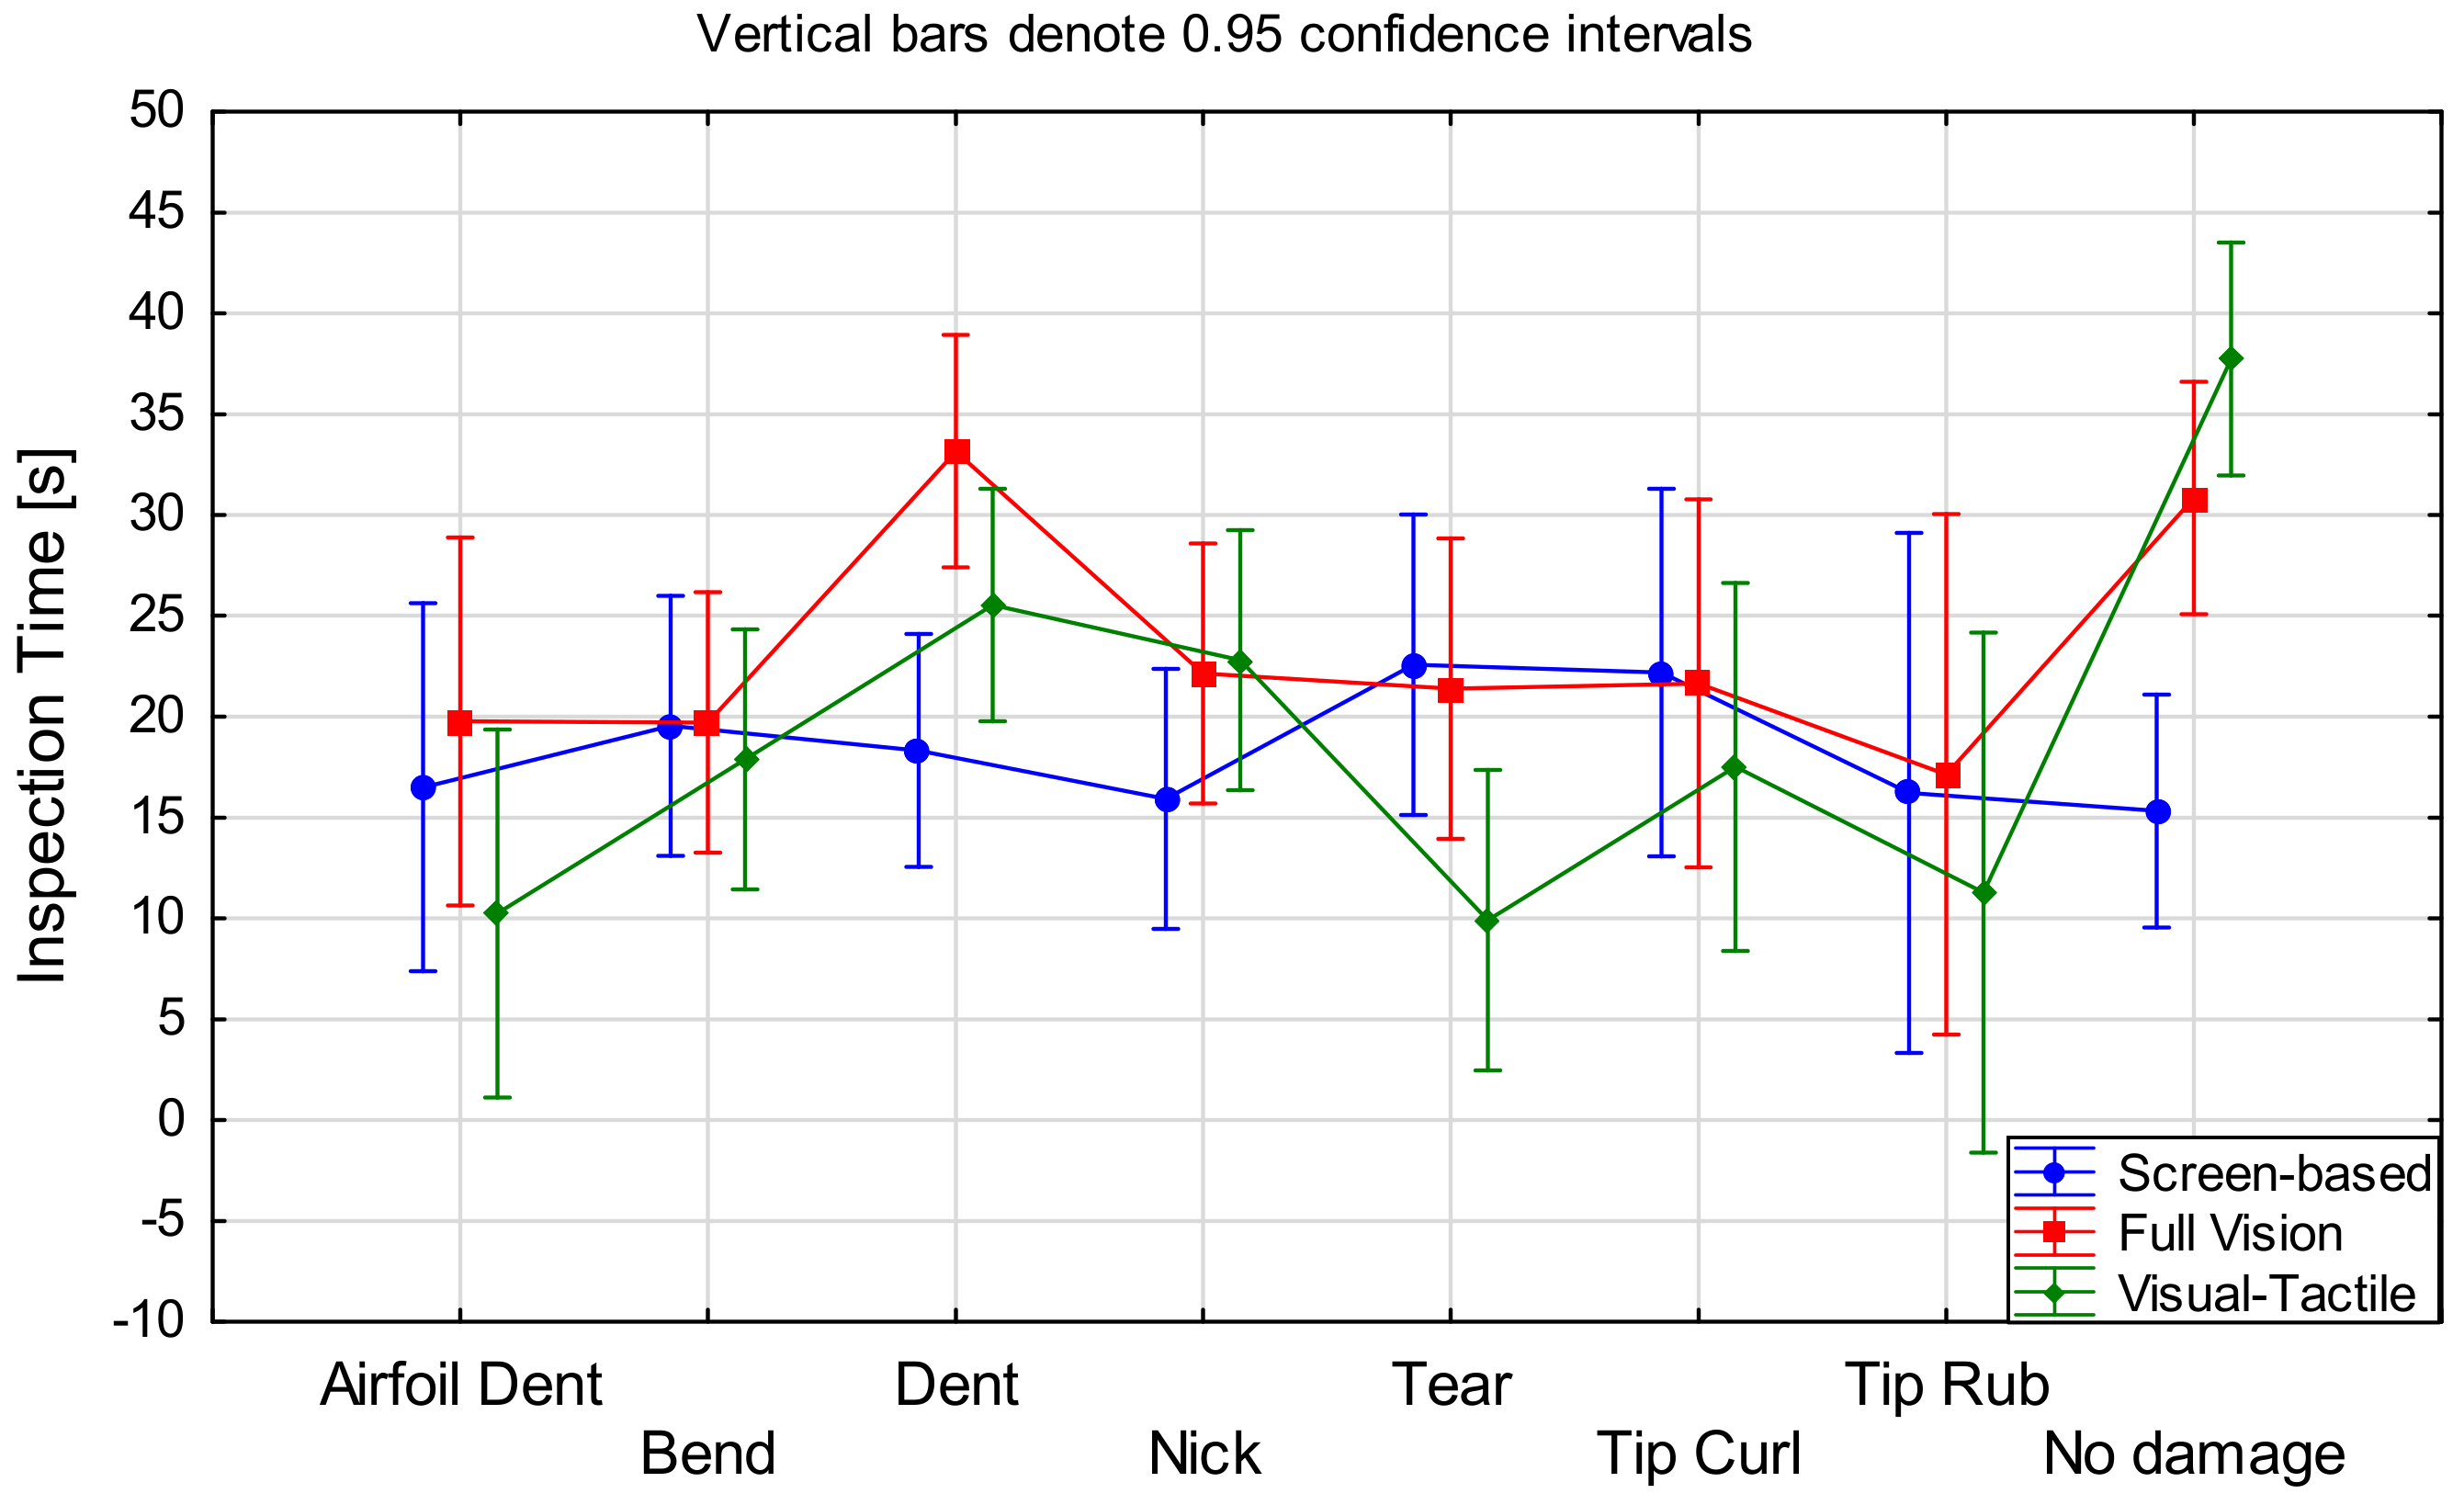
4.2.2. Inspection Time

An overview of the resulting inspection times of each inspection method grouped by defect type is presented in Table 7.
A review of the results showed that the detection of airfoil dents in screen-based and full vision inspection took almost twice as long as in the visual–tactile inspection. This is somewhat surprising, because as shown in Table 6 above, inspection performance also improved significantly through the latter method. The tactile component seemed to have the greatest effect on both inspection accuracy and inspection time, and thus on the efficiency of the inspection task as a whole.
There was a significant difference noted in inspection time for the different defect types, H(7) = 24.74, p = 0.001. As the mean plot of the inspection time in Figure 8 shows, non-defective blades and dents took the longest time to inspect with 28.0 s and 25.6 s, respectively. The Bonferroni test showed that both, non-defective blades (p = 0.005) and dents (p = 0.025) took significantly longer compared to airfoil dents. No other significant differences were noted.

4.2.3. Defect Classification Accuracy

Defect classification accuracies for the different defect types are listed below (Table 8). Non-defective blades were always correctly classified following a correct serviceability decision. The reason for this is that there was only one category for non-defective blades, but seven for defective ones. For the sake of completeness, classification accuracies for non-defective blades were also included in our analysis.
As the results highlighted, the classification accuracy improved for all defect types except one from the screen-based through the visual–tactile inspection. The biggest difference was noted for airfoil dents, bends, dents, and nicks, while the inspection method had only little impact on the classification accuracy of tears, tip curls, tip rubs, and nondefective blades (see Figure 9). Further statistical tests confirmed that there was a correlation between defect type and defect classification accuracy, H(7) = 98.327, p < 0.001. Bonferroni testing confirmed that the classification accuracy for tears was significantly lower than those for airfoil dents, bends, tip curl, tip rub, and non-damaged blades (all p ≤ 0.002). Furthermore, there was statistical evidence that dents showed a worse classification accuracy than bends, tip rub, airfoil dents, and non-damaged blades (all p ≤ 0.009). Finally, nicks were more challenging to classify compared to tip rub (p < 0.023) and non-defective blades (p < 0.001).
Tears were frequently confused with breakage, particularly when a piece of the blade was torn off. Since tears showed a 100% detection rate in all inspection methods, no tears were missed. Confusing tears with material separation (breakage) or cracks is not of great concern, since the maintenance and repair actions are the same for all three defect types.
Tip curl was often confused with bends, since the appearance of these defects is somewhat similar. The difference between the two is the initial cause of the defect. While tip curls stem from rubbing of the tip against the liners and hence are generally accompanied by some tip rub, bends, in contrast, are typically caused by impact damage from dull foreign objects. Both defects can be repaired using blending as far as repair limits allow, and thus misclassification is not drastic.
More problematic was the low classification accuracy of nicks and dents, which were often confused with one another. It is important to differentiate between the two defect types because of the different risks each type implies. While a dent typically does not lead to any negative consequences, except some negligible deterioration of the airflow, a nick can propagate into a crack, which can cause material separation and subsequent damage to the engine and aircraft. The main difference in appearance is that dents only show material deformation, while a nick also shows some material loss [24]. Dents have smooth bottoms with rounded edges, while nicks are characterised by a sharp v-shaped bottom [24]. The ability to touch the blade in the visual–tactile Inspection led to more accurate defect classifications (improvement of 103% and 17.6% compared to screen-based and full vision, respectively) and thus played a crucial role in inspecting blades.

4.3. Hypothesis H3 Testing

Because of the small research population (further discussed in Section 5.3), it was not possible to apply statistical methods. Therefore, a semiqualitative analysis was performed in order to obtain preliminary evidence that would validate a subsequent and more comprehensive analysis with a larger research population.

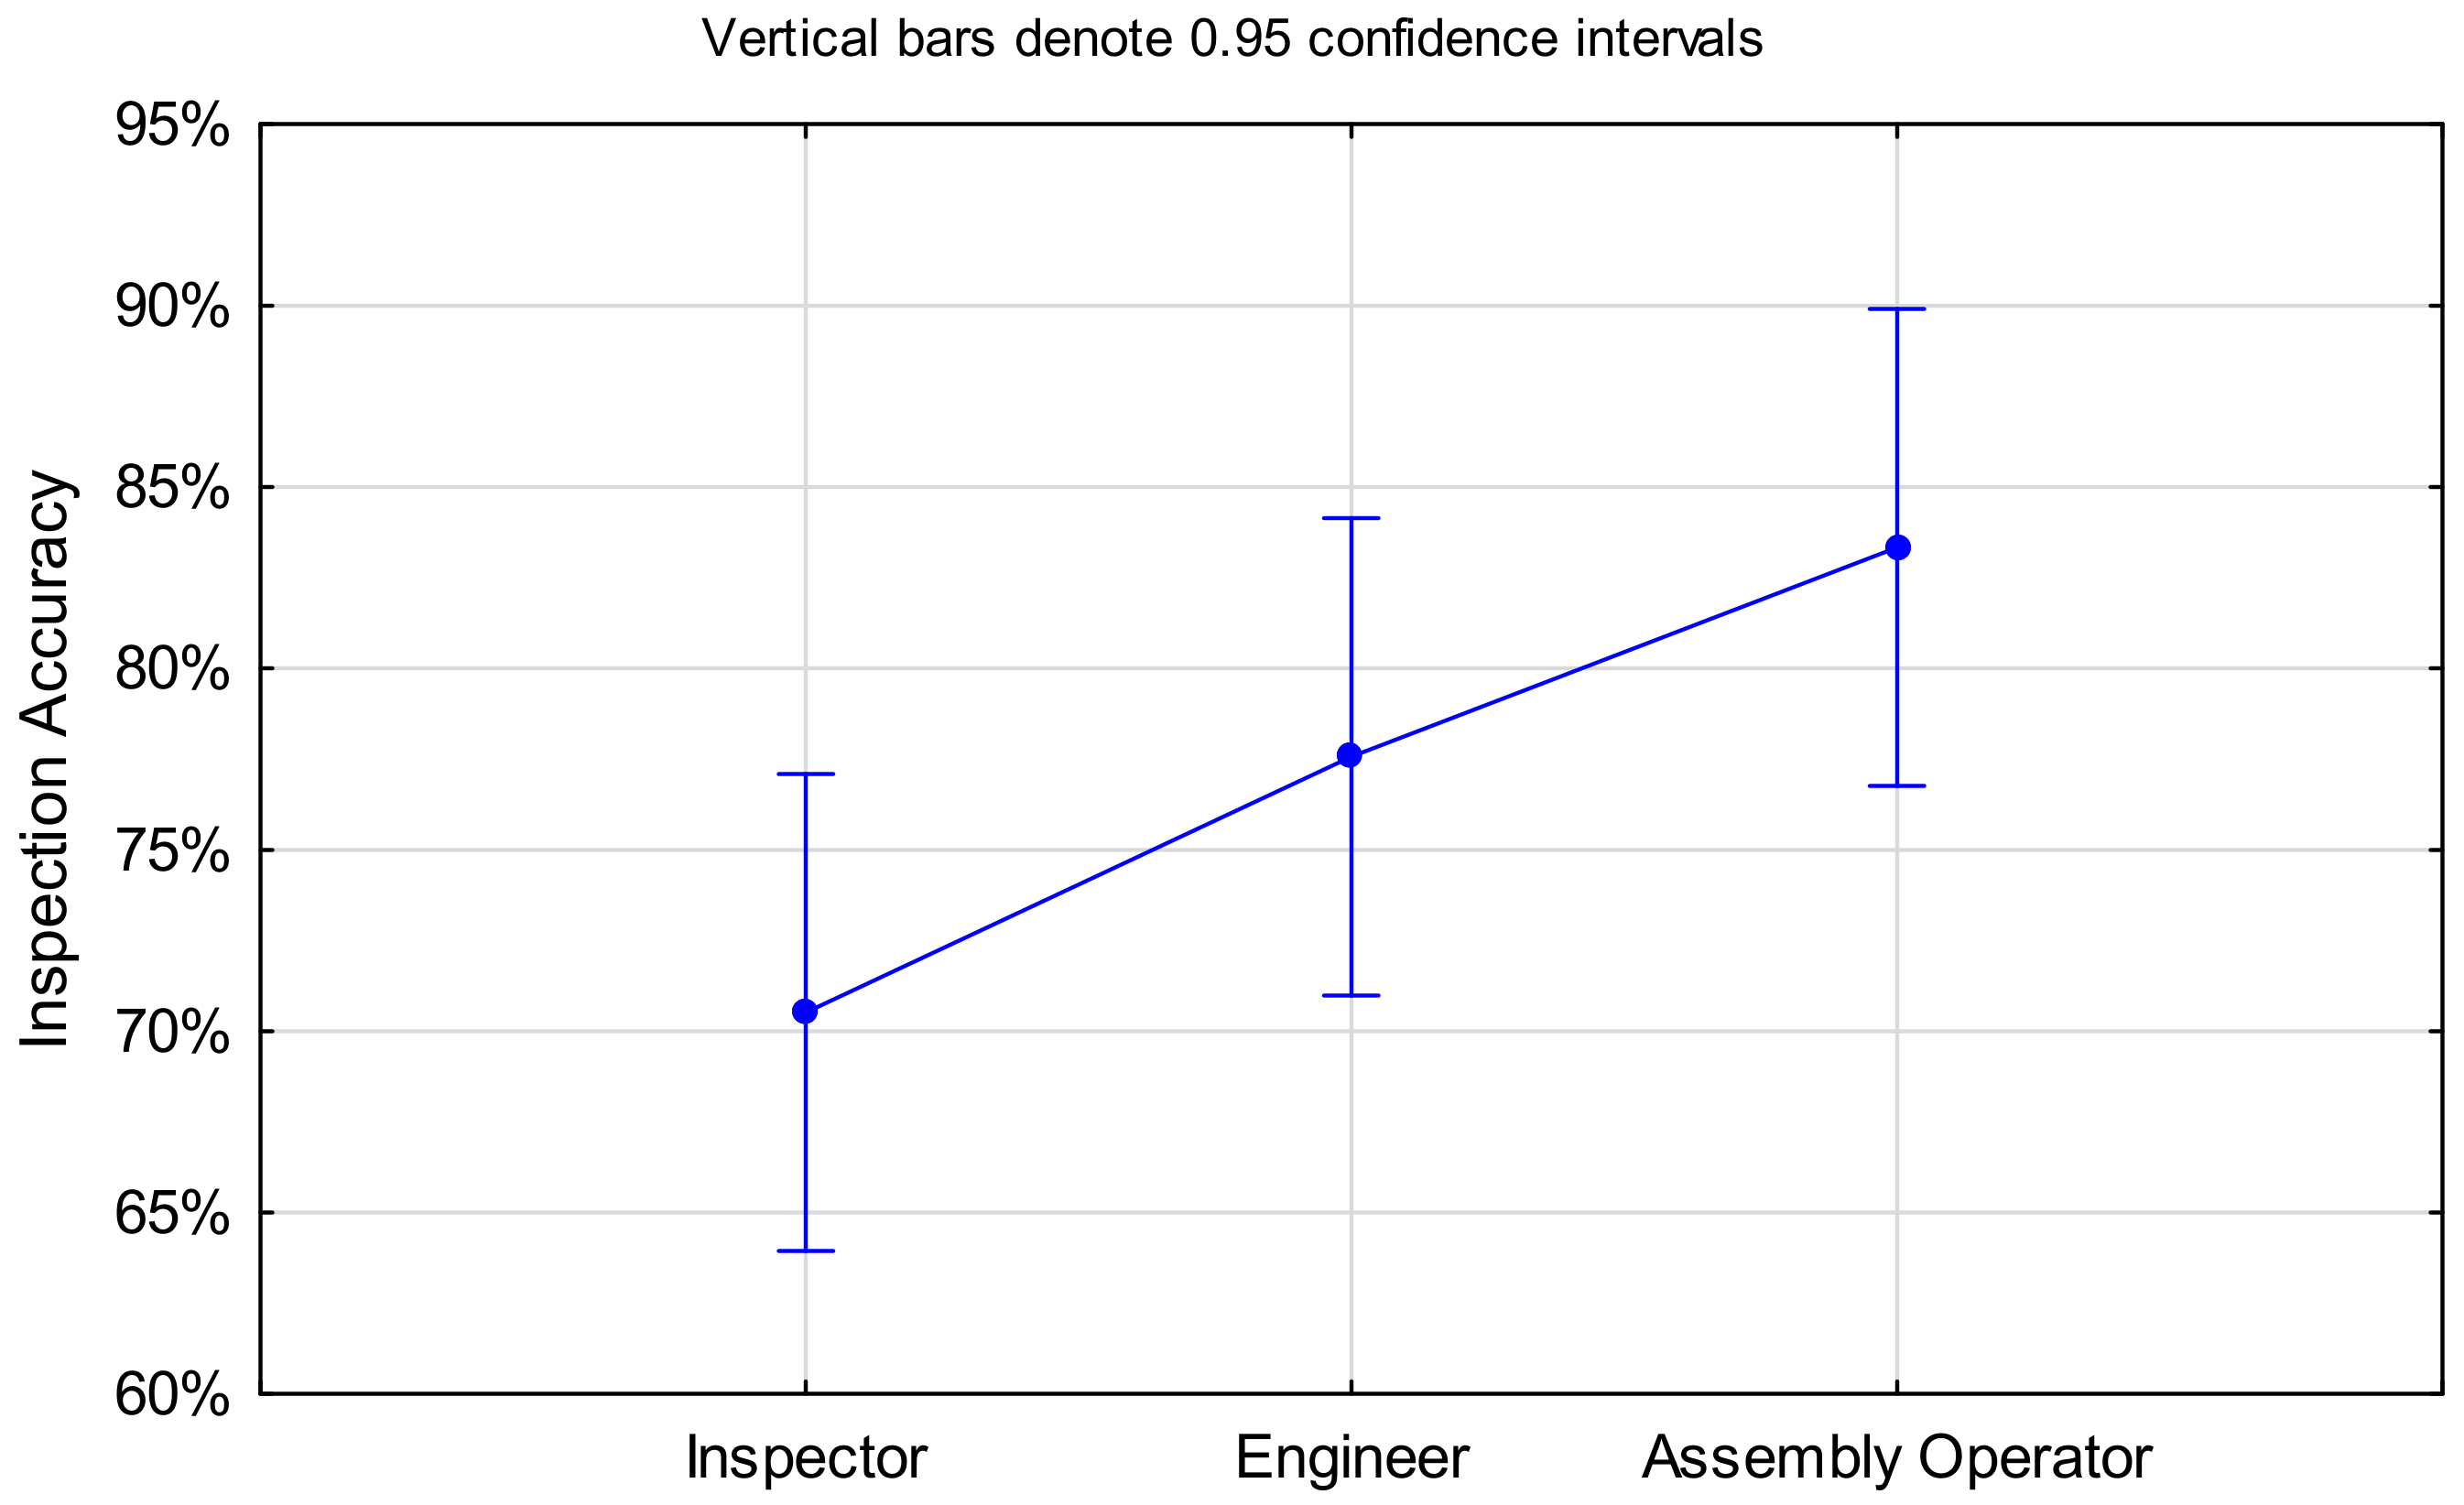
4.3.1. Inspection Accuracy

A mean plot of inspection accuracy for the three groups of expertise (Figure 10) showed that on average, assembly operators performed best with 83.3% accuracy, followed by engineers with 77.6% and inspectors with 70.5%. This is the reverse order of what we would have expected to see. It is reemphasised that the research population was small, and thus the results are tentative. It could be worthwhile to investigate this further with a larger study group to see whether this trend can be confirmed.

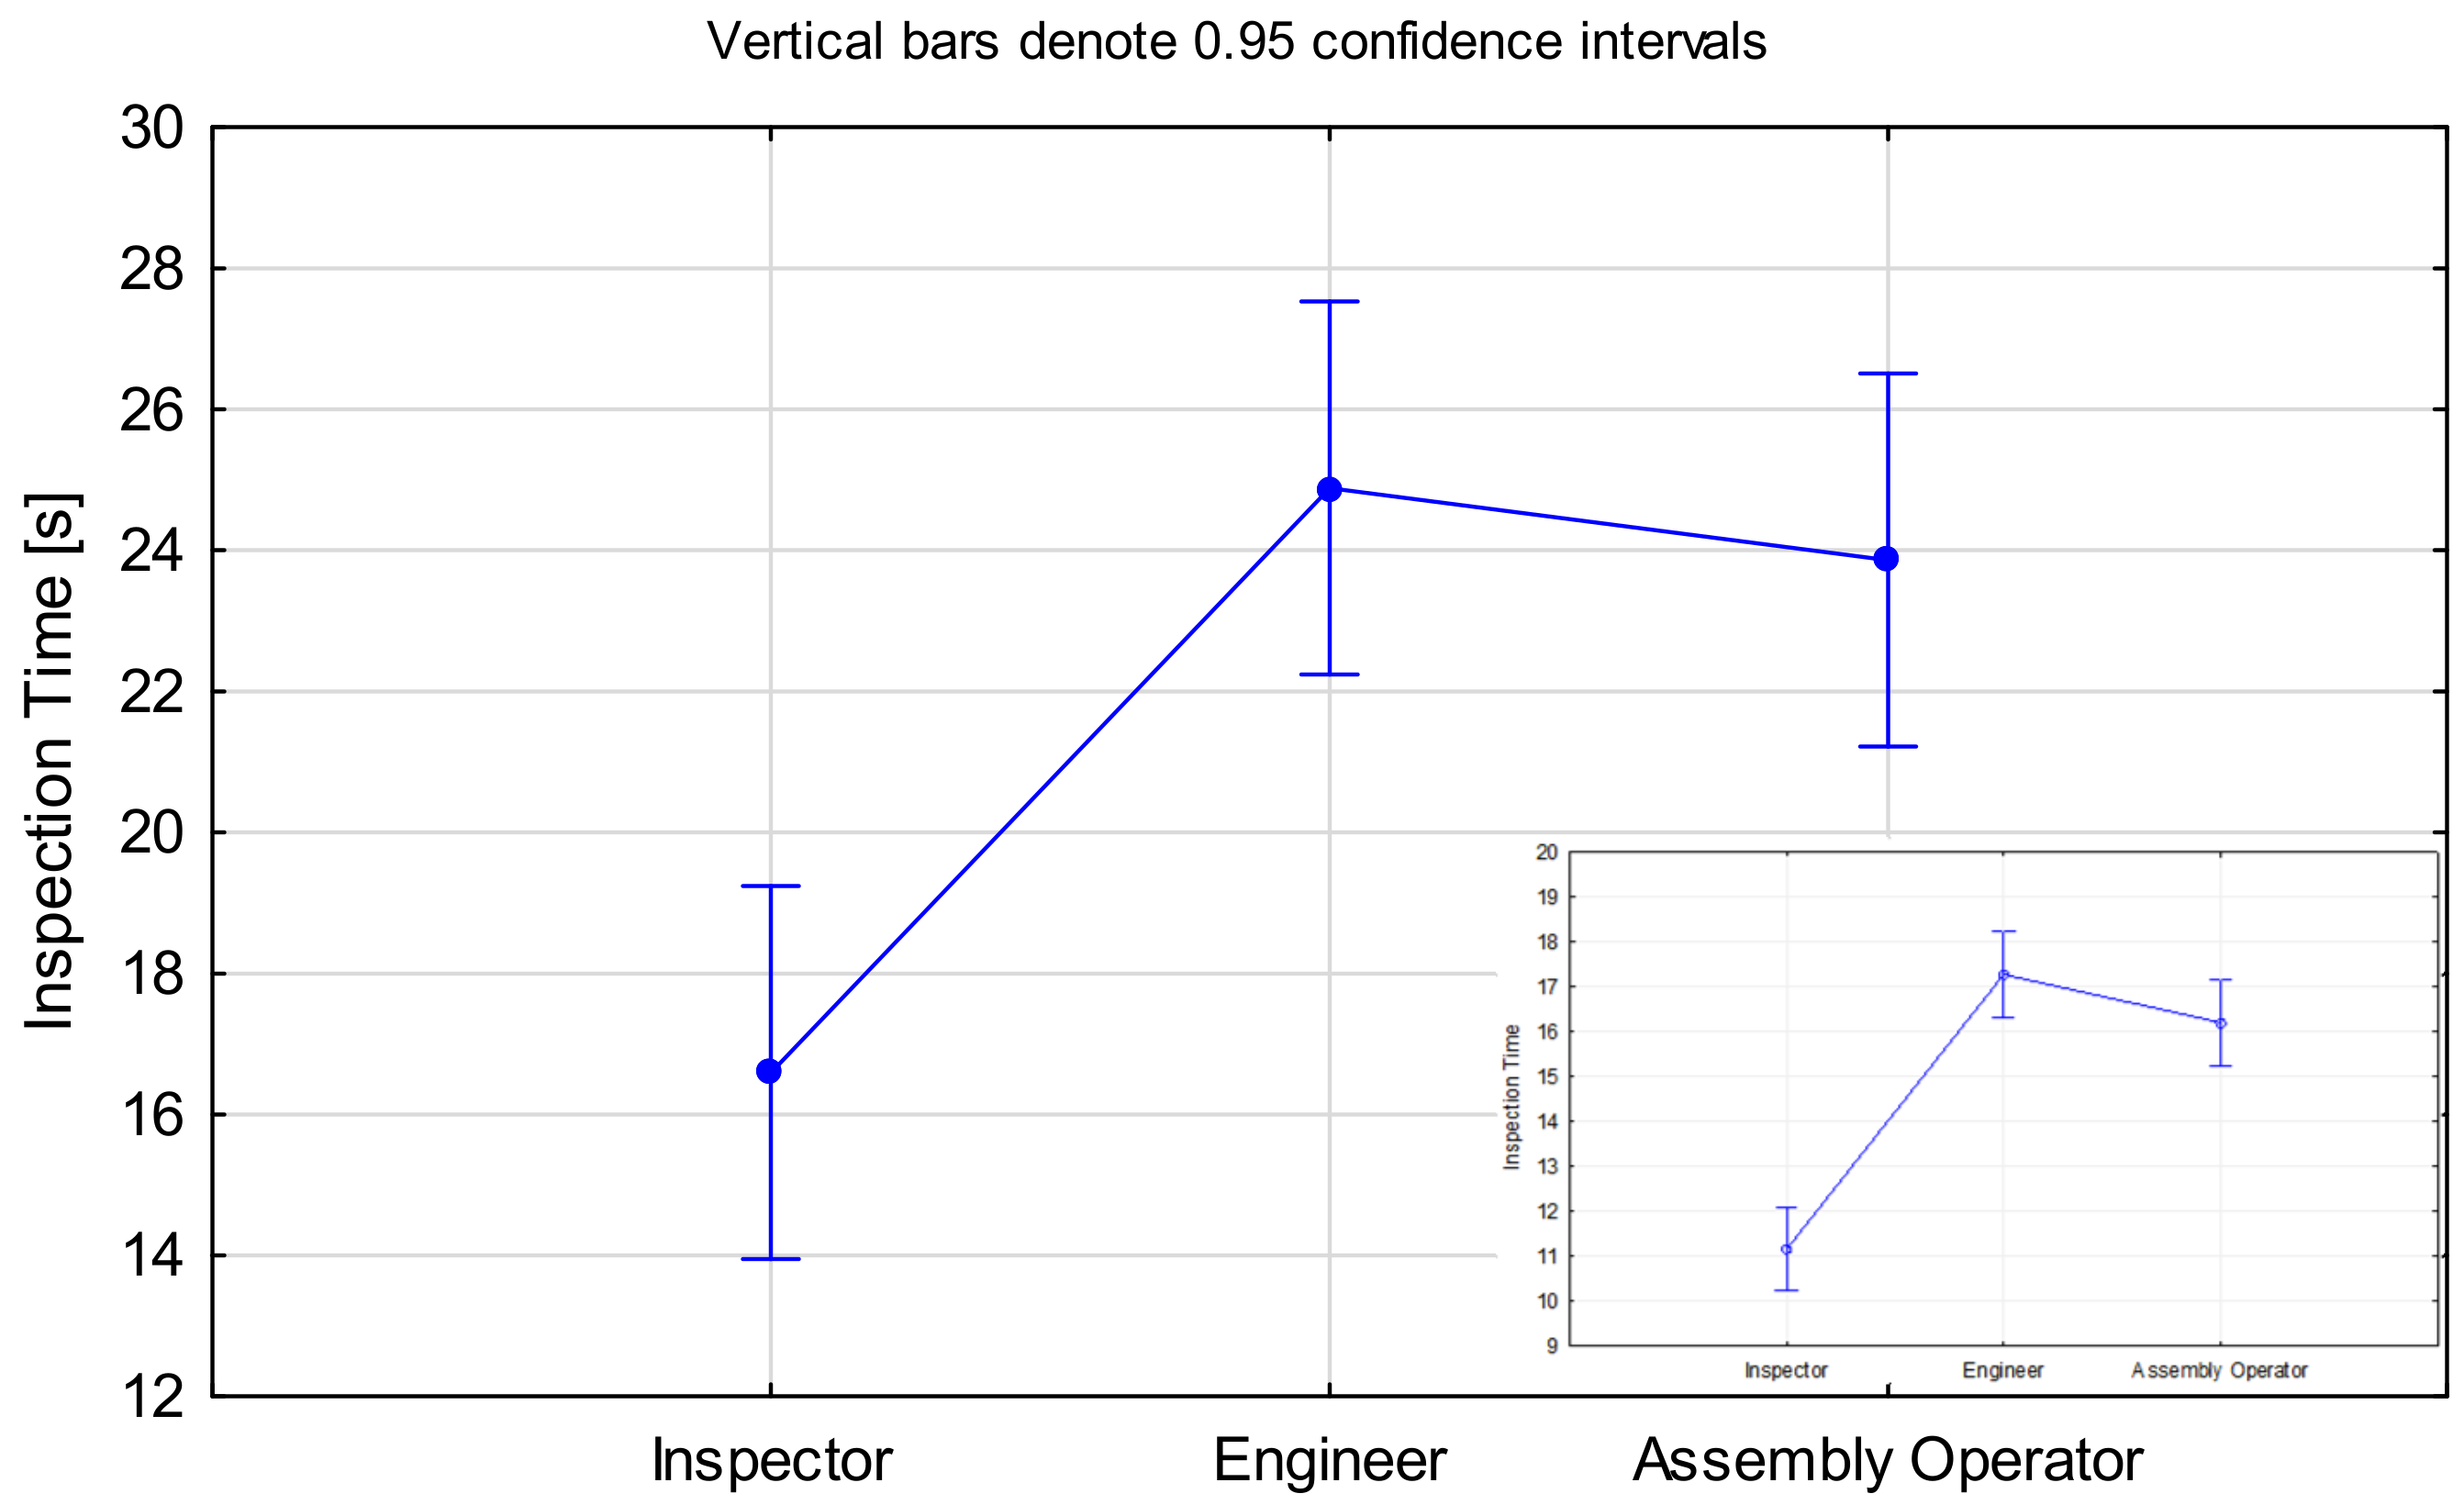
4.3.2. Inspection Time

Inspectors performed, on average, faster than engineers and assembly operators; the three groups had mean inspection times of 16.592 s, 24.884 s, and 23.861 s, respectively (Figure 11). This supports previous findings [6]. The average inspection times were overall longer in comparison to our previous study, since the blades could be viewed from different perspectives in the present study, while the results in [6] represented screen-based inspection only. For illustration purposes, the results of our previous study were added as a small graph at the bottom right of Figure 11. The proportions among the three groups of expertise were approximately the same in [6] and the present research. This implies that factors influencing the inspection, such as cleanliness [6] or inspection method, may have had little effect on the performance of the different groups in terms of inspection time.

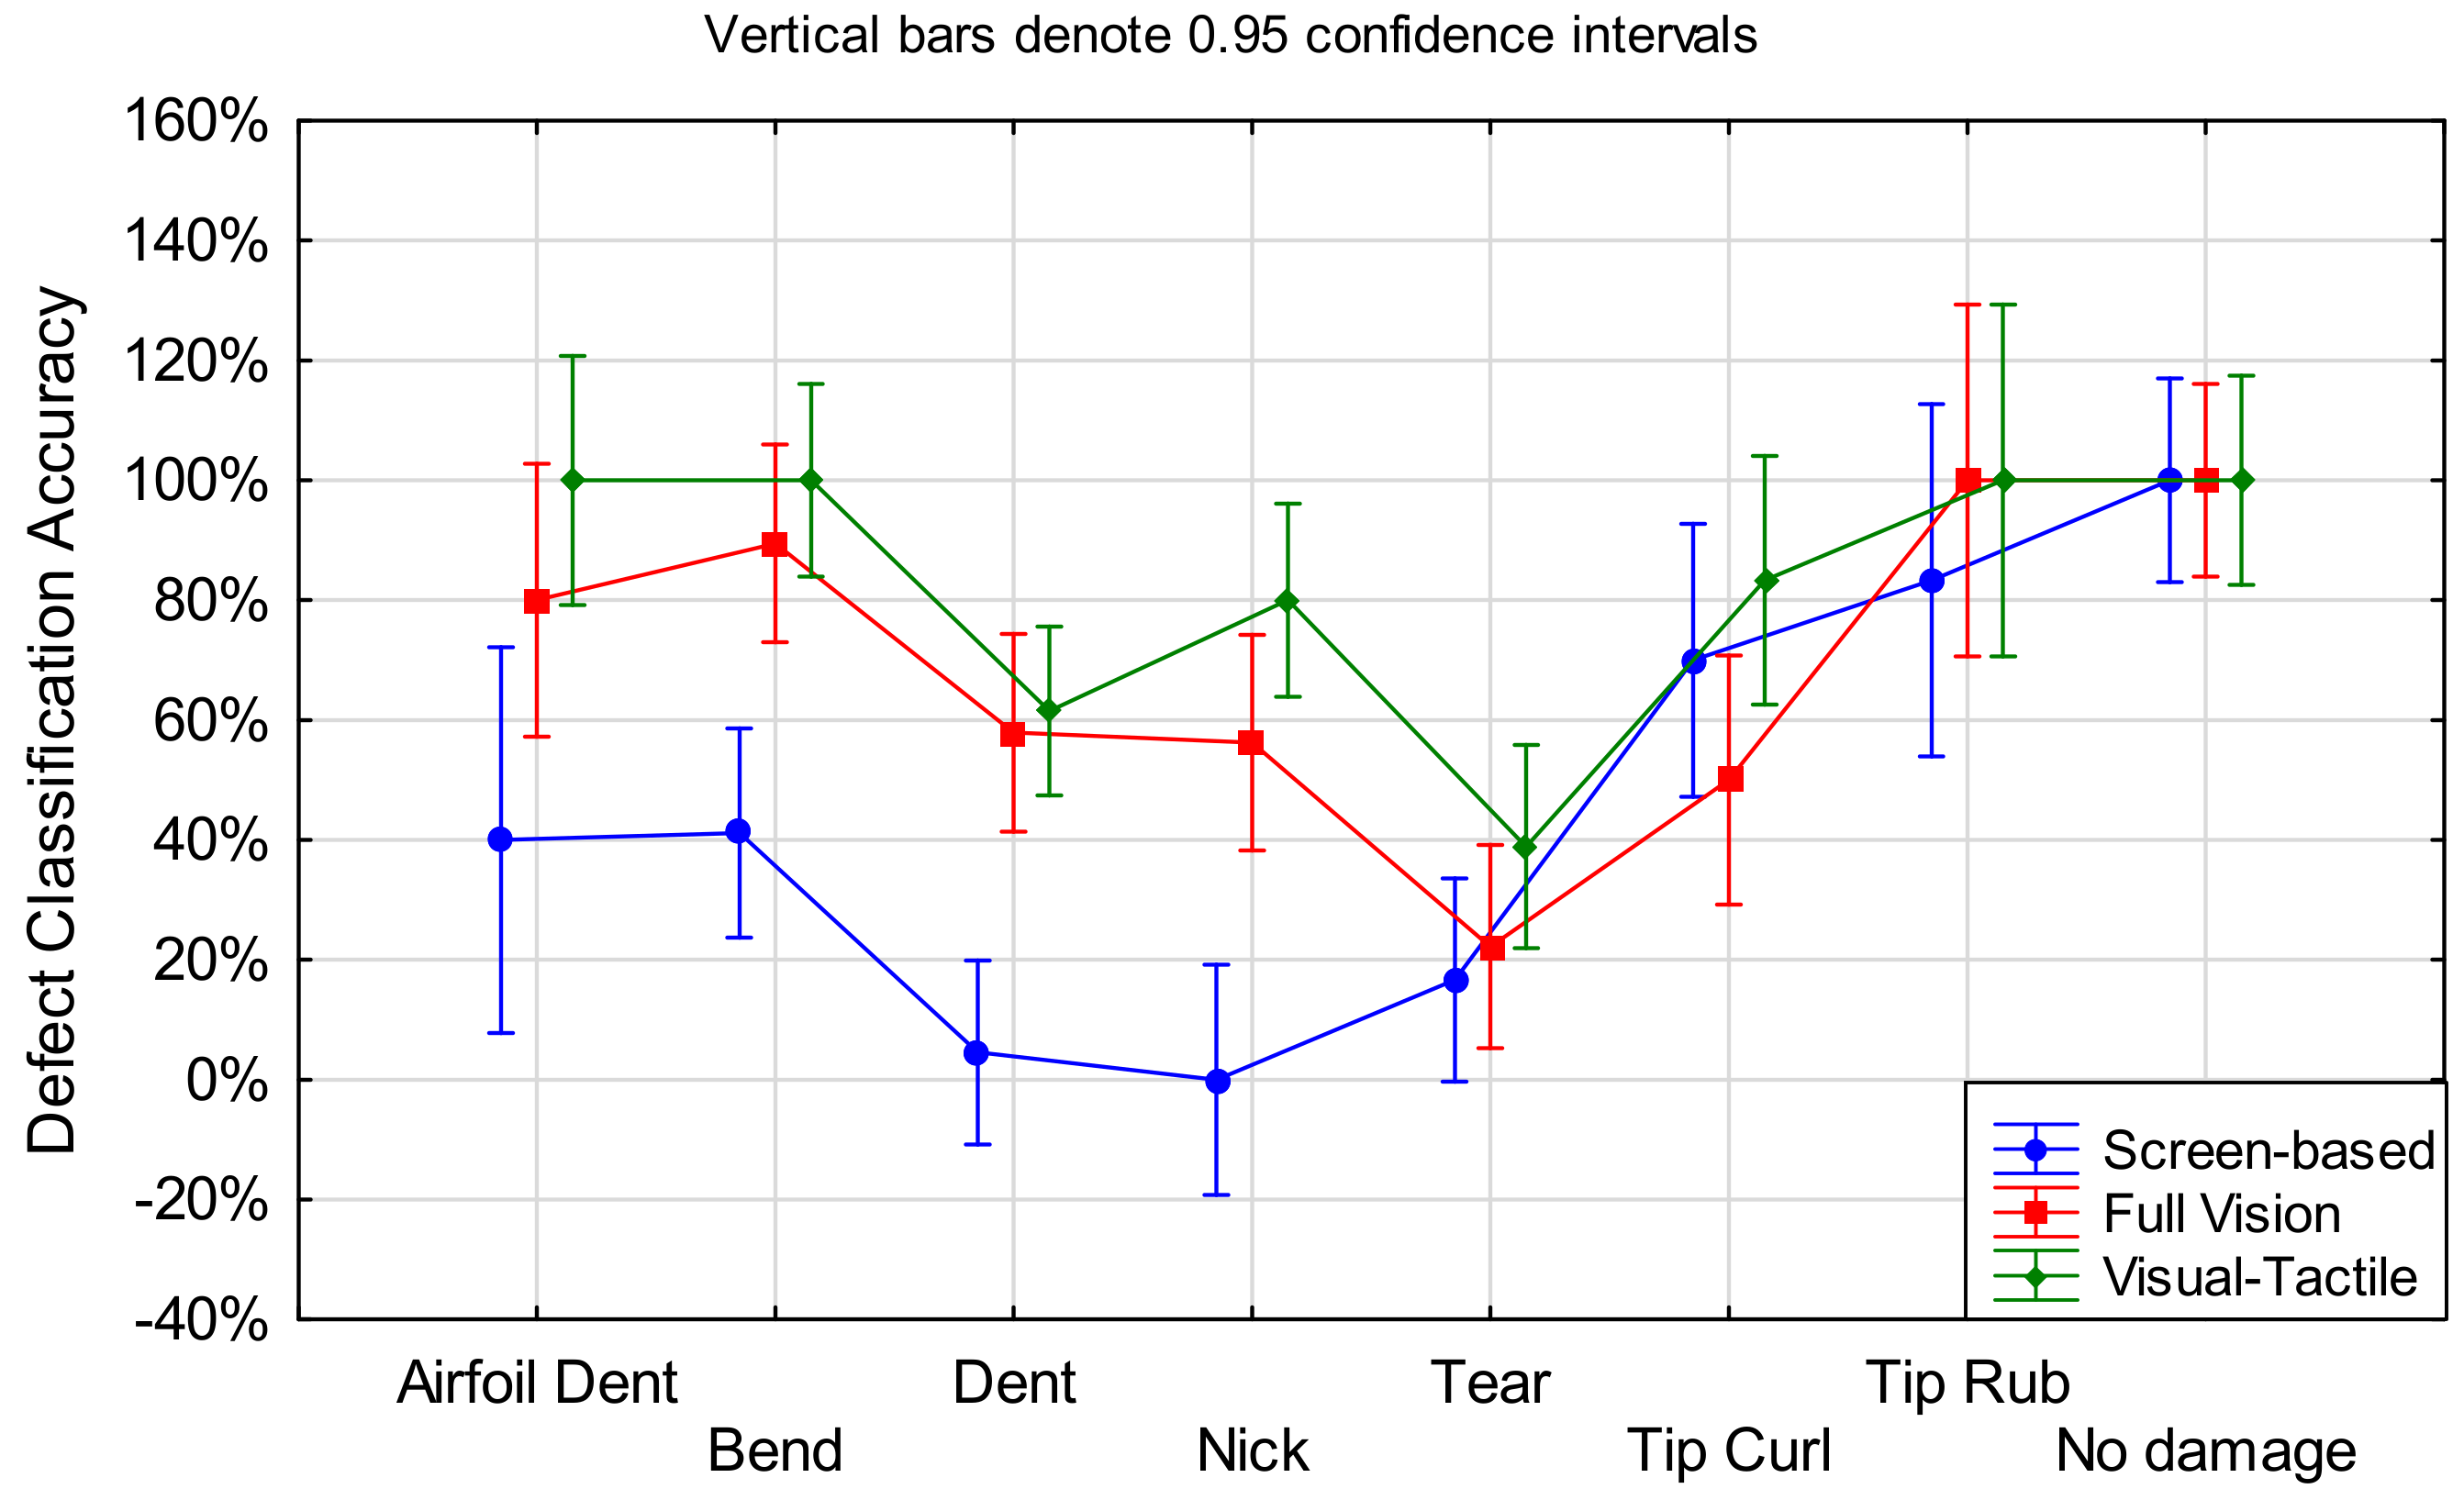
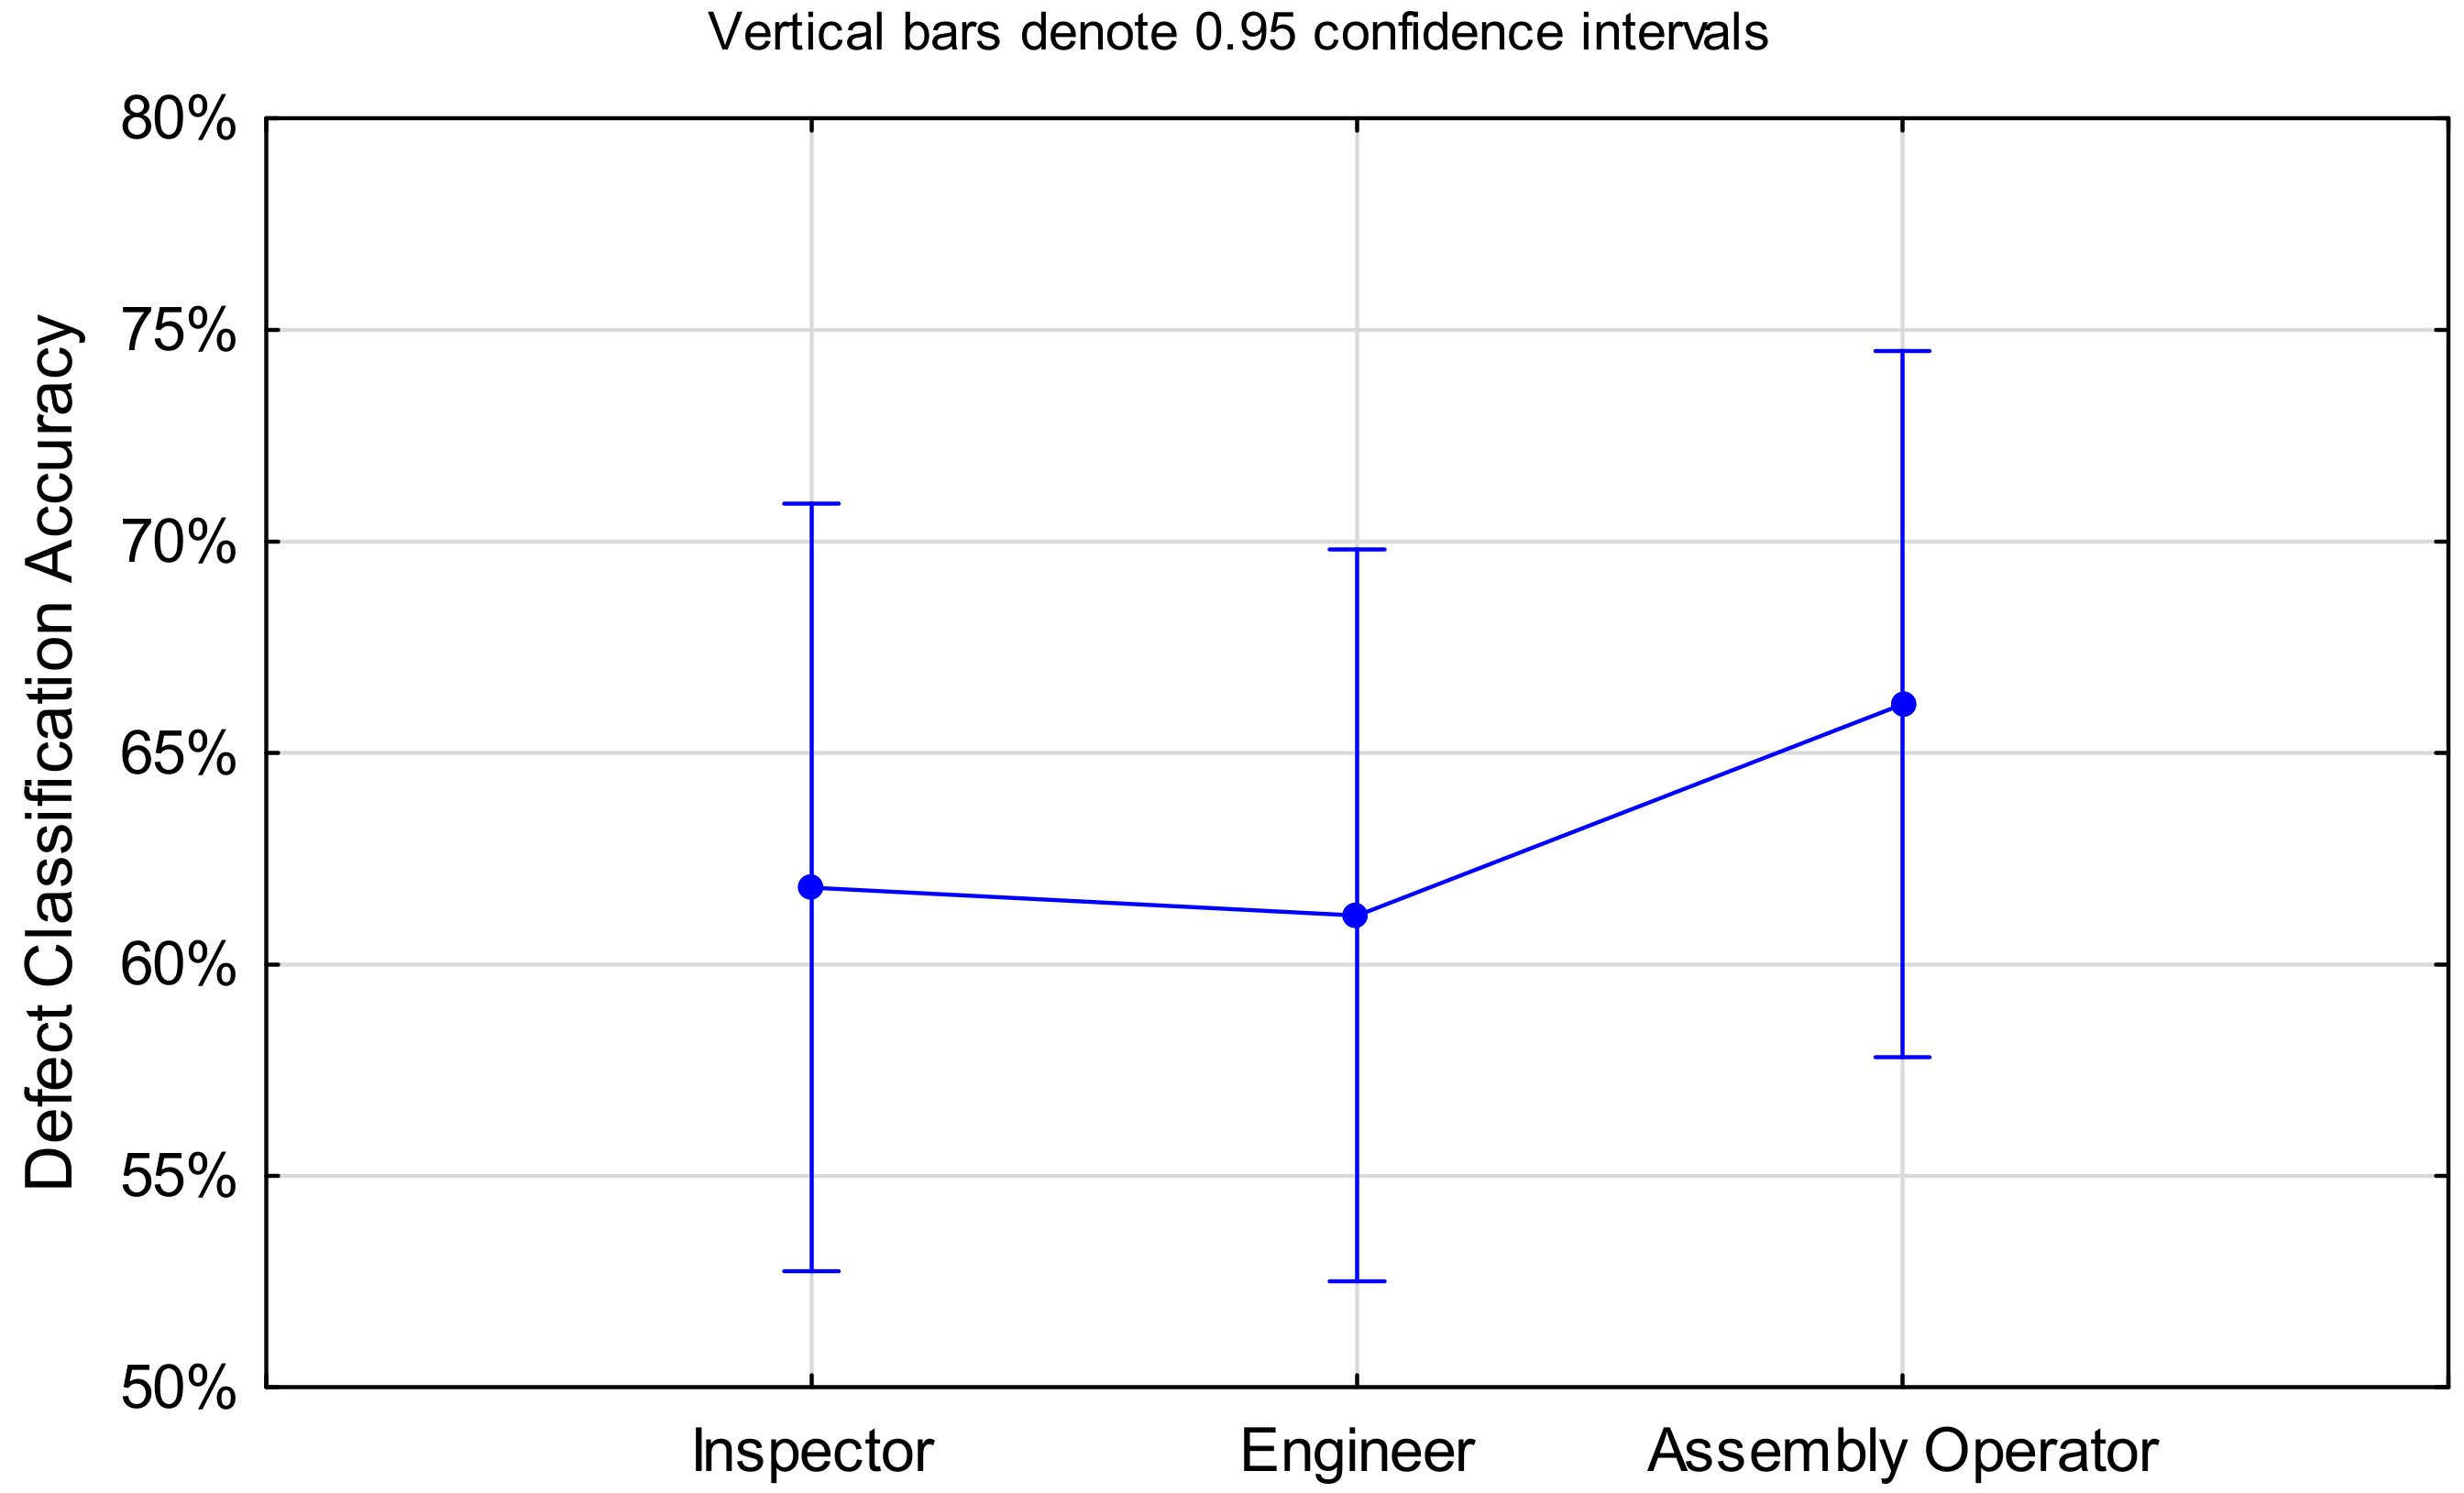
4.3.3. Defect Classification Accuracy

The results in Figure 12 showed that there was no striking difference between the three groups, although there was a tendency towards assembly operators performing slightly better in the classification task. On average, assembly operators classified the most defects correctly with 75.4%, followed by inspectors with 70.1% and engineers with 67.3%. This shows a lack of consistency in the classification of engine blade defects. Even experienced inspectors achieved only an average of 70.1% classification accuracy. This suggests that there might be benefit in standardisation of defect terminology and training [24].

5. Discussion

5.1. Summary of Work and Comparison with Other Studies

This work analysed and compared the visual and visual–tactile inspection of engine blades based on inspection performance measured in inspection accuracy and inspection time. The data of three experiments were collected and subsequently analysed statistically and semi-quantitatively.

5.1.1. Inspection Method

The results showed that both inspection accuracy and defect classification accuracy improved with additional abilities of viewing and touching the part. In the screen-based experiment, an average inspection accuracy of 70.5% was achieved, while an unrestricted full view led to 76.9% accuracy and visual–tactile inspection led to 84.0% accuracy, the highest detection rate. Similar, the defect classification increased from screen-based (62.3%) to full vision (66.9%) and further to visual–tactile inspection (79.4%). No other research was found that reported those metrics in regard to the inspection method.
While the tactile sense led to the highest accuracies of both measures, it also caused over-inspection of blades and increased false-positive rates. This may result in more serviceable blades being removed from service and undergoing unjustified repair work or even scrapping. The sense of touch is much more sensitive than the visual sense [25]. Thus, minor imperfections that would have been missed by the human eye were perceived as supposed defects when inspectors held the blades in their hands. This supports the statement by Kishi et al. [11] that tactile inspection and decision-making process is a sophisticated task and requires experience and practice to differentiate between those minor but acceptable imperfections and defects that can propagate and lead to more severe consequences.
The average inspection time increased from the screen-based to the full view inspection from 18.134 s to 25.064 s, respectively, and decreased from the full view to the visual–tactile inspection from 25.064 s to 22.140 s, respectively. Thus, the visual–tactile inspection was located between the two mere visual inspection methods in terms of inspection time. Noro [17] found that times for visual inspection (equivalent to our full-vision experiment) were shorter than for visual–tactile inspection tasks. However, it should be noted that the different inspection methods in [17] were used to inspect different areas of the part except one. The latter was inspected twice—first visually and then tactually. The results showed that the tactile inspection was 20.4% faster than the visual inspection of the same area. This aligns somewhat to our results in the sense that the tactile component in the visual–tactile inspection led to 11.7% shorter inspection times than the full vision inspection. There is another limitation in the comparison, since [17] neglected the order effect, i.e., whether the second inspection (tactile) was shorter only because the area had already been visually inspected beforehand or the effect was due to the inspection method. Another interesting finding of Noro was that sole tactile inspection was faster than visual and visual–tactile inspection. While [17] included pure tactile inspection due to limited accessibility (dead angles), in our study, limited accessibility referred to borescope inspection, which allows for only a screen-based assessment. Although both inspection methods showed the shortest inspection time, a comparison could not be made.
The effect of inspection time on inspection accuracy was assessed, and the results showed that longer inspection time was associated with poorer inspection performance. Previous research reported the opposite effect [17]. This could be due to different part and defect complexities, inspection conditions, the nature of the inspection under examination (manufacturing quality control vs. maintenance inspection), and the operating environment. Moreover, there might be a difference in thresholds for defect acceptability based on the risk involved. For instance, the aviation industry tends to be more conservative and biased towards part rejection because of the negative consequences a missed defect might have.

5.1.2. Defect Types

The assessment of individual defect types showed that airfoil dents, tears, tip curls, and tip rubs had the highest detection rate of 100% in visual–tactile inspection, while nondefective blades had the lowest inspection accuracy (56.7%). This performance was comparable to other findings in the literature [7,26]. Drury and Sinclair [26] analysed the inspection of manufactured metal cylinders with nicks and dents, tool marks, scratches, and pits with detection rates of 75.2%, 92.4%, 79.6%, and 99.1%, respectively. In order to compare the detection rates to our results, we had to combine the achieved inspection accuracy of nicks (83.3%) and that of dents (86.7%) in the visual–tactile experiment into a combined inspection accuracy for nicks and dents of 85.2%. This showed that the participants in the present study found 10% more nicks and dents compared to those in [26]. As per [24], pits have a fairly similar appearance to airfoil dents, and thus the two detection rates were compared with each other. In the visual–tactile experiment a detection rate of 100% for airfoil dents was achieved, which was almost identical to the 99.1% in [26]. No other defect types could be compared.
In [7], six inspectors were given 20 min time to detect dents on composite panels using any inspection aids. Because of the different experiment design and sample material, the results are not fully comparable. An average inspection accuracy for dents of 70% was achieved in [7], while the participants in our study detected 100% of airfoil dents and 86.7% of dents on blade edges in the visual–tactile experiment.
Non-defective blades and dents took the longest time to inspect with 28.0 s and 25.6 s, respectively. This might indicate a higher complexity and workload when inspecting these blades [17]. It is also possible that the participants had a mental checklist with which they inspected the blade for one defect type after another, and that only after an unsuccessful search did they confirm that a blade was non-defective. Thus, the multiple preceding searches might have caused significantly longer inspection times for undamaged blades.
While classification problems are an integral part of machine learning [27], there has been little emphasis on measuring and comparing the classification accuracies of humans with those of software or other technological systems. Previous studies compared the performance of humans and software in text classification problems [28,29] and image recognition and classification tasks [30,31], assessing effects such as image quality and visual distortion. However, the accuracy of defect classification has not yet been analysed. To the authors’ knowledge, the current findings are the first in an industrial context, specifically in an inspection environment. The results identified nicks and dents as the most challenging defect types to classify and thus those with the biggest potential for improvement.
A scatter plot of inspection time vs. accuracy is shown in Figure 13, representing the means across all participants for all defects and inspection methods. The optimal region is short inspection time with high accuracy, i.e., the bottom-right quadrant. The visual–tactile inspection dominated this region. The worst performing quadrant, at the top left, comprised mostly no-damage conditions.
The scatterplot shows that the inspection of non-defective blades in the visual–tactile inspection had the worst efficiency and performance. While every single blade of an engine must be inspected, since the majority of blades are typically non-defective, this may be the area with the greatest single improvement opportunity from an operational and cost perspective.
There is an operational trade-off between inspection time and accuracy: While a high false-positive rate means that undamaged blades are removed from service (hence a cost), the inspection of non-defective blades takes the longest of all defect types (hence also incurring a cost). A false positive during borescope inspection can lead to the engine being introduced to a shop visit and costly teardown. In piece–part inspection, in contrast, the cost of a false positive is limited to the value or repair cost of a single blade.
There is a related question as to whether performance limits can be set for true positives, false positives, true negatives, and false negatives for the various inspection methods. While that might be possible in simple classification problems, the confusion matrix becomes problematic in the complex situation of blade inspection. This is because a positive in this case refers to the serviceability decision: that the operator correctly rejected or accepted the blade, irrespective of the number of features. In this context, features refers to both defects and non-defective conditions. There are multiple layers of decision making beneath the serviceability decision. These decisions must address the type and location of the condition (e.g., a nick on leading edge is more critical than a tip rub) and the size of the condition (e.g., dents smaller than a certain size are acceptable). Hence, in practice, there is a hierarchy of confusion matrices. The present paper did not attempt to disentangle these but rather used the overall metric of inspection accuracy, which combined these four measures per Equation (1).
Hence, it is difficult to establish performance limits, other than to state that the goal from a safety perspective is to have 0% false negatives (or 100% true positives) for defects. From the economic perspective, the goal is 0% false negatives for defects and 100% false positives for conditions, since the latter imply unnecessary work or scrappage.
Likewise, an acceptable value of inspection accuracy is difficult to determine precisely. It need not be 100% because: (a) it is not achievable because of human factors [32]. Even if there were a technology with 100% detection accuracy (finding all suspicious features), it would not necessarily yield 100% inspection accuracy because a decision component would still need to be applied; (b) there are additional in-service inspections at regular intervals and periodic shop visits (tear-down) that can detect missed defects that have propagated to larger size but not yet failed; (c) the acceptable inspection accuracy depends on the criticality and type of defect [23], i.e., whether they aresafety-critical types (bend, dent, nick, and tear) or flight efficiency-reducing types (airfoil dent, tip curl, and tip rub). Possibly, and this is only a guess, an inspection accuracy around 75% [33] might be sufficient for safety-critical defects to allow safe flight status while minimising unnecessary scrappage, assuming normal inspections are adhered to. Lower values of possibly 33 to 67% may be appropriate for flight efficiency-reducing defects.
There is also an operational constraint in the form of taken time. An inspection time of about 30 s would seem reasonable.
Applying the above to the data in Figure 13, all types of defects had inspection accuracies above 75% when using the visual–tactile method. All safety-critical defects appear to have been detected at a sufficient level for operational purposes using this method (but not always with the other methods).
Using the tentative guidelines above, the areas for possible improvement are as follows:
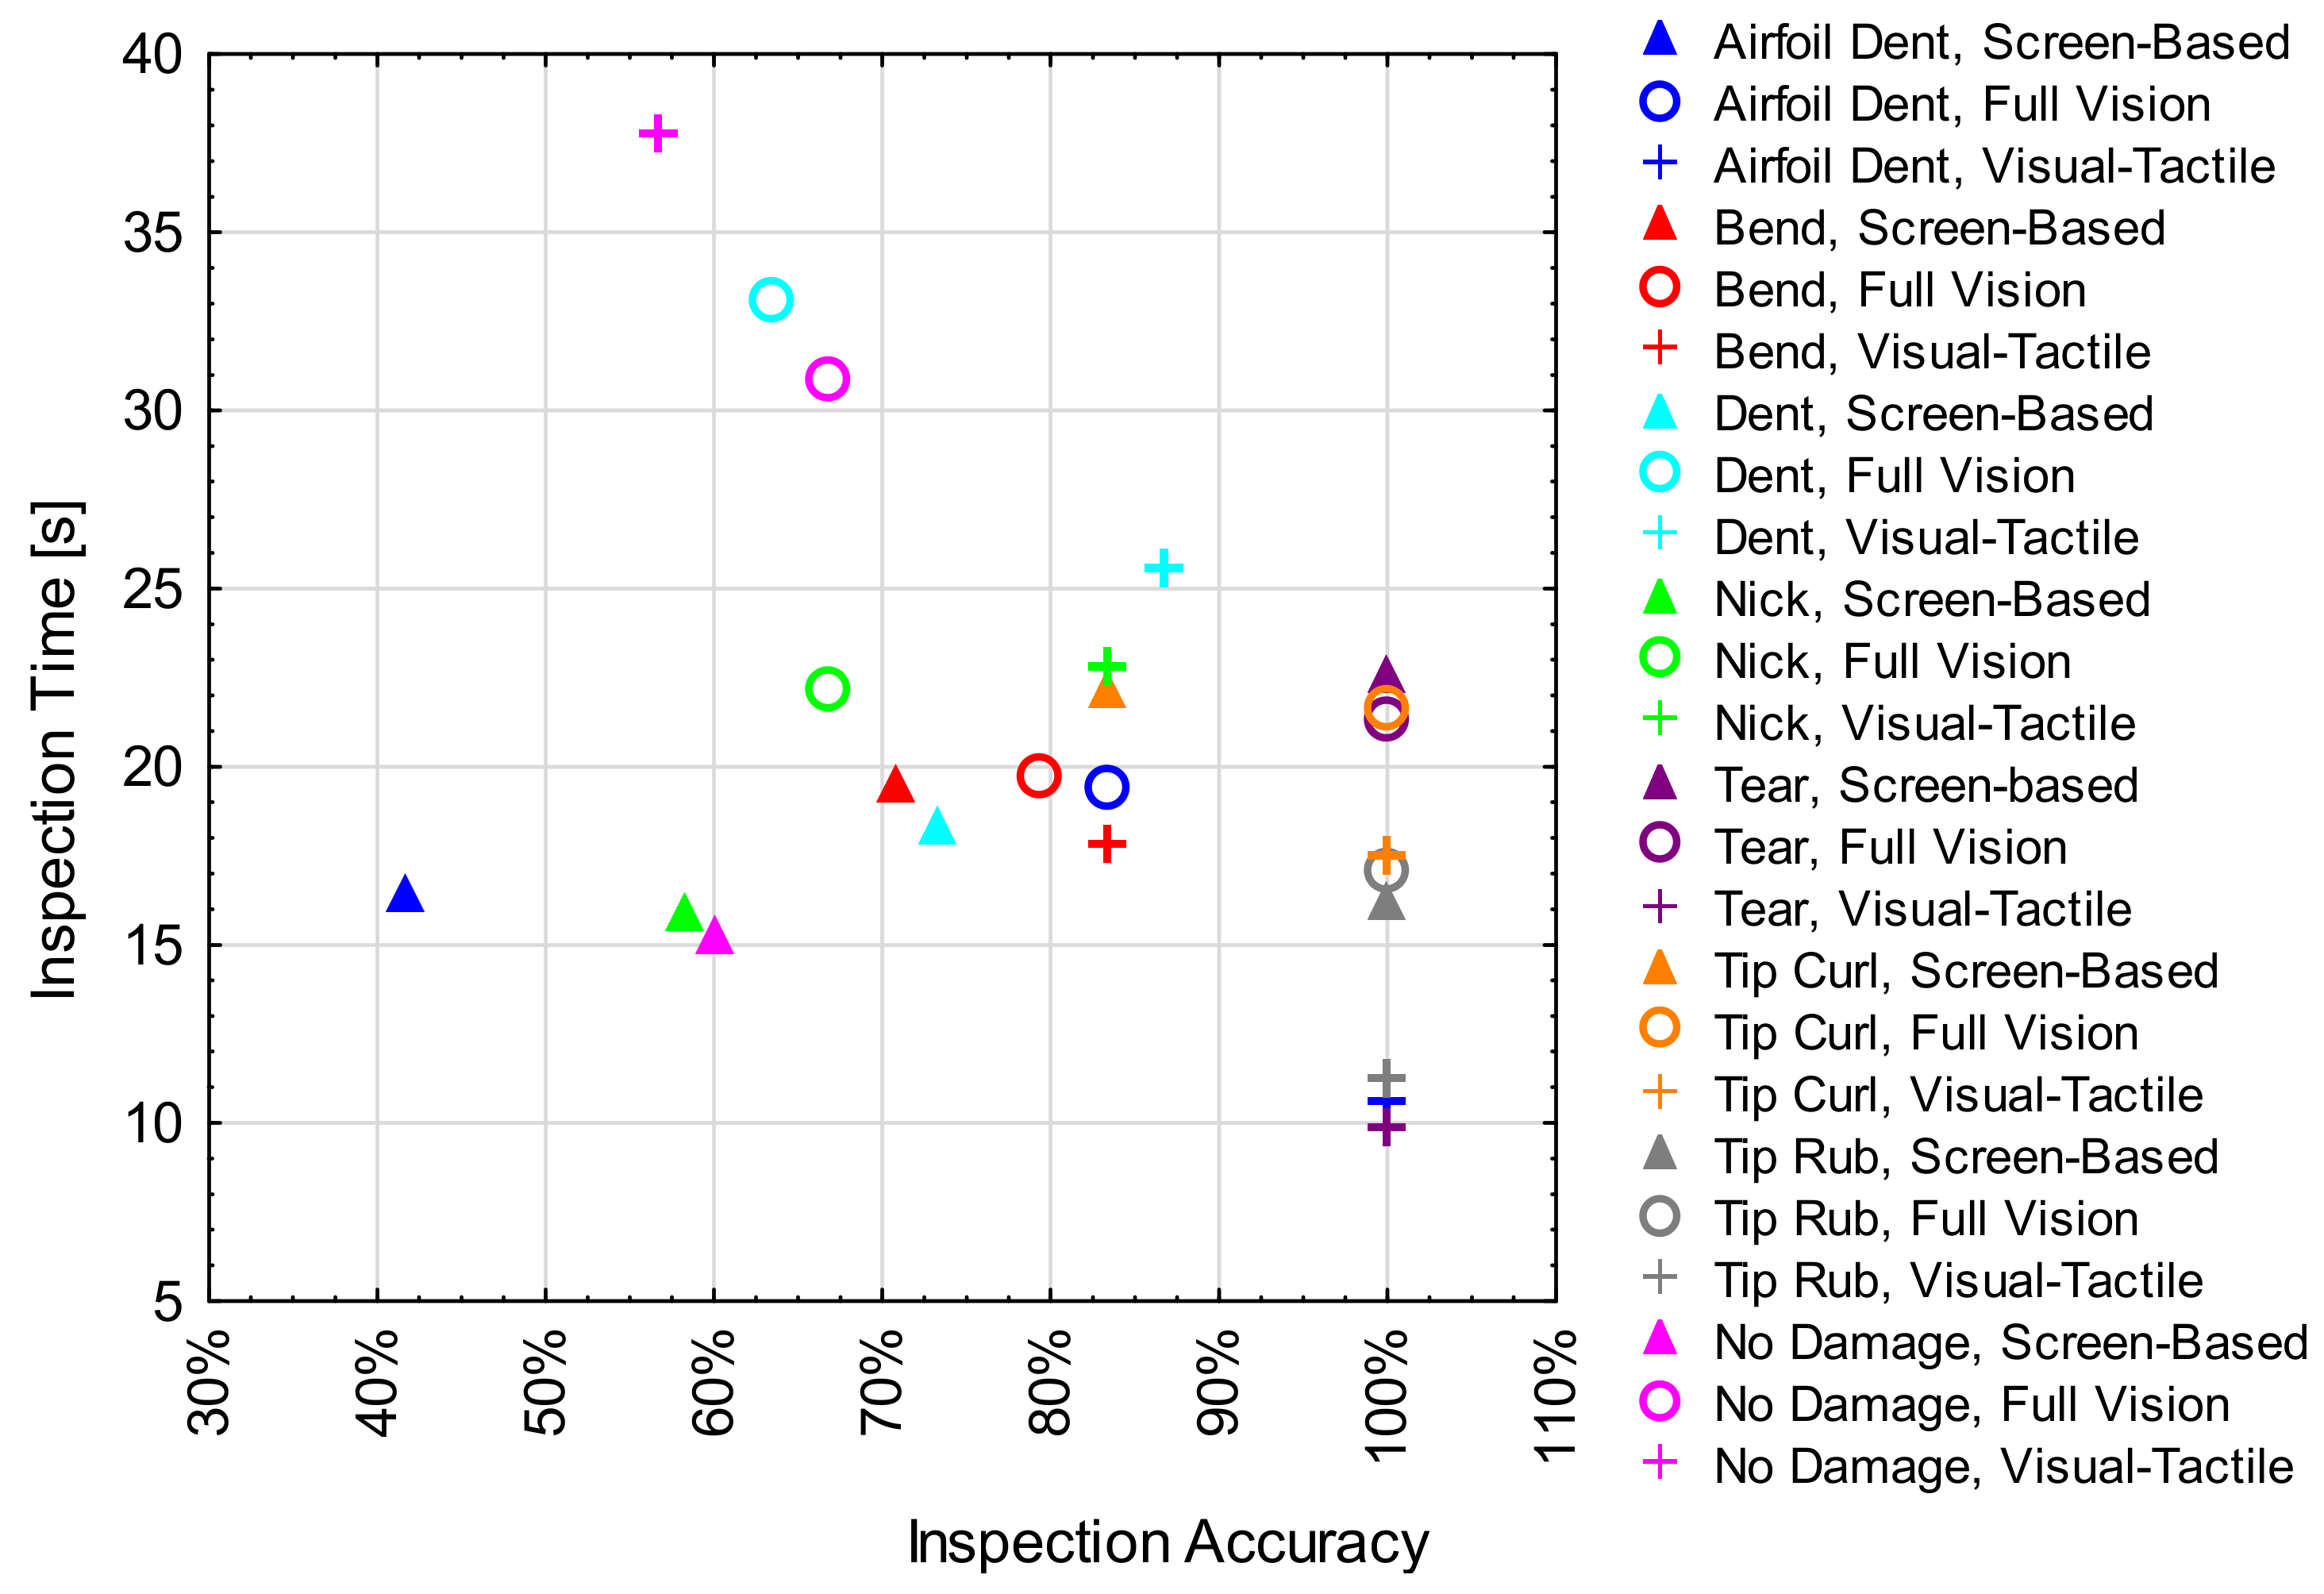
  • For inspection accuracy, the most valuable improvements would be for screen-based inspection of nicks.
  • For inspection time, the no-damage conditions were noted to take more than 30 s when visual–tactile and full vision inspections were used. Surprisingly screen-based methods were faster and of similar inspection accuracy. The full vision method applied to dents was also time consuming.
Hence, there may be value for research to explore better (quicker) ways of determining that a blade is non-defective.

5.1.3. Expertise

On average, assembly operators made correct serviceability decisions 83.3% of the time, followed by engineers with 77.6% and inspectors with 70.5% correct decisions. Surprisingly, higher expertise did not necessarily lead to better inspection performance. This suggests that there might be other work-environmental or personal factors affecting inspection performance such as individual perception ability, defect tolerance, daily performance, time pressure, gender, or age.
There was a difference in inspection time; inspectors were faster with their inspections (16.592 s) than both engineers (24.884 s) and assembly operators (23.861 s). This is consistent with previous findings [6]. There might be a risk that inspectors were overly confident and rushed the inspection, which may have led to a lower inspection performance compared to the other two groups; however, this is merely hypothetical. Another explanation could be decreasing sensory perception with age [34]. In terms of the demographics of the participants, assembly operators were the youngest group, followed by engineers and inspectors. This corresponds to the groups’ inspection accuracies and may indicate that younger participants perform better than older ones. This is a surprising finding, since with age comes experience, but visual and tactile perception decrease with age as well. Future research might consider examining this effect.
Another interesting finding in the demographic aspect is that the best performing participant in the visual–tactile inspection was female. This is consistent with the observation that women generally have a higher tactile perception than men [35].
The classification accuracy among the three groups did not vary notably. This may imply that for classification accuracy, years of experience are less important than proper training. If experts never learn to properly differentiate between different defect types, then they may start developing their own definitions and norms, which become embedded in their unconscious mind. Hence, appropriate (initial) training might offer the best opportunity to improve this metric.
Participants were on average more confident with their decision the more senses and inspection abilities they could use (see Figure 14), although this correlation was not statistically significant ( Χ 2 (4, N = 18) = 0.099, p = 0.071).

5.2. Implications for Practitioners

While it is generally accepted that visual inspection goes beyond the visual sense [6,7,8,9,10], tactile perception has not been given much attention in visual inspection tasks to date. Not only eyesight but the sense of touch deteriorates with age [34,36,37]. Moreover, tactile perception varies from person to person [38]. However, frequent eye tests are mandatory and a fixed part of the certification procedure in aviation, while the tactile sense is neglected entirely. Organisations with visual inspection procedures as part of their quality control processes could introduce tactile tests. There are several common tests to evaluate tactile perception, particularly in medicine, e.g., after a stroke [39]. An alternative and potentially more meaningful test for quality assurance tasks might be having a sample set of parts to be inspected with standardised defects on them and testing the inspectors’ tactile ability based on their detection (or not) of those defects. Similar to an eye test, wherein the subject is asked to read out several lines of different letters in decreasing font size, in the tactile test, subjects could be asked to identify different defect types and decreasing defect size.
Such a test could have several useful applications. There is the potential to use such a test as part of a staff hiring and development regime consisting of an inspection-based input control. Job applicants could be given a physical test in which their initial tactile perception would be assessed along with their visual abilities. Another option would be to use a tactile test in the inspector certification process to measure whether a set standard is met, similar to 20/20 vision in eye tests. This would also allow for repeated measure of an individual’s tactile perception to check for deterioration over time.
The same set of blades could be used for training purposes. Previous research found that it takes years of practice and experience to acquire the skills of tactile inspection [11]. However, tactile inspection is not currently part of the training package of aircraft maintenance technicians or inspectors. A training set of blades with standardised defects covering different defect types, severities, and sizes could be introduced. This has the potential not only to advance novices to inspection experts faster, but also to improve inspection and defect classification accuracy, which is still considerably low even for experts.

5.3. Limitations

This work had several limitations. The first was caused by the global COVID-19 pandemic and the resulting limited availability of industry practitioners, resulting in a small research population of N = 6 participants. Thus, the results especially in Section 4.3, serve only as preliminary evidence and should be interpreted with caution.
Participants were asked to verbalise their findings, which was a new task for them and thus might have caused longer inspection times. This effect was evaluated, and the time to call out a defect in the full-vision and the visual–tactile experiments was compared to the time required to mark a defect in the screen-based experiment. The results showed no difference, and the assumption was made that this was negligible. It should be noted that marking and classifying defects was part of inspectors’ daily jobs. Hence, the time recordings of this study for both defect marking and the verbalisation of defects were believed to represent the real situation fairly well.
As shown in Section 4.3.2, non-defective blades took longer to inspect than defective ones. Participants expected to find a defect even on non-defective blades, i.e., they were biased towards detecting defects. While such defect expectancy is desirable from a safety perspective, it might have been created artificially by the relatively large number of defective blades in the research sample. This was due to time restrictions and limited part availability. In practice, the majority of blades would be serviceable (non-defective), and industry practitioners may tend to become complacent for those. In this study, a similar effect was noticeable, but in this case, participants became biased to find defects, which might have increased the number of false positives.
Although extraneous variables were controlled to the best of our ability, there could have been other factors that might have influenced inspection accuracy and inspection time, such as individuals’ daily performance and other human factors.
Other types of blade defects that typically occur in the hot section of the engine such as cracks, burns, or coating loss [24] were not analysed but could be included in future work.
There are several potential areas of bias in the study. One is organisational bias, in that different MROs might have a different tolerance for what they consider a defect. In practice, this bias is probable very low in the aviation industry because of regular audits, prescriptive engine manual specifications, systematically trained staff, and a worldwide common understanding of quality. Another potential bias is that operators in this industry tend to make conservative decisions, i.e., they tend to reject blades if they are in doubt. This was evident in the high false-positive rates for non-defective blades. A third bias is that the sample of blades presented to participants was skewed towards defective blades. In practice, the proportion of defects would be much less than in the sample set. Hence, participants may have been conditioned to look for defects. They would reasonably have been more risk averse knowing they were under scrutiny, and this might have contributed to elevated false-positive rates for non-defective blades. The selection of participants was random, being purely based on their availability, so this was not expected to be a significant biasing factor.

5.4. Future Work

There are several avenues for future research. Some have already been identified in previous sections and are not repeated here.
The study could be repeated with a larger population, allowing for more substantive statistical analysis including other demographic factors. An approximate power and sample size analysis indicated the desirability of a population of N = 60 participants with 20 participants per expertise group and equally distributed across age and gender. There could also be value in conducting the study under more natural conditions, i.e., on the inspection bench, by measuring inspection performance afterwards, perhaps without telling subjects that their performance is assessed.
Eye-tracking glasses could potentially be used to provide insights of where participants looked, at which angle relative to their eyes the part was held, and what their hands were doing during the inspection, i.e., whether they solely used their hands to rotate the blade, if they used their fingertips to feel the edges, or if they rubbed off any deposits. Fingertip tracking could be also valuable, e.g., by applying dye to the operator’s gloves that would leave residue on the part surface, indicating the contact areas and direction of fingertip movement.
Complex parts with undercuts that restrict visual inspection abilities and force inspectors to rely solely on the tactile sense are also an area for future research. This is the area that might benefit the most from the insights gained in his study.
Tactile inspection is complex and has yet not been automated [40]. Future work could look into new technologies such as 3D scanning to measure and to analyse the shape, surface, and specific features of parts.

6. Conclusions

This work made several novel contributions. First, three inspection methods from visual through visual–tactile were assessed and compared based on inspection performance measured in inspection accuracy, inspection time, and defect classification accuracy. The results showed that an increasing degree of inspectability—unrestrained vision and tactual perception—led to higher inspection and defect classification accuracies, while the inspection time increased as well. The false positive rate was high for all three inspection methods and offered the greatest potential for improvement. A possible cause might be that the participants felt some irregularities in the surface that were residuals from operation but did not warrant unserviceability. While a high false-positive rate is not safety critical, it does induce needless maintenance and repair costs to the MRO provider. Thus, the sense of touch might have led to ‘over-inspection’ and sensitisation of defect perception.
The most common defect types on high-pressure compressor blades caused by foreign object damage (FOD) were analysed, and the detection and classification rates as well as the inspection times were calculated. Nicks and dents were identified as the most difficult defect types to detect and classify and were often confused with each other. This is concerning from a safety perspective.
A second novel contribution to the literature is that this study analysed and quantified the defect classification performance of human operators in an industrial context, specifically in inspection tasks.
Several future work streams were suggested that might have the potential to increase inspection performance while counteracting human factors, thus making aircraft engine inspection more reliable.

Author Contributions

Conceptualisation, J.A.; methodology, J.A.; validation, J.A.; formal analysis, J.A. and A.M.; investigation, J.A.; resources, A.M. and D.P.; data curation, J.A.; writing—original draft preparation, J.A.; writing—review and editing, J.A., A.M. and D.P.; visualisation, J.A.; supervision, D.P. and A.M.; project administration, D.P. and A.M.; funding acquisition, D.P. All authors have read and agreed to the published version of the manuscript.

Funding

This research project was funded by the Christchurch Engine Centre (CHCEC), a maintenance, repair, and overhaul (MRO) facility based in Christchurch and a joint venture between the Pratt and Whitney (PW) division of Raytheon Technologies Corporation (RTC) and Air New Zealand (ANZ).

Institutional Review Board Statement

The study was conducted according to the guidelines of the Declaration of Helsinki and approved by the Human Ethics Committee of the University of Canterbury (HEC 2020/08/LR-PS Amendment 2).

Informed Consent Statement

Informed consent was obtained from all subjects involved in the study prior to experiment commencement.

Data Availability Statement

The data are not publicly available due to commercial sensitivity and data privacy.

Acknowledgments

We sincerely thank all staff from the Christchurch Engine Centre for repeatedly participating in all three experiments. We further thank everyone who supported this research in any form. In particular, we want to thank Ross Riordan and Marcus Wade.

Conflicts of Interest

J.A. was funded by a Ph.D. scholarship through this research project. The authors declare no other conflict of interest.

References

  1. Latorella, K.A.; Prabhu, P.V. A review of human error in aviation maintenance and inspection. Int. J. Ind. Ergon. 2000, 26, 133–161. [Google Scholar] [CrossRef]
  2. Nickles, G.; Him, H.; Koenig, S.; Gramopadhye, A.; Melloy, B. A Descriptive Model of Aircraft Inspection Activities. Available online: https://www.faa.gov/about/initiatives/maintenance_hf/library/documents/media/human_factors_maintenance/a_descriptive_model_of_aircraft_inspection_activities.pdf. (accessed on 20 September 2021).
  3. Hussin, R.; Ismail, N.; Mustapa, S. A study of foreign object damage (FOD) and prevention method at the airport and aircraft maintenance area. In Proceedings of the IOP Conference Series: Materials Science and Engineering, Kuala Lumpur, Malaysia, 8–9 November 2016; p. 012038. [Google Scholar]
  4. Australian Transport Safety Bureau (ATSB). Engine power loss and low speed rejected take off, involving Airbus A320-232, registered VH-VFF. Available online: https://www.atsb.gov.au/publications/investigation_reports/2020/aair/ao-2020-058/ (accessed on 19 August 2021).
  5. Australian Transport Safety Bureau (ATSB). Foreign object damage involving Airbus A320, VH-VGY. Available online: https://www.atsb.gov.au/publications/investigation_reports/2017/aair/ao-2017-108/ (accessed on 19 August 2021).
  6. Aust, J.; Mitrovic, A.; Pons, D. Assessment of the Effect of Cleanliness on the Visual Inspection of Aircraft Engine Blades: An Eye Tracking Study. Sensors 2021, 21, 6135. [Google Scholar] [CrossRef]
  7. Baaran, J. Visual Inspection of Composite Structures; European Aviation Safety Agency (EASA): Cologne, Germany, 2009. [Google Scholar]
  8. Spencer, F.W. Visual Inspection Research Project Report on Benchmark Inspections; Aging Aircraft NDI Validation Center (AANC), Sandia National Labs: Albuquerque, NM, USA, 1996; p. 59. [Google Scholar]
  9. Erhart, D.; Ostrom, L.T.; Wilhelmsen, C.A. Visual detectibility of dents on a composite aircraft inspection specimen: An initial study. Int. J. Appl. Aviat. Stud. 2004, 4, 111–122. [Google Scholar]
  10. Drury, C.G.; Watson, J. Good Practices in Visual Inspection. Available online: https://www.faa.gov/about/initiatives/maintenance_hf/library/documents/#HumanFactorsMaintenance (accessed on 14 June 2021).
  11. Kishi, K.; Hida, T.; Nakajima, R.; Matsumoto, T. Proposal of Tactile Inspection Conditions for Valid Defects Detection Focusing on Haptic Perception with Active Touch. Available online: https://apiems2016.conf.tw/site/userdata/1087/papers/0152.pdf (accessed on 16 August 2021).
  12. Gibson, J.J. Observations on active touch. Psychol Rev. 1962, 69, 477–491. [Google Scholar] [CrossRef] [PubMed]
  13. Auld, M.L.; Boyd, R.N.; Moseley, G.L.; Johnston, L.M. Tactile Assessment in Children with Cerebral Palsy: A Clinimetric Review. Phys. Occup Ther Pediatr 2011, 31, 413–439. [Google Scholar] [CrossRef] [PubMed]
  14. Macey, R.; Walsh, T.; Riley, P.; Glenny, A.-M.; Worthington, H.V.; O’Malley, L.; Clarkson, J.E.; Ricketts, D. Visual or visual-tactile examination to detect and inform the diagnosis of enamel caries. Cochrane Database Syst. Rev. 2021, 6, CD014546. [Google Scholar] [CrossRef]
  15. Kikuuwe, R.; Sano, A.; Mochiyama, H.; Takesue, N.; Tsunekawa, K.; Suzuki, S.; Fujimoto, H. The tactile contact lens. In Proceedings of the IEEE Sensors, Vienna, Austria, 24–27 October 2004; pp. 535–538. [Google Scholar]
  16. Desai, S.; Konz, S. Tactile Inspection Performance with and without Gloves. Proc. Hum. Factors Soc. annu. meet. 1983, 27, 782–785. [Google Scholar] [CrossRef]
  17. Noro, K. Analysis of visual and tactile search in industrial inspection. Ergonomics 1984, 27, 733–743. [Google Scholar] [CrossRef]
  18. Nakajima, R.; Yamamoto, R.; Hida, T.; Matsumoto, T. A Study on the Effect of Defect Shape on Defect Detection in Visual Inspection. Procedia Manuf. 2019, 39, 1641–1648. [Google Scholar] [CrossRef]
  19. Drury, C.G. The speed—accuracy trade-off in industry. Ergonomics 1994, 37, 747–763. [Google Scholar] [CrossRef]
  20. Kleiner, B.M.; Drury, C.G.; Christopher, G.L. Sensitivity of Human Tactile Inspection. Hum. Factors 1987, 29, 1–7. [Google Scholar] [CrossRef] [PubMed]
  21. McKennel, A.C. Wool Quality Assessment—The Acquisition of Skill. J. Occup. Psychol. 1958, 32, 111–119. [Google Scholar]
  22. Aust, J.; Shankland, S.; Pons, D.; Mukundan, R.; Mitrovic, A. Automated Defect Detection and Decision-Support in Gas Turbine Blade Inspection. Aerospace 2021, 8, 30. [Google Scholar] [CrossRef]
  23. Aust, J.; Pons, D. Methodology for Evaluating Risk of Visual Inspection Tasks of Aircraft Engine Blades. Aerospace 2021, 8, 117. [Google Scholar] [CrossRef]
  24. Aust, J.; Pons, D. Taxonomy of Gas Turbine Blade Defects. Aerospace 2019, 6, 58. [Google Scholar] [CrossRef] [Green Version]
  25. Carpenter, C.; Dhong, C.; Root, N.; Rodriquez, D.; Abdo, E.; Skelil, K.; Alkhadra, M.; Ramírez, J.; Ramachandran, V.; Lipomi, D. Human ability to discriminate surface chemistry by touch. Mater. Horiz 2017, 5, 70–77. [Google Scholar] [CrossRef]
  26. Drury, C.; Sinclair, M. Human and Machine Performance in an Inspection Task. Hum. Factors 1983, 25, 391–399. [Google Scholar] [CrossRef]
  27. Kotsiantis, S.B.; Zaharakis, I.D.; Pintelas, P.E. Machine learning: A review of classification and combining techniques. Artif. Intell. Rev. 2006, 26, 159–190. [Google Scholar] [CrossRef]
  28. Goh, Y.C.; Cai, X.Q.; Theseira, W.; Ko, G.; Khor, K.A. Evaluating human versus machine learning performance in classifying research abstracts. Scientometrics 2020, 125, 1197–1212. [Google Scholar] [CrossRef]
  29. Boesser, C.T. Comparing Human and Machine Learning Classification of Human Factors in Incident Reports From Aviation. Ph.D. Thesis, University of Central Florida, Orlando, FL, USA, December 2021. [Google Scholar]
  30. Dodge, S.; Karam, L. Human and DNN Classification Performance on Images with Quality Distortions: A Comparative Study. ACM Trans. Appl. Percept. 2019, 16, 1–17. [Google Scholar] [CrossRef]
  31. Carrasco, J.; Hogan, A.; Pérez, J. Laconic Image Classification: Human vs. Machine Performance. In Proceedings of the 29th ACM International Conference on Information & Knowledge Management, Association for Computing Machinery, New York, NY, USA, 19–23 October 2020; pp. 115–124. [Google Scholar]
  32. Drury, C.G.; Fox, J.G. The imperfect inspector. In Human Reliability in Quality Control; Drury, C.G., Fox, J.G., Eds.; Taylor & Francis: London, UK, 1975; pp. 11–16. [Google Scholar]
  33. See, J.E. Visual Inspection Reliability for Precision Manufactured Parts. Hum. Factors 2015, 57, 1427–1442. [Google Scholar] [CrossRef] [Green Version]
  34. Wickremaratchi, M.M.; Llewelyn, J.G. Effects of ageing on touch. Postgrad. Med. J. 2006, 82, 301–304. [Google Scholar] [CrossRef] [PubMed]
  35. Abdouni, A.; Moreau, G.; Vargiolu, R.; Zahouani, H. Static and active tactile perception and touch anisotropy: Aging and gender effect. Sci. Rep. 2018, 8, 14240. [Google Scholar] [CrossRef] [PubMed] [Green Version]
  36. Verrillo, R.T. Aging of Tactile Sense. In Encyclopedia of Neuroscience; Binder, M.D., Hirokawa, N., Windhorst, U., Eds.; Springer: Berlin/Heidelberg, Germany, 2009; pp. 69–73. [Google Scholar]
  37. Tremblay, F.; Master, S. Touch in Aging. In Scholarpedia of Touch; Prescott, T., Ahissar, E., Izhikevich, E., Eds.; Atlantis Press: Paris, France, 2016; pp. 351–361. [Google Scholar]
  38. Sakamoto, M.; Watanabe, J. Visualizing Individual Perceptual Differences Using Intuitive Word-Based Input. Front. Psychol. 2019, 10, 1108. [Google Scholar] [CrossRef] [PubMed]
  39. Carey, L.M.; Mak-Yuen, Y.Y.K.; Matyas, T.A. The Functional Tactile Object Recognition Test: A Unidimensional Measure with Excellent Internal Consistency for Haptic Sensing of Real Objects After Stroke. Front. Neurosci. 2020, 14, 948. [Google Scholar] [CrossRef] [PubMed]
  40. Yukinawa, T.; Hida, T.; Seo, A. Effect of object orientation and scanning direction on upper limb load during tactile inspection. J. Jpn. Ind. Manag. Assoc. 2013, 64, 138–144. [Google Scholar]
Figure 1. High-pressure compressor (HPC) blade.
Aerospace 08 00313 g001
Figure 2. Three experiments representing three inspection methods: (a) screen-based inspection, in which the part was presented on a computer monitor; (b) part-based inspection, with full vision of the blade from all angles and distances; (c) visual–tactile inspection of the part, allowing the use of the sense of touch additionally to vision.
Aerospace 08 00313 g002
Figure 3. Mean plot of inspection accuracy by inspection Method.
Aerospace 08 00313 g003
Figure 4. Mean plot of inspection time by inspection method.
Aerospace 08 00313 g004
Figure 5. Mean plot of inspection time by decision.
Aerospace 08 00313 g005
Figure 6. Mean plot of defect classification accuracy by inspection method.
Aerospace 08 00313 g006
Figure 7. Mean plot of inspection accuracy by defect type for all inspection methods.
Aerospace 08 00313 g007
Figure 8. Mean plot of inspection time by defect type for all inspection methods.
Aerospace 08 00313 g008
Figure 9. Mean plot of defect classification accuracy by defect type for all inspection methods.
Aerospace 08 00313 g009
Figure 10. Mean plot of inspection accuracy by expertise.
Aerospace 08 00313 g010
Figure 11. Mean plot of inspection time by expertise. The results of [6] are shown in the bottom-right corner for comparison (Reprinted with permission from ref. [6]. Copyright 2021 MDPI Aerospace).
Aerospace 08 00313 g011
Figure 12. Mean plot of defect classification accuracy by expertise.
Aerospace 08 00313 g012
Figure 13. Scatter plot of inspection time and inspection accuracy for each defect type and inspection method. ‘No damage’ refers to non-defective blades and acceptable conditions.
Aerospace 08 00313 g013
Figure 14. Confidence rating for each inspection method.
Aerospace 08 00313 g014
Table 1. Research hypothesis.
Hypothesis
Hypothesis H1. The inspection method and associated inspection capabilities affect inspection performance measured in (a) inspection accuracy, (b) inspection time, and (c) defect classification accuracy.
Hypothesis H2. The defect type affects inspection performance measured in (a) inspection accuracy, (b) inspection time, and (c) defect classification accuracy.
Hypothesis H3. Inspectors perform better in terms of (a) inspection accuracy, (b) inspection time, and (c) defect classification accuracy than non-inspecting staff.
Table 2. Metrics used for measuring inspection performance.
MetricDescription
True Positive (TP)Defect correctly detected (hit).
True Negative (TN)Undamaged blade correctly identified as non-defective.
False Positive (FP)Non-defective blade incorrectly identified as defective.
False Negative (FN)Defective blade incorrectly identified as non-defective (miss).
Inspection Accuracy (IA)The percentage of correct decisions made, i.e., correct removal from service of a defective blade (TP) or passing of a non-defective blade (TN).
I A = T P   +   T N T P   +   F P   +   T N   +   F N (1)
Inspection Time (IT)Time spent per blade to perform the inspection in seconds.
Defect Classification
Accuracy (DCA)
The number of correct classifications divided by the number of correct detections (not the sample size).
Table 3. Inspection accuracy of each participant by inspection method.
ParticipantsScreen-Based
Inspection
Full Vision
Inspection
Visual–Tactile
Inspection
Inspector 169.2%69.2%88.5%
Inspector 257.1%65.4%73.1%
Engineer 157.7%88.5%88.5%
Engineer 276.9%69.2%84.6%
Assembly Operator 176.9%80.8%92.3%
Assembly Operator 284.6%88.5%76.9%
All Participants70.5%76.9%84.0%
Table 4. Decision time of each participant by inspection method (in seconds).
ParticipantsScreen-Based
Inspection
Full Vision
Inspection
Visual–Tactile
Inspection
Inspector 19.875 (4.768)11.582 (4.350)9.441 (4.777)
Inspector 210.276 (7.329)29.113 (11.567)29.267 (15.224)
Engineer 115.957 (8.486)21.625 (11.964)11.279 (8.073)
Engineer 220.277 (9.572)40.775 (30.401)39.388 (23.619)
Assembly Operator 117.280 (5.259)14.339 (6.759)16.779 (10.653)
Assembly Operator 235.136 (13.822)32.949 (17.122)26.684 (23.338)
All Participants18.134 (9.264)25.064 (11.261)22.140 (11.635)
Table 5. Defect classification accuracy of each participant by inspection method.
ParticipantsScreen-Based
Inspection
Full Vision
Inspection
Visual–Tactile
Inspection
Inspector 133.3%55.6%73.9%
Inspector 233.3%70.6%94.7%
Engineer 146.7%82.6%87.0%
Engineer 240.0%33.3%63.6%
Assembly Operator 145.0%76.2%79.2%
Assembly Operator 236.4%78.3%80.0%
All Participants39.1%67.5%79.4%
Table 6. Inspection accuracy of each inspection method by defect type.
Inspection MethodAirfoil DentBendDentNickTearTip CurlTip RubNo
Damage
Screen-based Inspection41.7%70.8%73.3%58.3%100.0%83.3%100.0%60.0%
Full Vision Inspection83.3%79.2%63.3%66.7%100.0%100.0%100.0%66.7%
Visual–Tactile Inspection100.0%83.3%86.7%83.3%100.0%100.0%100.0%56.7%
Table 7. Inspection time and standard deviation of each inspection method by defect type (in seconds).
Inspection Method Airfoil Dent Bend Dent Nick Tear Tip Curl Tip Rub No
Damage
Screen-based
Inspection
16.497 (14.565)19.541 (11.861)18.328 (12.524)15.923 (12.465)22.589 (12.328)22.185 (10.202)16.221 (9.809)15.325 (11.317)
Full Vision
Inspection
19.474 (16.962)19.717 (10.562)33.161 (29.752)22.144 (10.711)21.394 (13.208)21.653 (10.397)17.147 (11.079)30.850 (20.315)
Visual–Tactile
Inspection
10.599 (5.800)17.883 (14.658)25.538 (15.687)22.804 (17.438)9.912 (5.841)17.517 (19.117)11.275 (6.198)37.732 (25.147)
Table 8. Defect classification accuracy of each inspection method by defect type.
Inspection MethodAirfoil DentBendDentNickTearTip CurlTip RubNo
Damage
Screen-based
Inspection
40.0%41.2%4.5%0.0%16.7%70.0%83.3%100.0%
Full Vision
Inspection
80.0%89.5%57.9%56.3%22.2%50.0%100.0%100.0%
Visual–Tactile
Inspection
100.0%100.0%61.5%80.0%38.9%83.3%100.0%100.0%
Publisher’s Note: MDPI stays neutral with regard to jurisdictional claims in published maps and institutional affiliations.

