Article

Impulse and Performance Measurements of Electric Solid Propellant in a Laboratory Electrothermal Ablation-Fed Pulsed Plasma Thruster

by
Matthew S. Glascock
1,*,†,
Joshua L. Rovey
2,† and
Kurt A. Polzin
3,†
1
Mechanical and Aerospace Engineering Department, Missouri University of Science and Technology, Rolla, MO 65409, USA
2
Department of Aerospace Engineering, Grainger College of Engineering, University of Illinois at Urbana-Champaign, Urbana, IL 61801, USA
3
Advance Concepts Office, NASA Marshall Space Flight Center, Huntsville, AL 35808, USA
*
Author to whom correspondence should be addressed.
These authors contributed equally to this work.
Aerospace 2020, 7(6), 70; https://doi.org/10.3390/aerospace7060070
Submission received: 29 April 2020 / Revised: 25 May 2020 / Accepted: 26 May 2020 / Published: 30 May 2020
(This article belongs to the Special Issue Electric Propulsion)

Abstract

:
Electric solid propellants are advanced solid chemical rocket propellants that can be controlled (ignited, throttled and extinguished) through the application and removal of an electric current. This behavior may enable the propellant to be used in multimode propulsion systems utilizing the ablative pulsed plasma thruster. The performance of an electric solid propellant operating in an electrothermal ablation-fed pulsed plasma thruster was investigated using an inverted pendulum micro-newton thrust stand. The impulse bit and specific impulse of the device using the electric solid propellant were measured for short-duration test runs of 100 pulses and longer-duration runs to end-of-life, at energy levels of 5, 10, 15 and 20 J. Also, the device was operated using the current state-of-the-art ablation-fed pulsed plasma thruster propellant, polytetrafluoroethylene (PTFE). Impulse bit measurements for PTFE indicate 100 ± 20 µN-s at an initial energy level of 5 J, which increases linearly with energy by approximately 30 µN-s/J. Within the error of the experiment, measurements of the impulse bit for the electric solid propellant are identical to PTFE. Specific impulse when operating on PTFE is calculated to be about 450 s. It is demonstrated that a surface layer in the hygroscopic electric solid propellant is rapidly ablated over the first few discharges of the device, which decreases the average specific impulse relative to the traditional polytetrafluoroethylene propellant. Correcting these data by subtracting the early discharge ablation mass loss measurements yields a corrected electric solid propellant specific impulse of approximately 300 s.

1. Introduction

Recent innovations in the solid rocket propellant field have led to the development of a solid propellant that is safe, throttleable, and green with on-demand on-off capability. These electric solid propellants (ESPs) ignite and decompose when electric power is applied at sufficient current and voltage [1]. This decomposition is a highly exothermic process that generates hot gas at a burn rate that can be throttled by varying the applied current. Removal of the voltage and current extinguishes the reaction, which may be restarted by the reapplication of electric power [2]. Because this reaction is only induced by the electric current, ESPs are not susceptible to accidental ignition by spark, impact or open flame. These characteristics are extremely beneficial compared to traditional solid rocket propellants which are not throttleable, toggleable, or insensitive to external ignition sources. The advent of ESPs expands the potential for the use of solid propellants in applications that were previously infeasible or dangerous.
Development of ESPs began in the 1990s with the design of an automobile air bag inflator propellant (ABIP) using materials safe for unprotected human contact (i.e., “green” materials). This ABIP was ammonium nitrate-based and was later repurposed for use in other areas, including rocket propulsion. Shortly thereafter, “ASPEN,” the first digitally controlled extinguishable solid propellant, was developed [3]. This propellant featured additives with the ammonium nitrate base to lower the melting point and increase electrical conductivity [2]. This material exhibited performance metrics comparable to that of previous solid rocket propellants, but major problems existed with the repeatability of ignition. Further development for gas-generation applications led to a special family of electrically controlled energetic materials which may be mixed as solid, liquid or gel form propellants, all of which are electrically ignitable [4,5]. Some mixtures are flame-sensitive and explosive, some are insensitive to flame and combustion sustainable, and some are insensitive and extinguishable (like ESPs). One particular formula which conducts electricity and exhibits high specific impulse is known as the high-performance electric propellant (HIPEP) [1,6], which is not sensitive to open flame, spark, or impact and is extinguishable. In this solid energetic material, the ionic liquid oxidizer hydroxyl-ammonium nitrate (HAN) is dissolved and cross-linked in polyvinyl alcohol (PVA), forming a gel that is hardened by baking. The resulting rubbery solid HIPEP exhibits a pyroelectric behavior unique to energetics. When direct current electric power is applied, the proton transfer reaction between hydroxyl-ammonium and nitrate is promoted, and the level of nitric acid rapidly rises in the material, eventually triggering ignition of the propellant. This exothermic, gas-generating reaction may be harnessed in a solid rocket motor to generate thrust on demand using electric power.
HIPEP’s pyroelectric behavior may facilitate a dual mode propulsion system. The first mode is a high thrust chemical mode where direct current electric power is applied to incite pyroelectric gas generation. The decomposed propellant is gas-dynamically accelerated through a nozzle to generate thrust like any typical solid rocket motor. The duration of each chemical mode firing is determined by the duration that electric power is supplied and could be 500 ms. The inventors of this propellant and collaborating groups have reported on this mode of operation previously, with some efforts still ongoing [7,8,9]. This solid rocket motor may be paired with a second, high specific impulse (Isp) electric mode in the same device using the same thruster and solid propellant connected to a second, pulsed electrical circuit. One promising electric configuration for a high Isp mode is a pulsed electric propulsion device known as the electrothermal coaxial pulsed plasma thruster.
Pulsed plasma thrusters [10] (PPTs) have been in use since the first orbital flight of an electric propulsion device in 1964. PPTs offer repeatable impulse bits with higher exhaust velocities than can be achieved using chemical thrusters. Ablating polytetrafluoroethylene (PTFE) in a discharge to yield a working fluid, ablation-fed PPTs (APPTs) have the added benefit of inert propellant storage with no pressure vessel requirements. PPTs typically fulfill secondary propulsion needs on spacecraft such as station-keeping and attitude control, but have recently garnered more attention as a main propulsion system for small spacecraft [11,12]. Broadly speaking, APPT geometry may be classified as either rectangular or coaxial [10]. Coaxial geometry APPTs, like that of PPT-4 [13], electrothermal PPTs [14,15,16,17,18], PETRUS 2.0 [19], or ablative z-pinch PPTs [20], possess a central and a downstream electrode and may have a conical-shaped dielectric between the electrodes. The central or upstream electrode is typically cylindrical and positively charged (anode) while the downstream electrode is ring-shaped. Solid propellant fills the space between electrodes and may be fed from the side through the conical dielectric. Most commonly this propellant is the inert polymer PTFE which is the state-of-the-art propellant for APPTs. A capacitor or bank of capacitors is charged to a few kilovolts, with that voltage applied across the electrodes. The main arc discharge is initiated by a small ignition pulse, which is always located in or near the cathode in a PPT. The igniter generates a surface flashover discharge to produce a seed plasma that initiates the main arc discharge. Radiant heat supplied by the high temperature arc heats and ablates the surface of the solid propellant, yielding gaseous propellant that further fuels the arc. At low energy, the coaxial PPT is a device dominated by electrothermal acceleration mechanisms, with the energy of the arc heating the gas to yield high exit velocities through gas-dynamic acceleration. Ablation processes are at the core of APPT operation, with many PTFE ablation studies in the literature [21,22,23,24,25,26].
The aforementioned dual mode device combining a solid chemical rocket motor mode with an electric coaxial APPT mode remains conceptual. Research in the use of HIPEP and other ESPs for gas-generation and chemical mode applications with long (>1 ms) timescales is ongoing and separate from the present work. Current efforts by the authors are focused on understanding the behavior of the HIPEP material in the proposed APPT pulsed electric mode. Our recent work has compared ablation of HIPEP with traditional PTFE in ablation-fed arc discharge devices [27,28,29,30,31]. At high temperatures and during long (~ms) time-scales, it is known that HIPEP undergoes a thermal decomposition process, while PTFE evaporates after depolymerization. However, ablation-controlled arc discharges occur on much shorter timescales, as the discharge current has a period of less than 10 µs. The specific ablation (µg/J) of HIPEP was measured to be roughly twice that of PTFE, and this was attributed to differences in the material thermal and chemical properties [27]. Plume measurements of HIPEP-fueled pulsed microthrusters [28] indicate electron temperatures (1–2 eV) and densities (1011–1014 cm−3) of the weakly ionized plasma comparable to that of PTFE fueled APPTs. Exhaust velocity measurements indicate similar specific impulse performance of HIPEP relative to PTFE in the microthrusters, for at least the ionized portion of the expelled mass. Furthermore, it has been shown that the fraction of late-time ablation mass is similar for both propellants. Estimates from high-speed imagery of a pulsed HIPEP microthruster suggest that up to 50% of the ablated mass may be attributed to low-speed macroparticles ejected after the main current pulse [29].
To date, HIPEP has not been used in a traditional APPT configuration, where propellant material is ablated during a high current, short duration (~10 µs) arc discharge. Another ESP, the ammonium nitrate-based ABIP, was previously tested in Aerojet’s modular test unit (MTU) and reported impulse bits roughly 50%–80% of the PTFE solid propellant typically used in that unit [1]. No measured performance metrics (impulse bit, specific impulse) are yet published for a PPT using HIPEP as propellant. The objective of this work is to investigate the performance of the HAN-based HIPEP material relative to that of PTFE in an electrothermal APPT. The device is a coaxial geometry electrothermal APPT and a modified version of it was used previously to quantify the propellant specific ablation [27]. Both PTFE and HIPEP are used as propellants in this work and the impulse bit and specific impulse are measured using an inverted pendulum thrust stand. For each propellant, the device was nominally operated for 100 pulses in vacuum, with the impulse bit measured throughout the test and the average propellant mass loss per pulse found by measuring the propellant mass before and after a test. These measurements are the first reported one-to-one performance comparisons between the HIPEP and PTFE materials in an ablative pulsed plasma device. Results from these experiments, when combined with previous observations on the ablation of the HIPEP material, can now be used to draw conclusions about the propulsive performance. The evolution of ablation mass with pulse number was also examined closely. Very short duration tests are conducted to quantify the early-pulse mass loss, and the mass loss measurements in long-duration tests are closely examined for both PTFE and HIPEP propellants to identify long-term trends in the calculated specific impulse. We discuss the role of moisture absorbed by the hygroscopic HIPEP in mass loss measurements and specific impulse calculations, as well as its impact on future thruster designs.

2. Methods and Apparatus

The performance of the electric solid propellant, HIPEP, operating in an electrothermal pulsed plasma thruster was measured using an inverted pendulum thrust stand. This section details the propellant, the devices, and methods used in the present work.

2.1. High-Performance Electric Propellant

HIPEP is a HAN-based solution solid manufactured by Digital Solid State Propulsion (DSSP) using “green” ingredients and processes free of harmful fumes. HIPEP has a chemical composition of 75% HAN oxidizer (an inorganic ionic liquid), 20% polyvinyl alcohol (PVA) fuel binder, and 5% ammonium nitrate. It is mixed in standard chemical glassware, with only gloves and safety glasses needed for protection, and cured at 35 °C/95°F. It is initially a liquid and poured into a mold, curing to form a rubbery solid with density ~1.8 g/cm3 and the appearance and texture of a soft pencil eraser. In a typical PPT, the PTFE is an electrical insulator between the electrodes. The conductivity of HIPEP (1–2 S/m) is comparable to highly conductive ionic liquids. However, our previous work has shown that the conductivity of the HIPEP has a negligible effect on the measured current in the arc discharge [27]. Furthermore, it has been observed that the HIPEP material ablates more readily than PTFE in an ablation-fed arc, which may be attributed to thermodynamic properties of the solid propellant. It is currently unclear how the additional ablation mass contributes to the thrust produced in an ablation-fed thruster.
The solid HIPEP material is hygroscopic and gradually absorbs moisture from a typical laboratory atmosphere (~50% rel. hum.), eventually causing the propellant to become completely liquid. To mitigate absorption of moisture in this work, HIPEP samples are handled and measured only in a dry-air glovebox kept at 5% relative humidity. The material is stored only in a vacuum or dry-air environment. Furthermore, these samples undergo a vacuum drying process wherein samples were kept at <5 × 10⁻² torr for at least 24 h. After this time, the mass of the samples reach steady state, with the measured mass within 0.26% of the dry mass [27]. A Sartorius QUINTIX125D-1S dual range semi-micro balance is used to measure the mass of propellant samples before and after testing. In the selected range, this balance has a capacity of 60 g and can be read to an increment of 0.01 mg. The factory reported repeatability of the balance is 0.02 mg. For measurements reported here the typical variation in measurement was ±0.03 mg.

2.2. Electric Propellant Thruster Experiment

The electric propellant thruster experiment (EPTX) shown schematically in Figure 1 has geometry similar to that of a coaxial electrothermal APPT. It should be noted that this device was originally used primarily to study the mass ablation of propellants and it was not designed to be an efficient thruster [27]. The device was designed to facilitate removal and replacement of small propellant tube samples and is not optimized for performance.

2.2.1. Geometry and Operation

A circular stainless steel rod serves as the anode (+, positive) and a stainless steel ring with a 15° conical nozzle bore serves as the cathode (−, ground). The assembly is housed in a non-conductive PEEK body. The propellant tube sample has length 12 mm and inner diameter 6.35 mm. Because HIPEP is conductive, the propellant is isolated electrically from the two electrodes by thin PTFE washers with inner diameter of 7 mm which are not shown in Figure 1. These washers have an approximate thickness of <0.5 mm which is sufficient to hold off the maximum voltage (2.23 kV) used in the present work. The washers remain during PTFE testing to keep electrode spacing consistent between propellant samples. The test article and the capacitor bank are co-located inside the vacuum test facility. It is intended that the arc discharge occurs in the cylindrical cavity (6.35 mm dia.) formed by the inner propellant tube wall and the anode end. Because the test article is at vacuum, the capacitor can be charged to a high voltage (1–5 kV) across the anode/cathode-gap without initiating a Paschen breakdown. Breakdown of the gas is initiated by a surface discharge igniter constructed of two tungsten wires cemented in a two-bore alumina tube with approximately 2 mm exposed tip lengths. The wire tips are embedded in the nozzle of the cathode as shown in Figure 1. A capacitor discharge ignition (CDI) circuit creates a low-energy surface discharge between the tungsten wire tips. Electrons from this discharge are accelerated to the positively charged anode and sputter particles from it and the nearby propellant, triggering the main arc discharge.
During the main arc discharge, current flows in the z-direction through the arc region from the anode and attaches at the cathode/nozzle electrode. This current oscillates between high positive and negative currents over a few microseconds. Because the magnetic field induced by this rapidly changing current is in the θ-direction and follows the sign of the current, the Lorentz force is always directed in the negative radial direction (pinching toward the z-axis) in the arc region labeled in Figure 1. Consequently, the current sheet does not propagate along the z-axis in the cavity. In the conical nozzle region there is a radial component of current that may give rise to a small electromagnetic axial thrust component. The high current flowing through the resistance of the arc discharge in the cavity dissipates the energy that was initially stored on the capacitors. This energy transiently heats the walls of the propellant cavity to well above the vaporization temperature and causes ablation of propellant mass at a rate of 30–300 µg/pulse. The gas generated by ablation is then further heated by the arc discharge to high temperatures on the order of a few eV. This mass of high temperature charged particles and neutrals is accelerated gas-dynamically via the nozzle and imparts an impulse per pulse or impulse bit (Ibit). The capacitor bank must be recharged after each discharge, pulsed at a repetition rate of once per 20 s in this work (0.05 Hz). This low repetition rate means the propellant has time to cool after each discharge. Further details on operation, propellant sample preparation, and the ablation mass rates of PTFE and HIPEP in the precursor to this device may be found in our previous publication [27]. The only change in the device between that work and the present work is the implementation of the conical-shaped cathode nozzle.

2.2.2. Thrust Mode

In this device, the electromagnetic force pinches the plasma radially inward, increasing the plasma pressure which, in turn, generates gas-dynamic thrust in the axial direction. To estimate the gas-dynamic contribution to axial thrust due to electromagnetic pinching, we use a z-pinch quasi-equilibrium analysis [32] for which the equilibrium condition is written:
p = j × B .
In our device the magnetic field B is unidirectional in θ and a function of r , while the current density j is equal to the curl of the magnetic field and is written:
μ 0 j = × B = × ( B θ ( r ) θ ^ ) .
Evaluating the gradient and cross product in Equation (1) yields:
d p d r = d d r ( B θ 2 ( r ) 2 μ 0 ) + B θ 2 ( r ) μ 0 r
where B θ ( r ) is the azimuthal magnetic field strength, which is assumed to vary only in the r -direction. If we further assume that the plasma within the discharge chamber of the EPTX device is a cylindrical column spanning r = 0 to r , the differential Equation (3) has a solution of the form:
p ( r ) = p 0 B θ 2 ( r ) 2 μ 0 1 μ 0 0 r B θ 2 ( r ) r d r
where p 0 is the peak pressure in the plasma column, assumed to be at r = 0 . Further assuming a uniform axial current density distribution within the plasma column of maximum radius r = r 0 , and utilizing Ampère’s Law in Equation (3), we may write the magnetic field as:
B θ ( r ) = B 0 r r 0 = μ 0 I r 2 π r 0 2
where I is the current flowing through the thruster-capacitor circuit and B 0 is the azimuthal magnetic field strength at the outer edge of the plasma column. While we will not report it in this work, the current I was measured for each discharge and the results are practically identical to the current waveforms presented in Ref. [27]. Substituting Equation (5) into Equation (4) and performing the integral yields:
p 0 p ( r ) = μ 0 I 2 4 π 2 r 2 r 0 4  
after some minor rearranging of terms. Equation (6) is the “pinch condition” for the plasma. The axial force arising from the imbalance in gas pressure at the open end of the propellant cavity at any time may then be obtained by integrating Equation (6) over the solid back face of the cavity, as:
F z = 0 2 π d θ 0 r 0 ( p 0 p ) r   d r = μ 0 I 2 8 π .
Thus, the axial force arising from the electromagnetic pinching in the radial direction scales with the square of the current flowing through the arc plasma. Using the definition of impulse as the time integral of force, we obtain the contribution of that force to the measured impulse of the device as:
( I z ) EM   pinch = F z d t = μ 0 8 π I 2 d t = μ 0 8 π Ψ ,
where Ψ is the integral of the current squared over the entire discharge. The quantity Ψ is obtained by numerically integrating the experimentally-measured current. In electrothermal PPTs, the value of the impulse contributed by the electromagnetic force is small relative to the measured impulse. In Section 4.3, we use the results of the present work to show that this is true for the EPTX device.

2.3. Compact Thrust Stand

This work was conducted in Electric Propulsion Facility 1 at the University of Illinois Urbana-Champaign (UIUC) Electric Propulsion Lab. This vacuum facility is approximately 1000 L in volume and achieves a nominal base pressure of 2 × 10⁻⁵ torr. Housed in this facility is the UIUC Compact Thrust Stand designed for accurate measurement of thrust and impulse bit in the micro- and milli-newton range [33]. This stand is an inverted-pendulum design diagramed in Figure 2a. Two modes of stand operation allow for constant thrust measurement in the range of 1–10 mN and impulse bit measurement in the range of 0.1–3.0 mN-s. In this work, the stand is operated in impulsive measurement mode to determine the impulse bit of the electrothermal APPT device. The thruster and hardware are mounted on top of the long stand platform which is mounted to the fixed frame by stainless steel arms with torsional flexures, as shown in the photograph in Figure 2b. Any motion of the stand platform in the x-direction causes deflection of the stand arms and is opposed by the spring force of the torsional flexures, yielding an oscillatory response. Calibration is performed using a method similar to that described in Polk, et al. [34] for impulsive measurement using an inverted-pendulum thrust stand. A small impact hammer constructed of aluminum body and soft plastic head is mounted to a hinge and actuated by a solenoid. The solenoid is triggered remotely, causing the head of the hammer to strike a piezoelectric force transducer at the impact location shown in Figure 2a. This impulsive force to the stand platform and generates an oscillatory response in the x-direction. The impulse delivered to the stand may be calculated by integration of the transducer signal. In this work, a typical calibration impulse bit is 100–1400 µN-s, adjusted manually.
The measurement error for each calibration impulse is ±6 µN-s due to bit noise and trapezoidal integration error. The motion of the thrust stand is monitored by a linear variable differential transformer (LVDT) affixed to the rear of the stand platform. Typical noise levels for this analog signal are on the order of 10−4 V peak-to-peak. The LVDT signal is used both for electromagnetic (eddy current) damping of stand motion and for determining the response of the stand to an impulse. Specifically, the differential between successive position measurements (i.e., the velocity of the stand platform) is examined to determine response. For each calibration impulse, a distinct peak in the differential voltage waveform is detected. The value of this peak in volts is known as the response.
In this work, calibration was performed immediately prior to and following each testing session. Typically, 20–25 impulsive strikes are delivered to the stand and both transducer and LVDT output signals stored to memory for each. The response of the stand is plotted on the y-axis, the applied calibration impulse bits are plotted on the x-axis, and a linear fit to the data is established as the calibration curve. Figure 3 presents such a calibration curve for a typical pre-test calibration in the range of 100–1400 µN-s. A standard least-squares regression method as described in Polk, et al. [34] is used to determine the best linear fit to the calibration data. Also shown in Figure 3 are the standard residuals shown relative to the average standard residual indicated by the solid black line. The distribution and mean of the standard residuals indicate that the linear fit is appropriate, and typical R 2 values are 0.95 or greater. After each calibration, a testing session was conducted wherein the EPTX device was pulsed once every 20 s, imparting an impulse on the stand. For each pulse of the device, the thrust stand response was obtained from the LVDT measurement. The calibration curve in Figure 3 was then used to determine the impulse bit of each pulse based upon the measured thrust stand response. In the present work, the impulse bits measured are in the range of roughly 100–800 µN-s, which is fully contained in the linear region of the established calibration curve. A typical standard deviation of residuals in calibration is 1.5 mV. Using the linear fit in Figure 3, this suggests the error in a single impulse bit measurement is ±20 µN-s, equivalent to one standard deviation of response residual in either direction.

3. Results

The EPTX was operated in the facility described and tested using PTFE and HIPEP as propellants for comparative purposes. Using the compact thrust stand, the impulse bit of each propellant was recorded for four nominal stored energy values of 5, 10, 15, and 20 J. Initially, two test durations were conducted in this work: a short-duration test consisting of 100 pulses and a long-duration test to end-of-life. In this section, we present the results of these tests.

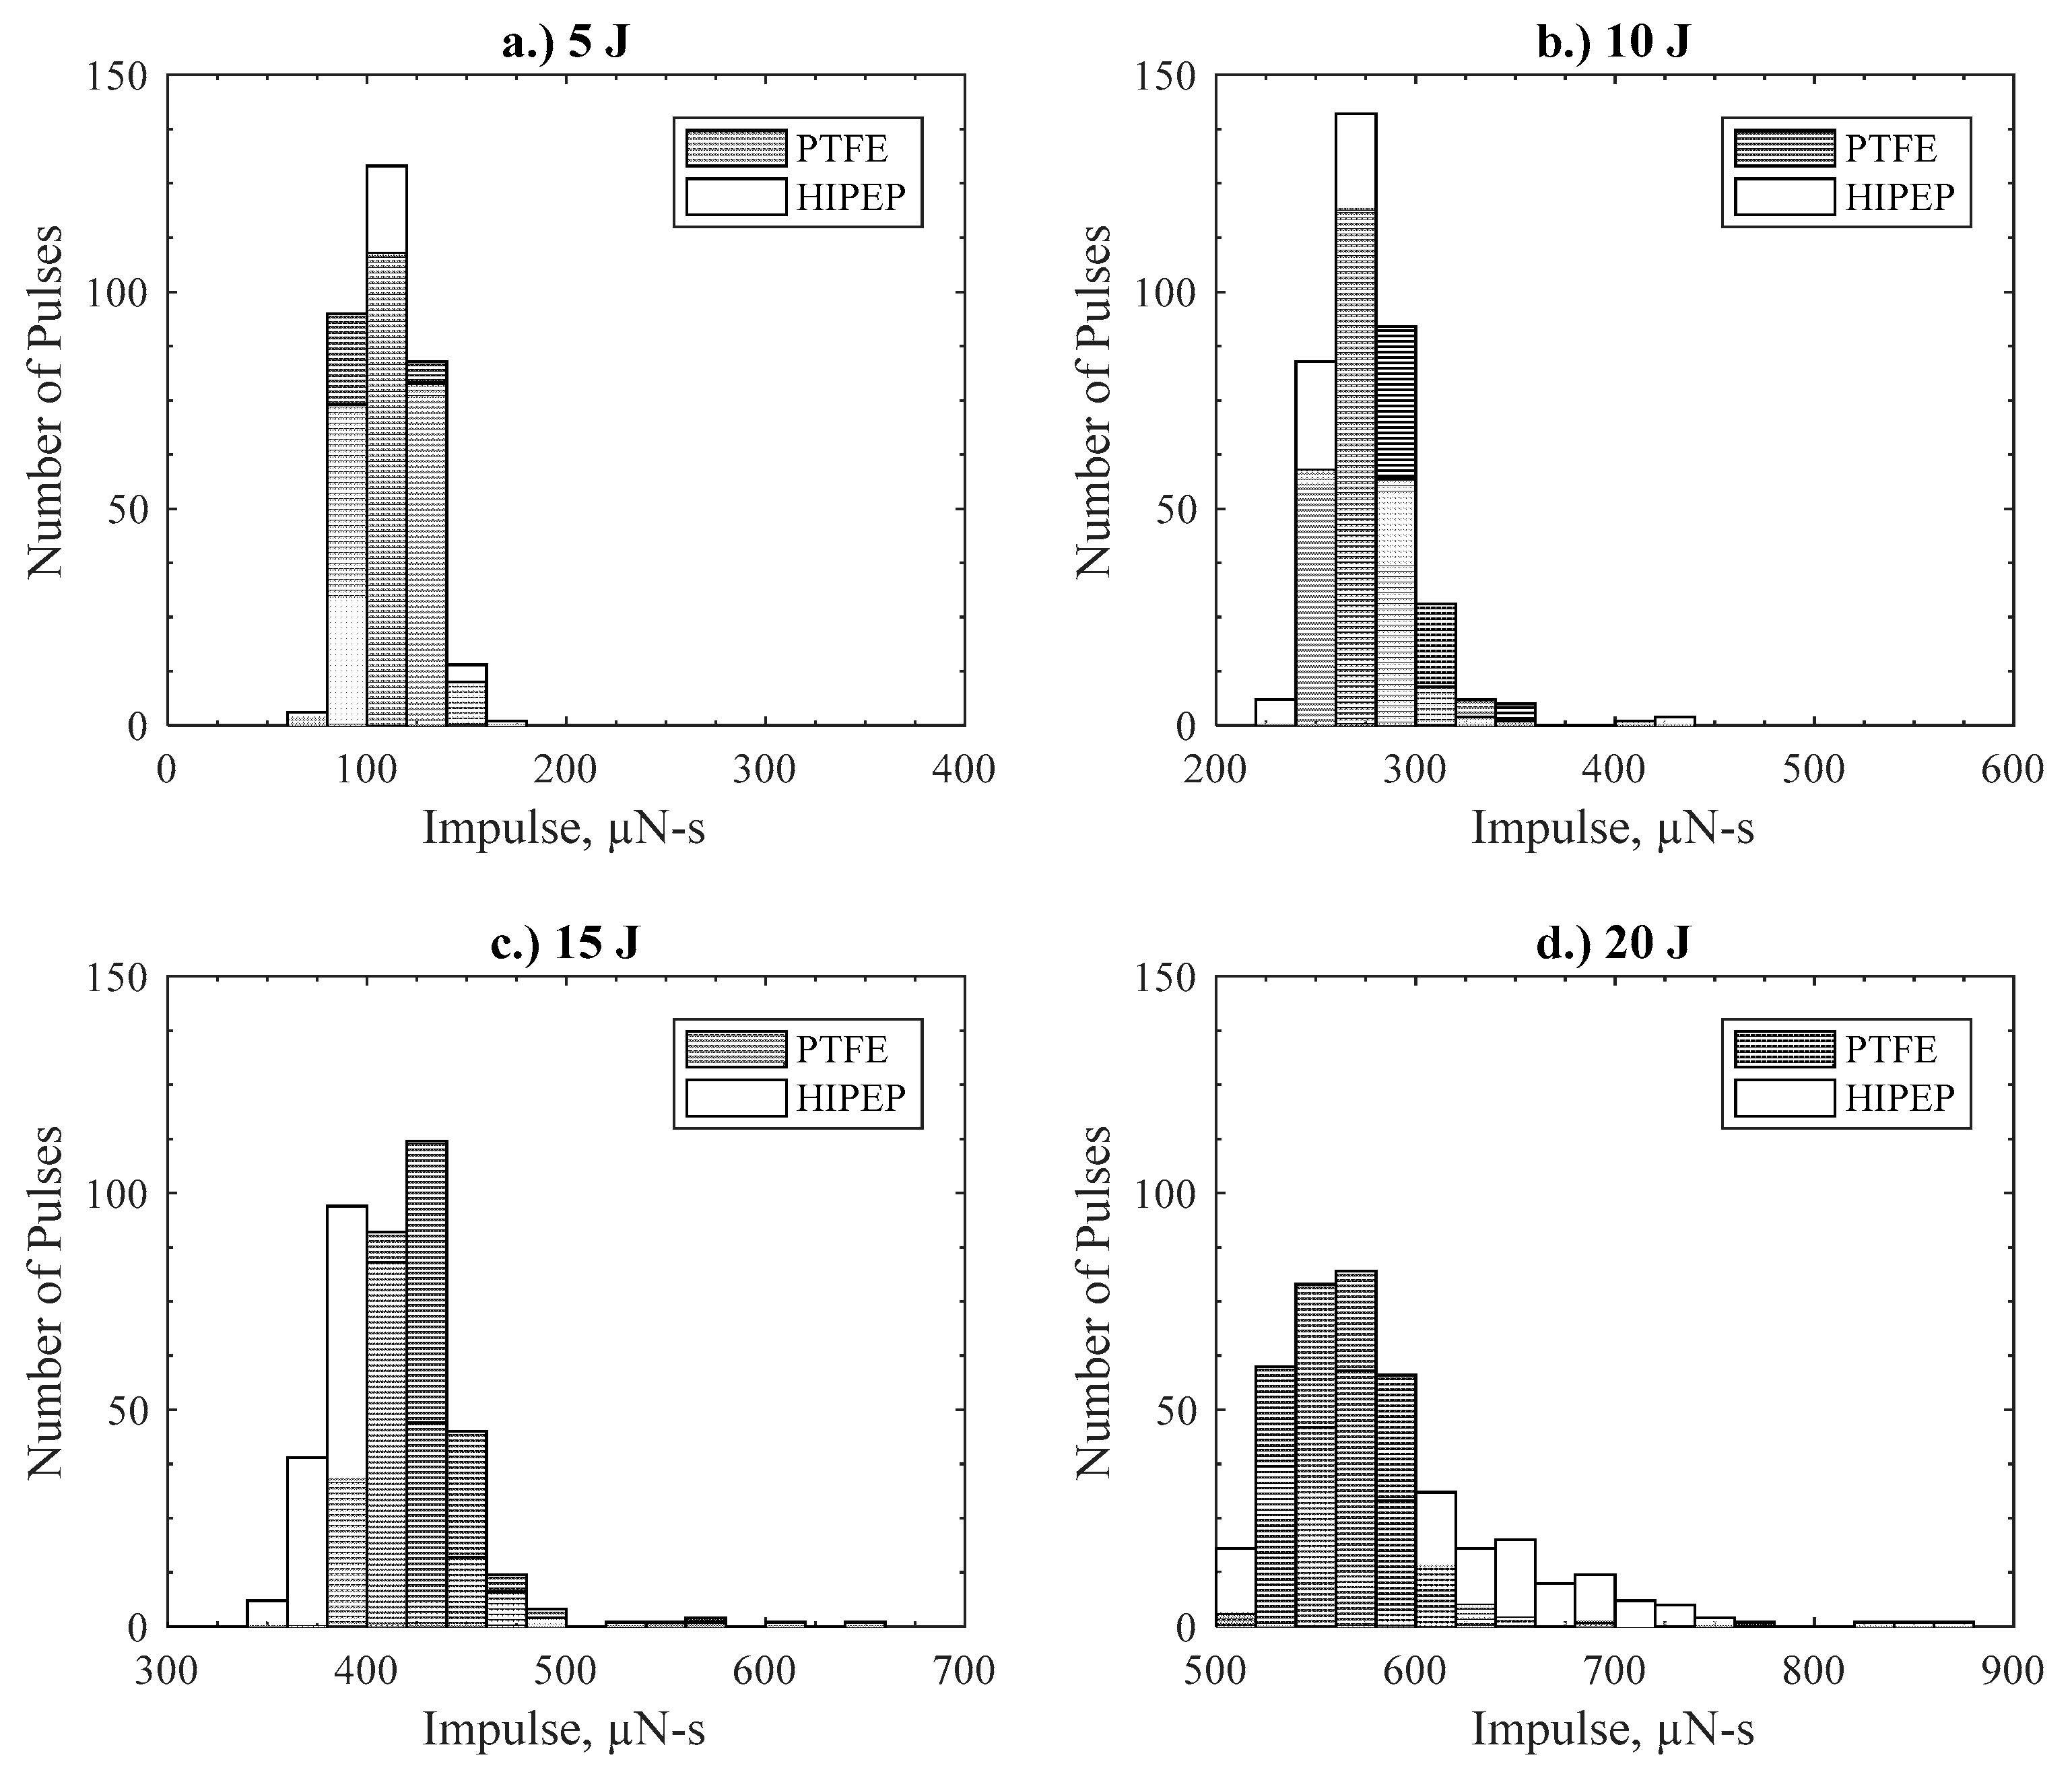
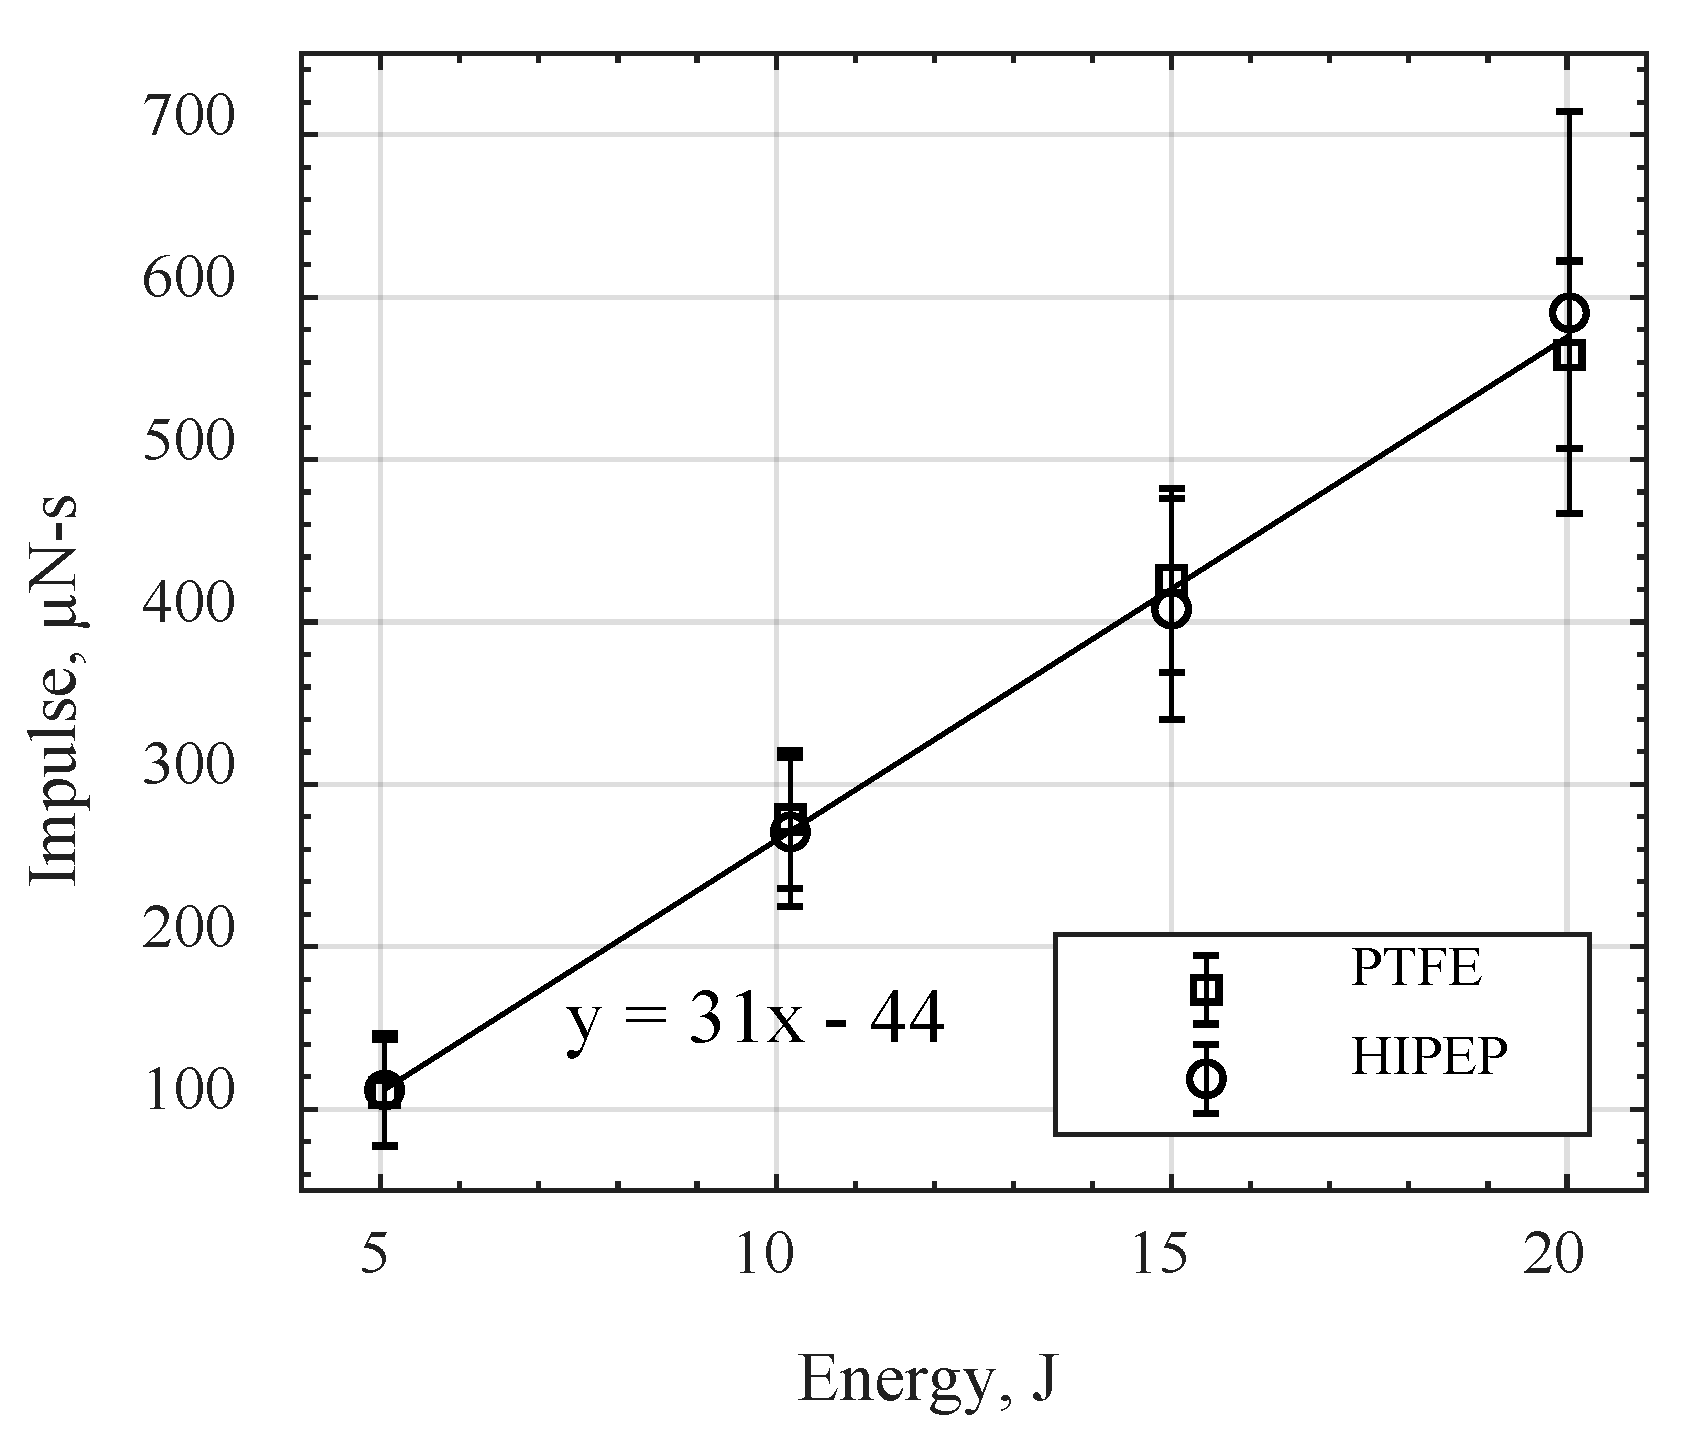
3.1. Short-Duration Tests

In our previous work, PTFE and HIPEP were tested in a similar device specifically designed to quantify the ablated mass per pulse [27]. The nominal test duration for that work was 100 pulses, which was initially selected as the test length for the short-duration test in this work. Each test begins with a 20 point calibration at the nominal base pressure of 2 × 10⁻⁵ torr. The high voltage power supply is then set to the voltage corresponding to the desired energy level and impulse testing begins. Each pulse is triggered remotely via a surface discharge igniter and imparts an impulse to the thrust stand which is recorded and post processed to yield the impulse bit by the method described in Section 2.3. Six separate 100 pulse test trials were conducted at each energy level, three for PTFE and three for HIPEP. A new propellant sample is used for each test trial, but no other parameters of the experiment are changed.
Typical impulse bit sets from one such test trial for each propellant is shown in Figure 4, normalized by the average impulse bit value over all 100 pulses. It is observed in the Figure 4 that the impulse bit varies about the mean and remains roughly constant, within the error bars (±20 µN-s), over pulses 10–100 for both propellants. However, it is noted that the measured impulse bit for the first pulse of each trial is 30%–40% greater than the average. Subsequent pulses 2–10 decrease in each trial until a rough steady state is achieved near the average value. The impulse bit then varies about the mean and remains roughly constant, within the error bars, through pulse 100. Only one test trial (HIPEP propellant, 20 J) deviated from this behavior as shown in Figure 4. In this trial, the impulse bits for pulses 1–10 were near the mean value of 608 µN-s, rather than 30% greater. An increasing trend over pulses 10–40 is observed before decreasing again to end near the mean of the other trials. While this trial deviated significantly from the typical trend observed in the other energy tests, the mean impulse bit of this trial is still similar to the other five trials at 20 J.
For each energy level (5, 10, 15, 20 J), three separate test trials were performed for each propellant. This yields 24 100-pulse trials, 12 trials for each propellant. All measurements from these trials are presented in histograms in Figure 5. The width of the histogram bars is 20 µN-s in Figure 5, equivalent to the error for a single impulse measurement. We observe in general that for each propellant there are four distinct groupings corresponding to the four energy levels, which are organized into the four subfigures of Figure 5. The HIPEP results are shown in white bars but are plotted semi-transparent such that where the bars overlap with PTFE results, a light gray bar is shown. Each group of measurements is roughly centered about the mean impulse value for each energy level. Additionally, we see that the number of impulse measurements in each group are quite similar between the two propellants for a given energy. Because the initial impulse measurements of each trial are up to 30% greater than the mean, there also exists a number of additional bins slightly greater than the mean value at each energy. Finally, the effect of the unique trial for HIPEP at 20 J can be clearly observed in Figure 5d, where the spread of measurements is much greater for HIPEP than for PTFE. The spread of impulse measurements is noticeably wider in the 15 and 20 J energy trials when compared with the 5 and 10 J trials for both propellants.
Figure 6 presents the impulse bits averaged over 300 pulses (3 propellant samples at 100 pulses each) at each energy level for each propellant, with error bars indicating two standard deviations above and below the average. Also shown in Figure 6 is a linear fit and coefficients of the results for both propellants. The y-intercept for this linear fit is not forced to be zero because the impulse is not linearly related to energy at low energy levels. Some finite discharge energy is required to overcome static friction and generate an impulse, thus, the y-intercept is negative. From the average impulse bit results in Figure 6, it is observed that impulse bit increases linearly with initially stored energy with a slope of about 30 µN-s/J for both propellants. Impulse bit values at each energy level are nearly identical between propellants. At the 20 J energy level, HIPEP exhibits an average impulse bit of 590 µN-s compared to 565 µN-s for PTFE, a difference of 25 µN-s, or about 5% which is still within the error of the experiment. This is the largest discrepancy between propellants at any energy, and 20 J is the only energy level where a larger impulse bit is measured for HIPEP. Standard deviation in impulse bit also increases with energy level for both propellants, but not at the same rate. The standard deviation for PTFE has a value of 16 µN-s at 5 J and 29 µN-s at 20 J, with a roughly linear slope between the two. At 5 J, HIPEP impulse bit standard deviation is 17 µN-s, similar to PTFE, but increases to 62 µN-s at the 20 J level. The standard deviation for HIPEP at 20 J was largely affected by the one anomalous short-duration trial previously discussed. As a result of this trial’s unique trend, the standard deviation for HIPEP measurements at 20 J is significantly increased compared to other energy levels and PTFE. Otherwise, the mean impulse bit at a given energy for HIPEP is typically ~95% of the mean impulse bit for PTFE, with increased variation (~10% larger standard deviation) about the mean.

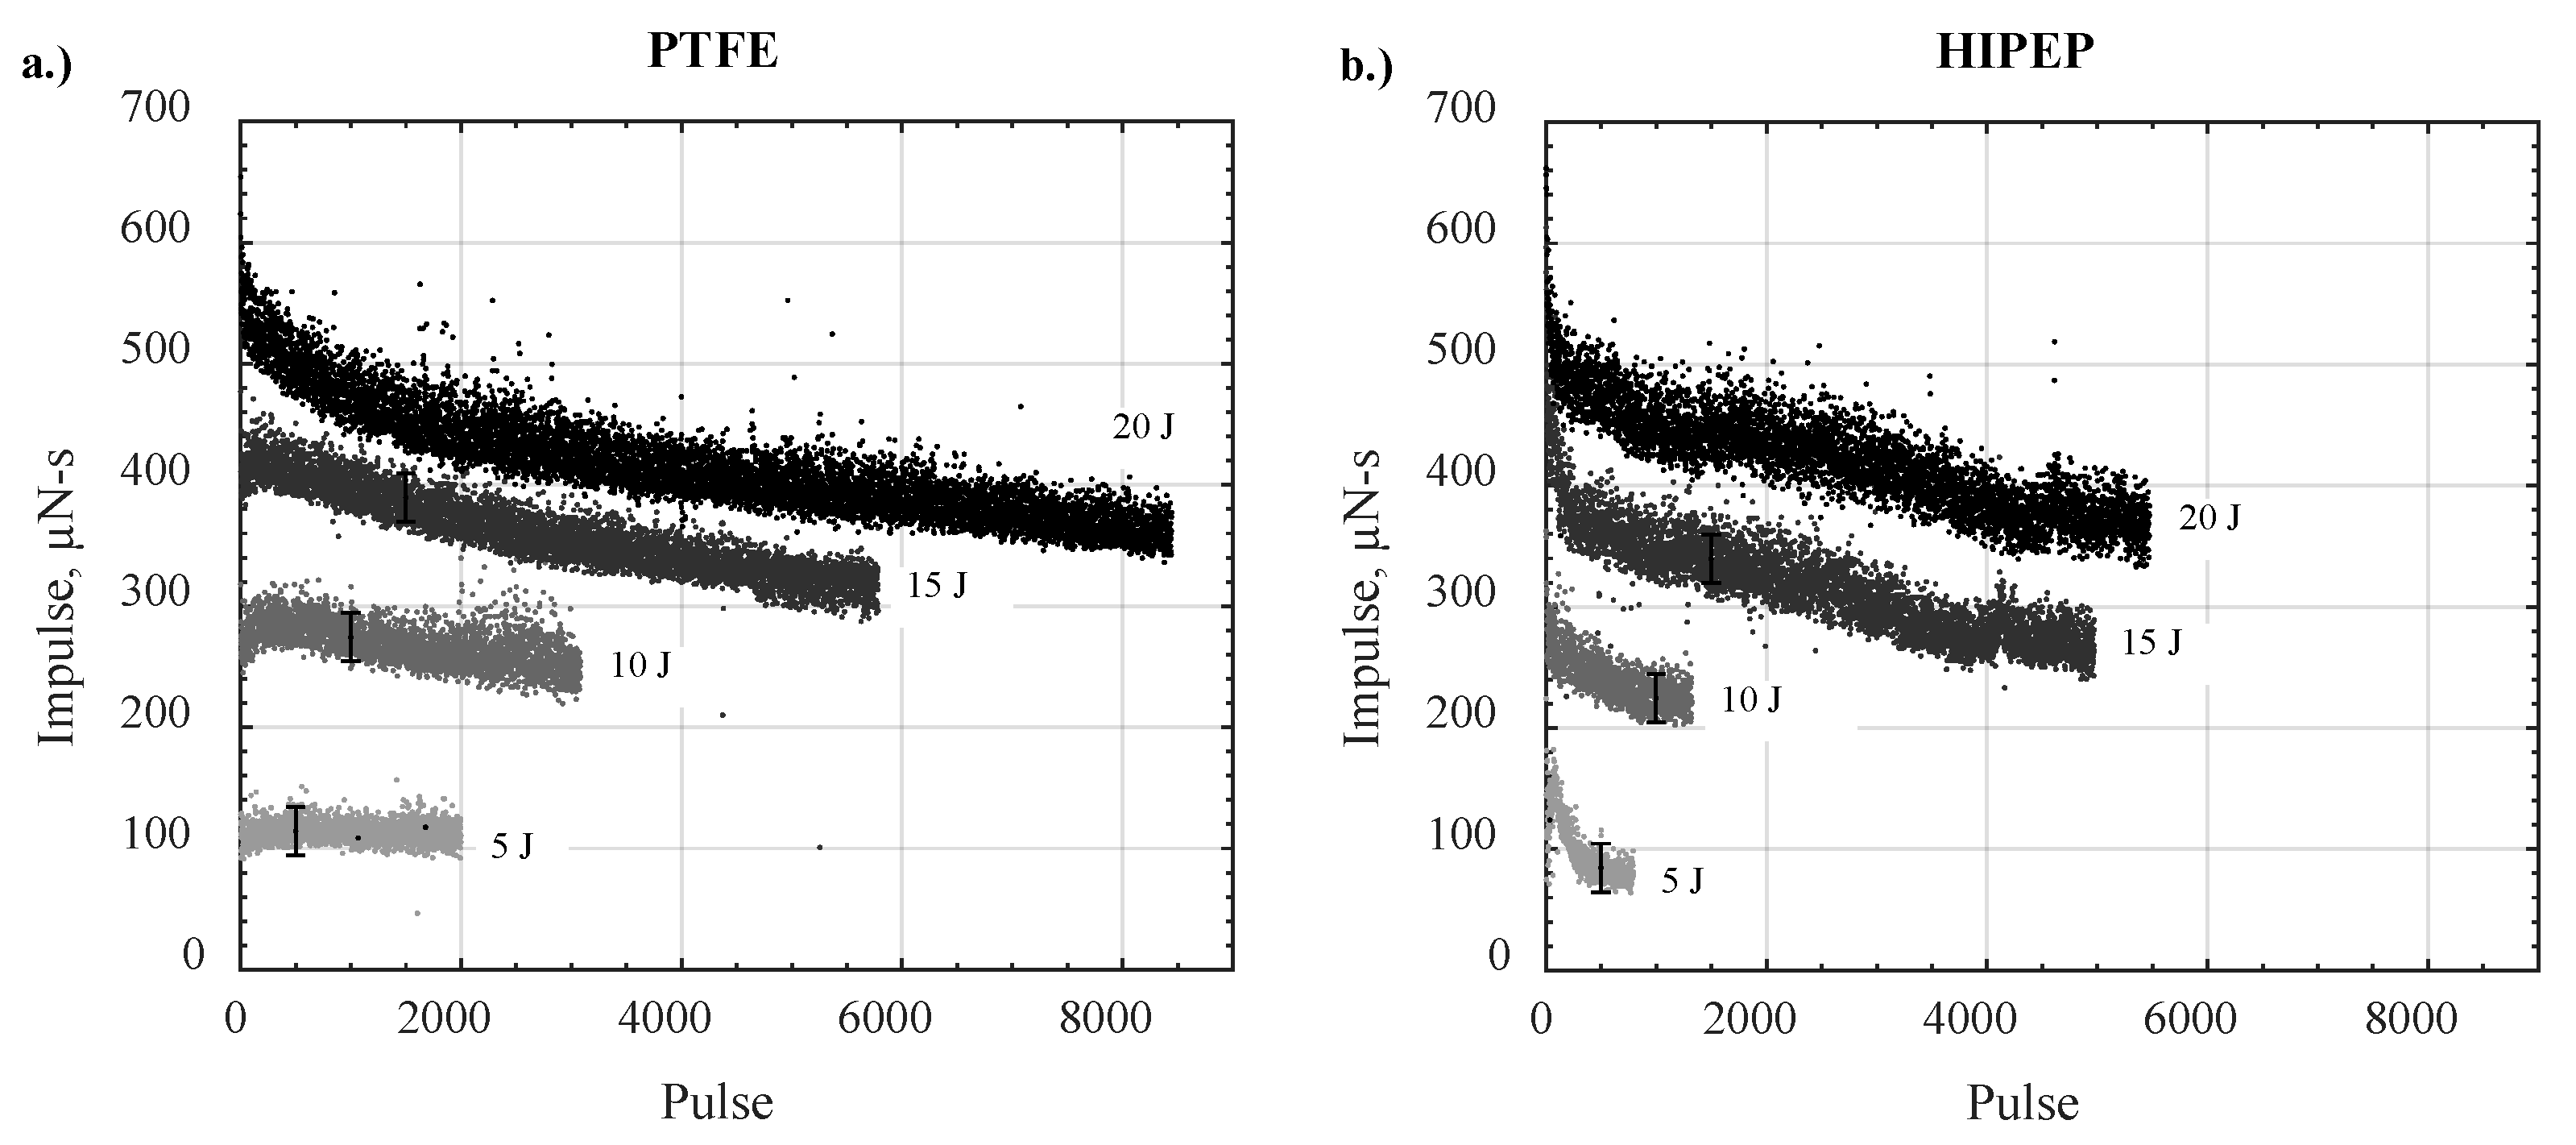
3.2. Long-Duration Tests

Also of interest in the present work is the trend of impulse bit over the entire lifetime of a propellant sample. Long-duration tests were conducted using the same EPTX device operating on HIPEP and PTFE propellant samples. In these tests, the device is pulsed at the same repetition rate, and the impulse bit is measured using the compact thrust stand as in the short-duration tests, but over a greater time period (>24 h). Automated pulsing of the EPTX device is achieved by use of a battery-powered timer circuit that triggers the surface discharge igniter every 22 s. At the beginning of its life, the inner diameter of a propellant sample is at the nominal dimension (6.35 mm) and the main arc discharge is repeatedly triggered by the igniter. Each discharge ablates propellant material from the inner wall of the sample and gradually increases the diameter of the propellant cavity. As this diameter increases, ignition of the arc discharge becomes more difficult, and the time between successive pulses increases to two or more multiples of 22 s. That is, the first trigger event may not initiate arc formation, but a second or third or subsequent trigger event may initiate arc formation. The end-of-test in this work is defined as the pulse number where the time between pulses is in excess of 1 h, which means 160 trigger events do not initiate arc formation. The long-duration test trials begin with fresh samples of nominal inner diameter and end at the sample end-of-life as previously defined. Figure 7 presents the measurements of impulse bit over these long duration tests for the four nominal energy levels and for each propellant. Error bars here show the estimated measurement error for a single impulse bit measurement (±20 µN-s).
In Figure 7, it should first be noted that for each long-duration trial, comparison of pulses 1–100 shows close agreement with the trends observed in short-duration testing (Figure 4). For example, a pulse 1 at 5 J using PTFE was measured to produce 130 µN-s and the impulse bit decreased to a mean value of about 115 µN-s over the first 100 pulses. Beyond pulse 100, the PTFE impulse bit measurements at 5 J in Figure 7a are largely constant, and the mean over the full lifetime is 114 µN-s. At increased discharge energy, over the duration of the test, a decreasing trend in impulse bit is observed. At 10 J, PTFE impulse bit measurements average 274 µN-s through 100 pulses, but 268 µN-s at end-of-life (3083 pulses). A rough linear fit indicates the impulse bit decreases by about 1.1 µN-s per 100 pulses for PTFE at 10 J. At 15 J, this decrease is slightly greater in magnitude (1.8 µN-s per 100 pulses) but still nearly linear, and the average over the 5783 pulses is 361 µN-s. At 20 J, the average over the full 8445 pulses is 418 µN-s and a decreasing trend is still observed, but the profile deviates from a linear shape. Furthermore, it is noted in Figure 7a that the lifetime of the test trial increases with discharge energy. Lifetime for PTFE is 8445 pulses at 20 J compared to 2000 pulses at 5 J. In Figure 7b, a similar trend of increasing lifetime with discharge energy is observed for HIPEP. This increase is most apparent between the 10 and 15 J energy levels, where pulse lifetime increases from 1323 to 4974 pulses. From beginning to end-of-life, however, slightly different trends are observed for HIPEP compared to PTFE. At 5 J, the decrease in impulse bit for HIPEP is much greater than for PTFE, decreasing by 19 µN-s per 100 pulses. Average impulse bit through pulse 100 is 120 µN-s, but a decreasing trend is observed through the final pulse, and the lifetime is much shorter than 5 J for PTFE (793 vs. 2000 pulses). For both propellants, the shortest lifetime in number of pulses is observed for the 5 J trial, and the longest lifetime is for the 20 J energy level, as noted in Figure 7. Average HIPEP impulse bits are typically about 90%–99% of the average value measured for PTFE for a given initial energy. Also, at each discharge energy the lifetime for the HIPEP samples is up to 60% less than PTFE. Finally, HIPEP impulse bit typically decreases more than PTFE over a shorter lifetime at a given energy.

4. Analysis and Discussion

Further details and discussion concerning the results presented in the previous section are provided here. The measured values of mass loss and impulse for each propellant are used to calculate the specific impulse for the device depending on propellant selection. Comparisons of these key metrics between the two propellants are a focus in this section.

4.1. Very Short Duration Tests

A key observation in the above results led us to conduct a third series of tests. The increased impulse bit over pulses 1–10 indicated that some form of propellant surface conditioning was occurring. Our initial hypothesis was that the ablation mass loss was also greater during these pulses, but we could not definitively test this hypothesis because no method was available to actively measure mass loss on a shot-by-shot basis. Consequently, we performed very short duration tests of only 10 pulses to better quantify the early-pulse mass loss. Testing and sample preparation procedures for very-short-duration 10 pulse tests were identical to those of the short-duration (100-pulse) tests, including pre-test vacuum drying and mass measurement. Results for 10-pulse trials at each energy level are shown in Table 1 alongside the average mass loss measured for 100-pulse trials. Also shown in the final column of Table 1 is the 10-pulse mass loss as a percent of the 100-pulse mass loss.
In Table 1 we observe that for similar conditions the early pulse mass loss for HIPEP is significantly greater than for PTFE. In 100-pulse tests, HIPEP mass loss is typically about twice that of PTFE. This is much less than in the 10-pulse tests, where the HIPEP mass loss is nearly six times that of PTFE. Second, while the mass loss of PTFE clearly increases with energy in 10-pulse trials, the same is not observed for HIPEP. Rather, the 10-pulse mass loss data for HIPEP appears to be independent of stored energy and is, on average, ~6 mg. Finally, we note that for all energy levels, the 10-pulse mass loss is 10%–11% of the 100-pulse mass loss for PTFE. This result indicates that PTFE mass loss is roughly constant for both the 10-pulse and 100-pulse intervals. For HIPEP, the mass loss during 10-pulse tests is much greater than 10% in all cases, indicating that a significant part of the mass lost during the 100-pulse tests was lost during the first 10 pulses.

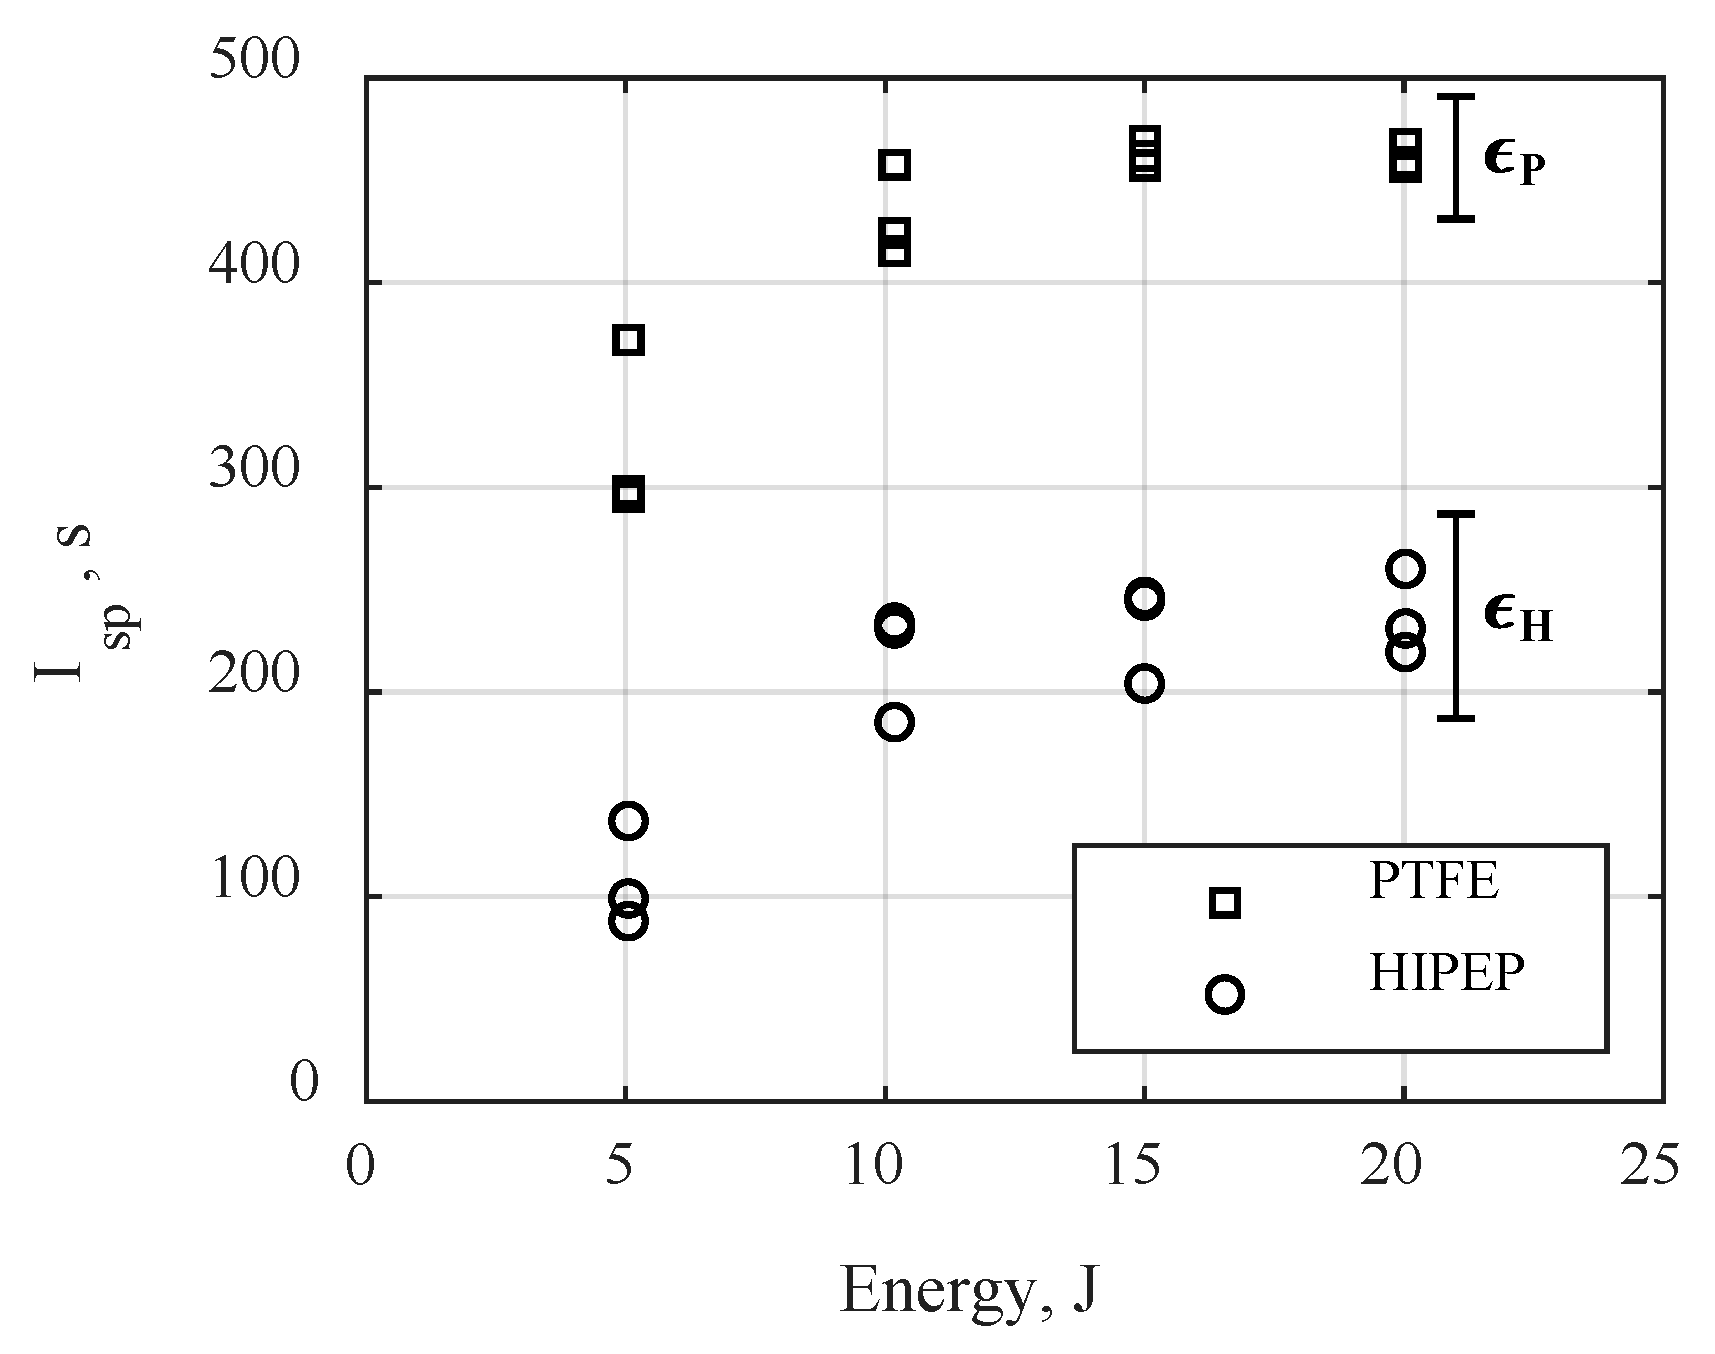
4.2. Specific Impulse

One of the most reported performance metrics for in-space propulsion devices is the specific impulse, or I s p . This quantity is expressed in seconds and describes the efficiency at which the device can generate thrust per unit mass of propellant. In this work, I s p is obtained by:
I s p = I t o t a l m g 0
where I t o t a l is the sum of all impulse bit measurements for a given trial and g 0 is the acceleration due to gravity. In a previous work, the ablation mass m was investigated in a similar device [27]. The same propellant sample preparation procedures were followed in this work, and similar mass losses were measured during short duration tests. In general, ablation mass increases in a linear fashion as a function of discharge energy. For PTFE, the ablation mass at 5 J is 35.3 µg/pulse which yields a specific ablation of 7.0 µg/J. For the other, higher energy levels, the specific ablation is on average a constant 6.3 µg/J. HIPEP ablation exhibits similar scaling, but at a specific ablation rate that is much greater than PTFE. At 5 J, the ablation mass of HIPEP is on average 106.8 µg/pulse or 21.0 µg/J, which is about three times that of PTFE. The specific ablation of HIPEP decreases to about 12.5 µg/J at the higher discharge energy levels tested. This is roughly twice that of PTFE. Because the measured impulse bits at all energy levels are nearly identical between the two propellants, the higher mass ablated per pulse for HIPEP results in a HIPEP specific impulse that is significantly lower than PTFE. The I s p of both propellants were calculated using Equation (9) for the short-duration (100 pulse) test trials and the results are presented in Figure 8. The measurement error for HIPEP ( ϵ H ) specific impulse is ±50 s based on mass loss measurement error of ±35 µg/pulse [27] and impulse measurement error of ±20 µN-s. For PTFE, the measurement error ( ϵ P ) is ±30 s. These errors are shown as representative error bars in Figure 8.
The specific impulse at 5 J is reduced for both propellants because of the increased ablation mass relative to stored energy. For PTFE, the average I s p at 5 J is 320 s compared to >400 s at the higher energy levels. HIPEP specific impulse at 5 J is on average 100 s, but is typically above 200 s at 10, 15, and 20 J. The reduced specific impulse at 5 J relative to a mostly constant value for other energies indicates this device may be operating in a different mode at low energy. One option is that a charring phenomenon observed in APPTs using PTFE as propellant at low energy is reducing the specific impulse. It has been observed in other work that excessive carbonization of the PTFE surface occurs if the local current density is below a certain threshold [35,36]. This charring leads to non-uniform ablation over the surface. It is possible that this non-uniformity may translate to non-uniform heating of the ablated material and thus a lower average exhaust velocity and specific impulse. Alternatively, at low discharge energies, the energy available for the arc discharge may be too low to sustain a breakdown across the entire gap, yielding an incomplete current channel that cannot dissipate the electrical energy efficiently. Although the EPTX device is not optimized as a thruster, its performance is near to that of other similar devices. The measured I s p for PTFE at 10 J or above in this work is comparable to other coaxial geometry APPTs using PTFE as propellant. For example, theUIUC coaxial PPT was measured to have specific impulse of 500–600 s operating with a stored energy of 7.5 J/pulse [10,33]. Various configurations of the ablative Z-pinch PPT, which possesses a geometry similar to the EPTX, exhibited a specific impulse in the range of 300–600 s [20]. On average, over the three higher energy levels, the specific impulse for PTFE is calculated to be 450 s, compared to 225 s for HIPEP. The measured impulse bits between propellants was virtually identical but the ablation mass for HIPEP was significantly greater. This leads to the conclusion that much of the additional mass ablated when operating with HIPEP does not appreciably contribute to increasing the impulse bit, but is expelled at a low average velocity. Furthermore, the observations made in Section 4.1 indicate that much of the additional mass ablated by HIPEP is ablated during the first few discharges.
This phenomenon of initially high and then decreasing impulse bit over the first few pulses has previously been observed in the literature for PTFE fueled ablation-fed devices [16,20]. The propellant surface is conditioned by the transient heating from the adjacent arc discharge resulting in the removal of impurities during those pulses. These impurities may be foreign particles on the surface acquired through handling or contact with a non-vacuum atmosphere. While PTFE is not porous or hygroscopic, it is expected that a small amount of moisture may reside on the surface as an impurity of the material before being subjected to the vacuum. These impurities add mass to the initial measurements, but evaporate or are expelled quickly during the first few pulses. In Table 1 we see that the first 10 pulses with PTFE exhibit a mass loss-per-pulse that is about 1% higher than the next 90 pulses. This indicates that the mass of impurities that are then expelled during propellant conditioning is quite small compared to the mass loss due to arc discharge ablation. Furthermore, a summation of the impulses in Figure 4 reveals that the sum total impulse for the first 10 pulses is about 10.8% of the sum total impulse for all 100 pulses. The additional mass (<1%) expelled due to surface impurities roughly translates to a relative increase of impulse (<1%) in the early pulses, indicating that on average the impurities are likely liberated by the arc discharge and accelerated to near the bulk plasma velocity.
As seen in Table 1 for HIPEP, the mass loss-per-pulse during pulses 1–10 is much greater than that of the 90 subsequent pulses. In the most extreme case, at 5 J, the mass lost in the first 10 pulses is more than 50% of the total mass loss over an entire 100-pulse test. However, using the data in Figure 4, the sum total impulse for the first 10 pulses is only 10%–11% of the sum total impulse from all 100 pulses. These combined observations indicate first that HIPEP has more mass loss attributed to surface impurities (and thus more mass loss in earlier pulses) relative to PTFE. They also indicate that the average gas velocity of these first few pulses is significantly reduced because the impulse bit remains unchanged. Because HIPEP is extremely hygroscopic, we attribute this phenomenon to water absorbed into the propellant. The propellant preparation procedure appears to effectively remove a considerable amount of water (typically 5%–6% propellant mass) by allowing it to slowly evaporate when exposed to vacuum conditions. It could be that some water absorbs deeper into the material, rather than just the surface. This deeply absorbed water would typically require a greater amount of time to evaporate in vacuum. The addition of thermal energy through arc discharge heating would greatly increase the evaporation rate and the commensurate mass loss rate. However, the fraction of early mass loss is significant and the vacuum drying process is sophisticated, so we expect that a majority of the absorbed water is released during this preparation. Prior to drying, the absorbed water molecules may chemically react with the propellant resulting in a surface layer of unknown chemical composition and thickness. This layer of unknown chemical composition would not revert to the original chemical composition of the propellant through a drying process. It is possible that this layer, which would be adjacent to the arc discharge for early pulses of a test, could ablate more readily than the standard propellant composition. However, it is difficult to quantify this potential effect at present. The HIPEP material is completely soluble in water, and in fact an entire slug used in this work may be dissolved in about10 mL of water. This makes it difficult to estimate the thickness of such a surface layer as there is no clear limit over time. An additional study investigating the penetration depth of atmospheric moisture into the material over time would need to be conducted. We have previously used a simple model to predict the mass ablated for a given ablation energy in this device [27]. This estimate (which is now seen to slightly overestimate HIPEP ablation relative to PTFE) was partially based on the chemical reaction incited in pure HIPEP unaffected by absorbed water. Both major constituents of HIPEP (HAN and PVA) are known to be soluble in water, but it is unclear if they would dissolve at the same rate. Between the two, HAN is more sensitive to temperature and present in a greater quantity, so a water solvated surface layer is likely composed mainly of HAN. Further, water molecules are capable of bonding with both the hydroxylammonium and the nitrate ions, forming HAN in a high purity aqueous form. When the water is then desorbed during vacuum drying, pure HAN crystals could remain on the surface, which are both irregular and highly heat sensitive.
Ultimately, the mass loss measurement for HIPEP is skewed artificially high because of the very high mass loss rates in the early pulses. As a result, commensurate specific impulse calculations for the duration of the test are skewed lower. In the interest of reporting a specific impulse that is ideally achievable, we develop a simple method to correct the average mass lost data. Specifically, we subtract the mass loss and total impulse measured in the first 10 pulses from results for 100-pulse mass loss and total impulse measurements, and then perform all the calculations to obtain the average mass loss-per-pulse and average corrected I s p using those remaining 90 pulses from the 100-pulse test. The 100 pulse average I s p values from Figure 8 and the corrected values for HIPEP are shown in Figure 9.
In Figure 9 we observe that the corrected I s p for HIPEP is greater than or equal to the previously measured values at each energy level. In fact, all but one corrected value at 20 J is greater than all of the previous results at that energy. This is the expected result, based upon the observation that a significant fraction sometimes constituting a majority of the mass is lost in early pulses. When we ignore this poor propellant utilization in early pulses, the overall specific impulse increases. At ≥10 J, the mean corrected I s p is about 300 s, with the data scattered relatively uniformly about that value. As before, the mean corrected I s p at 5 J is reduced when compared to the higher energy data, with an average value of 211 s.
In the long-duration testing, the thruster was operated until the trigger pulse could no longer initiate a discharge. As the number of discharges increase, the overall mass loss for an experimental data set will be larger and the initial mass loss for the first 10 pulses would become a decreasingly small portion of the overall mass loss. Consequently, we expect that the average mass loss-per-pulse based on pre- and post-test mass measurements of the propellant will start to approach the corrected average mass loss-per-pulse obtained for pulses 11–100 of the 100-pulse tests. We can also use the same method (subtract from the data set the mass loss and total impulse measured in the first 10 pulses) to correct the long-duration test data to quantify the effect of increased initial mass bits on calculated specific impulse. We observe that the raw calculated specific impulse of HIPEP does indeed appear to asymptotically approach the corrected value as the pulse number increases. In these long-duration tests (1000+ pulses), we find that the corrected specific impulse for HIPEP is very similar to the raw calculated value. As an illustration of this, the longest duration test on HIPEP involved 5474 pulses at 20 J. This resulted in an overall mass loss of 788 mg and a total impulse of 2.31 N-s, which yields a raw average specific impulse of roughly 300 s. The typical mass loss for the very short 10-pulse duration test conducted at 20 J was 6 mg and total impulse was approximately 5 mN-s. These values are both less than 1% of the long-duration test totals, limiting their overall influence on the average specific impulse calculated using the long-duration test data.
Furthermore, it was noted in our original tests that the 5 J energy level specific impulse values for both propellants is significantly decreased relative to the higher energy levels. While the exact cause of the reduction at the low energy is currently unknown, it is suspected that the stored energy is too low to sustain a uniform arc discharge in the given cavity geometry. As a result, the arc would be either incomplete or non-uniform, causing non-uniform wall ablation and heating of propellant in the cavity. Therefore, many of the observations in the present paper may only be valid for the 10–20 J energy range, and may not hold for lower energy discharges.

4.3. Thrust Mode Verification

In the present discussion, it is useful to divide both sides of Equation (8) by the initially stored energy, E 0 , yielding:
( I z ) EM   pinch E 0 = μ 0 8 π ( Ψ E 0 ) .
The value of Equation (10) may then be compared with the constant slope of the results presented in Figure 6 showing the total I b i t / E 0 for each test. The right-hand side of the normalized Equation (10) only depends on the quantity Ψ / E 0 , calculated by integration of the measured current. This quantity has a minimum value of 14 A2-s/J at 5 J and 20 A2-s/J at 20 J and is almost entirely dependent on the initial discharge energy. Variation in Ψ between the PTFE and HIPEP propellants at each discharge energy is at most 1 A2-s/J. For the range of Ψ values, the electromagnetic pinching contribution to the impulse bit is calculated to be 0.7–1.0 µN-s/J, or about 3%–5% of the total impulse bit measured in this work. This very low fraction of the measured impulse supports the assumption that the performance of the EPTX device is dominated by electrothermal acceleration mechanisms. This also helps explain the observed difference in specific impulse performance between propellants, even after correcting for the effects of absorbed water. HIPEP ablates more mass in a given energy discharge than PTFE, but the bulk temperature is lower because the energy available for heating is relatively constant in both cases. As a consequence, HIPEP exhibits reduced specific impulse despite similar arc discharge circuit parameters [27]. We conclude that the specific impulse depends strongly on the amount of propellant mass ablated in the discharge and is only very weakly dependent on the electric circuit parameters.

5. Conclusions

A compact thrust stand of inverted pendulum design was used to measure the impulse of an electrothermal APPT. This device was operated using both PTFE and an electric solid propellant, HIPEP. The impulse bit for PTFE was roughly 100 µN-s for 5 J of initial stored energy and it increased by about 30 µN-s per joule of additional stored energy. The impulse bit for HIPEP was typically 95–99% of PTFE, exhibiting similar trends at each of the four discharge energies tested (5, 10, 15, and 20 J). The device used in this work was not designed to be an optimized APPT, so the specific impulse for PTFE was low at roughly 450 s, which is at the bottom of the range of more optimized coaxial APPTs tested using PTFE. The ablated mass of HIPEP for a given discharge energy is typically double that of PTFE and, as a result, the calculated specific impulse is approximately half that of the thruster operating on PTFE. In the present work, we have found that the additional ablated mass of HIPEP does not increase the measured impulse when compared to operation with PTFE under identical testing conditions.
The average specific impulse per pulse was calculated from the total mass loss and impulse bit measurements for each pulse. This was found for PTFE to be relatively constant for a given discharge and not dependent on the total number of pulses, implying relatively constant surface conditions across the tests. The HIPEP propellant is significantly different in that it is a hygroscopic material, and absorbed water has been found to greatly affect the experimental results. Drying the material by exposure to vacuum allows much of the absorbed water to desorb and evaporate over about 24 h. However, there appear to be residual effects from the water. In a coaxial ablation-fed PPT, the result is increased ablation mass loss in the first several (about 10) arc discharges. The mass loss in these early pulses is up to 50% higher than later pulses, but the total impulse during the early pulses is only 10% higher. These observations are attributed either to the desorption of deeply absorbed water remaining in the propellant after the drying process or to a chemical reaction with absorbed water that forms a surface layer that ablates more readily. As a result, the average specific impulse for 100-pulse tests on HIPEP was only 225 s. Correcting these data by removing the first 10 pulses from the data set yields an average specific impulse for HIPEP of 300 s. Increasing the test duration to thousands of pulses significantly diminishes the effect of these early, high-mass-loss pulses on the average specific impulse. In the long-duration tests the average specific impulse is roughly the same as the value obtained from the 100-pulse tests when those data are corrected for the contribution of the first 10 pulses.

Author Contributions

M.S.G. conducted the impulse measurement experiments and analysis of results obtained, forming the initial writeup. J.L.R. advised the direction of experiments, and the organization of results and analysis, extensively editing initial draft. K.A.P. also advised in the interpretation of experimental results and lead the analysis of the electromagnetic thrust contribution. All authors have read and agreed to the published version of the manuscript.

Funding

This work was funded by NASA research grant NNX15AP31H.

Acknowledgments

M.S. Glascock would like to graciously thank the NASA Space Technology Research Fellowship program for funding his graduate research. This work was a significant part of that research and would not be possible without the support from this program. Additionally, the authors wish to thank DSSP for providing the HIPEP material in custom-made form for our research, as well as numerous discussions on the nuances of HIPEP operation and handling.

Conflicts of Interest

The authors declare no conflict of interest. The funders had no role in the design of the study; in the collection, analyses, or interpretation of data; in the writing of the manuscript; or in the decision to publish the results.

References

  1. Sawka, W.N.; McPherson, M. Electrical Solid Propellants: A Safe, Micro to Macro Propulsion Technology. In Proceedings of the 49th Joint Propulsion Conference, San Jose, CA, USA, 14–17 July 2013. [Google Scholar]
  2. Sawka, W.N. Controllable Digital Solid State Cluster Thrusters for Rocket Propulsion and Gas Generation. U.S. Patent 8464640, 18 June 2013. [Google Scholar]
  3. Dulligan, M. Electrically Controlled Extinguishable Solid Propellant Motors. U.S. Patent 7788900B2, 7 September 2010. [Google Scholar]
  4. Chung, K.; Rozumov, E.; Kaminsky, D.; Buescher, T.; Manship, T.; Valdivia, A.; Cook, P.; Anderson, P. Development of Electrically Controlled Energetic Materials. ECS Trans. 2013, 50, 59–66. [Google Scholar] [CrossRef]
  5. Grix, C.; Sawka, W.N. Family of Modifiable High Performance Electrically Controlled Propellants and Explosives. U.S. Patent 8888935B2, 18 November 2014. [Google Scholar]
  6. Sawka, W.N.; Grix, C. Family of Metastable Intermolecular Composites Utilizing Energetic Liquid Oxidizers with Nanoparticle Fuels in Sol-Gel Polymer Network. U.S. Patent 8317953B2, 27 November 2012. [Google Scholar]
  7. Baird, J.K.; Lang, J.R.; Hiatt, A.T.; Frederick, R.A. Electrolytic Combustion in the Polyvinyl Alcohol Plus Hydroxylammonium Nitrate Solid Propellant. J. Propul. Power 2017, 33, 1589–1590. [Google Scholar] [CrossRef]
  8. Hiatt, A.T.; Frederick, R.A. Laboratory Experimentation and Basic Research Investigation Electric Solid Propellant Electrolytic Characteristics. In Proceedings of the 52nd AIAA/SAE/ASEE Joint Propulsion Conference, Salt Lake City, UT, USA, 25–27 July 2016. [Google Scholar]
  9. Sawka, W.N.; Grix, C. Electrode Ignition and Control of Electrically Ignitable Materials. U.S. Patent 8857338B2, 14 October 2014. [Google Scholar]
  10. Burton, R.L.; Turchi, P.J. Pulsed Plasma Thruster. J. Propul. Power 1998, 14, 716–735. [Google Scholar] [CrossRef]
  11. Gatsonis, N.A.; Lu, Y.; Blandino, J.; Demetriou, M.A.; Paschalidis, N. Micropulsed Plasma Thrusters for Attitude Control of a Low-Earth-Orbiting CubeSat. J. Spacecr. Rockets 2016, 53, 57–73. [Google Scholar] [CrossRef]
  12. Keidar, M.; Zhuang, T.; Shashurin, A.; Teel, G.; Chiu, D.; Lukas, J.; Haque, S.; Brieda, L. Electric Propulsion for Small Satellites. Plasma Phys. Control. Fusion 2015, 57, 1–10. [Google Scholar] [CrossRef]
  13. Bushman, S.; Burton, R.L. Heating and Plasma Properties in a Coaxial Gasdynamic Pulsed Plasma Thruster. J. Propul. Power 2001, 17, 959–966. [Google Scholar] [CrossRef]
  14. Cheng, L.; Wang, Y.; Ding, W.; Ge, C.; Yan, J.; Li, Y.; Li, Z.; Sun, A. Experimental Study on the Discharge Ignition in a Capillary Discharge Based Pulsed Plasma Thruster. Phys. Plasma 2018, 25, 093512. [Google Scholar] [CrossRef]
  15. Wang, Y.; Ding, W.; Cheng, L.; Yan, J.; Li, Z.; Wang, J.; Wang, Y. An Investigation of Discharge Characteristics of an Electrothermal Pulsed Plasma Thruster. IEEE Trans. Plasma Sci. 2017, 45, 2715–2724. [Google Scholar] [CrossRef]
  16. Aoyagi, J.; Mukai, M.; Kamishima, Y.; Sasaki, T.; Shintani, K.; Takegahara, H.; Wakizono, T.; Sugiki, M. Total Impulse Improvement of Coaxial Pulsed Plasma Thruster for Small Satellite. Vacuum 2008, 83, 72–76. [Google Scholar] [CrossRef]
  17. Edamitsu, T.; Tahara, H. Experimental and Numerical Study of an Electrothermal Pulsed Plasma Thruster for Small Satellites. Vacuum 2006, 80, 1223–1228. [Google Scholar] [CrossRef]
  18. Miyasaka, T.; Asato, K.; Sakaguchi, N.; Ito, K. Optical Measurements of Unsteady Phenomena on Coaxial Pulsed Plasma Thrusters. Vacuum 2013, 88, 52–57. [Google Scholar] [CrossRef]
  19. Montag, C.; Herdrich, G.; Amo, J.G.d.; Bauer, P.; Feyhl, D. PETRUS 2.0 PPT and its CubeSat-size PPU: Testing and Characterization. In Proceedings of the 36th International Electric Propulsion Conference, Vienna, Austria, 15–20 September 2019. [Google Scholar]
  20. Markusic, T.E.; Polzin, K.A.; Choueiri, E.Y.; Keidar, M.; Boyd, I.D.; Lepsetz, N. Ablative Z-Pinch Pulsed Plasma Thruster. J. Propul. Power 2005, 21, 392–400. [Google Scholar] [CrossRef] [Green Version]
  21. Keidar, M.; Boyd, I.D.; Beilis, I.I. Electrical Discharge in the Teflon Cavity of a Coaxial Pulsed Plasma Thruster. IEEE Trans. Plasma Sci. 2000, 28, 376–385. [Google Scholar] [CrossRef]
  22. Keidar, M.; Boyd, I.D.; Beilis, I.I. Model of an Electrothermal Pulsed Plasma Thruster. J. Propul. Power 2003, 19, 424–430. [Google Scholar] [CrossRef]
  23. Ruchti, C.B.; Niemeyer, L. Ablation Controlled Arcs. IEEE Trans. Plasma Sci. 1986, PS-14, 423–434. [Google Scholar] [CrossRef]
  24. Schönherr, T.; Komurasaki, K.; Herdrich, G. Propellant Utilization Efficiency in a Pulsed Plasma Thruster. J. Propul. Power 2013, 29, 1478–1487. [Google Scholar] [CrossRef]
  25. Seeger, M.; Tepper, J.; Christen, T.; Abrahamson, J. Experimental Study on PTFE Ablation in High Voltage Circuit-Breakers. J. Phys. D Appl. Phys. 2006, 39, 5016–5024. [Google Scholar] [CrossRef]
  26. Wang, W.; Kong, L.; Geng, J.; Wei, F.; Xia, G. Wall Ablation of Heated Compound-Materials into Non-Equilibrium Discharge Plasmas. J. Phys. D Appl. Phys. 2017, 50, 074005. [Google Scholar] [CrossRef] [Green Version]
  27. Glascock, M.S.; Rovey, J.L.; Polzin, K.A. Electric Solid Propellant Ablation in an Arc Discharge. J. Propul. Power 2019, 1–10. [Google Scholar] [CrossRef]
  28. Glascock, M.S.; Rovey, J.L.; Williams, S.; Thrasher, J. Plume Characterization of Electric Solid Propellant Pulsed Microthrusters. J. Propul. Power 2017, 33, 870–880. [Google Scholar] [CrossRef]
  29. Glascock, M.S. Characterization of Electric Solid Propellant Pulsed Microthrusters. Master’s Thesis, Missouri University of Science and Technology, Rolla, MO, USA, 2016. [Google Scholar]
  30. Glascock, M.S.; Drew, P.D.; Rovey, J.L.; Polzin, K.A. Thermodynamic Properties of Hydroxylammonium Nitrate-Based Electric Solid Propellant Plasma. J. Therophys. Heat Transf. 2020, 1–8. [Google Scholar] [CrossRef]
  31. Glascock, M.S.; Rovey, J.L.; Williams, S.; Thrasher, J. Observation of Late-Time Ablation in Electric Solid Propellant Pulsed Microthrusters. In Proceedings of the 52nd AIAA/SAE/ASEE Joint Propulsion Conference, Salt Lake City, UT, USA, 25–27 July 2016. [Google Scholar]
  32. Goldston, R.J.; Rutherford, P.H. Introduction to Plasma Physics; Taylor & Francis Group: New York, NY, USA, 1995. [Google Scholar]
  33. Wilson, M.J.; Bushman, S.; Burton, R.L. A Compact Thrust Stand for Pulsed Plasma Thrusters. In Proceedings of the 25th International Electric Propulsion Conference, Cleveland, OH, USA, 24–28 August 1997. [Google Scholar]
  34. Polk, J.E.; Pancotti, A.; Haag, T.; King, S.; Walker, M.L.R.; Blakely, J.; Ziemer, J. Recommended Practice for Thrust Measurement in Electric Propulsion Testing. J. Propul. Power 2017, 33, 539–555. [Google Scholar] [CrossRef] [Green Version]
  35. Keidar, M.; Boyd, I.D.; Antonsen, E.L.; Burton, R.L.; Spanjers, G.G. Optimization Issues for a Micropulsed Plasma Thruster. J. Propul. Power 2006, 22, 48–55. [Google Scholar] [CrossRef]
  36. Keidar, M.; Boyd, I.D.; Antonsen, E.L.; Gulczinski, F.S., III; Spanjers, G.G. Propellant Charring in Pulsed Plasma Thrusters. J. Propul. Power 2004, 20, 978–984. [Google Scholar] [CrossRef] [Green Version]
Figure 1. Diagram of the electric propellant thruster experiment (EPTX).
Aerospace 07 00070 g001
Figure 2. (a) Diagram of the inverted-pendulum design UIUC Compact Thrust Stand and (b) photograph of the thrust stand and the EPTX device and capacitors mounted on the stand.
Aerospace 07 00070 g002
Figure 3. Typical pre-test thrust stand response calibration data as a function of applied impulse bit (bottom) and corresponding standardized residuals for the response data (top).
Aerospace 07 00070 g003
Figure 4. Impulse bit measurements representative of most trials normalized by average impulse bit.
Aerospace 07 00070 g004
Figure 5. Histograms of all impulse measurements from short duration tests for (a) 5 J, (b) 10 J, (c) 15 J, and (d) 20 J initially stored energy.
Aerospace 07 00070 g005
Figure 6. Average impulse bit over all short-duration tests at each initial energy for each propellant (error bars are a 2- σ standard deviation).
Aerospace 07 00070 g006
Figure 7. Impulse measurements for long-duration tests with (a) polytetrafluoroethylene (PTFE) and (b) high-performance electric propellant (HIPEP) propellant.
Aerospace 07 00070 g007
Figure 8. Specific impulse as a function of energy for each short-duration test for each propellant. Representative error bars are shown for HIPEP ( ϵ H ) and PTFE ( ϵ P ).
Aerospace 07 00070 g008
Figure 9. Average specific impulse as a function of discharge energy for each short-duration tests as a function of propellant type and discharge energy, with both raw and corrected HIPEP data.
Aerospace 07 00070 g009
Table 1. Ablation mass loss for 10- and 100-pulse tests.
PropellantEnergy, JTotal 10-Pulse Mass Loss, mgTotal 100-Pulse Mass Loss, mgRatio of 10-Pulse to 100-Pulse Mass Loss, %
PTFE5.050.373.5310.5%
10.180.706.9110.1%
15.001.009.4710.6%
20.031.2812.4810.3%
HIPEP5.055.8210.6850.7%
10.186.4213.3348.2%
15.006.0218.4332.7%
20.036.1426.0623.6%

