Abstract
Airport security checkpoints are the most important bottleneck in airport operations, but few studies aim to empirically understand them better. In this work we address this lack of data-driven quantitative analysis and insights about the security checkpoint process. To this end, we followed a total of 2277 passengers through the security checkpoint process at Rotterdam The Hague Airport (RTM), and published detailed timing data about their journey through the process. This dataset is unique in scientific literature, and can aid future researchers in the modelling and analysis of the security checkpoint. Our analysis showed important differences between six identified passenger types. Business passengers were found to be the fastest group, while passengers with reduced mobility (PRM) and families were the slowest two groups. We also identified events that hindered the performance of the security checkpoint, in which groups of passengers had to wait long for security employees or other passengers. A total of 335 such events occurred, with an average of 2.3 passengers affected per event. It was found that a passenger that had a high luggage drop time was followed by an event in 27% of the cases, which was the most frequent cause. To mitigate this waiting time of subsequent passengers in the security checkpoint process, we performed an experiment with a so-called service lane. This lane was used to process passengers that are expected to be slow, while the remaining lanes processed the other passengers. It was found that the mean throughput of the service lane setups was higher than the average throughput of the standard lanes, making it a promising setup to investigate further.
1. Introduction
After the devastating September 11 attacks, airport security has changed considerably. More and more measures were implemented, making the airport a more secure place. At the same time, passenger numbers have increased significantly since then as well. With this increase in passenger numbers, as well as increased security measures per passenger, a large increase in costs occurred. Where the United States spent $2.2 billion on airport security in 2002, they spent almost $8 billion in 2013 [1]. About a quarter of the operating costs of an airport is allocated to security nowadays [2].
Apart from these high costs, passengers travelling by aircraft experience high amounts of stress [2]. These stress levels are caused by the potential for adverse air travel events, angry reactions to other passengers and a lack of belief that airline/airport will ensure comfort and security [3].
To address this, the performance of the most important security measure, the security checkpoint, should be improved. Current measures to improve the security checkpoint process are focused at reducing stress levels for passengers, or aim to increase the throughput of the security checkpoint. For instance, Schiphol implemented a centralized security checkpoint, which uses natural light, plants, and a curved design to create a calm and stressless environment for passengers [4]. Other measures are implemented to increase throughput of the security checkpoint process. Programs such as TSA PreCheck [5] and Schiphol Privium [6] allow frequent travellers to undergo a reduced and therefore faster security check. TSA PreCheck claims theoretical throughput benefits of up to a factor two, although they have not been confirmed by empirical tests [7,8].
Only few studies can be found in literature that aim to empirically understand airport security checkpoint processes better. However, qualitative work in this direction is done by Kirschenbaum [2,9,10], who analyzed social aspects of airport security checkpoint processes. He argues that the security checkpoint process is above all a social process. Passengers constantly negotiate with employees, influencing the overall performance of the security checkpoint. Kirschenbaum reports some higher-level quantitative data related to the security checkpoint process, but it lacks specific details that allow researchers to find improvements for the security checkpoint.
More quantitative timing data on the security checkpoint process was provided by Leone and Liu [11]. They report data related to passenger arrival times, X-ray image inspection times, decision type (cleared or not-cleared), physical search service times and explosives trace detection (ETD) service times. However, they do not report data that specifies how long passengers take to drop or collect luggage. Furthermore, the passenger type is not included either in their dataset. The authors only provide summary figures that describe the data, but do not provide the raw data. To the best of our knowledge, no security checkpoint dataset with a large amount of details exists is available in literature.
In this work we address this lack of data-driven quantitative analysis and insights about the security checkpoint process. To this end, we followed a total of 2277 passengers through the security checkpoint process at Rotterdam The Hague Airport (RTM), and noted detailed timing data about their journey through the process. Furthermore, passenger characteristics, such as group size and passenger type, were noted for each passenger as well. The dataset as discussed in this work is unique in literature due to its high level of detail, and our analysis of this dataset provides novel insights in the security checkpoint process.
While gathering this data, we observed that slow passengers have a negative effect on the waiting time of subsequent passengers in the security checkpoint process. To mitigate these effects, it was proposed to implement a so-called service lane. This service lane is used to process passengers that are expected to be slow, while the remaining lanes (called normal lanes) process the other passengers. The implementation of such a service lane was projected to have two benefits: (1) an increased overall throughput of the security checkpoint system, and (2) a higher satisfaction of passengers with the security checkpoint process. We performed an experiment to assess the throughput performance of the service lane setup, and report on the analytical results in this paper.
The main contributions of this work are twofold. First, a detailed data-driven quantitative analysis on the workings of the airport security checkpoint is provided, gaining valuable insights into this important airport bottleneck. Second, the performance of a service lane setup for airport security checkpoints is analyzed, and compared to the performance of standard setups. All data is made publicly available in a repository [12].
This dataset will be useful for calibration, verification and validation of models developed by other researchers. This was often troublesome, as detailed quantitative data was lacking. Furthermore, data-driven analysis, as we provide in this work, can be performed with our dataset.
This paper is structured as follows. Section 2 provides an overview of the security checkpoint data that is analyzed this work. Then, Section 3 provides an analysis of the dataset, with a special focus on passenger types and the propagation of delay in security checkpoint lanes. Section 4 describes the service lane experiment that we performed, together with an analysis on the performance of such a setup. Finally, Section 5 provides a discussion and Section 6 concludes this paper along with an overview of future research directions.
2. Data Overview
This section provides an overview of the security checkpoint data that was gathered at Rotterdam The Hague Airport. All data was manually collected by researchers using camera footage, which was a labour intensive task. The size and specificity of the dataset is unique in scientific literature; no paper refers to a dataset such as the one described and analyzed in this work. We provide the dataset in a publicly available repository as well [12].
As in most airports, a security checkpoint lane at Rotterdam The Hague Airport consists of several parts. First, it has a place where passengers can drop luggage into boxes. This process is supervised by the luggage drop officer. These boxes are then passed through an X-ray machine, which is operated by an X-ray officer. Passengers move through a walk through metal detector (WTMD), after which they receive an optional ETD check or patdown by an ETD officer or patdown officer. Finally, passengers collect their luggage. At this time, an optional luggage check can be performed by a luggage check officer. This is visually outlined in Figure 1.
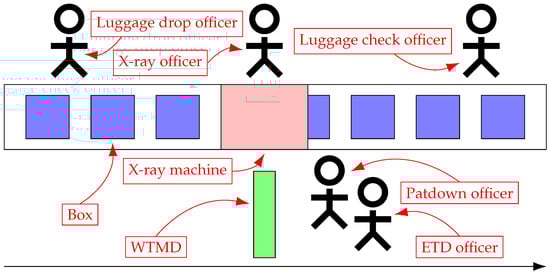
Figure 1.
Graphical representation of a security checkpoint lane with its employees. The most important elements are labelled. The black line indicates the direction in which the passenger moves.
Data was collected for 13 different security checkpoint lanes, in 11 blocks of time. In many of these time blocks, data for a single lane was collected, while multiple lanes were open. A total of 2277 passengers, flying to 16 different destinations with 48 flights were followed. Three types of lanes were considered: standard, normal and service lanes. Data for standard lanes was gathered between 23 February 2018 and 17 April 2018, while data for normal and service lanes was collected on the experimental days: 17 December 2018 and 18 December 2018. Days and times were chosen based on isolated blocks of flights that were scheduled, such that all passengers were expected to fly with these flights. Table 1 provides an overview of the data that was collected. The experiment was performed between 05:00–07:15, as this was the busiest period of the selected days. This table shows the names of the lanes, along with the date and time the data was collected. Furthermore, the number of passengers that passed through the lane is presented, along with the total number of lanes that were open during the time data was collected. Finally, the total number of flights in the flight block immediately after the data collection time is included in this table as well.

Table 1.
An overview of the data that was collected. Passengers refers to the number of passengers that were observed in the lane, and open lanes is the number of security checkpoint lanes that were simultaneously open in the considered period. Flights is the total number of flights in the flight block immediately after the data collection time. Dates marked with * are either Saturday or Sunday (weekend days).
For each passenger in the dataset, two types of data were collected: passenger characteristics and passenger timing. The specific type of data that was collected is shown in Table 2, along with example data of two passengers. One of the collected parameters is that of passenger type. Six passenger types are considered in the data, based on [13,14] and discussions with experts at the airport. Table 3 specifies these passenger types and how they were manually classified by the data collectors. In some cases passengers were grouped into two categories (i.e., young and business), when a passenger fitted multiple types.
Table 2.
The data that was gathered for each passenger in the dataset, along with example data of a slow and a fast passenger.
Table 3.
The different passenger types as used in this work, and the observable characteristics based on which they were classified.
A passenger was considered either experienced or inexperienced based on their behaviour and apparent familiarity with the security checkpoint. An experienced passenger for instance had limited interaction with security officers, and started preparing for the luggage drop process early. Inexperienced passengers did not show this type of behaviour.
Based on observed group behaviour (i.e., passengers talking with each other, and physical distance between passengers), the size of the group that a passenger was travelling with was determined. A parent travelling with a young child that needed supervision was considered a single passenger. However, the child was counted towards the group size of the passenger. For instance, a mother travelling with a young child has a single entry in the dataset, but is counted as a group of two.
For each of the passengers, we extracted a set of process durations from the entries in Table 2. These are frequently used in the remainder of this paper and shown in Table 4.
Table 4.
The extracted process duration from the gathered data, based on the entries as specified in Table 2.
3. Security Checkpoint Analysis
This section analyzes the performance of six different passenger types in the security checkpoint. First, we analyze the performance and differences between the different passenger types going through the security checkpoint (Section 3.1); and second, we analyze events in which passengers experience high waiting times (Section 3.2).
3.1. Passenger Types
In this section, the dataset is analyzed with a special focus on the six passenger types. The distributions of passenger types in the 13 different security checkpoint lanes is shown in Figure 2. This figure also shows an aggregate distribution of all passengers in the dataset. About one in six passengers in the dataset is of type business (16.1%), and about 20% is a senior passenger. 9% of passengers falls in the family category, and 14% is a young passenger. Less then 1% of passengers falls in the PRM category, and the remaining 40% of passengers is a regular passenger. Comparing this distribution of passengers type to passenger statistics of 2017 [15], we found that they correspond well. 23% of passengers in that year were 60 years or older, as compared to 20% in our dataset. Furthermore, 21% of passengers indicated to travel for business, while our dataset contained 16% business travelers. In our dataset 14% of passengers were identified to be young, while 13% of passengers were between 21 and 30 years old in 2017.
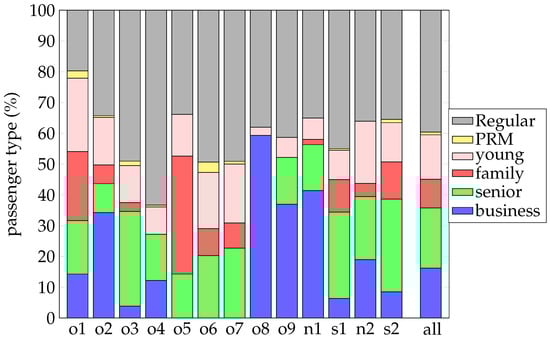
Figure 2.
The distribution of passenger types for the 13 different security checkpoint lanes.
Lane o1 had the highest percentage of young passengers, possibly due to a city trip destination (Budapest) and skiing destination (Innsbruck) in the flight block. Lane o2 had many business passengers, while lane o3 had most senior passengers. This is due to a flight to Alicante in the flight block, which is considered a senior destination. Lane o4 had no family passengers, potentially due to it being a Monday outside the school holiday period, instead of a day closer to the weekend or in a school holiday. Lane o5 saw a large portion of family passengers (38%) due to a flight mix with mostly family trip destinations. Lanes o5-o7 saw no business passengers as there were no typical business destinations in these periods. Lane o8 had almost 60% of business passenger, as both flights in that flight block were business flights. Lane o9 again had a large proportion of business passengers, as only a single flight to London was scheduled. The normal and services lanes n1 through s2 are discussed in more detail in Section 4.1.
Figure 3 show the mean processing times for the six passenger types, split into five distinct subprocesses of the security checkpoint. The figure shows that business passengers move through the security checkpoint fastest (168 s), while PRM passengers are slowest (207 s). This is an expected result: business travelers are generally more experienced in the security checkpoint process, while PRM passengers require additional support to go through the security checkpoint process. The above-described results are also significant: the business passenger is significantly faster than any other passenger.
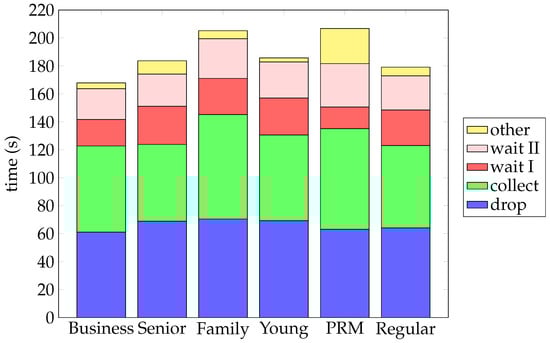
Figure 3.
The mean processing times, split into five subprocesses, for each of the passenger types in the dataset.
Family passengers are the second slowest group (mean security checkpoint time of 205 s), and have even higher mean drop and collect times. The parents often have to watch their kids and carry more luggage, while going through the security checkpoint. This leads to high mean security checkpoint times for these passengers. Security checkpoint time differences are significant for the family passenger as compared to other groups as well. Only with PRM passengers, no significant difference could be found due to the small size of this group.
Only due to a lower mean other time, family passengers are faster than PRM passengers. The other time consists of extra checks, such as ETD checks, luggage checks and patdowns, and are quite commonplace for PRM passengers. While being the slowest passenger type, the wait I time is lowest for PRM passengers. A likely explanation for this low waiting time of PRM passengers is that multiple employees aim to help this passenger, leading to lower times.
Young passengers showed similar security checkpoint times (186 s) as senior passengers (184 s) and regular passengers (179 s). Young passengers have the second highest luggage drop time (69 s), and the second highest wait time (wait I + wait II = 52 s). While being relatively slow, young passengers have the lowest mean other time of all passenger types (3 s).
Compared to our initial expectations, young passengers were slower than expected. These initial expectations are based on results as provided by Schultz [13], who states that passengers of age 25 have the highest walking speed. However, Pitchforth [16] shows that the age of arriving passengers has the second lowest influence of seven parameters on their processing speed.
The differences in other time can be understood better by observing Figure 4 and Figure 5. Figure 4 shows the proportion of passengers that receive a patdown, and the corresponding mean times this patdown takes. PRM passengers receive a patdown in over 50% of the cases, while business passengers receive a patdown in less than 3%. Business passengers are familiar with the processes and do not take illegal items with them. PRM passengers often do not go through the WTMD, and therefore have to be checked manually. Mean patdown times are from 12 s (young) to 35 s for PRM passengers. These differences can occur due to the type of check that is performed. PRM passengers often received a full patdown as they do not always go through the WTMD. Young passengers frequently identify the item that triggered the WTMD alarm quickly.
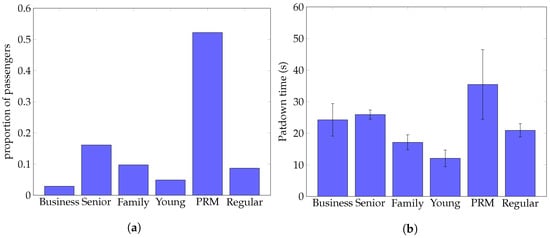
Figure 4.
Statistics related to patdowns for the six different passenger types in the entire dataset. (a) The
proportion of passengers that receive a patdown. (b) The mean patdown time of passengers, along with
the standard errors.
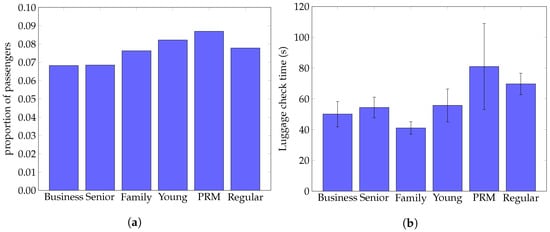
Figure 5.
Statistics related to luggage check for the six different passenger types in the entire dataset.
(a) The proportion of passengers that receive a luggage check. (b) The mean luggage check time of
passengers, along with the standard errors.
Figure 5 shows proportion of passengers that receive a luggage check, and the corresponding mean times this luggage check takes. Luggage check percentages range from 6.8% (business) to 8.7% (PRM). Mean luggage check times for different passenger types have a large variation: they range from 41 s (family) to 81 s (PRM). The low luggage check time for families might be due to a relative quick check of baby milk that is commonly performed.
The mean group size and mean number of boxes for the different passenger types are shown in Figure 6. All passenger types travel in groups of about 2 (on average), but business passengers predominantly travel alone (mean group size of 1.3 passengers), and a family travels in larger groups (mean group size of 3.6 passengers). PRM passengers use the lowest number of boxes (1.4 boxes on average), and business passengers use the most (2.3 boxes on average). Business passengers often carry laptops that have to be put in a separate box. PRM passengers are commonly accompanied by a caretaker, who carries most of the personal belongings of the PRM passenger.
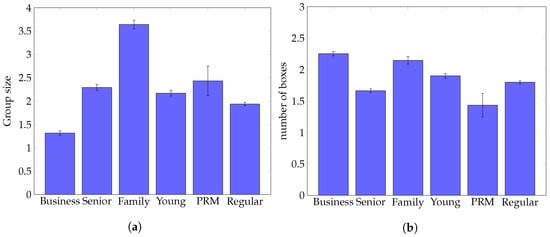
Figure 6.
Statistics related to group sizes and number of boxes for the six different passenger types
in the entire dataset. (a) The mean group size per passenger type. (b) The mean number of boxes per
passenger type.
It was found that important differences between different passenger types exist. Business passengers were found to be the fastest group, while young passengers were found to be slower than expected. PRM and family passengers were the slowest two groups in the dataset. When ignoring PRM passengers, senior passengers triggered most WTMD alarms, while young passengers had to undergo most luggage checks. Families travel in the largest groups, while business passengers travel mostly alone. The next section analyzes how slow passengers influence the processing time of subsequent passengers.
3.2. Delay Propagation
As mentioned above, large differences between security checkpoint times of different passengers exist. The processing of a slow passenger can influence subsequent passengers, as they have to wait for the slow passenger to finish. This is most clearly seen in the wait I time, the time that a passenger spends waiting before they can pass the WTMD. This time is influenced by passengers in front of them. We show the distribution of these waiting times in Figure 7. The figure shows that the largest group of passengers have a wait I time of under 10 s, and increasingly smaller groups of passengers have increasingly larger waiting times. The mean wait I time is 25.6 s, with 1523 passengers below this mean, and 754 passengers (33% of the total) above the mean.
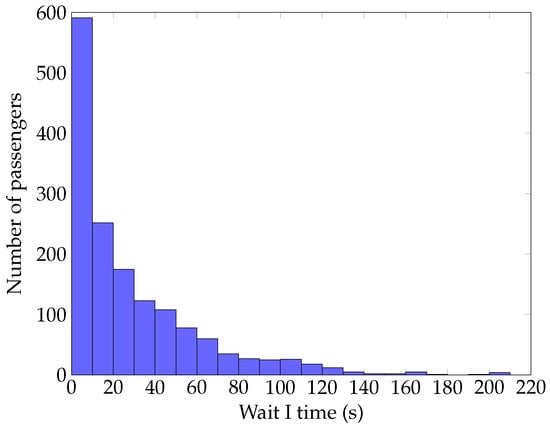
Figure 7.
A histogram of wait I times for all passengers in the dataset.
We investigate passengers with high wait I times, in relationship to passengers in front of them. To analyze this, we define a waiting time event as follows. An event has both a size and a set of affected passengers. Any passenger, with a wait I time of at least 25.6 s (the mean wait I time in the dataset), that follows a passenger with a wait I time of less than 25.6, is defined as an affected passenger. The size of the event is calculated by the number of consecutive passengers that have a wait I time higher than the mean.
A total of 335 events occurred in the dataset, with a mean size of 2.3 passengers. A histogram of event sizes is shown in Figure 8. It shows that over half of the events (176) are of size 1. The remaining 159 events affect 578 passengers, which is 25% of the total number of passengers in the dataset.
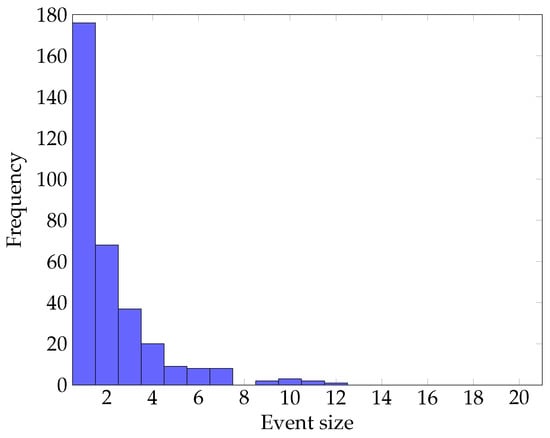
Figure 8.
The size distribution of high waiting time events.
For waiting time events with a size of at least two and at most seven, we investigated how they developed and resolved. Events with a size larger than 7 are too infrequent in our dataset to lead to a meaningful analysis, while events with a size of 1 have a trivial development. Figure 9 shows the mean wait I time for passengers in events of different sizes. This figure shows that the largest events (sizes 7 and 8) first show an increasing mean wait I time, before it reduces and finally completely resolves. Smaller events generally do not show this initial increase in wait I time, but show a direct reduction of this time.
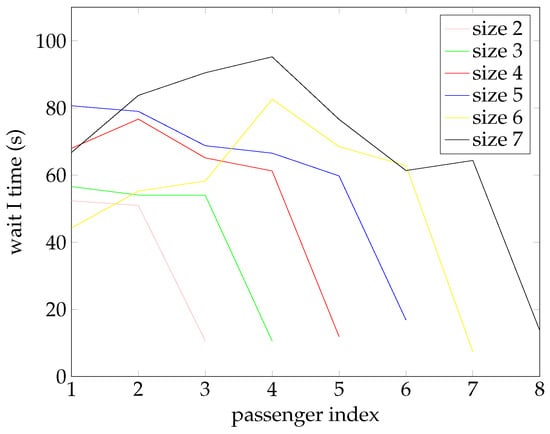
Figure 9.
The mean wait I time for passengers involved in a waiting time event of a specific size. A passenger at index i is the ith passenger affected by the event.
To be able to understand the potential causes of these events better, we look into five potential causes right before events: patdowns, luggage checks, ETD checks, repeated WTMD passages and slow luggage drops. While an employee is performing a patdown or ETD check, he cannot process any other passenger, causing them to wait. When a luggage check is being executed, the luggage belt of the system can become saturated. Following regulations, passengers and luggage are kept close together, and therefore passengers have to wait when the luggage belt is saturated. A second WTMD passage by a passenger causes the subsequent passengers to wait longer as well. Finally, a passenger that takes long to drop their luggage, may cause subsequent passengers to wait. We define a luggage drop to be slow, if it is slower than 1.5 times the mean luggage drop time.
Figure 10 shows how frequently the different causes preceded an event. About 15% of passengers have such a slow luggage drop time. It shows that a slow luggage drop passenger preceded an event in 27% of the cases, which is the most frequent cause. 15% of passengers have a slow luggage drop, meaning that this indicator is markedly better than random. A luggage check precedes an event the least amount of times (8.6% of the events), and is close to the proportion of passenger that have a luggage check (7.1%). This is therefore considered the least informative indicator.
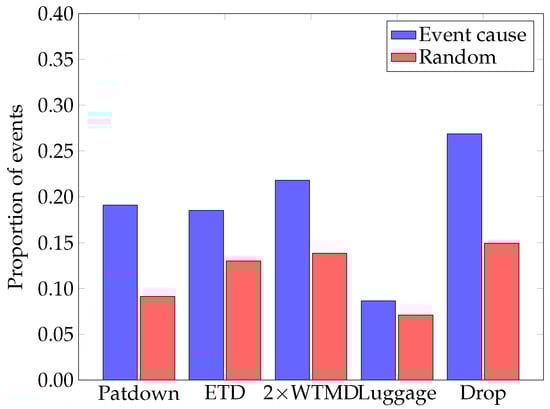
Figure 10.
The proportion of events that were preceded by a potential cause, compared to the total frequency of these events in the dataset. Luggage refers to passengers that receive a luggage check.
When combining all five potential causes, 63% of the events was preceded by a potential cause. Other potential causes, such as employees or passengers that are not paying attention, could not be assessed using the gathered dataset.
This delay propagation analysis shows that implementing a service lane setup at the airport security checkpoint has potential to increase throughput in normal lanes. As fewer slow passengers are present in these lanes, fewer passengers have a potential to cause waiting time events. This can then lead to a higher throughput. The next section introduces the service lane experiment that we performed, and analyses the performance of the service lane setup.
4. Service Lane Experiment
In current security checkpoint operations at Rotterdam The Hague Airport, passengers individually choose a lane in which they will undergo their security checks. Usually passengers assess the queue lengths of each of the available lanes, and choose the lane with the shortest queue. This leads to similar distribution of passenger types over the available lanes, and ensures that each lane has a similar arrival rate of passengers.
However, following initial observations and insights of security experts, it was found that slow passengers may have a negative effect on the wait I time of subsequent passengers in the security checkpoint process. To mitigate these effects, it was proposed to implement a so-called service lane. This service lane is used to process passengers that are expected to be slow, while the remaining lanes (called normal lanes) process the other passengers.
As mentioned above, a similar solution focusing on processing fast and experienced travelers in a separate lane has been implemented in many airports already. This approach requires airports to do background checks on passengers, which is often infeasible for regional airports.
The implementation of a service lane was projected to have two benefits:
- Increased overall throughput of the security checkpoint system
- Higher satisfaction of passengers with the security checkpoint process
An increased overall throughput may be obtained, as the number of passengers that are slowed down by slow passengers in front of them will be decreased. These slow passengers are isolated in a single service lane, and only influence each other. They can receive extra help from experienced security officers, potentially increasing their speed as well. While the service lane will have a lower throughput than a lane in normal operations, called standard lane, the combination with a (set of) normal lane(s) may improve the overall throughput of the system.
Fast passengers are expected to experience fewer delays in the security checkpoint process, potentially leading to a higher satisfaction. Slow and inexperienced travelers receive extra help, which lowers their stress levels. This can then lead to a higher satisfaction of these slow passengers as well.
To be able to implement a service lane, slow passengers have to be identified a priori, such that they can be directed to the service lane. Based an initial data analysis, and discussions with security experts, three types of passengers were identified:
- Senior passengers (inexperienced)
- Families
- Passengers with reduced mobility (PRM)
Table 3 specified how these passengers can be identified based on visual characteristics. Passengers that were not part of these groups were directed to the normal lane. In cases where a lane was receiving insufficient passengers to operate at full capacity, any passenger was sent to that lane, regardless of their characteristics. This was a requirement from the airport, as this was an experiment under operational conditions, with real passengers. When lanes were not fully occupied, this could ultimately lead to passengers missing their flight. These operational circumstances lead to more realistic data and results, as passengers and operators operate under mostly mostly known conditions. The process of directing passengers to specific security lanes is performed by an official in front of the security checkpoint.
A service lane experiment, following the above-specified procedure was executed on two days: Monday 17 December 2018 and Tuesday 18 December 2018, both between 05:00 and 07:30 in the morning. We specifically focus on the projected throughput benefit, as this can be quantified using objective timing data. The remainder of this paper focuses on the analysis of security checkpoint timing data collected under standard circumstances and during the service lane experiment.
This remainder of this section analyzes the performance of the service lane setup of the security checkpoint. First, we analyze the passenger characteristics and security checkpoint times for the different security lanes. This is described in Section 4.1. The number of passengers that are processed by a lane is not only dependent on the security checkpoint times of passengers, but also on for instance the occupation of the security checkpoint. Section 4.2 discusses the lane throughput of the different security checkpoint lanes. Finally, Section 4.3 compares the overall performance of the service lane setup with the performance of standard lanes.
4.1. Passenger Processing
We refer to Figure 2 for the distribution of passenger types in the service lane experiment. Clear differences can be observed for the passenger type distributions of the lanes on the two experiment days (n1, s1 & n2, s2). In both cases, a lot more families are found in the service lanes (s1 and s2), and a higher number of business passengers are in the normal lanes (n1 and n2). All PRM passengers are in the service lane, and more senior passengers are found there as well. This shows that the identification and separation of potential slow passengers for the service lane setup was possible in practice. As both lanes had to be occupied at all times, the split was not perfect. For instance, business passengers were still found in service lanes, and families were still found in normal lanes.
Furthermore, lane n1 has more business passengers than lane n2, as one out of three flights on that day was to London City (a typical business flight). Lane n2 has more young passengers, as more city trip destinations (i.e., Barcelona and Malaga) were scheduled on that day.
Figure 11 shows the mean security checkpoint times for passengers in the 13 different security checkpoint lanes. The mean security checkpoint times range from 162 s (lane n1) to 196 s (lane o6). This figure shows that on the experimental days (n1, s1 and n2, s2), the average passenger of the normal lane was faster than the service lane of that day. This is according to expectations. An interesting observation is that passengers in the two lanes of 18 December 2018 (n2 and s2) are slower than both lanes on 17 December 2018 (n1 and s1). The most important reason for this is the increased mean wait I time. This is about 18 s higher for lanes n2 and s2 as compared to lanes n1 and s1. As 18 December 2018 saw significantly more passengers (591 vs. 352), with the same number of lanes open (2), employees were more busy. This means that the system operated closer to the saturation point. This then lead to higher wait I times for passengers, as they could only move through the WTMD when an employee was available.
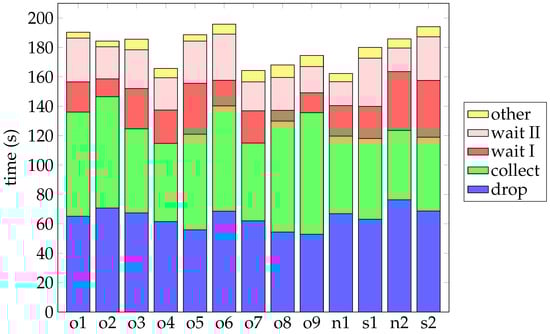
Figure 11.
The mean security checkpoint times, split into five subprocesses, for the 13 security checkpoint lanes.
Surprisingly, mean luggage drop and luggage collect times were found to be slightly lower for the service lanes (s1 and s2) then the respective normal lanes on the same day (n1 and n2). This may be due to the scheduling of more experienced employees in these lanes, as also supported in evaluation with security experts. The main differences between the service lanes and the normal lanes occur due to the wait II time. These can be better understood by observing Figure 12 and Figure 13.
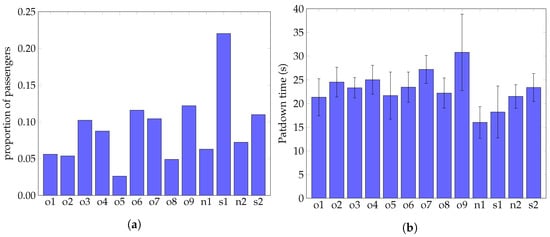
Figure 12.
Statistics related to patdowns for the 13 different security checkpoint lanes. (a) The
proportion of passengers that receive a patdown. (b) The mean patdown time in a lane, along with the
standard errors.
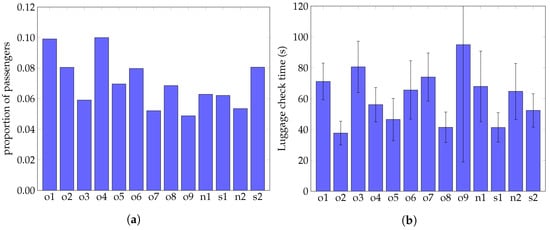
Figure 13.
Statistics related to luggage check for the 13 different security checkpoint lanes. (a) The
proportion of passengers that receive a luggage check. (b) The mean luggage check time in a lane,
along with the standard errors.
Figure 12 shows the proportion of passengers that received a patdown, and their corresponding times. The proportion of passengers that received a patdown ranges from 2.6% (lane o5) to 22% (lane s1). On both experiment days, the service lanes saw higher proportions of patdowns than the normal lanes on the same day. In lane s1, even over 20% of the passengers received a patdown. This is likely due to the high number of headscarfs that had to, following security regulations, be checked manually for families flying to Al Hoceima. The mean time for a patdown was also faster in the normal lanes than the service lanes.
Figure 13 shows the proportion of passengers that received a luggage check, and the corresponding times. Interestingly, the service lanes show luggage check times that are significantly lower than the normal lanes (43 vs. 68 s). Interviews with employees suggested that these lanes were staffed by the most experienced employees, which lead to lower luggage check times.
It is clear that there are large differences between mean security checkpoint times of passengers in the different lanes. In the next section, we compare these times to the throughput of the lanes.
4.2. Lane Throughput
We define lane throughput as the number of passengers that were served by a security lane in a specified time period. With lower mean security checkpoint times, a higher throughput of a security lane is expected. To calculate the throughput of each lane, we find the 45 min period that saw most passengers, and count how many passengers went through the security checkpoint. This is to ensure that we can fairly compare lanes, as throughput is highly impacted by the number of passengers that arrive at the security lane.
We show these throughputs for the 13 lanes in Figure 14. Throughputs range from 44 passengers per hour (lane o9) to 156 passengers per hour (lane o7). The mean security checkpoint time of passengers in lane n2 is ninth fastest (out of the 13 lanes considered), but the total number of processed passengers is second highest. Lane n1 has the fastest mean security checkpoint time of passengers, but comes in seventh when looking at the throughput. This shows that lower mean security checkpoint times for passengers do not automatically lead to a higher throughput.
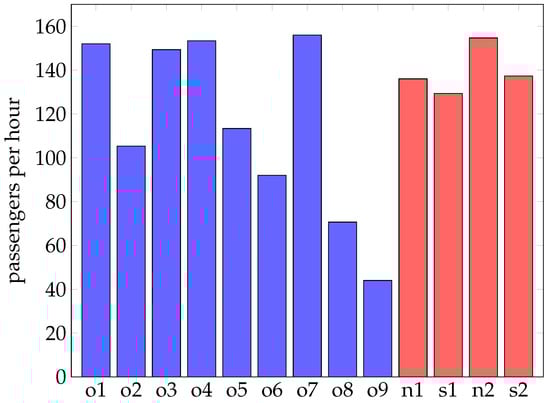
Figure 14.
The maximum throughput (normalized to passengers per hour) for the thirteen different security checkpoint lanes.
This difference in security checkpoint times and throughput likely occurs due to a lower number of passengers that simultaneously execute the security checkpoint process in that period. The two most likely explanations that we could find for that are the following: (1) not enough passengers arrive at the security checkpoint (i.e., not enough supply) or (2) the available space is not fully occupied.
We calculated the occupation of the system in the considered 45 min period, by calculating the mean number of passengers that were in the system in that period. This system occupation is shown in Figure 15. Lanes n1 and s2 have a similar throughput (136 vs. 137 passengers per hour), but mean security checkpoint time is much lower for lane n1 (162 vs. 194 s). The mean system occupation is however a lot larger for lane s2 (6.6 vs. 5.7 passengers), leading to a similar throughput.
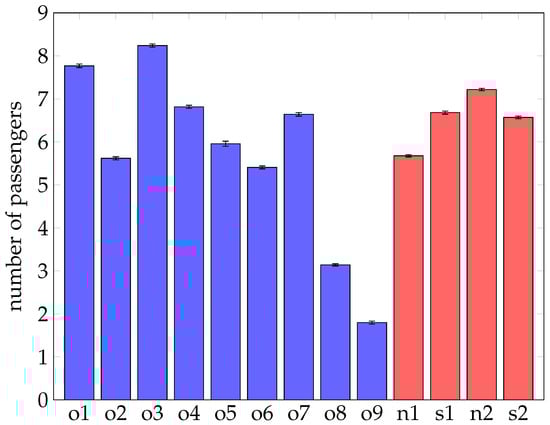
Figure 15.
The mean system occupation (and their standard errors) for the thirteen security checkpoint lanes, based on the same periods as Figure 14.
It is evident that throughput, system occupation and mean security checkpoint time are related. To this end, we performed linear regression to determine the relationship between throughput and the other two variables, based on all data in the dataset. This is shown in Equation (1) below.
where throughtput is number of passengers that pass through the security checkpoint lane per hour, occupation is the mean number of passengers occupying the security checkpoint lane, and checkpoint is the mean time passengers spend at the security checkpoint. The value of the regression is 0.95, implying a good fit. This formula shows that obtaining a high system occupation is much more important for throughput than ensuring a low security checkpoint time. While the relationship between these parameters is not necessarily linear, this formula can be used by security managers to estimate throughput based on information that can be observed relatively fast. While this formula holds for the specific checkpoint layout in Rotterdam The Hague airport, the layout of Rotterdam The Hague airport is commonly seen at regional airports. However, different airports may have different relationships between system occupation, security checkpoint time and throughput. Furthermore, other parameters, such as the distribution of passenger types, could be included to estimate (linear) relations between throughput and other parameters.
An easy way to improve overall throughput, regardless of the security checkpoint setup, is by ensuring that the security checkpoint lane is fully occupied. Employees can constantly instruct passengers that are dropping or collect luggage to move their boxes forward as far as possible. This opens up space for other passengers to drop or collect their luggage. This then leads to a better occupation of the system, and a higher throughput.
As there are clear differences between the security checkpoint lanes, we can asses the performance of the service lane setup. This is discussed in detail in the next section.
4.3. Service Lane Setup Performance
To assess the performance of the entire security checkpoint during the service lane experiment, we calculate the mean throughput over the two open lanes. The first day of the experiment (lanes n1 and s1) had a mean throughput of 133 passengers per hour per lane, while the second day of the experiment (lanes n2 and s2) had a mean throughput of 146 passengers per hour per lane. Figure 16 shows a ranking of the different security checkpoint setups.
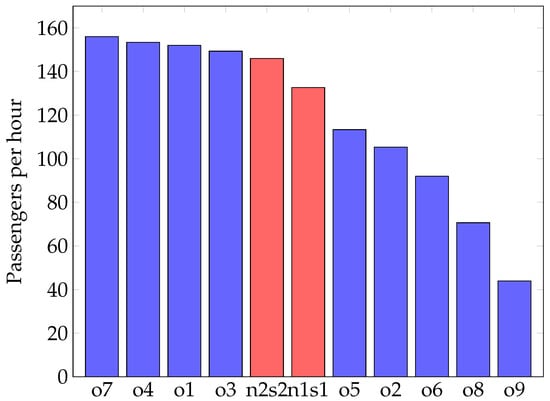
Figure 16.
The maximum throughput (normalized to passengers per lane per hour) for the 11 different security checkpoint setups.
Four standard lanes had a higher throughput than the throughput of both experimental days. Lane o4 had no family passengers, which were found to be slow passengers. Furthermore, lane o7 had the second lowest mean security checkpoint time (after lane n1). As well as the other high performing standard lanes, lane o1 saw a high system occupation (the highest of all lanes). However, it showed high mean security checkpoint times (eleventh highest out of 13 lanes). All of these lanes had a high system occupation, and lane o3 even had the highest system occupation of all lanes.
When just comparing throughput, the service lane setup performed above average compared to the standard setups. The average throughput of the standard lanes is 115.1 passengers per lane per hour, while the mean throughput of the service lane setup is 139.3 passengers per lane per hour. However, the two worst performing lanes (o8 and o9) had very low occupations, and likely did not have a constant supply of passenger arrivals. Even while not taking into account these two lanes, the throughput of the service lane setups is higher than the average throughput of the remaining standard lanes.
Due to the differences in checkpoint occupation, passenger type distribution and arrival distributions, it is hard to make an overall comparison between the service lane setup and the standard setup. More work is needed to understand the advantages and disadvantages of the service lane setup, but initial results are promising. The overall performance of the service lane setup was higher than the average performance of the standard lanes.
5. Limitations and Future Work
This section provides a discussion on the limitations of the present work, and discusses directions for future work. We did not assess the projected passenger satisfaction benefit, and more research is needed to determine the advantages and disadvantages of the service lane in this respect. Informal discussions with airport employees about their experiences with the service lane setup were promising. The employees working in the service lane mentioned that they were mentally prepared for a lot of slow passengers, making it easier to help them. Conducting an experiment that includes questionnaires querying passengers on their experiences with the security checkpoint process can help to understand this aspect better.
Due to differences in checkpoint occupation, passenger type distributions and arrival distributions, it was hard to perform a fair comparison between the service lane setup and the standard security checkpoint setup. Similar type of experiments can be performed in the future to understand the advantages and disadvantages of the service lane setup, but initial results show that the checkpoint performance can be improved using such a setup.
Furthermore, the dataset and analysis did not consider an important aspect of the security checkpoint process: the employees. Discussions with the employees revealed that they form an essential aspect in the processing times of passengers. They indicated that experienced employees identify and help slow passengers faster, leading to an increased overall performance of the security checkpoint. While some work has been done in this area [2,9,10,17], more research is needed to assess the quantitative effect of employees on the security checkpoint.
Based on the findings and statistics obtained from our study, other measures could be considered as well. In particular, re-allocation of passengers and checkpoint employees to different lanes might be considered, when (large) delays are predicted based on the statistical models identified by this study. In such a way, propagation effects of delays could be mitigated. Furthermore, different mixes of passenger types in a queue might be considered, so that delays could be locally contained. Moreover, to minimize delays and optimize the lane occupation, dedicated mobile apps could be employed advising passengers to go through a security check at different times, depending on the passenger’s type, other passengers’ types and their states, and the state of the security checkpoint.
Finally, we had to perform a set of subjective assessments for each passenger. Passengers had to be classified into a passenger type, the group size had to be determined and the experience level had to be assessed. It is therefore likely that errors are introduced in the data due to classification mistakes. This could be improved by individually asking each passenger about these demographics.
6. Discussion & Conclusions
In this paper, we analyzed security checkpoint operations at Rotterdam The Hague Airport. Data of a total of 2277 passengers, in 13 security checkpoint lanes was manually collected using camera images and made publicly available [12]. Nine of these security checkpoint lanes were operated following standard airport procedures, while four lanes followed a service lane setup. In this service lane setup, passengers that were expected to be slow were guided towards a service lane, to increase the overall throughput of the system.
Important differences between different passenger types were found. Business passengers were found to be the fastest group, while young passengers were found to be slower than expected. Passengers with reduced mobility (PRM) and families were the slowest two groups in the dataset.
Delay propagation was analyzed in terms of waiting time events. These events include passengers that have to wait for employees or other passengers. A total of 335 events occurred in the dataset, with an average of 2.3 passengers affected per event. It was found that a passenger that had a high luggage drop time preceded an event in 27% of the cases, which was the most frequent cause.
It was found that the service lane setup performed fifth (second experiment day) and sixth best (first experiment day) in terms of throughput out of 11 setups. The mean throughput of the service lane setups was higher than the average throughput of the standard lanes. These initial results are promising, but more experimental results are needed to confirm these initial findings.
Author Contributions
Methodology, A.D., R.v.d.S., and S.J.; formal analysis, S.J. and R.v.d.S.; writing—original draft preparation, S.J. and R.v.d.S.; writing—review and editing, A.D. and A.S. All authors have read and agreed to the published version of the manuscript.
Funding
This research received no external funding.
Acknowledgments
The authors thank Bas Simons, Co Petersen and Bram Peerlings for their valuable contribution in the data collection phase.
Conflicts of Interest
The authors declare no conflict of interest.
References
- Gillen, D.; Morrison, W.G. Aviation security: Costing, pricing, finance and performance. J. Air Transp. Manag. 2015, 48, 1–12. [Google Scholar] [CrossRef]
- Kirschenbaum, A.A. The cost of airport security: The passenger dilemma. J. Air Transp. Manag. 2013, 30, 39–45. [Google Scholar] [CrossRef]
- Bricker, J.B. Development and evaluation of the Air Travel Stress Scale. J. Couns. Psychol. 2005, 52, 615. [Google Scholar] [CrossRef]
- Future Travel Experience. Behind the Scenes of the New Schiphol Security Experience. 2015. Available online: https://www.futuretravelexperience.com/2015/04/behind-scenes-new-schiphol-security-experience/ (accessed on 29 March 2019).
- Transportation Security Administration. 2019; TSA Pre. Available online: https://www.tsa.gov/precheck (accessed on 29 March 2019).
- Schiphol. Privium: Live Life in the Fast Lane. 2019. Available online: https://www.schiphol.nl/nl/privium/ (accessed on 29 March 2019).
- Stewart, M.G.; Mueller, J. Risk and economic assessment of expedited passenger screening and TSA PreCheck. J. Transp. Secur. 2017, 10, 1–22. [Google Scholar]
- Jacobson, S.H.; Khatibi, A.; Yu, G. When should TSA PreCheck be offered at no cost to travelers? J. Transp. Secur. 2017, 10, 23–29. [Google Scholar] [CrossRef]
- Kirschenbaum, A.A.; Mariani, M.; Van Gulijk, C.; Rapaport, C.; Lubasz, S. Trusting technology: Security decision making at airports. J. Air Transp. Manag. 2012, 25, 57–60. [Google Scholar] [CrossRef]
- Kirschenbaum, A.A.; Mariani, M.; Van Gulijk, C.; Lubasz, S.; Rapaport, C.; Andriessen, H. Airport security: An ethnographic study. J. Air Transp. Manag. 2012, 18, 68–73. [Google Scholar] [CrossRef]
- Leone, K.; Liu, R.R. Improving airport security screening checkpoint operations in the US via paced system design. J. Air Transp. Manag. 2011, 17, 62–67. [Google Scholar]
- Janssen, S.A.M.; Sharpanskykh, A. Airport Security Checkpoint Data. 2020. Available online: https://doi.org/10.4121/UUID:6246E6A6-D149-420F-A6A4-7AFD08F154B5 (accessed on 26 May 2020).
- Schultz, M. Entwicklung Eines Individuenbasierten Modells zur Abbildung des Bewegungsverhaltens von Passagieren im Flughafenterminal. Ph.D. Thesis, Technischen Universität Dresden, Dresden, Germany, 2010. [Google Scholar]
- Schultz, M.; Fricke, H. Managing passenger handling at airport terminals individual-based approach for modeling the stochastic passenger behavior. In Proceedings of the Ninth USA/Europe Air Traffic Management Research and Development Seminar (ATM2011), Berlin, Germany, 14–17 June 2011. [Google Scholar]
- Rotterdam The Hague Airport. Feiten & Cijfers 2017. 2018. Available online: https://www.rotterdamthehagueairport.nl/content/uploads/2018/07/feiten-en-cijfers-2017.pdf (accessed on 28 March 2019).
- Pitchforth, J.; Wu, P.; Fookes, C.; Mengersen, K. Processing passengers efficiently: An analysis of airport processing times for international passengers. J. Air Transp. Manag. 2015, 49, 35–45. [Google Scholar] [CrossRef]
- Knol, A.; Sharpanskykh, A.; Janssen, S. Analyzing airport security checkpoint performance using cognitive agent models. J. Air Transp. Manag. 2019, 75, 39–50. [Google Scholar]


© 2020 by the authors. Licensee MDPI, Basel, Switzerland. This article is an open access article distributed under the terms and conditions of the Creative Commons Attribution (CC BY) license (http://creativecommons.org/licenses/by/4.0/).