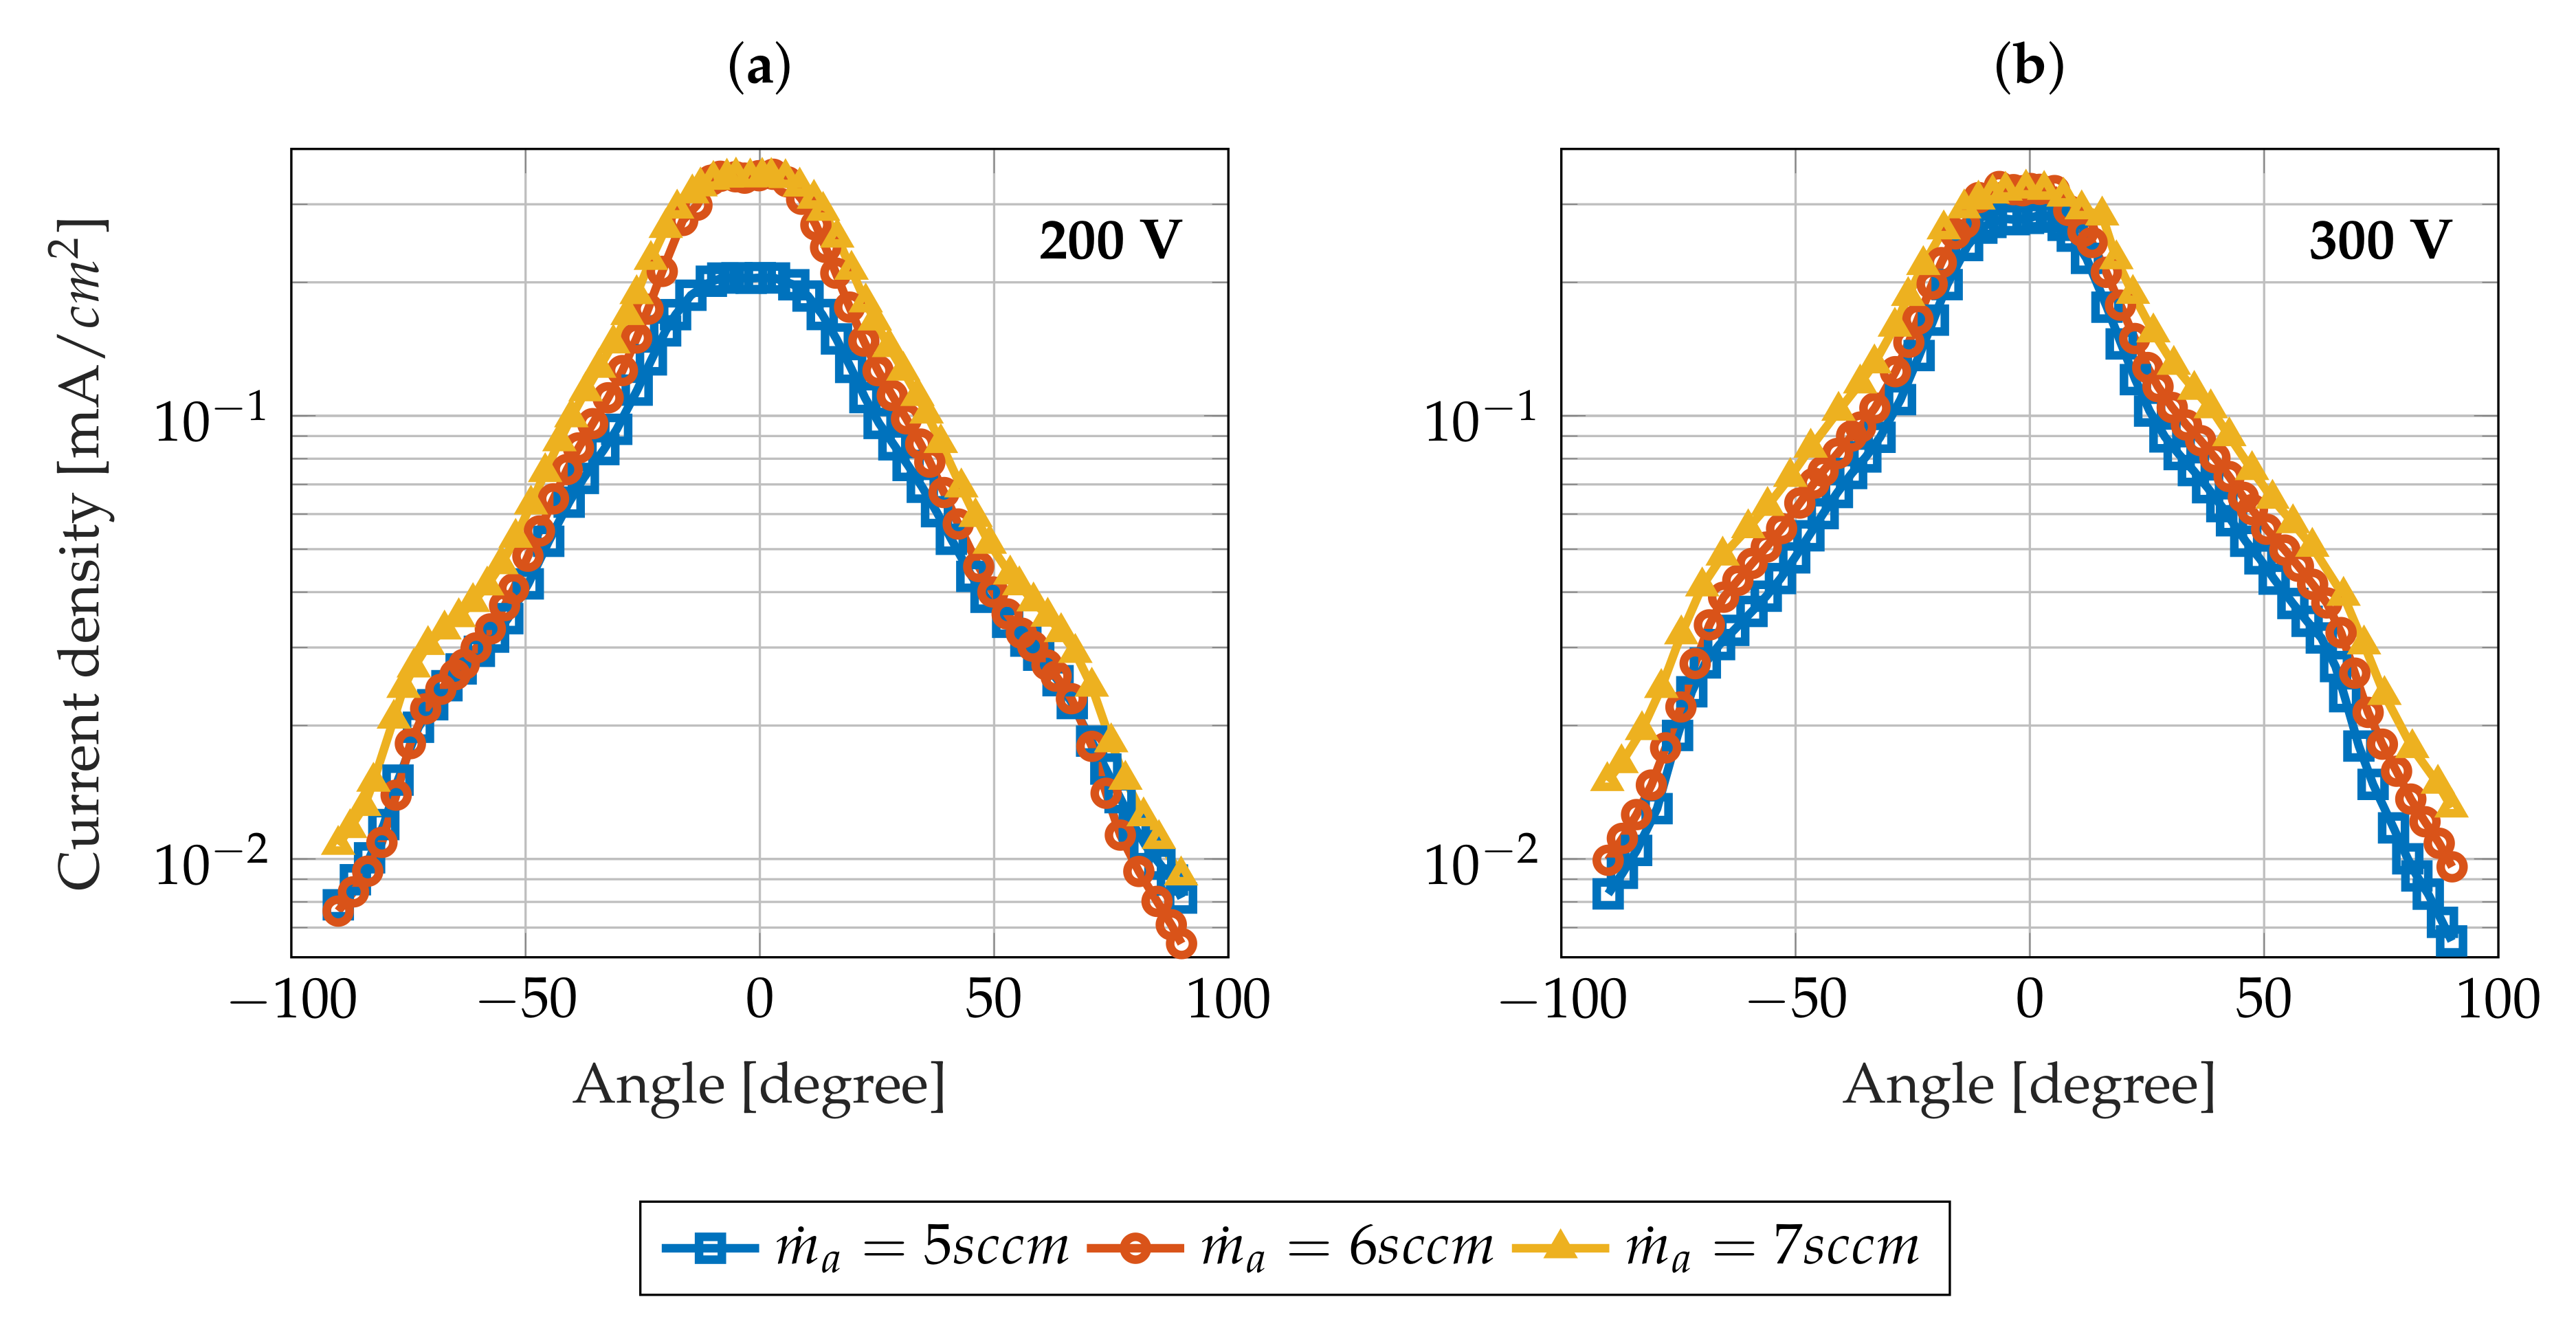
The overall shape of the
angular profile remains similar in many features whatever the operating conditions, as shown in
Figure 7 and
Figure 8. Indeed, the distribution is axisymmetric with respect to the thruster centerline
and reaches a maximum amplitude at this point. When moving away from the thruster centerline, the ion current density sharply decreases by an order of magnitude. Around
, a hump is observed. This wing structure has already been noticed and identified as a backpressure effect [
36]. The shape of
profile for this 100 W-class HT is similar to the one observed with high-power HT plumes [
37,
38,
39].
4.1. Influence of the Anode Mass Flow Rate
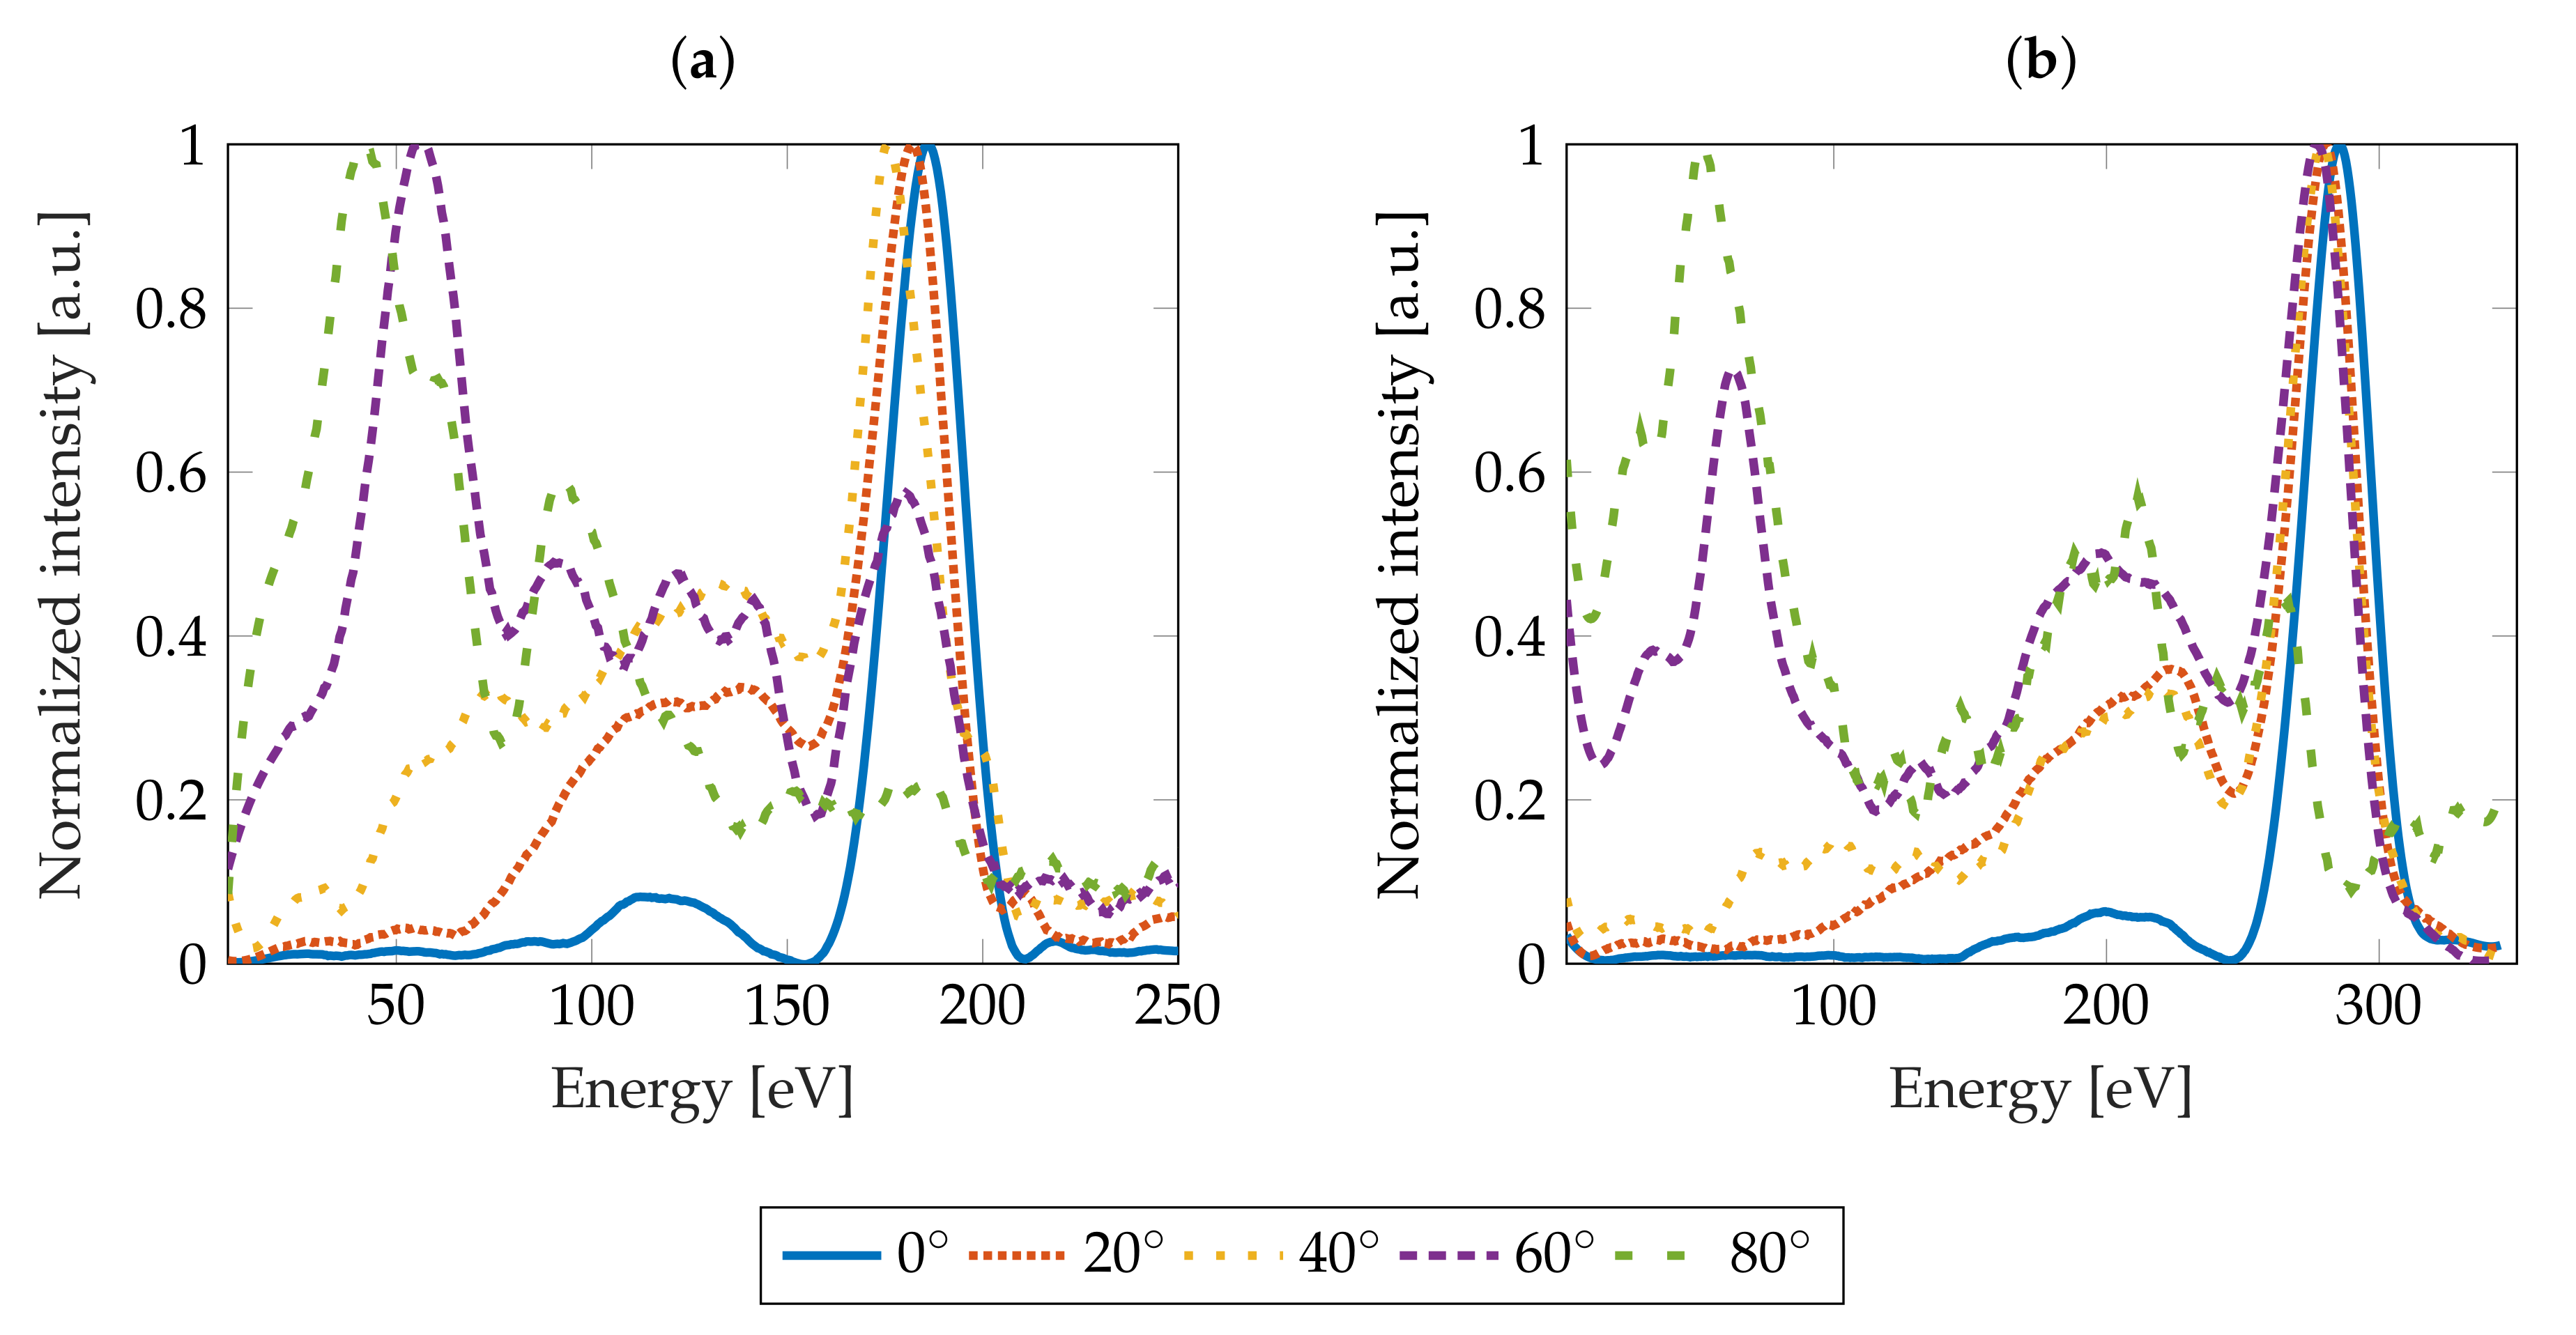
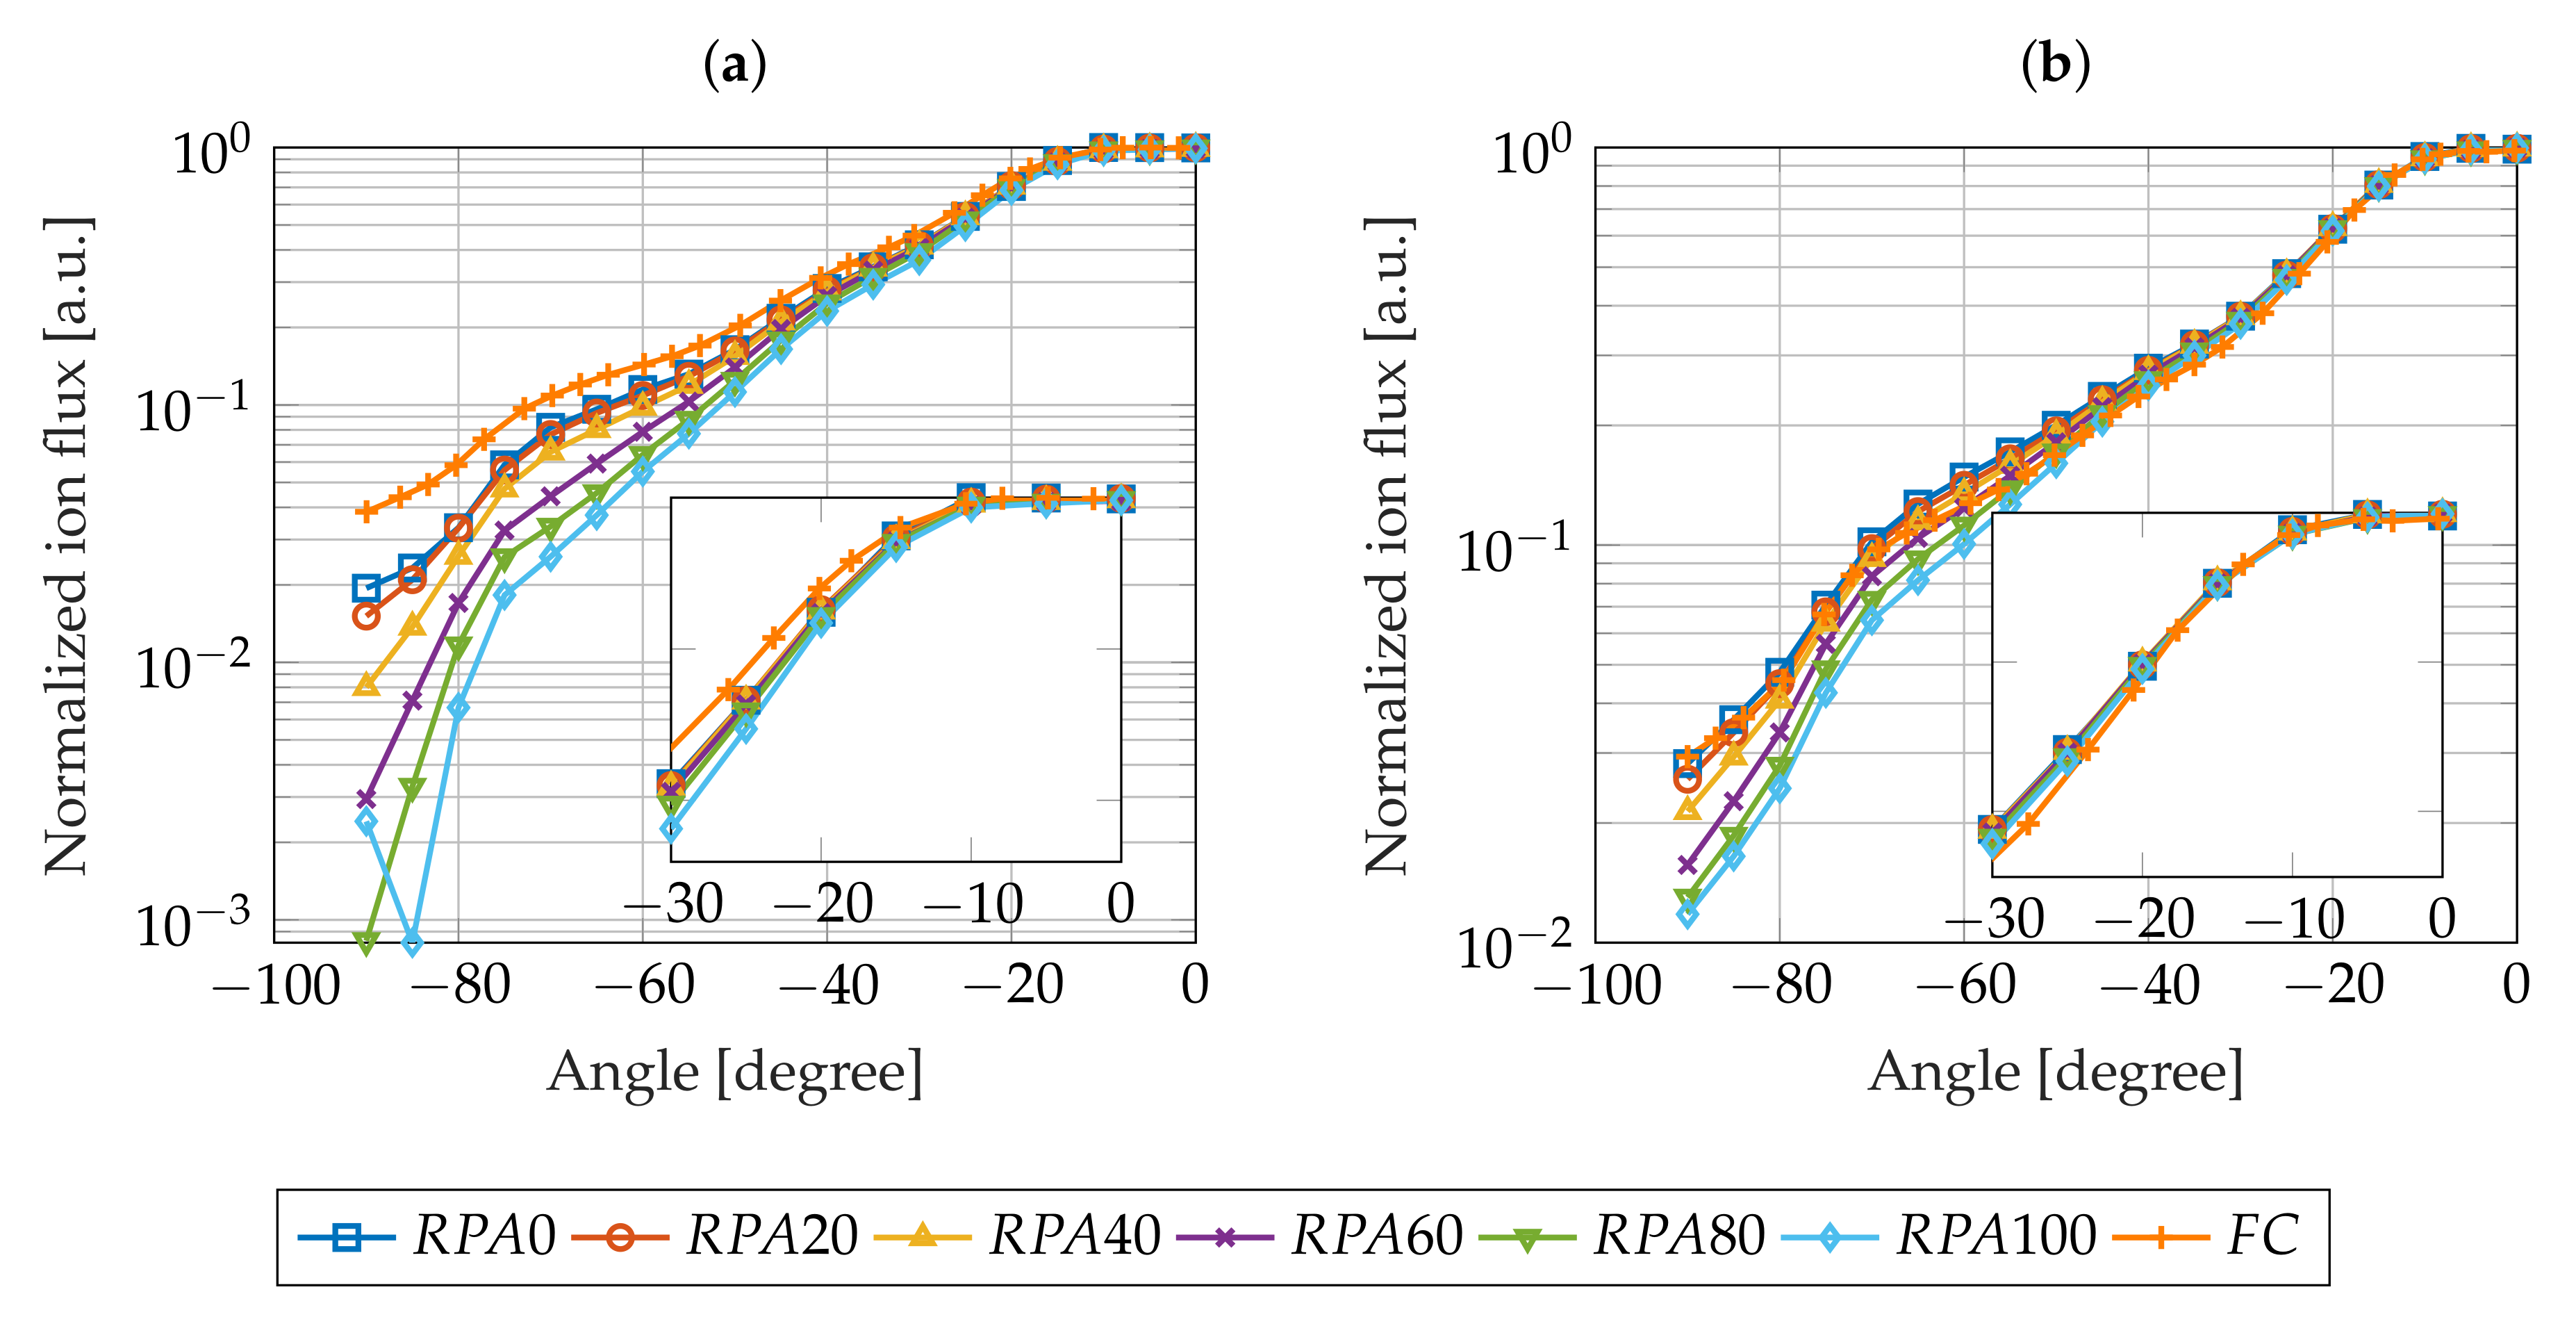
Figure 7a,b show the
angular distribution at fixed discharge voltages, i.e., 200 V and 300 V, respectively, and different anode mass flows. As expected, the total ion current increases with the anode mass flow. As the neutral density increases in the discharge channel of the HT, ionization collisions become more likely, favoring production of ions. Nevertheless, interesting features are noticeable in the
distribution. Firstly, the ion current distribution broadens when the mass flow rate increases. Secondly, the ion current density in the plume core (on axis region) reaches a limit value ≈0.35 mA/cm
at both 6 sccm and 7 sccm.
The first feature is commonly observed in HT plume FC measurements and is identified as the consequence of an increase in vacuum chamber backpressure.
Numerous investigations have been performed to understand the impact of this parameter on ion current measurements. For instance, P5 (also called NASA-173M) [
36,
40], PPS-Flex [
28], PPS
1350-G [
41], SPT-100 [
38,
42], and BHT-1500 [
39] plumes have been charaterized at different operating pressures and a fixed operating point. It appears that the core of the plume is unaffected by pressure changes in contrast to large angle parts, where the current density increases. The large difference observed in the plume large angle region is well understood and has been identified as the product of Charge EXchange (CEX) collisions between residual neutral atoms and fast ions. Indeed, if we consider a CEX collision occuring between a fast moving xenon ion Xe
and a slow moving neutral Xe
, we obtain a fast atom Xe
and a slow ion Xe
. In an HT plume, the radial potential gradient increases outward the on-axis region since the magnetic field lines have greater curvatures [
43,
44,
45,
46,
47]. Xe
resulting from scattering along the entire plume are then accelerated to the wings. As the backpressure increases with the mass flow, CEX events are more likely, which results in an increase of the current density in the wings. PPS-Flex plume characterization [
28] also figured out that, above a pressure of
mBar, the profile is distorted: the thruster is not operating in a standard mode due to backpressure effects. Thereupon, the backpressure condition is determinant in the reliability of ion current measurement. As the backpressure increases, the total ion current is overestimated, resulting in an overestimation of thruster performances.
The second feature can also be the consequence of backpressure effects. Since the CEX ions are redirected to large angles, the ion current density in the core of the plume is decreased. Nevertheless, other tendencies were described in literature [
37,
39] and lead us to consider further explanations, related to the inherent properties of low-power HTs. Previous studies have shown that operating mode are sensitive to operating parameters i.e., the discharge voltage, the anode mass flow rate and the magnetic field. Mode transitions in terms of current oscillations can occur [
48,
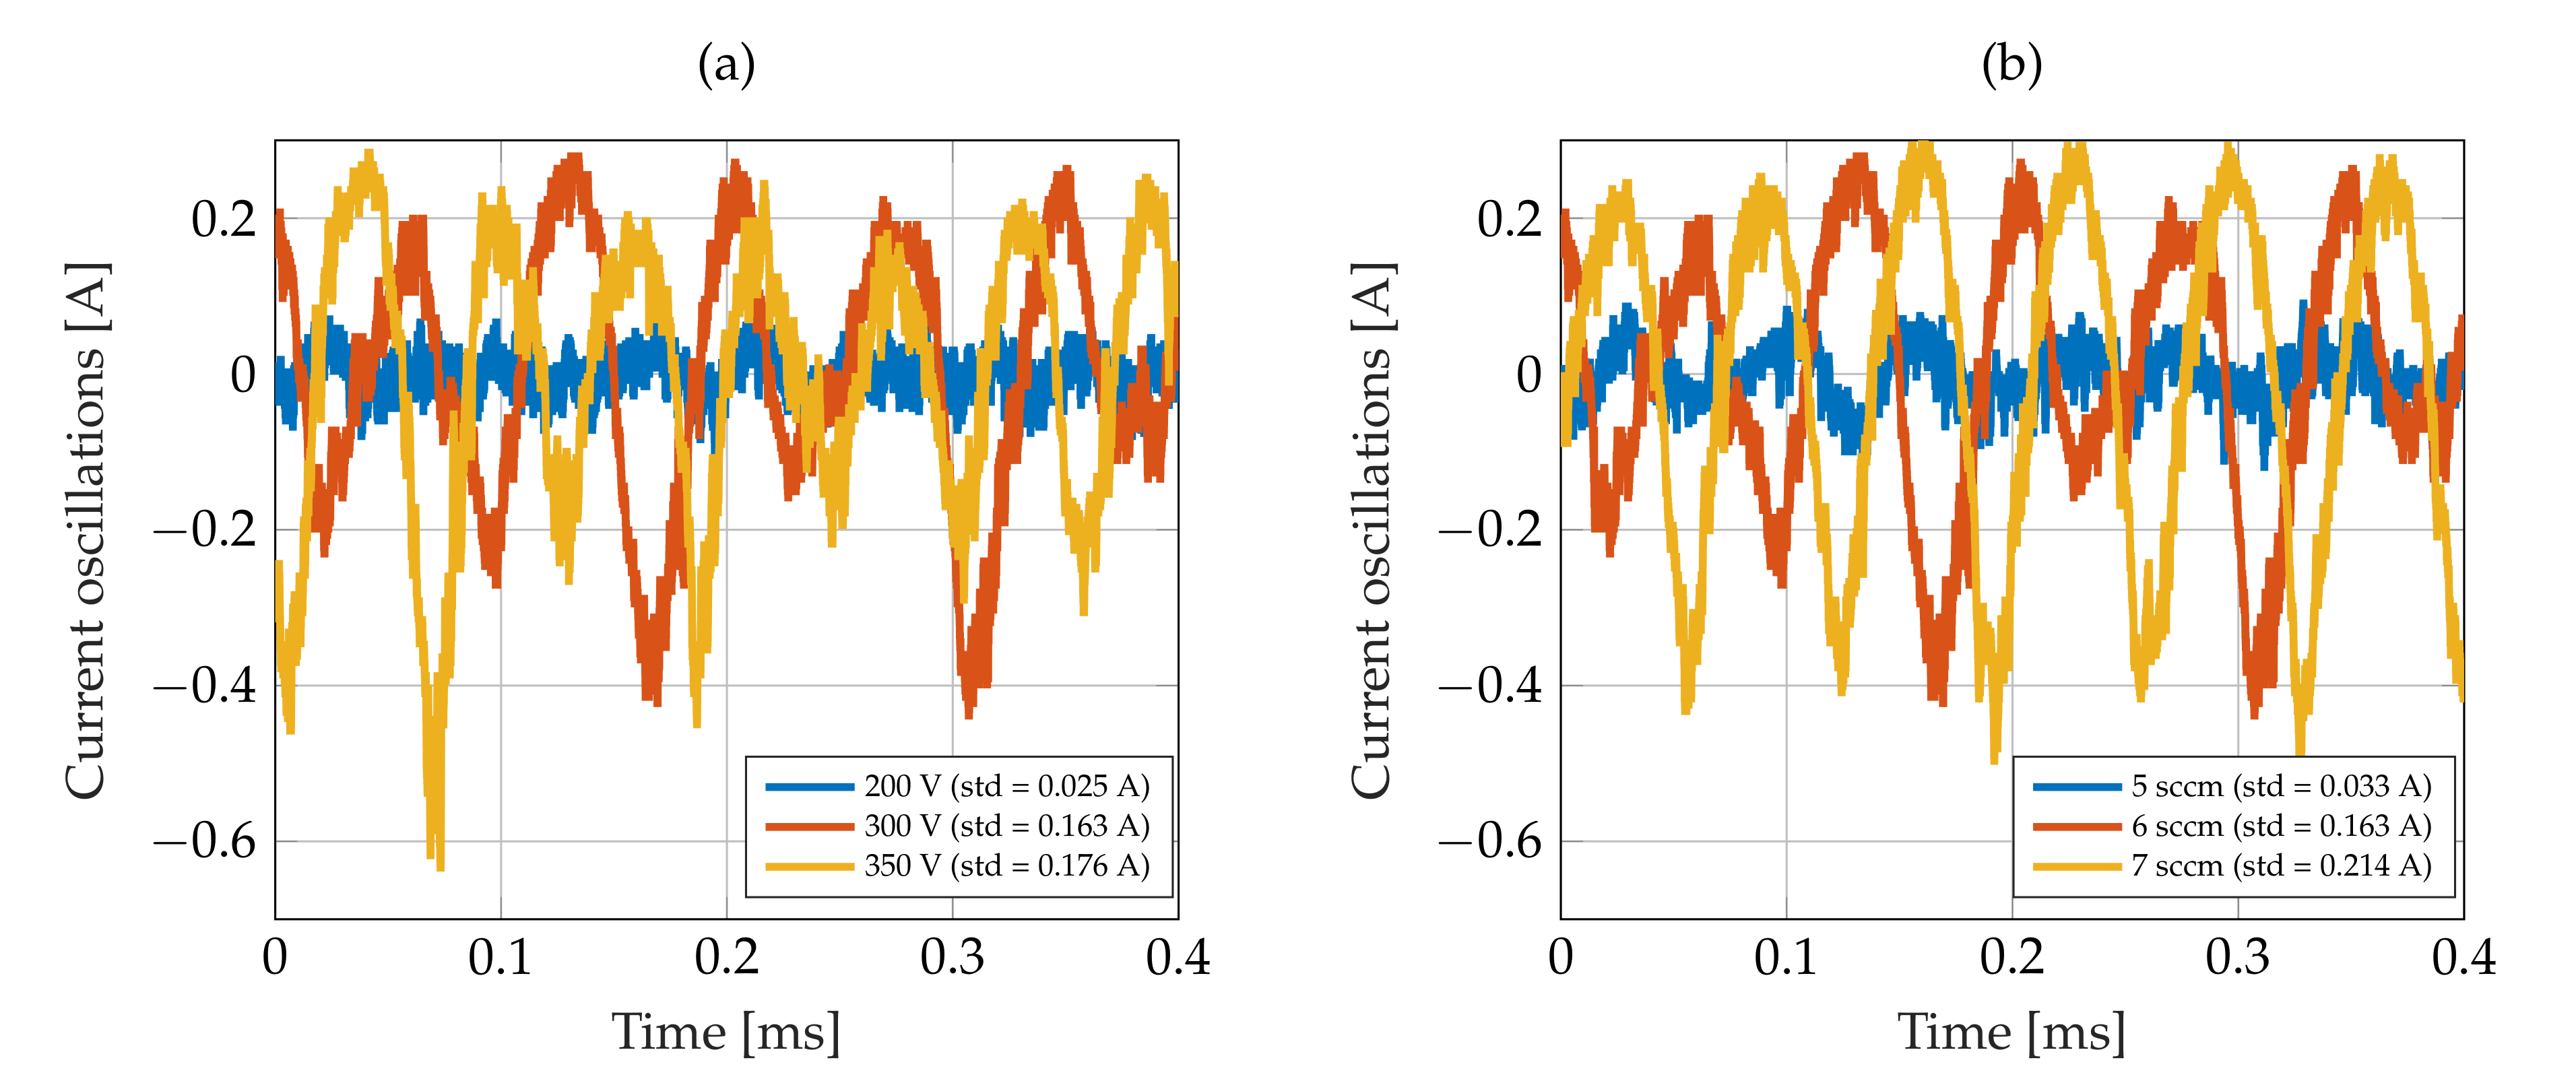
49]. Current oscillations are plotted as a function of discharge voltages (
Figure 9a) and anode mass flow rates (
Figure 9b) at constant anode mass flow rate and discharge voltage, respectively. The Standard Deviation (std) is computed to assess the oscillation amplitude at a given operating point. Standard deviation reaches about 87% and 85% when discharge voltages and anode mass flow rates are ramped up from 200 V to 350 V and from 5 sccm to 7 sccm, respectively. High-osccillation modes are produced at both high voltage and high anode mass flow rate, when the magnetic field topology is fixed. Such a high-oscillation mode affects thruster performances, namely the current utilization decreases and the plume divergence angle increases [
48]. Consequently, the ion current density profile is attenuated in the core of the plume and broadened at larger angles, as observed in
Figure 7a,b.
Note that the two ratios between the external discharge channel diameter
and the vacuum chamber diameter
D and length
L were computed for this study and studies of Refs. [
41,
42]. Ratios are identical, namely
and
0.01–0.02.
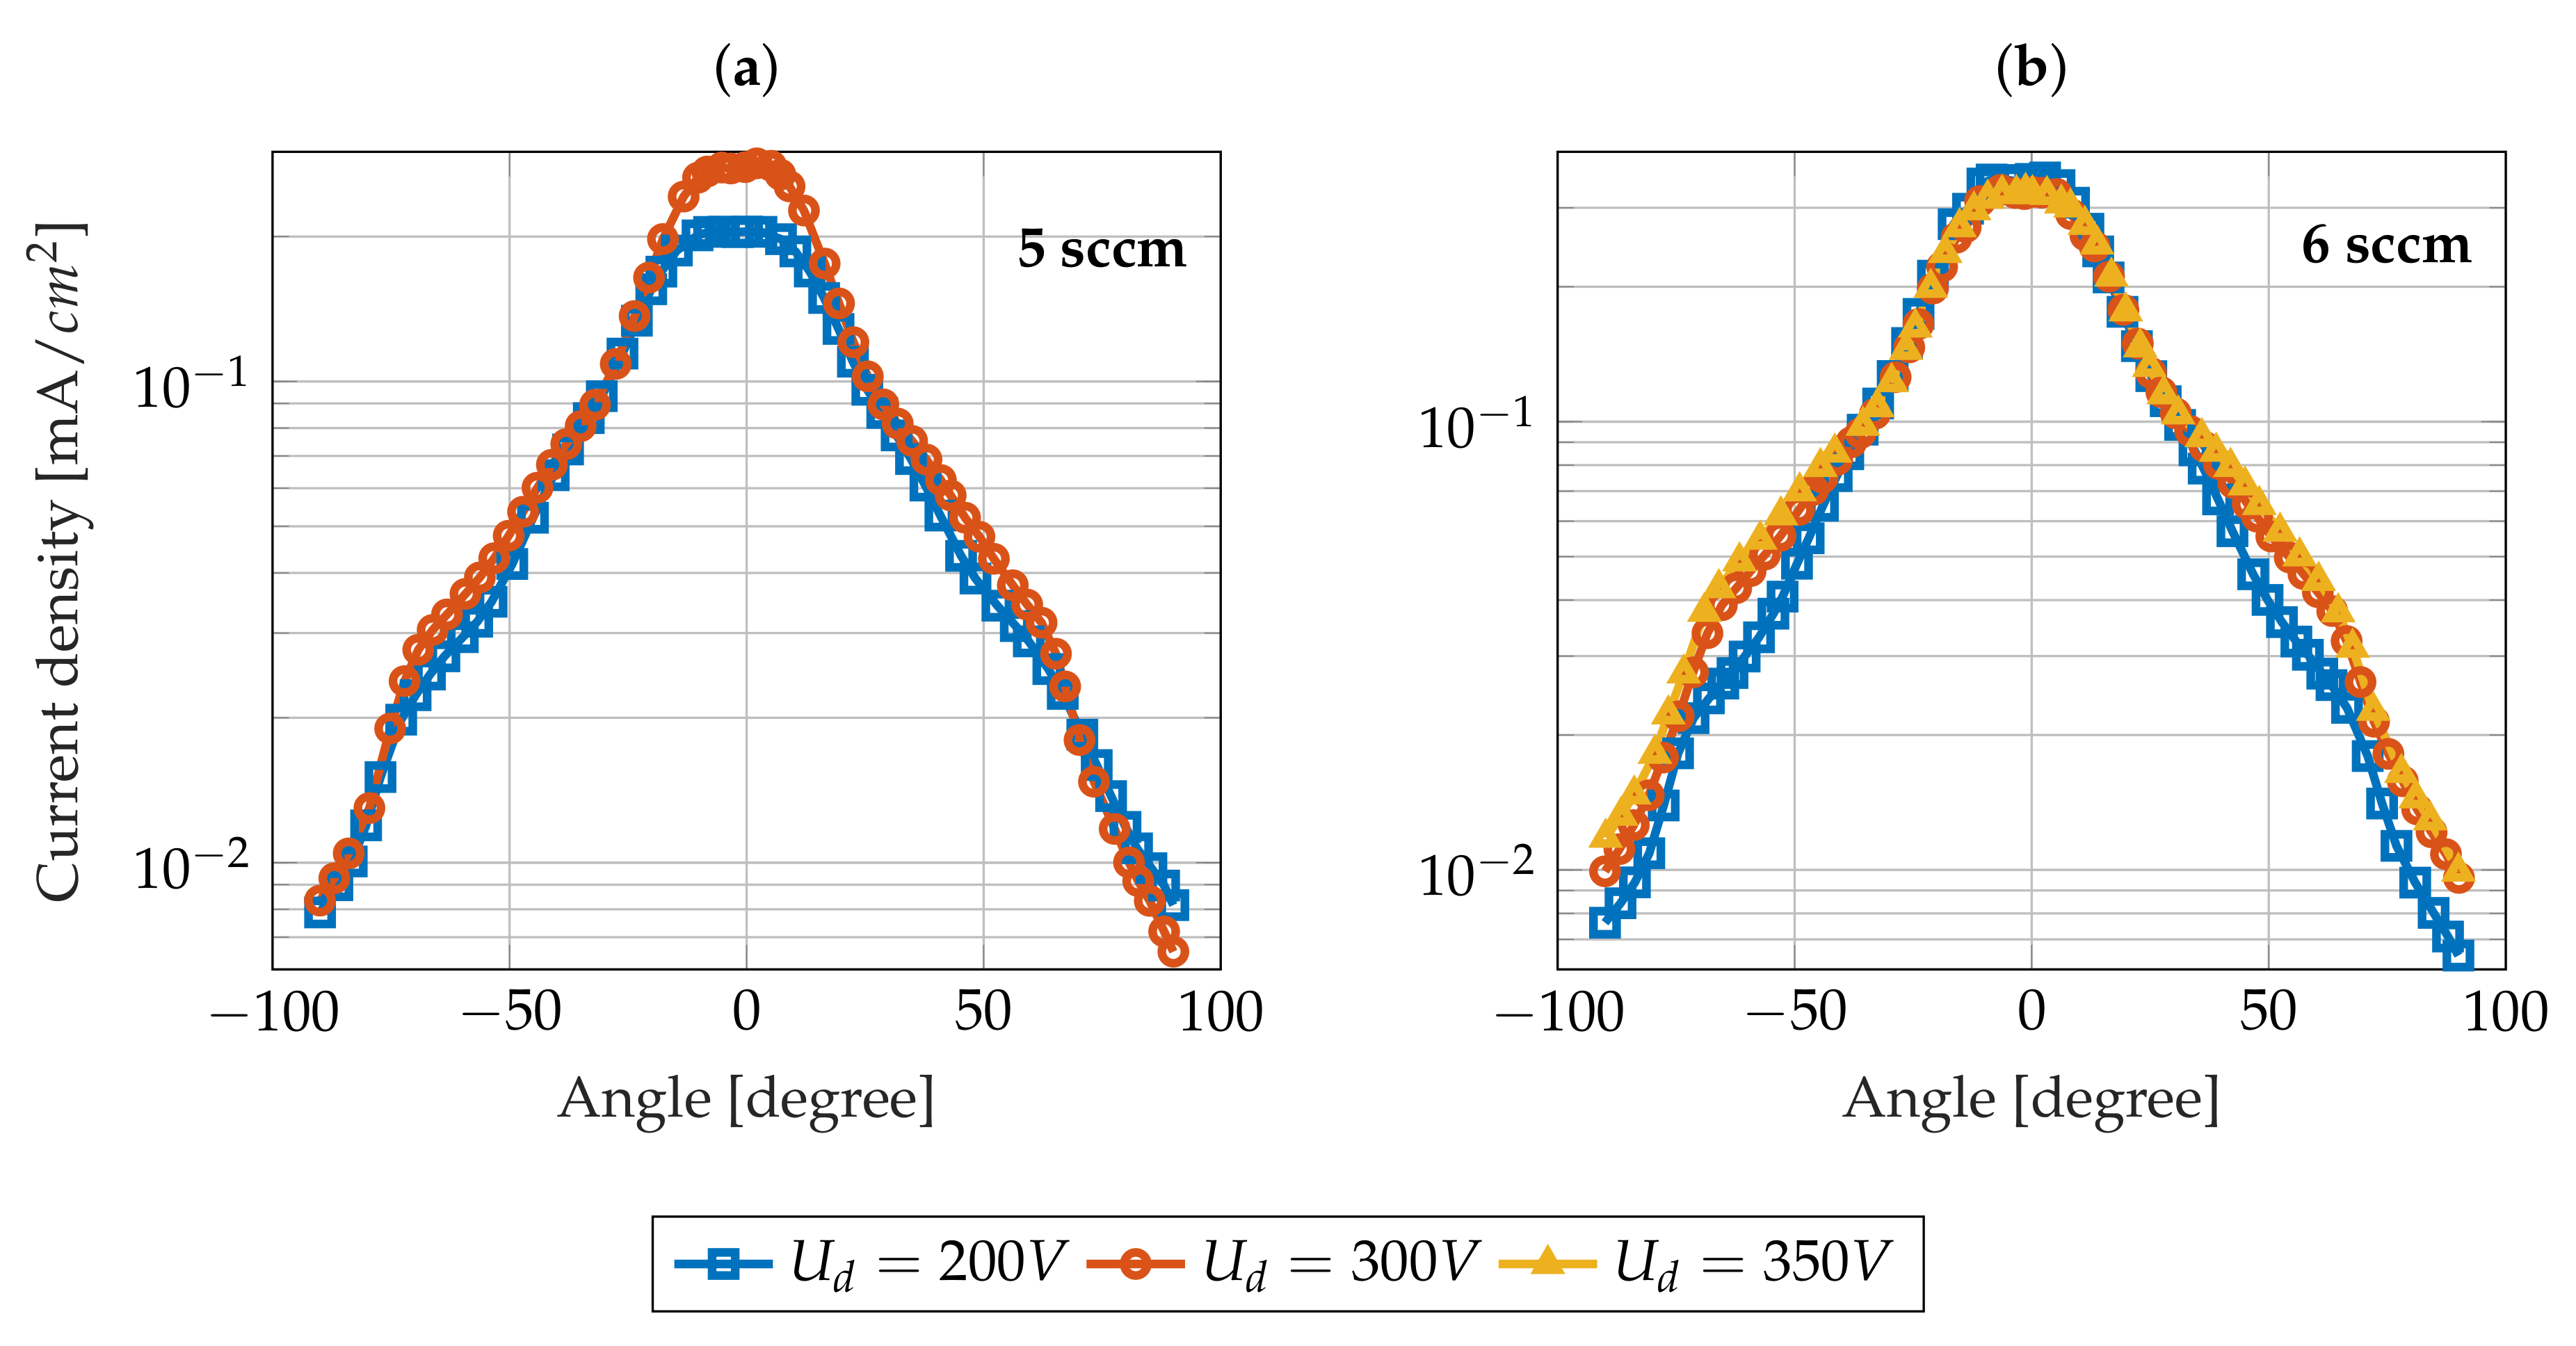
4.2. Influence of the Discharge Voltage
The influence of the thruster discharge voltage has been investigated for two different anode mass flow rates, namely 5 sccm and 6 sccm. The respective
angular distributions are plotted in
Figure 8a,b. Specific features are identifiable. Firstly, the ion current density increases at large angles when the discharge voltage is ramped up. Secondly, the current density increases in the core of the plume as
is amplified, except for the 6 sccm case (
Figure 8b), where the
amplitude reaches a limit value whatever the discharge voltage.
The first observed feature diverges from common observations as usually an increase in discharge voltage leads to a narrowing of the profile and a growth of the central peak [
37,
39]. The discrepancy cannot be attributed to backpressure effects, since the gas injected through the anode remains constant and thus the residual pressure in the vacuum chamber is unchanged. The increased in ion current in the wings of the profile, i.e., when
is above
, and the resulting broadening when the discharge voltage is ramped up can have various origins. Firstly, as mentioned in several articles [
50,
51,
52], high discharge voltage operation favors multiply charged ions production, of which the population increases at large angles. Secondly, the electric field distribution is also impacted by an increase in voltage, in such a way that the fraction of potential inside the thruster increases, shifting the location of the ionization area upstream and extending the acceleration region [
53]. Some ions created at lower axial potential in the acceleration region are then accelerated toward large angles. In this work, the magnetic field stays unchanged. It is not increased when
is increased.
The second reported feature is commonly observed in plume studies: an increase in discharge voltage favors ion production and the ion current increases in the core of the plume [
37,
39]. However, the specific case noticed in
Figure 8b for 6sccm was rarely observed: D. H. Manzella and Sankovic J. M. mentioned this behaviour in the SPT-100 plume [
38]. Although the asymptotic limit is consistent with high-oscillation operations (see
Section 4.1), it can also be interpreted as a consequence of multiply-charged ion production. Such ions may be the result of collisions between high-energy electrons and CEX ions. Since the latter are slow moving (see
Section 4.1), collisions with electrons are favored. Such ions are scattered to large angles which increases the ion current density at large angles, i.e., the divergence, and leaves the core unchanged. Moreover, multiply-charged ion production is favored at high voltage conditions, since both electron temperature [
54,
55] and ion density increase when the discharge voltage is ramped up. Further investigations need to be performed to evaluate the distribution of different ion species in the far-field plume.
Table 5 shows the total ion current computed for each operating point, using Equation (
2). As expected, the beam current increases with both the discharge voltage and the anode mass flow. The current utilization and mass utilization efficiencies, termed
and
respectively, are also displayed in
Table 5. They are respectively computed from Equations (
4) and (
5):
corresponds to the the singly-charged ions mass flow rate in the beam,
m the atomic mass and
e the elementary charge.
is above 0.7 in average and
above 0.8 which demonstrate a good ionization efficiency of the ISCT100-v2 despite the small size and a low discharge power. Similar efficiencies were described in literature for high-power HTs at the same discharge voltages [
52,
56,
57]. However, it should be noted that
decreases with discharge voltage, compared to what is observed for high-power HTs [
56]. This difference can be interpreted as an increase of the fraction of electrons in the discharge current, i.e., an increase of electron leakage to the anode, owing to an increase of electron temperature with discharge voltage. While this loss can be mitigated in high-power HTs by increasing the magnetic field, the use of permanent magnets in low-power HTs prevents any correction. In fact, this effect could even be amplified as the magnets heat up when the power increases (see
Section 2.3). High oscillation modes also favors the decrease of current utilization efficiency [
48].


