1. Introduction
The electrification in the aerospace field is a well-established trend in recent years in order to achieve economic and environmental sustainability [
1]. The growing interest in this field is attested by the ever-increasing number of studies concerning the electrification or hybridization of general aviation aircraft. See for example [
2] for a review of concept, models, and design approaches presented in the literature.
One of the main key issues in the electrification of aviation is represented by the electricity storage systems, i.e., the batteries [
3]. To be used in aircraft, batteries must be safe, reliable, efficient, and capable of delivering power and energy when required. The two main specifications of batteries for propulsion are:
Energy density, i.e., the energy-to-weight ratio that directly affect the flight range;
Power density (or specific power) which describes the available maximum power that can be drawn during the flight per battery unit weight.
In designing an electric or a hybrid electric aircraft, encumbrance is also a constraint because there is little room for battery packs, electric motor(s) and power control electronics. For this reason, the volumetric energy density of the battery, i.e., the amount of stored energy per unit volume, is also important. At the moment, lithium-based batteries are the best commercial technology in terms of energy and power densities [
4] even if other promising technologies are under investigation [
5].
Lithium-based batteries can make usage of several different materials as electrodes and can be classified into two main families according to the type of electrolyte: Lithium-ion (Li-ion) and lithium-polymer (Li-po). Li-ions are widely used as batteries for electric cars, power tools, and power-banks since they are cheaper to manufacture, offer a higher energy density and longer lifetime. On the other hand, Li-pos are widely used to power Unmanned Aerial Vehicles (UAVs) because they have a much higher specific power and can be more easily shaped [
4].
An accurate determination of battery performance, health, and life prediction is necessary not only during battery usage but also in the design process. In fact, the misunderstanding of battery characteristics and performance causes substantial issues for battery management and impacts the actual range and the fuel economy of electrified power systems. Most battery state parameters, which control battery performance during design, manufacturing and usage, are subject to interference from dynamic ambient environment [
6], battery health issues, and aging effects [
7].
Aging processes are irreversible changes in the characteristics of the electrolyte, anode and cathode, and the structure of the components used in the battery. According to [
6], the most important degradation factors for batteries are:
Environment temperature;
Discharging current rate;
Charging rate (fast charging);
Depth of Discharge (DoD);
Time intervals between full charge cycles.
The goal of this investigation is to quantify the effect of battery aging on the performance of electric and hybrid electric flight. To this, an appropriate battery model including aging effect is proposed and applied to the estimation of the performance of a hybrid electric rotorcraft for urban air-mobility during both emergency landing and normal AirTaxi operation.
One of the phenomenon taken into account in the proposed model is the worsening of the Peukert effect [
8], which is the reduction of the effective capacity of the battery when increasing current taken from the battery. A few studies in the literature describe the impact of the Peukert effect on range and endurance, optimal airspeed [
9], and recently, also on the altitude dependency of maximum reachable range [
10]. However, none of them presents an aging model suitable for the design and the performance evaluation of electric and hybrid electric rotorcraft comprehensive of the Peukert effect. Therefore, this is the main innovative aspect of the present investigation to the authors’ knowledge. As already explained in the introduction, Li-ion batteries include a large variety of technologies. However, we will propose a general model whose coefficients can be tuned according to the specific technology.
2. Battery Sizing and Modeling
Batteries are reversible electrical energy storage systems composed of several individual cells, each containing two electrodes and a medium that provides the ion transport between the two electrodes.
The performance of a battery in terms of energy and power depends on the following nominal parameters that can be easily identified in its datasheet:
The nominal capacity C, measured in Ah, and evaluated by discharging the battery a specific constant current Inom;
The number of cells in series () that together with the rated voltage Vcell, defines the nominal voltage of the battery Vnom and the bus voltage of the power system.
The maximum and cut-off voltage of the battery;
The maximum current of the battery for continuous discharge, usually expressed as a multiple of the nominal capacity and named Crate.
The burst current. Each battery is also characterized by a C rating in terms of burst current, which measures how quickly the battery is able to discharge for a short time. This parameter is usually twice the
Crate [
11] and will be named
bCrate;
The maximum recharge current that the battery can tolerate. It is also specified by the manufacturers as a multiple of the nominal capacity and will be denoted here as rCrate;
The Depth of Discharge (DOD) is used to describe how deeply the battery can be discharged because a fully discharge (100% DOD) would shorten its cycle life.
According to these specifications, it is possible to calculate the nominal energy that can be drawn from a battery in discharging,
, as:
Actually, the energy that the battery can delivered is a complicated issue as explained later.
The nominal power that the battery can provide is:
For a small amount of time (ranging from 10 to 30 s) the battery is able to sustain the burst power:
A battery module is obtained by connecting a large number of cells in series and parallel, to achieve the desired values of bus voltage and capacity (energy). However, the mass of the battery pack is larger than the sum of cells in parallel and/or in series because of the presence of inter-cell connectors, separators infra-cell, control units, etc. The additional mass is also larger when higher discharge currents are required. Consequently, the gravimetric energy density at battery pack level is much lower than the cell specific energy and depends on Crate, C and Ns. Being C and Ns the same, the higher the Crate, the higher the battery power. Therefore, using a pack with a higher Crate will leave room for extra power, safety, and extending the life of battery. On the other hand, batteries with higher Crate are heavier and bulkier.
2.1. Modeling the Battery Current and State of Charge
Three main types of battery models have been presented in the battery-related literature: mathematical, electric, and physical [
12] with electric model being the best compromise between the high accuracy and complexity of physical models and the simplicity and limited truthfulness of mathematical ones. Electric models describe the battery with an equivalent electric circuit and are able to estimate the voltage and current changes in the battery during both discharging and recharging [
12] not only in off-line modeling but also in real time applications.
The simplest battery circuit consists of an open circuit voltage () and internal resistance ():
The internal resistance R takes into account three contributions:
The open circuit voltage and the internal resistance are a function of the battery state, which is expressed in terms of State of Charge (SOC) and temperature [
13]. The SOC is the amount of actual charge in the battery expressed as a percentage of its nominal capacity.
For this reason, they are reported in Equation (4) as a function of the time. In this study, we will neglect the effect of temperature (leaving this analysis for a further investigation) and use the well- known Shepherd–Peukert’s model to express the dependence of the on SOC.
In the Shepherd–Peukert model [
14] the OCV is calculated as the sum of three terms: a constant voltage E
0, a polarization term and an exponential loss:
where J, A and B are tuning variables as explained later in the text.
In this equation,
is the charge drawn from the battery at time
that can be also used to calculate the battery state of charge:
Actually, the ultimate goal of the electric models is to achieve an accurate state of charge estimation, because the SOC is the main state parameter in the control of hybrid electric power systems [
13,
15,
16].
The Shepherd–Peukert model was developed to simulate a typical constant-current discharge test that starts with the battery fully charged (SOC = 100%, battery voltage equals the open circuit voltage). A constant current is then applied and the battery voltage starts to decrease. After a certain time, the cut-off voltage is recharged and the battery is considered discharged. The battery discharge time
depends on the discharge current but the dependence is not of inverse proportionality due to the so-called Peukert effect [
13]:
The Peukert coefficient
n depends on the cell technology and varies between 1 and 1.5 for lithium batteries [
16]. Because of the Peukert effect, the capacity of the battery is a function of the discharge current:
The capacity reduction that occurs at high discharging currents is an important issue often neglected in the sizing and analysis of electric and hybrid powertrains as in [
17].
The simulation approach used in this investigation (see also [
18]) is to evaluate the actual current of the battery according to the power request
and its state of charge and to upgrade
As proposed by [
19], to take into account the Peukert effect, the upgrade of the
is performed by integrating not the actual current (as in Equation (6)) but an effective current defined as
If the battery is charged on board of the vehicle, the same model can be used with the simple trick of considering a negative battery current/power. However, it is necessary to use an appropriate charging scheme not only to get back as much as possible charge in the battery, but also to avoid damages and to maintain the temperature within safety limits [
20]. The most appropriate charging scheme for Lithium batteries is the constant-current constant voltage (CC/CV). In this method, charging is started at constant current I
0. The voltage rapidly goes up until the upper voltage limit of the cell is reached. This limit should be equal to
Vmax = 4.2 V for all lithium cells; however, lithium cells are sometimes charged to 4.1V to increase the cycle life even if this reduces the effective cell capacity by about 10% [
21]. During the CC charge, the power needed for the charge increases with time. When the upper voltage limit is reached, the state of charge of the battery is less than 100%. To restore the initial capacity, a constant voltage recharge is then performed. In this second phase, the charging current decreases exponentially up to a cut-off current that can be set in the range 0.03I
0–0.1I
0. [
21,
22,
23].
2.2. Tuning of the Model and Implementation Issues
Equation (5) contains a set of tuning parameters which depend on the specific battery and can be obtained by comparison with experimental data acquired under controlled conditions [
14,
23] or by on-line parameter identification [
6,
12].
A simplified version of the model proposed here (with a constant
) was presented in [
24] and named “
Ragone mod” because it applies the Ragone model proposed by [
25] with a correction to take into account the Peukert effect. Another approach proposed by the authors in [
24] is a modified version of the Traub formula [
26] that calculates the discharge time as:
where
is the discharge time over which the battery capacity is determined (usually 1 h) [
26].
These models were validated in [
24] through comparison with a variety of experimental data of battery discharge times at constant power. This comparison showed that both models are able to predict the constant power discharge time with an average relative error of 3%. For more details about the previous models and their validation, please refer to [
24].
In this investigation, the values of the model variables were taken from [
27]. They are shown in
Table 1.
The model was applied to general hypothetical lithium battery with a nominal capacity of 130 Ah and a nominal voltage of 270 V (73 cells in series).
The internal resistance
is strictly connected to the
of the battery because it limits the current [
13] and, therefore, the maximum power that the battery can deliver, as can be see also from (9). For the hypothetical battery, the internal resistance was selected in order to achieve a burst current of 30C [
24] obtaining
. The full specification of the battery is in
Table 2.
The proposed model can be used for constant power and mission-based analyses in this way. The time variable is discretized in time steps and Equations (5), (9) and (10) are applied in sequence, at any time step, to evaluate the battery current. Then, the effective current is calculated with (10) and the state of state of charge updated with Equation (11).
In the constant power analysis, the at time is assumed equal to 100% (full charged battery) and the simulation is run until the reaches the minimum accepted value of 20% in order to find the discharge time of the battery at that power level, thus obtaining a DOD of 80%.
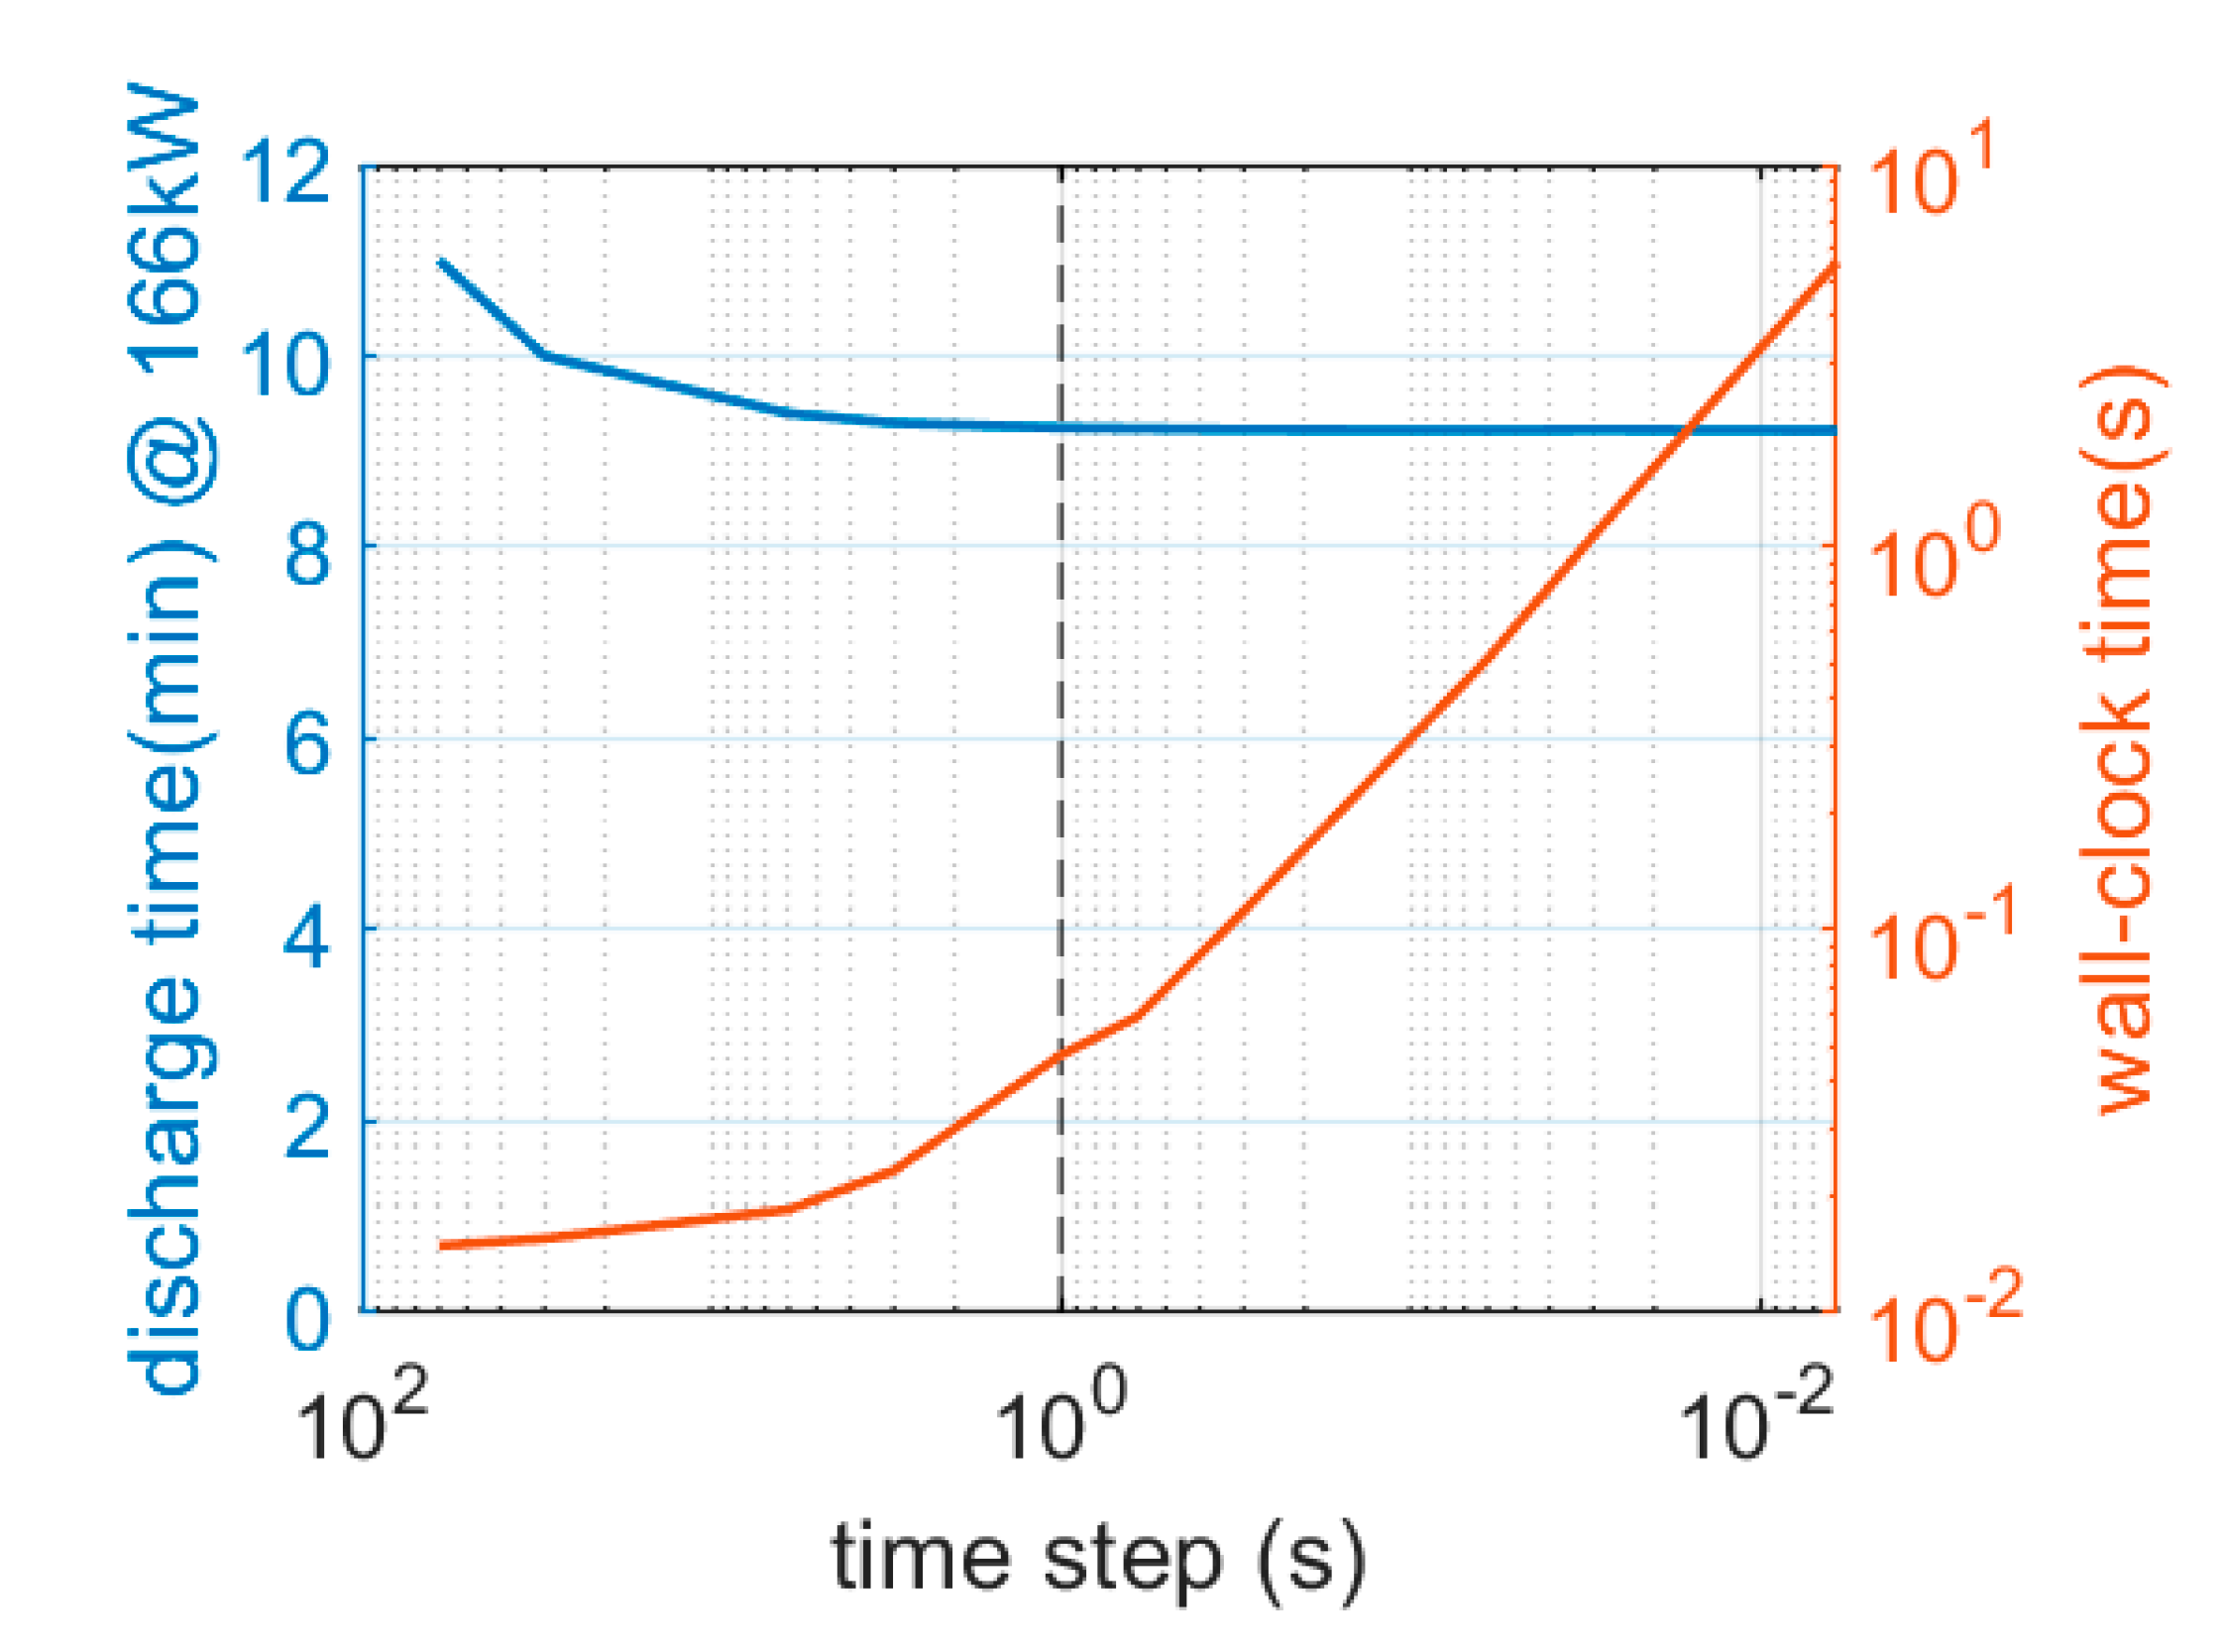
Before applying the model, a sensitivity analysis on the time step was performed by considering a power request
of about 1/3 of
and reducing the time step from 100 s to 0.01 s. The results are shown in
Figure 1 in terms of discharge time and wall-clock time on an ATX Intel i7 8700 Workstation as a function of the time step. Please note that a time step of 1 s ensures sufficient accuracy in the estimation of the discharge time with a reasonable wall-clock time. Therefore, a time step of 1 s was applied to all the simulations performed in the present investigation.
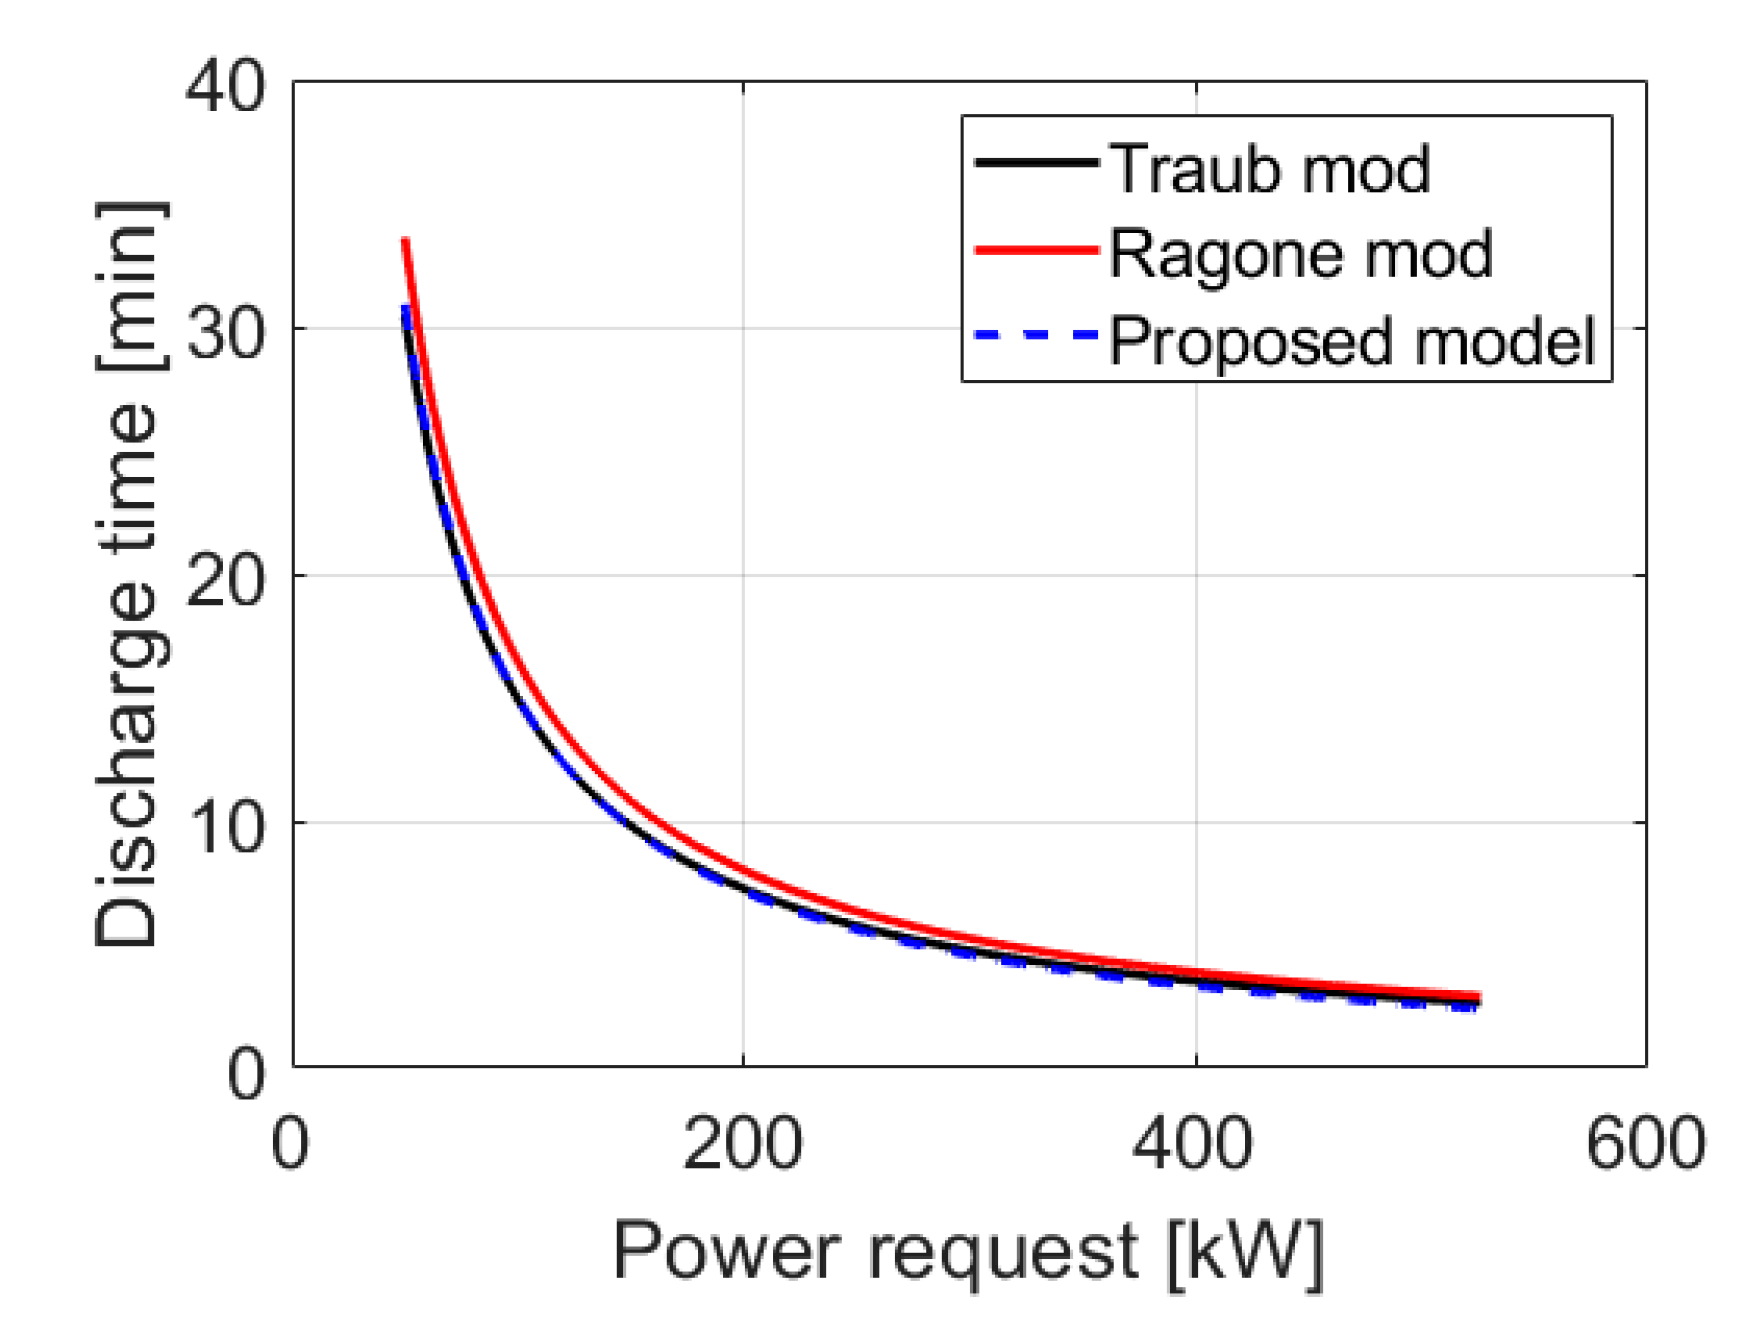
To validate the proposed model, the simulations were repeated with a battery power request ranging from 50 kW to the nominal power of the battery (526 kW). The results were compared in
Figure 2 with the discharge times found with the
“Traub mod” and
“Ragone mod” models proposed in the previous investigation [
24].
Please note that the results obtained with the proposed model are very similar to the discharge time predicted by the “Traub mod” model. However, the two previous models can only be applied to constant power simulations while the new approach can calculate the battery current, the effective current and the battery state of charge along a flight mission with a variable power demand.
3. Battery Aging
The main drawback of the proposed model is that battery specification and model parameters are constant, while in experience they change during the battery life due to several phenomena such as capacity fade, thermal influence, etc. [
1,
28]. Moreover, the battery life and its associated failure mechanisms are strongly dependent on battery architecture, load profile, and control strategies. This limits the accuracy of electric model in real applications, though they are widely employed during system design. The use of data-driven prognostic [
29] and on-line parameter identification techniques [
6] would compensate for the accuracy loss in using a simple battery model by allowing parameter/state estimation during the normal operation of the battery.
To understand how aging affects the discharge time of the battery and, therefore, the performance of electric and hybrid electric aircraft, it is possible to introduce empirical correction factors. In this investigation, the main specifications of the battery and the parameters of the model are expressed as a function of the battery “cycle number”, which is defined as the number of complete discharge-recharge cycles executed on the battery. A battery is conventionally said to have reached its end of life (named life cycle) when the capacity reaches 80% of the nominal value. This usually happens, for a Li-ion battery, after 300–500 discharge-recharge cycles [
4]. However, other life parameters can be defined for the batteries because their performance degrades in time even when not used (shelf life).
The aging of a lithium-ion battery affects both energy and power retention [
7]. The energy retention is caused by the reduction of the nominal capacity and the increasing of the Peukert coefficient, while the power retention is associated mainly to the increase of the internal resistance. The open circuit voltage is also affected by the battery cycle number.
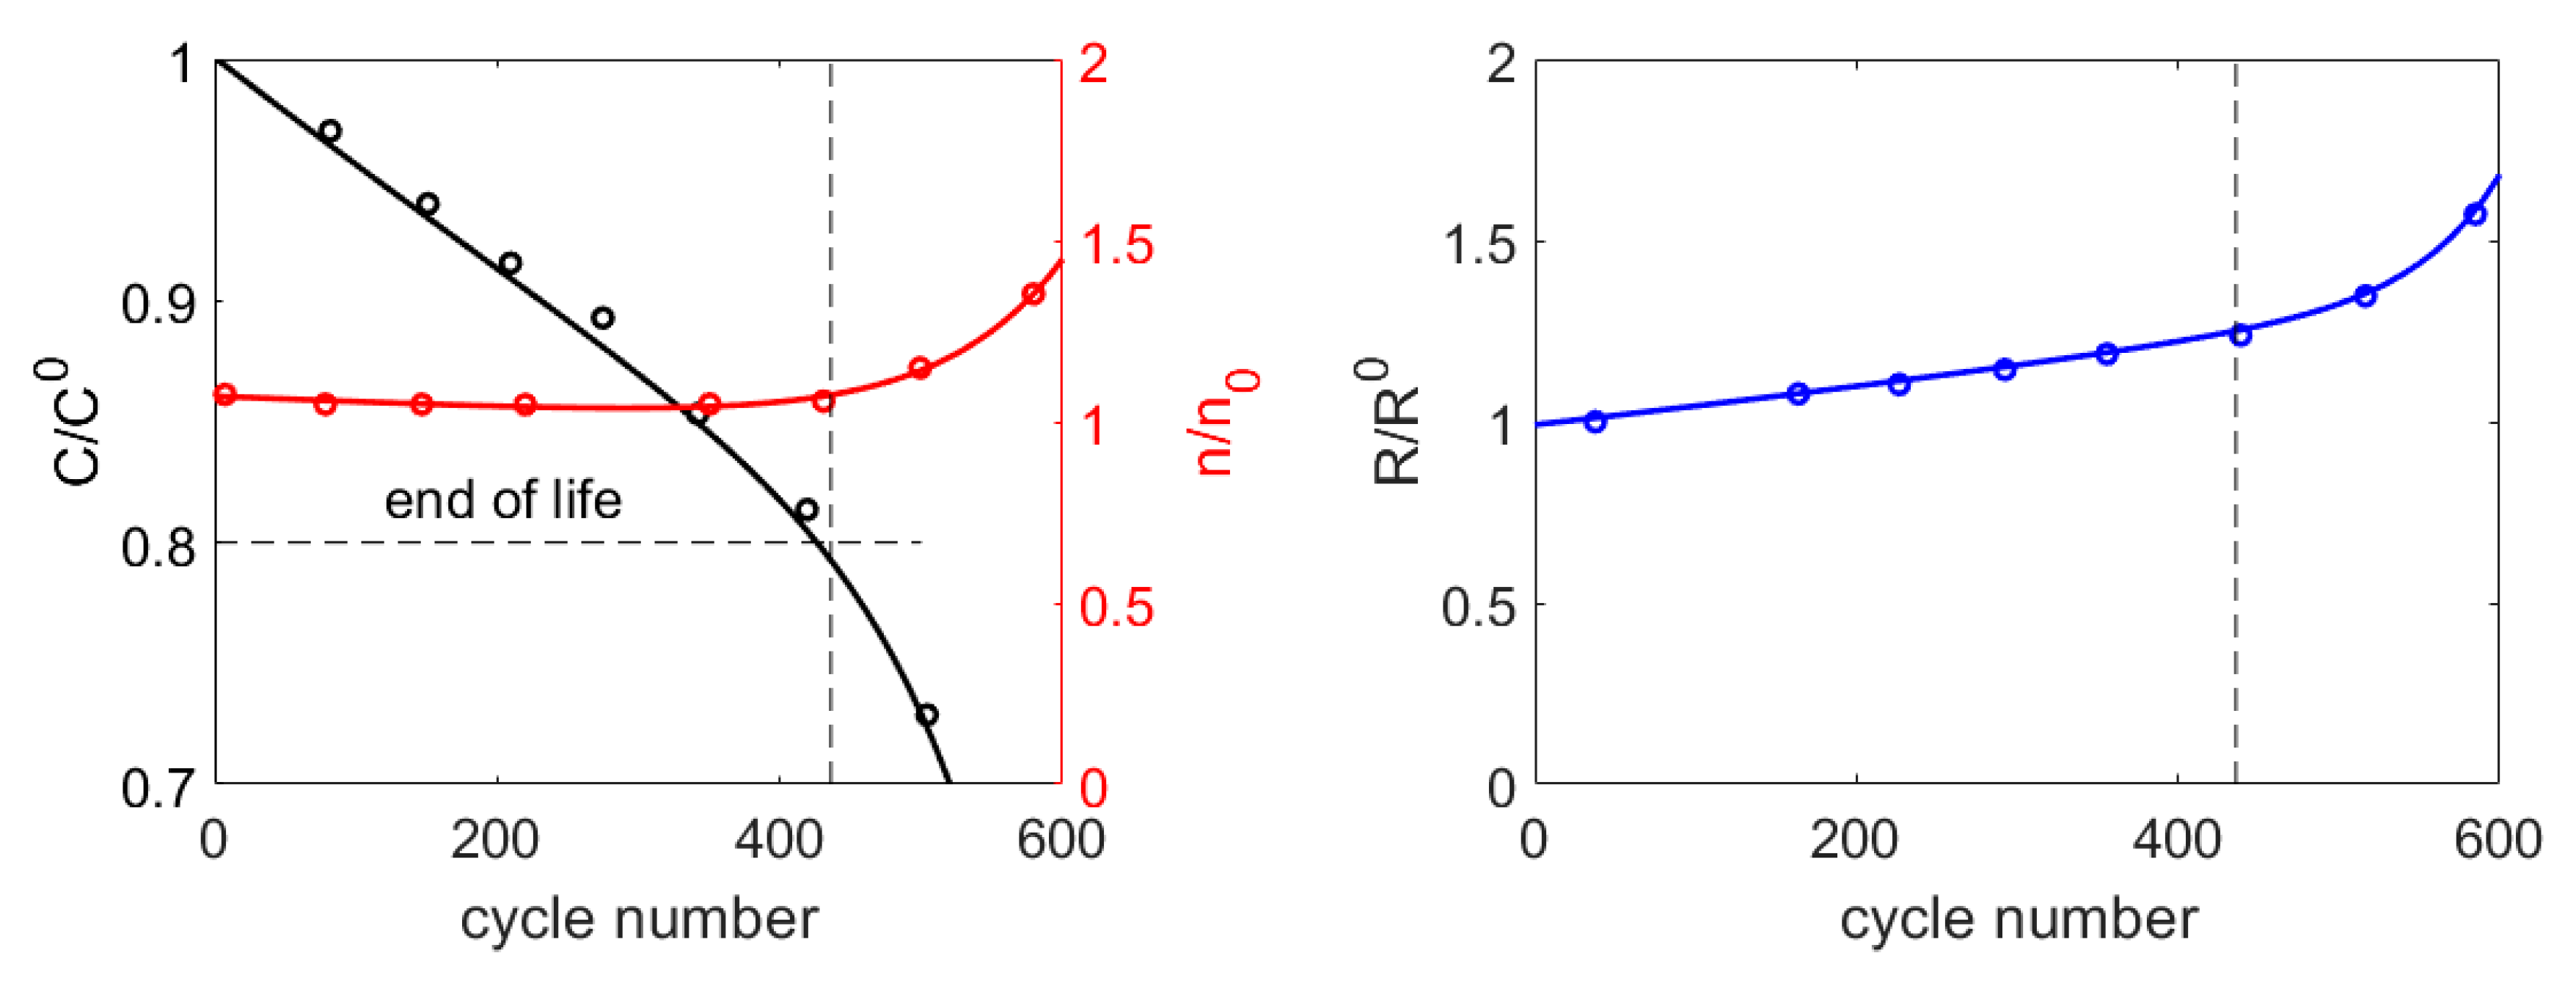
In [
7], the capacity fading of a LiFePO4 cell was studied using a dynamic stress test schedule. In particular, Dubarry et al. [
7] derived the Peukert curves at various stages of life (in cycle number), and found that the Peukert coefficient (initially equal to 1.05) declines gradually from the 1st to the 80th cycle, then remains relatively constant. After 400 cycles, the Peukert coefficient begins to increase at a noticeable pace up to 1.35. As for the resistance, in the tests of [
7] it increases monotonically with cycle number and is doubled after 400 cycles (see
Figure 3).
The data of Dubarry et al. [
7] were used here to correct the parameters of the battery model as a function of the cycle number N. For each parameter
of the battery model (namely nominal capacity
, Peukert coefficient
and internal resistance
), the correction factor is defined as follows:
where the initial values of the parameter are denoted with superscript 0.
The dependence of the correction factors on battery cycle number is expressed as a double exponential:
In this investigation, the coefficients of Equation (14) were obtained by minimizing the root-mean-square error from experimental data of [
7] for each parameter. The values found in the fitting are reported in
Table 3 while
Figure 3 compares the data of [
7], shown as circles, with the results of Equation (14) after the fitting.
Please note that the results with N = 1 correspond to the nominal values of the battery parameters. The battery reaches its nominal end of life at cycle 436 when the capacity is reduced to 80% of the initial value.
It is important to stress that the proposed aging model cannot be universally used for a general li-ion battery but it is useful for the goal of the investigation i.e., to show how an aging model can be implemented and used to evaluate the performance of electric and hybrid electric power systems.
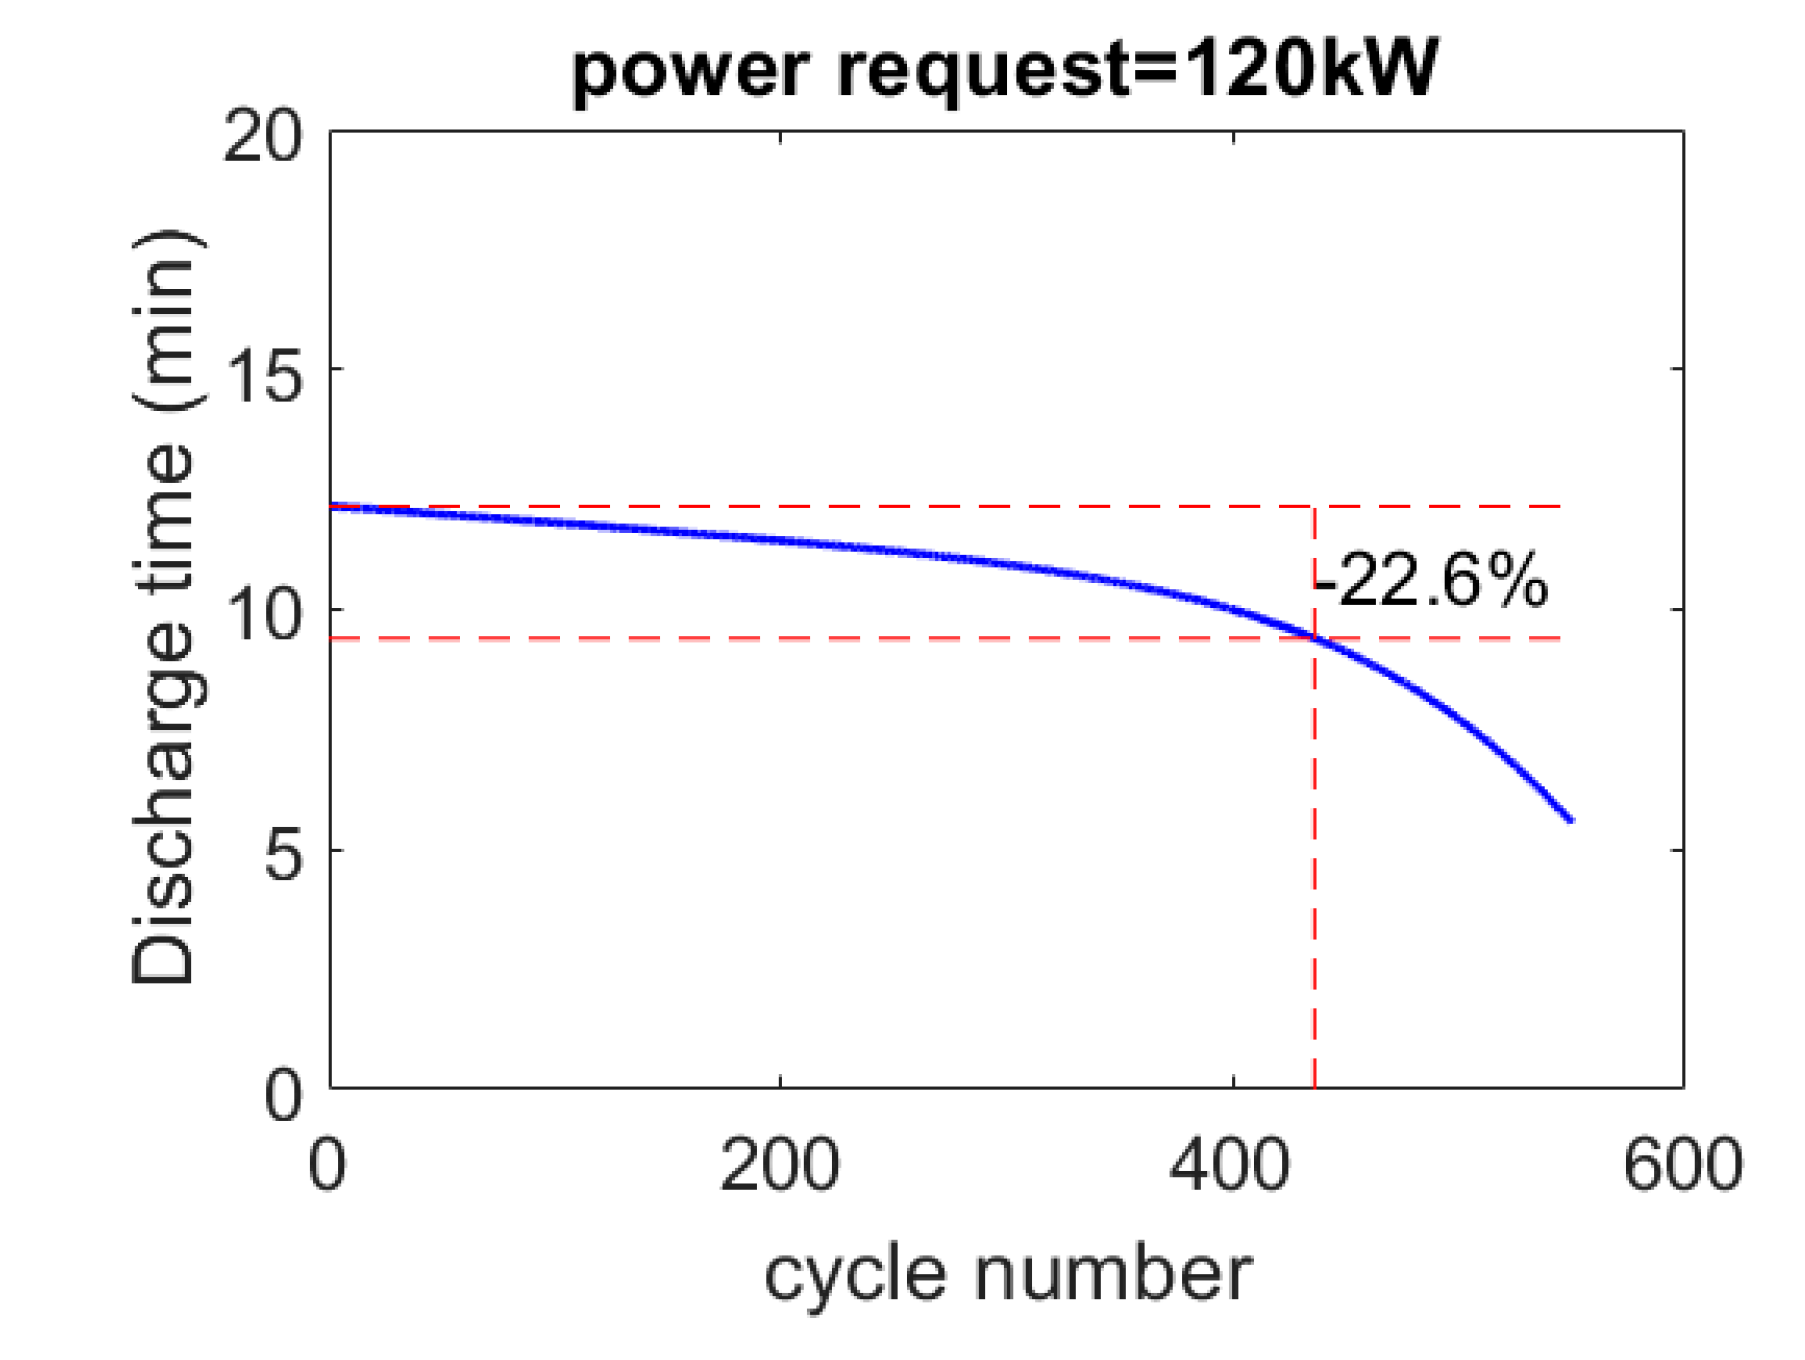
The aging model is applied in
Figure 4 to the same battery of
Table 2 with a required power of 120 kW to underline the effect of aging on the battery discharge time. Please note that along the battery life, the discharge time at 120 kW decreases from 12.15 min at the beginning of the life to 9.4 min at the end of life.
As already explained, the proposed model does not take into account the effect of working temperature that is usually controlled by the Battery Management System and the Thermal Management System [
30].
4. The Hybrid Electric Rotorcraft
The advantages of hybrid electric power systems for helicopters include: separation of the propulsion of main and tail rotor, higher reliability, increased operational lifetime thanks to reduction in the number of devices (e.g., gear, transmission, etc.), improved maintenance workability and lower operational costs together with lower emissions, consumption, noise and vibration levels [
31,
32,
33,
34,
35,
36,
37]. As a further advantage, particularly relevant for single-engine rotorcraft, the battery pack allows for a few minutes of endurance in case of engine failure. Instead of completing an autorotation descent with a critical engine-out landing, the residual energy in the batteries can be used for landing the rotorcraft by means of a more conventional (and inherently safer) powered landing sequence [
32,
33,
34]. These advantages need to be weighed against the increased weight and complexity of the resulting powertrain.
Possible variants in terms of powertrain configurations for helicopters are presented in Gurevich et al. [
31]. The electric drive can be used for the tail rotor only or for both rotors, with both parallel and series schemes. In [
37] the feasibility and the fuel saving potentiality of different hybridization scheme for a light helicopter are addressed. In particular, the power and energy required for different missions and emergency landings after thermal engine failure are estimated in order to size and compare the proposed hybridization schemes. This analysis shows that with existing technologies for batteries and motors, the electrification of the tail rotor is the only scheme that can be achieved without a significant increase in the mass of the rotorcraft. A larger fuel saving (−14%) can be potentially guaranteed by the parallel hybrid power system (in which one of the twin engines is replaced by an electric drive and the battery is used as an energy buffer) or with a larger engine coupled with an electric drive for partial emergency landing.
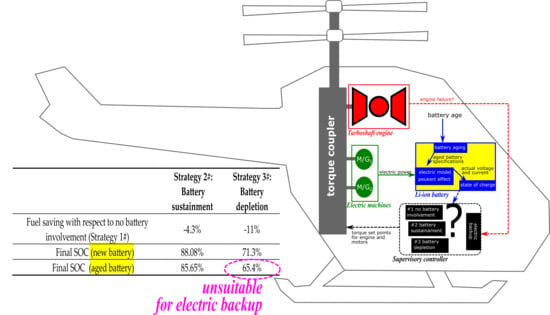
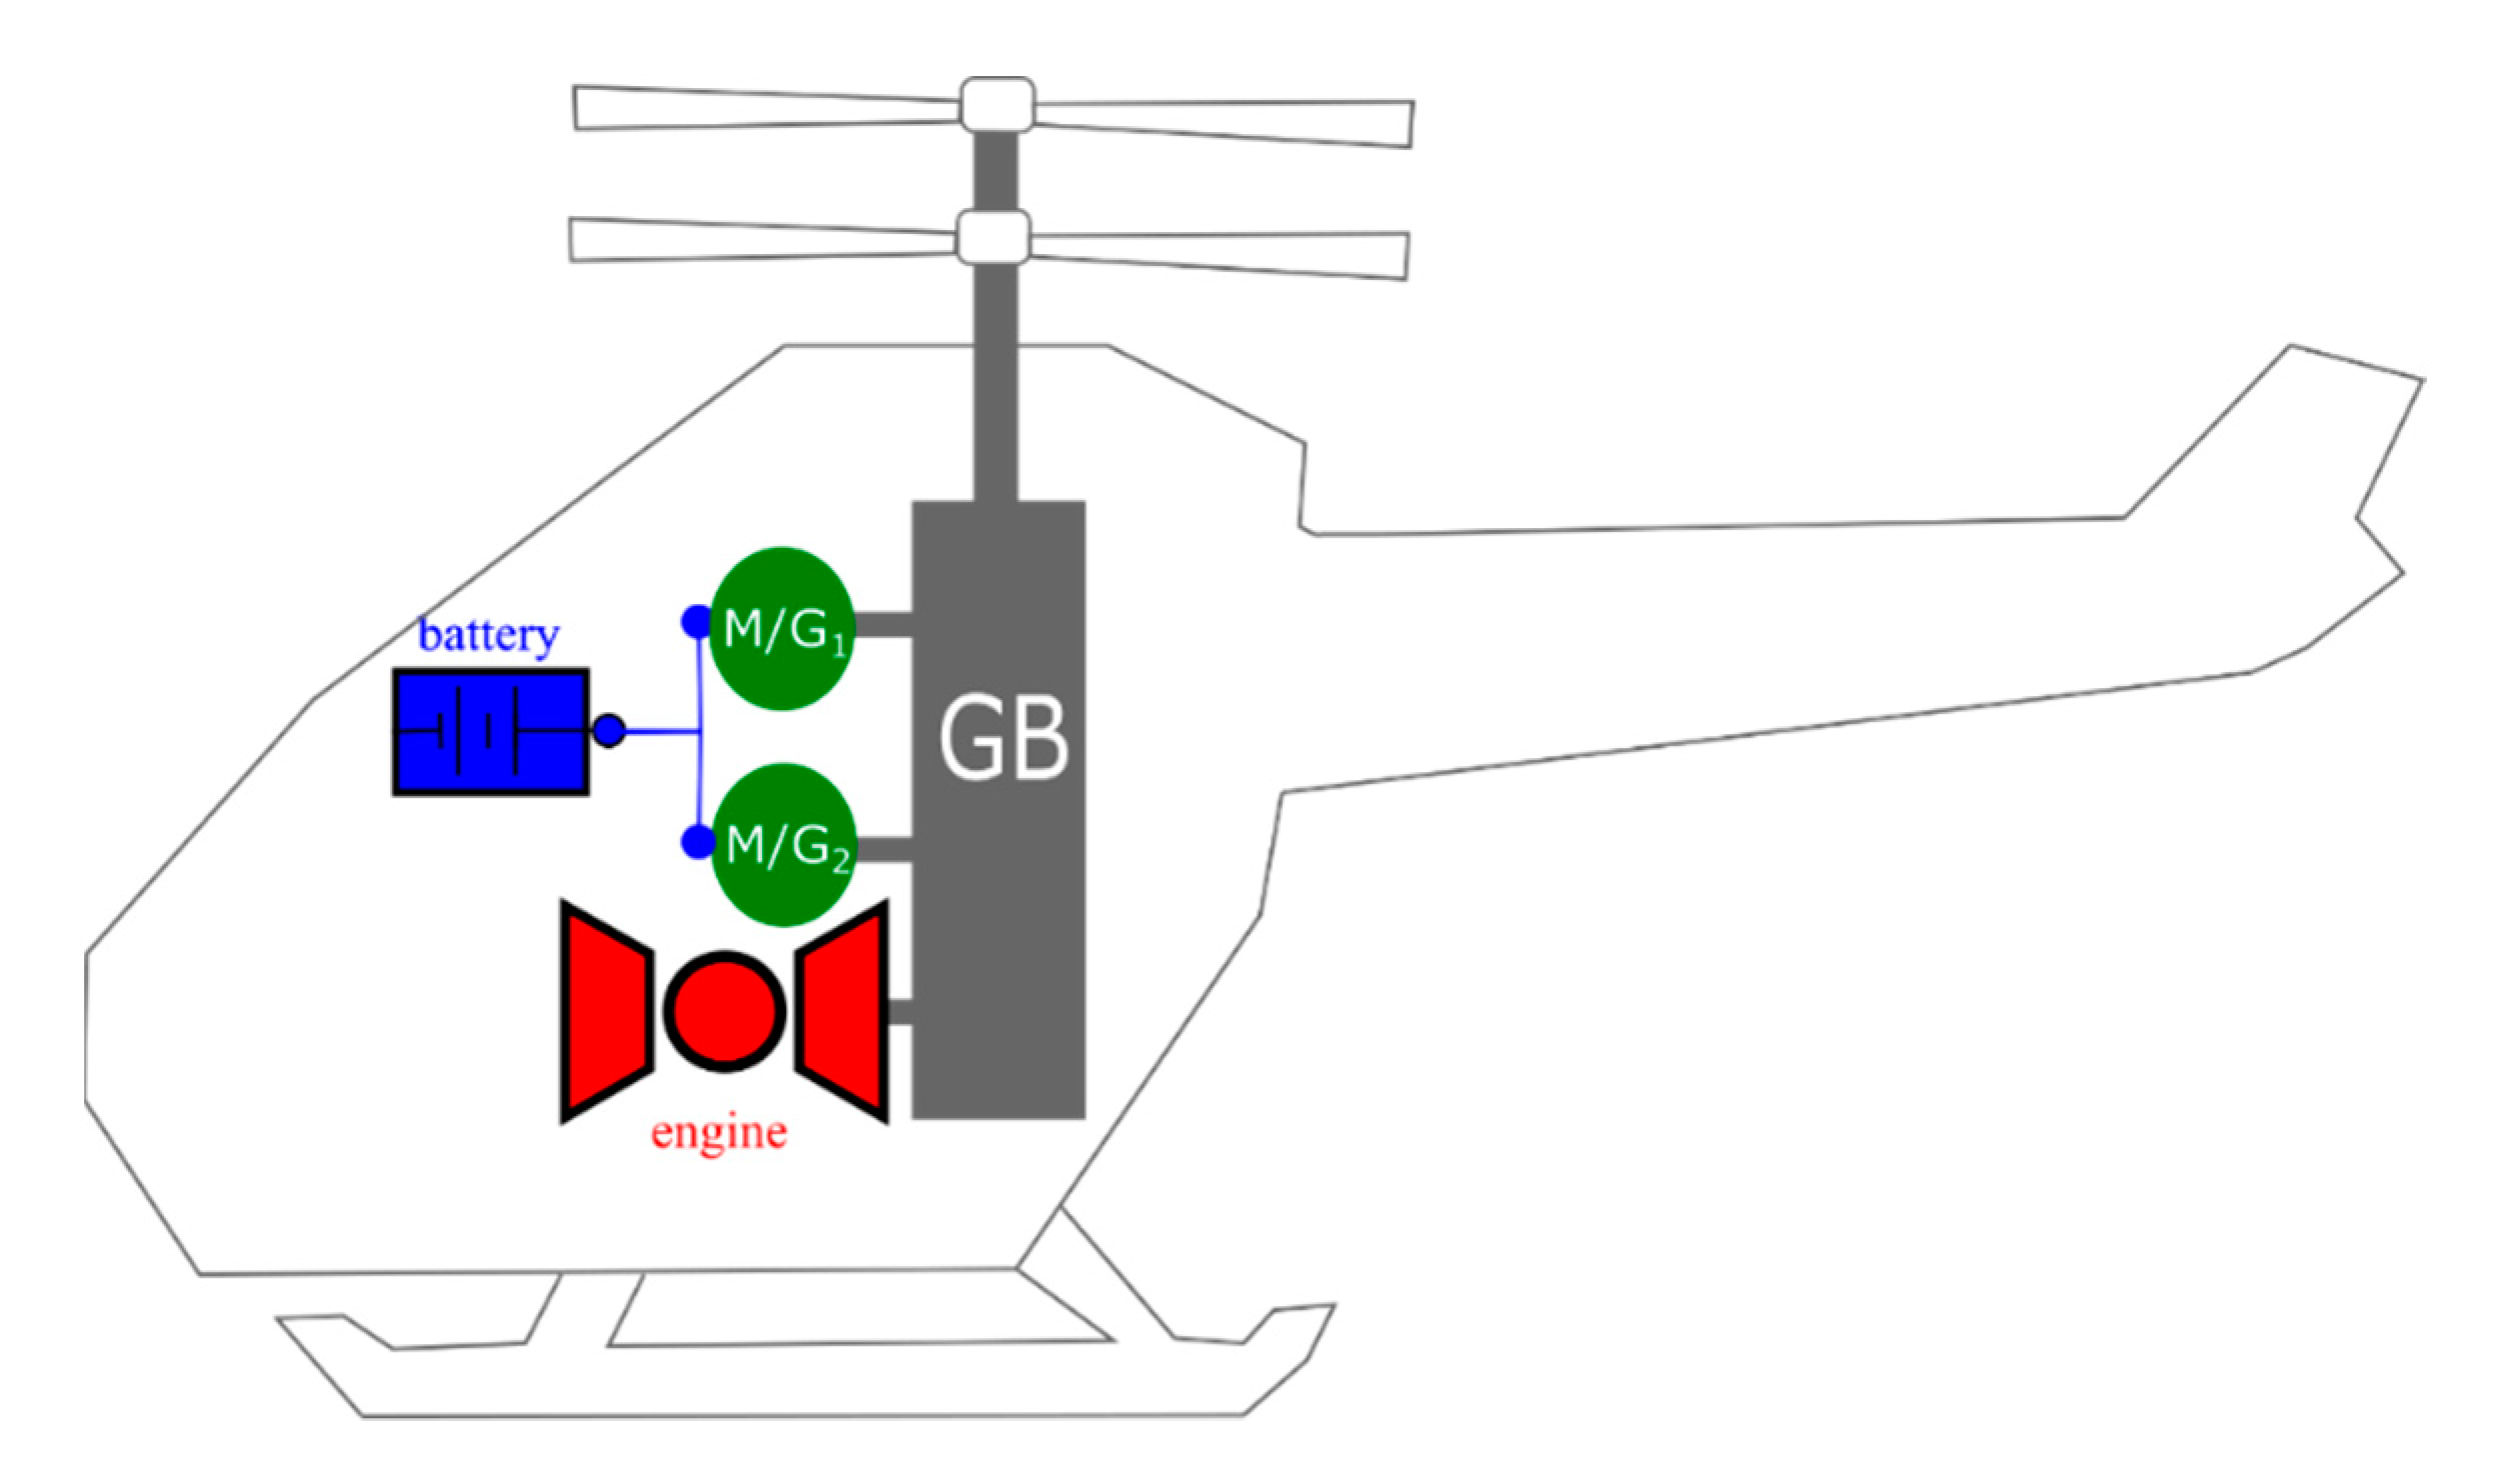
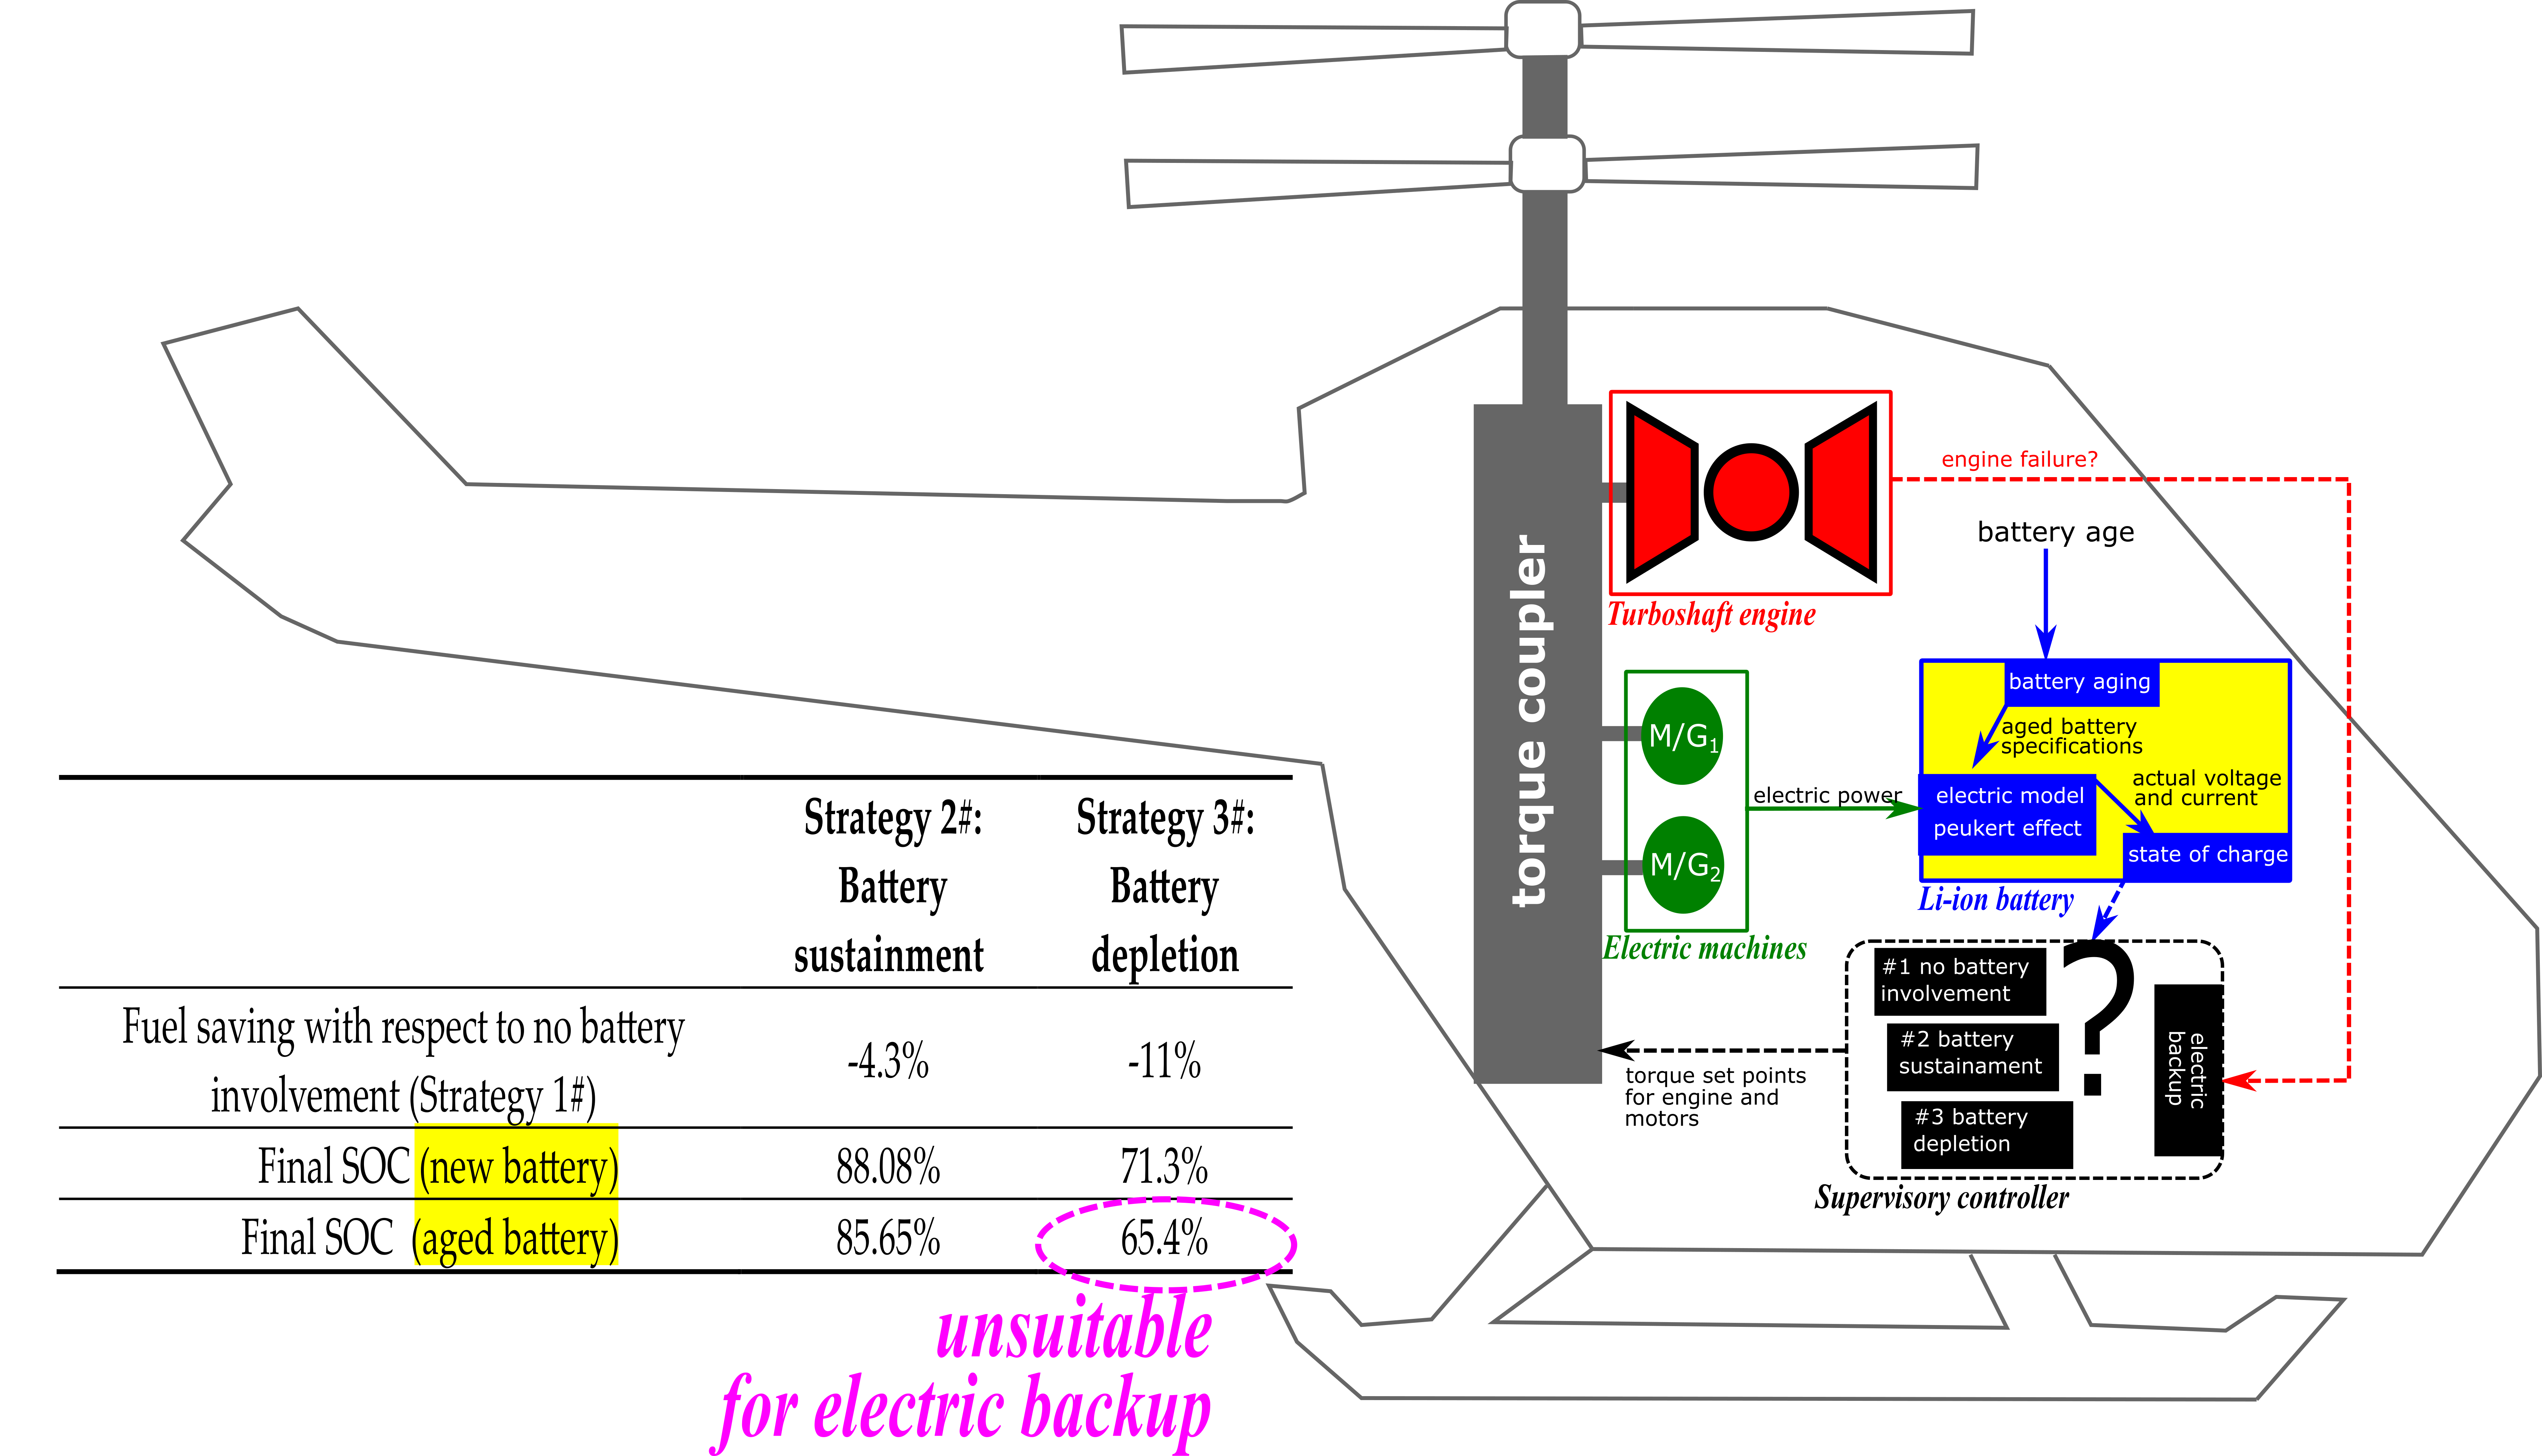
The analysis performed in the present investigation is based on the architecture of
Figure 5. It is a hybrid electric configuration in which a turboshaft engine (with nominal power
) is coupled with two electric machines able to produce a nominal power
The power hybridization degree of the system (defined as the ratio of electric power to total installed power) is equal to 0.45.
A Li-ion battery with specifications similar to those reported in
Table 2 is considered for the application. Please note that it is beyond the goal of this investigation to analyze the issues connected to the weight and complexity of the proposed powertrain. In fact, this study will assume an arbitrary power request comprehensive of the weight of the battery. The rotor shaft speed will be assumed constant and equal to 6000 rpm.
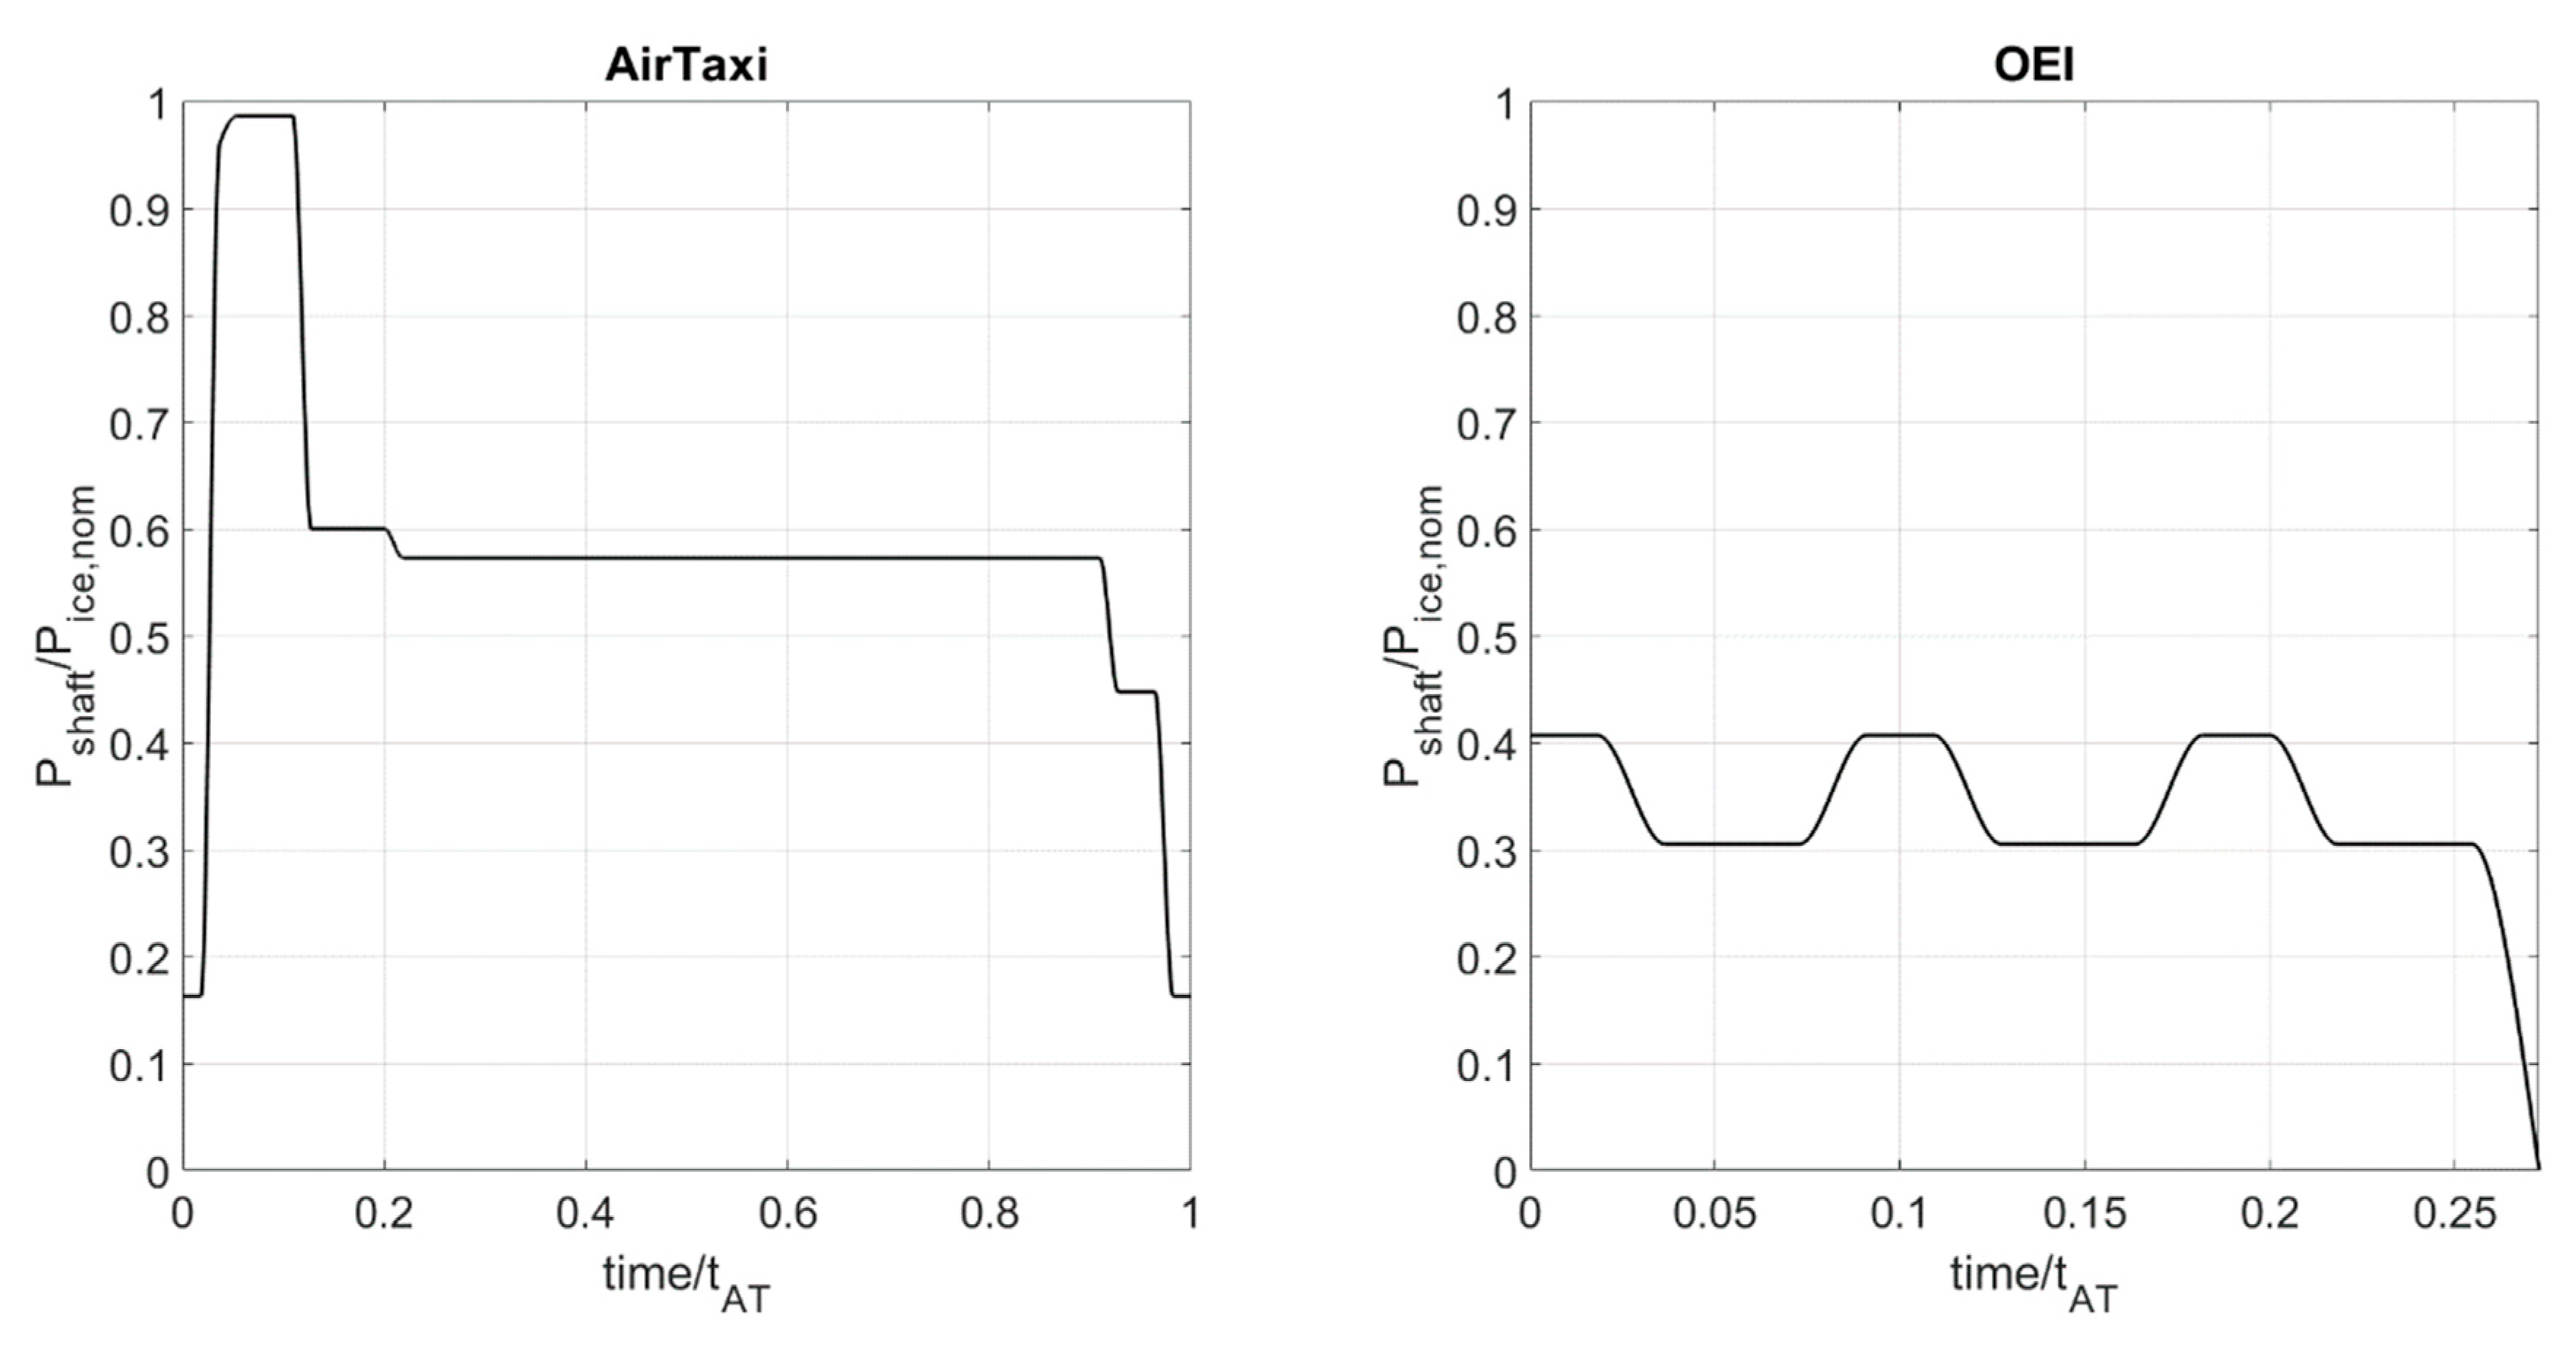
According to the experience of the authors about aerial vehicles for urban air-mobility, a hypothetical Airtaxi mission is considered. It is described in terms of the mechanical power request at the rotor shaft, altitude, and flight time in
Table 4. Because of a confidentiality agreement, the power request is scaled with respect to the nominal power of the turboshaft engine (
). Similarly, the flight time of each phase is scaled with respect to the total flight time of the AirTaxi mission (
).
As stated before, one of the main potential benefits of the hybrid technology in helicopters is the possibility of full back-up electric operation. Considering three landing tries after engine failure, the power request of
Table 5 is considered for the electric motors in case of thermal engine failure to comply with Light Twin Engines OEI (One Engine Inoperative) regulations.
4.1. Preliminary Analysis
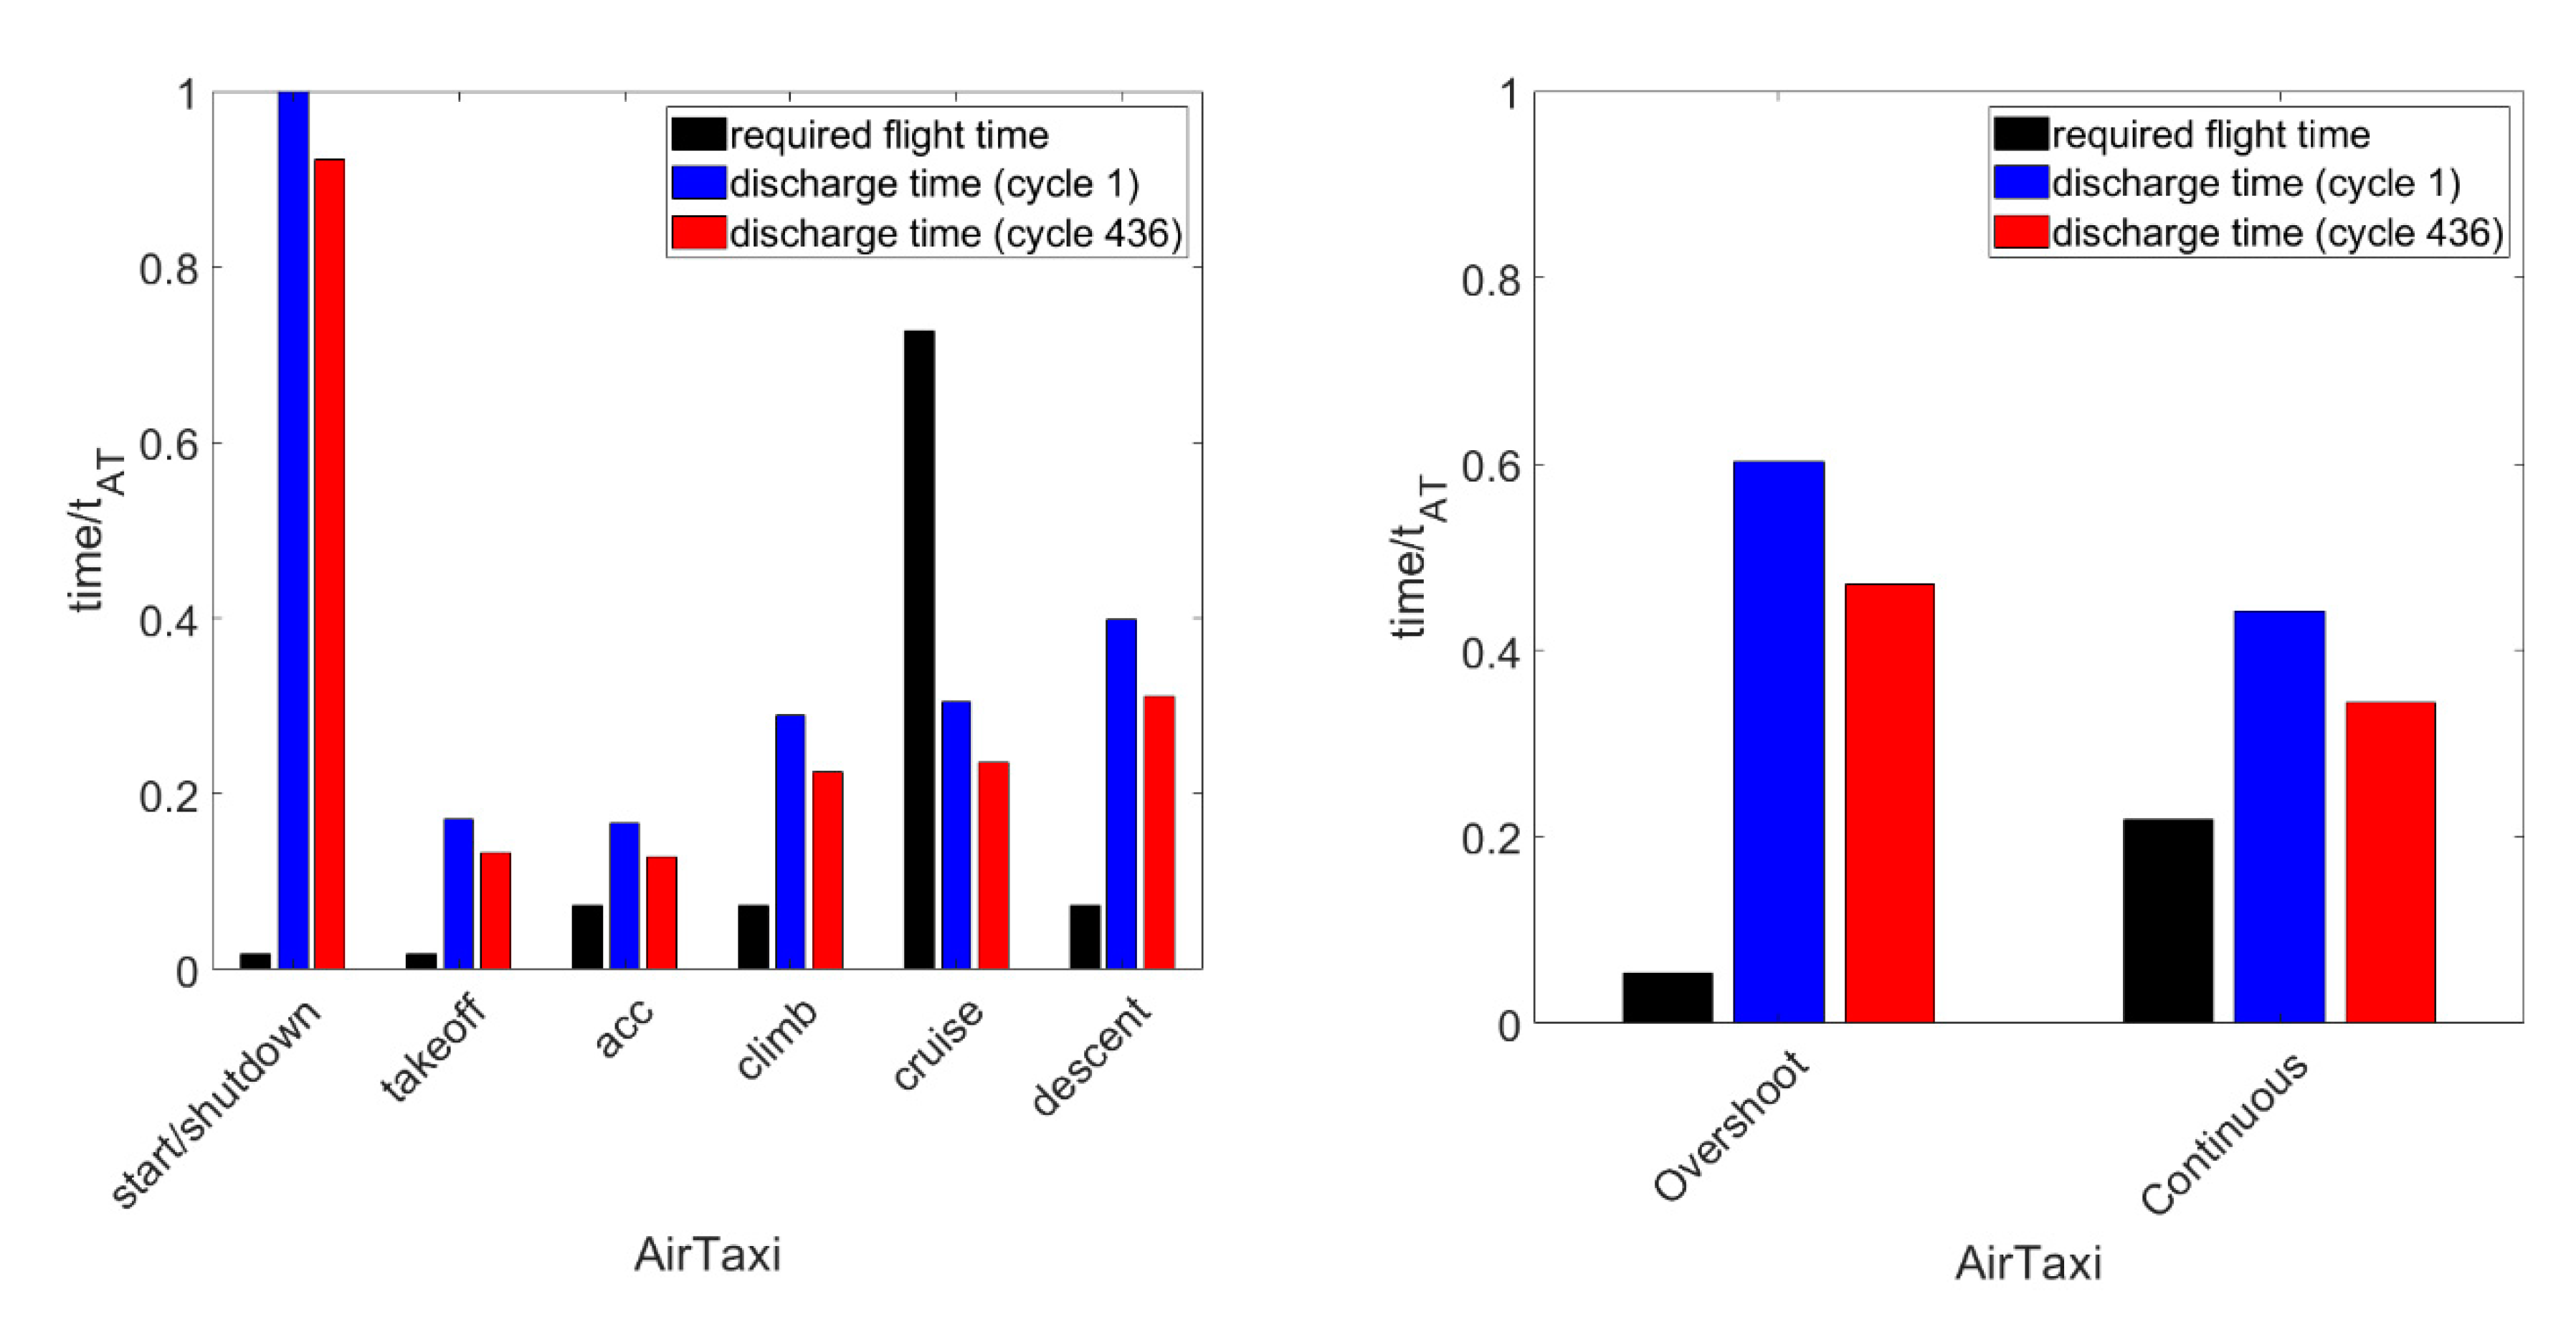
As a preliminary step, we apply the proposed model to check which phases of the missions can be performed in electric mode. To this, we will compare the predicted discharging time with the required flight time (after remarking that the required power is always below the maximum continuous power of the selected battery). In the plots of
Figure 6, the discharge time of the battery is calculated both at the beginning (cycle 1) and at the end of its life (cycle 436).
We can notice that the battery, if initially fully charged, is able to perform, separately, all the flight phases of the two missions, except for cruise in the AirTaxi mission. However, the battery SOC at the beginning of each phase depends on the usage of the battery in the previous phase of flight. Therefore, it is necessary to change the modeling approach and approximate the two missions with the power demand vs. time profiles as in
Figure 7.
Taking into account the results of
Figure 6, we could use the battery in the AirTaxi mission to help the engine with the constraint that its state of charge is always higher that the value required to perform, at any moment, the OEI mission, even when the battery is close to its end of life.
4.2. Modeling the Energy Converters
To evaluate the actual battery power along the AirTaxi mission it is necessary to introduce appropriate models for the other components of the power systems, i.e., the electric machine and the turboshaft engine.
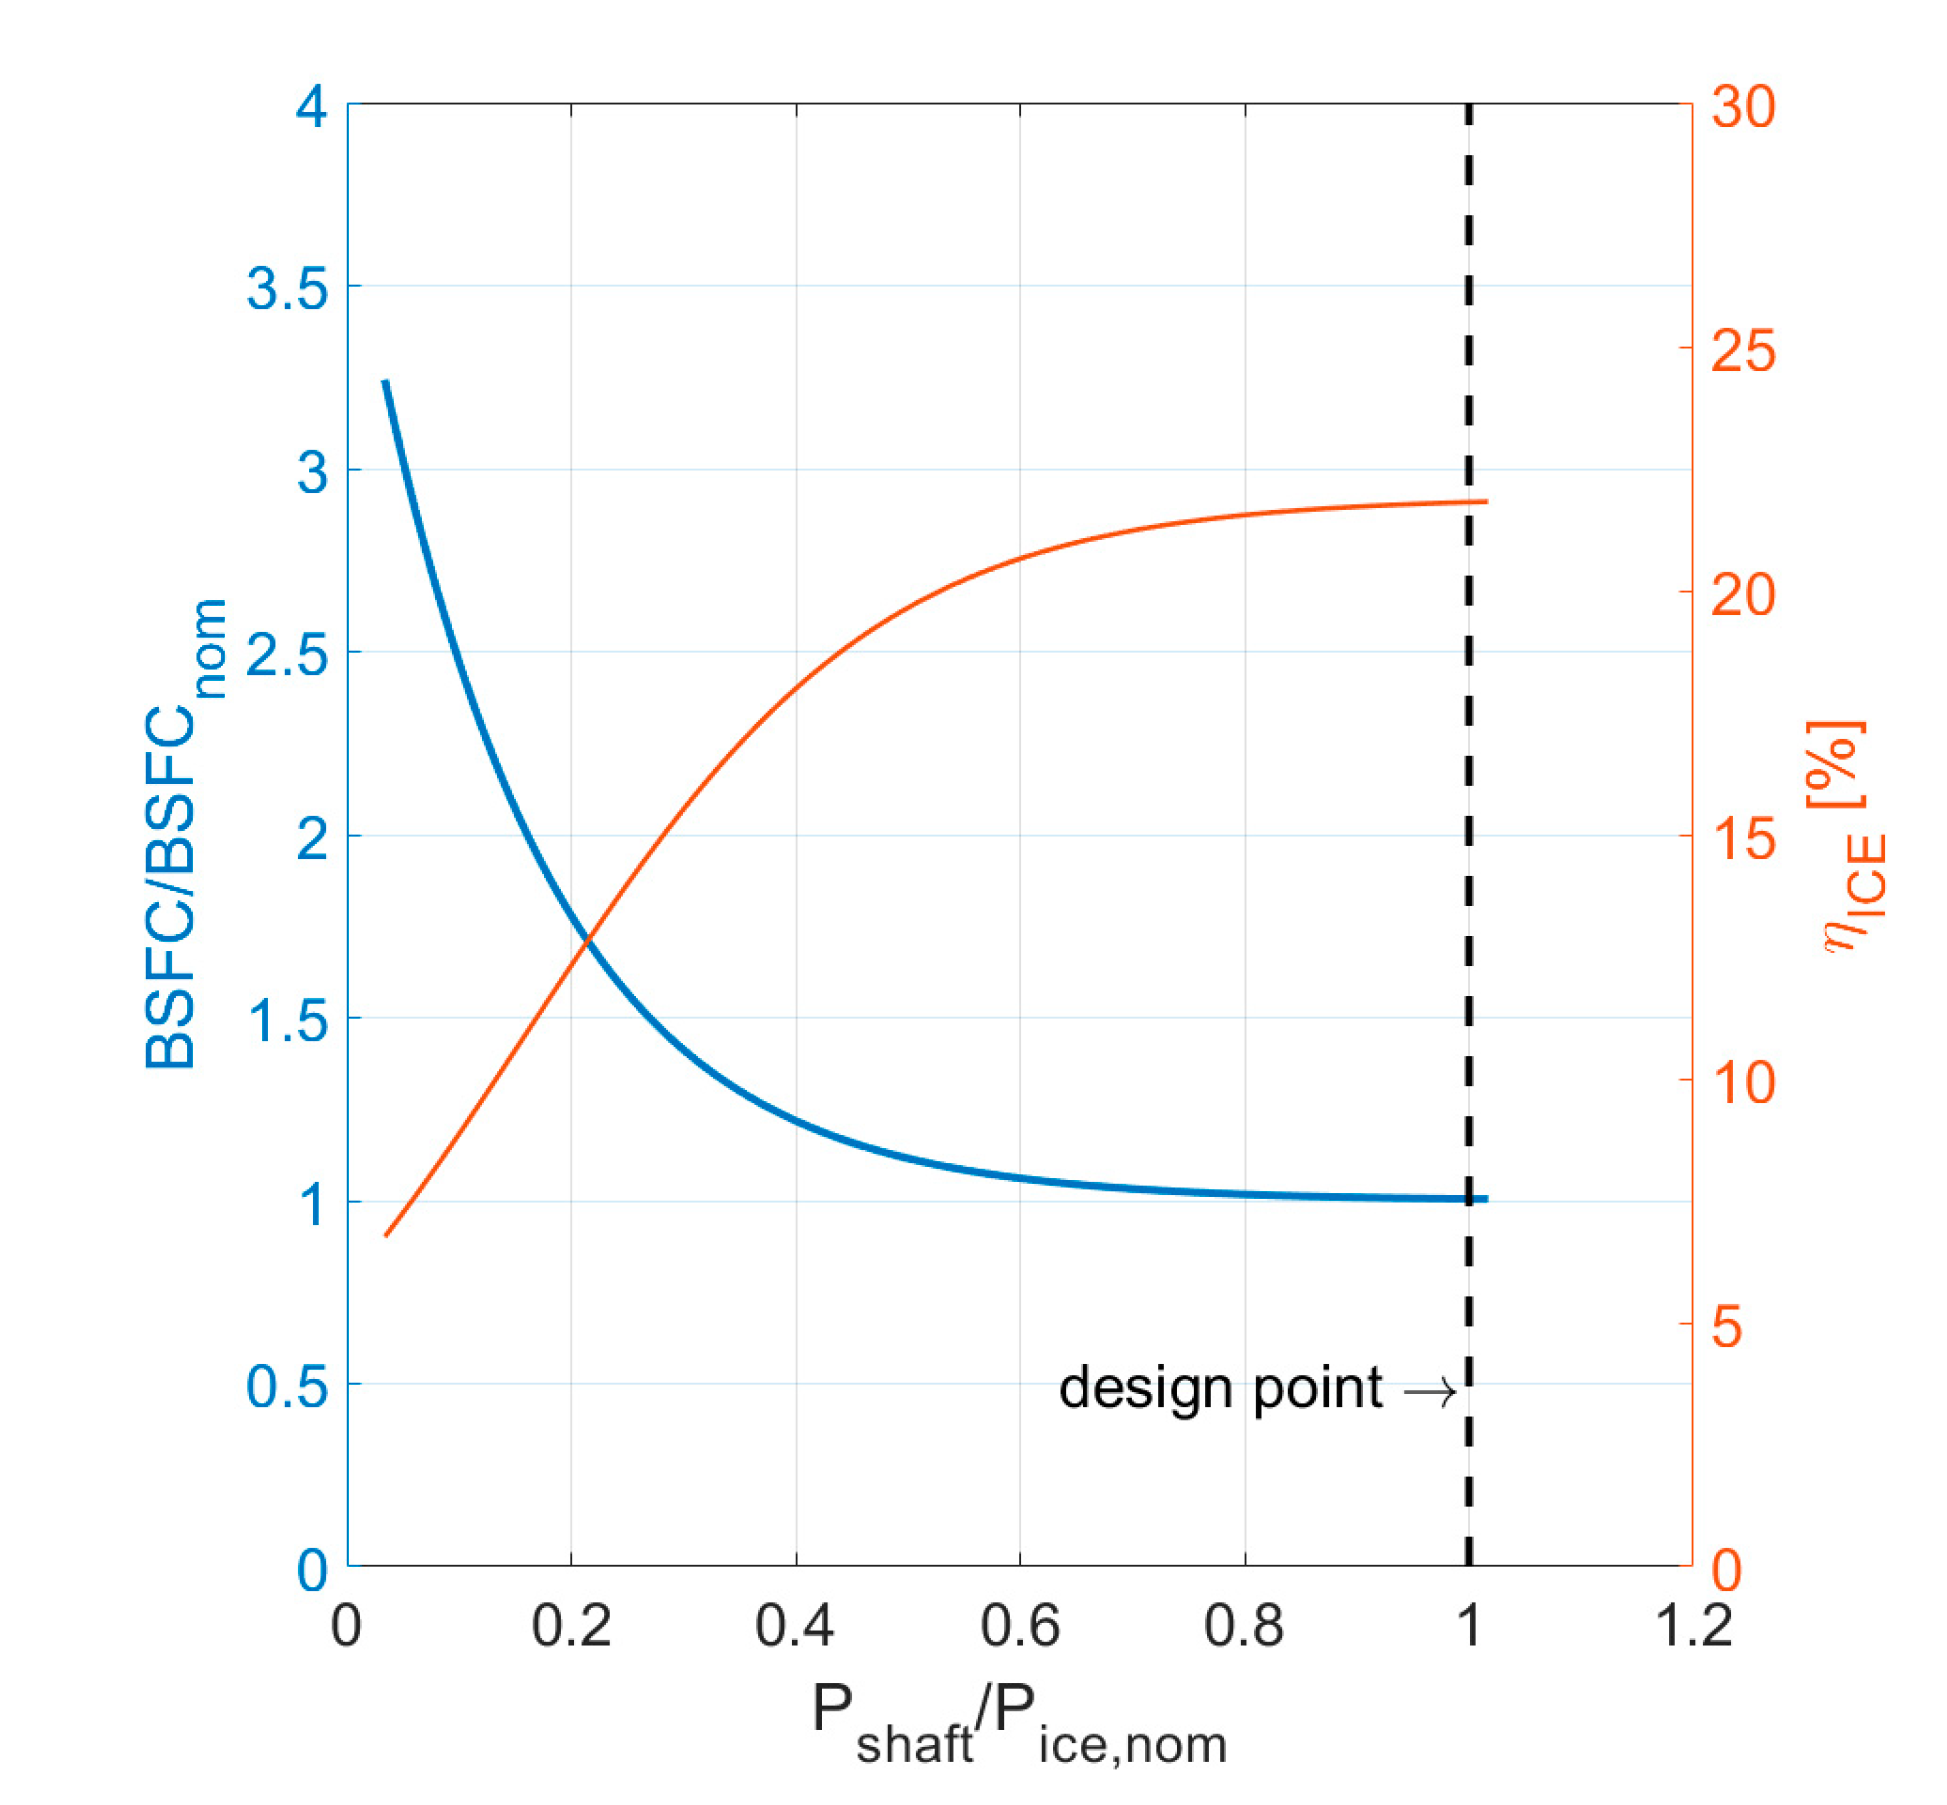
The off-design specific fuel consumption of the turboshaft will be calculated as proposed by [
21]. Starting from the brake specific fuel consumption of the engine at the design point (
) a correction factor to BSFC at part load is considered by Walsh [
38] by including also atmosphere conditions and Mach number as inputs of the model. Since altitude and speed variations are quite limited in the present application, we will consider a dependence on power request only, as shown in
Figure 8. The engine fuel economy can be expressed either in terms of Brake Specific Fuel Consumption (
):
The BSFC is related to the engine efficiency
through the Lower Heating Value (LHV) of the fuel (43 MJ/kg for kerosene):
The fuel flow rate at any instant (time step) of the mission is calculated as:
where
is the engine power at time t.
The total fuel consumption is obtained by numerically integrating the fuel flow rate over the whole mission.
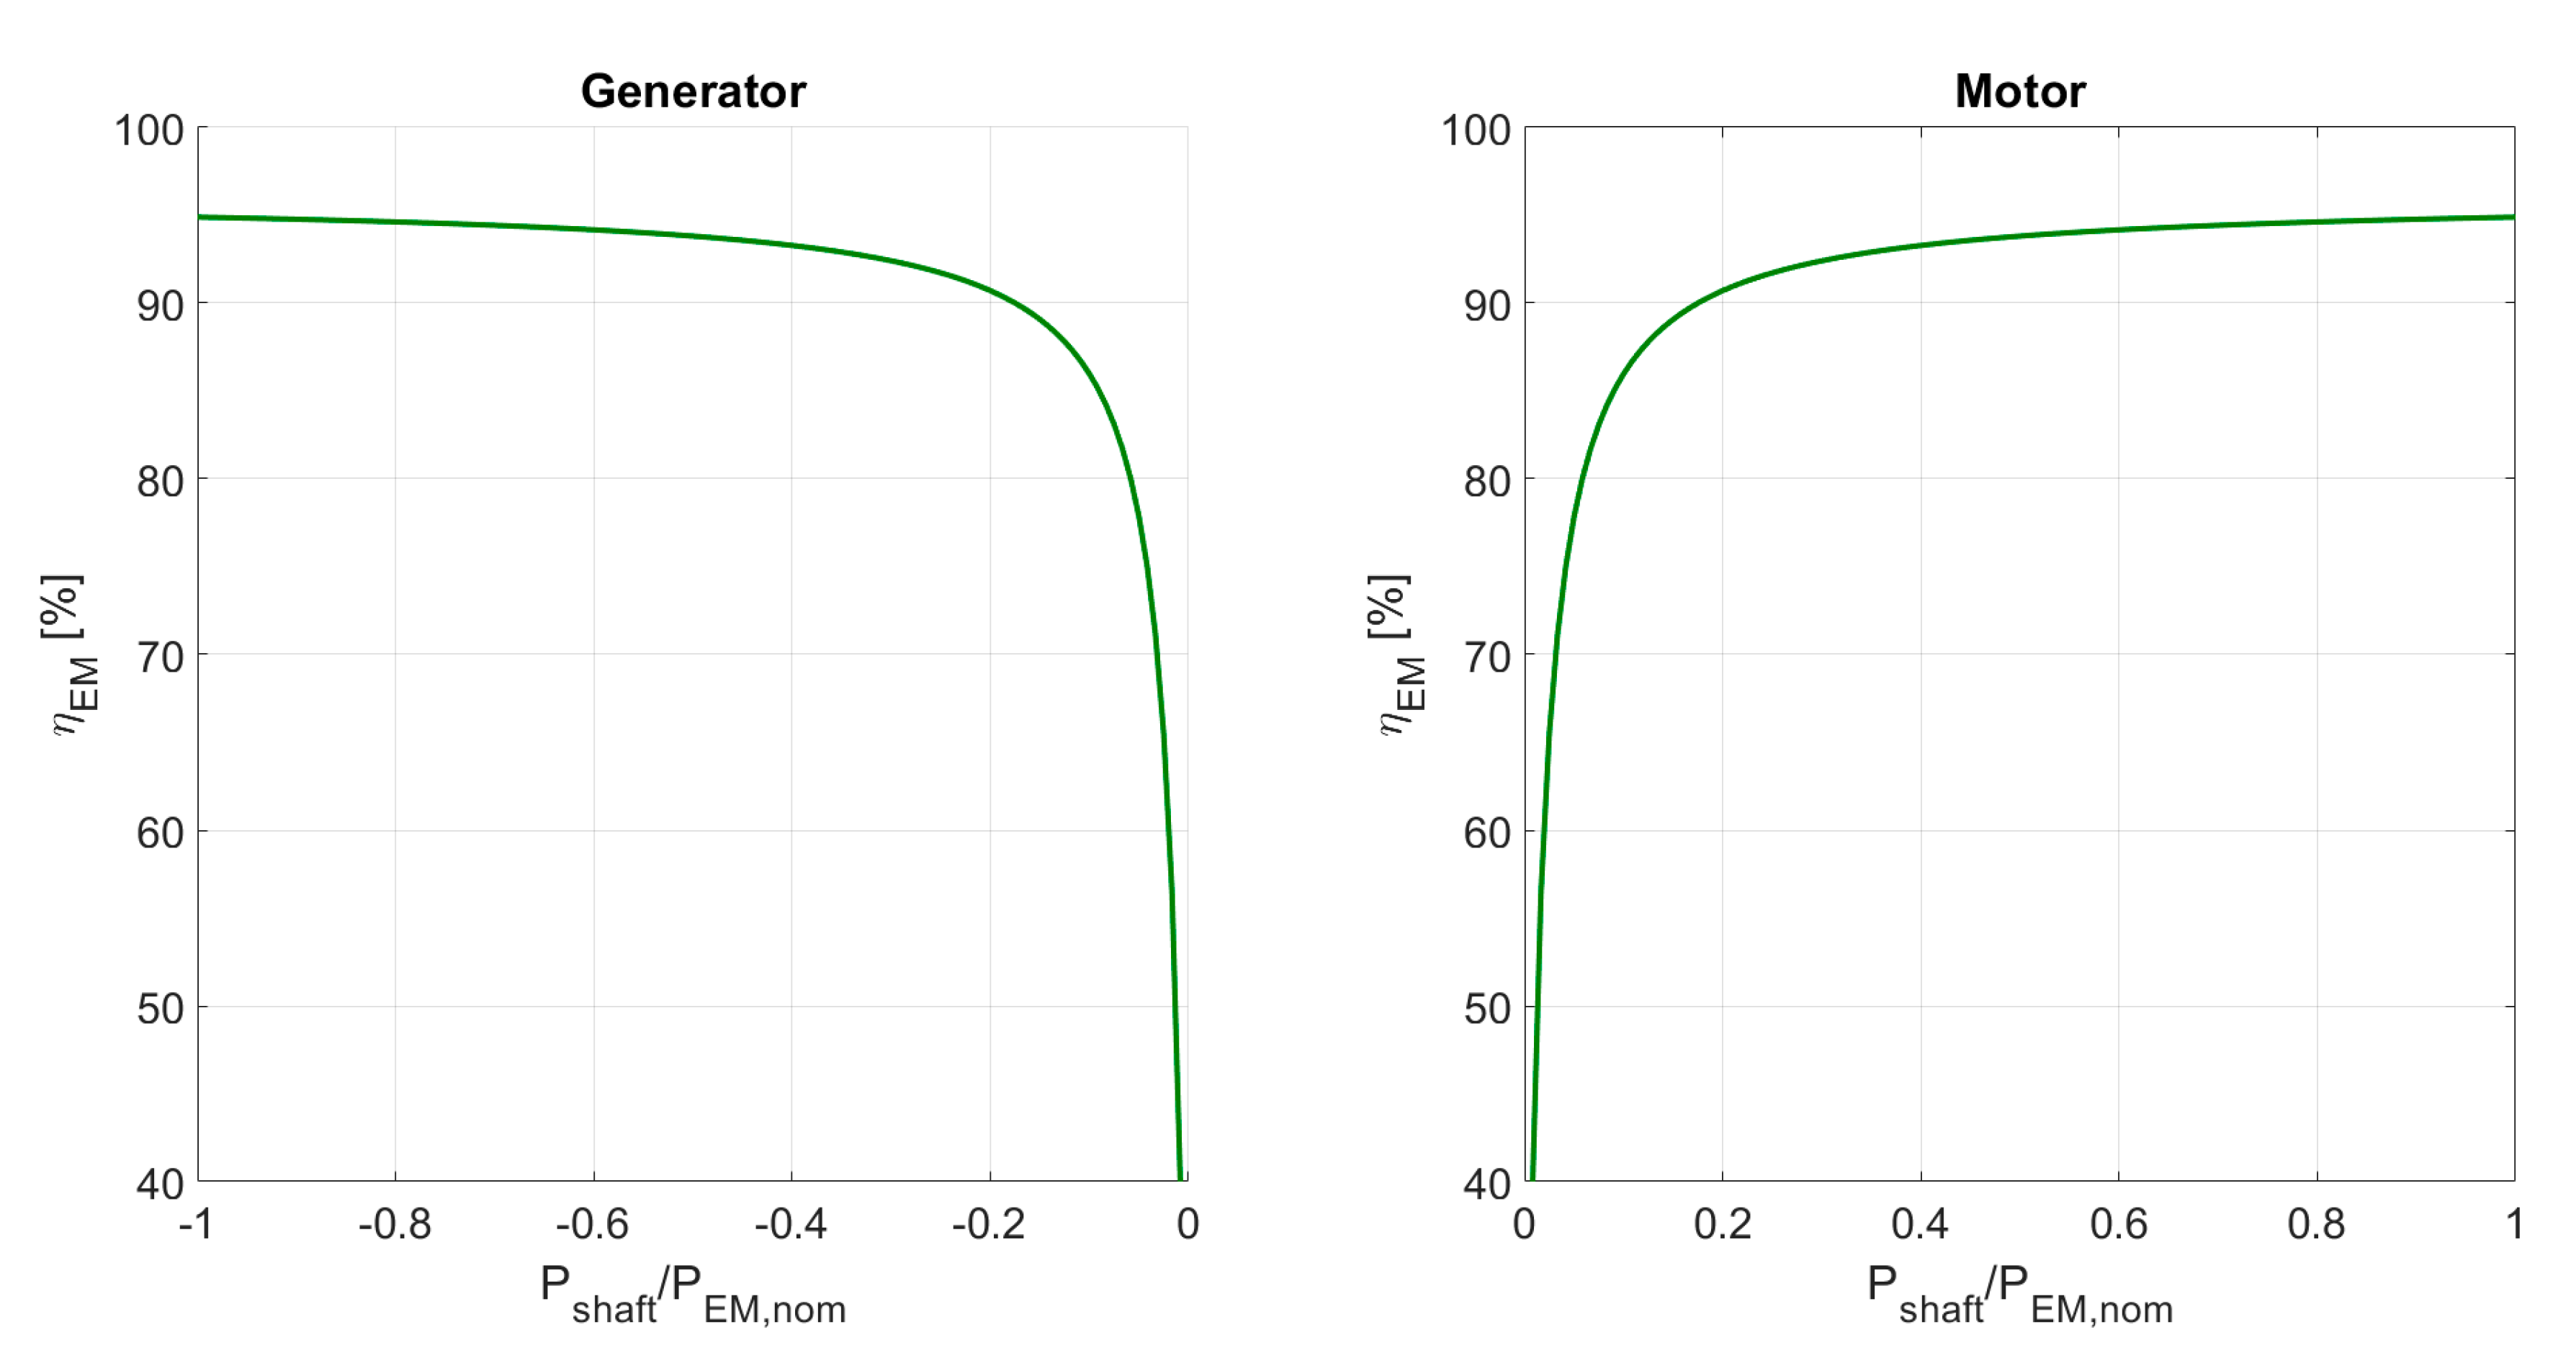
The electric machine is modeled with a simple Willans line as proposed by [
13].
where
and
are, respectively, the mechanical and electrical power of the machine,
is the intrinsic efficiency of the conversion process (electrical to mechanical energy and vice versa) while
takes into account the losses that take place after the energy conversion (friction, heat losses, etc.). In this investigation, we will assume
and
kW as suggested by Guzzella et al. [
13] for permanent magnet machines. This efficiency will be assumed to take into account also the losses in the inverter [
21]. The efficiency of the electric machine is defined as:
where
or
according to the electric machine mode (motor or generator, respectively).
The proposed model, generate for an electric machine with a nominal power of 120 kW, the efficiency curves shown in
Figure 9.
Please note that the electric power in Equations (18) and (19) is the battery power, which is assumed positive in discharge and negative in charging.
4.3. Back-up Electric Operation
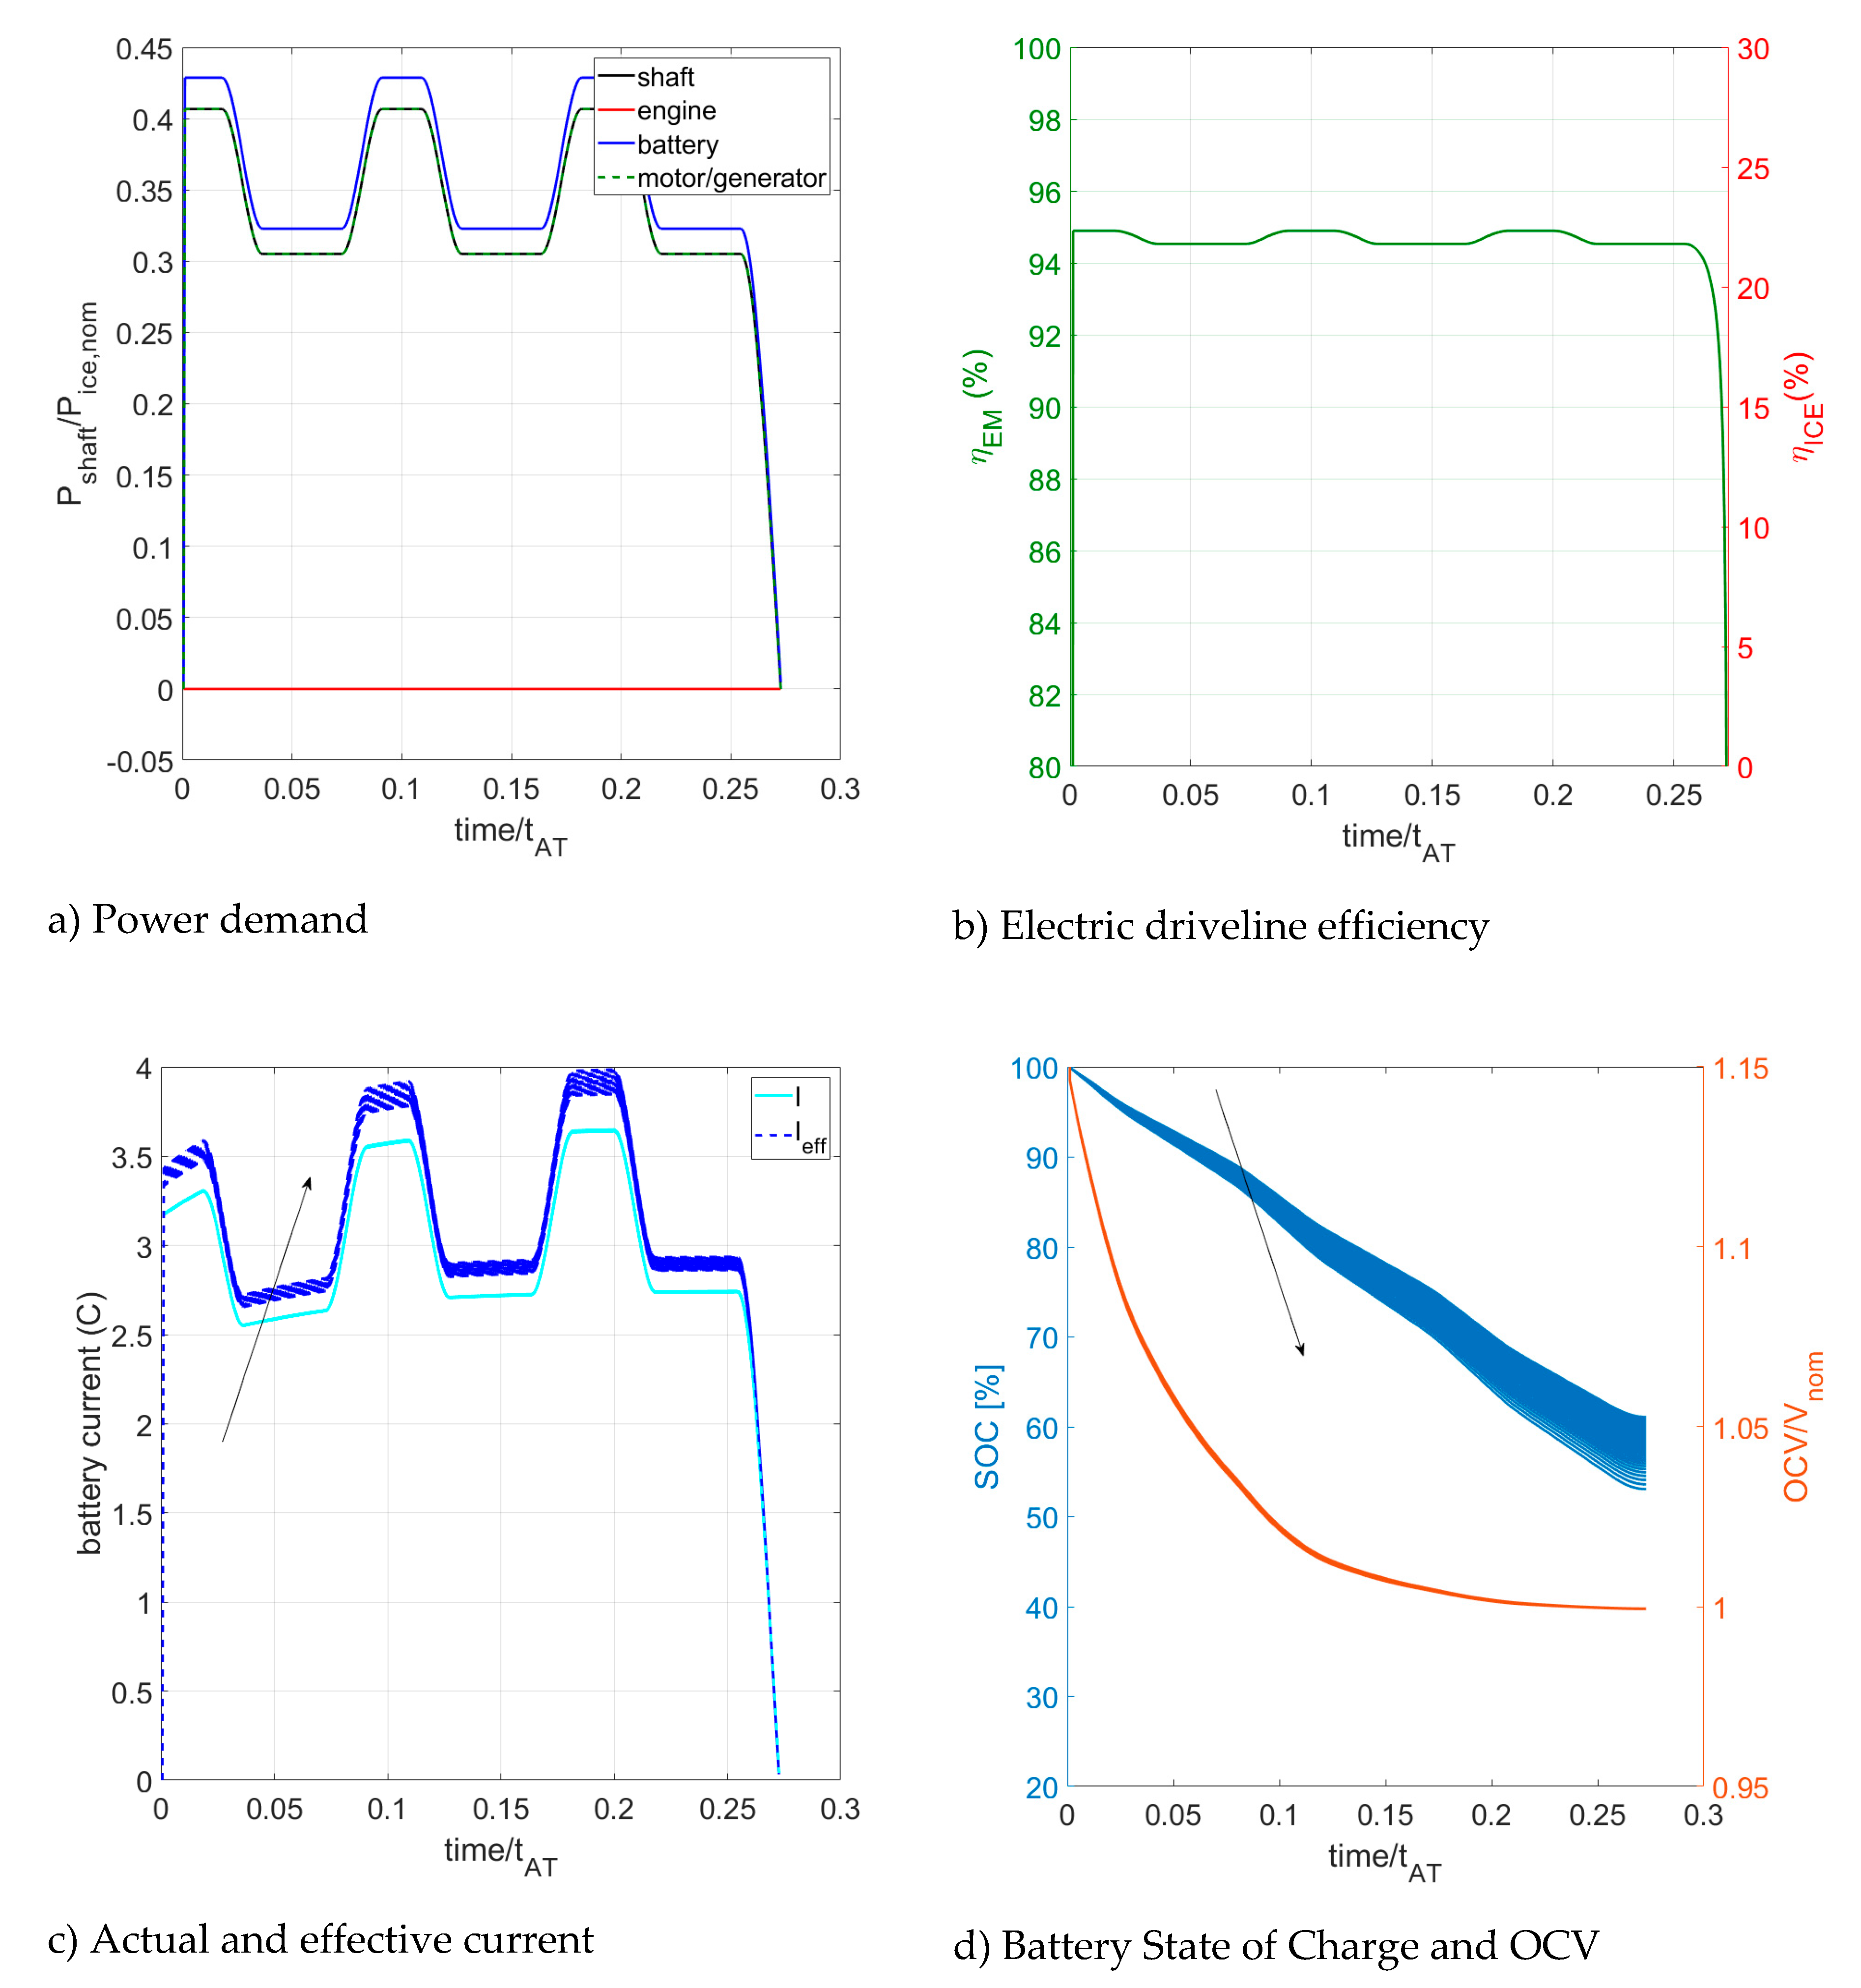
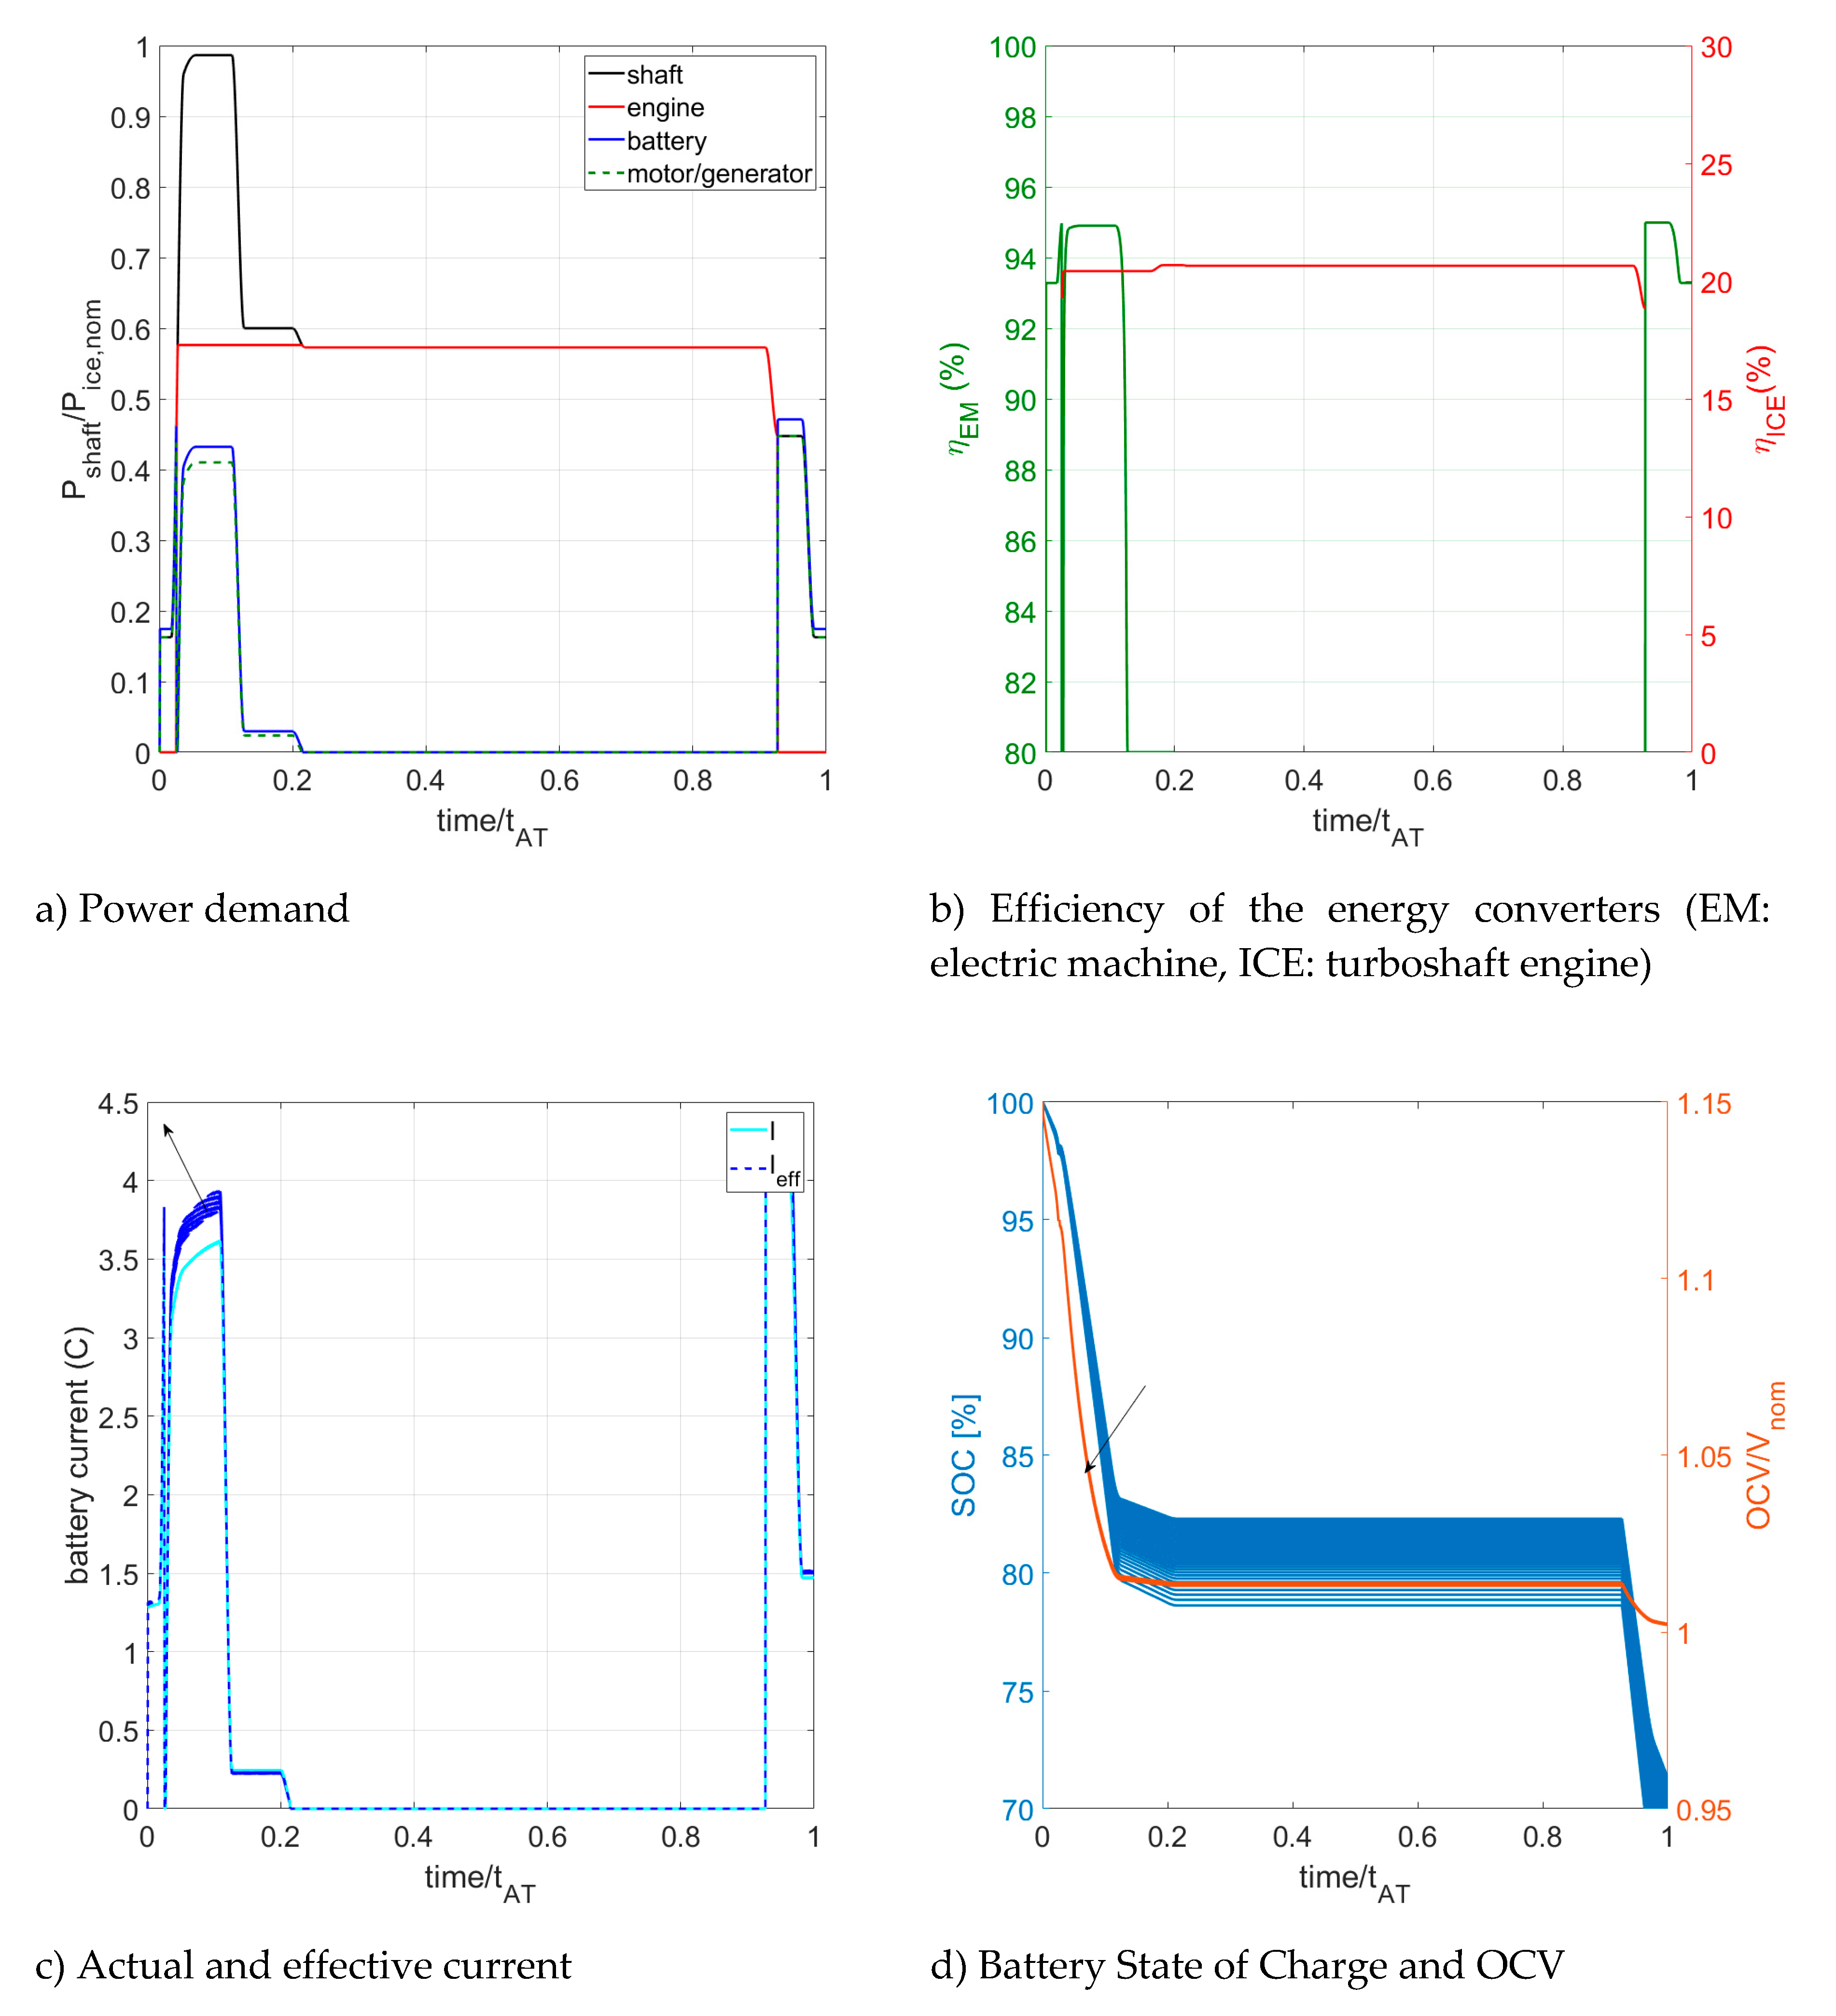
Figure 10 presents the results of the proposed model applied to the OEI mission that is performed without the usage of the engine (to simulate its failure) and with the battery initially fully charged (
). In particular, the plot of
Figure 10a shows how the total power demand of the shaft is satisfied by power system.
Figure 10b shows the efficiency of the two energy converters (in this case only the electric machine). The actual and effective currents of the battery are reported in
Figure 10c while
Figure 10d details the values of battery SOC and OCV.
The results of
Figure 10 are obtained by superimposing the outcomes of the model with the battery cycle number ranging from 1 (start of battery life) to 400 (close to the end of the battery life) so that the width of the lines is proportional to effect of aging on each variable. The arrows in
Figure 10c,d indicate the variation of each variable with increasing cycle number.
Please note that the battery current corresponding to a certain power demand is not the same along the mission but increases in time. This is because of the reduction of the OCV with decreasing SOC. Note also that as the battery SOC decreases, the OCV reduction is intensified with battery aging for the phenomena included in the model (in particular capacity fading and internal resistance increasing). The worsening of the Peukert effect is stressed by the variation of the effective current with battery cycle number (
Figure 10c) which in turn, discharge the battery faster.
According to the proposed model, if the back-up operation is performed with the battery at the beginning of its life, the final SOC is 61.1%. If the battery is close to its end of life, the final SOC is 53% (with the battery again initially fully charged at the beginning of the mission).
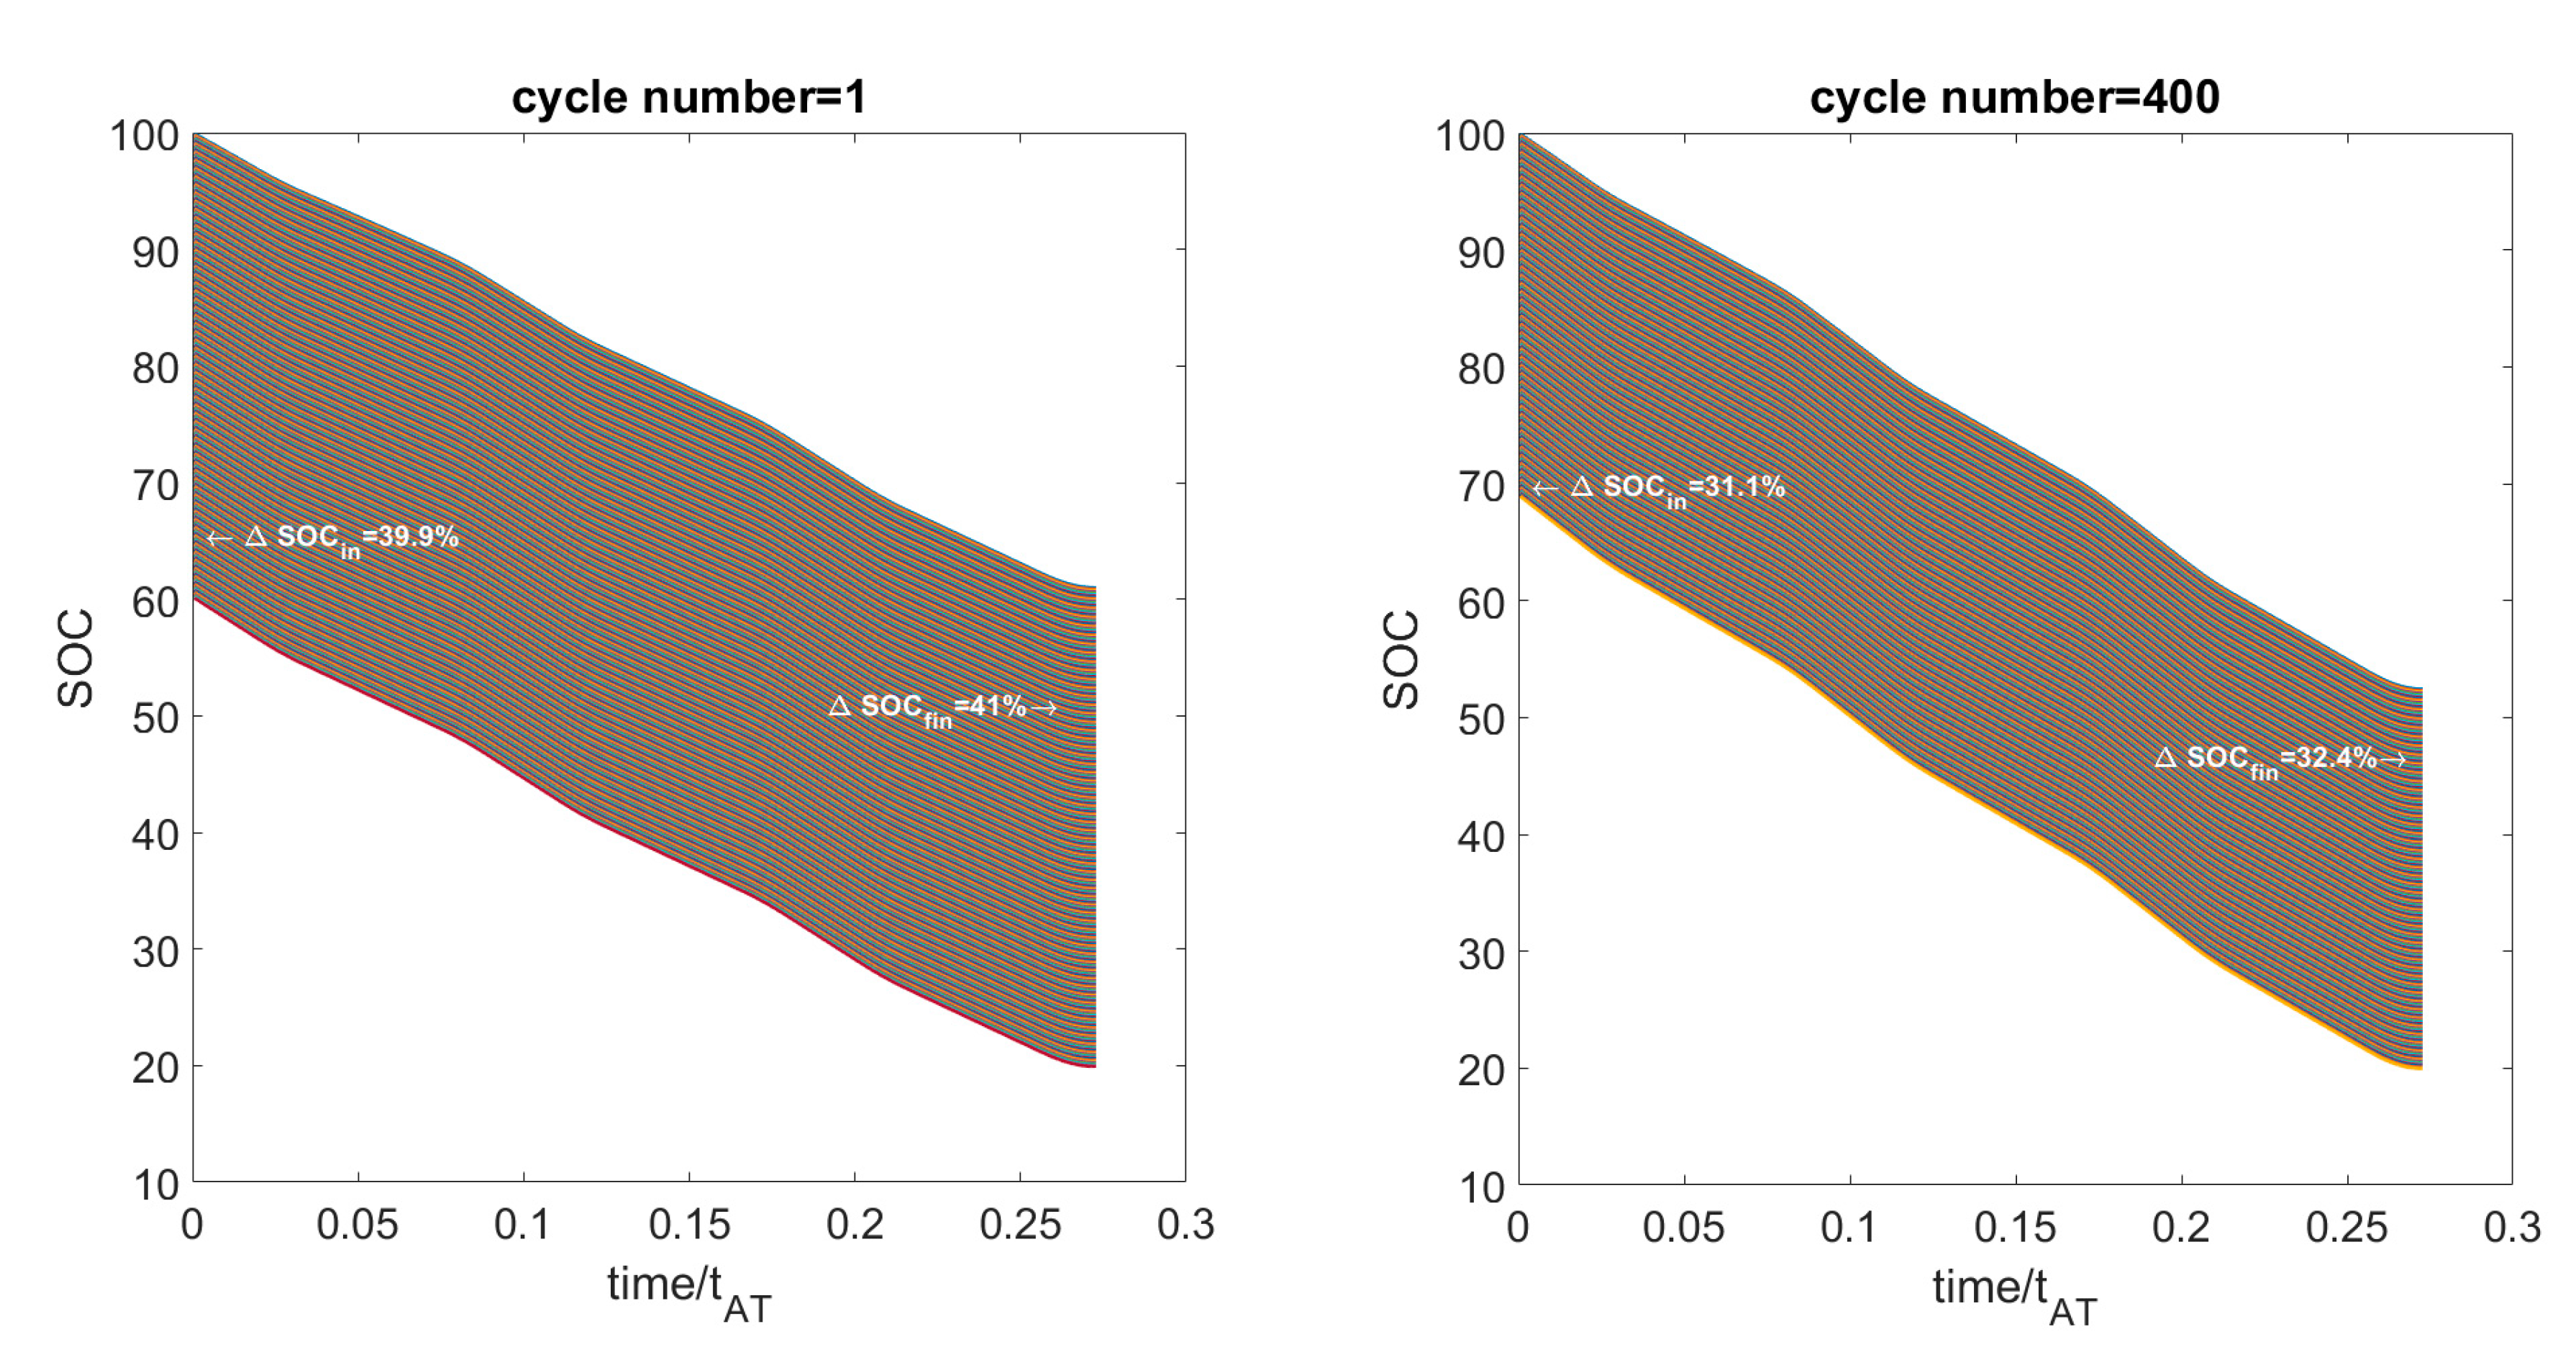
To find the minimum value of the SOC at the beginning of the OEI mission, the initial SOC decreased until the SOC at the end of the OEI mission reached the value at which a Li-ion battery is considered fully discharged i.e.,
. The calculation was repeated when the battery is closed to its end of life (cycle number = 400) and the results are reported in
Figure 11.
The results of
Figure 11 also put into evidence the non-linearity of the battery model. In fact, a reduction of 39.9%/31.1% in the initial SOC produces a decreasing of the final SOC by 41%/32.4% for the battery at the beginning/end of its life, respectively.
We can notice that when the battery is at the beginning of its life, in order to perform the OEI mission, the initial SOC can be as low as 60.1%. When the battery is close to its end of life, we cannot accept values of the initial SOC lower than 68.9%. Therefore, we will assume a threshold value of 70% for the battery SOC in all phases of the Airtaxi operation.
4.4. Airtaxi Operation
The power systems of
Figure 5 can work into four possible modes:
Mode 1: only the thermal engine is operated;
Mode 2: only the electric machine is operated (as a motor);
Mode 3: the battery helps the engine through the electric machine operated as a motor;
Mode 4: the thermal engine gives the power to the rotor shaft and simultaneously recharges the battery (the electric machine works as a generator).
After noting that the battery is not able to sustain the whole air-taxi mission in mode 2, we will compare different energy management strategies based on two threshold values for the required power , namely and .
Strategy #1 performs the whole mission in mode 1; therefore, the battery is not involved in the satisfaction of the power request.
The energy management strategy #2 uses the battery to help the engine when the total power request is very high (mode 3) and charges the battery when the power request is very low. This strategy is aimed at preserving the battery state of charge while trying to reduce the fuel consumption during takeoff, acceleration, and climb. For this reason, it will be named “battery sustaining”. This strategy can be defined as follows:
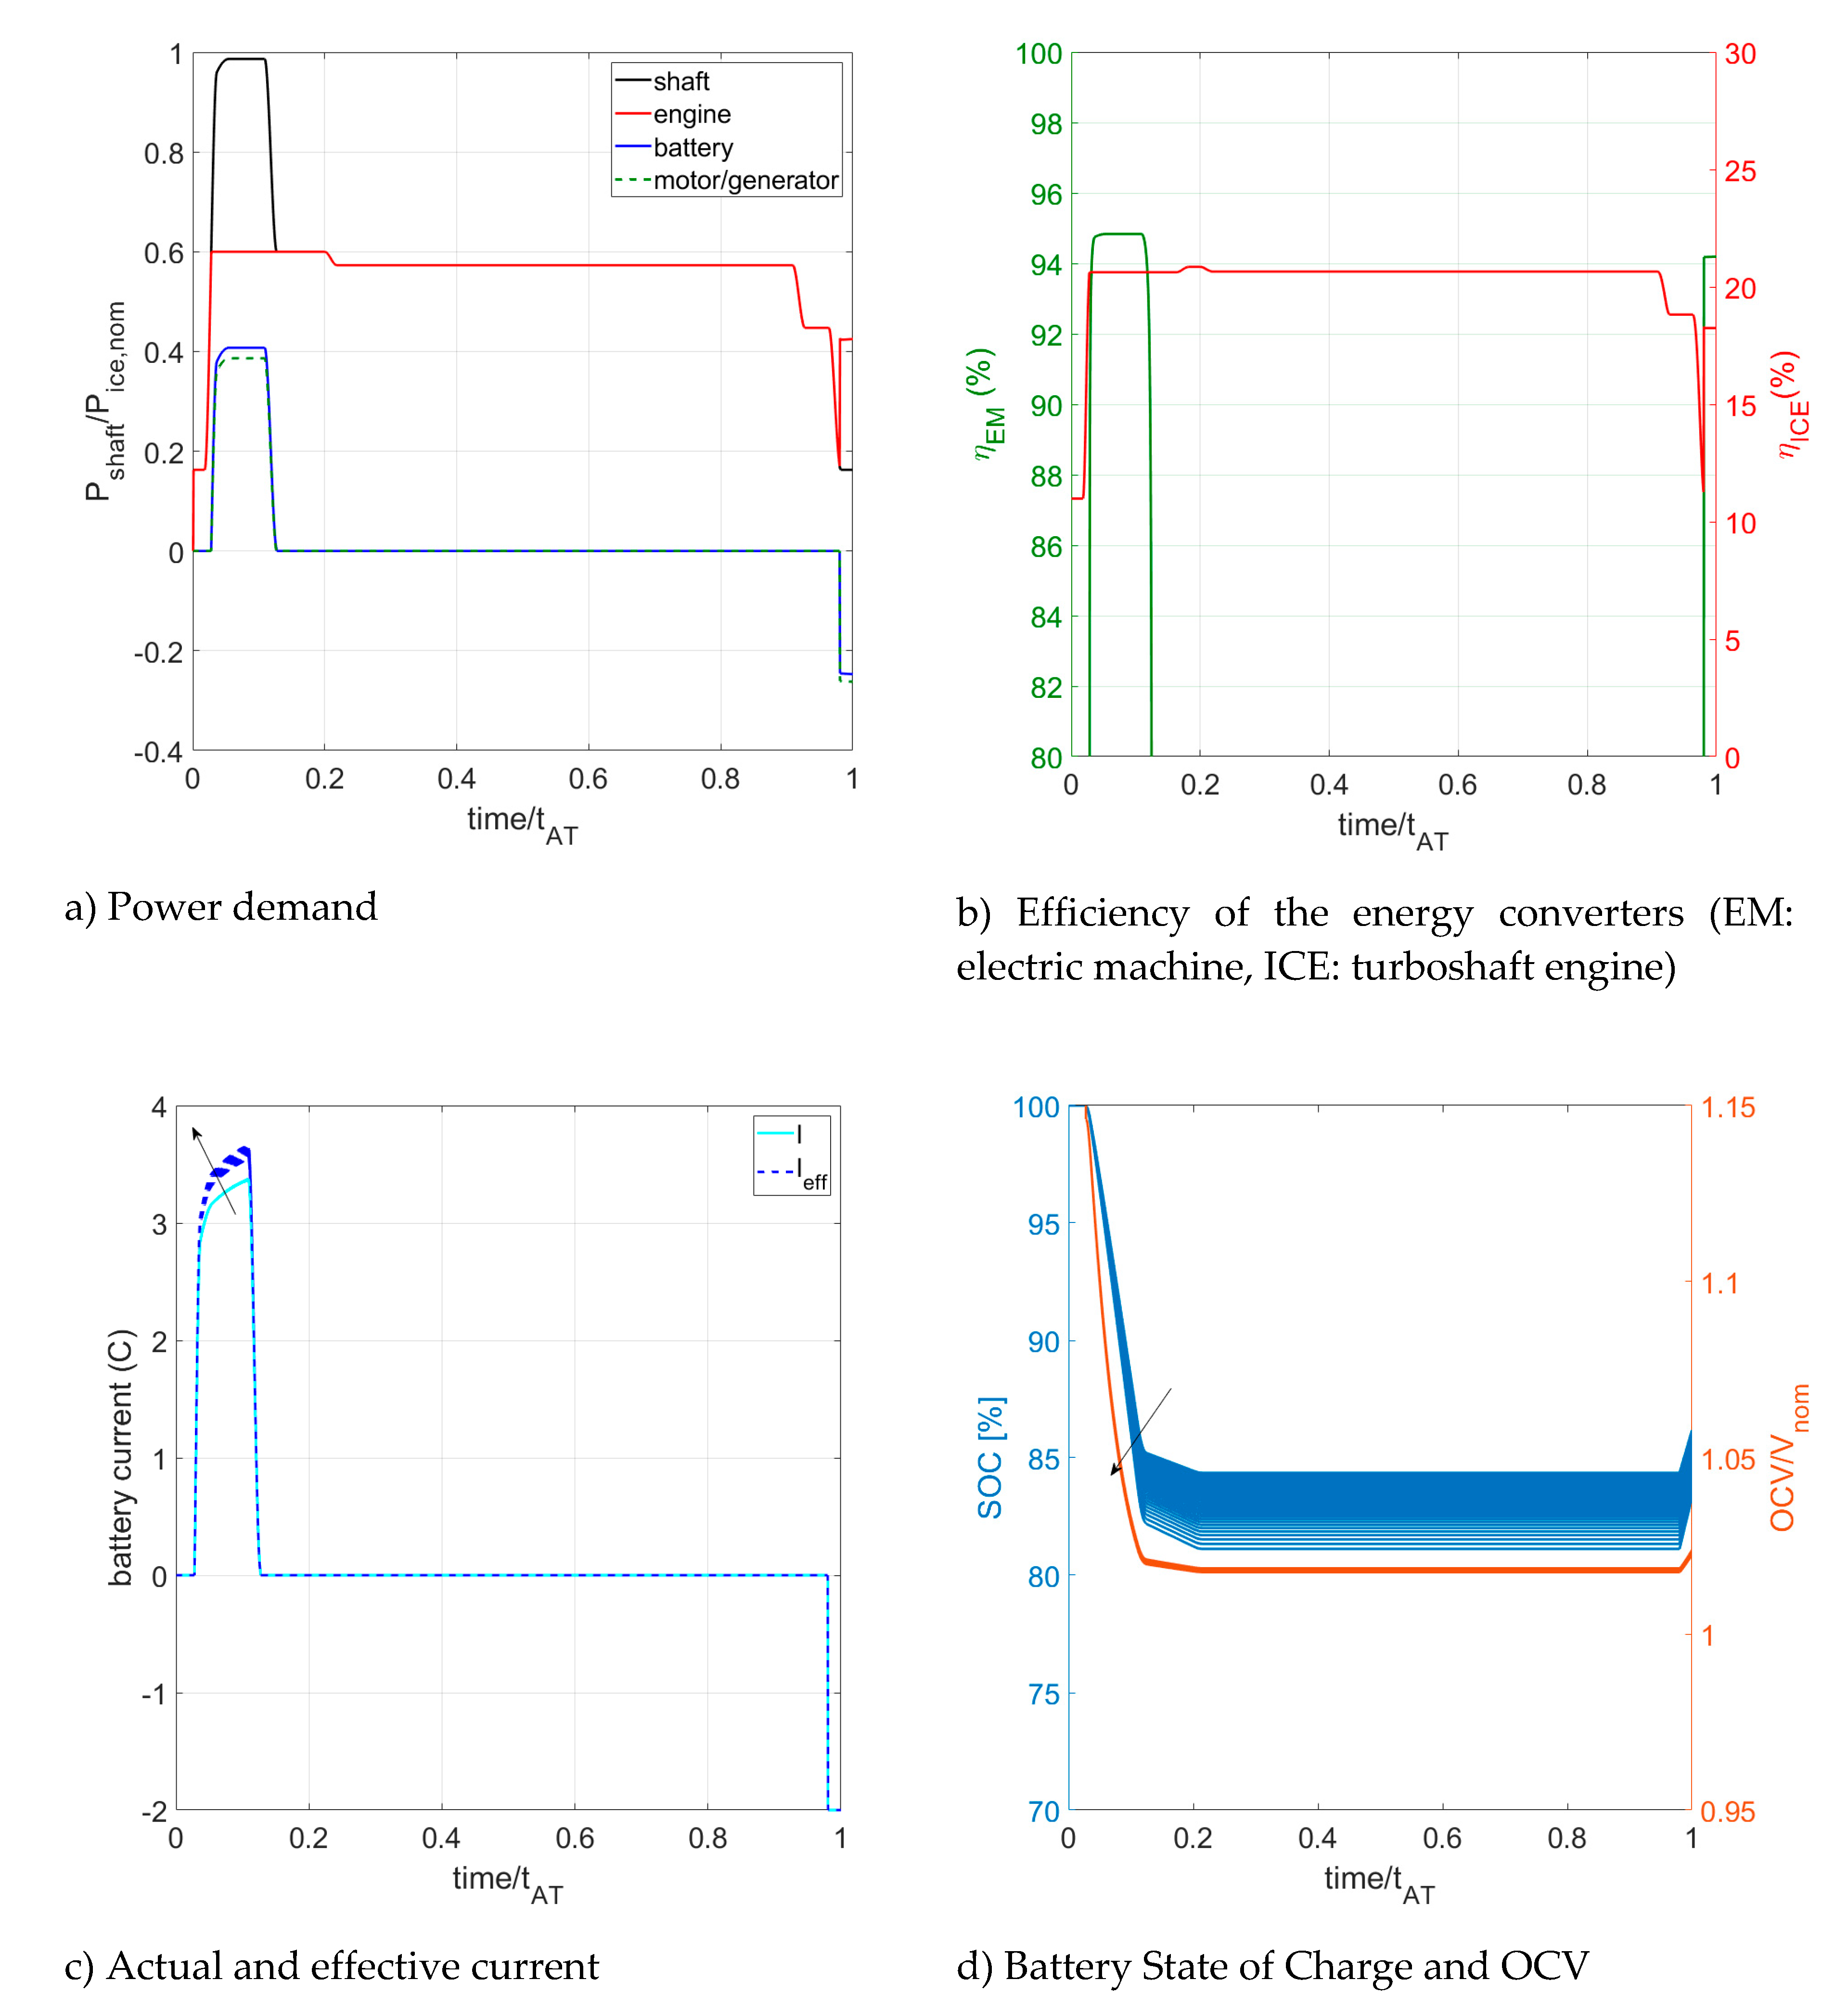
The results of the model on the AirTaxi mission with strategy #2 are shown in
Figure 12 with the same choice of variables and plotting policy of
Figure 10.
Please note that the usage of the battery, motor, and engine to fulfill the power request (
Figure 12a) and the efficiency of the two converters (
Figure 12b) are not affected by the battery aging. The battery is involved only in the first part of the mission (in discharge) and is recharged in the last part by using the excess power of the engine.
The energy management strategy #3 aims at using the battery as much as possible (battery depleting) and can be defined as follows:
The results of
Figure 13 shows the performance of the different components of the power systems with strategy #3.
In this case, the engine works in a very limited range of power and the battery is never recharged.
From the plots of
Figure 13d we can notice that this strategy can be used only when the battery is at the beginning of its life. In fact, with the final battery SOC decreases with battery aging and reaches values lower than 70% after a certain number of cycles.
5. Discussion
The changes in engine efficiency in
Figure 8a and
Figure 9a reflect the rate of variation of the engine power request. In the case of strategy #2 (
Figure 8), the engine is always “on” and its efficiency is low at the beginning of the mission because the power request is low. The sudden change in the efficiency is due to the schematization used for the power demand that presents fast steps of variation when the air vehicle passes from a phase of the mission to the following one. In the case of strategy #3, the engine is used only in the central part of the mission where its power demand is quite constant. Therefore, engine efficiency is not shown in
Figure 9b at the beginning and at the end of the mission and is quite constant in the middle.
Please note that these plots may appear unrealistic but are reasonable in the simulation approach used in this investigation. Actually, the analysis of the dynamic behavior of the powertrain and the implementation of the proposed strategies under real world flight conditions are not addressed here. These topics will be the goals of next activities of the research project.
The results shown in the previous section are also affected by the arbitrary choice of some parameters of the model and of the threshold values of power in the proposed energy management strategy. However, the goal of the investigation is to propose a methodology to take into account battery aging, not to model a specific system or develop an optimal energy management strategy.
Nevertheless, we can discuss some interesting issues using these results.
The fuel consumption of the engine and the final SOC of the battery with the three proposed strategies are summarized in
Table 6. Even if the electric drive was mainly introduced to allow back-up operation in case of engine failure, the results of
Table 6 show that using the battery can significantly improve the fuel economy in the AirTaxi operation. The improvement ranges from about 4% with strategy #2 to 11% when the battery is fully used in the mission. However, as already pointed out, this strategy is compatible with the possibility of back-up operation only if the battery is at the beginning of its life.
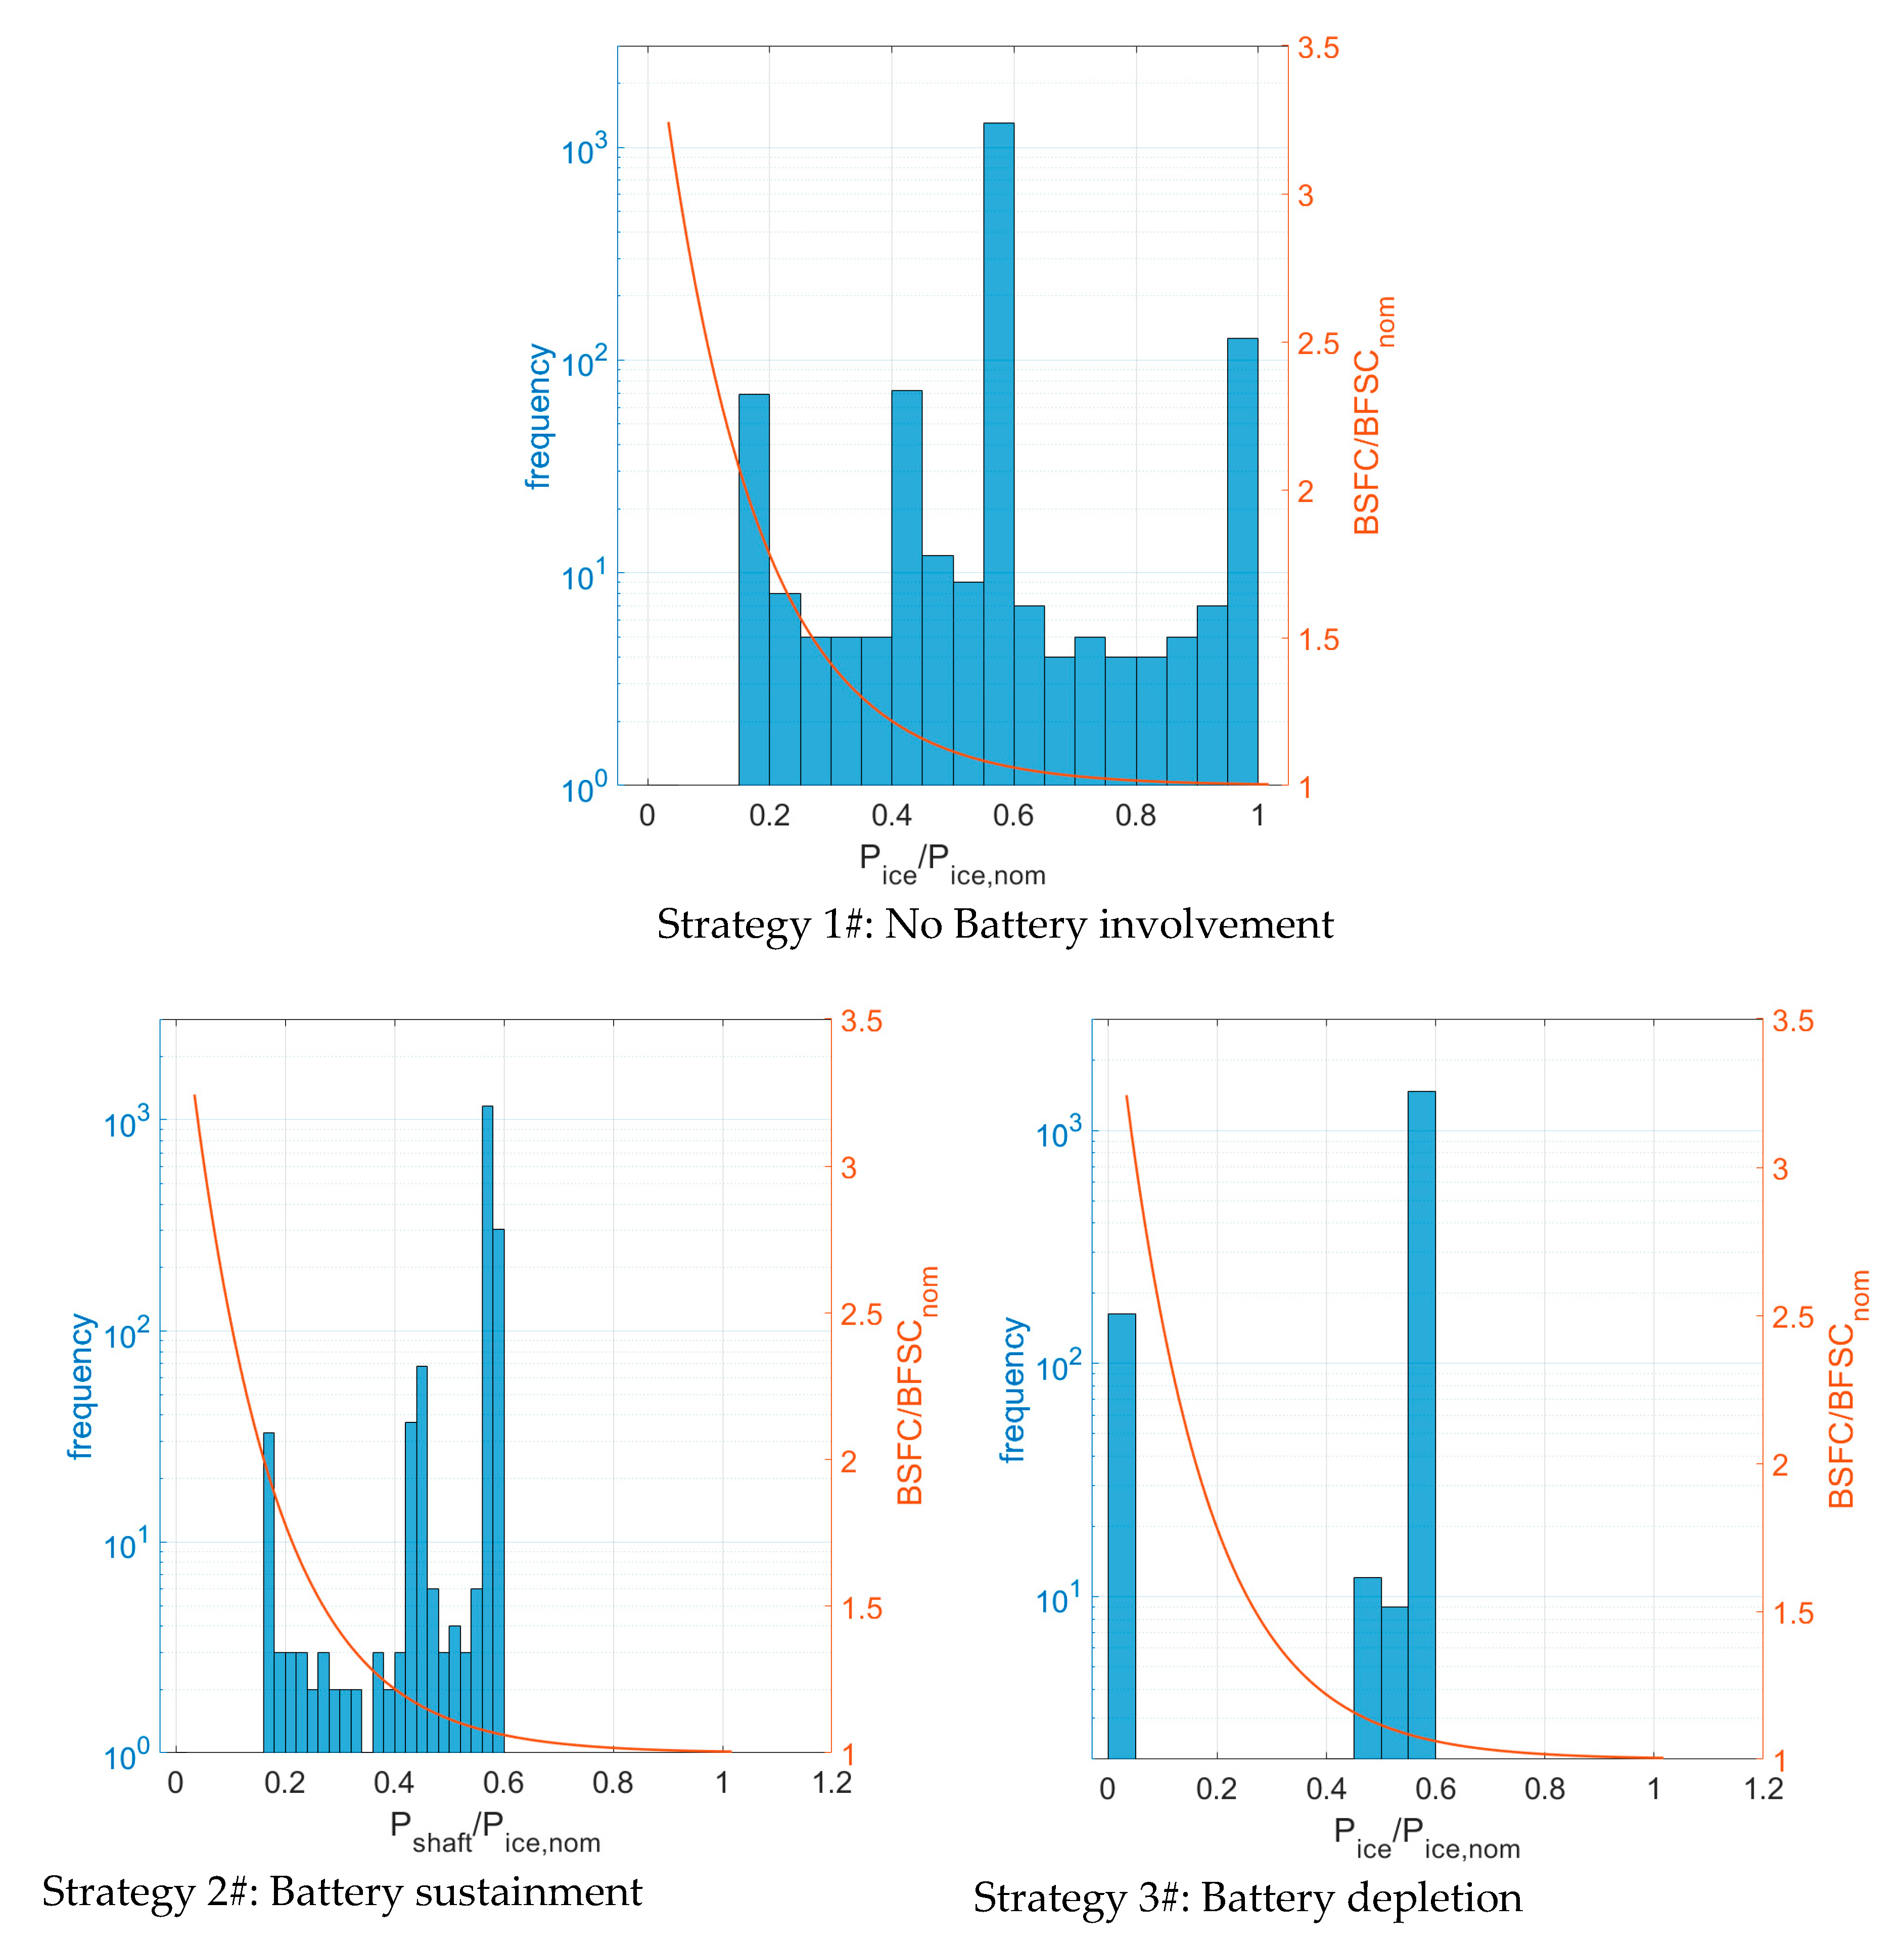
The improvement of fuel economy with strategy #2 and #3 is due not only to the fact that the battery helps the engine but also to the enhancement in the engine efficiency as shown in
Figure 14 where the frequency distribution of the engine power request is superimposed to the BSFC vs. engine power line.
In the case of strategy #1, i.e., when the battery is not used, the engine is required to work with a very variable load (ranging from the minimum to the maximum power request of the mission). This means that its BSFC ranges from the nominal value at the design point to about twice this value when the power request is very low (startup and shutdown).
With strategy #2, the engine is still always on but it is used up to . At the end of the mission where the power request is lower than , the engine works at a higher load because it also give the power needed to charge the battery.
In the case of strategy #3, the engine is used only in a limited range of power so that its BSFC never exceeds Moreover, it is turned off (or possibly idling according to the actual implementation of the strategy) for large part of the mission. Still better results could be obtained by choosing a downsized engine with a nominal power of about . However, this is beyond the scope of the present investigation.
This discussion puts into evidence how the energy management strategy plays an important role in the performance of hybrid power systems.
6. Conclusions
This investigation proposes a modeling approach to take into account the aging of the battery in the analysis of a hybrid electric rotorcraft for urban mobility in AirTaxi and back-up emergency operation. The proposed model for the battery is validated according to experimental data available in the literature. However, it contains a set of parameters that depend on the specific battery. Their value could be obtained by comparison with experimental data derived under controlled conditions during the design phase or by on-line parameter identification in real time applications.
To simulate the whole power system, reasonably accurate models were introduced for the engine and the electric machine in order to predict their off-design behavior. Three energy management strategies with a different involvement of the battery in the normal AirTaxi operation were proposed and compared. The first one does not use the battery at all. The improvement of the other two ranges from about 4% (when the battery is used only to help the engine at takeoff and acceleration) to 11% (when the battery is used also in the descent phase instead of the engine). However, the last strategy is not feasible when the battery comes close to its end of life, because it does not ensure the battery to be ready to perform the back-up operation.


