Article

Nytrox as “Drop-in” Replacement for Gaseous Oxygen in SmallSat Hybrid Propulsion Systems

by
Stephen A. Whitmore
Department of Mechanical and Aerospace Engineering, Utah State University, Logan, UT 84322, USA
Aerospace 2020, 7(4), 43; https://doi.org/10.3390/aerospace7040043
Submission received: 13 February 2020 / Revised: 18 March 2020 / Accepted: 19 March 2020 / Published: 12 April 2020

Abstract

:
A medical grade nitrous oxide (N2O) and gaseous oxygen (GOX) “Nytrox” blend is investigated as a volumetrically-efficient replacement for GOX in SmallSat-scale hybrid propulsion systems. Combined with 3-D printed acrylonitrile butadiene styrene (ABS), the propellants represent a significantly safer, but superior performing, alternative to environmentally-unsustainable spacecraft propellants like hydrazine. In a manner analogous to the creation of soda-water using dissolved carbon dioxide, Nytrox is created by bubbling GOX under pressure into N2O until the solution reaches saturation. Oxygen in the ullage dilutes N2O vapor and increases the required decomposition energy barrier by several orders of magnitude. Thus, risks associated with inadvertent thermal or catalytic N2O decomposition are virtually eliminated. Preliminary results of a test-and-evaluation campaign are reported. A small spacecraft thruster is first tested using gaseous oxygen and 3-D printed ABS as the baseline propellants. Tests were then repeated using Nytrox as a “drop-in” replacement for GOX. Parameters compared include ignition reliability, latency, initiation energy, thrust coefficient, characteristic velocity, specific impulse, combustion efficiency, and fuel regression rate. Tests demonstrate Nytrox as an effective replacement for GOX, exhibiting a slightly reduced specific impulse, but with significantly higher volumetric efficiency. Vacuum specific impulse exceeding 300 s is reported. Future research topics are recommended.

1. Introduction

Over the past decade the Utah State University Propulsion Research Laboratory (USU-PRL) has developed and refined a novel High-Performance “Green” Hybrid Propulsion (HPGHP) system as an environmentally sustainable replacement for hydrazine and other highly-toxic propellants. In its most mature form, the HPGHP system uses gaseous oxygen (GOX) as the oxidizer with 3-D printed acrylonitrile–butadiene–styrene (ABS) as the fuel. The GOX/ABS propellants are highly mass efficient system, with a prototype light-weight 25 N thrust chamber achieving a vacuum specific impulse (Isp) greater than 300 s [1]. Unfortunately, unless stored at very high pressures, GOX has a low specific gravity and is a volumetrically inefficient propellant. A higher density “green” alternative is highly desirable.
This paper will investigate the potential to use a blend of medical grade Nitrous Oxide (N2O) and gaseous oxygen (GOX), typically used for anesthesia applications, as a “drop-in” replacement for GOX in a legacy small spacecraft thruster system. Using Nytrox as the oxidizer in place of GOX allows a significant increase in overall volumetric efficiency, and with similar hazard levels. As will be described later in this paper, the “Nytrox” mixture is preferred to pure N2O which exhibits a significant potential decomposition hazard. Nytrox exhibits more than an order of magnitude increase in the activation energy for decomposition as compared to pure N2O, allowing a significant increase in storage and handling safety results. Results of a testing campaign to demonstrate the compatibility of Nytrox with the current HPGHP thruster technology will be presented.

2. Background on Green Propellant Options

Two studies performed by the European Space Agency Space Research and Technology Center (ESTEC) [2,3] have identified: (1) reduced production, operations, and transport costs resulting from propellant toxicity and explosion hazards and (2) reduced costs due to subsystems and overall systems interface complexity, as essential components for achieving low cost space access and operations. The ESTEC study showed also potential for significant cost savings by simplifying propellant ground handling procedures. Developing a “green” alternative for most commonly used toxic or potentially-hazardous propellants, especially hydrazine, was highly recommended.

2.1. Ionic Liquid Propellants

In response to ESTEC’s report and other “green” propellant [4] recommendations, the US Air Force (USAF) and the Swedish Space Corporation Ecological Advanced Propulsion Systems (ECAPS) center have developed less hazardous alternatives to hydrazine. The two most mature propellants are based on aqueous solutions of the ionic liquids (ILs) ammonium dinitramide (ADN) [5,6] and hydroxylamine nitrate (HAN) [7,8]. In August 2011, ECAPS published results from a year-long series of in-space tests of a 1-N thruster comparing their high performance green propellant, known by the brand name LMP-103S, to hydrazine on the Prisma spacecraft platform [9]. The report states that LMP-103S delivered equivalent–to-superior performance to hydrazine, with a vacuum specific impulse of 230 s. NASA selected the USAF-developed HAN-based propellant, known by the product name AF-M315E, for its “Green” Propellant Infusion Mission (GPIM) [10]. The GPIM thruster system was successfully deployed by a Space-X Falcon Heavy Booster on June 25, 2019 [11]. Results from the GPIM spaceflight test are reported by McLean et al. [12]. In spite of being called “green,” by their manufacturers, IL-based propellants are generally not environmentally-friendly. Both of the above-mentioned IL-propellants are toxic to organic tissue, for example AF-M315E contains Hydroxyethyl hydrazine (HEHN) as an ignition enhancer and burn stabilizer. In in high concentrations IL-based propellants are prone to energetic uncontrolled decomposition events. Thus, special handling precautions are required for processing and storage. The major advantage of both propellants is a low-vapor pressure at room temperature, allowing handling and servicing without the use of Self Contained Atmospheric Protective Ensemble (SCAPE) suits. Because of these properties, the USAF has recently begun to refer to such IL-formulations more properly as having “reduced toxicity” instead of being green.
In addition to potential toxicity and objective hazards, there exist several key developmental issues that make them IL-based propellants unsuitable for some small spacecraft applications. In order to reduce the decomposition hazard, both the LMP-103S and AFM-315E mono-propellants require a significant water content to keep the IL-salts in solution with up to 14% for LMP-103S [13], and 16% for AFM-315E [14]. The high water content makes IL-propellants notoriously hard to ignite. Also, undecomposed water vapor in the exhaust plume poses a significant contamination hazard, clouding or obscuring sensitive spacecraft optics or photo-voltaic cells [15].
Multiple catalyst systems have been developed to augment IL ignitability, but due to the high water content, room temperature ignition does not currently exist for either propellant. During ignition the catalyst beds must be preheated to greater than 340 °C (573 K) for LMP-103S [16] and 370 °C (643 K) for AFM-315E [17]. This preheat requirement places a large power burden on the spacecraft systems. Catalyst beds and associated heating systems add significantly to the inert mass of the spacecraft and the high-wattage preheat requirement presents a significant disadvantage for systems where power budgets are limited. For example, as stated by Pokrupa et al. [18], for the ECAPS 1-N LMP-103S thruster, “time required for 9.25 W of catbed preheating (to a minimum of 340 °C) has been shown in flight to be roughly 600–720 s.” Thus, at a minimum the startup-cycle for this system requires between 5.6 and 6.7 kJ of energy input. For the Prisma flight demonstration of Reference [9], the pre-heat time was set to 30 min, requiring 16.7 kJ of total energy input. The high pre-heat temperature also significantly limits the catbed system burn lifetime.
Finally, due to the very slow reaction kinetics demonstrated by Hori and Katsumi [19] for HAN, and Whitmore and Burnside [20] for ADN at the moderate pressures levels required for SmallSat Thruster systems (1000–2000 kPa), ignition latencies can be significant, up to several seconds, and may limit the usefulness of IL-propellants for spacecraft maneuvering and control systems. Even under steady-state operating conditions, when compared to conventional solid, hybrid, or bi-propellant options, the performances of ionic liquid propellants are generally quite low—with achieved vacuum Isp values at or less than 230 s. The combination of these detrimental characteristics compared to their “green” advantages have led some in the industry to question whether ionic liquids as propellants have been “oversold [21].” Clearly, significant technological issues exist and must be overcome before the ionic-liquid propellants are used routinely as a hydrazine replacement.

2.2. Hybrid Rockets as a Significantly Safer and More Efficient “Green” Propulsion Alternative

The inherent safety and environmental friendliness of hybrid rocket systems have been known for several decades [22]. Propulsion systems using hybrid propellants offer the potential to replace the current generation of toxic or hazardous propellants with an environmentally-sustainable “green” alternative. Hybrids require only a single flow path, which significantly reduces the overall complexity when compared to bi-propellant systems. In fact, hybrids present a similar complexity to monopropellant systems, but with significantly higher performance and efficiency levels. Properly-optimized hybrid propulsion systems can achieve Isp and characteristic velocity (c*) values comparable to non-cryogenic bi-propellant systems, and in a highly storable form factor. The primary drawback to the wide-ranging deployment of hybrid systems is a low Technology Readiness Level (TRL). As the TRL matures, small hybrid systems have potential to fill an unmet and growing need for advanced propulsion both in-space and during launch stages for the emerging SmallSat market. Although requiring a small increase in overall dry mass compared to conventional solid-propellant systems, capabilities for on-demand throttle, shut-down, and relight, offset this mass-disadvantage. Such a “smart-stage” can potentially provide ΔV for orbit access, on-orbit maneuvering, and station keeping. Such a system could also provide extensive capabilities for endo-atmospheric maneuvering for a variety of defense applications.

2.3. Hybrid Rocket Low-Power Arc-Ignition System

Hybrid rockets are “safe” due to the relative stability of both the oxidizer and fuel components. This stability comes at a price, as traditionally hybrid rocket systems require a significant energy input for reliable ignition. For the vast majority of hybrid rocket-systems developed to date, pyrotechnic or “squib” charges are used to ignite a secondary solid-propellant motor whose high-enthalpy output provides sufficient heat to overcome the activation energy of the propellants. While effective, this pyrotechnic approach allows only a single-shot ignition, with no inherent restart capability. Thus, until very recently, the lack of a reliable, low-energy multiple-use ignition method has discouraged the use of hybrid rockets for in-space propulsion. This technology gap has limited the full potential for hybrid systems as restartable upper stages or in-space maneuvering systems.
The above-described hybrid restart issue has been overcome by leveraging the unique electrical breakdown properties of certain 3-D printed thermoplastics like ABS or polyamide. The authors discovered that when printed using a technique known as fused deposition modeling (FDM) [23], ABS possesses unique electrical breakdown properties that can be exploited to allow for rapid on-demand ignition [24]. Under normal conditions, ABS possesses a very high electrical resistivity and is not generally considered as an electrical conductor. However, as FDM-processed ABS is subjected to a moderate electrostatic potential between electrodes embedded in the material, the layered FDM structure concentrates electrical charges at points along the surface. Figure 1 shows a typical pyrolysis event, where the ablated hydrocarbon vapor results from the inductive arc carving a path across the fuel surface [25]. Because Joule heating pyrolizes a small mass of fuel material, when an oxidizing flow is introduced at oxygen partial pressures above two atmospheres (Reference [24]), combustion is initiated with the pyrolized vapor.
Shortly after this discovery, the authors of this paper made several attempts to reproduce a similar phenomenon with other 3-D printed and extruded fuel materials [26]. Only a few printed material exhibited the required arcing-properties, with ABS being the best. None of the extruded materials exhibited the required arcing properties. It appears that 3-D printing is an essential feature for low-energy arc-ignition. As developed over the past five years, the HPGHP arc-ignition system is extremely power-efficient and can be started, stopped, and restarted with a high degree of reliability [27]. Once started, the system can be sequentially fired with no additional energy inputs required.
Multiple prototype ground-test units with thrust levels varying from 4.5 to 900 N have been developed and tested [28,29]. On 25 March, 2018 a flight experiment containing a 10-N prototype of this thruster system was launched aboard a two-stage Terrier-Improved Malemute sounding rocket from Wallops Flight Facility. The launch achieved apogee of 172 km, allowing more than 6 min in hard-vacuum environment above the Von-Karman line. The thruster was successfully fired five times in a hard vacuum environment. Whitmore and Bulcher (2018) [30] report the details of this flight test experiment.

2.4. Considering the Best Options for “Green” Oxidizers for Hybrid Space Propulsion

Karabeyoglu (2014) [31] recently performed a comprehensive analytical study on oxidizer options for in-space hybrid propulsion systems. Key performance parameters or other beneficial characteristics identified by this study include non-toxicity, high characteristic velocity (c*) and impulse density (ρIsp), space storability, and safe performance under cold-soak conditions. This study identified only four options that can be reasonably considerable as “green,” and still offer a vacuum specific impulse competitive with existing liquid bi-propellant and IL-monopropellants. These are: (1) Liquid Oxygen (LOX), (2) Gaseous Oxygen (GOX), (3) Hydrogen Peroxide (H2O2), and (4) Nitrous Oxide. (N2O). Unfortunately, the oxidizer that offered the best ρIsp performance, LOX, is not space-storable and must be eliminated from consideration for the proposed application.
Recent work by Whitmore et al. [32,33] and other organizations [34,35] have adapted hybrid rockets for use with medium-to-high grade (90%) H2O2. Hydrogen peroxide is a very efficient and dense propellant, and is an extremely strong oxidizer. Unfortunately, unless used in very high concentrations (>98%), hydrogen peroxide is difficult to ignite in a hybrid rocket, and is marginally functional with the previously-described arc-ignition system. Most applications using hydrogen peroxide rely on catalytic ignition, which remains a significant development issue. None of the existing hybrid systems using peroxide are able to achieve a reliable cold-start. Significant ignition time latencies are also experienced.
Experience based on the results of References [32,33] have lead the authors to conclude that 90% peroxide is an unsuitable oxidizer for in-space applications, where cold-soak commonly occurs. It is likely that significantly higher oxidizer solutions with concentrations at 98% or greater could have avoided these pooling issues, however, at these concentrations peroxide becomes a class 4 oxidizer, and is no longer really a “green” propellant. As 98% peroxide is extremely hazardous to work with, it presents objective hazards that are on-par with hydrazine. It appears, that hybrid rockets using lower concentration (90% or lower) peroxide, are more suitable for launch vehicle stages where significant external power can be used to pre-heat all of the flow path components, and ignition latencies can be absorbed into the mission timeline.
Having eliminated LOX and H2O2 from consideration, only GOX and N2O remain as in-space hybrid oxidizers compatible with the HPGHP arc-ignition system. Gaseous oxygen is an excellent oxidizer that can be efficiently managed at pressures well below 14,000 kPa (140 atmospheres) [36]. Unfortunately, GOX, even when stored at high pressures, has a low specific gravity and is a volumetrically inefficient propellant. For space missions requiring even moderate ΔV levels, GOX is an impractical propellant. Thus, by process of elimination N2O remains as the primary oxidizer option for this project. Nitrous oxide is by far the most commonly used oxidizer hybrid rocket “hobbyists”. Nitrous oxide is an inexpensive, readily available and has the clear advantage of being non-toxic to human tissue.

2.5. Hazards Associated with Using Nitrous Oxide as a Hybrid Rocket Propellant

Nitrous Oxide exists as a saturated liquid below its critical temperature of 36.4 °C, and propulsion applications typically must deal with N2O in both liquid and vapor form. Studies performed by Rhodes at the Air Force Weapons Lab (AFWL) [37] show that it is nearly impossible to detonate liquid phase N2O in pure form. In fact, liquid-phase N2O is classified as non-explosive and non-flammable by the US Occupational Safety and Health Administration (OHSA) [38,39]. However, in vapor phase N2O can experience rapid thermal decomposition (Reference [37]), especially in the presence of contamination. The N2O decomposition reaction, as given by Equation (1), is strongly exothermic and releases heat up to 1864 kJ/kg for full decomposition. Decomposition also rapidly produces large volumes of nitrogen and oxygen gas. Output gas temperatures can exceed 1900 K (1627 °C). The combination of heat and high-temperature gas-volumes make the decomposition event potentially explosive.
N 2 O N 2 ( g ) + 1 2 O 2 ( g ) + H e a t
Generally, N2O has a large activation energy, Ea, for thermal decomposition, 5682 kJ/kg, and N2O vapor must be heated to temperatures near 1000 °C in order to induce thermal decomposition [40]. However, when N2O vapor is contaminated by a small amount of hydrocarbon material, the relative stability is lowered and Ea drops significantly. Figure 2 illustrates the concept where “hydrocarbon-seeding” lowers the activation energy to a point where decomposition reactions can occur at near room-temperatures [41]. In effect, the addition of hydrocarbon material to nitrous oxide catalyzes the decomposition event. Because N2O is a highly polar molecule and an exceptionally good solvent, it readily picks up and dissolves hydrocarbons or other contaminating materials that may be exposed to the flow path. Since only a small amount of contamination is needed to catalyze decomposition, this physical property further exacerbates the potential safety hazards associated with N2O propulsion applications.
For flight applications, close-coupling of the oxidizer tank with the motor case creates a significant chance of introducing contamination into the thrust chamber. As the motor burns and nitrous oxide is depleted, adiabatic cooling forces a significant drop in the tank vapor pressure. This internal pressure drop provides the opportunity for backflow across the injector, allowing hot hydrocarbon gasses to enter the oxidizer feed lines and possibly the lower portion of the tank itself. The result is a significant potential for a run-away decomposition reaction. A notable number of accidents resulting from runaway N2O decomposition events have occurred. Karabeyoglu et al. (2008) [41] presented a summary of nine verified accidents related to inadvertent, uncontrolled nitrous oxide decomposition events.

2.6. Mitigation of the N2O Decomposition Hazard

Fortunately, it appears following procedures developed by the medical and dental anesthesia community offers a strong mitigation to this decomposition hazard [42]. In a manner directly analogous to creation of soda-water using dissolved carbon dioxide, an N2O/O2 hybrid solution, referred to as Nytrox for the remainder of this paper, is created by bubbling gaseous O2 under pressure into liquid N2O until the solution reaches saturation. The oxygen in solution displaces much of the nitrous oxide vapor in the tank ullage, significantly reducing the potential for a decomposition reaction, and allows “laughing gas” to be safely worked with in a clinical environment.
Figure 3 plots the vapor/liquid isotherm diagram for a saturated “Nytrox” solution. Figure 3a plots the vapor and Figure 3b plots the liquid phase mass concentrations of oxygen in solution as a function pressure and for isotherm curves for temperatures varying from −30 °C to 30 °C. The 0 °C isotherm is highlighted as the solid blue line for both the liquid and vapor segments of the chart. The calculations of Figure 3 were performed using the Peng–Robinson [43] two-phase state-equation for binary solutions. The mixing rule used to combine the O2 and N2O binary components is based on the model of Zudkevitch and Joffe [44]. At phase equilibrium, the fugacity (for the purposes of this model the fugacity may be defined as the pressure of an ideal gas which has the same Gibbs free energy as the real gas at the same temperature. Fugacity—the “tendency to escape” from solution—is the measure of a mixture component’s values for the liquid and vapor phases of each fluid component are equal. The implemented numerical algorithm that performs these calculations follows the procedure laid out by Karabeyoglu, Reference [31]. Reading the diagrams of Figure 3, at 0 °C and approximately 86 atmospheres (8745 kPa), there exists a “sweet spot” where the concentration of oxygen in the vapor-phase is a maximum (note that the pressure required to hold the O2 in solution is significantly higher than the natural vapor pressure of N2O, approximately 30 atmospheres at 0 °C) [45]. This optimal point, noted by the circular symbol on the graphs, shows that the vapor phase contains approximately 37% O2 mass fraction, while the O2 mass fraction in the liquid phase lies at just below 13%. This near-optimal point allows for the maximum proportion of vapor dilution while maintaining the highest possible density for the liquid phase.
Because O2 in solution dilutes the N2O vapor in the tank ullage, the required ignition energy Ei, defined as the minimum energy required to initiate a deflagration wave, is significantly increased. Assuming a spherical flame kernel, when the input energy is smaller than Ei, the resulting flame front decays rapidly because the released heat diffuses away from the surface faster that can be replaced by the decomposing material in the kernel volume. Dilution of the N2O vapor with O2 effectively increases the kernel volume, reducing the energy density. The diluent gas also acts to absorb heat, further quenching the reaction.
Figure 4 illustrates the effect of the O2 dilution in the Nytrox vapor phase upon Ei. The data of Figure 4 are extrapolated from data presented by References [31] and [47]. For this calculation, Reference [31] assumes a spherical ignition kernel. Figure 4a plots the minimum ignition energy as a function of ullage O2 mass fraction for pressure levels varying from 40 to 100 atmospheres. Figure 4b plots the ratio of the ignition energy at a given O2 mass concentration to the value for pure N2O vapor at the same pressure level. This ratio is referred to as the ignition energy amplification factor, Eif. Also plotted as solid symbols are the Ei values for Nytrox solutions at the O2 vapor mass fractions calculated (from Figure 3) at the given pressure levels and 0 °C storage temperature. Depending upon the shape of the flame kernel, the absolute energies of Figure 4a may vary, but the ratio plotted by Figure 4b will remain generally constant.
Note that near the previously-described “sweet spot” pressure level at 86 atm, the ignition energy has increased from less than 1 joule for pure N2O, to a value greater than 2200 Joules for the Nytrox solution. This increase amounts to an amplification factor Eif of greater than 10,000 or four orders of magnitude! This buffering effect significantly increases the handling safety for Nytrox, and it may be reasonably concluded that ignition cannot be achieved by any conceivable inadvertent ignition source. Only direct and purposeful action, such as the arc-ignition system or a pyrotechnic device can achieve the required ignition energy.

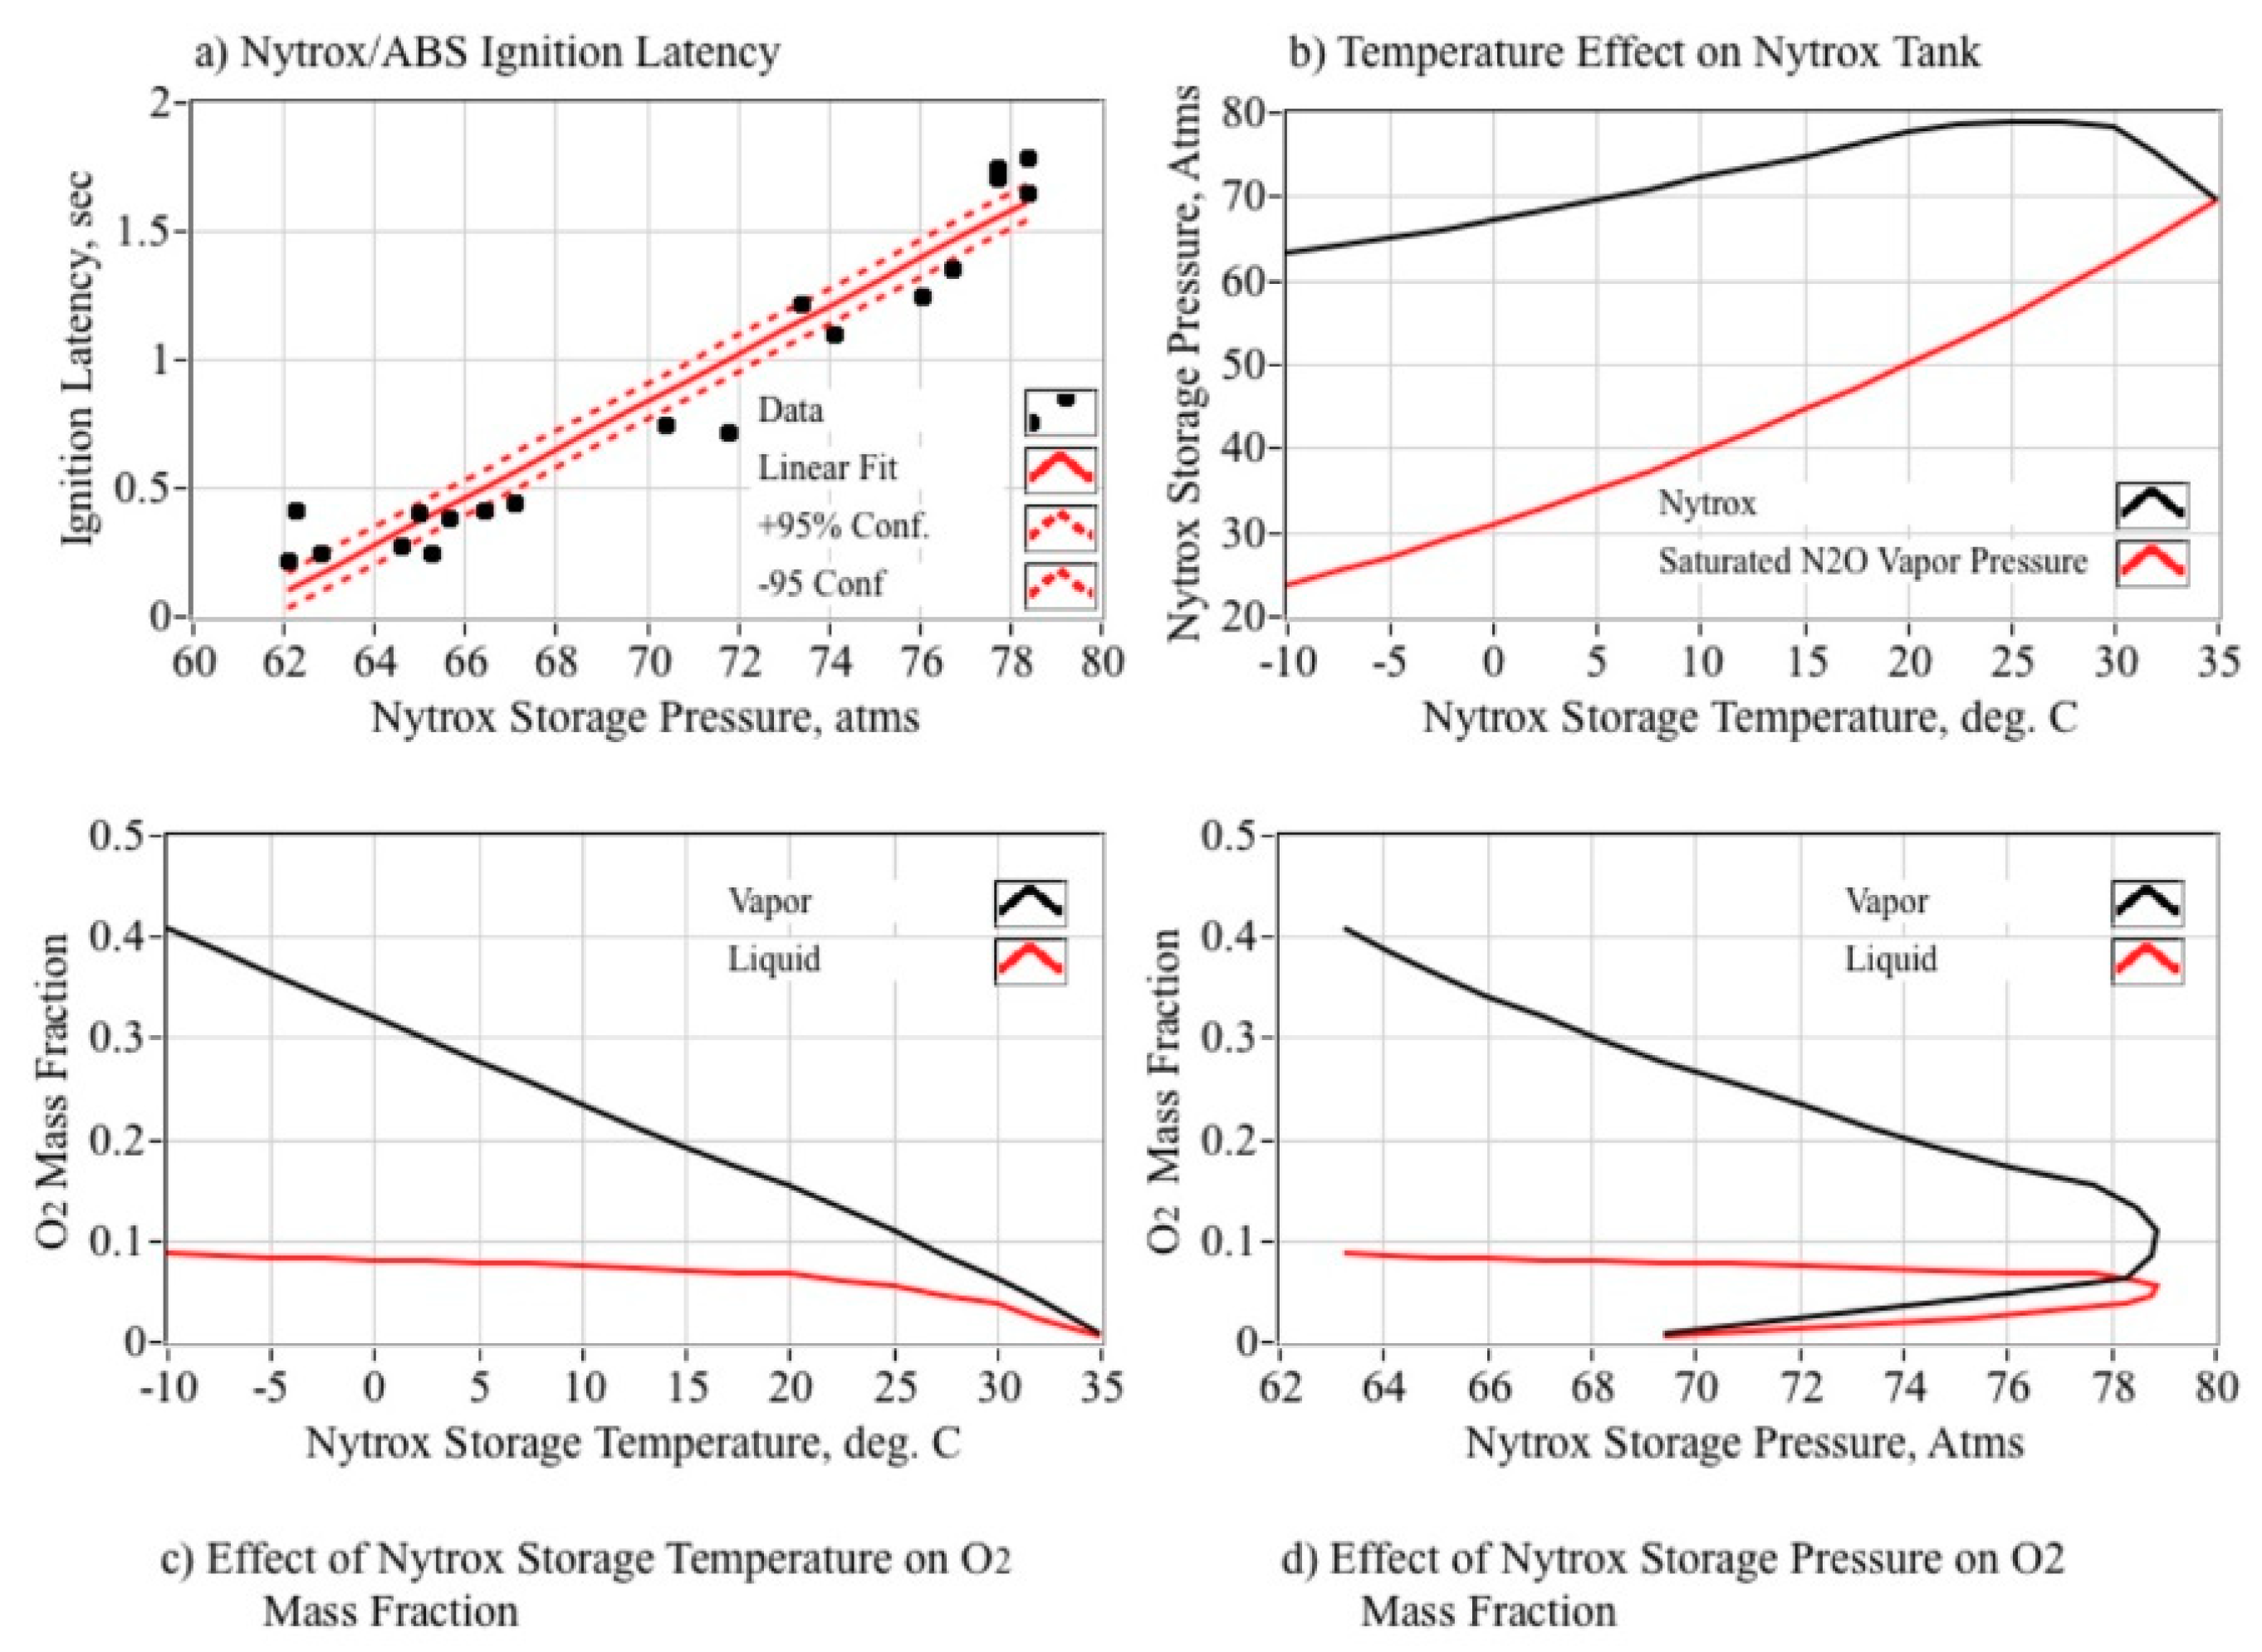
2.7. Effect of O2 in Solution Upon the Nytrox Mixture Density

Figure 5 plots the densities of the Nytrox vapor and liquid phases, as calculated by the previously discussed Peng–Robinson model. Referring to Figure 3 and Figure 5, near the “sweet spot” where the vapor O2 mass concentration peaks at 0 °C and 86 atmospheres, the liquid-phase density is approximately 780 kg/m3. At this point the liquid-phase Nytrox density is slightly lower than for saturated nitrous saturated oxide at the same temperature, or approximately 900 kg/m3. Thus, at the optimal point Nytrox is only 13% less dense than pure nitrous oxide. At a higher storage pressure of 120 atmospheres (12,160 kPa) and 0 °C, the percentage of N2O in the liquid-phase drops to around 70% with a corresponding density of only 600 kg/m3. This difference amounts to a density drop of more than 40% compared to saturated N2O at the same temperature. This behavior occurs because the nitrous oxide and oxygen become mutually dissolved in each other, and as the oxygen content in solution rises, the density drops. Thus, maintaining the storage pressure near the best value of 80 atmospheres is essential to achieving volumetric efficiency with Nytrox.

2.8. Predicted Propulsion Performance of the Nytrox/ABS Hybrid

Although, when compared to pure N2O the liquid-phase density of Nytrox is slightly lower, the O2 in solution moderately increases the potential specific impulse (Isp) and allows a significant reduction of the optimal oxidizer-to-fuel (O/F) ratio. This performance-trade results in Nytrox being only slightly less volumetrically efficient than pure N2O, and significantly more mass efficient. Figure 6 compares the performance of five different “green” O2 and N2O blend options when burned with ABS as the fuel source. In Figure 6, the plotted curves with differing colors compare pure GOX (black) and N2O (red), against Nytrox with three different liquid-phase O2 mass proportions, 90% N2O/ 10% O2 (blue), 70% N2O/ 30% O2 (green), and 50% N2O/ 50% O2 (violet). For notational simplicity, the Nytrox blends are referred by the mass-percentage of N2O in the liquid-phase of the solution: Nytrox 90, Nytrox 70, and Nytrox 50, respectively. The ABS fuel assumes a typical composition with 33%, 33%, and 34% acrylonitrile, butadiene, and styrene monomer mole-fractions. The associated density of this fuel blend is 1.04 g/cm3.
The calculations of Figure 6 were performed using the industry-standard NASA Chemical Equilibrium Program (CEA) [48], and assuming six different chamber pressure levels varying from 690 to 3450 kPa (100 to 500 psia) The propellants are assumed to be initially stored at 0 °C. Parameters plotted on Figure 6 include: (a) characteristic velocity c*, (b) vacuum Isp, (c) specific gravity, and (d) impulse density ρIsp (impulse density is defined as the product of the specific impulse multiplied by the mean effective density of the propellants. Impulse density is typically expressed in units of N·s/L). For this analysis impulse density is defined as the product of the mean propellant density and the vacuum specific impulse, expressed in the unit of N·s/L. For each color grouping the pressure curves are represented by the different line styles, with the highest pressure levels exhibiting the highest c* and Isp levels.
The vacuum Isp calculations allow a 25:1 nozzle expansion-ratio, with the combustion products frozen at the nozzle throat. The specific gravity calculation for GOX (relative to the weight of water at 20 °C) assumes a storage pressure of 86 atm (8745 kPa) at 0 °C. The specific gravity calculation for pure N2O uses the saturation liquid density at 0 °C (from Reference [45]). The specific gravity for the Nytrox blends are calculated using the Peng–Robinson model, with the liquid-density values taken from Figure 3b for the appropriate N2O/O2 mass proportions.
For comparison purposes, Isp and ρIsp of monopropellant-hydrazine are also plotted on Figure 6b,c. Note that vacuum Isp significantly exceeds that of hydrazine for all of the hybrid oxidizers. Even though hydrazine has a significantly higher specific gravity, ρIsp for the hybrid using either pure nitrous oxide or Nytrox 90 is still greater significantly greater than for hydrazine. The low GOX storage density results in the lowest impulse density for all of the hybrid oxidizers. Using pure N2O gives the best volumetric efficiency, but results in the lowest specific impulse and requires significantly more oxidizer at the optimal O/F ratio. The curve corresponding to the Nytrox 90 mixture gives the best compromise with a distinct ρIsp optimum occurring at an O/F ratio of approximately 4.
Also of note, the data displayed in Figure 6 show that chamber pressure has only a second order effect upon the relative performances of the propellants, with the highest chamber pressure (3450 kPa) exhibiting approximately 5% greater c* and Isp than the lowest chamber pressure (690 kPa). Chamber pressure has essentially no effect upon the impulse density. Thus, even though the results to be presented later in this paper consider a very small thruster system operating at low chamber pressures, the results have a wider range of applicability.

2.9. Summary of Nytrox Properties and Safety Advantages Compared to Pure Nitrous Oxide

The key advantages associated with using Nytrox mixtures to replace N2O as a hybrid oxidizer are:
(1)
Nytrox is much safer than pure N2O because vapor phase has significant O2 concentration, thereby increasing the minimum ignition energy Ei by three or four orders of magnitude,
(2)
The multiple order of magnitude increase in Ei using Nytrox allows for safe self-pressurization with high fluid densities.
(3)
Self-pressurization greatly simplifies the system design and eliminates the need for a heavy, separate pressurant system using helium or nitrogen.
(4)
Nytrox allows improved Isp performance compared to pure N2O.
(5)
From Figure 5b, at the optimal pressure level of 86 atmospheres, the Nytrox liquid density at 0 °C is higher than GOX by a factor approximately 6.4, and allows for a significant improvement in the overall volumetric efficiency of the propellants.
(6)
The optimal O/F ratio is significantly reduced when using Nytrox, allowing a larger proportion of the total impulse to be delivered by the high-density fuel component, in this case, ABS.
(7)
Maintaining the storage pressure near 80 atmospheres at 0 °C is essential to achieving best volumetric efficiency with Nytrox.

3. Experimental Apparatus, Instrumentation, and Test Procedures

This section discusses the process for manufacture of the Nytrox solution, followed by a description of the test article, experimental apparatus, and hot-fire test procedures. The legacy hybrid thruster used for this evaluation was previously optimized for GOX as the oxidizer (Reference [1]) For this testing campaign the legacy hardware was deployed without change to demonstrate Nytrox as a “drop-in” replacement for GOX, and the results are not optimal for the Nytrox/ABS propellants. Considerable room for improvement and optimization of the Nytrox system exists.

3.1. Nytrox Solution Processing

For this study highly-purified grades [49] of N2O and GOX were used to ensure that the resulting Nytrox mixture was free from contaminants and any other possible catalytic agents. The objective of the developed procedure is to generate a Nytrox solution that lies near the previously-described “sweet spot,” where the solution possesses a maximum concentration of oxygen in the vapor phase, with a minimum O2 concentration in the liquid phase. As described earlier, and depicted by Figure 3, at 0 °C this optimum point concentration occurs at approximately 86 atmospheres. The resulting “Nytrox 87” solution has a vapor phase O2 concentration of 37%, and a liquid phase O2 concentration of approximately 13%. For this condition the liquid-phase Nytrox 87 solution has a density of approximately 0.780 g/cm3. Using the ideal gas law, GOX at the same temperature and pressure would have a density of 0.123 g/cm3, or only 16% as dense.
Figure 7 shows the percolation apparatus block diagram. For this test campaign the procedure consists of filling the 4.5 kg-capacity (10 lbs) Nytrox run tank half-full with nitrous oxide. During filling flow is passively initialed by placing the empty Nytrox run tank in an ice bath to lower the temperature to 0°C, while the N2O service tank is kept at room temperature. The temperature difference lowers the vapor pressure of the run tank fluid, creating a pressure difference that motivates in fluid flow.
Once the Nytrox run tank is filled with the desired mass of nitrous oxide, the three-way valve is moved isolate the N2O fill tank, and to allow oxygen to begin flowing into the Nytrox run tank. The GOX regulator set pressure is maintained at 86 atmospheres throughout this process. A dip-tube in the run tank allows GOX to bubble up through the nitrous oxide. During passage through the liquid N2O, oxygen dissolves into solution and also droplets of nitrous oxide are carried up into the gas phase.
The volume of liquid in the cylinder steadily diminishes until equilibrium conditions are reached for the fluid temperature. Equilibrium conditions are noted when the storage tank settles at a constant weight and internal pressure. With the fill-regulator set at 8720 kPa (86 atm absolute pressure), the process takes about 2 h to reach equilibrium. An electronic scale was used to measure the nitrous oxide mass moved from the service tank to the run tank. After the Nytrox is blended at the desired density, the serviced Nytrox run tank is stored at −15 °C temperatures in a portable freezer to keep vapor pressures low and ensure a minimal amount of N2O vapor in the tank ullage. By decreasing the temperature of the run tank, the activation energy barrier is raised even further and allows additional decomposition hazard mitigation.

3.2. Hot-Fire Test Apparatus and Instrumentation

This section summarizes the hardware, instrumentation, and test procedures used to perform the hot-fire evaluation tests. The hot-fire testing campaign was performed inside USU’s on campus hazardous test facility. Whitmore and Bulcher [1], Whitmore and Stoddard [46], and Stoddard [50] describe the analytical methods, test apparatus, instrumentation, test procedures, and analysis methods used to derive the presented data in much fuller detail.

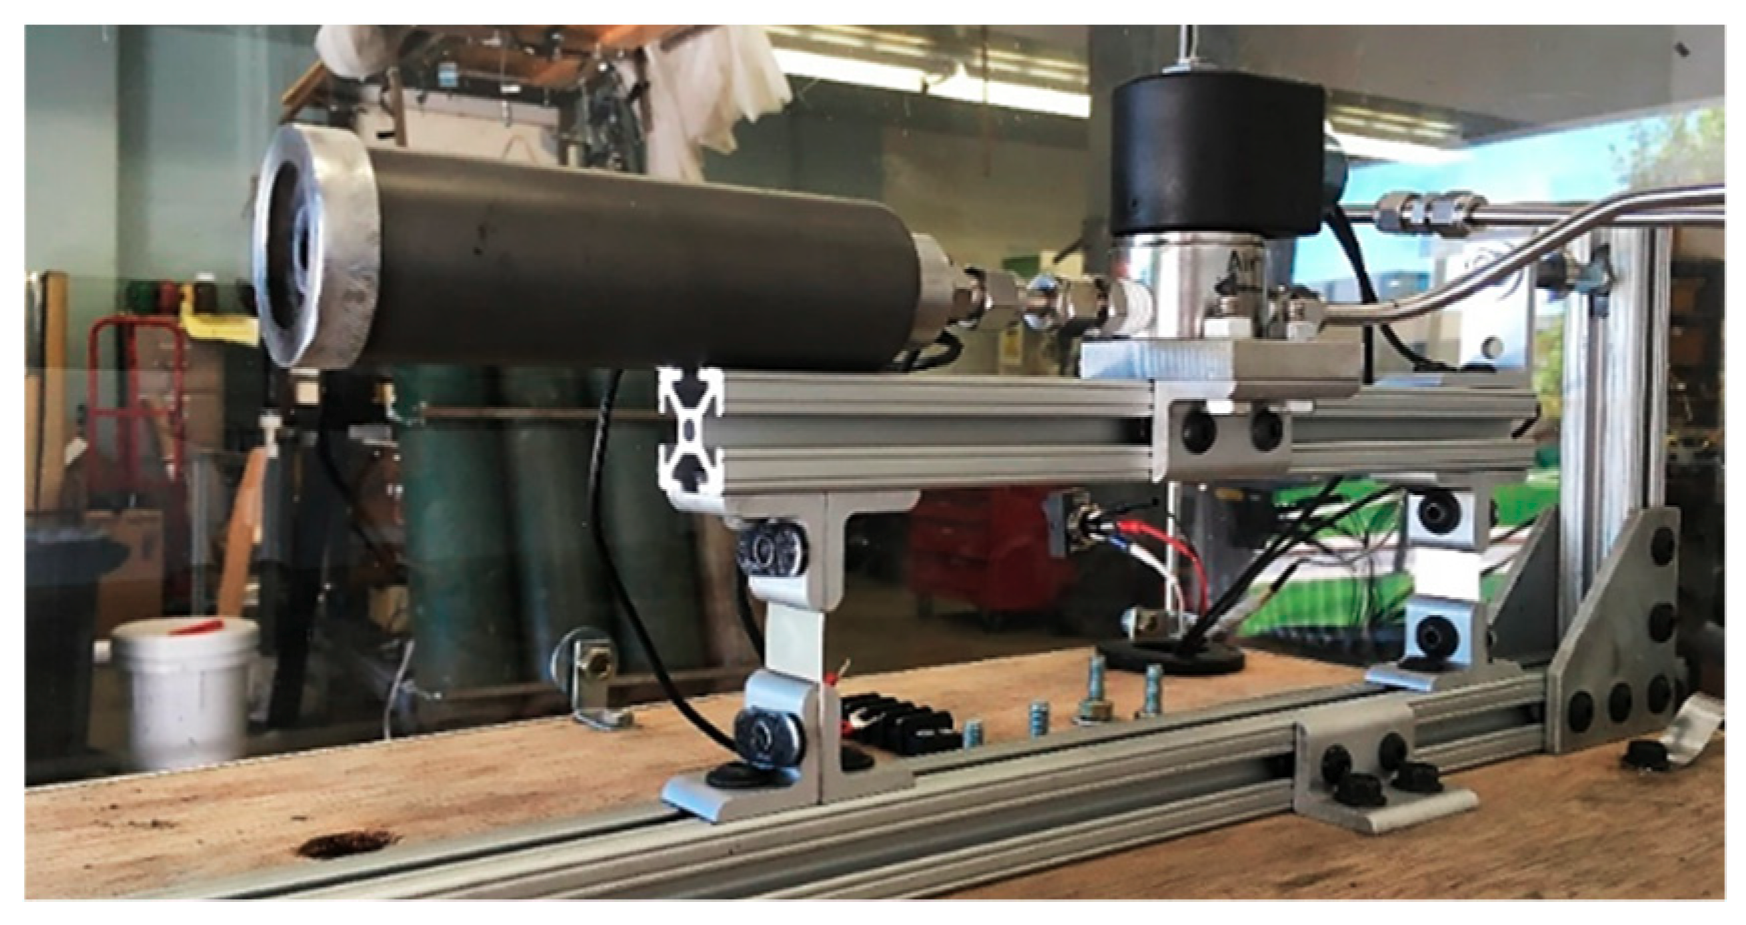
3.2.1. Thrust Chamber

The legacy GOX/ABS prototype of Reference [1] was reconfigured this testing campaign. Figure 8 presents the details of the thrust chamber assembly. Major system components are: (i) graphite nozzle, (ii) nozzle retention cap, (iii) motor case, (iv) 3D printed fuel grain with embedded electrodes, (v) insulating phenolic liner, (vi) chamber pressure fitting, and vii) single-port injector cap. The 38-mm diameter motor case, constructed from 6061-T6 aluminum, was procured commercially [51]. Table 1 summarizes the thrust chamber component geometry specifications, including the injector, fuel grain, motor case, and nozzle.

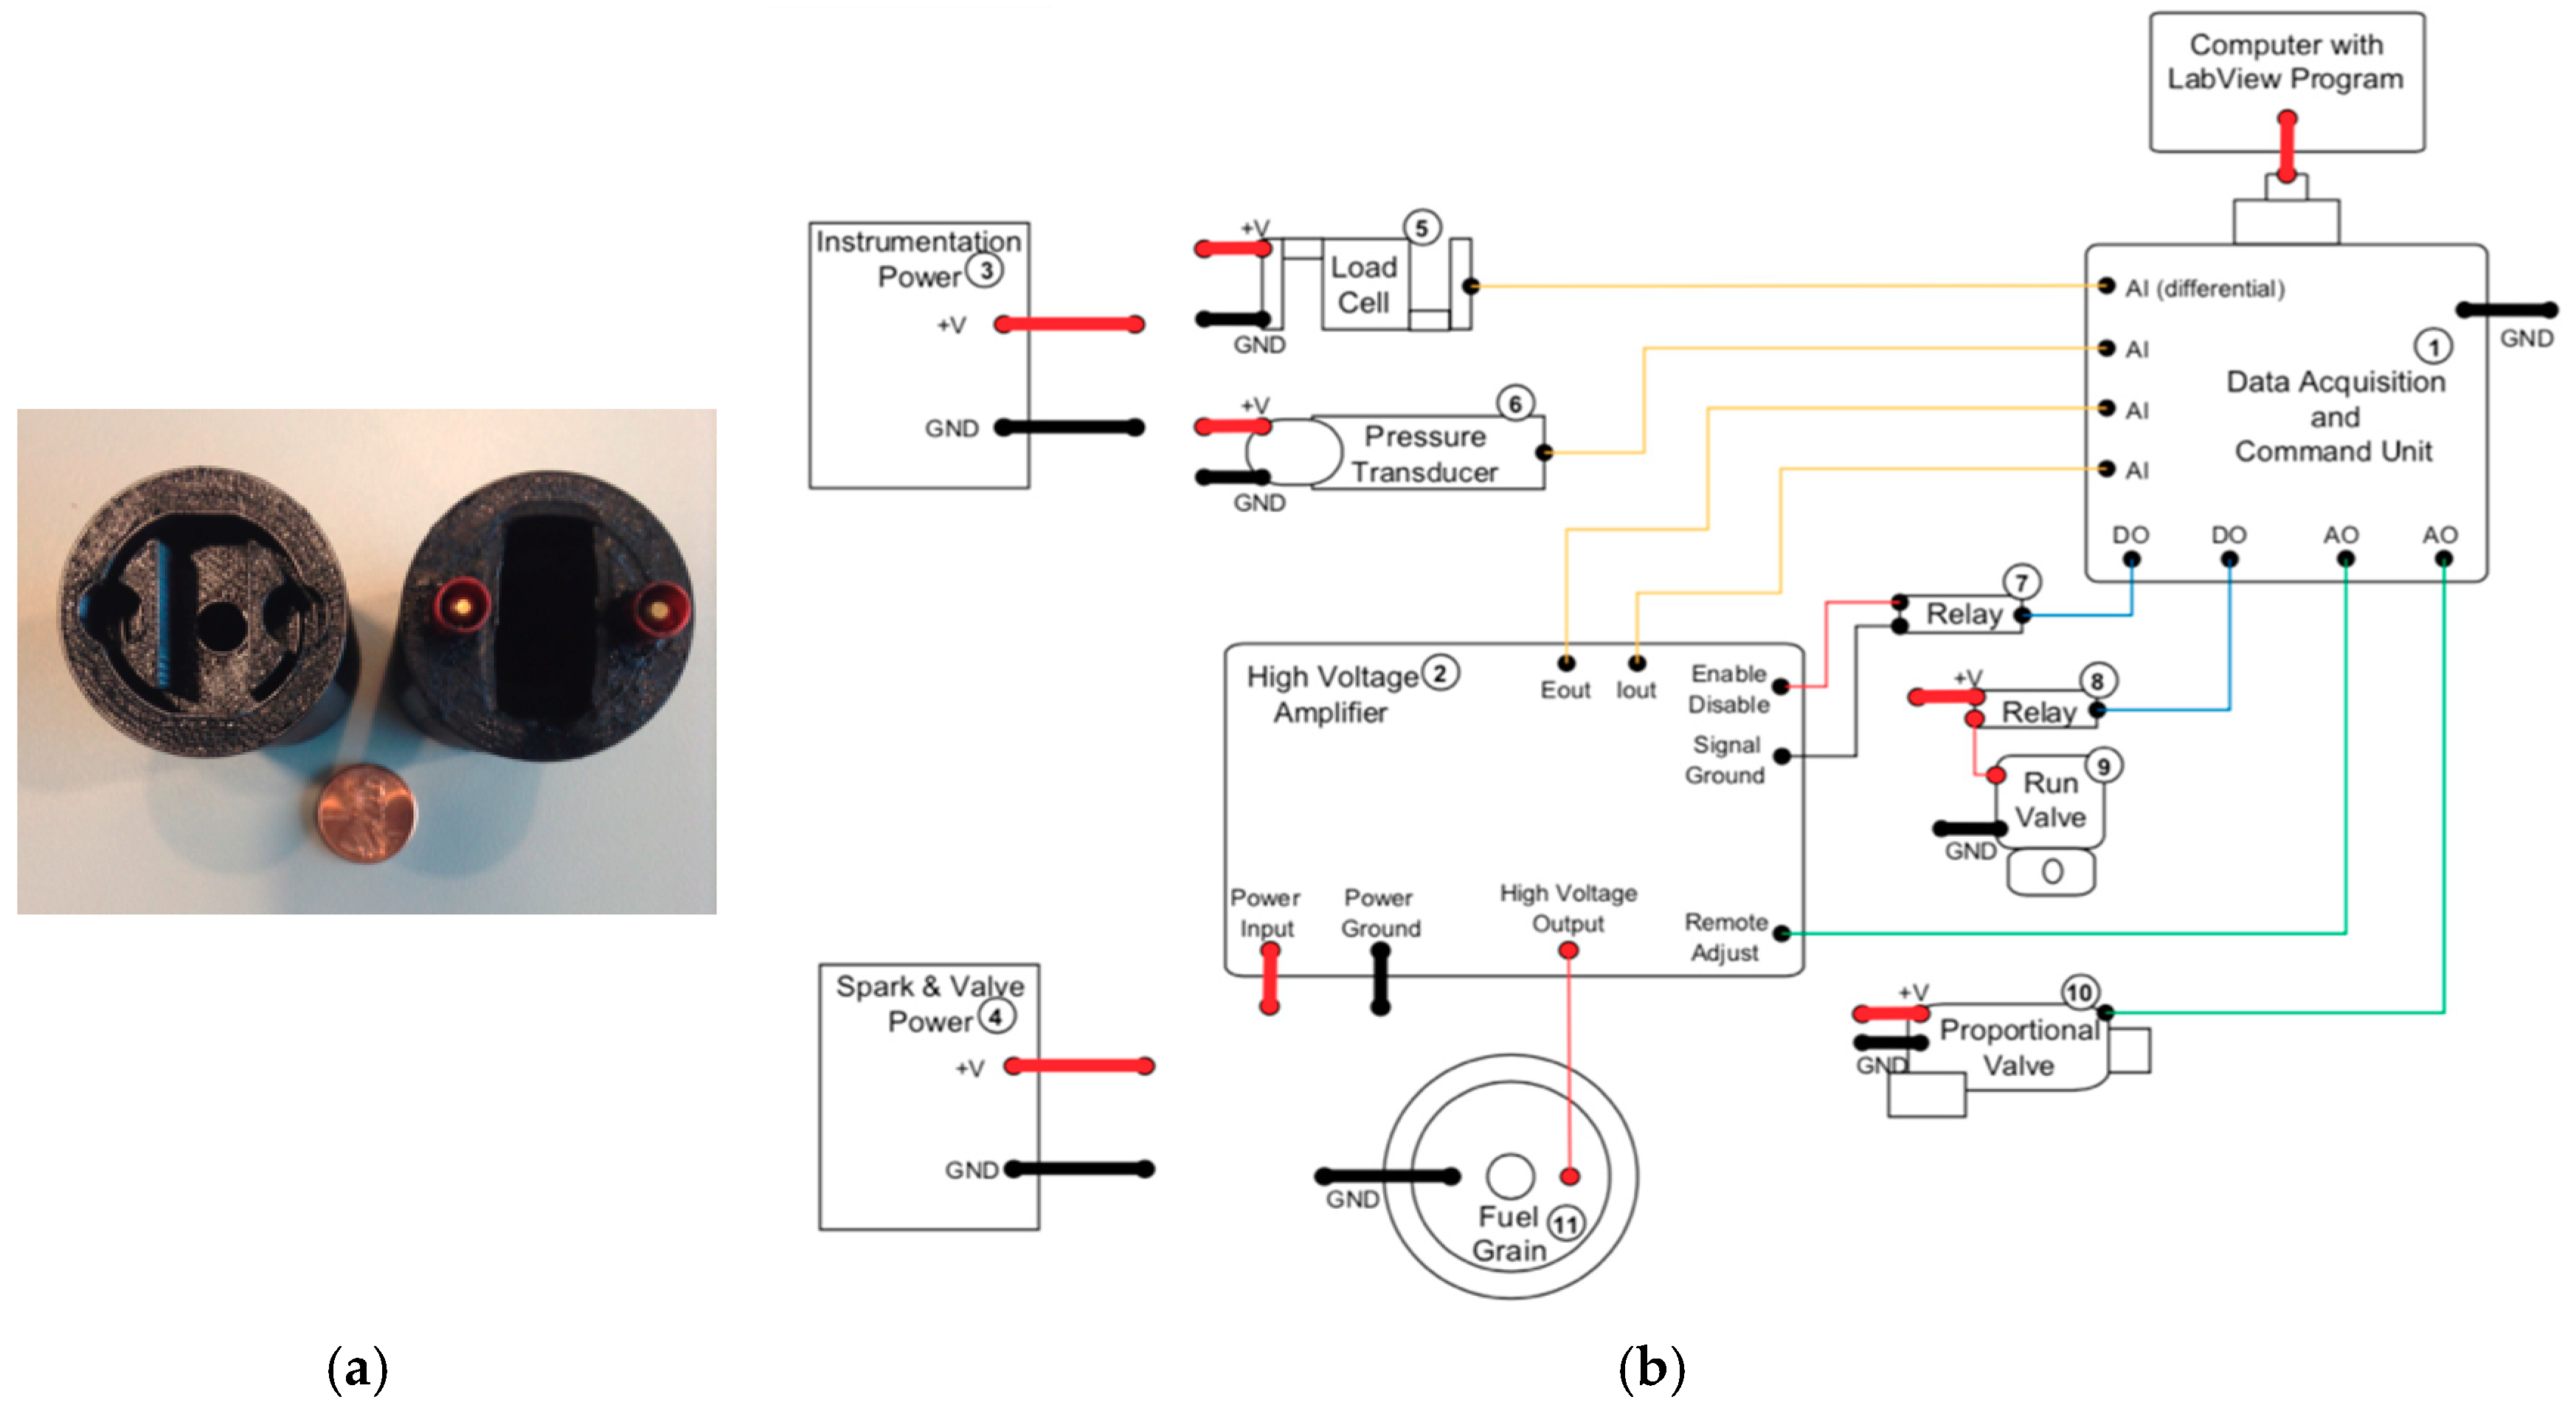
3.2.2. Arc-Ignition System

Figure 9a shows the motor head end layout with flow impingement shelves and embedded electrodes in the 3-D printed ABS fuel grain. Figure 9b shows the ignition system electronics schematic. The ignition system power processing unit is based on the UltraVolt® line of high-voltage power supplies (HVPS) [52]. The HVPS provides a current-limited (30 mA) high voltage output of up to 1000 V or 30 Watts total output. Depending on the impedance on the arc path between the ignitor electrodes, the dissipated voltage typically varies between 100 and 400 volts. Ignition power to the thruster is initiated by sending a transistor–transistor logic (TTL)-level activate logic bit to the HVPS.

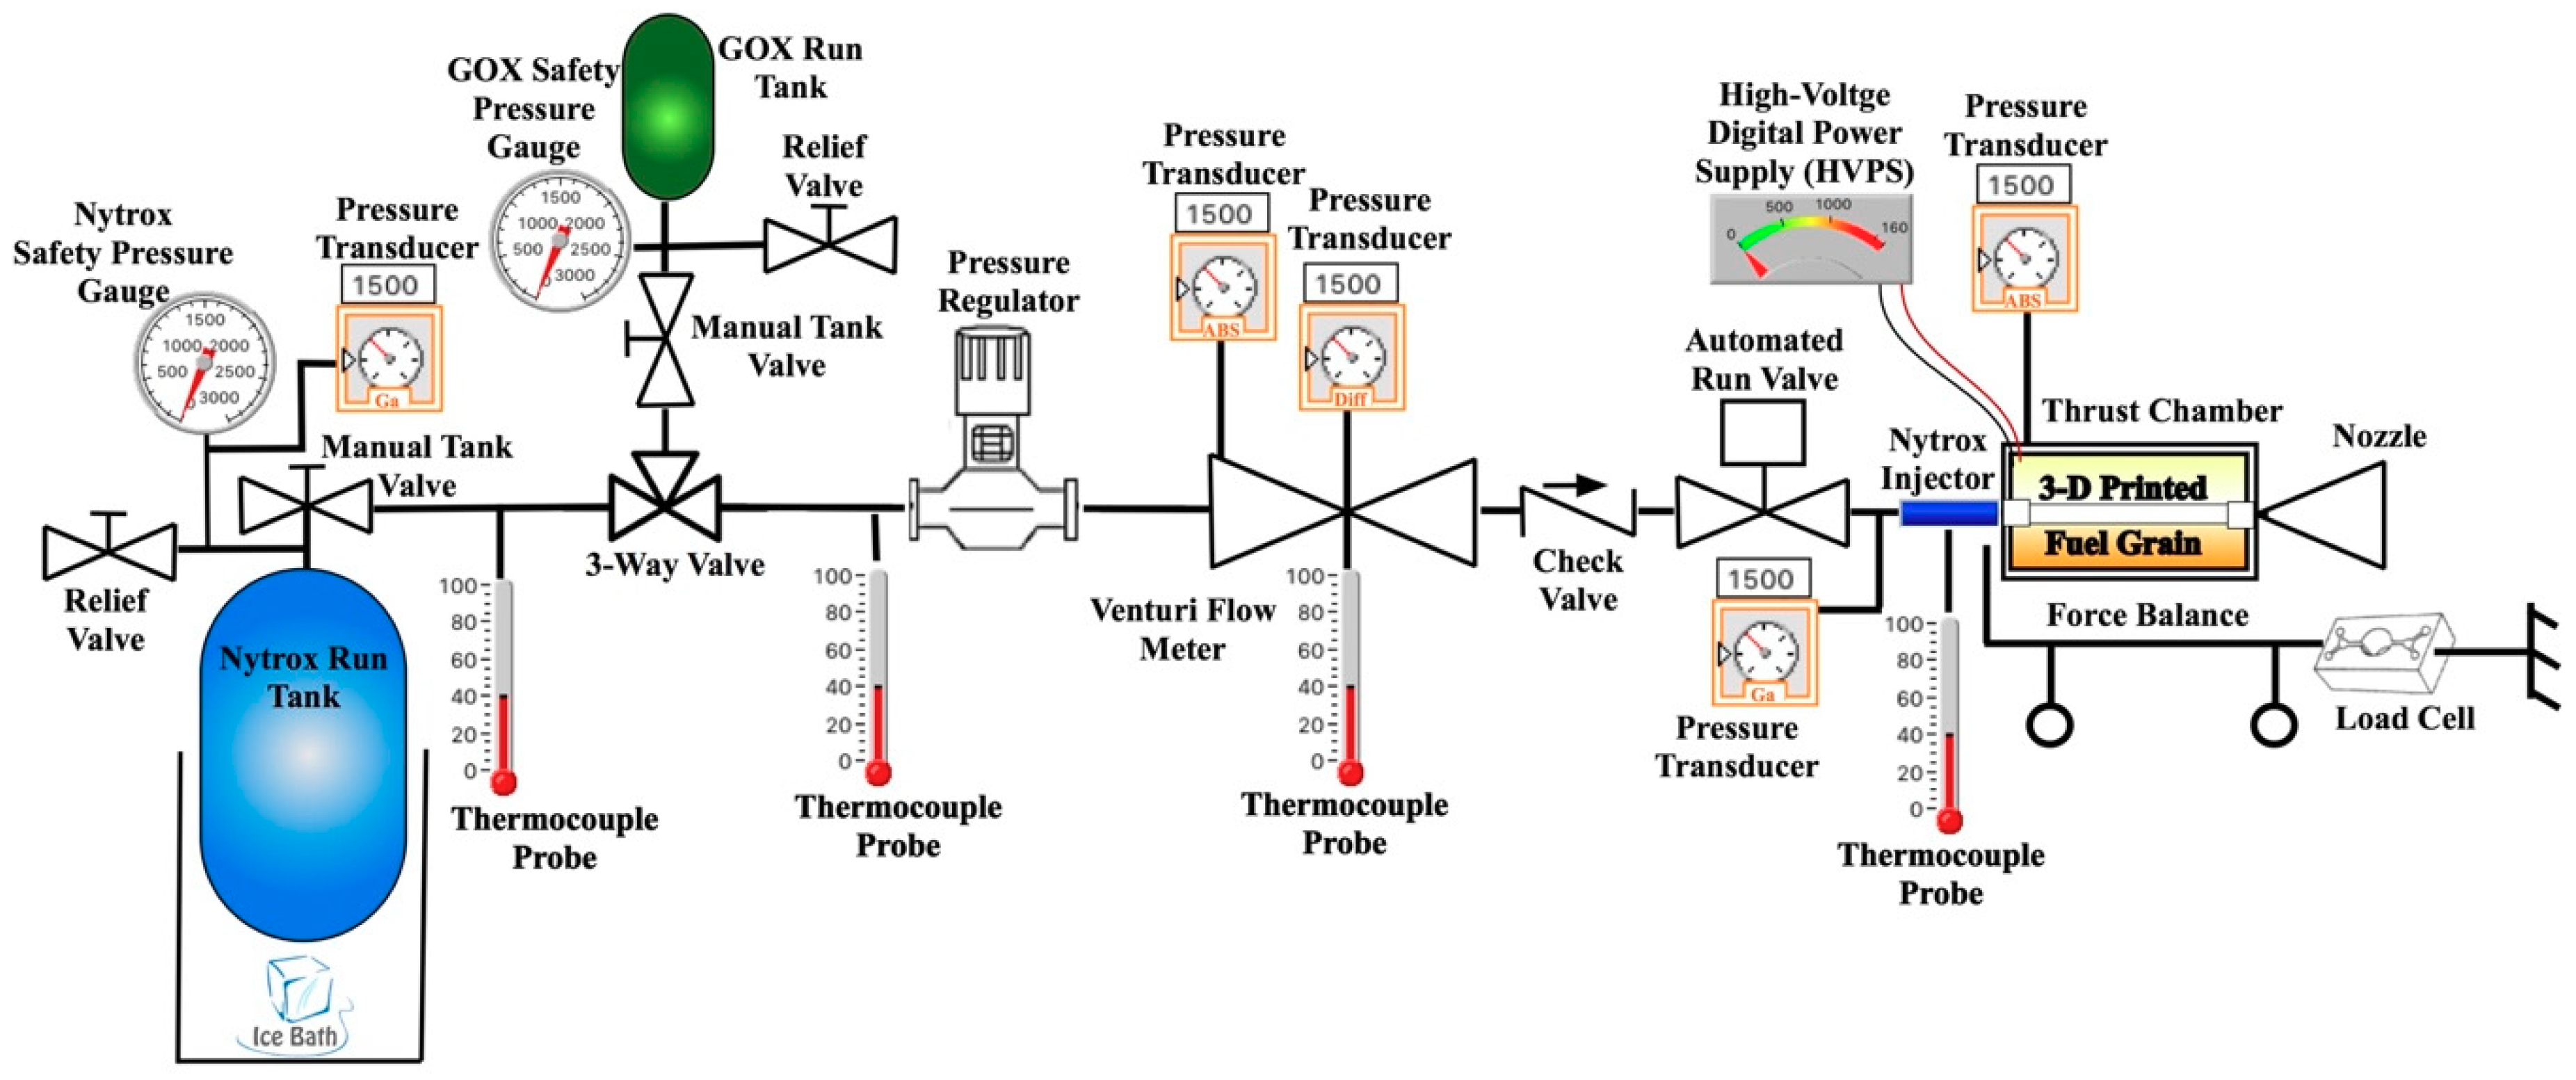
3.2.3. Test Stand Apparatus and Instrumentation

Figure 10 shows the test motor assembled and mounted to the test stand. For this configuration support members allow bending along the direction of thrust to prevent them from interfering with the measured load. Figure 11 shows the piping and instrumentation diagram (P&ID) of the test systems. The test stand measurements include Venturi-based oxidizer mass flow measurements, load-cell based thrust measurements, chamber pressure, and multiple temperature readings at various points along the flow path. The system was configured to allow rapid cycling between Nytrox and GOX using a 3-way valve. Directly aft of the thrust chamber lies the solenoid actuated oxidizer run-valve. Stoddard [50] presents a detailed summary of the test apparatus and procedures.

3.3. Hot-Fire Test Procedures

Initially, baseline tests were performed using gaseous oxygen as the oxidizer. This test series ensured that the “mothballed” system had been returned to the status that existed during the testing campaign of Reference [1]. Parameters measured include ignition power, thrust, chamber pressure, mass flow, fuel regression rate, specific impulse, and impulse density.
Following the baseline tests, the GOX tank was swapped for the run tank filled with the processed Nytrox. A commercial Holley Nitrous Oxide Systems (NOS®) [53] storage tank was used as the nitrous oxide run tank. Other than the change in oxidizer and storage tank, the test assembly remained identical. Special attention was placed on establishing the required ignition power, and the resulting thrust, specific impulse and fuel regression rates. In order to simulate a true operational environment, during hot-fire testing the Nytrox is gradually allowed to warm to ambient conditions.
Test Procedures were nearly identical for both the GOX baseline and Nytrox tests. Pre-test measurements included fuel grain weight and port diameter, measured at both the top and bottom of the fuel port. The nozzle throat and exit plane diameters were also measured. Finally, the initial oxidizer run-tank tank weight, pressure, and temperature were measured. All data were logged on a spreadsheet for post-test analysis.
The upstream oxidizer flow regulator feed pressure was manually set to approximately 22 atmospheres (2230 kPa) in order to choke the injector and ensure a constant oxidizer mass flow throughout the burn. For the two-phase Nytrox flow this pressure level also proved to be sufficiently high to quasi-choke the injector, and significantly reduced the risk of incurring injector-feed coupling instabilities during combustion.
In order to ensure Nytrox ignition reliability, the HVPS was activated sending power to the fuel grain electrodes one second before the oxidizer run valve was opened. Once the run valve opened, then HVPS power to the electrodes was continued to overlap for another 1 s. Since the required power was so small, no attempt to shorten or optimize the “spark” length or overlap time was performed for this test series. For this test series, the motor run valve was programmed to open for a prescribed amount time that varied from 1 to 4 s. The motor would snuff immediately after closure of the run valve. Allowing forma safety margin to prevent motor-case burn through, one fuel grain allows for 8 s of total burn time. Thus, on a single fuel grain a typical test series would prescribe four tests of 2 s each, or two tests of 4 s each. Following each burn, the weight and geometry measurements described in the previous paragraphs were repeated and logged for post-test analysis

4. Data Analysis Methods

This section details the analytical methods that were used to calculate key derived-parameters from the raw test data. These mass-flow based calculations include: (1) oxidizer mass flow, (2) mean fuel regression rate, (3) oxidizer-to-fuel ratio, (4) mean fuel port diameter, (5) oxidizer massflux, (6) total massflux, (7) equivalence ratio, and (8) specific gravity. Key performance parameters calculated from the raw data include: (1) combustion efficiency, (2) thrust coefficient, (3) specific impulse, (4) characteristic velocity, and (5) impulse density. The following section detail how these calculations were performed. The presented calculations for regression rate, fuel port diameter, and massflux are valid only for the longitudinal averages. There is no attempt to spatially resolve these parameters along the length of the fuel port.

4.1. Calculating the Fuel Mass flow Rate.

Although the inline Venturi measures the oxidizer mass flow in real-time, the test stand was not configured to directly measure the fuel mass flow. Instead, before and after each hot-firing the fuel grains were weighed to give the total fuel mass consumed during the test. As will be described later in this section, these mass measurements were used to anchor the “instantaneous” fuel mass flow rates, calculated as the difference between the nozzle exit and oxidizer mass flows:
m ˙ f u e l ( t ) = m ˙ t o t a l ( t ) m ˙ o x ( t )
Knowing the nozzle throat area A* and the plume exhaust gas properties, the nozzle exit (total) mass flow at each time point was calculated from the measured chamber pressure time history P0, using the 1-dimensional choking mass flow equation, (Anderson [54], Chapter 4)
m ˙ t o t a l ( t ) = A * P 0 ( t ) γ R g T 0 ( 2 γ + 1 ) γ + 1 γ 1
The calculation of Equation (2) assumes the flow composition is frozen at the nozzle entrance, (Anderson, [54], pp. 659–661) and nozzle erosion during the burn.
A table of thermodynamic and transport equilibrium properties of the GOX/ABS and Nytrox/ABS exhaust plumes were calculated using NASA’s industry standard Chemical Equilibrium code (CEA) [48] with chamber pressure P0 and mean O/F ratio as independent look up variables for the tables. For each data point in the burn time history, the two-dimensional tables of thermodynamic and transport properties were interpolated using chamber pressure P0 and mean O/F ratio as lookup variables. Calculated parameters included the gas constant Rg, ratio of specific heats γ, and flame temperature T0. Defining the combustion efficiency as:
η * = c a c t u a l * c i d e a l * = ( γ + 1 2 γ ) γ + 1 γ 1 R g T 0 a c t u a l ( γ + 1 2 γ ) γ + 1 γ 1 R g T 0 i d e a l T 0 a c t u a l T 0 i d e a l
The theoretical flame temperature was scaled by adjusting the combustion efficiency:
T 0 a c t u a l = T 0 i d e a l ( η * ) 2
such that the calculated fuel mass consumption over the burn:
Δ M f u e l ( t b u r n ) = 0 t b u r n ( m ˙ t o t a l ( t ) m ˙ o x ( t ) ) d t
matched the measured value from differences of the pre- and post-test weight measurements. As described earlier, the consumed fuel mass anchored the thermodynamic calculations.
Adjusting input combustion efficiency upwards has the effect of increasing the calculated fuel mass consumption, and downwards decreases the calculated fuel mass consumption. The calculations of Equations (2)–(6) were iterated, adjusting η* after each iteration, until the calculated fuel mass matched the measured mass within a prescribed level of accuracy, in this case 0.5%. For each iteration, the time-averaged oxidizer-to-fuel ratio was calculated as integrated oxidizer mass flow divided by the consumed fuel mass:
O / F = 0 t b u r n m ˙ o x ( t ) d t Δ M f u e l ( t b u r n ) = 0 t b u r n m ˙ o x ( t ) d t 0 t b u r n ( m ˙ t o t a l ( t ) m ˙ o x ( t ) ) d t  
The thruster system to be tested exhibited very little O/F ratio shift over the burn lifetime. Thus, the assumption of a constant O/F ratio based on the total consumed masses had very little effect upon the presented results. Clearly, for propellants or thruster systems that exhibit a significant O/F shift, the presented method must be modified with the O/F being calculated as a function of time based upon the instantaneous mass flow calculations. The time-averaged O/F method was used to reduce the complexity of the implemented model and also aid for numerical convergence.

4.2. Calculating the Fuel Regression Rate

Once the mass flow and consumed masses were calculated as described above, the instantaneous longitudinal mean of the regression rate was calculated from the rate of fuel mass depletion as:
r ˙ L ( t ) = m ˙ f u e l ( t ) 2 π ρ f u e l r L ( t ) L
In Equation (8) ρfuel is the solid fuel density, L is the fuel grain burn length, and rL is the longitudinal mean of the fuel port radius. Integrating Equation (8) from the initial condition to the current burn time solves for the instantaneous longitudinal mean of the port radius and cross-sectional area:
r L ( t ) = r 0 2 + 1 π ρ f u e l L 0 t m ˙ f u e l ( τ ) d τ
and:
A c ( t ) = π r L 2 ( t )
In Equation (10) r0 is the initial fuel port radius at the beginning of the burn. The terminal cross sectional area of the fuel port is:
A c ( t b u r n ) = π r 0 2 + Δ M f u e l ( t b u r n ) ρ f u e l L
The time-averaged fuel regression rate over the duration of the burn is calculated by:
r ˙ ¯ = Δ M f u e l ( t b u r n ) 2 π ρ f u e l L ( r t b u r n + r 0 2 ) t b u r n
The time-averaged- oxidizer mass flux, total mass flux, equivalence ratio, and effective specific gravity of the propellants are estimated by:
G ¯ o x = 1 t b u r n ( 0 t b u r n m ˙ o x ( t ) d t A c ( t ) ) ,               G ¯ t o t a l = 1 t b u r n ( 0 t b u r n m ˙ o x ( t ) d t A c ( t ) + Δ M f u e l A c ( t b u r n ) )   and   Φ = ( O / F ) s t o i c h i o m e t r i c ( O / F ) t e s t ,                       s g = s g o x s g f u e l ( O / F + 1 ) ( s g f u e l O / F + s g o x )
For this discussion, the specific gravity is calculated based on the propellant density relative to the weight of water at 20 °C. For GOX flow, the specific gravity is based on mean tank storage density as calculated using the ideal gas law. For Nytrox flow the Peng–Robinson model was used to calculate the oxidizer specific gravity. As shown by Table 1, the ABS fuel print density was approximately 1.04 g/cm3. The stoichiometric O/F ratio for each propellant combination was calculated using CEA [48].

4.3. Calculating the Motor Performance Parameters

The 1-dimensional de Laval flow equations (Anderson [54], Chapter 4) were used to calculate the thruster performance parameters. Thrust and thrust coefficient were calculated from chamber pressure as:
F t h r u s t = P 0 A * ( 2 γ 1 ( 2 γ + 1 ) γ + 1 γ 1 ( 1 p e x i t P 0 ) γ 1 γ + ( A e x i t A * ) ( p e x i t p P 0 ) )
C F = F t h r u s t P 0 A * = γ 2 γ 1 ( 2 γ + 1 ) γ + 1 γ 1 ( 1 p e x i t P 0 ) γ 1 γ + ( A e x i t A * ) ( p e x i t p P 0 )  
Specific Impulse, Characteristic Velocity, and Impulse density were calculated as:
I s p = F t h r u s t g 0 m ˙ t o t a l
c * = P 0 A * m ˙ t o t a l  
ρ I s p = s g g 0 I s p
In Equations (16) and (18) g0 is normal acceleration of gravity at sea level, 9.8067 m/s2. The thrust coefficient CF and specific impulse Isp were also calculated directly from the thrust sensed by the test stand load cell. Values calculated from both sources will be presented later in order to support the verisimilitude of the collected test data.

5. Results and Discussion

This section presents results from the testing campaign. Nytrox-batch solution properties are presented first, followed by the Venturi flow meter calibration test results for Nytrox flow. Results of 32 successful hot-fires are presented, 13 with GOX as the oxidizer and 19 burns with Nytrox replacing GOX. Results from tests using GOX and Nytrox will first be presented individually and then compared. For both test series, the oxidizer regulator set-pressure was adjusted such that the nozzle exit pressure was near the optimal (ambient) condition. During preliminary testing, the optimal exit pressure was estimated from the measured chamber pressure, the nozzle expansion ratio, and combustion properties as determined from the earlier-described CEA analysis. The optimal exit pressure was desired for both test series in order to reduce or eliminate the effects nozzle efficiency as a factor in the performance comparisons. Thus, any performance differences would primarily result from the propellants. In order to achieve the optimal-nozzle exit pressure, the Nytrox/ABS thruster chamber pressure was approximately 6% higher than the corresponding chamber pressure for GOX/ABS.

5.1. Making the Nytrox Mixture

The procedures described by Section 3.1 were followed to generate the Nytrox batches used for this testing campaign. Table 2 summarizes these processing results.
At the time of this publication, six complete batches of Nytrox have been processed. The batch comparisons are remarkably similar. With the tank temperature closely regulated by submersion in an ice bath, the mean batch equilibrium pressure was 8745.4 kPa (86.3 atm) with a standard deviation of only 3%. Also, the intensive fluid properties were remarkably similar. The mean effective fill density calculated using the known tank volume and pre- and post-fill weights was 0.422, with a standard deviation of less than 1%. The listed Nytrox vapor and liquid densities were calculated from the Peng–Robinson model based on the known tank fill pressure and temperature. Based on the Peng–Robinson model, the mean liquid O2 vapor mass fraction was 12.76%, with a standard deviation of less than 0.68%. The mean Nytrox liquid density was 0.773 g/cm2 with a standard deviation of only 0.007%. These values are remarkably close to the pre-planned “sweet spot” values as presented by Figure 3 and Figure 5.

5.2. Oxidizer Venturi Calibration

For the flow of gaseous oxygen, the associated Venturi mass flow calculations were developed using from material presented by Anderson [54]. The compressible mass flow equations are written in terms of the oxidizer stagnation downstream of the regulator P0, the Venturi inlet pressure P1, and the Venturi throat pressure P2. The result is:
P 0 = [ ( A 1 A 2 ) 2 ( P 1 ) γ + 1 γ ( P 2 ) γ + 1 γ ( A 1 A 2 ) 2 ( P 1 ) 2 γ ( P 2 ) 2 γ ] γ γ 1 m ˙ o x = C d A 2 P 0 2 γ ( γ 1 ) ( R g T ) [ ( P 2 P 0 ) 2 γ ( P 2 P 0 ) γ + 1 γ ]
Previously, References [1,30], performed extensive GOX cold flow tests at a multiple upstream set pressures varying from 15 to 30 atm were performed. Over this range the associated discharge coefficient was found to be essentially constant with a value of approximately Cd = 0.95. The value was not found to vary over the range of mass flow tested in this experiment. Since the Venturi arrangement for GOX baseline tests did not change from the original tests series, the Venturi flow meter was not re-calibrated for GOX flow for this testing campaign.
In contrast to the GOX flow, the two-phase, binary nature of the Nytrox flow made mass flow measurements from the Venturi sensor rather more complicated. Multiple models have been previously developed for two phase nitrous oxide mass flows. These include models developed by Zilliac and Karabeyoglu [55], Dyer [56], Whitmore and Chandler [57], Zimmerman et al. [58], and Waxman et al. [59]. It is likely that these models, each developed for the flow of a single saturated liquid are applicable to the two phase binary fluid injector problem, but a solid theoretical foundation for Venturi flow has yet to be developed.
Thus, for this proof-of-concept testing campaign, the Nytrox mass flow was modeled using the compressible Venturi model of Equation (15), with discharge coefficient set specifically for Nytrox 87 flow. The associated ideal gas thermodynamic properties are calculated as the molar averages of the GOX and N2O fluid components, based on the Peng–Robinson model at the tank storage pressure and temperature.
Figure 12 plots the results of a series of cold-flow tests used to calibrate the Venturi for Nytrox flow. The actual thrust chamber and injector were used for these tests, but with the exit nozzle removed, and no fuel grain installed. For these tests regulator pressure was set at 22 atmospheres to match the set pressure to be used for the hot-fire tests. Run-time lengths of 1, 2, 3, and 7 s were performed, and the run tank mass was measured before and after each test. The oxidizer masses depleted from the run tank, measured by the differences in the before and after run tank weights, are plotted against the time integrals of the mass flows calculated by Equation (15), assuming Cd = 1.0. The slope of the plotted curve, approximately 1.352 g/g, is equivalent to the true discharge coefficient at the upstream set pressure.
Clearly, since the calculated value Cd = 1.352 is greater than unity, the model of Equation (15) is not a complete representation of the two-phase flow physics. It is likely that the ideal-gas compressible flow equations do not capture some of the interaction phenomena of the binary fluid components. If the tests were performed over a much wider mass flow range, it is possible that the slope curve plotted on Figure 12 would vary as a function of set pressure and mass flow. However, since the test data form a very tight curve for this series, the resulting Cd value is considered to be accurate as long as the upstream regulator set pressure is maintained near 22 atmospheres.
This limited calibration was performed for time expediency to allow the testing campaign to be concluded within the available test window. With this method the molecular weight, gas constant, and ratio specific heats were calculated based on the mean tank vapor composition as shown by Table 2. Pressing forward to the nytrox hot-fire testing campaign the following parameters were used for the Venturi nytrox flow calibration:
Mw = 37.67 g/mol, Rg = 220.72 J/kg-K, γ = 1.40, and Cd = 1.352

5.3. Baseline O2 Hot-Fire Test Summary

As stated previously, a series of hot-fire tests were performed using GOX as the oxidizer in order to establish a baseline for the small thruster system. Results from 13 hot-firings are reported here. Figure 13 plots the time histories from a typical GOX baseline test. Plotted are (a) thrust, (b) chamber pressure, (c) mass flow, and (d) consumed propellant mass.
The fuel mass flow and consumed mass time histories were calculated using the procedure previously laid out in Section 4.1. Note that although the oxidizer flow initiates at time zero, the steady chamber pressure is not reached until approximately 300 ms later. The initial GOX time history overshoot is likely due to an unchoked nozzle as gas streams into the thrust chamber. On Figure 13a thrust values as directly measured by the load call and as calculated from chamber pressure using Equation (12) show excellent agreement. This close comparison indicates that values for the nozzle-flow thermodynamic parameters, T0, γ, Mw, and Rg, derived from the previously-described procedure of Section 4.1 are accurately calculated.
Figure 14 graphically summarizes the baseline tests, showing the results of 13 hot-firings. Plotted are Isp, CF, c*, and the mean ABS fuel regression rate. The mean fuel regression rate, calculated using Equations (10), is plotted as a function of both mean oxidizer Gox and total massflux Gtotal. The specific impulse and thrust coefficient curves plot values calculated using both the sensed thrust from the load cell, and the thrust calculated from chamber pressure. The plotted data of this section and the bar charts of the next section result from time history averages taken from the steady-state portions of each hot-fire test. For the purpose of this calculation the term “steady-state” means all data points that lie within 10% of the maximum observed thrust and chamber pressure levels.
The time-averaged CF values calculated using measured thrust and chamber pressure data were calculated as:
C ¯ F = 1 t b u r n 0 t b u r n F ( t ) P ( t ) A * d t
are plotted as the black circular symbols. Time-averaged values calculated from the chamber pressure, calculated using 1-D De Laval flow model (Anderson, Reference [49]):
C ¯ F = 1 t b u r n 0 t b u r n γ 2 γ 1 ( 2 γ + 1 ) γ + 1 γ 1 ( 1 p e x i t P 0 ) γ 1 γ + ( A e x i t A * ) ( p e x i t p P 0 ) d t  
are plotted as circular red symbols. In Equation (17), the exit pressure values were calculated from the chamber pressure based on nozzle expansion ratio using the previously-described values for γ and Rg. For both the GOX and Nytrox testing campaign, pre- and post-test measurements indicated no discernable change in the nozzle throat area. For this calculation a constant throat area A* is used.
Dashed red lines overlaid on the Isp, CF, and c* plots were values calculated from CEA [48]. assuming frozen flow at the nozzle throat. The plotted data generally support the theoretical calculations. Because the data of Figure 14 agree closely with results previously published by References [1,30], it is concluded that the reassembled test article and test stand were returned to the previous state of performance, for which there is an extensive data base.

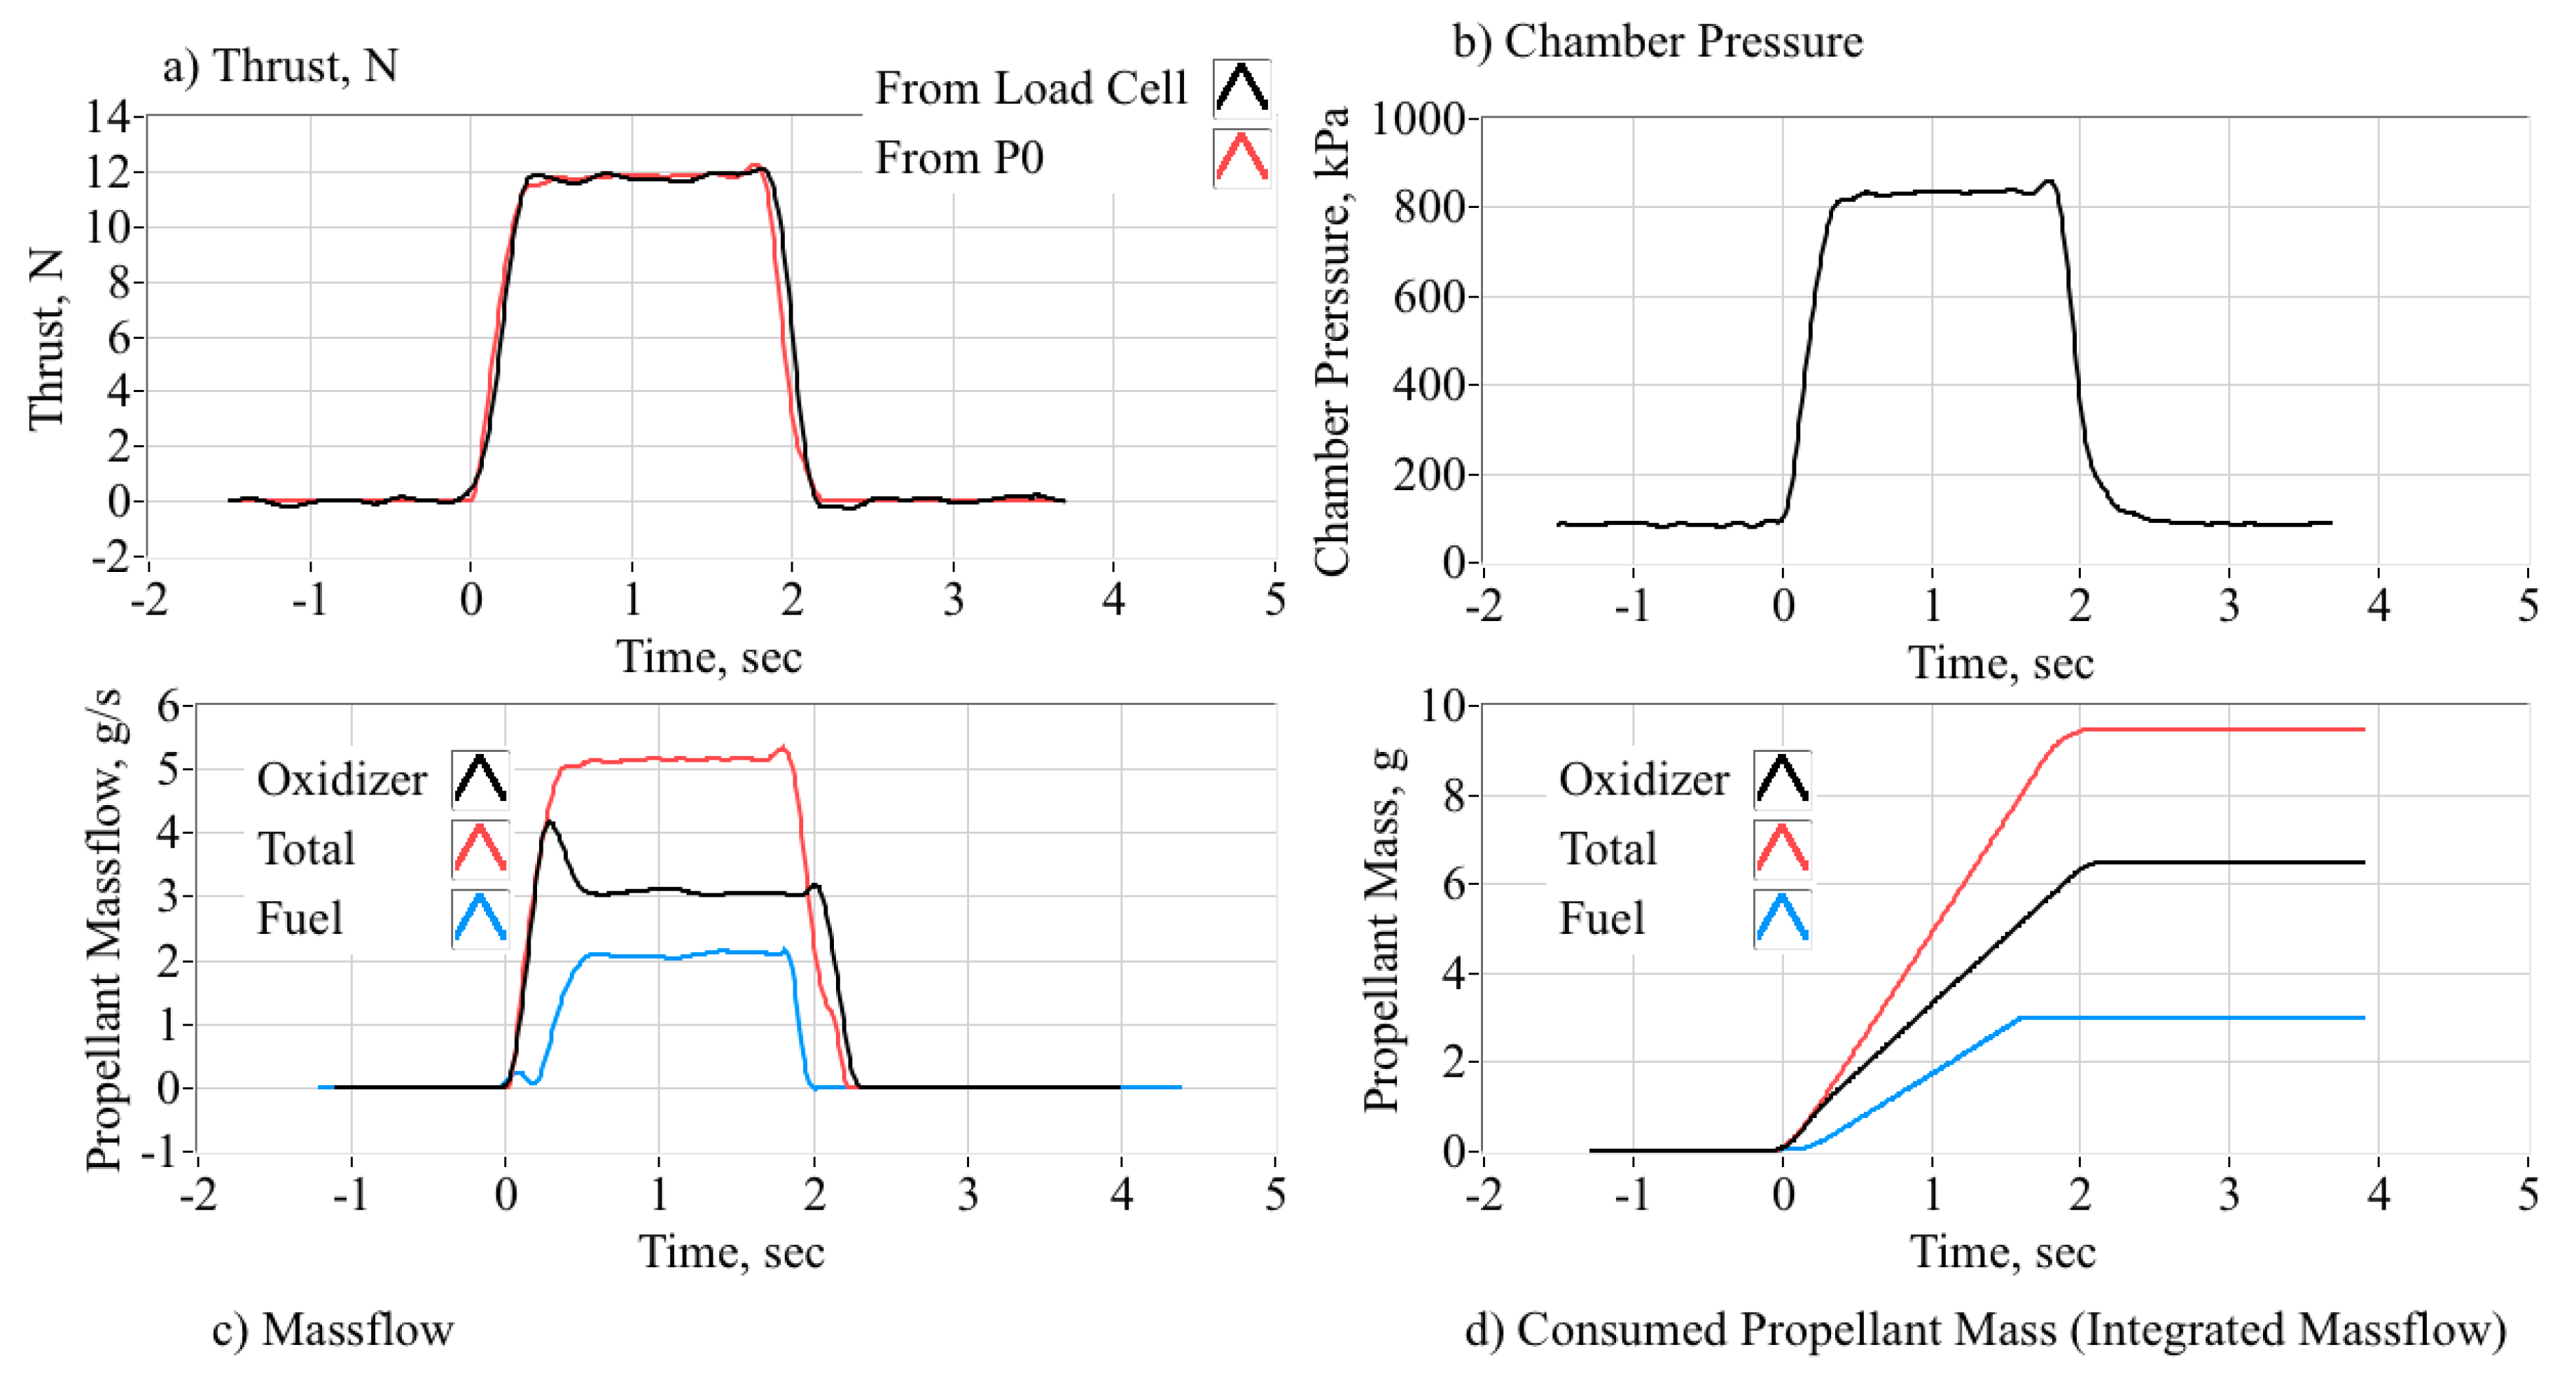
5.4. Nytrox 87 Hot-Fire Test Summary

Data from a total of 19 Nytrox hot-firings are reported. Figure 15 plots the time histories from a typical hot-fire test. As with the previous plots of Figure 13, the plotted time histories are (a) thrust, (b) chamber Pressure, (c) mass flow, and (d) consumed propellant mass. The time scales have been adjusted so that the zero-time point corresponds with the motor-ignition, signaled by a sharp rise of the chamber pressure. As shown by the mass flow plot 15c, the Nytrox run valve was opened approximately 400 ms prior to this motor-ignition rise time. Prior to the motor ignition it appears that chilled, mostly liquid, Nytrox streamed into the combustion chamber. Because this pre-ignition flow stream was mostly-liquid, only a minor rise in thrust and chamber pressure occurs. This ignition latency was observed for the majority of the Nytrox tests, and will be described in detail later in this section. The Nytrox streaming into the thrust chamber prior to ignition is not included in the total Nytrox mass calculation of Figure 15b. Pre- and post-test measurements of the NOS® tank weights were compared against the calculation for the consumed oxidizer mass, e.g., from Figure 15d, and verified the accuracy of the nytrox Venturi discharge coefficient described in the previous section.
Figure 16 graphically summarizes the nytrox test results. The nytrox mixtures used for these tests are described previously in Section 5.1, with the mixture properties listed by Table 2. As with the baseline data presentation, Figure 16 plots Isp, CF, and c* as a function of O/F ratio, and mean fuel regression rate as a function of Gox and Gtotal. With regard to the regression rate plots, note that the Gox and Gtotal curves lie closer together as compared to the baseline data. This occurrence results from the significantly higher O/F ratio for the nytrox flow, where the majority of total thruster mass flow is from the oxidizer and not ablated fuel.
The corresponding CEA curves assuming a Nytrox 87 (87% N2O) liquid composition are also plotted. Here there is significantly more scatter exhibited by the data, a likely result of the changing Nytrox fluid composition as the tank empties. The mean values for Isp and c* are approximately 10% lower that theoretical CEA predictions. Comparing Figure 14 and Figure 16 shows that when Nytrox is “dropped in” as a replacement for GOX, the motor tends to run slightly fuel-rich than the O/F required for optimal performance. Since the thruster had been previously optimized for best O/F ratio based on GOX as the oxidizer, this result was expected. The ensemble-mean Nytrox combustion efficiency, as calculated by Equation (3) for each burn was approximately 92.5%.

5.5. GOX/Nytrox Burn Data Comparisons

This section compares the results of the GOX/ABS baseline against the Nytrox/ABS test results. Table 3 summarizes the GOX/ABS test statistics with data taken from Figure 14, and the Nytrox/ABS test statistics with data taken from Figure 16. The mean μ, standard deviation σ and 95% t-confidence intervals [56] for thrust, thrust coefficient, specific impulse, characteristic velocity, combustion efficiency, O/F ratio, chamber pressure, and total mass flow are tabulated. Values for thrust, CF, and Isp are calculated using both the sensed load and thrust calculated from chamber pressure using Equations (12)–(14). Generally, the thrust comparisons are close, with the Nytrox/ABS thruster exhibiting a slightly higher thrust and chamber pressure that the GOX/ABS, a likely result from the higher Nytrox density. Conversely, the GOX/ABS thruster exhibits increased specific impulse Isp and c* level, compared to Nytro/ABS. This result was predicted by Figure 6, and was expected. Also, note that the calculated values for CF for both test series are nearly identical, in fact they are statistically indistinguishable. This CF comparison indicates that the choice of propellants is the primary distinguishing actor with regard to the specific impulse performance differences.

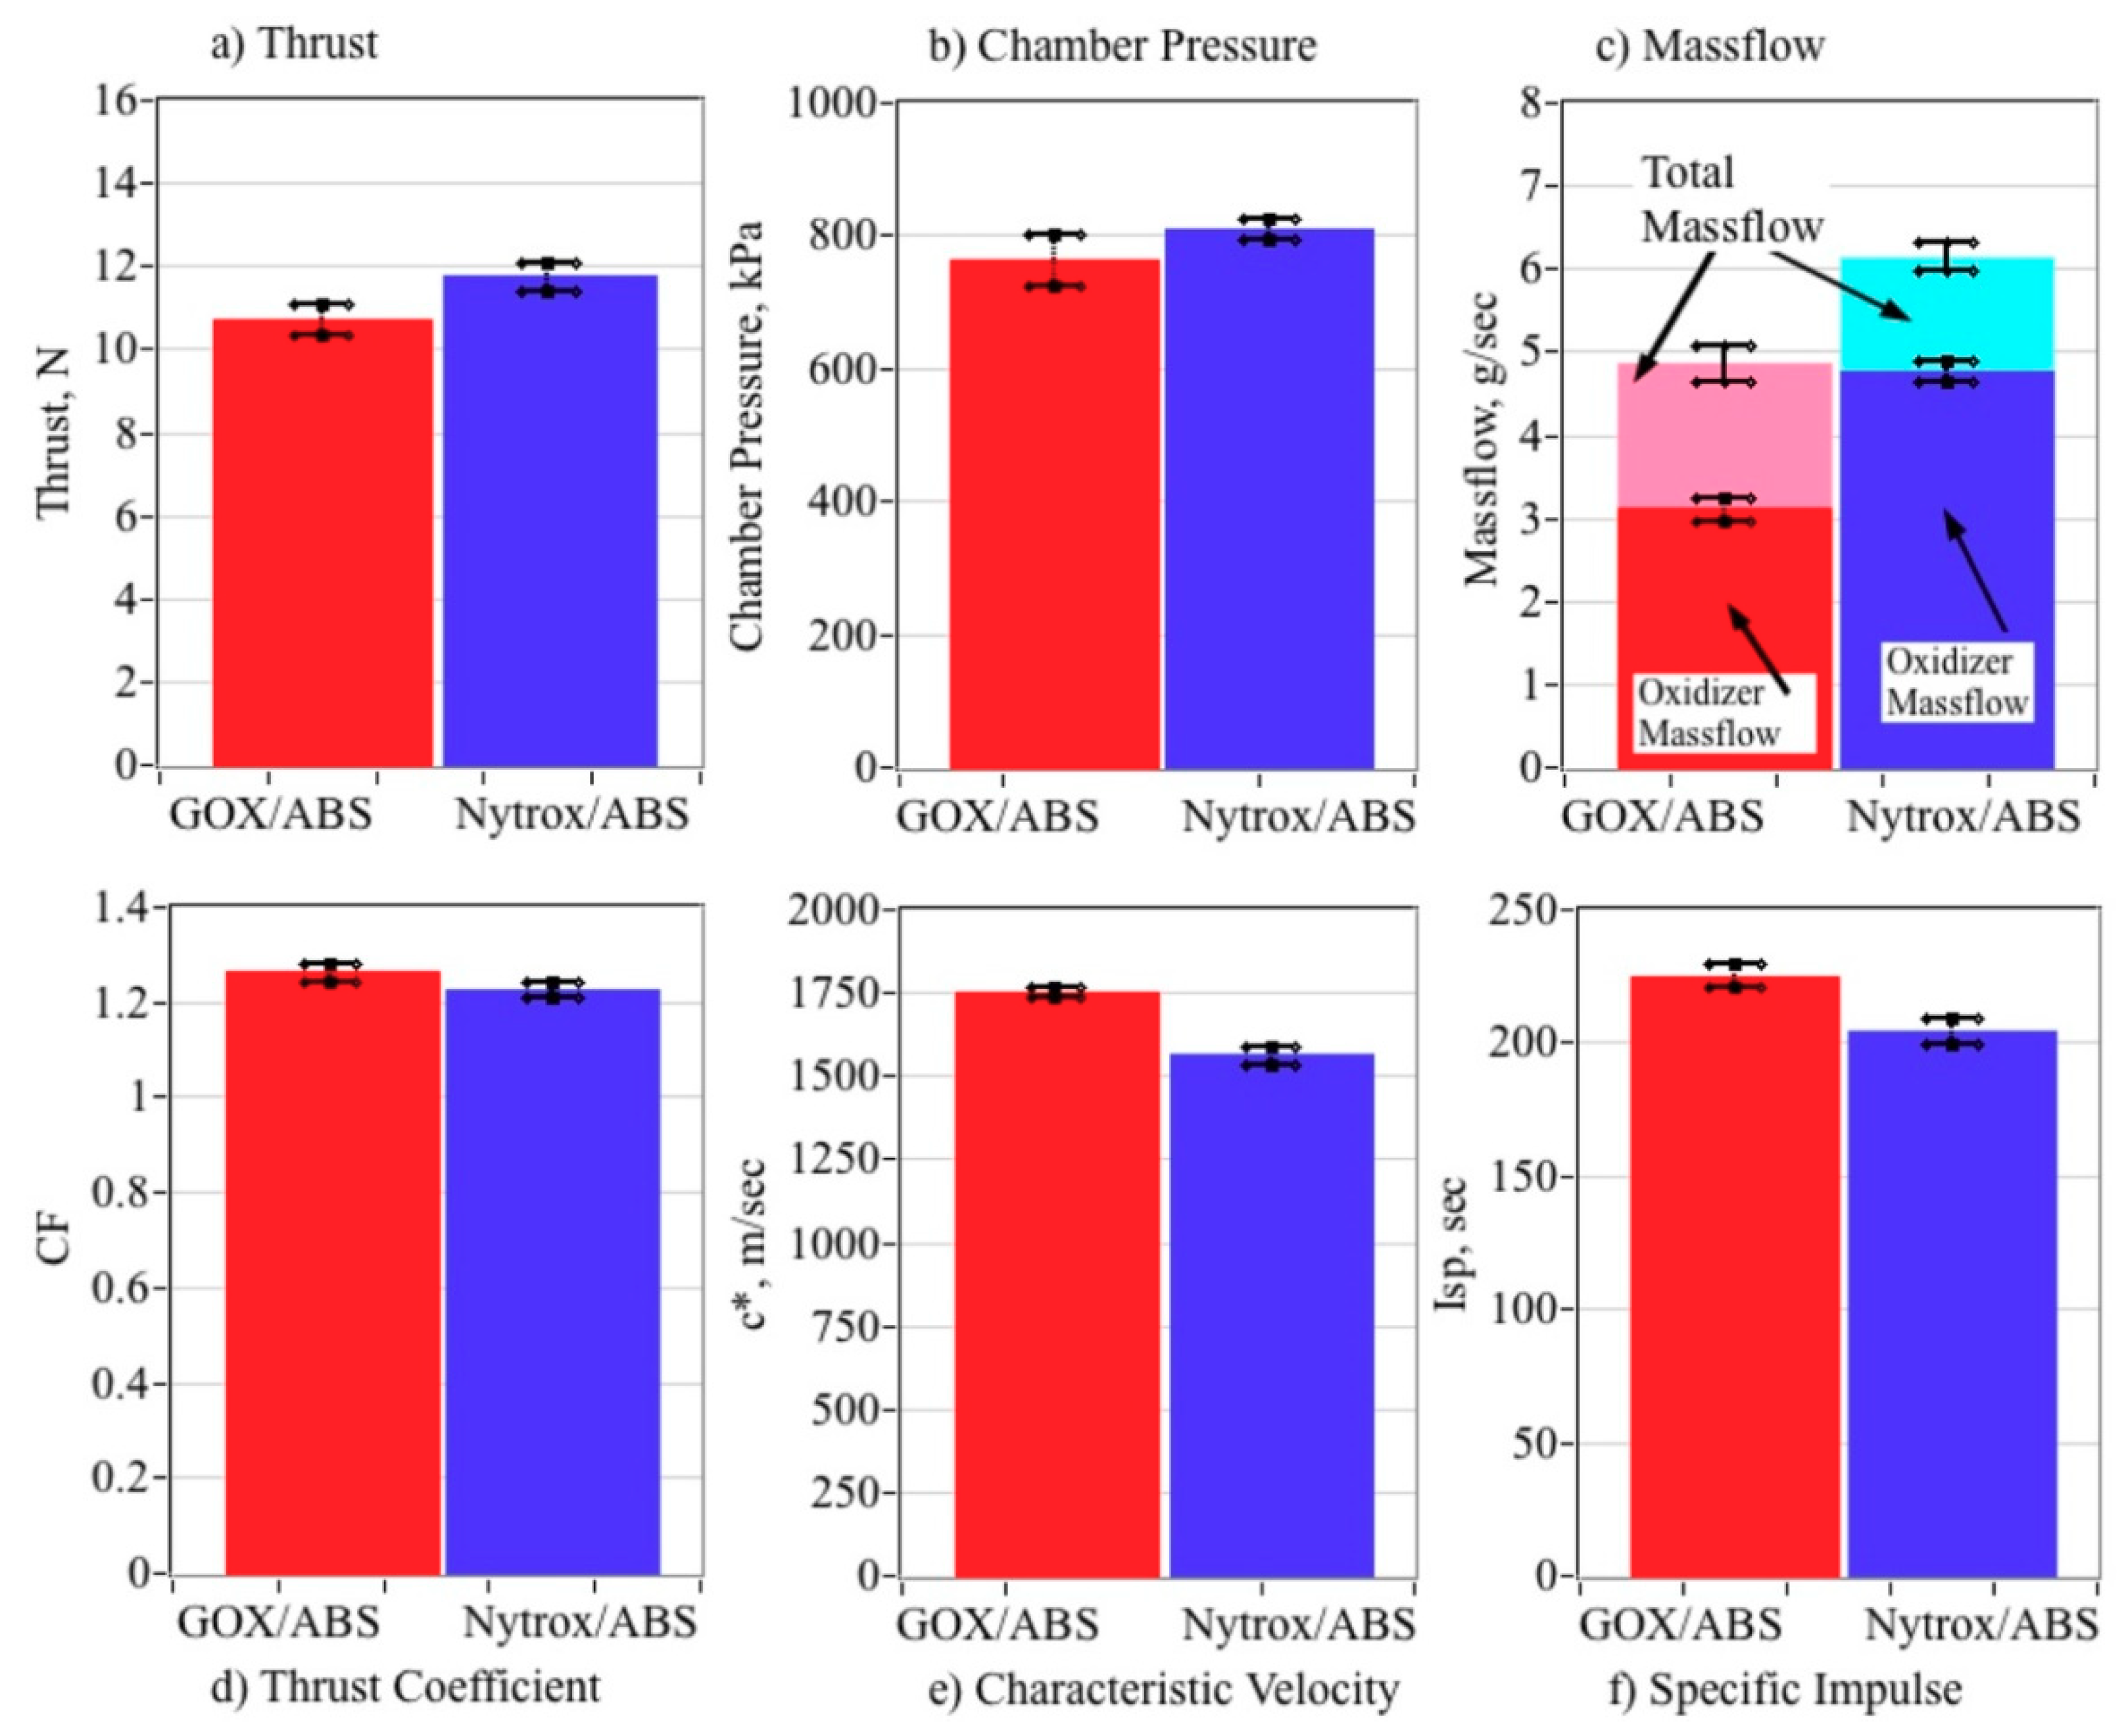
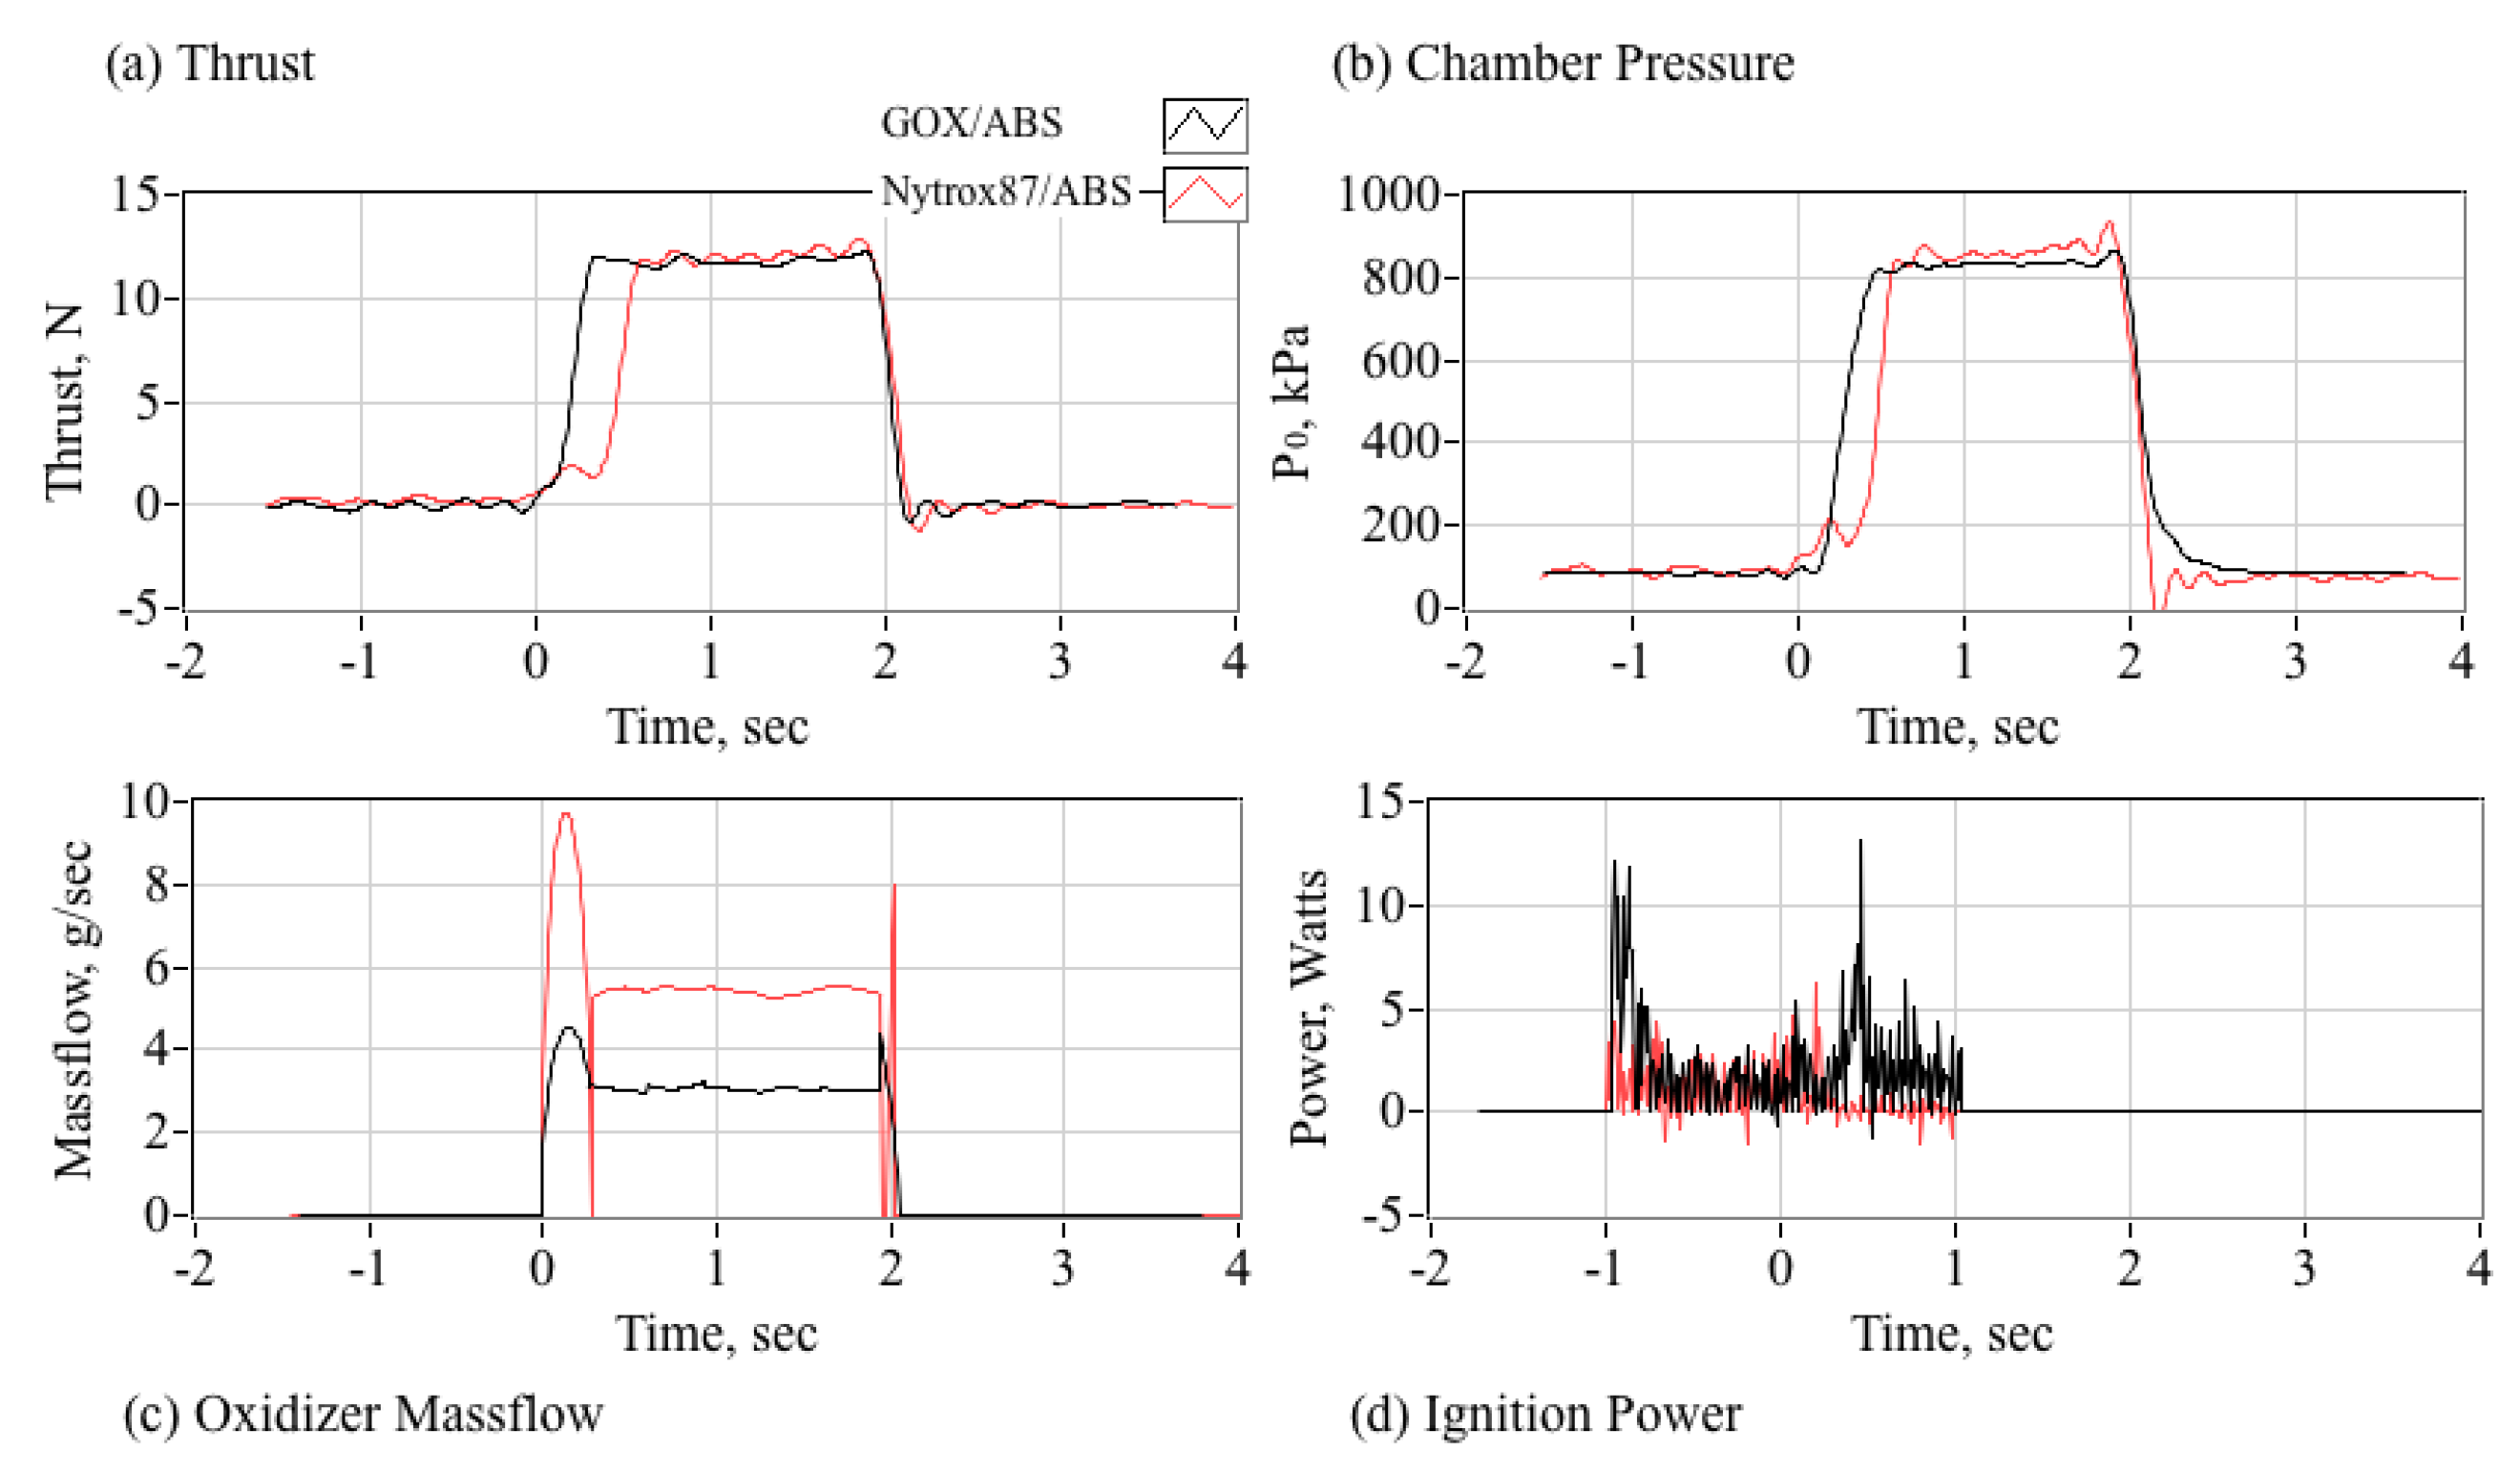
5.5.1. Top-Level Motor Performance Comparisons

This section presents a series of bar charts that compare the mean properties of the thruster as derived from the 13 GOX-baseline and 19 Nytrox-evaluation hot-fire tests. In addition to the nominal performance parameters as listed by Table 3, mass-derived parameters like equivalence ratio, regression rate, and impulse-density are also compared. Effects of massflux on fuel regression rate will be assessed. Finally, the required ignition energy and ignition latencies will be assessed and compared.
Figure 17 bar charts compare the actual thrust, mean operating chamber pressure, oxidizer and total mass flows, and performance parameters of the thruster using the two propellant classes. In addition to the mean parameter levels, these plots also show the 95% confidence intervals based on the student t-distribution [60] for the appropriate degrees of freedom (based on the number of measurements). As shown by Figure 17a–c the Nytrox oxidizer, inserted as a higher-density “drop in” for GOX results in slightly higher absolute thrust, chamber pressure, and mass flow levels. These higher absolute levels are due to the higher density of Nytrox 87 oxidizer, as compared to GOX.
Also, the mean values of the performance parameters CF, c*, and Isp, exhibit a slight-to-moderate reduction for Nytrox/ABS when compared to GOX/ABS. For example, as shown by Figure 17e,f the mean GOX/ABS Isp and c* values are 224.8 s and 1751 m/s, respectively, as compared to 204.4 s and 1561 m/s for Nytrox/ABS. This lowered performance results from two factors, the reduced optimal c* for Nytrox/ABS based on a lower flame temperature, and a less-than optimal O/F ratio for the Nytrox thruster. The first factor was previously predicted by the analytical comparisons of Figure 6, and was expected. The second factor can be corrected by slightly shortening the fuel grain length in order to better approach the optimal O/F ratio.

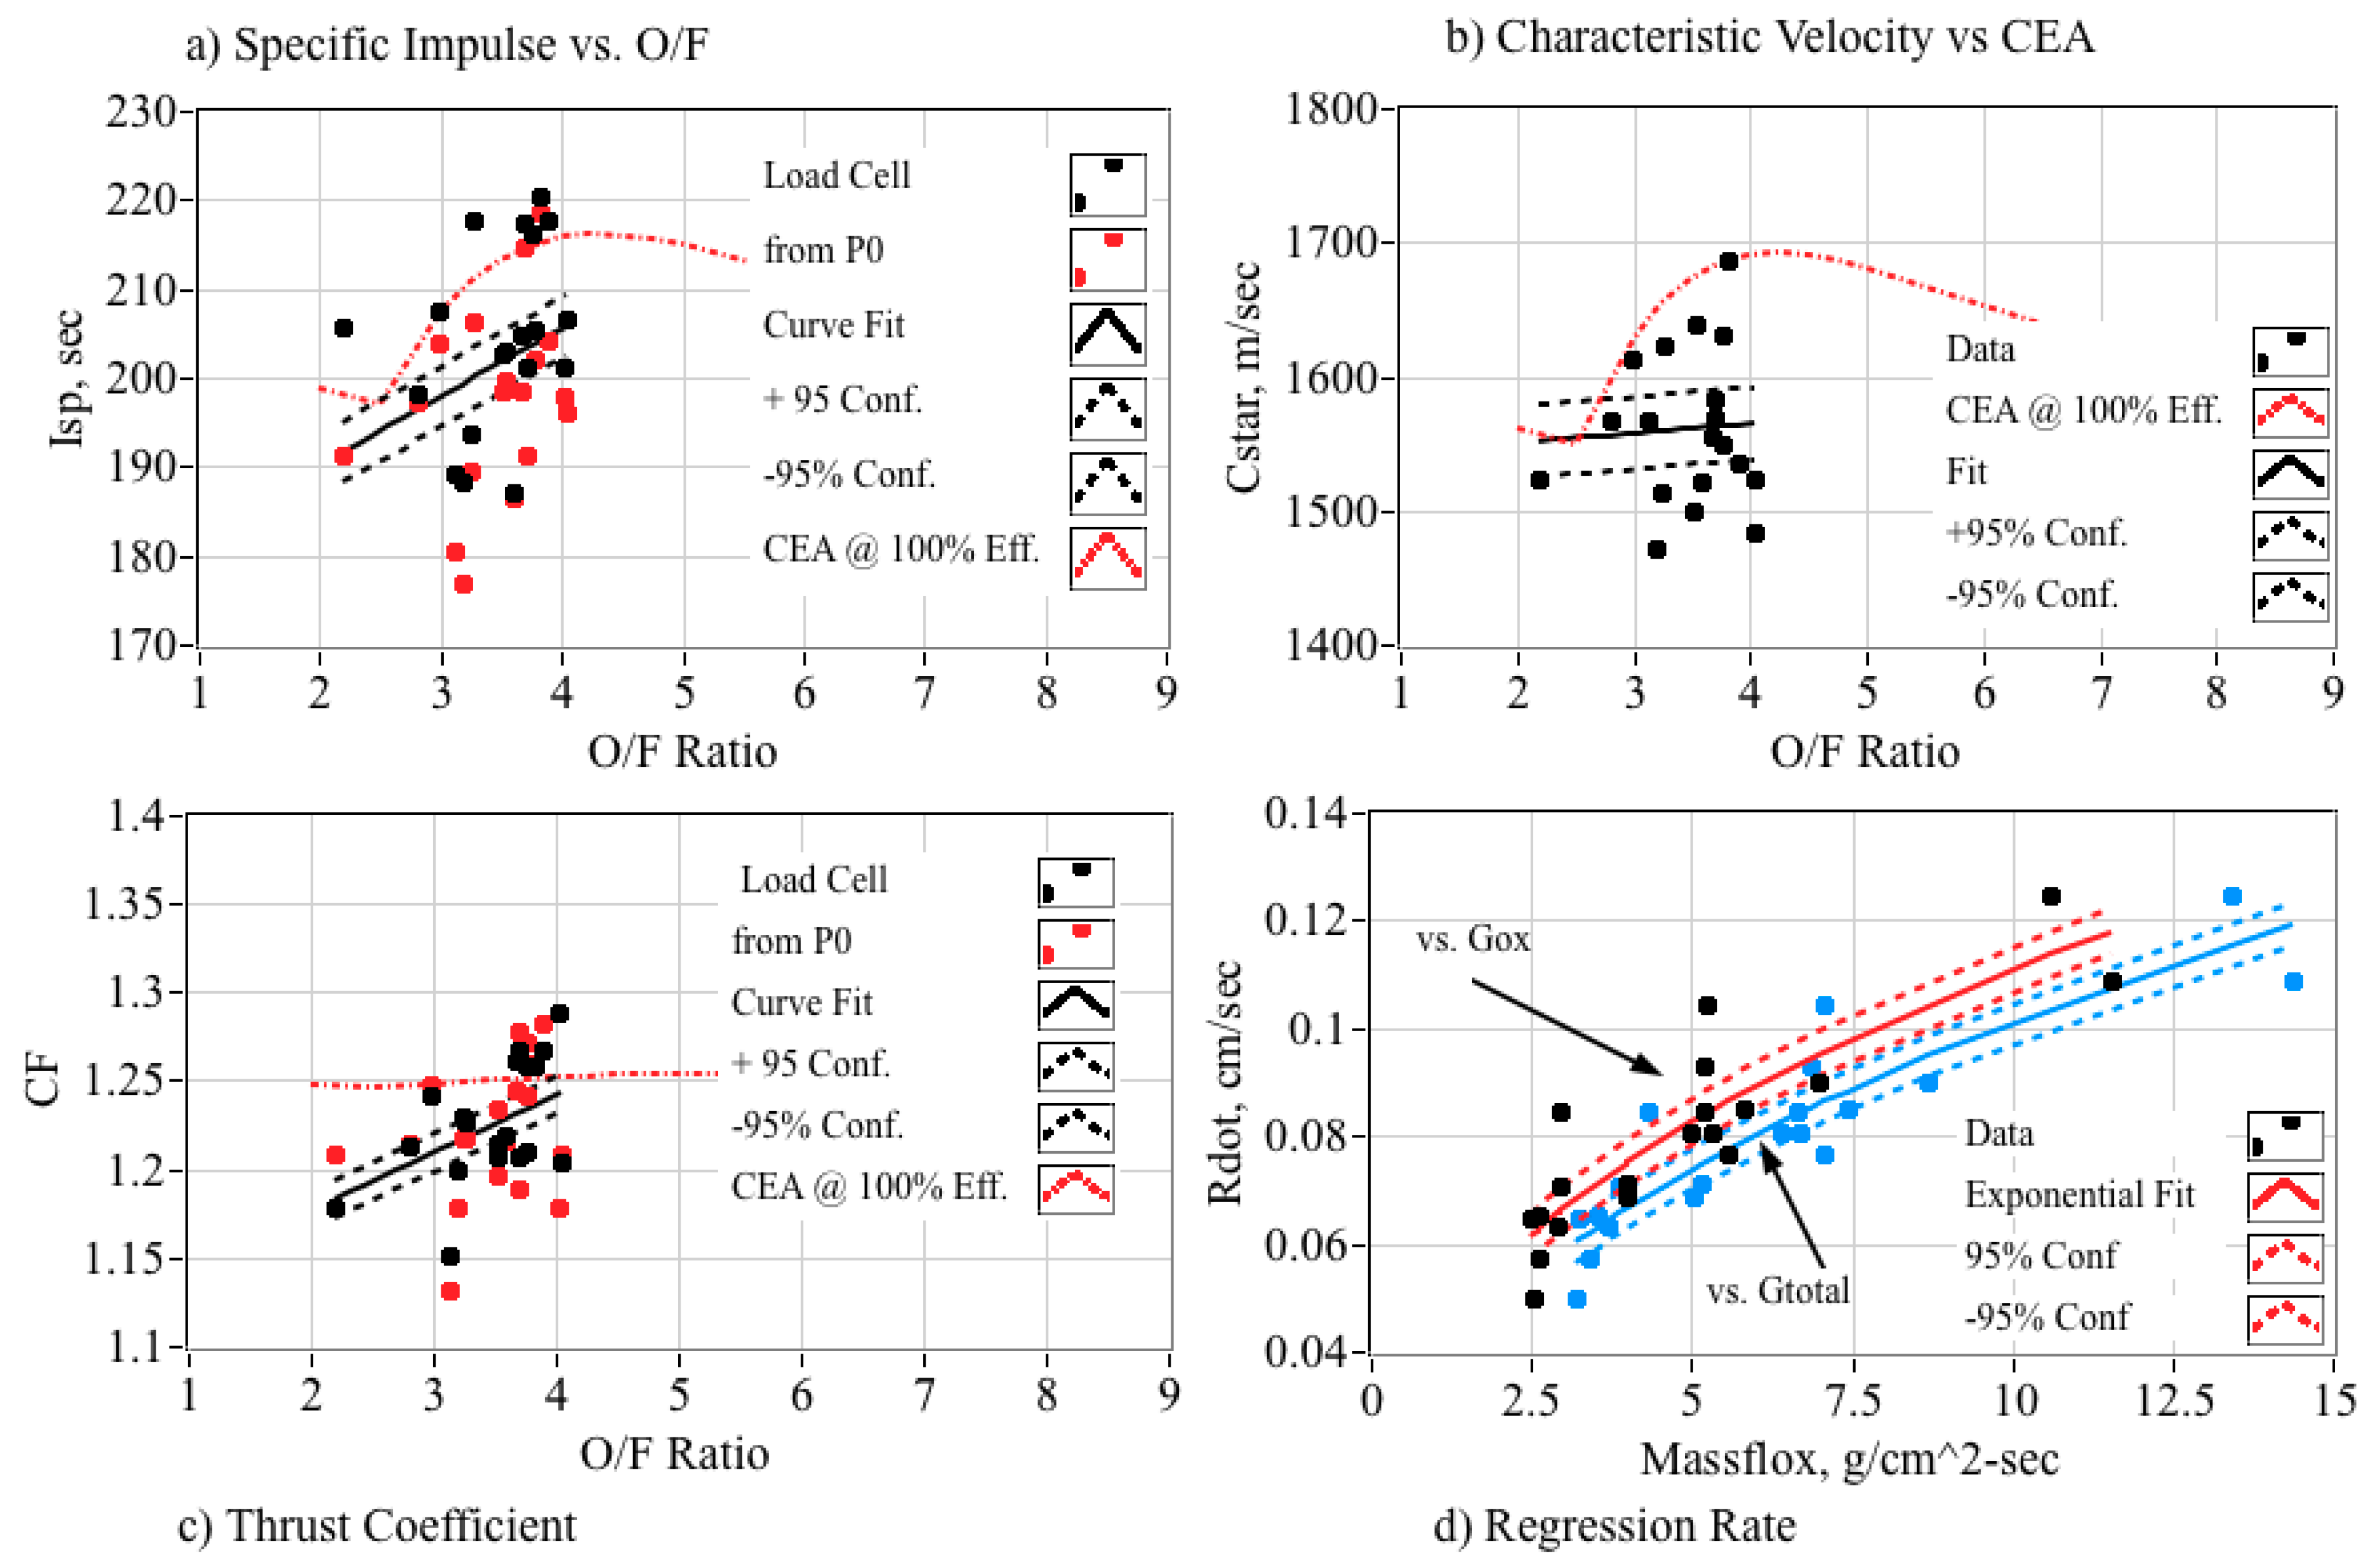
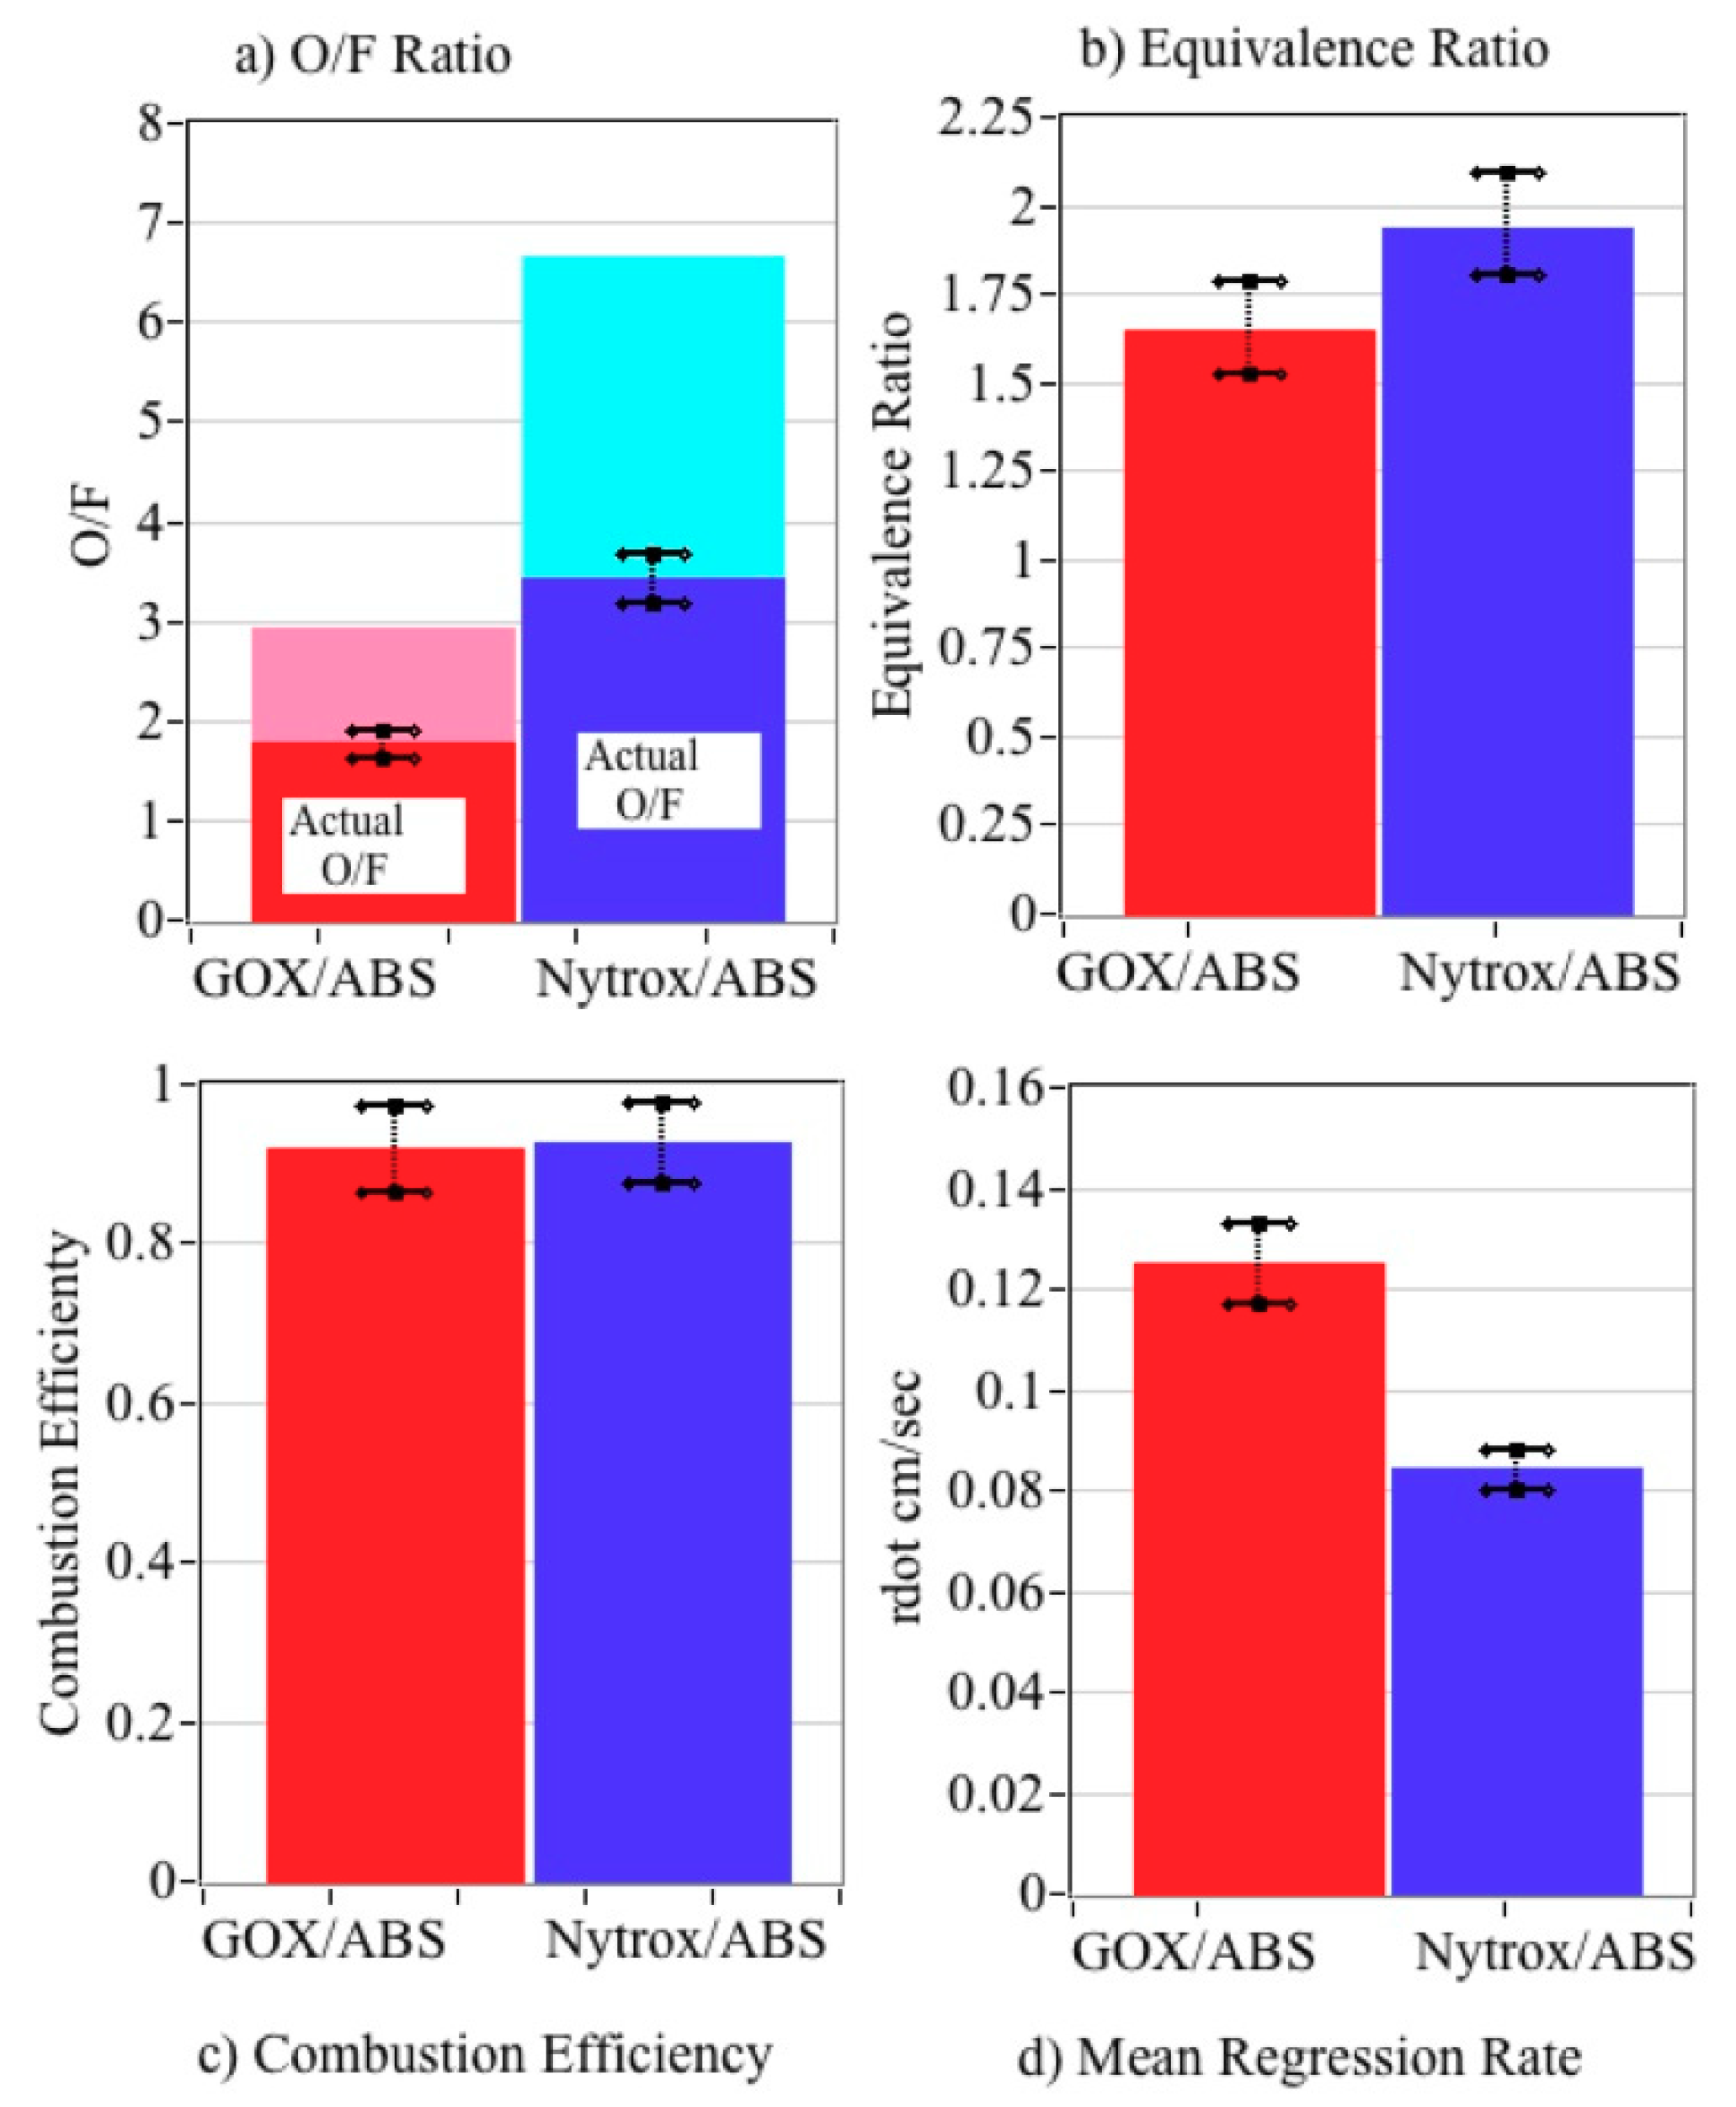
5.5.2. Comparing Combustion Properties

Figure 18 compares the mean oxidizer to fuel ratio O/F, equivalence ratio Φ (Equivalence ratio Φ is defined as the stoichiometric O/F divided by the actual O/F achieved during the burn), combustion efficiency η*, and mean regression rate γ ˙ ¯ of the thruster burned with the two classes of propellants. Note, as shown by Figure 13c and Figure 15c, that the Nytrox mass flows were 30% higher than the corresponding GOX mass flows, and the resulting O/F ratios are significantly higher for the Nytrox thruster. The higher O/F ratio for Nytrox also results from the lower overall fuel regression rates shown by Figure 14d and Figure 16d.
For both oxidizers the target equivalence ratio was between 1.5 and 2.0. Burning at these moderately fuel-rich equivalence ratios has the beneficial effect of reducing flame temperature, lowering nozzle throat erosion rate, and producing a plume with a lower molecular weight. The lowered molecular weight compensates for the reduced flame temperature, allowing an acceptable level of performance to be achieved. The fuel-rich equivalence ratios are a likely-reason why essentially no nozzle erosion was observed during this testing campaign.
Since, as shown by Figure 18b, both propellants burned at equivalence ratios between 1.5 and 2.0, the top-level design objectives were indeed achieved by these tests. The GOX/ABS thruster burned an equivalence ratio of approximately 1.65, and as shown by Figure 14a,b, the resulting O/F ratio tends to lie directly on top of the O/F ratio for maximum c*.
When Nytrox 87 GOX was swapped-in for GOX, the ensemble mean value for Φ is approximately 1.95. As shown by Figure 16a,b, the mean Nytrox/ABS burn condition is slightly richer that would be required to achieve optimal performance. Because this test series was designed to evaluate Nytrox as a “drop-in” for GOX, the fuel port geometry was not optimized for best performance, thus, the non-optimal c* is not a concern here. A simple method for optimizing the system for Nytrox would be to slightly shorten the fuel port, thus, the resulting O/F ratio towards leaner burning and back to near the optimal value.

5.5.3. Detailed Fuel Regression Rate Comparisons

Figure 19 presents the time-averaged, longitudinal-mean regression rates for GOX/ABS and Nytrox 87/ABS, overlaid with regression rate data for other propellant combinations. These data include previously collected by the Whitmore et al. (2013) [61] and Whitmore and Merkley [62] for pure N2O using HTPB (hydroxyl-terminated polybutadiene) and ABS as fuels. Power-law curve fits taken from Reference [63] for: (a) liquid oxygen (LOX)/paraffin, (b) LOX/HTPB, (c) N20/Escorez-HTPB, and (d) LOX/high-density-polyethylene (HDPE are also plotted.
The power-law curve fits take the form:
r ˙ = a G o x n
where Gox is the longitudinal mean of the oxidizer massflux, γ ˙ is the curve-fit dependent variable, and {a, n} are the burn parameters. The mean regression rate plotted on Figure 16d calculated by integrating the power-law curve fits for GOX/BS and Nytrox 87/ABS over the operating massflux range, in this case, 0–20 g/cm2·s:
r ˙ ¯ = a G o x max 0 G o x max G o x n d G o x = a n + 1 G o x n max
Table 4 summarizes the power-law fit parameters for the plotted curves on Figure 17. The Nytrox/ABS regression rates are moderately lower than result from GOX/ABS and LOX/Paraffin, a result that is primarily due to the reduced flame temperature and the associated heat transfer from the flame zone to the fuel surface. However, the resulting Nytrox87/ABS regression rates are clearly higher to N2O as a stand-alone oxidizer. The higher regression rate will lead to a reduced fuel grain length in order to achieve and equivalent fuel mass flow rate. This volumetric reduction offsets the loss in overall system density that derives from the switch to Nytrox from N2O.
Also of note, for both propellant combinations GOX/ABS and Nytrox/ABS the burn exponents are close to a value of n = 0.5. As noted by Zilliac and Karabeyoglu (Reference [56]), a hybrid-burn exponent of 0.5 corresponds to a propellant combination with essentially no O/F shift over the burn lifetime. This numerical calculation agrees well with the test observations, where very little O/F shift was noted for this small thruster system. Ref. [62] explain this neutral burn profile as a balance between convective and radiative heat transfer in the combustion chamber. In small thruster systems of this size, radiation heating is no longer negligible and tends to compensate for the drop off in convective heat transfer as the fuel burns and the port opens up.

5.5.4. Volumetric Efficiency Comparisons

In contrast to the mass-based Isp comparisons that favor the performance of the GOX/ABS propellants, the Nytrox/ABS propellants exhibit a significantly higher impulse density. The bar charts of Figure 20 show these comparisons. Plotted are effective specific gravity in Figure 20a and measured impulse density at ambient conditions in Figure 20b. Based on the Nytrox liquid storage density at 86 atmospheres (from Peng–Robinson model) and 0 °C, as compared to the GOX storage density at 150 atmospheres (from ideal gas law), and the ABS Fuel density of 1.04 g/cm3, the respective specific gravities are 0.842 and 0.512, with ambient density impulses of 1710 and 1174 N·s/L. Thus, the Nytrox/ABS propellants exhibit at least a 45% increase in volumetric efficiency when compared to GOX/ABS.

5.5.5. Extrapolating the Specific Impulse to Vacuum Conditions

Recall that the specific impulse values plotted on Figure 14, Figure 16, and Figure 17 were derived from data collected under ambient test conditions at approximately 4700 ft. (1430 m) altitude, the elevation of the test facility in Logan Utah. The 2.07:1 nozzle expansion-ratio was designed to give near-optimal performance at this altitude, and the desired operating chamber pressure. Clearly, when matched with a high expansion-ratio nozzle, the vacuum performance will be significantly better. The ambient-test data can be extrapolated to altitude using the previously presented 1-D de Laval flow equations. (Anderson, Reference [49]) First, the thrust coefficient for the test condition is written in terms of the nozzle-exit-to-chamber pressure ratio, and the freestream-to-chamber pressure ratio:
C F t e s t = γ 2 γ 1 ( 2 γ + 1 ) γ + 1 γ 1 ( 1 p e x i t P 0 ) γ 1 γ + ( A e x i t A * ) ( p e x i t p P 0 )
For optimal operating conditions, the pressure thrust term of Equation (18) vanishes and the ratio of the optimal and test CF’s is used to scale specific impulse to the optimal condition:
I s p o p t I s p t e s t = ( P 0 A * g 0 m ˙ ) C F o p t ( P 0 A * g 0 m ˙ ) C F t e s t = 1 1 + ( A e x i t A * ) ( p e x i t p P 0 ) 2 γ 1 ( 2 γ + 1 ) γ + 1 γ 1 ( 1 p e x i t P 0 ) γ 1 γ
Using the motor geometry, thrust coefficient, mean chamber pressure, and the CEA-derived calculations for Nytrox 87/ABS, and assuming a 92.5% combustion efficiency, from Figure 18c, Figure 21 plots the specific impulse extrapolations for GOX/ABS and Nytrox 87/ABS. For both propellant combinations, using the data of Figure 14 and Figure 16, the plotted parameters are: (a) optimal expansion ratio as a function altitude, (b) optimal CF as a function of the optimal expansion ratio, (c) optimal Isp as a function of expansion ratio, and (d) optimal impulse density as a function of altitude. Also plotted as the red and blue symbols are the actual experimental values for the GOX/ABS and Nytrox 87/ABS motors. The GOX/ABS data extrapolates to an Isp of greater than 345 s under vacuum conditions, while the Nytrox/ABS data extrapolates to just over 300 s. This Isp value, although 8% lower than for GOX/ABS, is still nearly 25%–30% higher than can be achieved by any of the “green” ionic liquid propellants or by hydrazine. Using a similar process to scale the impulse density, the corresponding optimal vacuum ρIsp values are 1,590 N·s/L for GOX/ABS, and 2510 N·s/L for Nytrox 87/ABS. These values will be compared to Hydrazine and the ionic liquid propellants later in this report.

5.5.6. Required Ignition Energy

One of the key objectives of this research campaign was to demonstrate that Nytrox, can be “dropped in” as a replacement for GOX, but still function effectively with the previously-matured arc-ignition system. In that regard, the arc-ignition system was effective in igniting the Nytrox/ABS propellants, but did exhibit several minor issues that must still be overcome for an operation system. When a virgin-fuel grain is first burned with Nytrox, the observed ignition reliability was only about 50%. “Setting” the arc path by first burning the grain using GOX, or by using a GOX pre-lead prior to initiating Nytrox flow overcame this problem. Once the first ignition is achieved, then the system reliably ignites using Nytrox, even with a dead-cold motor. The reason for this observed behavior appears to be that Nytrox expansion into the combustion chamber super-chills the ABS fuel, causing the surface impedance to increase to a point where the HVPS cannot provide sufficient power to pyrolize a conduction path through the material. Once a conduction path is set into the fuel material after the initial burn, then this issue goes away.
The data presented in Figure 22 supports this assertion. Here the required ignition energy is plotted as a function of the cumulative fuel grain burn lifetime. These data were taken from the burns plotted on Figure 14 and Figure 16. Recall from the previous discussion of Section 2.3 that the HVPS is current limited at 30 mA, and the output voltage is a function of the impedance path that the arc carves along the material surface. Total ignition energy is calculated as the integral of the output power. The HVPS output power is calculated as the product of the voltage and current-sense readings. Figure 22a plots the ignition energy for GOX/ABS propellants, and Figure 22b plots the ignition energy for Nytrox/ABS as a function of cumulative burn time for the fuel grain. The first two points on Figure 22b, near zero burn lifetime, were obtained from successful Nytrox tests of two previously unburned fuel grains without the GOX pre-lead. Both of these point show a considerably higher ignition energy requirement. The remaining lower ignition energy data points plotted on Figure 22b were obtained from fuel grains that had been initially burned using a GOX pre-lead. For both GOX/ABS and Nytrox/ABS, the ignition energy correlates directly with burn time, indicating that the arc-path becomes better established, and the impedance drops following each ignition.
Once the path is set, the required ignition energy is similar for both oxidizers. The bar chart of Figure 23 compares the mean ignition energies for GOX/ABS and Nytrox 87/ABS, calculated from the data presented in Figure 22, but with the virgin-grain Nytrox burns excluded. Both systems have a mean startup energy less than 2.5 joules, and to a 95% confidence level, neither require more than 4 joules for ignition (excluding the virgin-grain data). This energy level is contrasted to the ECAPS Prisma spacecraft [60] which used the ADN-based LMP-103s green propellant. For first ignition, this system required a 10 watt preheat for as long as 20 min, consuming more than 12,000 joules of energy.

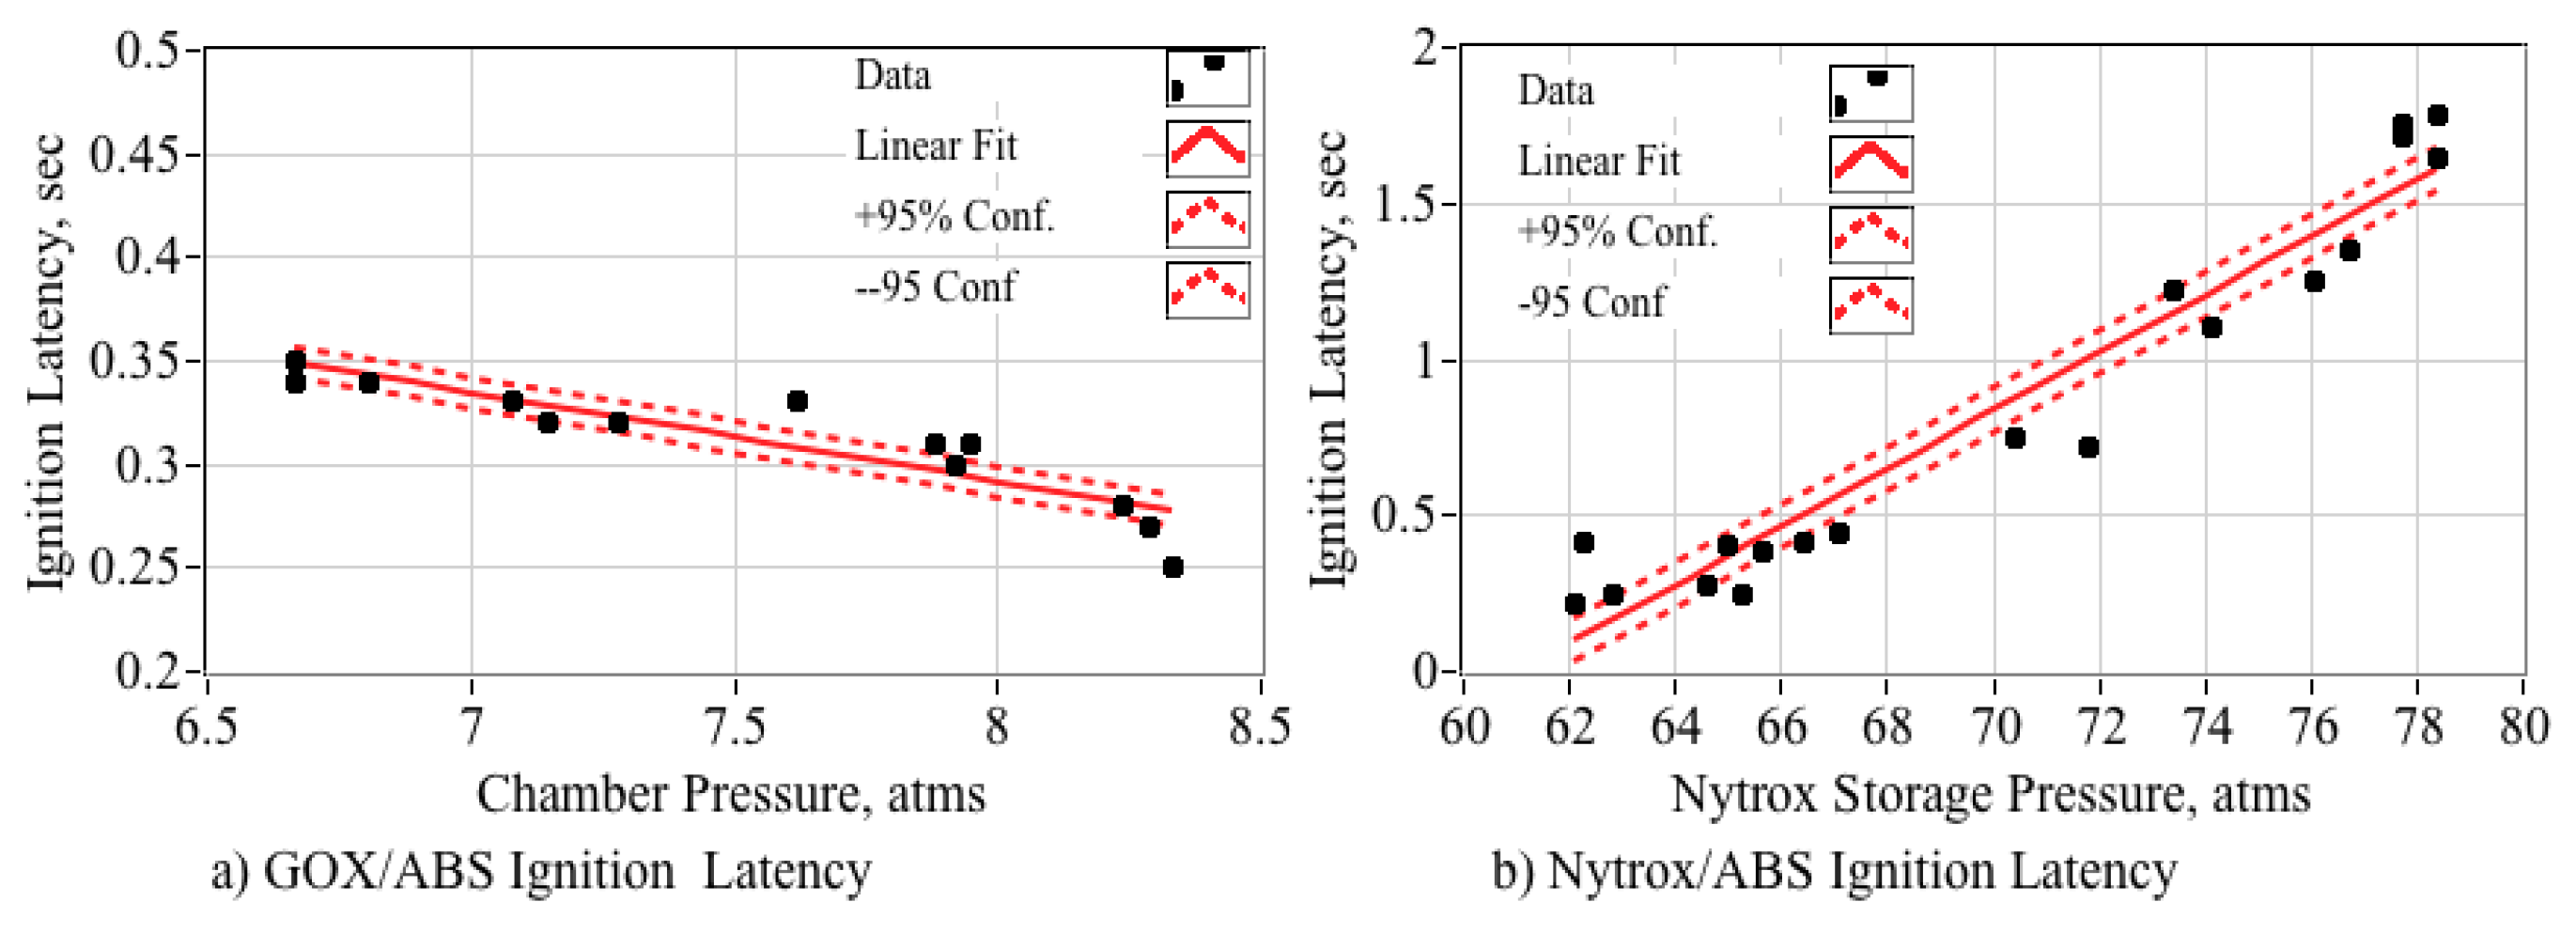
5.5.7. Ignition Latency

Substituting Nytrox 87 for GOX in the 10-N thruster system, resulted in significant increase in ignition latency. Figure 24 illustrates this phenomenon. Plotted are time histories demonstrating the typical ignition behaviors for a 2-s pulse of the thruster system using first GOX/ABS, and then Nytrox 87/ABS. Plotted are: (a) thrust, (b) chamber pressure, (c) oxidizer mass flow, and (d) ignition power. Note that for both runs the ignition power profiles for both conditions are quite similar, but the chamber responses are significantly different. As shown by the mass flow data of Figure 24c, after opening the oxidizer valve flow into the combustion chamber is almost immediate. While the GOX/ABS motor lights and reaches within 63.2% of full operating pressure within about 150 milliseconds, the Nytrox/ABS Motor exhibits a more significant startup latency, in this example, an additional 250 ms.
Over the burn lifetime of the fuel grains, the Nytrox/ABS propellants exhibit mean ignition latencies that are significantly larger than for GOX-ignition. It is hypothesized that the rapid expansion and subsequent phase change super-chills Nytrox fluid entering the combustion chamber. The very cold Nytrox reduces the pyrolysis rate of the fuel material and absorbs some of the spark energy. The result is a result in a slowed ignition process. The bar chart of Figure 25 shows this latency comparison.
The additional latency exhibited by the Nitrox/ABS propellants occurred for all of the test runs, and appears to be endemic to the use of Nytrox as a hybrid oxidizer. Figure 26 compares the observed ignition latencies, calculated as the 63.2% first-order response rise time, for GOX/ABS and Nytrox 87/ABS. The GOX-ignition latency of Figure 24a correlates with the combustion chamber pressure, whereas the Nytrox-ignition latency of Figure 26b correlates strongly with the NOS® (Nytrox) run-tank pressure. The trend is very distinctive with the latency growing from only about 250 ms at the original tank pressure and temperature, to greater than 1.7 s at the highest internal tank pressures.
At first glance the behaviors exhibited by Figure 25 and Figure 26 appear to be quite odd, but upon further examination, it becomes clear that the Nytrox latency trend results from the two-phase binary-mixture properties, and the concentration of oxygen in solution. Clearly for GOX-ignition the thruster chamber pressure is a key influence. With higher chamber pressures allowing nozzle to choke faster and build the internal oxygen partial pressure to greater than the observed critical value of 2 atmospheres (from Reference [24]) more rapidly.
In contrast, it appears that the observed latency trend of Figure 26b results from the O2 mass concentration in the Nytrox solution. As described previously in Section 3.1, for a typical test the Nytrox run tank was chilled to 0 °C in an ice bath while filling. After the Nytrox is blended at the desired density manufactured, the filled run tank is stored at −15 °C to keep vapor pressures lower for safe storage. During testing the tank is removed from the freezer and gradually warms to the ambient temperature conditions.
The previously-described Peng–Robinson model [43] is used to analyze the quantitative effect of the rising tank temperature upon the Nytrox oxygen concentration. Assuming that the total molar volume remains constant, then as the tank warms from an initial temperature and pressure {Pinit, Tinit} to a higher temperature Tfinal, then the corresponding pressure rise is calculated from the real gas equation of state:
1 ν = 1 ν v + 1 ν l = ( 1 Z v + 1 Z l ) P R u T
where the parameters ν and Z refer to the molar volume and compressibility factor, and the indices “l” and “v” refer to the vapor and liquid phases, respectively. For the purposes of this discussion, the compressibility factor is a measure how much the fluid properties deviate from an ideal gas. Since the molar volume is constant, then from the initial-to-final state:
( 1 Z v + 1 Z l ) i n i t P i n i t T i n i t = ( 1 Z v + 1 Z l ) f i n a l P f i n a l T f i n a l
Solving for the final pressure level:
P f i n a l = ( T f i n a l T i n i t ) ( 1 Z v + 1 Z l ) i n i t ( 1 Z v + 1 Z l ) f i n a l P i n i t
and the equilibrium solution at the final pressure is the state vector {P, T, Zv, Zl}final whose values are consistent with the Peng–Robinson model.
Figure 27 plots this numerical solution assuming a starting temperature and pressure of −15 °C (the Nytrox storage temperature) and 62 atm. The solution then warms up to a peak temperature of 35 °C. Plotted are: (a) the original latency data, (b) the Nytrox phase-equilibrium pressure as a function of temperature, (c) the O2 mass concentrations in the vapor and liquid phases as a function of solution temperature, and (d) the O2 mass concentrations in the vapor and liquid phases as a function Nytrox phase-equilibrium pressure. Note, as the tank warms, the pressure rises to 68 atmospheres at 0 °C (the optimal operating point) and then peaks at around 79 atmospheres at room temperature, or approximately 25 °C. This calculated maximum pressure agrees well with the maximum pressure observed in Figure 24a. Thus, the rising tank pressure correlates with a diminishing mass of oxygen in solution.
As plotted in Figure 27c,d, note that O2 mass concentrations drop rapidly as the solution warms. Eventually nearly all of the oxygen comes out of solution leading to a pure nitrous oxide liquid phase and stratified O2 and N2O vapor phases. Since oxygen is the lighter of the gasses, it would occupy the upper portion of the tank ullage. Thus, at the higher tank pressures of the warm tank, it appears that almost no O2 reaches the injector during the initial ignition stages. It appears that this phenomenon makes ignition increasingly more difficult, and it takes longer for the oxygen concentration to build to the critical level for ignition.
The results presented by Figure 26 and Figure 27 were discovered only shortly before the publication of this paper, and have not been fully explored. Clearly, Nytrox response latencies have not been fully characterized at this point been, and are recommended as a point of emphasis for further study. A dedicated experiment with wider pressure and temperature ranges, and a range of initial saturation levels is proposed. When completely comprehended, it appears that super-chilling the Nytrox solution may be an effective engineering practice for reducing the observed ignition latencies using Nytrox.

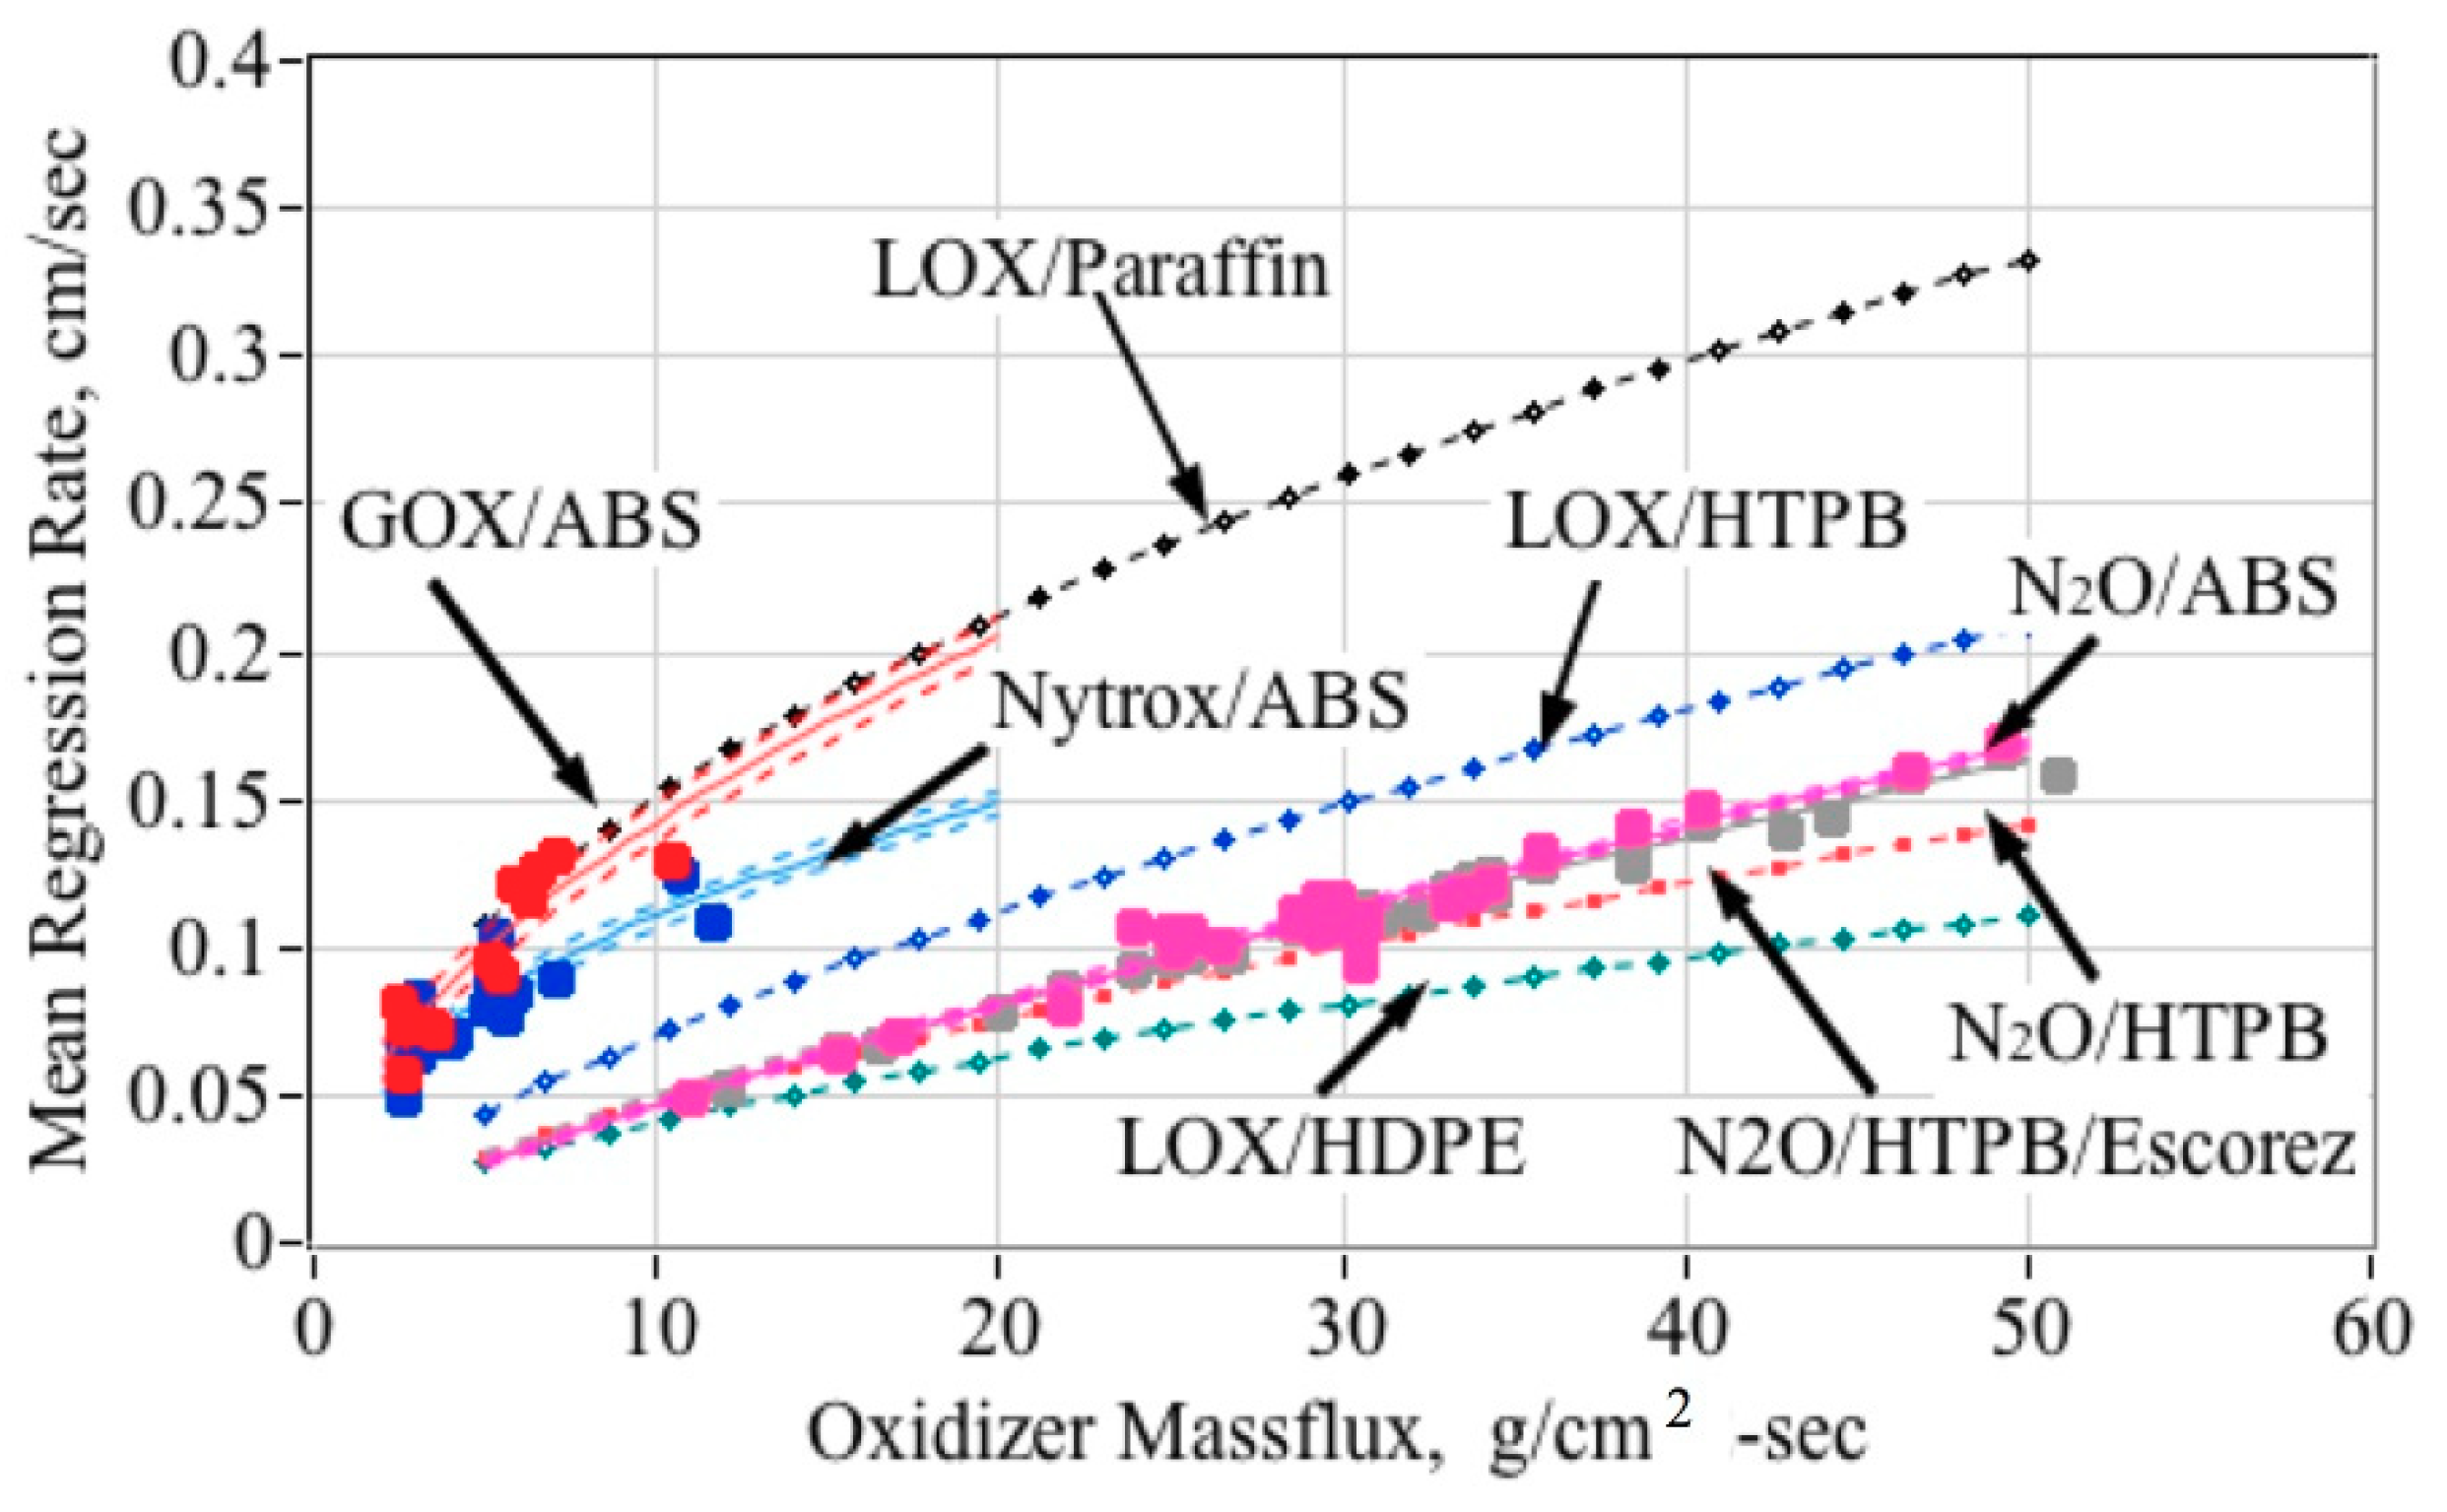
5.6. Comparing Nytrox to Existing Space Mono-Propellants

With 19 successful hot-firings reported in this paper, Nytrox 87 has been demonstrated as a reliable on- “drop-in” replacement for GOX in the HPGHP thruster system. Table 5 compares the performance of the Nytrox/ABS system to the competing propellants: hydrazine, LMP-103S, and AF-M315-E. In Table 5 the data for Hydrazine and AF-M315E were extracted from Refs. [14] and [17]. Data for LMP-103S were extracted from Refs. [16] and [18]. Data for the Nytrox/ABS Hybrid System were extracted from Section 5 of this paper, and also from Ref. [1].
With the exception of impulse density, the Nytrox/ABS system outperforms the other propellants in every listed category. Even the lower ρIsp value is a bit misleading. Because Nytrox had the ability to safely self-pressurize, there is no need for an additional volumetrically inefficient oxidizer pressurization system. The absence of this secondary system significantly decreases the overall system complexity, and leads to a clear advantage in volumetric efficiency. Due to the high pyrolysis energy of ABS fuel, 3.1 MJ/kg, the HPGHP motors are ablative and self-cooling, offering a final systems advantage.

6. Summary and Conclusions

Over the past decade, a novel High-Performance “Green” Hybrid Propulsion (HPGHP) system has been developed as an environmentally sustainable replacement for hydrazine, and other highly-toxic spacecraft propellants. HPGHP is enabled by recent advances in 3-D printing and leverages unique electrical breakdown characteristics of printed plastics like ABS and polyamide. Additive manufacturing changes the electrical breakdown properties, and when printed materials are presented with a sufficiently high, low-current voltage, electrical-arcing along the layered surface pyrolizes material and seeds combustion when an oxidizing flow is introduced. The system has been engineered to a high level of reliability with the number of possible ignitions limited only by the amount of fuel. Typical startup sequences require less than 2 joules, and once started, the system can be sequentially fired with no additional energy inputs required.
In its most mature form, HPGHP uses gaseous oxygen as the oxidizer. Although gaseous oxygen is highly mass efficient, it is volumetrically inefficient due to its low specific gravity unless stored at very high pressures. In order to increase the HPGHP system volumetric efficiency, a two-phase blend of nitrous oxide and oxygen, “Nytrox,” has been engineered as a higher-density “drop-in” replacement. Nytrox is similar to “laughing-gas” used for anesthesia applications and is blended by percolating oxygen under pressure into N2O until the solution reaches saturation.
With 19 successful hot-firings reported in this paper, results from the preliminary test-and-evaluation campaign have demonstrated Nytrox as an effective replacement for GOX in the HPGHP system, exhibiting a slightly reduced specific impulse, but with significantly higher volumetric efficiency. Vacuum specific impulse values exceeding 300 s are reported. This Isp is significantly greater than can be achieved by hydrazine or the current generation of “green” propellants based on ionic-liquids, LMP-103S and AF-M315E. Because Nytrox had the ability to safely self-pressurize, there is no need for an additional volumetrically inefficient oxidizer pressurization system. This characteristic significantly decreases the overall system complexity.
The primary issue associated with using Nytrox a replacement for GOX as a hybrid oxidizer is a significant increase in the cold-start ignition latency. Presented data and supporting analysis shows that the higher Nytrox latency correlates strongly with the run tank storage temperature and pressure, and the mass fraction of oxygen in the Nytrox solution. Because of the reduced oxygen levels at warmer temperatures, it takes longer for the combustion chamber oxygen concentration to build to the critical level required for ignition. It appears that super-chilling the Nytrox solution may be an effective engineering practice for reducing the observed ignition latencies using Nytrox. Clearly, these Nytrox response latencies have not been fully characterized, and are recommended as a point of emphasis for further study.

7. Patents

Whitmore, Stephen A., “Restartable Ignition Devices, Systems, and Methods Thereof,” USA Provisional Patent No. US 2015/A0322892 A1, 12 November, 2015.

Funding

This work was partially funded with a cooperative agreement with the NASA Marshall Spaceflight Center, Cooperative Agreement No. NNM16AA01A.

Acknowledgments

The author is especially grateful for the assistance of NASA Marshall Space Flight Center (MSFC) ER-23, by graciously provided access to the testing facilities used to collect vacuum chamber data for this project. I deeply appreciate MSFC employees Kevin Pedersen, Carlos Diaz, and Daniel Cavender for their time, technical support, and expert advice.

Conflicts of Interest

The author declares no conflict of interest.

Nomenclature

Symbols
Acabfuel port cross-sectional area, cm2
Aexitabnozzle exit area, cm2
A*abcross sectional area at which local flow chokes, cm2
A1abVenturi inlet area, cm2
A2abVenturi throat area, cm2
Aexit/A*abnozzle expansion-ratio
Cdabdischarge coefficient
CFabthrust coefficient
c ¯ F abtime averaged thrust coefficient
c*abcharacteristic velocity of propellants, m/s
Eaabactivation energy for self-sustaining decomposition reaction, kJ/kg
Eacabactivation energy for contaminated solution, kJ/kg
Eaabreduction of energy of activation due to catalysis or hydrocarbon contamination, kJ/kg
Eiabminimum energy required to initiate a deflagration wave in Nytrox mixture, J
Eifabignition energy amplification factor
Fabthrust, N
Goxaboxidizer massflux, g/cm2·s
Gtotabtotal massflux, g/cm2·s
g0abnominal acceleration of gravity, 9.8067 m/s
Habenergy of reaction, kJ/kg
Ispabspecific impulse, s
Lportabfuel grain length, cm
Mwabmolecular weight, g/g-mol
Mfuelabconsumed fuel mass, g
Moxlabconsumed oxidizer mass, g
mflueabfuel mass flow, g/s
moxaboxidizer mass flow, g/s
mtotalabtotal mass flow through the nozzle, g/s
O/Faboxidizer/fuel ratio
O/Factualabactual oxidizer-to-fuel ratio
O/Fstoichabstoichiometric oxidizer-to-fuel ratio
O/Fabtime-averaged oxidizer-to-fuel ratio.
P1abVenturi inlet pressure, psia
P2abVenturi throat pressure, psia
P0abchamber pressure or oxidizer flow stagnation pressure, psia
pexitabexit plane static pressure, psia
pabambient pressure, psia
Rgabgas constant, J/kg-K
Ruabuniversal gas constant, 8314.4612 J/kg-mol-K
rLablongitudinal average of the fuel port radius, cm
r0abinitial fuel port radius, cm
r ˙ L ablongitudinal mean of fuel regression rate, cm/s
r ˙ ¯ abmean regression rate over burn duration, cm/s
r ˙ abdependent variable for regression rate as fit by power-law curve, cm/s
sgabspecific gravity with respect to weight of water.
T0abstagnation temperature, K
tburnabburn time, s
tabgeneric time symbol, s
Zabcompressibility factor
μabmean value
η*combustion efficiency
γabof specific heats
Θabequivalence ratio
ρuelabsolid fuel density, g/cm3
ρIspabimpulse density, N·s/L standard deviation
Acronyms
ABSabAcrylonitrile Butadiene Styrene
ADNabAmmonium Dinitramide
AF-M315EabHAN Based Ionic Liquid Green Propellant
AFWLabAir Force Weapons Lab
ECAPSabEcological Advanced Propulsion Systems
ESTECabEuropean Space Agency Space Research and Technology Center
FDMabFused Deposition Modeling
GOXabGaseous Oxygen
GPIMabGreen Propellant Infusion Mission
HANabHydroxylamine Nitrate
HDPEabHigh Density Polyethylene
HPGHPabHigh-Performance “Green” Hybrid Propulsion
HTPBabHydroxyl-Terminated Polybutadiene
HVPSabHigh Voltage Power Supply
ILabIonic Liquid
LMP-103SabADN-Based Ionic Liquid “Green” Propellant
NOS®abNitrous Oxide Systems (Trademark)
P&IDabPiping and Instrumentation
TRLabTechnology Readiness Level
TTLabTransistor–Transistor Logic
USU-PRLabUtah State University Propulsion Research Laboratory

References

  1. Whitmore, S.A.; Bulcher, A.M. Vacuum Test of a Novel Green-Propellant Thruster for Small Spacecraft, AIAA 2017-5044. In Proceedings of the 53rd AIAA/SAE/ASEE Joint Propulsion Conference, AIAA Propulsion and Energy Forum, Atlanta, GA, USA, 10–12 July 2017. [Google Scholar] [CrossRef]
  2. Bombelli, V. Economic Benefits for the Use of Non-toxic Monopropellants for Spacecraft Applications, AIAA-2003-4783. In Proceedings of the 39th AIAA/ASME/SAE/ASEE Joint Propulsion Conference and Exhibit, Huntsville, AL, USA, 20–23 July 2003. [Google Scholar] [CrossRef]
  3. Haeseler, D.; Bombelli, V.; Vuillermoz, P.; Lo, R.; Marée, T.; Caramelli, F. Green Propellant Propulsion Concepts for Space Transportation and Technology Development Needs. ESA SP-557. In Proceedings of the 2nd International Conference on Green Propellants for Space Propulsion, Cagliari, Sardinia, Italy, 7–8 June 2004; Available online: https://www.researchgate.net/publication/234265416_Green_Propellant_Propulsion_Concepts_for_Space_Transportation_and_Technology_Development_Needs (accessed on 5 December 2019).
  4. Goldstein, E. The Greening of Satellite Propulsion. Aerosp. Am. 2012, 26–28. Available online: https://uppsagd.files.wordpress.com/2012/05/aerospace-america-february-2012-the-greening-of-satellite-propulsion-page-26-28.pdf (accessed on 5 December 2019).
  5. Venkatachalam, S.; Santhosh, G.; Ninan, K.N. An Overview on the Synthetic Routes and Properties of Ammonium Dinitramide (ADN) and other Dinitramide Salts. Propellants Explos. Pyrotech. 2004, 29, 178–187. [Google Scholar] [CrossRef]
  6. Nagamachi, M.Y.; Oliveira, J.I.; Kawamoto, A.M.; Dutra, R.D. ADN—The new oxidizer around the corner for an environmentally friendly smokeless propellant. J. Aerosp. Technol. Manag. 2009, 1, 153–160. Available online: http://www.redalyc.org/articulo.oa?id=309426551003 (accessed on 5 December 2019).
  7. Rheingold, A.L.; Cronin, J.T.; Brill, T.B.; Ross, F.K. Structure of Hydroxylammonium Nitrate (HAN) and the Deuterium Homolog. Acta Crystallogr. 1987, 43, 402–404. Available online: https://scripts.iucr.org/cgi-bin/paper?a26870 (accessed on 5 December 2019).
  8. Hawkins, T.W.; Brand, A.J.; McKay, M.B.; Tinnirello, M. Reduced Toxicity, High Performance Monopropellant at the U.S. Air Force Research Laboratory. AFRL-RZ-ED-TP-2010-219. In Proceedings of the 4th International Association for the Advancement of Space Safety Conference, Huntsville, AL, USA, 19–21 May 2010; Available online: www.dtic.mil/dtic/tr/fulltext/u2/a522113.pdf (accessed on 5 December 2019).
  9. Anflo, K.; Crowe, B. In-Space Demonstration of an ADN-based Propulsion System, AIAA-2011-5832. In Proceedings of the 47th AIAA/ASME/SAE/ASEE Joint Propulsion Conference & Exhibit, San Diego, CA, USA, 31 July–03 August 2011. [Google Scholar] [CrossRef]
  10. Spores, R.A.; Masse, R.; Kimbrel, S. GPIM AF-M315E Propulsion System, AIAA_2013-3849. In Proceedings of the 49th AIAA/ASME/SAE/ASEE Joint Propulsion Conference & Exhibit, San Jose, CA, USA, 15–17 July 2013; Available online: https://ntrs.nasa.gov/archive/nasa/casi.ntrs.nasa.gov/20140012587.pdf (accessed on 5 December 2019).
  11. Sempsrott, D. NASA’s Green Propellant Infusion Mission Deploys. NASA Blog 2019. Available online: https://blogs.nasa.gov/spacex/2019/06/25/nasas-green-propellant-infusion-mission-deploys/ (accessed on 20 October 2019).
  12. McLean, C.; Marotta, B.; Porter, B. Flight performance of the propulsion subsystem on the green propellant infusion mission. AAS 20-062. In Proceedings of the 30th AIAA/AAS Space Flight Mechanics Meeting, Orlando, FL, USA, 6–10 January 2020; Available online: http://www.univelt.com/AASPapers.html (accessed on 5 December 2019).
  13. Wilhelm, M.; Negri, M.; Ciezki, H.; Schlechtriem, S. Preliminary tests on thermal ignition of ADN-based liquid monopropellants. Acta Astronaut. 2019, 158, 388–396. [Google Scholar] [CrossRef]
  14. Anon, AF-M315E Safety Data Sheet. Available online: https://static1.squarespace.com/static/59de9c9c18b27ddf3bac610a/t/5e3af2d0fb8df43f9b2ae377/1580921553250/AF-M315E+SDS.pdf (accessed on 1 December 2019).
  15. Button, K. Green Propellant. Aerospace America. March 2017. Available online: https://aerospaceamerica.aiaa.org/features/green-propellant/ (accessed on 1 December 2019).
  16. Persson, M.; Anflo, K.; Dinardi, A. A Family of Thrusters for ADN-Based Monopropellant LMP-103S. AIAA-2012-3815. In Proceedings of the 48th AIAA/ASME/SAE/ASEE Joint Propulsion Conference & Exhibit, Atlanta, GA, USA, 30 July–01 August 2012. [Google Scholar] [CrossRef]
  17. Brand, A. Reduced Toxicity, High Performance Monopropellant. AFRL-RZ-ED-VG-2011-326. Presentation at the Green Propellant Workshop, Sweden, 12–15 September 2011; p. 23. Available online: https://apps.dtic.mil/dtic/tr/fulltext/u2/a554667.pdf (accessed on 5 December 2019).
  18. Pokrupa, N.; Anglo, K.; Svensson, O. Spacecraft System Level Design with Regards to Incorporation of a New Green Propulsion System. AIAA-2011-6129. In Proceedings of the 46th AIAA/ASME/SAE/ASEE Joint Propulsion Conference and Exhibit, San Diego, CA, USA, 31 July–3 August 2011. [Google Scholar] [CrossRef]
  19. Katsumi, T.; Hori, K. Combustion Wave Structure of Hydroxylammonium Nitrate Aqueous Solutions. AIAA 2010-6900. In Proceedings of the 46th AIAA/ASME/SAE/ASEE Joint Propulsion Conference & Exhibit, Nashville, TN, USA, 25–28 July 2010. [Google Scholar] [CrossRef]
  20. Whitmore, S.A.; Burnside, C.G. Performance Analysis of a High Performance Green Propellant Thruster. NASA Marshall Space Flight Center Faculty Program, NASA TM-2015-218216. December 2015; pp. 125–151. Available online: https://ntrs.nasa.gov/search.jsp?R=20160000456 (accessed on 1 December 2019).
  21. Lowe, D. The Overselling of Ionic Liquids. Science Magazine, In The Pipeline, 11 June 2013. Available online: http://blogs.sciencemag.org/pipeline/archives/2013/06/11/the_overselling_of_ionic_liquids (accessed on 28 March 2018).
  22. Anon. Hazard Analysis of Commercial Space Transportation; Vol. 1: Operations, Vol. 2: Hazards, vol. 3: Risk Analysis, PB93-199040, Accession 1988; U.S. Dept. of Transportation: Washington, DC, USA, 1988. Available online: https://rosap.ntl.bts.gov/view/dot/35788 (accessed on 5 December 2019).
  23. Palermo, E. Fused Deposition Modeling: Most Common 3D Printing Method. LIVESCIENCE. 19 September 2013. Available online: https://www.livescience.com/39810-fused-deposition-modeling.html (accessed on 2 December 2019).
  24. Whitmore, S.A.; Inkley, N.R.; Merkley, D.P.; Judson, M.I. Development of a Power-Efficient, Restart-Capable Arc Ignitor for Hybrid Rockets. J. Propuls. Power 2015, 31, 1739–1749. [Google Scholar] [CrossRef]
  25. Whitmore, S.A.; Mathias, S.D.; Harvey, R. High Voltage Breakdown and Arc-Tracking Mechanism of Thermoplastics with Applications to Hybrid Rocket Arc- Ignition. In Proceedings of the 53rd AIAA/SAE/ASEE Joint Propulsion Conference, Atlanta, GA, USA, 10–12 July 2017. AIAA 2017-4601. [Google Scholar] [CrossRef]
  26. Whitmore, S.A.; Merkley, S.L.; Tonc, L.; Mathias, S.D. Survey of Selected Additively Manufactured Propellants for Arc Ignition of Hybrid Rockets. J. Propuls. Power 2016, 32, 1494–1504. [Google Scholar] [CrossRef] [Green Version]
  27. Whitmore, S.A. Three-Dimensional Printing of “Green” Fuels for Low-Cost Small Spacecraft Propulsion Systems. J. Spacecr. Rocket. 2017, 54. [Google Scholar] [CrossRef] [Green Version]
  28. Whitmore, S.A. Additive Manufacturing as an Enabling Technology for “Green” Hybrid Spacecraft Propulsion. In Proceedings of the RAST-1039, Conference on Recent Advances in Space Technology 2015, Istanbul, Turkey, 16–19 June 2015; Available online: https://ieeexplore.ieee.org/document/7208305 (accessed on 5 December 2019).
  29. Whitmore, S.A.; Merkley, S.L.; Spurrier, Z.S.; Walker, S.D. Development of a Power Efficient, Restartable. Green” Propellant Thruster for Small Spacecraft and Satellites. SSC15-P-34. In Proceedings of the 29th AIAA/USU Conference on Small Satellites, Logan, UT, USA, 8–13 August 2015; Available online: https://digitalcommons.usu.edu/smallsat/2015/all2015/90/ (accessed on 5 December 2019).
  30. Whitmore, S.A.; Bulcher, A.M. A Green Hybrid Thruster Using Moderately Enriched Compressed Air as the Oxidizer. AIAA 2018-4841. In Proceedings of the 2018 Joint Propulsion Conference, AIAA Propulsion and Energy Forum, Cincinnati, OH, USA, 8–11 July 2018. [Google Scholar] [CrossRef]
  31. Karabeyoglu, M.A. Nitrous Oxide and Oxygen Mixtures (Nytrox) as Oxidizers for Rocket Propulsion Applications. J. Propuls. Power 2014, 30, 696–706. [Google Scholar] [CrossRef]
  32. Whitmore, S.A.; Armstrong, I.W.; Heiner, M.C.; Martinez, C.J. High-Performing Hydrogen Peroxide Hybrid Rocket with 3-D Printed and Extruded ABS Fuel. Aeronaut. Aerosp. Open Access J. 2018, 2. [Google Scholar] [CrossRef] [Green Version]
  33. Whitmore, S.A.; Martinez, C.J.; Merkley, D.P. Catalyst Development for an Arc-Ignited Hydrogen Peroxide/ABS Hybrid Rocket System. Aeronaut. Aerosp. Open Access J. 2018, 2. [Google Scholar] [CrossRef] [Green Version]
  34. Rommingen, J.E.; Husdal, J. Nammo Hybrid Rocket Propulsion TRL Improvement Program. AIAA 2012-4311. In Proceedings of the 48th AIAA/ASME/SAE/ASEE Joint Propulsion Conference & Exhibit, Atlanta, GA, USA, 30 July–1 August 2012. [Google Scholar] [CrossRef]
  35. Anthoine, J.; Jean-Yves Lestrade, J.-Y.; Messineo, J.; Casu, S. Performances of a Multi-Pulsed Hybrid Rocket Engine Operating with Highly Concentrated Hydrogen Peroxide. AIAA 2017-4006. In Proceedings of the 53rd AIAA/SAE/ASEE Joint Propulsion Conference, AIAA Propulsion and Energy Forum, July 2017. [Google Scholar] [CrossRef]
  36. Anon. Safety Standard for Oxygen and Oxygen Systems; NSS 1740.15; NASA Office of Mission Assurance: Washington DC, USA, January 1996. Available online: https://ntrs.nasa.gov/search.jsp?R=19960021046 (accessed on 5 December 2019).
  37. Rhodes, G.W. Investigation of Decomposition Characteristics of Gaseous and Liquid Nitrous Oxide; Report AD-784 602; Air Force Weapons Laboratory: Kirtland AFB, NM, USA, July 1974; Available online: https://www.freelists.org/archives/arocket/01-2014/pdfEE82jaPU9W.pdf (accessed on 5 December 2019).
  38. Anon. Occupational Safety and Health Guideline for Nitrous Oxide; US Department of Labor, Occupational Health and Safety Administration. Available online: http://www.osha.gov/SLTC/healthguidelines/nitrousoxide/recognition.html (accessed on 21 September 2018).
  39. Whitmore, S.A. Additively Manufactured Acrylonitrile-Butadiene-Styrene–Nitrous-Oxide Hybrid Rocket Motor with Electrostatic Igniter. J. Propuls. Power 2015, 31, 1217–1220. [Google Scholar] [CrossRef]
  40. Zakirov, V.; Sweeting, M.; Goeman, V.; Lawrence, T. Surrey Research on Nitrous Oxide Catalytic Decomposition for Space Applications. SSC00-XI-6. In Proceedings of the 14th Annual AIAA/USU Conference on Small Satellites, August 2000; Available online: https://digitalcommons.usu.edu/cgi/viewcontent.cgi?article=2109&context=smallsat (accessed on 5 December 2019).
  41. Karabeyoglu, A.; Dyer, J.; Stevens, J.; Cantwell, B. Modeling of N2O Decomposition Events, AIAA 2008-4933. In Proceedings of the 44th AIAA/ASME/SAE/ASEE Joint Propulsion Conference and Exhibit, Hartford, CT, USA, 1–3 July 2008. [Google Scholar] [CrossRef]
  42. Bracken, A.B.; Broughton, G.B.; Hill, W. Equilibria for Mixtures of Oxygen and Nitrous Oxide and Carbon Dioxide and Their Relevance to the Storage of N2O/O2 Cylinders for Use in Analgesia. J. Phys. D 1970, 3, 1747–1758. [Google Scholar] [CrossRef]
  43. Peng, D.-Y.; Robinson, D.B. A New Two Constant Equation of State. Ind. Eng. Chem. Fundam. 1976, 15, 59–64. [Google Scholar] [CrossRef]
  44. Zudkevitch, D.; Joffe, J. Correlation and Prediction of Vapor- Liquid Equilibria with the Redlich-Kwong Equation of State. AIChE J. 1970, 16, 112–119. [Google Scholar] [CrossRef]
  45. Linstrom, P.; Mallard, W. NIST Chemistry WebBook; NIST Standard Reference Database Number 69, National Inst. of Standards and Technology: Gaithersburg, Maryland, 2018. Available online: http://webbook.nist.gov/ (accessed on 28 June 2011).
  46. Whitmore, S.A.; Stoddard, R.L. N2O/O2 blends safe and volumetrically efficient oxidizers for small spacecraft hybrid propulsion. Aeronaut. Aerosp. Open Access J. 2019, 3. Available online: https://medcraveonline.com/AAOAJ/AAOAJ-03-00097.pdf (accessed on 5 December 2019). [CrossRef]
  47. Borisov, A.A.; Troshin, K.Y. Critical Conditions for Nitrous Oxide Ignition. Russ. J. Phys. Chem. 2009. [Google Scholar] [CrossRef]
  48. Gordon, S.; McBride, B.J. Computer Program for Calculation of Complex Chemical Equilibrium Compositions and Applications. In NASA Technical Report RP-1311; 1994. Available online: https://ntrs.nasa.gov/archive/nasa/casi.ntrs.nasa.gov/19950013764.pdf (accessed on 5 December 2019).
  49. Anon. “Pure Gasses”, Airgas, an Air Liquide Company. Pages 39, 40. Available online: http://airgassgcatalog.com/catalog/ (accessed on 2 July 2019).
  50. Stoddard, R.L. Experimental Investigation of N2O/O2 Mixtures as Volumetrically Efficient Oxidizers for Small Spacecraft Hybrid Propulsion Systems. Master’s Thesis, Utah State University, Logan, UT, USA, December 2019. Available on Digital Commons. Available online: https://digitalcommons.usu.edu/ (accessed on 5 December 2019).
  51. Anon. Cesaroni Pro38® Hardware. Available online: http://pro38.com/products/pro38/pro38.php (accessed on 5 January 2020).
  52. Anon. ULTRAVOLT C Series High Voltage CAP-Charging Supplies. Advanced Energy, Inc. Available online: https://www.advancedenergy.com/globalassets/resources-root/data-sheets/ultravolt-c-series-data-sheet.pdf (accessed on 9 December 2019).
  53. Holley. Nitrous Oxide Systems. Available online: https://www.holley.com/brands/nos/ (accessed on 6 December 2019).
  54. Anderson, J.D. Modern Compressible Flow, 3rd ed.; The McGraw Hill Companies, Inc.: New York, NY, USA, 2003; Chapter 4; pp. 127–187, ISBN-13: 978-0072424430; Available online: https://libcat.lib.usu.edu/search/i0070016542 (accessed on 5 December 2019).
  55. Zilliac, G.; Karabeyoglu, M.A. Modeling of Propellant Tank Pressurization. AIAA 2005-3549. In Proceedings of the 41st AIAA/ASME/SAE/ASEE Joint Propulsion Conference & Exhibit, Tucson, AZ, USA, 10–13 July 2005; pp. 1–25. [Google Scholar] [CrossRef]
  56. Dyer, J.; Doran, E.; Dunn, Z.; Lohner, K. Modeling Feed System Flow Physics for Self-Pressuring Propellants. In Proceedings of the 43rd AIAA/ASME/ SAE/ASEE Joint Propulsion Conference & Exhibit, Cincinnati, OH, USA, 8–11 July 2007. AIAA Paper 2007-5702. [Google Scholar] [CrossRef]
  57. Whitmore, S.A.; Chandler, S.N. Engineering Model for Self-Pressurizing Saturated-N2O-Propellant Feed Systems. J. Propuls. Power 2010, 26, 706–714. [Google Scholar] [CrossRef]
  58. Zimmerman, J.E.; Waxman, B.S.; Cantwell, B.; Zilliac, G. Review and Evaluation of Models for Self-Pressurizing Propellant Tank Dynamics. AIAA 2013-4045. In Proceedings of the 49th AIAA/ASME/SAE/ASEE Joint Propulsion Conference & Exhibit, San Jose, CA, USA, 14–17 July 2013. [Google Scholar] [CrossRef] [Green Version]
  59. Waxman, B.S.; Zimmerman, J.E.; Cantwell, B.J.; Zilliac, G.G. Mass flow Rate Characterization of Injectors for Use with Self-Pressurizing Oxidizers in Hybrid Rockets. AIAA 2013-3636. In Proceedings of the 49th AIAA/ASME/SAE/ASEE Joint Propulsion Conference & Exhibit, San Jose, CA, USA, 14–17 July 2013. [Google Scholar] [CrossRef] [Green Version]
  60. Beckwith, T.G.; Marangoni, R.D.; Lienhard, J.H.V. Mechanical Measurements, 6th ed.; Prentice Hall: Upper Saddle River, NY, USA, 2006; pp. 43–73. [Google Scholar]
  61. Whitmore, S.A.; Peterson, Z.W.; Eilers, S.D. Comparing Hydroxyl Terminated Polybutadiene and Acrylonitrile Butadiene Styrene as Hybrid Rocket Fuels. J. Propuls. Power 2013, 29, 582–592. [Google Scholar] [CrossRef] [Green Version]
  62. Whitmore, S.A.; Merkley, S. Radiation Heating Effects on Oxidizer-to-Fuel Ratio of Additively Manufactured Hybrid Rocket Fuels. J. Propuls. Power 2019, 35, 863–878. [Google Scholar] [CrossRef]
  63. Zilliac, G.; Karabeyoglu, M.A. Hybrid Rocket Fuel Regression Rate Data and Modeling. AIAA 2006-4504. In Proceedings of the 42nd AIAA/ASME/SAE/ASEE Joint Propulsion Conference & Exhibit, Sacramento, CA, USA, 9–12 July 2006. [Google Scholar] [CrossRef] [Green Version]
  64. Anon. NFPA 704, National Fire Protection Association Hazard Identification System. ACS Chemistry for Life. Available online: https://www.google.com/search?client=firefox-b-1-d&q=NFPA+Hazard+Class (accessed on 10 December 2019).
  65. Hussain, S.M.; Frazier, J.M. In vitro toxicity assessment of a new series of high energy compounds. Sci. Total Environ. 2001, 247, 151–160. Available online: https://www.ncbi.nlm.nih.gov/pubmed/11453292 (accessed on 25 March 2020). [CrossRef]
Figure 1. Inductive Charge Pyrolyzing acrylonitrile–butadiene–styrene (ABS) fuel. (Copyright Utah State University [1], reproduced with permission).
Aerospace 07 00043 g001
Figure 2. Hydrocarbon seeding reduces the N2O decomposition energy barrier.
Aerospace 07 00043 g002
Figure 3. Nytrox vapor/liquid isotherm plots, mass fraction of O2 in solution. (Copyright Utah State University [46], reproduced with permission).
Aerospace 07 00043 g003
Figure 4. Minimum ignition energy Ei for nytrox mixtures at 7 storage pressure levels. (A portion of this data is taken from Reference [31], data reproduced with permission).
Aerospace 07 00043 g004
Figure 5. Density of nytrox vapor and liquid phases at vapor pressure for 7 different isotherms. (Copyright Utah State University [46], reproduced with permission).
Aerospace 07 00043 g005
Figure 6. Performance of 3 N2O/O2 concentrations compared against pure N2O and GOX as oxidizer. (Copyright Utah State University [46], reproduced with permission).
Aerospace 07 00043 g006
Figure 7. Nytrox percolation apparatus block diagram.
Aerospace 07 00043 g007
Figure 8. Test article thrust chamber assembly. (Copyright Utah State University [1], reproduced with permission).
Aerospace 07 00043 g008
Figure 9. High-performance “green” hybrid propulsion (HPGHP) arc-igniton system: (a) motor head-end ignitor layout and (b) typical arc-ignition electrical system layout. (Copyright Utah State University [1], reproduced with permission).
Aerospace 07 00043 g009
Figure 10. Thrust chamber mounted to load-balance test sled. (Copyright Utah State University [1], reproduced with permission).
Aerospace 07 00043 g010
Figure 11. Piping and instrumentation diagram of the hot-fire test apparatus.
Aerospace 07 00043 g011
Figure 12. Venturi calibration for nytrox 90 flow at 22 atmospheres.
Aerospace 07 00043 g012
Figure 13. Time history of typical baseline GOX/ABS hot-firing.
Aerospace 07 00043 g013
Figure 14. Summary of the GOX/ABS baseline test results. (Copyright Utah State University [46], reproduced with permission).
Aerospace 07 00043 g014
Figure 15. Time history of typical Nytrox 87/ABS hot-firing.
Aerospace 07 00043 g015
Figure 16. Summary of the Nytrox 87/ABS hot-fire test results. (Copyright Utah State University [46], reproduced with permission).
Aerospace 07 00043 g016
Figure 17. Comparing performance of test thruster using GOX/ABS and Nytrox 87/ABS.
Aerospace 07 00043 g017
Figure 18. Comparing combustion properties of GOX/ABS and Nytrox 87/ABS motors.
Aerospace 07 00043 g018
Figure 19. Comparing GOX/ABS and Nytrox 87/ABS fuel regression rates to previous tests of hybrid propellants.
Aerospace 07 00043 g019
Figure 20. Volumetric Efficiency Comparisons.
Aerospace 07 00043 g020
Figure 21. Extrapolating ambient GOX/ABS and Nytrox 87/ABS test data to optimal vacuum conditions.
Aerospace 07 00043 g021
Figure 22. Effect of Fuel Grain Burn Lifetime on Required Ignition Energy.
Aerospace 07 00043 g022
Figure 23. Mean Ignition Energy Levels for "Pre-Set" Fuel Grains.
Aerospace 07 00043 g023
Figure 24. Typical ignition response time histories for GOX/ABS and Nytrox 87/ABS thrusters.
Aerospace 07 00043 g024
Figure 25. GOX/ABS, Nytrox/ABS mean ignition latency comparisons.
Aerospace 07 00043 g025
Figure 26. Comparing GOX/ABS and Nytrox/ABS ignition latencies.
Aerospace 07 00043 g026
Figure 27. Nytrox ignition latency explained as diminishing O2 concentrations in Nytrox solution at higher tank temperatures.
Aerospace 07 00043 g027
Table 1. Motor component geometry specifications.
Component
Single Port InjectorDiameter: 0.127 cm
Fuel Grain (ABS)Diameter: 3.168 cmLength:
5.1 cm
Initial Weight:
45.0 g 1
Initial Port Diameter:
0.53 cm
Motor CaseDiameter: 3.8 cmLength:
7.92 cm
Wall Thickness:
1.5 mm
Nozzle (Graphite)Initial Throat Diameter:
0.345 cm
Exit Diameter:
0.483 cm
Expansion Ratio:
2.07:1, Conical
Exit Angle:
5.0 deg.
1 The fuel grain print density was approximately, 1.04 g/cm3.
Table 2. Nytrox mix batch specifications.
Batch No.123456MeanStd. Dev
Final Fill Pressure, kPa8704.48842.38739.48760.18725.68105.18745.4269.3
Final Fill Temperature, °C0.1 −0.20.0 0.0 0.2 0.2 0.05 0.15
Total Oxidizer Added, kg2.8672.9212.9162.8642.8652.8542.8870.029
N2O Added, kg2.2342.2672.2842.2732.2832.2782.2680.019
O2 Added to Tank, kg0.6330.6540.6320.5910.5820.5760.6180.032
Mean Nytrox Density, g/cm30.4190.4270.4260.4180.4180.4170.4220.004
Liquid O2 Mass Fraction (%)12.6312.9912.7212.7812.6911.1312.760.68
Vapor O2 Mass Fraction (%)37.1437.2037.1637.1737.1636.4037.170.31
Vapor Fraction in Tank (%)37.036.635.937.537.232.936.801.7
Nytrox Liquid Density, g/cm30.7740.7700.7730.7730.7740.7900.7730.007
Nytrox Vapor Density, g/cm30.2350.2410.2360.2370.2360.2120.2370.010
Table 3. Summary of top-level parameter statistics for GOX/ABS baseline and Nytrox/ABS tests.
Baseline GOX/ABS Test (13 Total Burns)
StatisticThrust, N
Load P0
CF
Load P0
Isp
Load P0
c*, m/sη*O/FP0, kPaTotal Mass Flow, g/s
μ10.7010.901.2621.273224.9224.81751.40.9191.772762.94.85
σ0.6450.6170.0310.0267.528.8323.840.0890.22862.820.349
95% t-conf.0.3390.3730.0190.0164.545.3414.400.0540.17837.940.211
Nytrox/ABS Test (19 Total Burns)
μ11.7511.701.2271.222204.4198.4560.840.9273.464809.76.14
σ0.7490.7590.0340.03910.2911.1057.460.1060.46332.840.356
95% t-conf.0.3580.3660.0170.01954.965.3427.680.0510.22315.820.171
Table 4. Power-law fit Parameters for GOX/ABS, Nytrox87/BS and other selected propellant regression rates. (A portion of this data is taken from References [61,62,63]. Data reproduced with permission).
PropellantGOX/ABSNytrox87/ABSN2O/ABS58N2O/HTPB58,59Paraffin/LOX59LOX/HTPB59Lox/HTPB-Escorez59LOX/HDPE59
a coefficient0.04280.03540.007420.007950.04880.01460.00990.0098
n exponent0.5240.4550.7990.7730.4910.6810.6800.620
Table 5. Nytrox/ABS performance characteristics compared to existing space mono-propellants.
PropellantHydrazine LMP-103S AF-M315ENytrox/ABS Hybrid
Flame Temperature600–750 °C1600 °C1900 °C3000 °C
Vacuum Isp, s220–225252 (theory)
235 (delivered)
266 (theory)
245 (delivered)
320 (theory)
294 (extrapolated)
Specific Gravity1.011.241.4650.650 (87% N2O)
Impulse density, N·s/L22703125 (theory)
2915 (delivered)
3900 (theory)
3650 (delivered)
2510 (vacuum, extrapolated)
1750 (ambient, delivered)
Preheat Temperature315 °C, cold-start capable300 °C370 °CN/A
none-required
Required Ignition Input Energy, JoulesN/A 12,000 J (10 Watts @ 1200 s)27,000 J (15 Watts @ 1800 s2.5 J (5 Watts for 500 ms)
Propellant Freezing Temperature1–2 °C−7 °C< 0 °C (forms glass, no freezing point)−70 °C
Cost$$$$$$$$$
AvailabilityReadily AvailableRestricted AccessLimited AccessVery Widely Available 1
NFPA 704 Hazard Class [64] Aerospace 07 00043 i001 Aerospace 07 00043 i002 Aerospace 07 00043 i0032 Aerospace 07 00043 i004
1 80%–90% Nytrox solutions easily manufactured, as per procedure in this paper. 2 Based up the AF-M315E constituent components, Hydroxyl Ammonium Nitrate (HAN), and 2-Hydroxyethylhydrazine (HEHN) [65].

