Article

Natural Language Processing Based Method for Clustering and Analysis of Aviation Safety Narratives

Aerospace Systems Design Laboratory, Georgia Institute of Technology, Atlanta, GA 30332-0150, USA
*
Author to whom correspondence should be addressed.
Aerospace 2020, 7(10), 143; https://doi.org/10.3390/aerospace7100143
Submission received: 28 August 2020 / Revised: 24 September 2020 / Accepted: 26 September 2020 / Published: 28 September 2020
(This article belongs to the Special Issue Machine Learning Applications in Aviation Safety)

Abstract

:
The complexity of commercial aviation operations has grown substantially in recent years, together with a diversification of techniques for collecting and analyzing flight data. As a result, data-driven frameworks for enhancing flight safety have grown in popularity. Data-driven techniques offer efficient and repeatable exploration of patterns and anomalies in large datasets. Text-based flight safety data presents a unique challenge in its subjectivity, and relies on natural language processing tools to extract underlying trends from narratives. In this paper, a methodology is presented for the analysis of aviation safety narratives based on text-based accounts of in-flight events and categorical metadata parameters which accompany them. An extensive pre-processing routine is presented, including a comparison between numeric models of textual representation for the purposes of document classification. A framework for categorizing and visualizing narratives is presented through a combination of k-means clustering and 2-D mapping with t-Distributed Stochastic Neighbor Embedding (t-SNE). A cluster post-processing routine is developed for identifying driving factors in each cluster and building a hierarchical structure of cluster and sub-cluster labels. The Aviation Safety Reporting System (ASRS), which includes over a million de-identified voluntarily submitted reports describing aviation safety incidents for commercial flights, is analyzed as a case study for the methodology. The method results in the identification of 10 major clusters and a total of 31 sub-clusters. The identified groupings are post-processed through metadata-based statistical analysis of the learned clusters. The developed method shows promise in uncovering trends from clusters that are not evident in existing anomaly labels in the data and offers a new tool for obtaining insights from text-based safety data that complement existing approaches.

1. Introduction

Commercial aviation safety is a field of great importance, especially as international passenger traffic continues to grow after having increased by over 50% in the past 16 years [1]. According to the Federal Aviation Administration (FAA), the demand for air travel and traffic is predicted to grow steadily over the next two decades at a rate of approximately 1.8% annually [2]. Thus, major stakeholders in the aviation industry find themselves in a position of immense responsibility when it comes to assuring the quality and continued safety of their services. Data science has come to play an important role in enhancing and automating the safety investigation process as airlines, airport authorities and regulatory agencies such as the FAA have begun leveraging different tools available for data collection and exploration. A key field of focus in these studies has been the development of a more proactive and predictive model for the identification of risk, to be used in conjunction with existing frameworks of flight safety investigation which mostly rely on the analysis of past incidents and accidents. Commonly addressed areas of study include anomaly detection in time series data [3,4,5], precursor identification [6,7,8] and clustering of in-flight event data [9], as well as the analysis of text-based flight narratives. Each of these approaches tends to rely on different sources of flight safety data which vary in accessibility depending on the sensitivity of the information contained.
Beyond Flight Data Recorder (FDR) and Cockpit Voice Recorder (CVR) data, which are not publicly accessible, there exist a number of different sources for flight safety data, which rely on both aircraft information and pilot self-reporting. Examples of such sources include Flight Operational Quality Assurance (FOQA) [10] data, which documents key aircraft parameters such as altitude, airspeed and geographical location in a time series format, as well as Aircraft Communication Addressing & Reporting Systems (ACARS), which records messages between pilots and air traffic control in order to keep track of key points throughout a flight. However, the proprietary nature of many sources hinders the ability of researchers to acquire sufficient flight safety data in order to conduct extensive studies using data-driven methods. As a result, open-source repositories for flight safety data have grown in popularity recently, one of the most relevant being the Aviation Safety Reporting System (ASRS) (NASA ASRS Program: https://asrs.arc.nasa.gov/). Comprised of a large database of voluntarily reported safety event narratives, ASRS provides an optimal means of analyzing how different flight conditions influence the nature and outcome of in-flight anomalies. Extensive research has been done on anomaly detection in numerical flight data, but the field of linguistic analysis of event narratives remains largely unexplored, especially when combined with categorical event metadata. Additionally, there exists a need for further integration between numerical and text-based data in accident and incident investigation, especially in relation to human-aircraft interaction and its pitfalls. Examining how different external components influence self-reported narratives can provide significant insight on the causal factors of these events in the eyes of those involved in them, while identifying the external parameters that most strongly correlate with incidents can shed light on areas of potential improvement for airlines and enhance the overall safety of the industry. A successful implementation of this approach provides airlines with an automated and more refined approach for classifying and studying anomalies in their daily operations. Through a prospective rather than reactive approach to aviation safety, events are explored in the context of the industry as a whole, allowing stakeholders to more thoroughly understand how the experiences of pilots, air traffic controllers, flight attendants and other collaborators relate despite different individual situations. This paper presents such a methodology by leveraging the different components of ASRS data as a case study.
The rest of the paper is comprised of the following sections: Section 2 provides a review of different text-mining techniques in the context of aviation safety and the ASRS dataset. Section 3 outlines the framework for pre-processing and categorization of narratives and application of machine learning techniques on the processed data. Section 4 presents an analysis of the specific results obtained from the ASRS case-study. Section 5 presents conclusions and avenues for future research.

2. Background and Research Objective

Data-driven analysis using machine learning techniques is a well-developed field which has gained significant traction given recent advances in computational capacities and new algorithms. Novel techniques for extracting information out of large datasets have increasingly geared their focus towards adaptability and compatibility with different operating platforms, as well as classes of data [11]. Such data-driven methods often fall into two main categories: predictive and descriptive [12]. The former has as a key objective to develop a model for representing the phenomena driving a dataset, which can then be applied in generating new information and outcomes based on trends extracted from existing data. Methods of this sort have been extensively explored in the context of aviation accident risk prediction [13,14] and predictive operations in the airline industry [15,16]. Conversely, the descriptive approach aims to combine different modalities of existing data to uncover nontrivial conclusions and patterns, rather than using these trends to predict future outcomes. Some such methods are employed in the classification of large heterogeneous datasets [17], as well as in revealing underlying biases in text-based data [18].
Within the context of descriptive machine learning models in the aviation industry, text mining has grown in popularity given a need for time-efficient analysis of large-scale subjective text corpora. For this, a variety of natural language processing (NLP) techniques have been developed with the purposes of searching and classifying texts, as well as acquiring knowledge about dynamic connections that exist within them [19]. The work of Pimm et al. [20] presents a framework for automatic linguistic analysis specific to aviation safety reports, highlighting challenges such as dealing with acronyms and organizing terms which use different words but hold similar meanings. Additionally, the work of Tanguy et al. [21] presents a classification-based application of NLP to aviation safety data, where an approach is discussed for quantifying key elements of aviation incidents, as well as studying their evolution in time and space. Methods like this provide ways to analyze individual texts in the context of the large corpora they belong to, shedding light on underlying relationships not obvious in a vacuum.
Within the more localized realm of flight safety event reports, significant prior research has been undertaken involving ASRS data. Though a majority of studies focus solely on the narrative component of the dataset, with little integration of the rich metadata, the techniques applied in several studies have provided guidance for this investigation. The work of Subramanian and Rao [22] delved deeply into the study of cause categories for flight safety events, which were extracted directly from the textual narratives. The main objective of their work was to develop a model for time-series forecasting of go-around incidents, highlighting the presence of underlying relationships between the textual and metadata columns of ASRS data. While providing interesting results for the specific seasonal and long-term patterns in go-around incidents, the study leaves room for a more in-depth analysis of different metadata parameters and their impact on a wider range of safety events.
Additionally, the work of Kuhn [23] on identifying topics and trends in aviation incident reports through structural topic modeling highlights the importance of classifying events into their respective subject areas in order to facilitate a more specific analysis of each report. The topic labels used in that study were determined by subject matter experts, a valid approach that nevertheless leaves an opportunity when it comes to exploring the abundance of metadata categories already identified within the ASRS files. Taking these categories as topic labels, it then becomes possible to examine how closely they correlate with the subjects of their associated narratives. In a similar but more metadata-centered approach, the work on sparse machine learning methods conducted by El Ghaoui et al. [24] provides interesting insight on how certain specific metadata scenarios can drive patterns in textual reports. By performing the variant of least-squares analysis known as LASSO [25] on a numerical representation of the safety narratives from one specific airport, that study was able to identify the most important words (or n-grams) associated with that airport, as well as which words most often appeared in conjunction with those deemed most relevant by the algorithm. This kind of analysis, however, was only shown for two airports, which prompts further investigation on how each narrative is affected by the flight’s external conditions, including but not limited to the airport pair.
Similar clustering techniques to those being applied in this paper were used by Srivastava et al. [26] with the objective of discovering recurring anomalies in aerospace problem reports. Though the focus remains on identifying recurring anomalies and anomaly categories, that study outlines multiple techniques for the unsupervised classification of safety narratives and provides an interesting framework for this paper to expand upon when delving more deeply into metadata-centered anomaly cause categories. Furthermore, the study conducted by Robinson [27] on visual representations of safety narratives brings to light the value of 2-D isometric mapping as a method of intuitively visualizing how different event categories influence the text-based narrative reports. Despite the loss of information when reducing the dimensionality of the dataset from an over 2000-dimensional matrix to a two-dimensional plane, the ability to clearly discern visual clusters in the data when shaded according to event category reveals how valuable isometric mapping can be to identify what parameters cause narratives to be more closely related. This paper plans on using a non-linear dimensionality reduction technique known as t-Distributed Stochastic Neighbor Embedding (t-SNE) to perform a similar mapping, while also expanding upon this idea by applying clustering algorithms to a higher dimensional dataset in order to minimize losses stemming from dimensionality reduction.
Finally, on a conceptual level, the work on cluster explanations via neural networks by Kauffmann et al. [28] provides a methodology for identifying driving factors of text-based clustering at the level of key words. Their study on purity metrics for clustering highlights the balance that must be established between traditional numeric-based cluster scoring systems and more a refined analysis of cluster membership decisions based on key word trends present within a document. Though a direct application of the methodology explored in that work is outside the scope of this paper, the concepts outlined in their study of cluster validation procedures are put in practice through the use of the ASRS case study.
Thus, this work expands upon the efforts of the aforementioned studies in order to more thoroughly address the lack of metadata integration into flight safety narrative analysis. The specific contributions being made are the development of an efficient and reusable methodology for the unsupervised classification of safety narratives, as well as a statistical toolkit which allows for metadata parameters to be visualized in relation to the different clusters identified. The overall research objective is identified below.
Research Objective: Establish a data-driven framework based on natural language processing techniques for the clustering of text-based aviation safety narratives to gain insights on causal factors and correlations with metadata categories.

3. Method

The methodology presented by this study can be visualized in Figure 1 and is described here in brief, with a more detailed treatment in the sections that follow. The approach is undertaken in multiple steps, beginning with the extraction of specific ASRS reports from its large database of commercial flight records, followed by the cleaning and pre-processing of both the narrative and categorical data to more effectively reflect the information contained within each recorded parameter. Subsequently, the cleaned text narratives are reduced to a bag-of-words and term frequency-inverse document frequency (TF-IDF) matrix, and attempts are made to classify these narratives using k-means clustering, while visualizing them through T-distributed Stochastic Neighbor Embedding (t-SNE). Finally, statistical methods are applied to the results of both previous steps, in order to identify which metadata parameters and values correlate most strongly with the class categories identified. The final goal of this methodology is thus to identify a set of class categories that thoroughly encapsulate the ASRS dataset based on the categorical parameters that appear to have the most significant impact on in-flight event narratives.

3.1. Asrs Data Framework
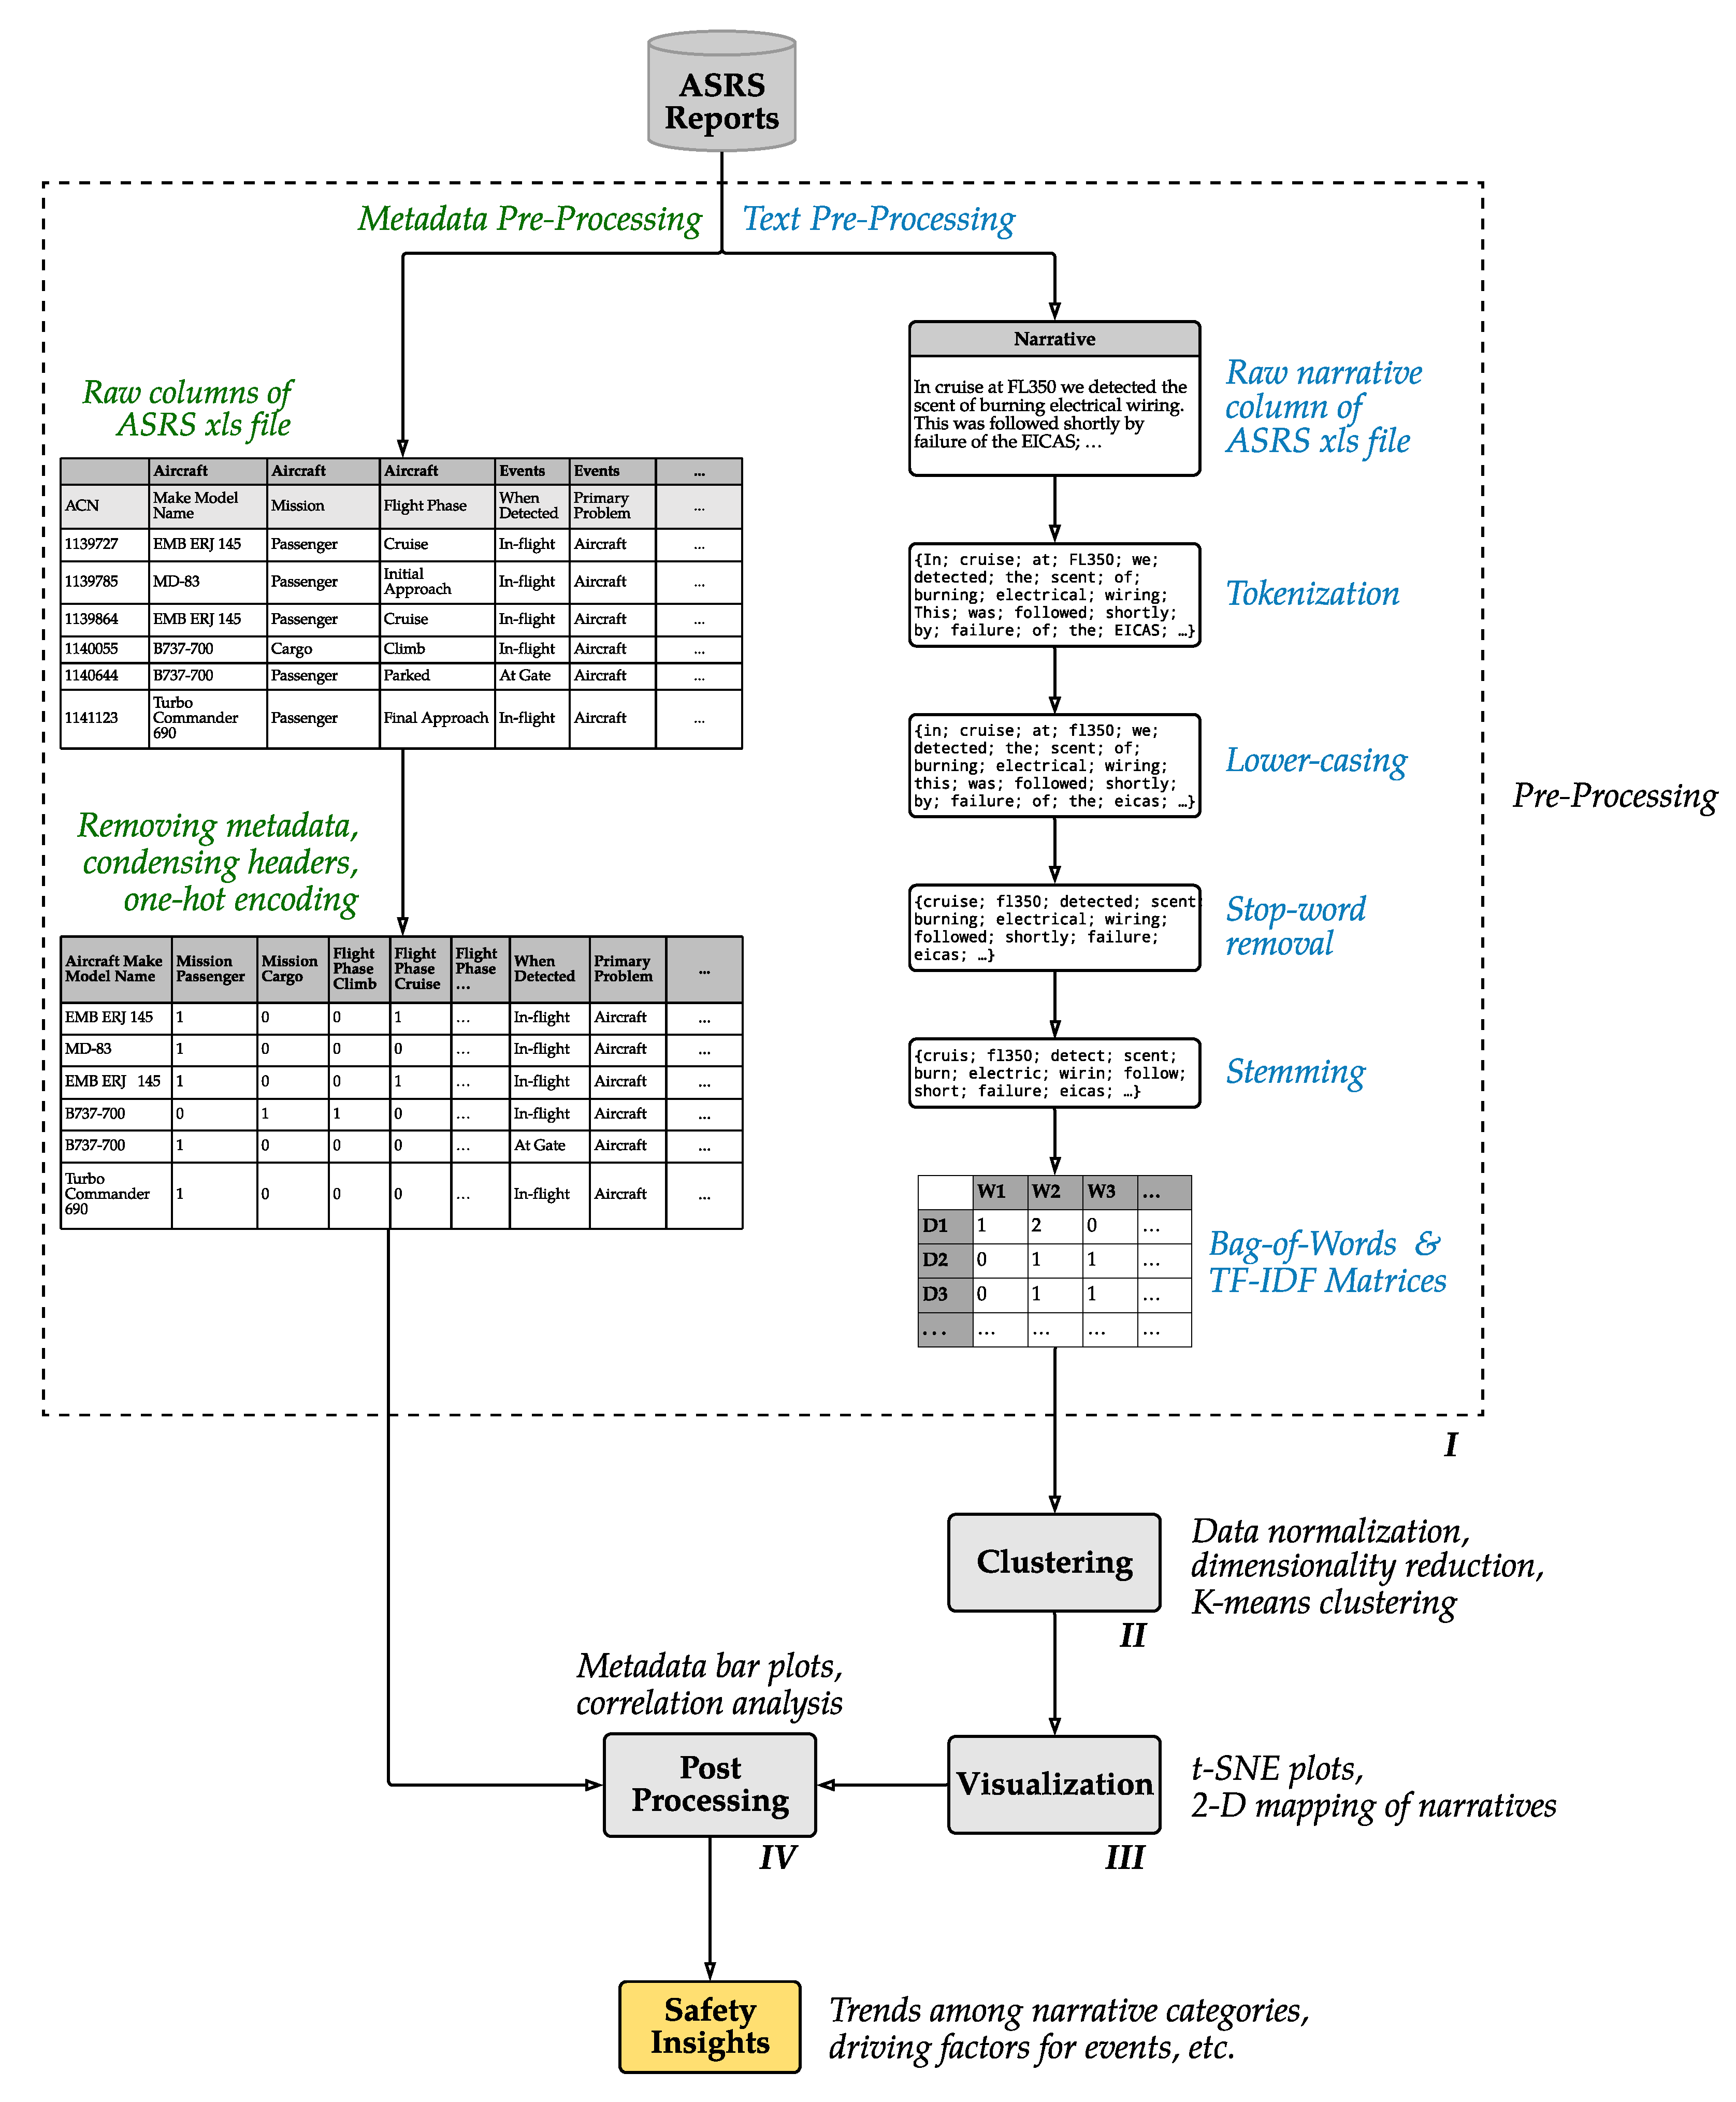
The Aviation Safety Reporting System is a program that collects and processes voluntary and de-identified reports of potentially unsafe occurrences in the aviation industry with the purpose of identifying regions of improvement in the national airspace system. ASRS receives reports from participants in multiple sectors of the industry including pilots, air traffic controllers, maintenance technicians, among others. With a total of over 1.6 million reports collected since the early 1980s, the ASRS database possesses narratives that span a wide range of event scenarios stemming from both technical and human factors.
The ASRS database allows for flight narratives to be directly extracted along with their metadata through a variety of filters which the user can select in order to narrow down the search by date, aircraft, environment, location, persons involved and event assessment. Flight records can be extracted in bulk as xls or csv files, a condensed visual representation of which can be seen in Table 1. However, for the purpose of illustration, the sample table presented in this figure does not represent the true amount or order of the columns found in an actual ASRS file. Each row of the files corresponds to a single event, while each column corresponds to a parameter recorded about that event. There are 91 total numerical or categorical metadata columns, further classified as time, place, environment, aircraft, person, event, and assessment columns. The first row of each file indicates the column category, while the second row indicates the column name itself. Additionally, each file contains 2 text-based columns titled “Narrative” and “Synopsis”, representing a first-person account of the occurrence and a summarized version of that account respectively.
For the purposes of this study, the ASRS records being considered have been narrowed down to only passenger and cargo operations between January 2010 and January 2020. This is to ensure that the model has sufficient data to capture long-term trends in commercial aviation safety events. Additionally, this work focuses solely on events brought about by technical factors, that is, the events flagged by the ASRS system as having been caused by issues relating to aircraft, airports, airspace structure, ATC equipment/navigation facilities, tooling, or incorrect/not installed/unavailable aircraft parts. The clustering model relies on word frequencies to distinguish narratives, and accounts of technical events are more likely to contain vocabulary specific enough to showcase a successful implementation of this framework. This yields a total of 13,336 reports, which are extracted from the database.

3.2. Pre-Processing

The procedure for data extraction and pre-processing for this study can be divided into two main components—ASRS metadata cleaning, and pre-processing of text-based event narratives. All pre-processing is conducted through Python, in which the Pandas (Pandas documentation: https://pandas.pydata.org/) and NumPy (NumPy documentation: https://numpy.org/) libraries prove helpful for extracting and manipulating meaningful information from the raw csv files provided by the online ASRS database.
The first step in the metadata cleaning is the correction of column headers in the flight records, as well as the removal of any irrelevant metadata relating to the files’ extraction from the sponsor’s system. The Python routine that accomplishes this combines the first and second rows of the dataset, which represent the broader and more specific column headers respectively, into a single header that encompasses all the information required to identify what metadata parameter each column contains. Additionally, a challenge arises when it comes to dealing with the majority of the categorical parameters in ASRS data, whose values are stored as strings. The tendency of machine learning tools to accept only numerical inputs requires some form of encoding to occur with these categorical variables prior to feeding them into the algorithm, for which there exist several techniques. Ordinal encoding simply assigns an integer to each distinct value in the categorical parameter, providing a method of representing not only nominal values, but also the natural ordering of the data if one exists. Differently, one-hot encoding divides a parameter that can take n distinct values into n separate binary parameters, each indicating the presence or absence of one specific value [29]. Given the lack of a predetermined ordering to the majority of the parameters relevant to this study, one-hot encoding was selected so as to minimize undesired relationships being established between similar ordinal values. Encoding as a whole ensures that columns which can only hold a limited set of values, such as “Flight Phase” or “Aircraft", can be more efficiently accessed and analyzed by the algorithms selected. Table 2 provides a visual representation of one-hot encoding in practice. In this example, each row represents one event.
The pre-processing of text-based event narratives for natural language processing can be further subdivided into two procedures: text cleansing and the generation of representative matrices. The text cleaning process consists of four main steps, all of which are implemented individually on each narrative through the Python library nltk (NLTK Documentation: https://www.nltk.org/). The first step, tokenization, splits each narrative into words (tokens) and vectorizes it, while the second step of lower-casing ensures that linguistically identical tokens like “Air” and “air” get combined, reducing the dataset’s dimensionality. The third step is known as stop word removal, and serves to disregard words such as “the” or “and” which provide little meaningful insight in distinguishing between two documents. The fourth step can be undertaken through two different methods: stemming or lemmatization. Both have the same objective, to reduce words to their root forms in order to combine closely related words such as different tenses of the same verb. The fundamental difference lies in the final product each of these techniques generates, as stemming trims a word to its absolute root, while lemmatization converts it to the existing English word most closely associated with it. Practically, stemming would reduce the words “machining” and “machines” to “machin”, while lemmatization would reduce them to “machine”. Though lemmatization is often preferred over stemming as it actually conducts a morphological analysis of the narrative, it often requires part of speech tags on the text which are unavailable in the context of this dataset. For that reason, stemming was chosen as the primary technique for this step of the process.
With the text cleaning complete, the next step is the generation of the bag-of-words matrix. The objective of this step is to convert the processed narratives into a numerical representation which the dimensionality reduction, clustering and t-SNE algorithms can more effectively manipulate. There are multiple approaches to this, but the method chosen for this study is term-frequency inverse-document-frequency (TF-IDF) as it was found to provide the best representation of word significance, both in the context of individual documents and the corpus as a whole. The model works by first analyzing each document individually and tallying how many times each word appears per document, generating what is known as a bag-of-words (BoW) matrix. The rows of the BoW matrix each correspond to one document, while the columns each correspond to one word. Thus, cell ij of the matrix will contain a number corresponding to how many times word j appeared in document i. As described, this representation only takes into account the absolute frequency of each word within each document, disregarding that value’s context within the document and the corpus as a whole. To address this, a TF-IDF matrix [30] is generated by applying the following equations to each cell of the BoW matrix:
t f i d f ( t , d , D ) = t f ( t , d ) · i d f ( t , D )
where:
t f ( t , d ) = f t , d m a x f t , d : t d
i d f ( t , D ) = l o g N d D : t d .
The term-frequency component normalizes each word’s frequency by that of the most common word within that document, thus ensuring that longer documents which are more likely to feature key words multiple times are not given undue importance over shorter texts. The inverse-document-frequency component scales each word’s value based on how many documents within the corpus contain it, attributing more importance to words that show up in a smaller subset of the overall corpus. This serves as a method of reducing the relevancy attached to words which appear very commonly in every document, and may not be useful in distinguishing between them [31].
Table 3 presents notional bag-of-words and TF-IDF matrices stemming from the same data. The rows of both tables correspond to five documents belonging to the same corpus, while the columns correspond to words found within those documents. The normalization effects of the term-frequency component are particularly noticeable in row D2, which originally contained high frequencies for every word, all of which were significantly reduced in the TF-IDF model. The inverse-document-frequency corrections can be seen in the “weather” and “fire” columns of the TF-IDF matrix, whose values were increased relative to other words due to the rare occurrence of documents containing these words. This process ensures that specific and uncommon words are not disregarded in favor of those which appear more frequently in general.
The technique selected for the 2-dimensional visualization of the bag-of-words and TF-IDF representations of the ASRS dataset in this study is t-distributed Stochastic Neighbor Embedding (t-SNE). Primarily a dimensionality reduction technique, t-SNE applies a probability-based nonlinear approach to 2-D mapping in order to reduce each row of the bag-of-words and TF-IDF matrices to a point on the x-y plane. The technique is treated in detail in the “t-SNE and Visualization” section of this paper. Figure 2 depicts a mapping of this kind for the bag-of-words and TF-IDF matrices generated from the ASRS narratives. The x and y coordinates possess no physical significance, therefore the position of points can only be compared in a relative context. The main improvement between both models lies in the relative positions of groupings of points within the plot, which are significantly more distinct in the latter approach.
The actual generation of these matrices is conducted through scikit-learn’s feature extraction module (Sklearn feature extraction documentation: https://scikit-learn.org/stable/modules/feature_extraction.html). A vectorizer class contained in this module implements both tokenization and occurrence counting, but only the counting functionality is applied in this case as tokenization is already carried out in the earlier pre-processing steps. A transformation method is invoked on the corpus, which generates an m × n matrix with m representing the number of narratives and n representing the number of relevant words identified in the corpus. The term-frequency and inverse-document-frequency formulas are then applied individually to each cell. It was found that over 20,000 different words exist within the corpus, however only the top 1000 were selected for analysis in order to preserve the efficiency of the techniques being applied. With this step complete, the data is ready for the dimensionality reduction, clustering and visualization algorithms. Figure 2a,b represent the two dimensional visualization of the bag of words and TF-IDF models, respectively.

3.3. Clustering

Clustering is an unsupervised learning technique which attempts to identify natural groupings of data points based on previously unknown measures of similarity [32]. Clustering algorithms partition data sets such that points assigned to the same cluster share common traits when compared to points in a different cluster. For this research, the data points used for clustering are the rows of the TF-IDF matrix, each a numerical representation of one individual event narrative. The first step in a usual clustering process is data normalization [33], to ensure that parameters with larger ranges of values (i.e., words that appear more frequently in all documents) do not dominate others. This is traditionally accomplished through standardization by z-score, which normalizes each parameter’s mean to zero and standard deviation to one. However, for the purposes of this investigation, the inherent normalization within the TF-IDF model is sufficient in avoiding skewed clustering results, thus z-score standardization is not applied.
Along with normalization, dimensionality reduction is conducted to facilitate the discovery of relationships between the different features (words) being analyzed. This allows the algorithms to consider fewer random variables and establish clearer links between those still present. Two techniques were explored for this purpose: principal component analysis (PCA) [34] and the aforementioned t-SNE. While both perform the same task, PCA is a linear technique and can be used to automatically determine how much reduction is needed by analyzing the retained variance of the dataset. t-SNE is a non-linear dimensionality reduction technique primarily used for visualization and can reduce the data to two or three dimensions. Due to the flexibility and simplicity of PCA it is selected for the initial dimensionality reduction procedure. This is applied directly to the TF-IDF matrix, reducing its rank from 1000 to 150. Further reduction during post-processing through t-SNE was conducted solely for visualization purposes and did not influence the clustering implementation.
For the clustering task itself, a number of different clustering algorithms exist, all of which factor in different components of a dataset and make different key assumptions. The algorithms studied for the purposes of this investigation were Agglomerative Hierarchical [35], Density-based spatial clustering of applications with noise (DBSCAN) [36], and k-means [37] as these are among the most popular clustering algorithms in aviation safety literature. Despite the establishment of an overall cluster hierarchy, the nature of agglomerative hierarchical clustering algorithms typically leads to poor results in document clustering given the proximity of certain clusters to each other [38]. DBSCAN clustering typically requires extensive tuning without which all the available data is classified into a single cluster with the remaining data regarded as noise. This would limit the insights that can be drawn from the effort. Thus, out of these three approaches, k-means provided the clearest results with the most distinct and relevant clusters and is selected as the main algorithm in this paper. Additionally, as the number of clusters is often determined prior to running the algorithms, there exist several different metrics used to ensure that the correct combination of technique and cluster count for that dataset is selected. The metrics used for this research are discussed more thoroughly in the next section, in the context of the results obtained.

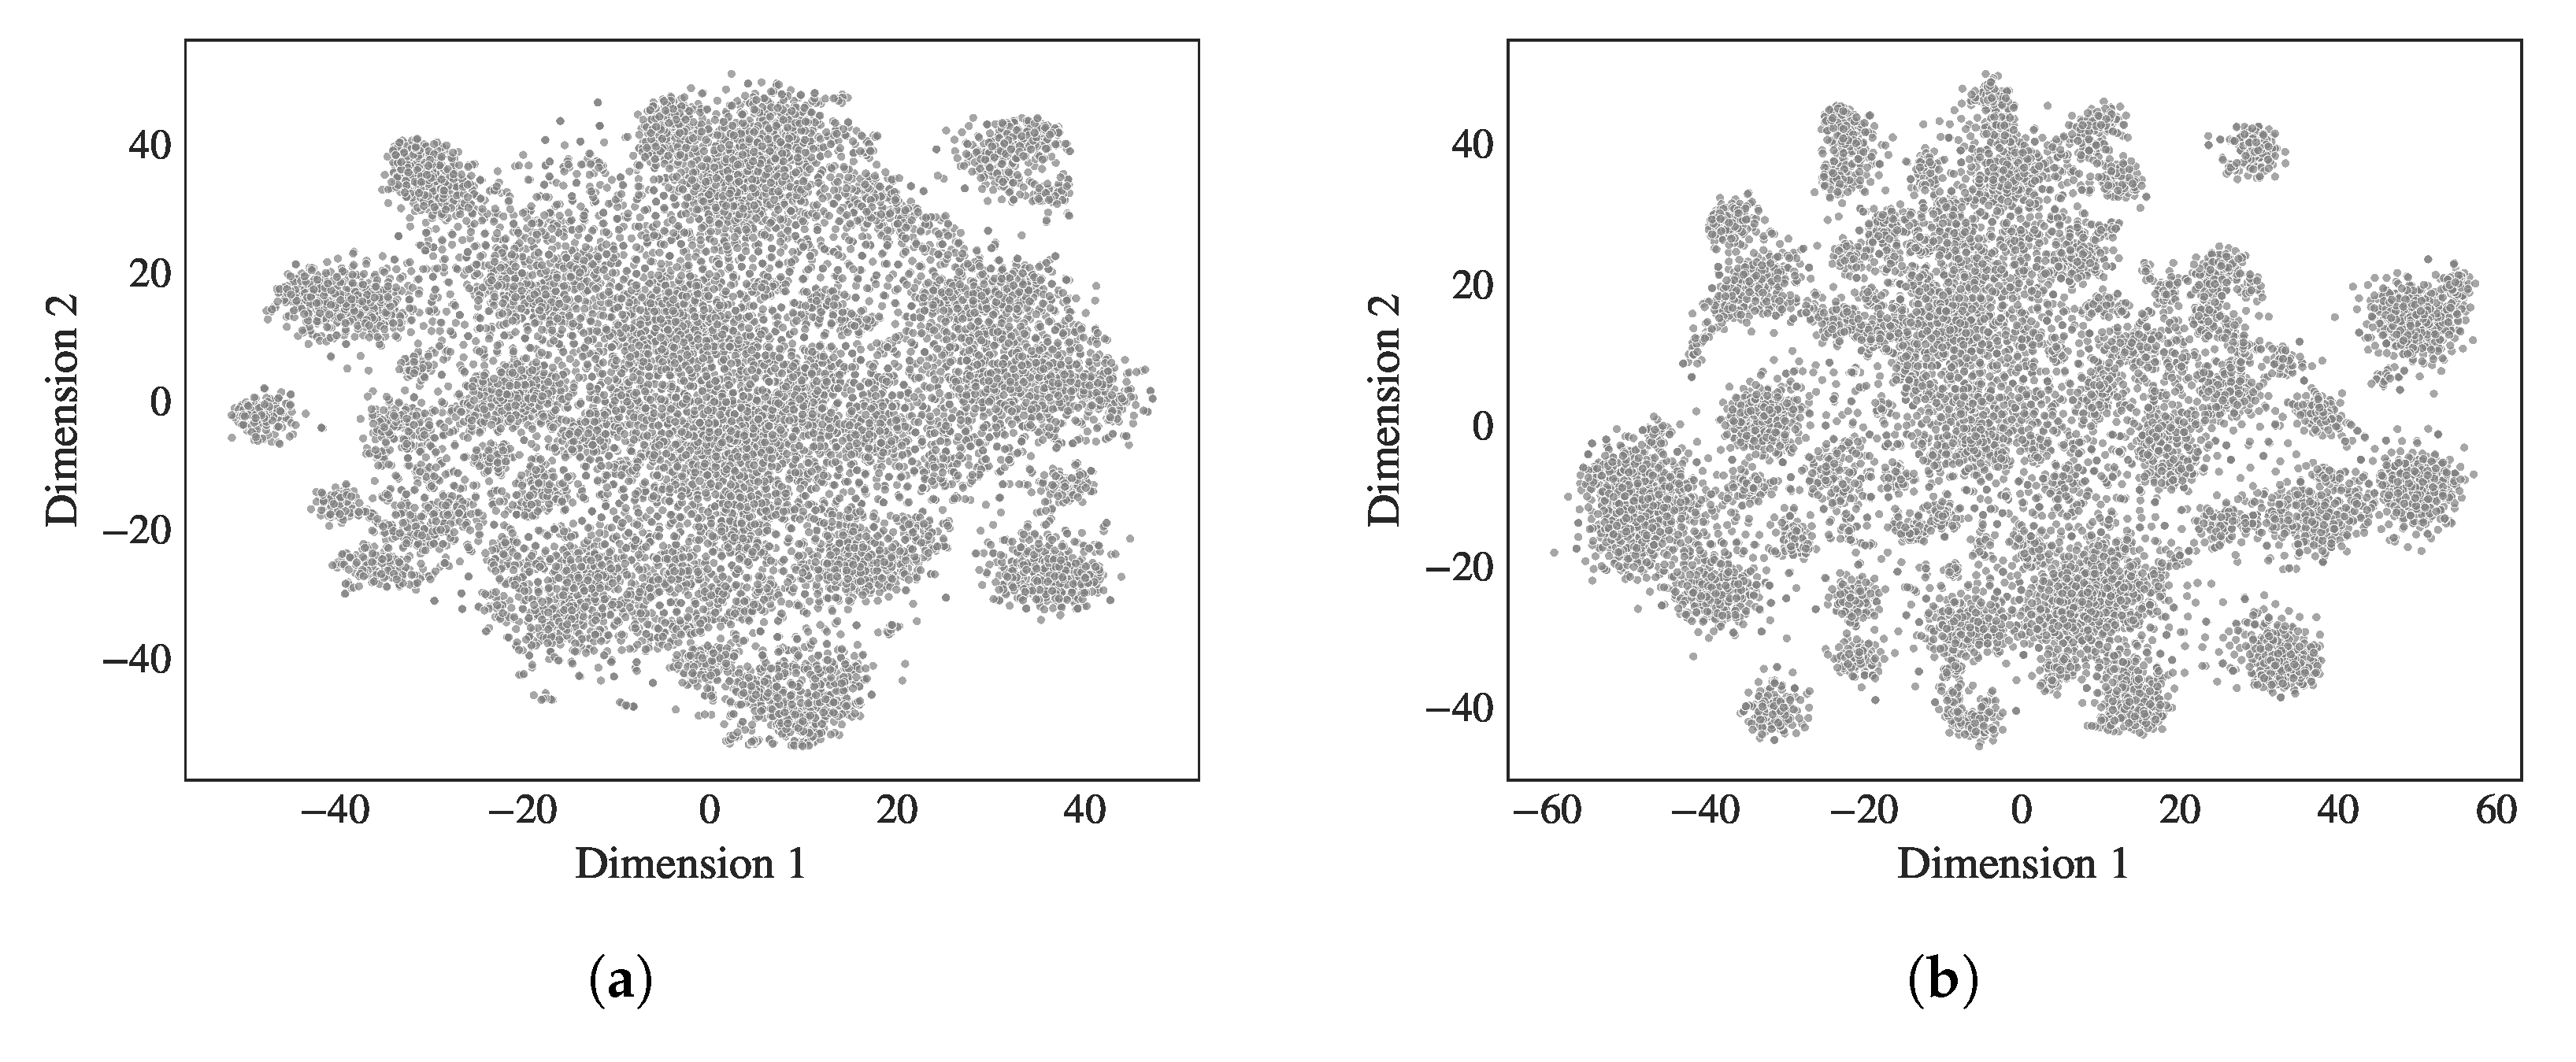
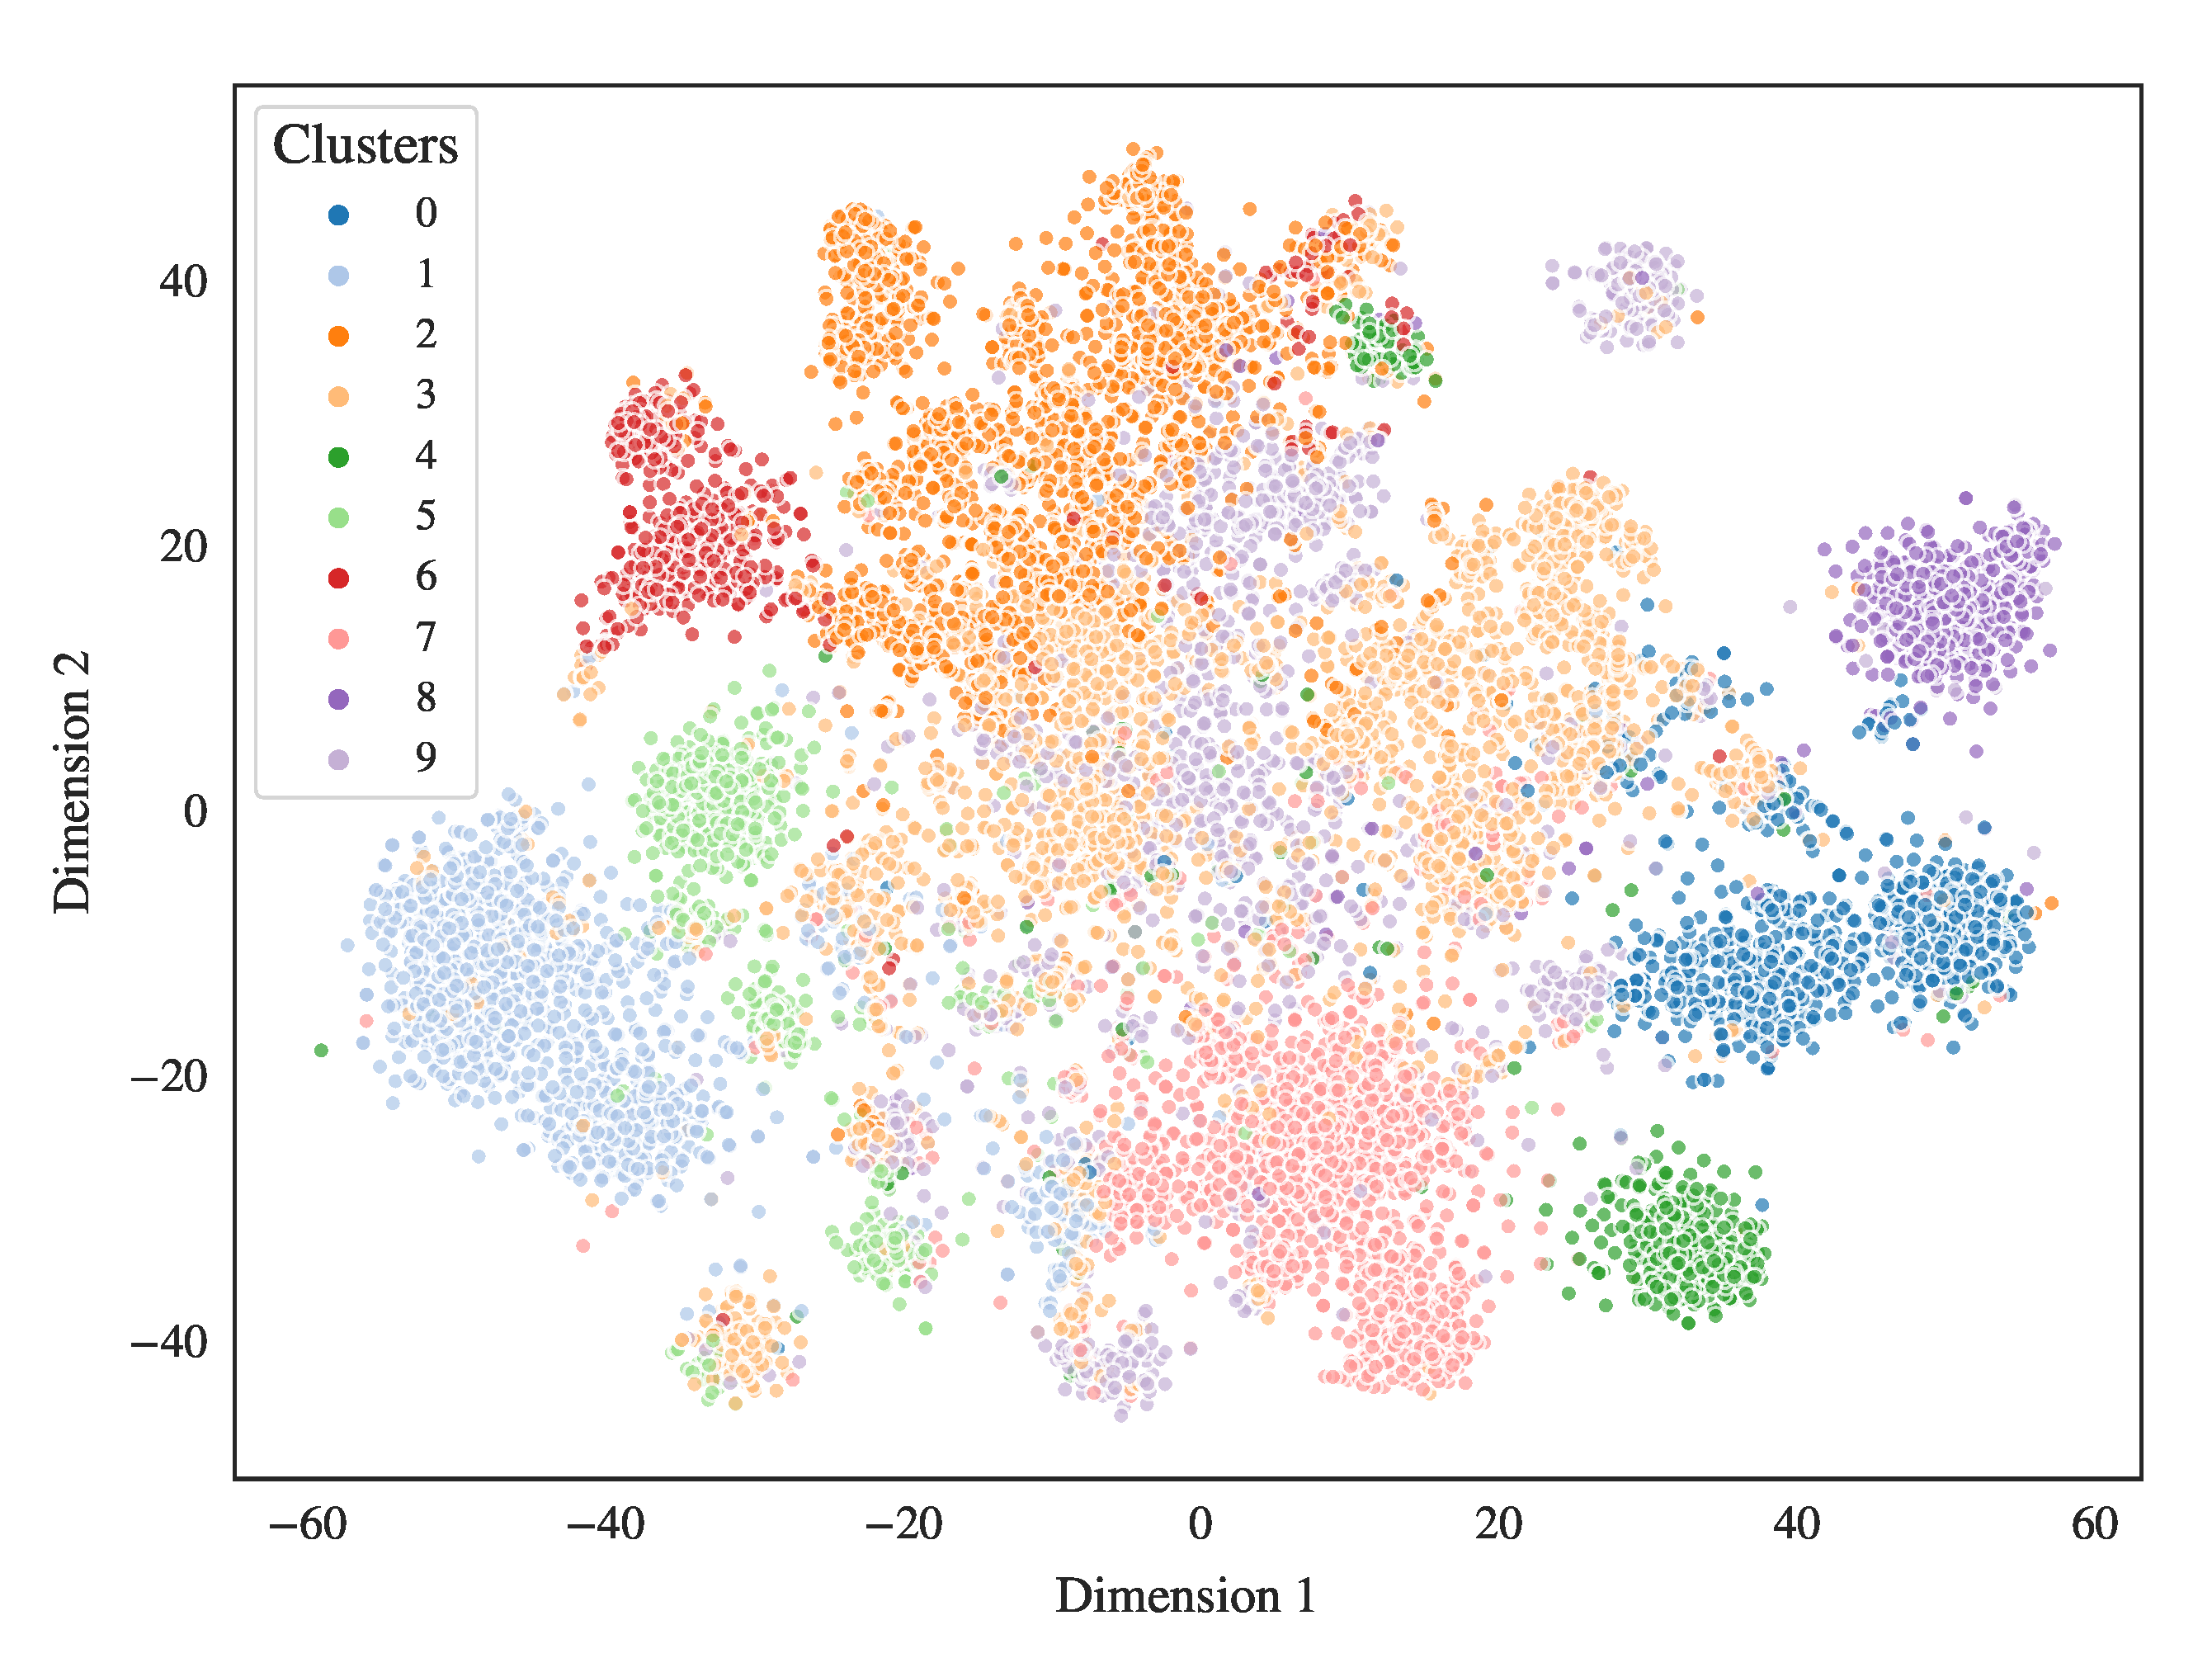
3.4. T-Sne and Visualization

The goal of applying t-SNE is to reduce the high-dimensional TF-IDF matrix generated from the text narratives into a two-dimensional plot that can be visually examined. Developed by Laurens van der Maaten and Geoffrey Hinton [39], t-SNE utilizes local relationships between high-dimensional points in order to capture non-linear structures and project them onto lower-dimensional spaces. The algorithm works by first defining a probability distribution dictating the relationship between neighboring points in high-dimensional space. This distribution is typically a Gaussian which depends on the distance between each point x i and its neighbors, with points nearest to x i being more likely to be selected as its neighbors. Once this distribution has been constructed in the high-dimensional space, it is then recreated in a lower dimension, and in order to avoid the crowding problem a Student t-distribution is selected for the reconstruction [40]. With the new distribution created, the results are then optimized through gradient descent on the Kullback-Leibler divergence between the high and low dimensional distributions. As a result, the data can be visualized on a traditional x-y plane, however the abscissa and ordinate do not possess any physical significance and points must be analyzed relative to each other. This process is conducted through python’s tsne (Sklearn t-SNE documentation: https://scikit-learn.org/stable/modules/generated/sklearn.manifold.TSNE.html) library, and is applied to the same PCA-reduced data that is used for clustering.
Thus, with a mapping of this data into two dimensions, it becomes possible to color-code and categorize points (corresponding to narratives) based on different metadata parameters, as well as based on the clustering results obtained in the previous section. These plots can then be visually analyzed in order to identify how well certain metadata parameters tend to align themselves with cluster boundaries. Concretely, one could color-code each point based on the “Anomaly” column of ASRS data, and visually examine the map to determine whether certain anomalies tend to align with specific clusters. This facilitates the identification of class categories that have a high influence on the narratives, as it highlights which metadata parameters tend to cause narratives to cluster.

3.5. Post-Processing

The post-processing conducted for this study consists in the application of statistical tools and visuals in order to examine the connections that exist between different metadata parameters and the clusters identified in the previous steps. The 2-dimensional mapping generated by t-SNE serves as an effective guide for relevant post-processing, as it can be analyzed visually as described earlier to uncover overarching trends between clusters and metadata. Given the high-dimensional nature of the clustered data, a more appropriate approach for identifying trends among clusters is plotting bar charts of specific metadata parameters by cluster in order to visualize how evenly they tend to spread across the narratives. For this study, the metadata columns selected for this kind of analysis were “Anomaly”, "”Aircraft Component” and “Make Model Name”. Additionally, it was also relevant to plot the top 10 most common words per cluster as a method of validating the metadata’s results against the data used to construct the clusters themselves. Bar plots from selected clusters are seen and discussed in detail in the “Results” section of this paper.
Furthermore, a correlation analysis was also conducted to determine how well results from certain metadata parameters align with cluster boundaries. The parameters selected for this analysis were “Date” and “Person 1-Function”, to uncover seasonal trends within certain categories of narratives, and reveal biases within the reporting agents for these narratives respectively. Plots generated through these techniques are also discussed in the "Results" section below.

4. Results

4.1. Overall Clustering Behavior

As outlined above, the dataset selected for this study comprises 13,336 ASRS event narratives, which are converted into a TF-IDF matrix representation and clustered through k-means. A t-SNE visualization of the narratives color-coded by cluster is seen in Figure 3. Each point corresponds to the TF-IDF representation of a single narrative, reduced to two dimensions. The colors represent the cluster assigned to that narrative by the k-means clustering algorithm. As outlined earlier, the axes of a t-SNE plot possess no physical significance, therefore the values for “Dimension 1” and “Dimension 2” cannot be taken to represent any specific characteristic of a narrative. However, the positions of points can be analyzed in a relative context. Weights assigned by the t-SNE algorithm based on original euclidean distance ensure that points placed close together in the visualization had a shorter distance between them in the high-dimensional space as well [41].
Similar to the issue encountered by Kauffman et al. [28] in their study of clustering involving text-based data, the traditional metrics for identifying the success of a clustering regime prove insufficient and misleading in the context of this study. The main metrics applied in determining the quality of learned clusters are Silhouette [42] score and Calinski-Harabasz (CH) [43] score, both of which pointed to extremely poor clustering results when the number of clusters was allowed to increase above 1. Nevertheless, the primary objective of this study remains to identify cause categories which drive clustering behavior in event narratives, therefore it becomes more relevant to analyze the word and content level significance of each cluster over the commonly accepted cluster purity metrics. For this, the post-processing techniques outlined earlier are applied and it is found that a cluster count of 10 provides sufficiently clear boundaries with overlap limited only to those clusters whose event categories are not as clearly defined within the narratives themselves. This cluster count was reached through repeated iteration of the k-means algorithm while sequentially increasing the number of clusters. This procedure is possible given the low computational cost of applying the technique after significant dimensionality reduction.

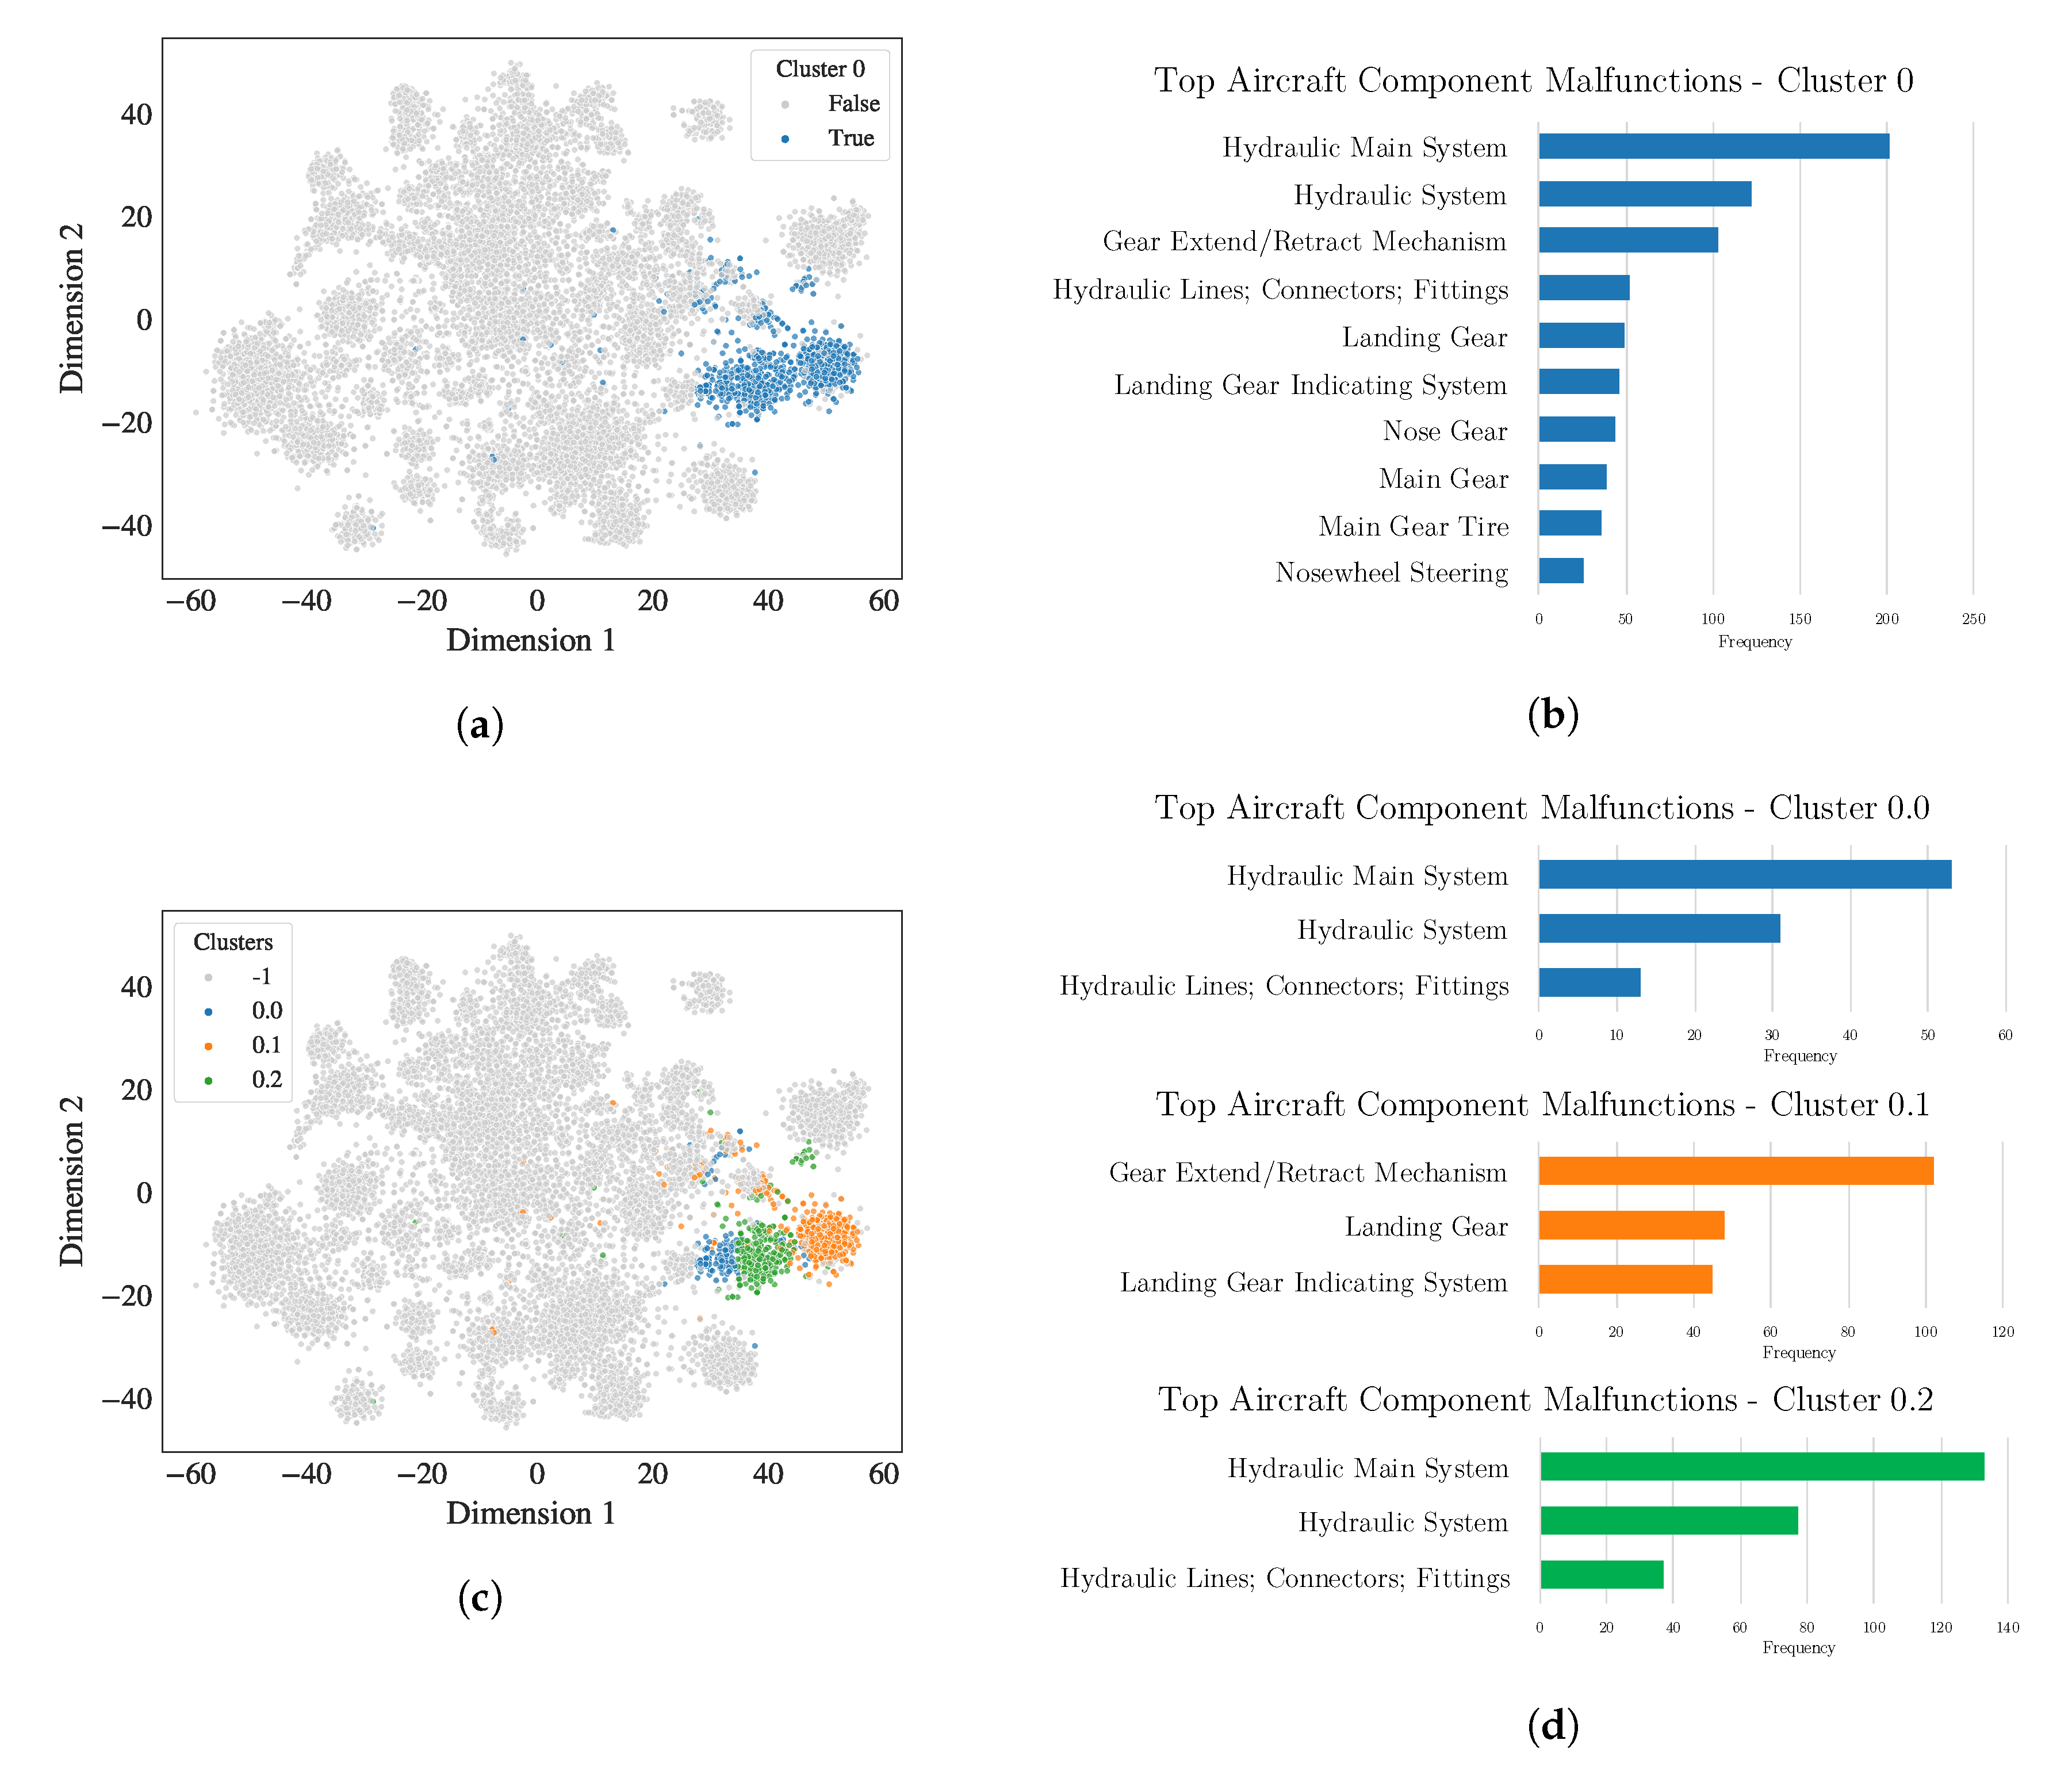
4.2. Individual Cluster Post-Processing

The results obtained from the 10 clusters can be post-processed and understood in multiple ways as demonstrated in the following sections. Two main sub-clustering behaviors stemming from precise and imprecise overarching clusters are identified and discussed in detail in Section 4.2.1 and Section 4.2.2 by highlighting specific examples which display each of them, in order to more thoroughly identify how meaningful narrative information tends to appear within the clusters. Additionally, one specific scenario relating to the post-processing of imprecise sub-clusters with little to no correlation with metadata parameters is explored in Section 4.2.3.

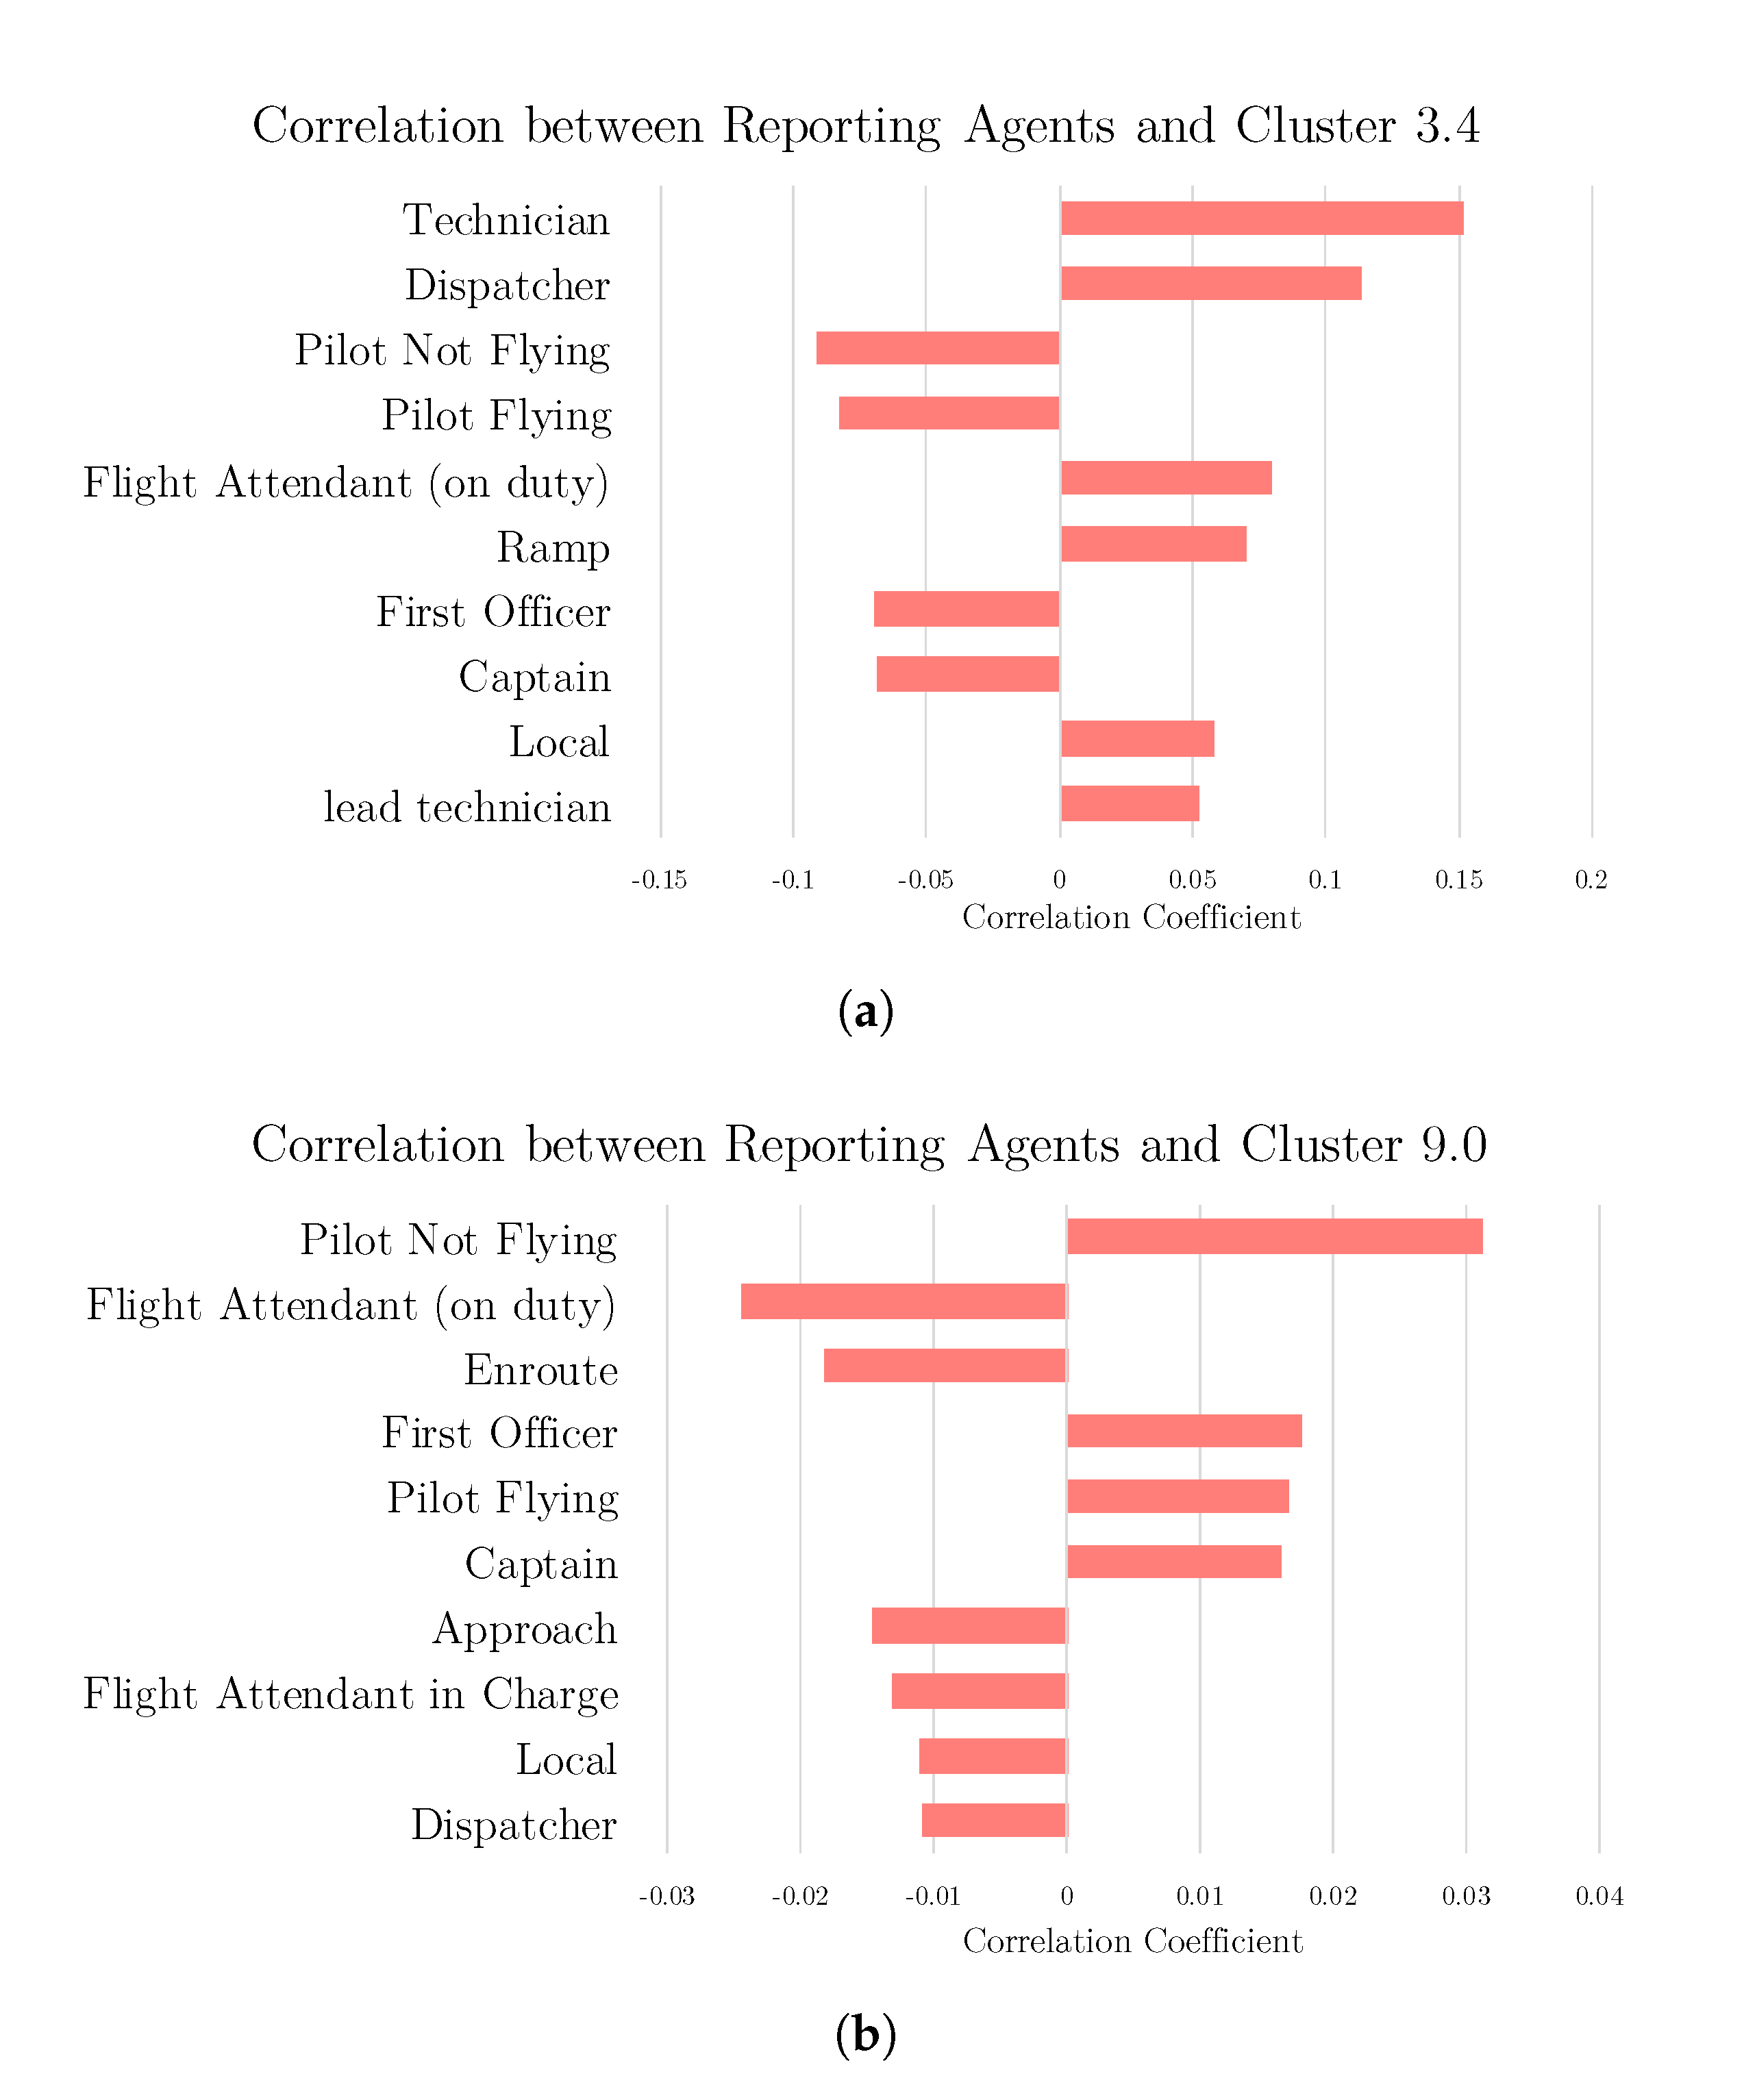
4.2.1. Precise Clusters and Sub-Clusters with High Metadata Correlation

The first sub-clustering behavior is exemplified most clearly by clusters 0 and 5 in Figure 4. Figure 4a is a highlight of Cluster 0, while Figure 4b represents a metadata bar plot for the main aircraft component which malfunctioned within flights in that cluster. From this bar plot it becomes clear that aircraft hydraulic systems are a key factor in cluster 0, however the t-SNE visualization reveals at least two distinct visual groupings of points labeled under this cluster. This lends itself to a more refined analysis of the subdivisions present within each individual cluster, for which the same routine outlined in the Methodology section (Section 3) is attempted while focusing only on the data belonging to each individual cluster. K-means is again selected as the clustering technique and the optimal number of sub-clusters is identified both through post-processing and through relative Silhouette score analysis, despite low absolute scores as discussed earlier. Each cluster was thus sub-divided into 2–5 sub-clusters, whose driving factors are clearly defined in the flights’ metadata.
Figure 4c,d represent the optimal division of sub-clusters for Cluster 0 and the metadata bar plots for each sub-cluster respectively. These plots make clear the subtle distinctions within different groups of points that are placed in the same original cluster, allowing for a deeper subdivision of Cluster 0 into both hydraulic and landing gear specific sub-clusters. These results indicate that even within well defined clusters, there exist deeper subdivisions which are sufficiently related narratively to be placed in the same overall cluster, but sufficiently distinct to possess different key metadata values. It is also relevant to note that clusters 0.0 and 0.2 possess a very similar metadata profile as seen in Figure 4d, however a closer word-level analysis of each sub-cluster revealed a reason for the distinction: an significant presence of Electronic Centralised Aircraft Monitor (ECAM) related events in cluster 0.0 which do not appear in cluster 0.2.
A similar analysis of distinct sub-clustering behavior is presented in Figure 5 for cluster 5, whose metadata indicates a strong presence of pressurization-related narratives. The structure of the figure is the same as that of Figure 4. The t-SNE visualizations of this cluster also seem to reveal at least three distinct visual groupings of points labeled under cluster 5, and this was confirmed by a deeper metadata analysis as seen in Figure 5d. Three distinct but related issues involving pressurization systems, pneumatic/bleed valves, and air conditioning are all placed within the same overall cluster, and each individual trend can only be analyzed more clearly through localized investigation of each group of points.

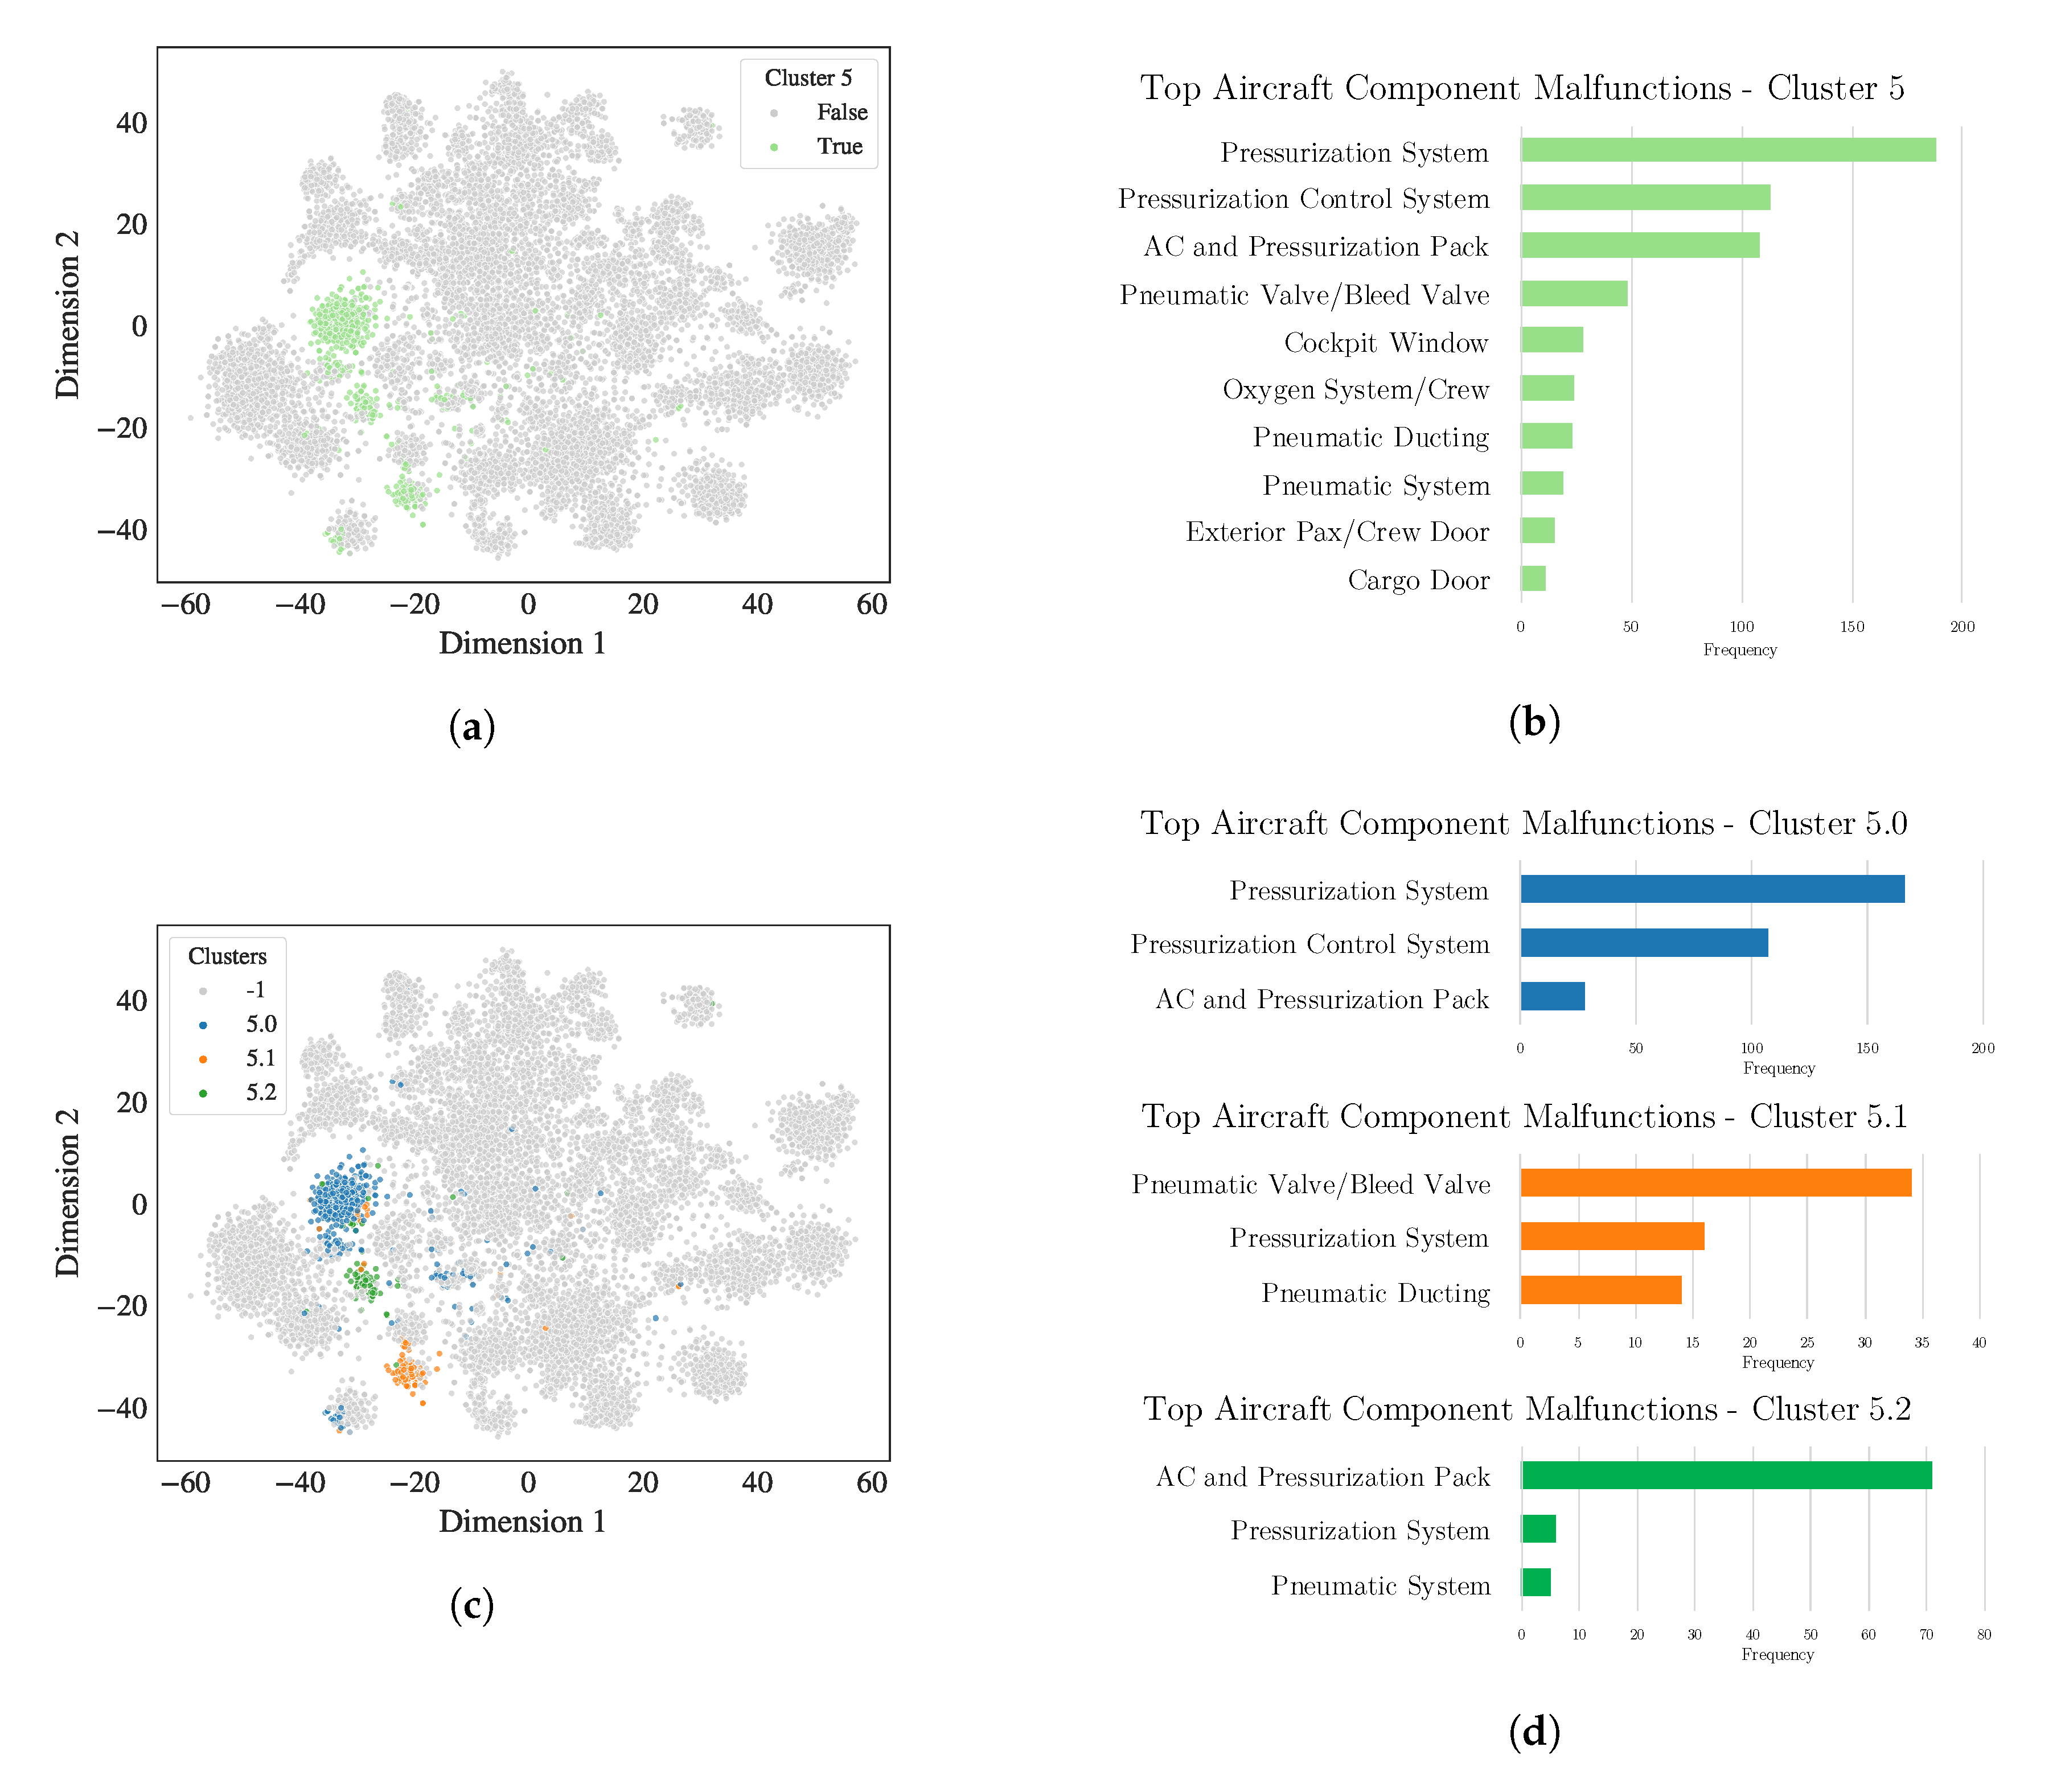
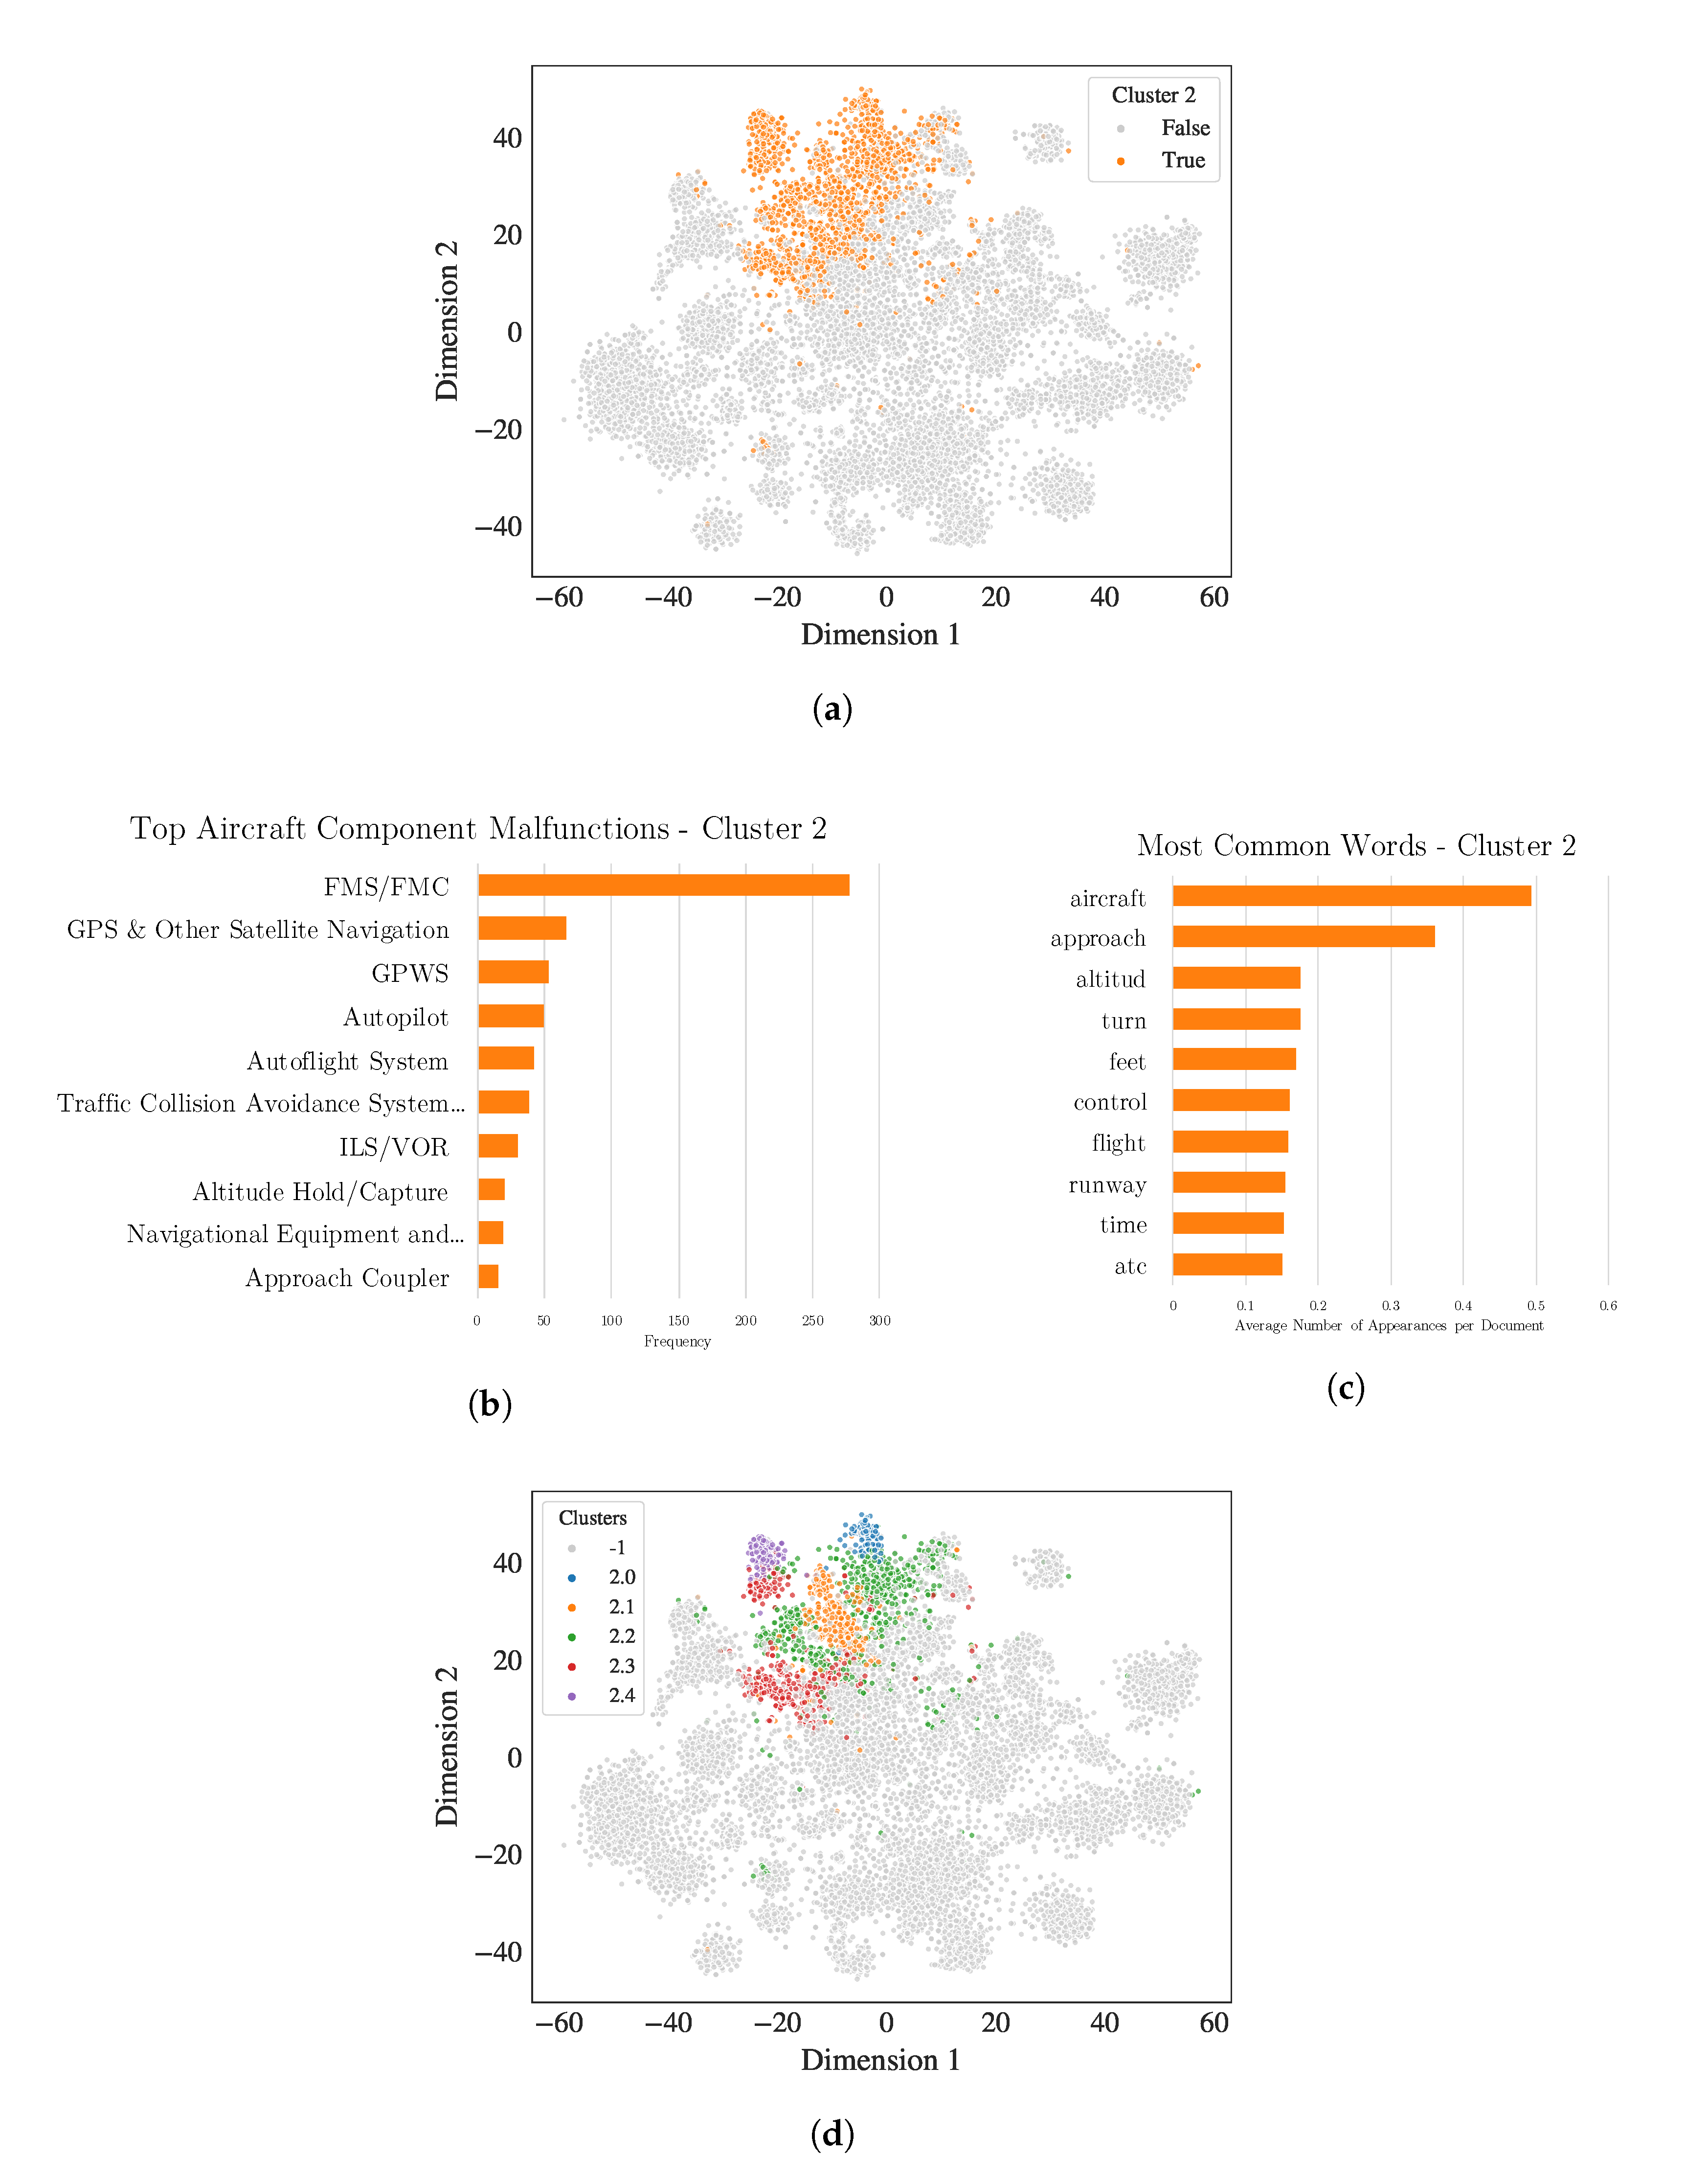
4.2.2. Imprecise Clusters with Precise Sub-Clusters and High Metadata Correlation

The second sub-clustering behavior is exemplified clearly in cluster 2, highlighted in Figure 6a, which appears significantly larger and less crisply defined than those seen in the earlier examples. Figure 6b shows the aircraft component malfunction bar plot for this cluster, and Figure 6c shows the top 10 most common words for this cluster, from which a variety of themes can be identified. Navigation and collisions appears to figure as an overarching theme, but less clearly than in the previous examples. Especially given the size of this cluster when compared to others, these results also lend themselves to a more thorough analysis in order to uncover potentially relevant sub-clusters.
The sub-cluster breakdown of Cluster 2 can be seen in Figure 6d. Clusters that exhibit a similar behavior of loose boundaries and low metadata correlation require a subdivision into more sub-clusters in order to uncover distinct trends in metadata. It was found that the navigation and collisions topic can be broken down into five distinct sub-categories, namely: terrain proximity, turns and headings, approach phase of flight, air traffic control issues, and traffic collisions. This indicates a trend in less-defined clusters of correlating with metadata parameters other than the main aircraft component which malfunctioned. The presence of the approach phase as a key driving factor for a sub-cluster, along with air traffic control issues, indicates a need to explore additional less obvious metadata parameters in order to identify the main contributing factor for each cluster.

4.2.3. Imprecise Clusters and Sub-Clusters with Low Metadata Correlation

Despite a more rigorous hierarchy-based analysis of the clustering regime, a small set of sub-clusters still present a challenge due to a lack of clear trends identifiable through metadata bar plots. Sub-clusters 3.4 and 9.0, both belonging to large and indistinct overarching clusters, prompt further exploration through the correlation analysis outlined in the “Post-processing” section in order to identify driving factors. Results from this can be seen in Figure 7a,b, which show correlation between reporting agent and sub-cluster labels for clusters 3.4 and 9.0, respectively. Cluster 9.0 shows results similar to a majority of clusters, in that positive labels tend to correlate with reports filed by pilots. Differently, labels for cluster 3.4 tend to correlate positively with reports filed by technicians and dispatchers, and correlate negatively with reports filed by pilots, a trend not observed in any other cluster. The presence of this sub-cluster within overarching cluster number 3, whose driving factor is events related to Ground Operations, supports the idea that the points assigned to it could relate to either maintenance or ground traffic issues.
Overall, this type of analysis provides a clearer indication of possibly relevant metadata patterns than a simple frequency analysis, as the overwhelming amount of reports filed by pilots often overshadows more specific characteristics of each cluster’s metadata, which can only be revealed through studies of correlation rather than absolute amounts. Ultimately, though these results do provide some insight into the nature of narratives placed within these clusters, they fail to provide enough information, even in conjunction with other metadata, to make a reasonable assumption regarding the driving factor for either of these clusters. Additionally, though an analysis of human-factor-related narratives is outside the scope of this study, it is relevant to highlight that correlations do exist between cluster labels and reporting agents. An interesting result obtained by conducting this kind of analysis was the positive correlation between labels for cluster 1, which encompasses fire and smoke events, and reports filed by flight attendants. A more refined investigation of those specific reports could serve as an avenue for further study, especially in the field of human response to different kinds of technical events.

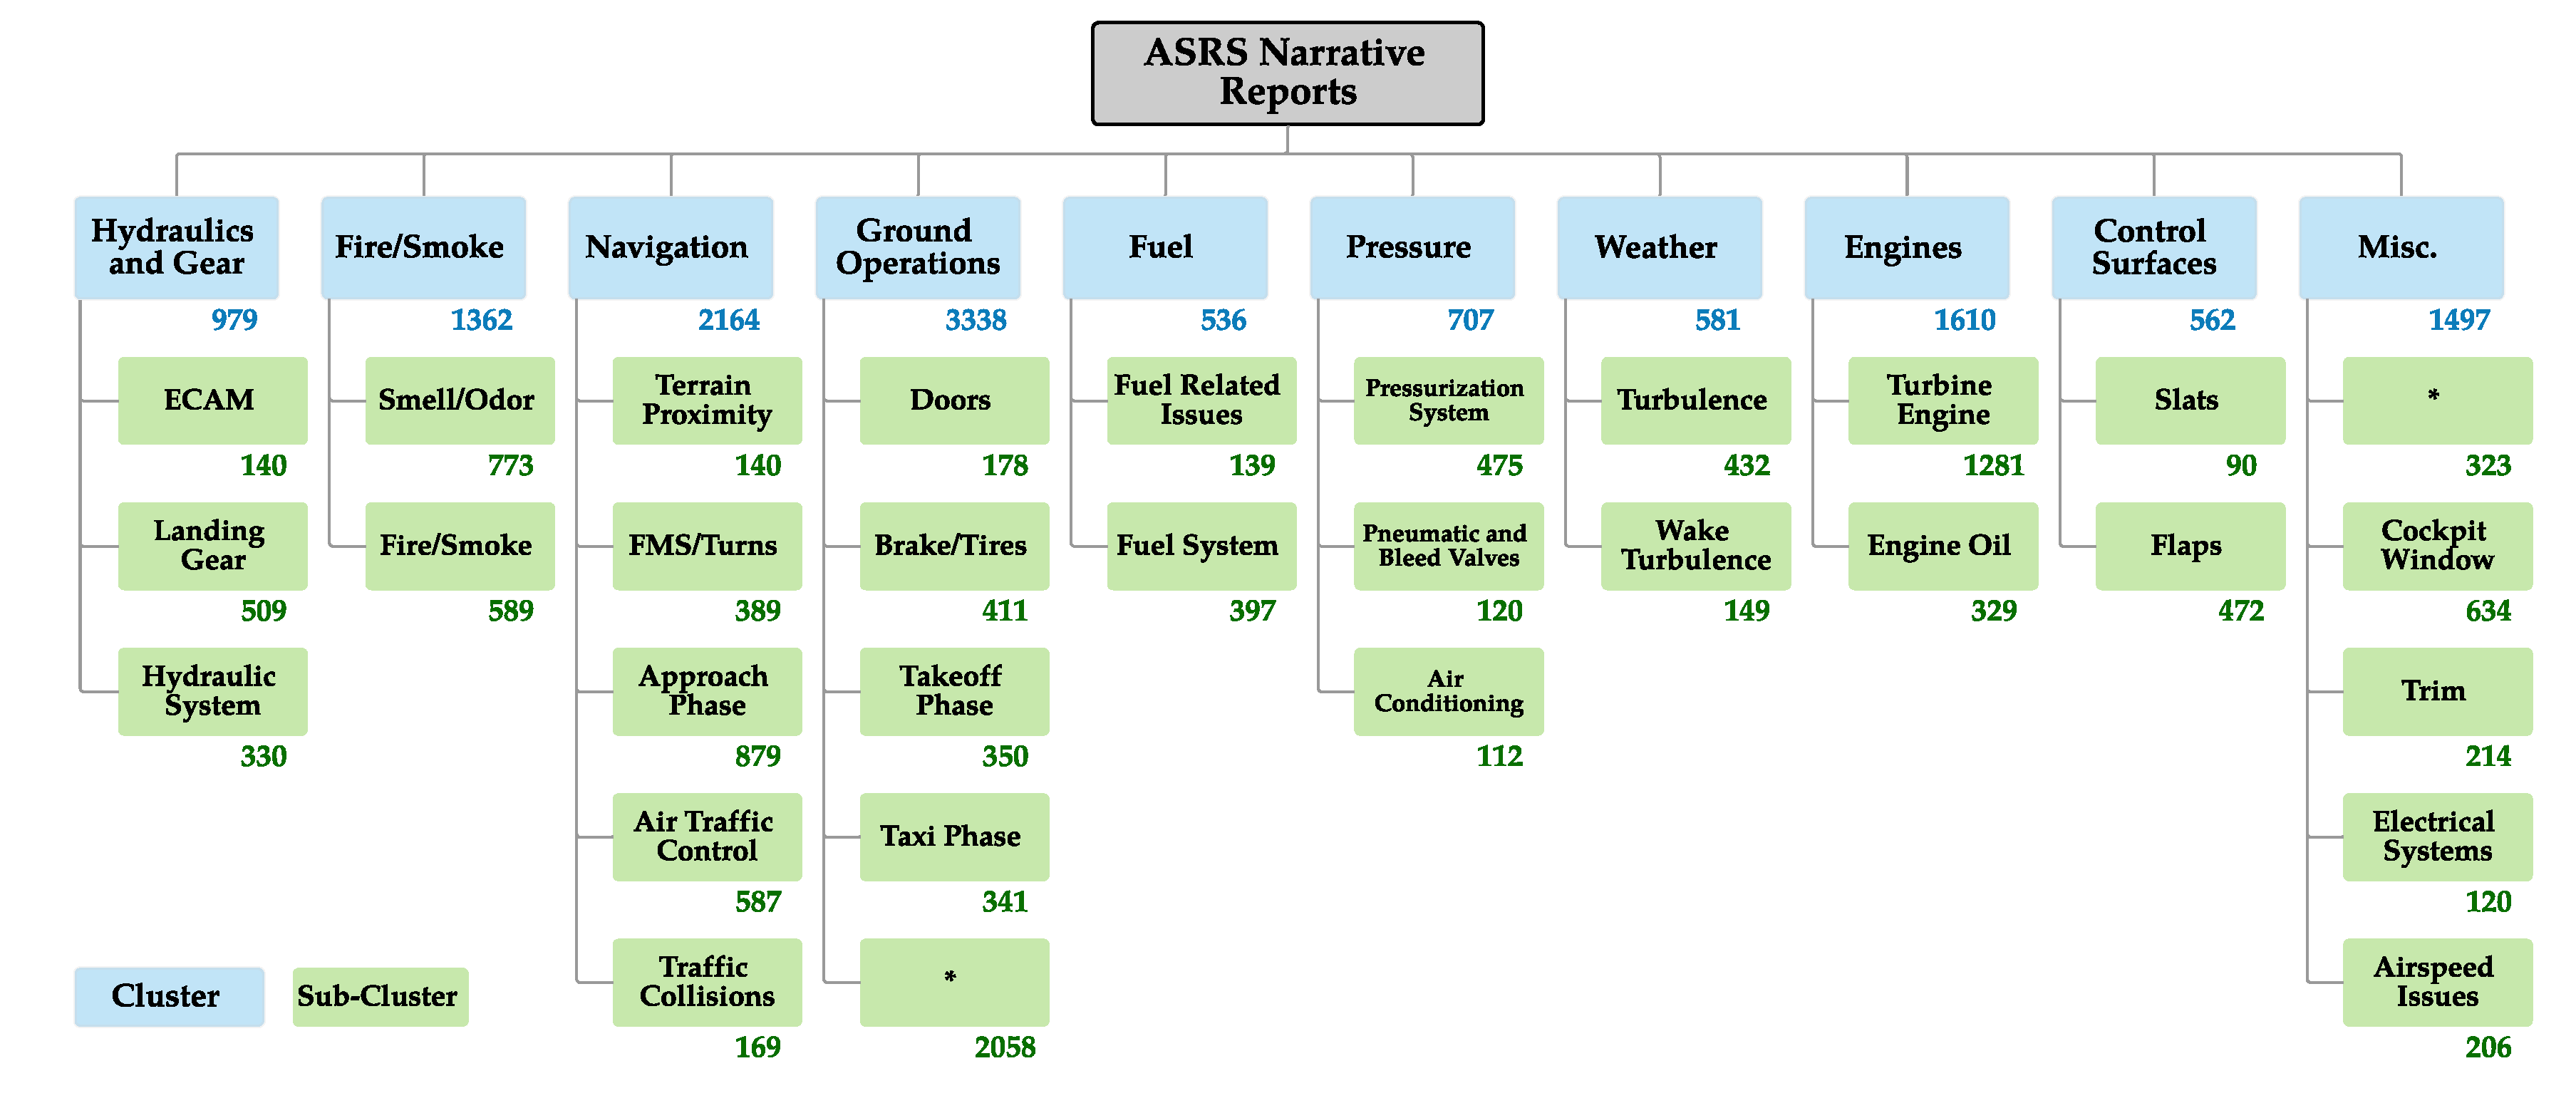
4.3. Sub-Cluster Hierarchical Structure

The procedures outlined in the previous section, when undertaken for every overarching cluster and sub-cluster, indicate that ASRS event narratives can be divided into 31 specific categories, each of which falls under one of 10 different overarching categories. Of these 31, only the two explored in Section 4.2.3 did not immediately possess a clear driving factor stemming from metadata bar plots. The hierarchical structure obtained can be seen in Figure 8. Blue boxes represent the overarching clusters identified through running the k-means algorithm on the entire dataset, while green boxes represent the individual breakdown when the algorithm is run on each cluster. The number at the corner of each box indicates the amount of narratives placed within this category. This allows for a thorough but succinct representation of the 13,336 narratives, each of which can be understood individually as well as in the context of the narratives which most closely align with it. The easy retrieval and study of individual categories of events is another benefit of this representation, allowing for metadata-based analysis on multiple levels of the hierarchy.
As such, this representation can be used to establish a new taxonomy for ASRS reports which relies on the content of the reports themselves rather than additional labels. The clustering-based approach provides additional precision in classifying narratives, which as part of a taxonomy would allow for easier retrieval and study of specific categories of events. Such a taxonomy could also be used in combination with existing, proven taxonomies like the ICAO Accident/Incident Data Reporting (ADREP) (ICAO ADREP Taxonomy: https://www.icao.int/safety/airnavigation/AIG/Pages/ADREP-Taxonomies.aspx) system, which differs from ASRS in how it labels different types of events. Despite the taxonomy generated by the clustering model not being as extensive as ADREP, the framework can be leveraged to obtain not only the set of categories that represents the different types of events, but also a method for automatically placing narratives in specific categories based on their content. This would attribute more objective and specific labels to each narrative, facilitating future metadata-based analysis.

4.4. Cluster-Anomaly Correlation

The final analysis conducted with the results of the clustering is related to an additional metadata parameter available in the data. This is the “Anomaly” column, which serves as the primary event category label for ASRS narratives. Often featuring multiple entries per narrative, the “Anomaly” column indicates a set of conditions which a flight experienced leading up to or as a result of the events described in the narrative. A closer look at three specific anomaly categories reveals another benefit of the methodology presented in this study, in terms of categorizing narratives by their key concepts.
Figure 9a depicts a highlight of cluster 1, whose driving factor is events involving fire, smoke and cabin odors. In Figure 9b, the shaded points represent those whose “Anomaly” column indicated the presence of a “Smoke/Fire/Fumes/Odor” event. There exists a clear visual similarity between these plots and a correlation analysis confirms this, yielding a correlation coefficient of 0.7952 between positive labels for Cluster 1 and for the “Smoke/Fire/Fumes/Odor” event. This indicates that in some scenarios, the clustering regime aligns fairly well with the existing categorical anomaly labels for ASRS event categories.
On the contrary, there exist certain anomaly labels which do not correlate well with any cluster boundaries, one example being the most common label in the dataset: “Aircraft Equipment Problem Critical”. The shaded points in Figure 10 represent narratives for which that label was attached in the “Anomaly” column. Table 4 presents correlation coefficients between positive labels of the “Aircraft Equipment Problem Critical” event and each cluster. It is relevant to note the slight positive correlation between this anomaly and cluster 7, whose driving factor is engine problems. This correlation can be understood intuitively, as there is a high likelihood of engine issues being reported as aircraft equipment problems. Accordingly, there exists a negative correlation between this anomaly and cluster 6, which is driven by turbulence-related narratives which do not typically feature any kind of aircraft equipment problems. These correlations are significantly weaker than those seen in the previous example, indicating a failure in the “Aircraft Equipment Problem Critical” anomaly label to adequately encapsulate a specific type of narrative. The somewhat haphazard scattering of points containing this anomaly label also supports this idea, as it encompasses too broad a spectrum of points to provide any meaningful knowledge about them. A similar behavior was observed in an entire class of anomaly labels titled “Deviation-Procedural”, which represent several categories of technical anomalies partly brought about by human factors. Ultimately, limited information is actually revealed about each narrative when simply selecting points labeled under this anomaly, which brings to light another benefit of the methodology in this paper which is that it provides a more focused and narrative-specific approach to labeling, accessing and analyzing specific types of ASRS reports. By looking at the clustering results obtained directly from narratives, one can have a better understanding of true trends in the reports.

5. Conclusions

This work demonstrates a robust and repeatable framework for the identification of class categories in relation to aviation safety event narratives through clustering and metadata analysis. A methodology for the cleaning and pre-processing of text-based data is outlined in conjunction with a clustering and visualization routine which allows for a clear set of categorical parameters to be identified as key factors in classifying event narratives. The advantages of the TF-IDF text representation model are explored in the context of clustering, and a metadata-based framework for evaluating the success of text clustering regimes is also presented. Finally, a set of 31 well-defined class categories for ASRS event narratives is presented as a case study of this methodology, along with several techniques for uncovering a class category hierarchy through post-processing and sub-clustering routines.
The case study highlights several of the practical applications of this framework when it comes to analyzing sets of data containing both subjective and objective information. However, it is relevant to note that the innately human nature of text-based data poses a challenge to any kind of automated analysis, and thus there exist certain limitations to the model. Non-technical datasets which are less likely to contain very specific vocabulary are prone to producing the results observed in Section 4.2.3, as the model relies on the words themselves to distinguish clusters. Additionally, the common tools for determining cluster validity fail to produce meaningful results in this regime, and the more subjective method of validating clusters which is applied may lead to some loss of precision. Despite these limitations, the framework excels at establishing relationships between narratives and metadata, which can shed light not only on the specific situations being explored, but also on the means through which this type of information is being stored and labeled. In particular, as mentioned earlier, there exist certain categories identified by the clustering regime which are not obviously shown in metadata, implying that certain small but no less distinct sets of narratives are being included in broader metadata categories where they are often overshadowed and difficult to identify. A clustering-based approach also lends itself to more in-depth analyses of individual groups of points, as little extra work is required in identifying which narratives hold key similarities. In the airline industry especially, this allows for more effective comparisons between incidents on individual fleets and the overall collective of aviation safety events. The model is thus generalizable enough that it can be applied not only to specific ASRS reports, but any kind of text-based data which is likely to discuss a variety of topics and contain specific vocabulary. Ultimately, as techniques for remote monitoring and documentation of in-flight events evolve and diversify, so does the complexity of the data collected, and frameworks which can successfully merge and analyze different types of data will prove vital in uncovering relationships which traditionally isolated investigations would miss.

Author Contributions

Conceptualization and Methodology, T.G.P. Data Curation, Implementation, and Data analysis, R.L.R., Writing—original draft, R.L.R. and T.G.P., Visualization, R.L.R.; Writing—review and editing, T.G.P.; Supervision, T.G.P.; Resources, D.N.M.; Project Administration, D.N.M. All authors have read and agreed to the published version of the manuscript.

Funding

This research received no external funding.

Acknowledgments

The authors would like to thank Michelle Kirby, Olivia Fischer, and Alexia Payan for their feedback and comments.

Conflicts of Interest

The authors declare no conflict of interest.

Abbreviations

The following abbreviations are used in this manuscript:
ACARSAircraft Communication Addressing Reporting Systems
ADREPAccident/Incident Data Reporting
ASRSAviation Safety Reporting System
ATCAir Traffic Control
BoWBag-of-Words
CHCalisnki-Harabasz
CVRCockpit Voice Recorder
DBSCANDensity-based spatial clustering of applications with noise
ECAMElectronic Centralised Aircraft Monitor
FAAFederal Aviation Administration
FDRFlight Data Recorder
FOQAFlight Operations Quality Assurance
ICAOInternational Civil Aviation Organization
PCAPrincipal Component Analysis
t-SNEt-distributed Stochastic Neighbor Embedding
TF-IDFTerm-Frequency-Inverse-Document-Frequency

References

  1. Statistical Summary of Commercial Jet Airplane Accidents-Boeing Commercial Airplanes. 2018. Available online: http://www.boeing.com/resources/boeingdotcom/company/about_bca/pdf/statsum.pdf (accessed on 1 August 2020).
  2. Federal Aviaition Administration Aerospace Forecasts Fiscal Years 2019–2039. 2019. Available online: https://www.faa.gov/data_research/aviation/aerospace_forecasts/media/FY2019-39_FAA_Aerospace_Forecast.pdf (accessed on 1 August 2020).
  3. Puranik, T.G.; Mavris, D.N. Identification of Instantaneous Anomalies in General Aviation Operations using Energy Metrics. J. Aerosp. Inf. Syst. 2019, 17, 1–15. [Google Scholar] [CrossRef]
  4. Memarzadeh, M.; Matthews, B.; Avrekh, I. Unsupervised Anomaly Detection in Flight Data Using Convolutional Variational Auto-Encoder. Aerospace 2020, 7, 115. [Google Scholar] [CrossRef]
  5. Deshmukh, R.; Hwang, I. Incremental-Learning-Based Unsupervised Anomaly Detection Algorithm for Terminal Airspace Operations. J. Aerosp. Inf. Syst. 2019, 16, 362–384. [Google Scholar] [CrossRef]
  6. Janakiraman, V.M.; Matthews, B.; Oza, N. Discovery of precursors to adverse events using time series data. In Proceedings of the 2016 SIAM International Conference on Data Mining, Miami, FL, USA, 5–7 May 2016; pp. 639–647. [Google Scholar] [CrossRef] [Green Version]
  7. Ackley, J.; Puranik, T.G.; Mavris, D.N. A Supervised Learning Approach for Safety Event Precursor Identification in Commercial Aviation. In Proceedings of the AIAA Aviation Forum, Reno, Mexico, 15–19 June 2020. [Google Scholar] [CrossRef]
  8. Lee, H.; Madar, S.; Sairam, S.; Puranik, T.G.; Payan, A.P.; Kirby, M.; Pinon, O.J.; Mavris, D.N. Critical Parameter Identification for Safety Events in Commercial Aviation Using Machine Learning. Aerospace 2020, 7, 73. [Google Scholar] [CrossRef]
  9. Mangortey, E.; Monteiro, D.; Ackley, J.; Gao, Z.; Puranik, T.; Kirby, M.; Pinon, O.; Mavris, D. Application of Machine Learning Techniques to Parameter Selection for Flight Risk Identification. In Proceedings of the AIAA SciTech Forum, Orlando, FL, USA, 6–10 January 2020. [Google Scholar] [CrossRef]
  10. Federal Aviation Administration Advisory Circular, 120-82-Flight Operational Quality Assurance. 2004. Available online: https://www.faa.gov/regulations_policies/advisory_circulars/index.cfm/go/document.information/documentID/23227 (accessed on 1 August 2020).
  11. Maheshwari, A.; Davendralingam, N.; DeLaurentis, D. A Comparative Study of Machine Learning Techniques for Aviation Applications. In Proceedings of the AIAA Aviation Forum, Atlanta, GA, USA, 25–29 June 2018. [Google Scholar] [CrossRef]
  12. Christopher, A.A.; Vivekanandam, V.S.; Anderson, A.A.; Markkandeyan, S.; Sivakumar, V. Large-scale data analysis on aviation accident database using different data mining techniques. Aeronaut. J. 2016, 120, 1849–1866. [Google Scholar] [CrossRef]
  13. Omar Alkhamisi, A.; Mehmood, R. An Ensemble Machine and Deep Learning Model for Risk Prediction in Aviation Systems. In Proceedings of the 2020 6th Conference on Data Science and Machine Learning Applications (CDMA), Riyadh, Saudi Arabia, 4–5 March 2020; pp. 54–59. [Google Scholar]
  14. Zhang, X.; Mahadevan, S. Ensemble machine learning models for aviation incident risk prediction. Decis. Support Syst. 2019, 116, 48–63. [Google Scholar] [CrossRef]
  15. Korvesis, P.; Besseau, S.; Vazirgiannis, M. Predictive Maintenance in Aviation: Failure Prediction from Post-Flight Reports. In Proceedings of the 2018 IEEE 34th International Conference on Data Engineering (ICDE), Paris, France, 16–19 April 2018; pp. 1414–1422. [Google Scholar]
  16. Gui, G.; Liu, F.; Sun, J.; Yang, J.; Zhou, Z.; Zhao, D. Flight Delay Prediction Based on Aviation Big Data and Machine Learning. IEEE Trans. Veh. Technol. 2020, 69, 140–150. [Google Scholar] [CrossRef]
  17. Gürbüz, F.; Özbakir, L.; Yapici, H. Classification rule discovery for the aviation incidents resulted in fatality. Knowl. Based Syst. 2009, 22, 622–632. [Google Scholar] [CrossRef]
  18. Srinivasan, P.; Nagarajan, V.; Mahadevan, S. Mining and Classifying Aviation Accident Reports. In Proceedings of the AIAA Aviation 2019 Forum, Dallas, TX, USA, 17–21 June 2019. [Google Scholar] [CrossRef]
  19. Chowdhary, K.R. Natural Language Processing. In Fundamentals of Artificial Intelligence; Springer: New Delhi, India, 2020; pp. 603–649. [Google Scholar] [CrossRef]
  20. Pimm, C.; Raynal, C.; Tulechki, N.; Hermann, E.; Caudy, G.; Tanguy, L. Natural Language Processing (NLP) tools for the analysis of incident and accident reports. In Proceedings of the International Conference on Human-Computer Interaction in Aerospace (HCI-Aero), Brussels, Belgium, 12–14 September 2012. [Google Scholar]
  21. Tanguy, L.; Tulechki, N.; Urieli, A.; Hermann, E.; Raynal, C. Natural language processing for aviation safety reports: From classification to interactive analysis. Comput. Ind. 2016, 78, 80–95. [Google Scholar] [CrossRef] [Green Version]
  22. Subramanian, S.V.; Rao, A.H. Deep-learning Based Time Series Forecasting of Go-around Incidents in the National Airspace System. In Proceedings of the 2018 AIAA Modeling and Simulation Technologies Conference, Kissimmee, FL, USA, 8–12 January 2018; p. AIAA 2018-0424. [Google Scholar] [CrossRef]
  23. Kuhn, K. Using structural topic modeling to identify latent topics and trends in aviation incident reports. Transp. Res. Part Emerg. Technol. 2018, 87, 105–122. [Google Scholar] [CrossRef]
  24. Ghaoui, L.; Pham, V.; Li, G.; Duong, V.; Srivastava, A.; Bhaduri, K. Understanding Large Text Corpora via Sparse Machine Learning. Stat. Anal. Data Min. 2013, 6. [Google Scholar] [CrossRef] [Green Version]
  25. Tibshirani, R. Regression Shrinkage and Selection Via the Lasso. J. R. Stat. Soc. Ser. B (Methodol.) 1996, 58, 267–288. [Google Scholar] [CrossRef]
  26. Srivastava, A. Enabling the discovery of recurring anomalies in aerospace problem reports using high-dimensional clustering techniques. In Proceedings of the 2006 IEEE Aerospace Conference, Big Sky, MT, USA, 4–11 March 2006; p. 17. [Google Scholar] [CrossRef]
  27. Robinson, S. Visual representation of safety narratives. Saf. Sci. 2016, 88, 123–128. [Google Scholar] [CrossRef]
  28. Kauffmann, J.; Esders, M.; Montavon, G.; Samek, W.; Müller, K. From Clustering to Cluster Explanations via Neural Networks. arXiv 2019, arXiv:1906.07633. [Google Scholar]
  29. Potdar, K.; Pardawala, T.; Pai, C. A Comparative Study of Categorical Variable Encoding Techniques for Neural Network Classifiers. Int. J. Comput. Appl. 2017, 175, 7–9. [Google Scholar] [CrossRef]
  30. Rajaraman, A.; Ullman, J.D. Data Mining. In Mining of Massive Datasets; Cambridge University Press: Cambridge, UK, 2011; pp. 1–17. [Google Scholar] [CrossRef]
  31. Qaiser, S.; Ali, R. Text Mining: Use of TF-IDF to Examine the Relevance of Words to Documents. Int. J. Comput. Appl. 2018, 181. [Google Scholar] [CrossRef]
  32. Madhulatha, T.S. An Overview on Clustering Methods. IOSR J. Eng. 2012, 2. [Google Scholar] [CrossRef]
  33. Patro, S.G.K.; Sahu, K.K. Normalization: A Preprocessing Stage. arXiv 2015, arXiv:1503.06462. [Google Scholar] [CrossRef]
  34. Wold, S.; Esbensen, K.; Geladi, P. Principal component analysis. Chemom. Intell. Lab. Syst. 1987, 2, 37–52. [Google Scholar] [CrossRef]
  35. Salvador, S.; Chan, P. Determining the Number of Clusters/Segments in Hierarchical Clustering/Segmentation Algorithms. In Proceedings of the International Conference on Tools for Artificial Intelligence (ICTAI), Boca Raton, FL, USA, 15–17 November 2004; pp. 576–584. [Google Scholar] [CrossRef] [Green Version]
  36. Ester, M.; Kriegel, H.P.; Sander, J.; Xu, X. A Density-based Algorithm for Discovering Clusters in Large Spatial Databases with Noise; Kdd: Washington, DC, USA, 1996; Volume 96, pp. 226–231. [Google Scholar]
  37. Likas, A.; Vlassis, N.; Verbeek, J.J. The global k-means clustering algorithm. Pattern Recognit. 2003, 36, 451–461. [Google Scholar] [CrossRef] [Green Version]
  38. Zhao, Y.; Karypis, G. Evaluation of Hierarchical Clustering Algorithms for Document Datasets. Int. Conf. Inf. Knowl. Manag. Proc. 2002. [Google Scholar] [CrossRef]
  39. van der Maaten, L.; Hinton, G. Visualizing Data using t-SNE. J. Mach. Learn. Res. 2008, 9, 2579–2605. [Google Scholar]
  40. Gisbrecht, A.; Schulz, A.; Hammer, B. Parametric nonlinear dimensionality reduction using kernel t-SNE. Neurocomputing 2015, 147, 71–82. [Google Scholar] [CrossRef] [Green Version]
  41. Linderman, G.C.; Steinerberger, S. Clustering with t-SNE, Provably. SIAM J. Math. Data Sci. 2019, 1, 313–332. [Google Scholar] [CrossRef] [Green Version]
  42. Thinsungnoen, T.; Kaoungku, N.; Durongdumronchai, P.; Kerdprasop, K.; Kerdprasop, N. The Clustering Validity with Silhouette and Sum of Squared Errors. In Proceedings of the International Conference on Industrial Application Engineering, Kitakyushu, Japan, 28–31 March 2015; pp. 44–51. [Google Scholar] [CrossRef] [Green Version]
  43. Liu, Y.; Li, Z.; Xiong, H.; Gao, X.; Wu, J. Understanding of Internal Clustering Validation Measures. In Proceedings of the IEEE International Conference on Data Mining, Sydney, Australia, 13–17 December 2010; pp. 911–916. [Google Scholar] [CrossRef]
Figure 1. Methodology for classification and visualization of safety narratives.
Aerospace 07 00143 g001
Figure 2. t-Distributed Stochastic Neighbor Embedding (t-SNE) visualization of narratives through Bag-of-Words and TF-IDF models. (a) Bag-of-Words Model. (b) TF-IDF Model.
Aerospace 07 00143 g002
Figure 3. t-SNE visualization of K-means clustering results with 10 clusters.
Aerospace 07 00143 g003
Figure 4. Highlight of cluster 0 and its sub-clusters, including most common aircraft component malfunction metadata plots. (a) Highlight of Cluster 0. (b) Cluster 0 Aircraft Component. (c) Highlight of Cluster 0 Sub-Clusters. (d) Sub-Cluster Aircraft Component.
Aerospace 07 00143 g004
Figure 5. Highlight of cluster 5 and its sub-clusters, including most common aircraft component malfunction metadata plots. (a) Highlight of Cluster 5. (b) Cluster 5 Aircraft Component. (c) Highlight of Cluster 5 Sub-Clusters. (d) Sub-Cluster Aircraft Components.
Aerospace 07 00143 g005
Figure 6. Highlight of cluster 2 and its sub-clusters, including most common aircraft component malfunction, and top 10 most common words in narratives for that cluster. (a) Highlight of Cluster 2. (b) Cluster 2 Aircraft Component. (c) Most CommonWords based on Average Count per Document. (d) Highlight of Cluster 2 Sub-Clusters.
Aerospace 07 00143 g006
Figure 7. Correlation coefficient between labels for clusters 3.4 and 9.0, and specific reporting agents. (a) Cluster 3.4. (b) Cluster 9.0.
Aerospace 07 00143 g007
Figure 8. Sub-cluster hierarchy identified for each cluster.
Aerospace 07 00143 g008
Figure 9. Side-by-side of Cluster 1 and narratives labeled as having a Smoke/Fire/Fumes/Odor Event. (a) Highlight of Cluster 1. (b) Presence of Smoke/Fire/Fumes/Odor Event.
Aerospace 07 00143 g009
Figure 10. Presence of “Aircraft Equipment Problem Critical” Event.
Aerospace 07 00143 g010
Table 1. Sample Aviation Safety Reporting System (ASRS) table including select relevant columns.
TimeEnvironmentAircraft 1Person 1EventsReport 1...
DateWeatherMake Model NameFunctionAnomalyNarrative...
January 2019RainB737Captain;
Pilot Flying
Aircraft Equipment
Problem Critical
During taxi out,
ATC alerted us...
...
January 2019 Large
Transport
Captain;
Pilot Flying
Deviation: Procedural
Published Material/Policy
The purpose of
this report...
...
January 2019RainB737GroundATC Issue;
Ground Conflict
I was working GC
(ground control)...
...
January 2019WindshearB757Captain;
Pilot Flying
Aircraft Equipment
Problem Less Severe
I was the Captain
on flight XXX...
...
January 2019 EMB ERJ 145First Officer;
Pilot Not Flying
Aircraft Equipment
Problem Critical
After landing at
ZZZ on Runway...
...
.....................
Table 2. Notional one-hot encoding procedure for two categorical variables.
Non-Encoded Data One-Hot Encoded Data
AircraftFlight Phase B737B757A320A330TakeoffCruiseLanding
B737Takeoff 1000100
B757Cruise 0100010
B737Landing1000001
A320Cruise 0001010
B757Landing 0100001
A330Landing 0001001
B737Takeoff 1000100
Table 3. Notional Bag-of-Words and term-frequency inverse-document-frequency (TF-IDF) Matrices.
Bag-of-Words MatrixTF-IDF Matrix
AircraftLandWeatherRunwayFire AircraftLandWeatherRunwayFire
D165400D10.2230.1860.61100
D21512090D20.2230.17900.3060
D3980107D30.2010.17900.5111.13
D420300D40.14900.91600
D504070D500.12700.5110
Table 4. Correlation Coefficient between “Aircraft Equipment Problem Critical” event and cluster labels.
ClusterCorrelation Coefficient
00.0982
1−0.0855
2−0.2671
3−0.0991
40.0151
50.1518
6−0.1609
70.2848
80.0554
90.1066

