Article

Fault Tolerant Control of an Experimental Flexible Wing

Institute of System Dynamics and Control, German Aerospace Center (DLR), 82234 Wessling, Germany
*
Author to whom correspondence should be addressed.
Aerospace 2019, 6(7), 76; https://doi.org/10.3390/aerospace6070076
Submission received: 6 June 2019 / Revised: 25 June 2019 / Accepted: 27 June 2019 / Published: 30 June 2019

Abstract

:
Active control techniques are a key factor in today’s aircraft developments to reduce structural loads and thereby enable highly efficient aircraft designs. Likewise, increasing the autonomy of aircraft systems aims to maintain the highest degree of operational performance also in fault scenarios. Motivated by these two aspects, this article describes the design and validation of a fault tolerant gust load alleviation control system on a flexible wing in a wind tunnel. The baseline gust load alleviation controller isolates and damps the weakly damped first wing bending mode. The mode isolation is performed via an H 2 -optimal blending of control inputs and measurement outputs, which allows for the design of a simple single-input single-output controller to actively damp the mode. To handle actuator faults, a control allocation scheme based on quadratic programming is implemented, which distributes the required control energy to the remaining available control surfaces. The control allocation is triggered in fault scenarios by a fault detection scheme developed to monitor the actuators using nullspace based filter design techniques. Finally, the fault tolerant control scheme is verified by wind tunnel experiments.

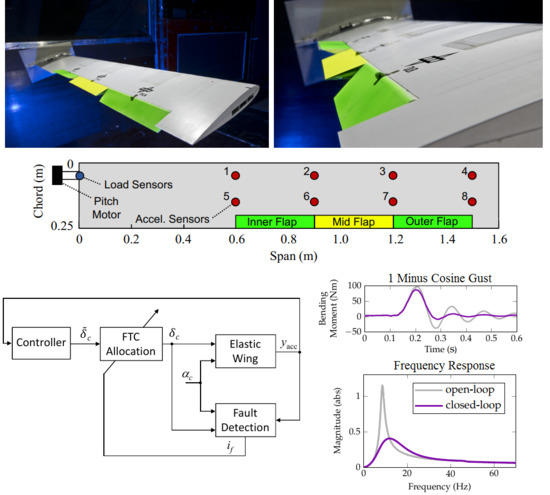
Graphical Abstract

1. Introduction

Today’s aircraft manufacturers are eager to fulfill the greener imperative demanded by society and allow for a more economic operation of aircraft. Besides the efficiency of engines and aerodynamics, the aircraft weight is a key factor for increased aircraft performance and decreased fuel costs. Active control techniques can alleviate wing gust loads. This alleviation allows to relax the structural design constraints and reducing weight, see for example, References [1,2,3]. Another main field of interest in the aircraft industry is the increase of flight autonomy. Providing the highest degree of automation enables the most efficient aircraft operation [4,5]. Future gust load alleviation systems must not only be high performing algorithms but also provide autonomy in case of faults. Thus, in the work presented herein, a fault tolerant gust load alleviation system is designed and experimentally verified in a wind tunnel test campaign.
The developed control system herein consists of three main parts: a baseline controller to mitigate the loads in the wing; a fault detection system to monitor the actuator condition; and a reconfigurable control allocation allowing to mitigate the fault effect when detected. To reduce structural loads, damping needs to be added to the aeroelastic system. This is achieved by blending the control inputs and measurement outputs such that the aeroelastic mode causing the largest loads is isolated and can be damped by a simple single-input and single-output (SISO) controller. The idea of this blending based controller design has been introduced in Reference [6], where it is denoted as “modal isolation and damping for adaptive aeroservoelastic suppression” (MIDAAS). Here, the H 2 -optimal blending approach developed in References [7,8] is used, which has also been successfully applied to a flutter demonstrator in Reference [9]. In Section 2 the fundamentals of the modal control approach are summarized.
The core element of the fault detection system is a linear fault detection filter designed by means of the nullspace based design technique discussed in the first part of Section 3. This technique for designing minimal order fault detection filter has been proposed in Reference [10], where the numerical properties of the solution techniques have been improved in References [11,12]. The method has been applied to design residual filters for flight actuators in Reference [13], processing both the in- and output signal of the actuators. The filters have been verified on a real flight actuation system. In Reference [5], the nullspace based design technique has been applied and tested on a high fidelity aircraft simulator to detect aircraft sensor faults using a rigid body model of the aircraft. Furthermore, in Reference [3] the approach has been applied the first time to high order aeroelastic aircraft models to detect incoming gusts. The work presented herein applies the method to a high order, aeroelastic model of a highly flexible wing and brings the method to life in realistic wind tunnel experiments. The fault detection system sets the basis for the fault tolerant control (FTC) approach. To detect aircraft sensor faults and trigger a reconfiguration, the FTC architecture developed in References [5,14] serves as basis for the FTC system design herein. The FTC architecture includes a fault detection system with a residual filter, a residual evaluator and a decision-making module to monitor the control surface actuator. In case of detected actuator faults, the blending of the control inputs is reconfigured by solving a constrained control allocation problem in real time. The theoretical background of this control allocation is provided in the second part of Section 3. In the literature different fault tolerant control approaches via control allocation techniques are available, see for example, References [15,16]. The control allocation scheme used herein solves a quadratic optimization each time step to allocate the control input accordingly. The fault tolerance is achieved by adapting the optimization constraints in case a fault is confirmed by the fault detection module. This allows maintaining the fault free control behavior, fully or at least with a minimum controller performance degradation.
The presented approaches are applied to an experimental wing for which detailed linear aeroelastic models have been derived, see References [17,18]. In Section 4 the design and modeling of the experimental wing are discussed in detail, setting the basis for the development of the fault tolerant control system in Section 5. Section 6 presents the results of the control system validation in an extensive wind tunnel test campaign. This includes open- and closed-loop experiments with and without faults to show the achieved load reduction by the baseline controller, which is maintained by the fault tolerant control architecture during fault scenarios.

2. Input-Output Blending Based Modal Control

In this section, the theoretical background to optimally blend inputs and outputs for modal control is provided. The approach blends the inputs and outputs of the system such that the controllability and observability of the mode to be controlled is maximized in terms of the H 2 -norm. For aeroelastic control problems, this approach is especially applicable since no model order reduction of the typically high dimensional simulation model is required. Furthermore, a high number of sensors, for example, strain or acceleration measurements, are available and need to be fused accordingly within the control algorithm.

2.1. Modal Description of Linear Time-Invariant Systems

A LTI system with n u inputs, n y outputs and n x states which is physically realizable is described by the transfer function matrix
G ( s ) = C s I A 1 B + D ,
where A R n x × n x , B R n x × n u , C R n y × n x , D R n y × n u and s denotes the Laplace variable. Assuming that A is diagonalizable, a modal decomposition of G ( s ) is possible such that
G ( s ) = m = 1 n m M m ( s ) + D ,
where the individual modes m = 1 , , n m are given as
M m ( s ) = R m s p m if ( p m ) = 0 R m s p m + R ¯ m s p ¯ m otherwise .
According to (2), a mode m is either described by a single real pole p m with an imaginary part ( p m ) = 0 or a conjugate complex pole pair p m and p ¯ m . Hence, the number of modes n m does not necessarily equal the number of states n x , that is, n m n x . Each pole p m is associated with a residue R m , where the residues of a conjugate complex pole pair are also conjugate complex.
In general, a mode m is considered to be asymptotically stable if ( p m ) < 0 and unstable if ( p m ) > 0 . In case ( p m ) = 0 , the mode is considered to be undamped, which also includes a pole in the origin. Furthermore, the natural frequency of a mode is given as ω n , m = | p m | and for ω n , m 0 , the corresponding relative damping is ζ m = ( p m ) / ω n , m . Note that for a conjugate complex pole pair, the corresponding real parts ( p m ) = ( p ¯ m ) and magnitudes | p m | = | p ¯ m | are equal.

2.2. H 2 -Optimal Blending of Inputs and Outputs for Modal Control

The task of controlling a single mode M ( s ) { M m ( s ) } of a high order dynamic system is challenging, especially when the number of control inputs or measurement outputs is large. To reduce the complexity of the control problem, it is proposed to weight and sum the measurement signals such that the resulting virtual measurement output v y best represents the response of the mode to be controlled. Similarly, it is proposed to generate a virtual control input v u which is distributed to available control inputs such that the target mode is best controlled. In other words, the inputs and outputs are blended such that a maximum controllability and observability of the mode to be controlled is achieved. Quantifying the combined controllability and observability in terms of the H 2 -norm as proposed in Reference [7], the resulting blending vector design problem is formulated as
maximize k u R n u , k y R n y k y T M ( s ) k u H 2 subject to k u 2 = 1 k y 2 = 1 ,
where the input and output blending vectors k u R n u and k y R n y are enforced to be of unit length. Solving the optimization problem (3) by means of the numerically efficient algorithm derived in Reference [8] yields blending vectors depending on the shape but not frequency of the target mode, which implies a high robustness against frequency variations. In case an explicit decoupling of the target mode is desired, for example, to avoid spillover effects, corresponding mode decoupling constraints may be considered during blending vector design as proposed in Reference [8]. Furthermore, for an unstable mode M ( s ) the corresponding H 2 -norm is infinite and it is proposed to reformulate the optimization problem (3) according to Reference [8]. Blending the inputs and outputs with k u and k y , respectively, the target mode can be controlled by a simple SISO controller c SISO ( s ) . Hence, the multiple-inputs multiple-outputs control design problem becomes a SISO one, where the resulting feedback controller is given as
K ( s ) = k u c SISO ( s ) k y T .
Figure 1 illustrates the blending idea in the closed-loop, where the available measurements y are blended to a scalar signal v y which is the input signal to the controller c SISO ( s ) . Its output signal v u is blended back to the available control commands u. The architecture can be easily extended to isolate more than one mode and design a SISO controller for each isolated mode, see References [7,8].

3. Fault Detection Based Fault Tolerant Control Allocation

The fault tolerant control approach in this work is based on two main modules: a fault detection system to detect the fault; and a reconfigurable control allocation triggered by the information of the fault detection system to recover the best possible control performance during the fault scenario(s). The design techniques for modules are explained as follows.

3.1. Fault Detection System

The fault detection system consists of a linear fault detection filter of minimal state order generating a residual signal. The residual signal is evaluated over time and compared against a predefined threshold to derive a Boolean variable indicating the presence or absence of a fault. In the following subsections, the fault detection filter design based on nullspace computation techniques for linear systems is discussed and insights into the decision-making process are given.

3.1.1. Linear Residual Filter Design

The linear residual filter design is based on advanced nullspace computation techniques presented in Reference [12]. These techniques provide residual filters of minimal dependence on the underlying model by providing the least possible filter order, which allows to check a-priori if a fault detection problem is solvable and enable a free definition of the filter dynamics. Below, a short introduction into the idea of the residual filter generation is given.
Consider the linear model described by the input-output form
y ( s ) = G u ( s ) u ( s ) + G d d ( s ) + G f f ( s ) ,
where y ( s ) , u ( s ) and d ( s ) are the Laplace-transformed vectors of the n y -dimensional system output vector y ( t ) , the n u -dimensional control input vector u ( t ) , the n d -dimensional disturbance vector d ( t ) and the n f dimensional fault vector f ( t ) , respectively. G u ( s ) , G d ( s ) , G f ( s ) are the transfer function matrices from control inputs to outputs, disturbance inputs to outputs and fault inputs to outputs, respectively. For the system described in (5), a linear fault detection filter processes the measurable system outputs y ( t ) and the control inputs u ( t ) to generate the residual r ( t ) . In the input-output form, this can be described by
r ( s ) = Q 0 ( s ) y ( s ) u ( s ) ,
where Q 0 ( s ) is the transfer function matrix of the fault detection filter. For a physically realizable filter, Q 0 ( s ) must be proper and stable. The order of Q 0 ( s ) is the dimension of the state vector of a minimal state-space realization of Q 0 ( s ) . The general description in (6) allows the definition of the fault detection problem: Design a physically realizable linear residual filter of the form (6) such that for all u ( t ) and d ( t )
( i ) r ( t ) = 0 when f ( t ) = 0 ( i i ) r ( t ) 0 when f ( t ) 0 ( i i i ) r ( t ) is asymptotically bounded .
Additionally, Q 0 ( s ) shall be of minimal order ( i v ).
The requirements (i) and ( i i ) of the fault detection problem are easily transformed into algebraic conditions. Therefore, the system’s input-output Equation (5) is inserted in the residual filter Equation (6), so that the residual filter depends on the control, disturbance and faults inputs, that is,
r ( s ) = Q 0 ( s ) G u ( s ) G d ( s ) G f ( s ) I n u 0 0 u ( s ) d ( s ) f ( s ) .
The decoupling condition ( i ) requires that the residual r ( s ) is decoupled from any inputs u ( s ) and disturbances d ( s ) . This is equivalent to demand
Q 0 ( s ) G u ( s ) G d ( s ) I n u 0 : = Q 0 ( s ) G e ( s ) = 0 .
It follows that Q 0 ( s ) needs to be a left annihilator of G e ( s ) . By deriving a minimal basis for the left nullspace of G n ( s ) , the design conditions ( i ) and ( i v ) can be tackled. For the design condition ( i i ) , the basic constraint
Q 0 ( s ) G f ( s ) 0 0
must be fulfilled. This can only be achieved, if the fault detection problem is solvable. The solvability condition follows the theorem presented in Reference [19], that is,
rank G d ( s ) G f ( s ) > rank ( G d ( s ) ) .
Thus, the fault to be detected needs to be linearly independent of all the disturbances. Note that the condition (10) is independent of the control input u. Thus, for the case n d = 0 , the fault detection problem is always solvable. This makes sense as just known inputs and unknown faults act on the system. Finally, condition ( i i i ) is achieved as the poles of the system can be freely designed when making the minimal nullspace basis physically realizable, that is, providing a proper residual filter.
To solve the fault detection problem and generate linear residual filter of minimal order, advanced numerical tools are readily available and are used for the work described herein. Readers interested in more details on how these problems are solved and in the corresponding software tools are referred to Reference [12]. Note that in case of linear design models of high state dimensions, which are, for example, present when dealing with aeroelastic models, an a-priori approximation of the high order model is recommended.
In practice, it is often desired to add an additional dynamic filter W ω ( s ) to the residual filter to suppress contributions at certain frequencies the considered faults will not be present. This increases the order of the linear overall filter, however, also increases the robustness against false alarms in certain frequency ranges. The overall filter structure is then given by
r ˜ ( s ) = Q ( s ) r ( s ) = W ω ( s ) Q 0 ( s ) r ( s ) .

3.1.2. Residual Evaluation and Decision-Making

To finally take a decision if a fault is present in the system and indicated via the residual r, the signal energy of the residual is computed. To approximate the signal energy, the residual evaluation scheme of the form
θ ( t ) = α | r ˜ ( t ) | + β t T w t | r ˜ ( τ ) | d τ ,
is used, determining the energy over a specific time window T w > 0 with the instantaneous and long-term residual values weighted via the parameters α 0 and β 0 , respectively. The evaluation signal θ ( t ) is compared to a specific threshold τ in the decision-making process to determine the auxiliary decision signal ι ( t ) using the decision logic
ι ( t ) = 1 , if θ ( t ) τ d 0 otherwise .
The threshold τ d is selected based on real test data in fault free scenarios. To increase the robustness of the fault detection system, a confirmation time is considered. Only if the auxiliary decision signal is above its threshold for a defined time window T d , the fault occurrence is confirmed. As the signal ι can just take values of 0 and 1 this test can be mathematically expressed by integrating ι over and comparing it to the defined time window, i.e,
i f ( t ) = 1 , if t T d t ι ( τ ) d τ = T d 0 otherwise .
Finally, the Boolean decision signal i f ( t ) is passed on to the fault tolerant control allocation algorithm to provide the required status information of the actuators to be monitored.

3.2. Fault Tolerant Control Allocation

As previously described, the virtual control input v u is distributed to the actual control inputs by means of the input blending vector k u , which can be seen as an unconstrained control allocation. Considering physical limitations of the actuation system or actuator fault scenarios like jamming, however, requires formulating a constrained control allocation problem, see for example, Reference [20]. To that end, the constraint allocation problem needs to be solved at each time sample with the goal to adequately distribute the current virtual control input v u under the momentarily given actuator constraints. A common control allocation approach is to minimize the additional control input Δ u R n u required to keep the nominal control input u ˜ within the lower and upper bound u min R n u and u max R n u , respectively. In case of the blending approach presented in Section 2, the nominal input is given as u ˜ = k u v u . Considering a quadratic objective function, the resulting optimization problem, which needs to be solved each time step, can be formulated
minimize Δ u R n u , η R Δ u T W u Δ u + η 2 subject to Δ u T k u = 0 u min u u max .
The constraint Δ u T k u = 0 in (15) enforces the additional control input Δ u to be orthogonal on the input blending vector k u to avoid an interference with the nominal controller. In case there is no feasible solution, nominal controller performance cannot be maintained. For this scenario, the slacking variable η R is introduced, which is also subject to being minimized [20]. The slacking variable is between 0 η 1 and can be interpreted as a controller performance degradation in case the current virtual control input v u cannot be realized. The case η = 0 represents the scenario without performance loss, while for η = 1 the controller is actually inactive (assuming that Δ u = 0 ). To balance the slacking variable η and the individual elements of Δ u , a positive definite weighting matrix W u R n u × n u is introduced in the objective function. Finally, deriving the optimal Δ u and η for each time step by solving (15), the control input u to the wing is computed as
u = 1 η u ˜ + Δ u = 1 η k u v u + Δ u .
To solve the quadratic program defined in (15), efficient methods are readily available. Herein, a derivative of the KWIK algorithm described in Reference [21] is used.
The presented approach is classically used to allocate the control inputs in an over-actuated system in case of position saturation on the actuators but can easily be extended to cover also rate saturation scenarios [20]. Furthermore, it can be used to achieve fault tolerance in case an actuator jamming occurs and is successfully detected. To that end, the constraints in (15) are adapted when a fault is detected by setting the lower and upper saturation limits u min and u max to zero. Thereby, the demanded control input to the faulty control surface is reduced to zero and the required control inputs are realized, if possible, via the remaining fault-free control surfaces.

4. The Flexible Wing

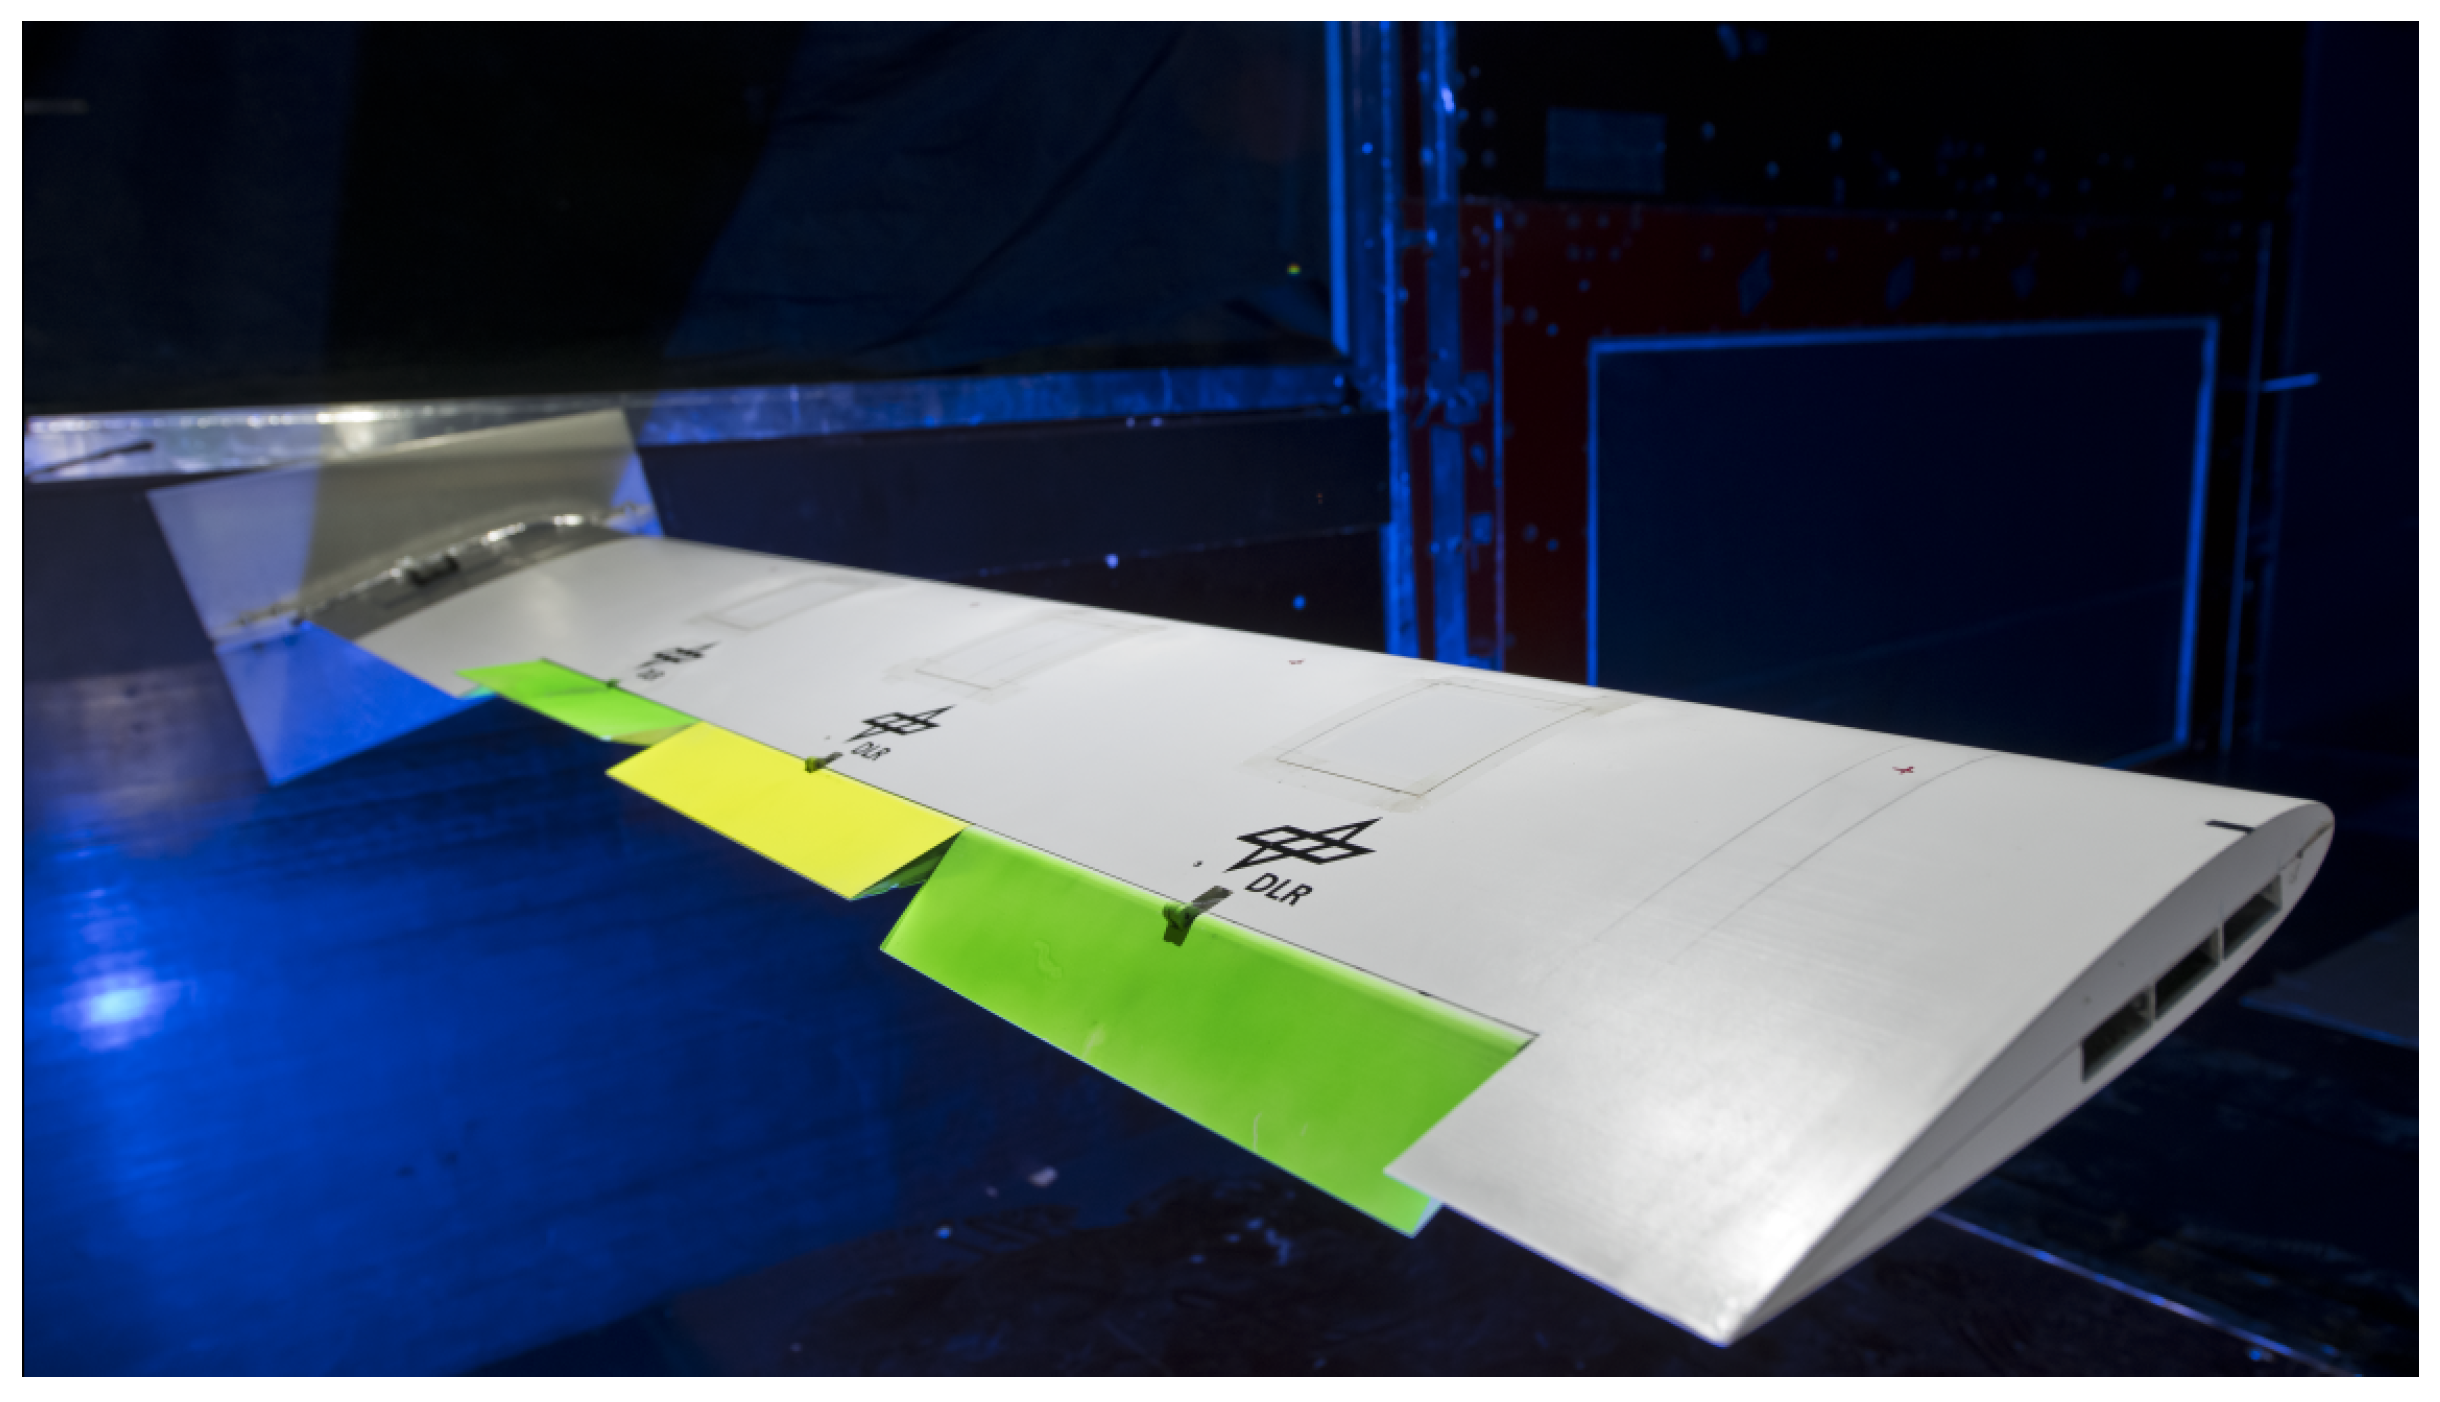
To validate the newly developed modal controller together with the fault tolerant control system, they are tested on the flexible wing depicted in Figure 2 mounted in a wind tunnel. The rectangular wing with a NACA 0015 profile consists of a foam core and glass fiber skins and has a length of 1.6 m, a cord length of 0.25 m and a weight of about 3.6 kg.
To counteract the gust excitations simulated by pitching motions of the wing, three equally sized control surfaces are mounted near the trailing edge of the wing. A schematic illustration of the wing with the three control surfaces is depicted in Figure 3. Also depicted in Figure 3 are the positions of eight installed acceleration sensors, where four sensors are located equally spaced near the leading edge and four sensors (1–4) are located equally spaced near the trailing edge (5–8) at the same span location [22]. Additionally, a piezo balance measures forces and moments in three spatial directions at the wing root. To have these forces and moments available allows for a realistic control performance validation. On aircraft, the non-measured wing root moments are typically the sizing parameters for the wing structure. Thus, any load alleviation controller needs to reduce these moments amongst others.

Modeling

To facilitate model based control and filter designs, a linear model of the wing has been developed [17,18], which consists of four submodels:
(i)
A structural model of the wing derived by modal analysis of the stiffness-optimized finite element model (FEM), which has been generated via the aeroelastic-tailoring process described [23]. Note that the structural model also includes rigid body dynamics in terms of the non-fixed pitching degree of freedom and considers only the seven flexible modes with the lowest natural frequency, that is, it consists 16 states in total.
(ii)
An aerodynamic model derived in frequency domain by means of the double lattice method, which considers also unsteady aerodynamic effects. To obtain a suitable state space model, a rational function approximation according to Roger [24] is carried out. Furthermore, the order of the approximated aerodynamic model is reduced to 20 by means of balance and truncation.
(iii)
Detailed models of the three control surface actuators, where each one features two states.
(iv)
A fourth-order pitch motor model identified via hardware tests.
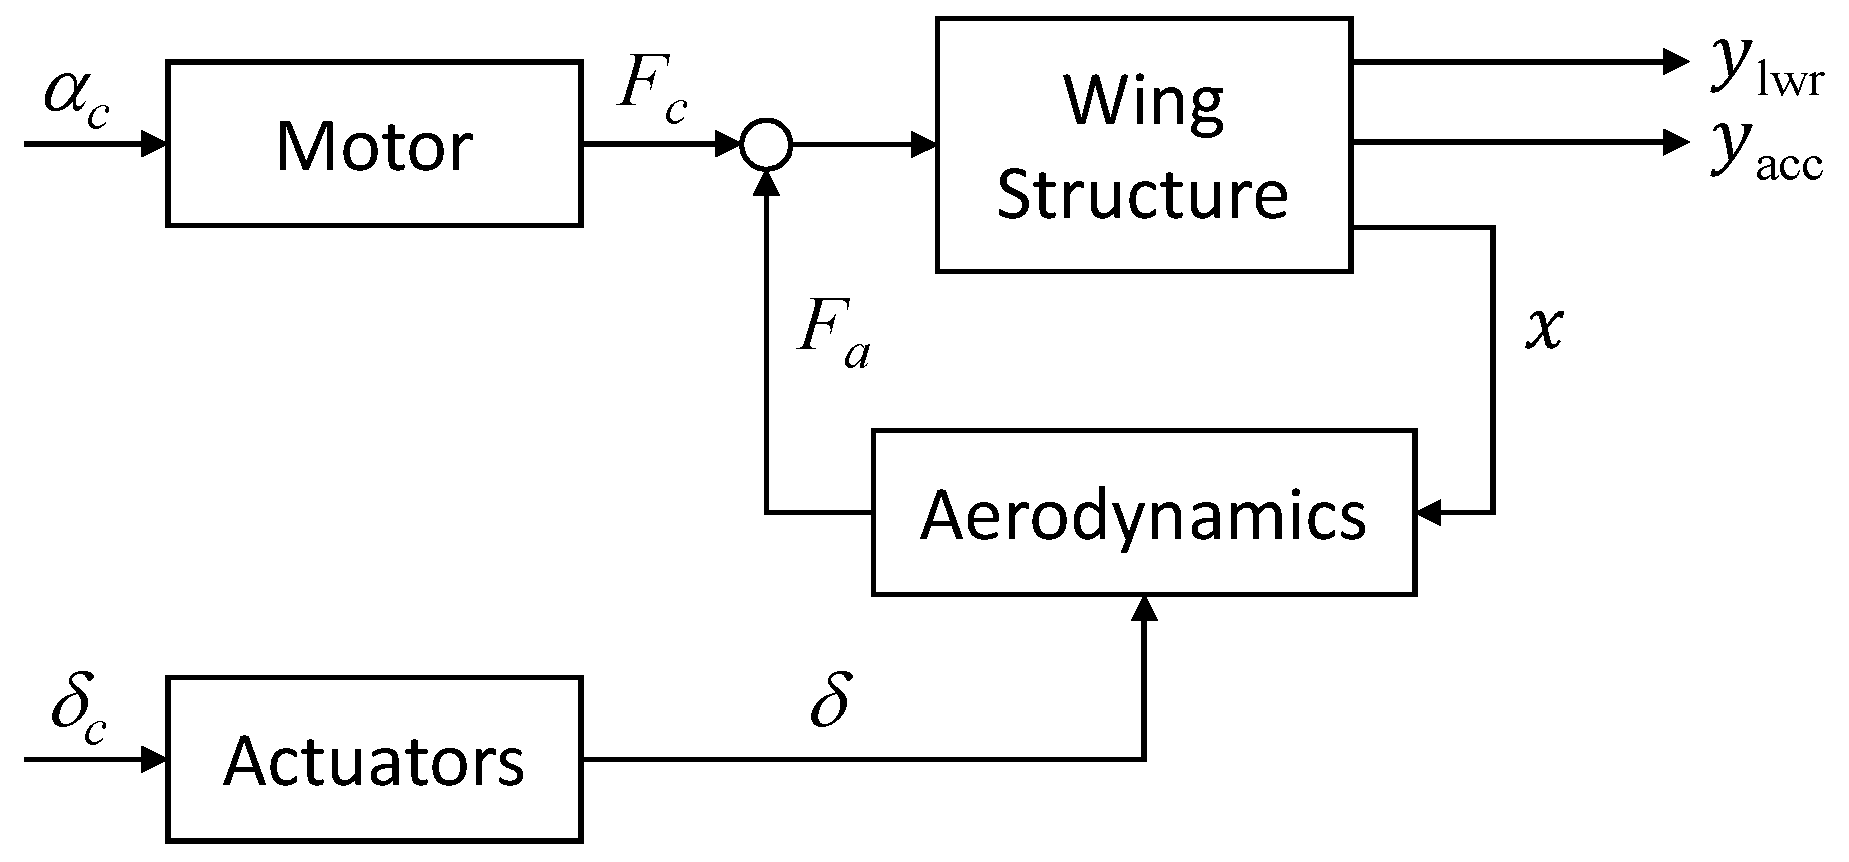
The four submodels are integrated together to derive an aeroelastic model of the wing. The interconnection of the models is illustrated in Figure 4, where the forced pitching moment F c acting on the wing is computed from the commanded pitch angle α c . The signals δ c = [ δ c ( 1 ) δ c ( 2 ) δ c ( 3 ) ] T are the commanded deflections of the inner, mid and outer surface deflections, respectively. They are transformed to the actual control surface deflections δ = [ δ ( 1 ) δ ( 2 ) δ ( 3 ) ] T via three decoupled linear first order models of the actuators with a time constant of 0.01 s, unit gain and a time delay of 0.008 s. Further, F a are the aerodynamic forces and x the modal deflections of the wing. On the output side of the model y acc = [ y acc ( 1 ) y acc ( 8 ) ] T represent the eight acceleration measurements on the wing installed for feedback control, where the indexes correspond to the position depicted in Figure 3. The six load measurements measured at the wing root are summarized in y lwr .
To increase model accuracy, a modal test has been carried on the wing using the techniques described in References [25,26] and the FEM has been updated accordingly. The first four structural eigenmodes of the wing are the first bending mode at around 8 Hz with a damping of 0.004, the first in-plane mode at 29.1 Hz with a damping of 0.005, the second bending mode at 42.2 Hz with a damping of 0.007 and the first torsion mode at 82.7 Hz with a damping of 0.019. Note that these frequencies and damping ratios describe the characteristics of the wing structure without any surrounding airflow. This means that aerodynamic effects which are in feedback with the wing structure, as illustrated in Figure 2, are not considered. The aeroelastic modes of the model are slightly different and vary with wind speed. To verify the aeroelastic modes of the model, on-line estimation techniques described in References [27,28] have been performed during the wind tunnel experiments. For example, the first wing bending mode has a damping of 0.1 when considering aerodynamic forces at a wind speed of 40 m/s compared to 0.004 without them.
The overall LTI model used for controller and residual filter design for a defined wind velocity has 46 states and is given in the form
x ˙ = A x + b α c + B δ c y lwr y acc = C x + d α c + D δ c
with the state vector x R 46 the model’s states space matrices A R 46 × 46 , b R 46 , B R 46 × 3 , C R 9 × 46 , d R 9 and D R 9 × 3 . Note that this model is available on a grid of different wind speeds ranging from 10 m/s to 50 m/s. For this work, only the LTI model at 40 m/s wind speed is used, as the wind tunnel tests are performed at this wind speed. A detailed discussion and the mathematical background on the generation, the integration and the description of the model is provided in Reference [17].

5. Fault Tolerant Control System Design

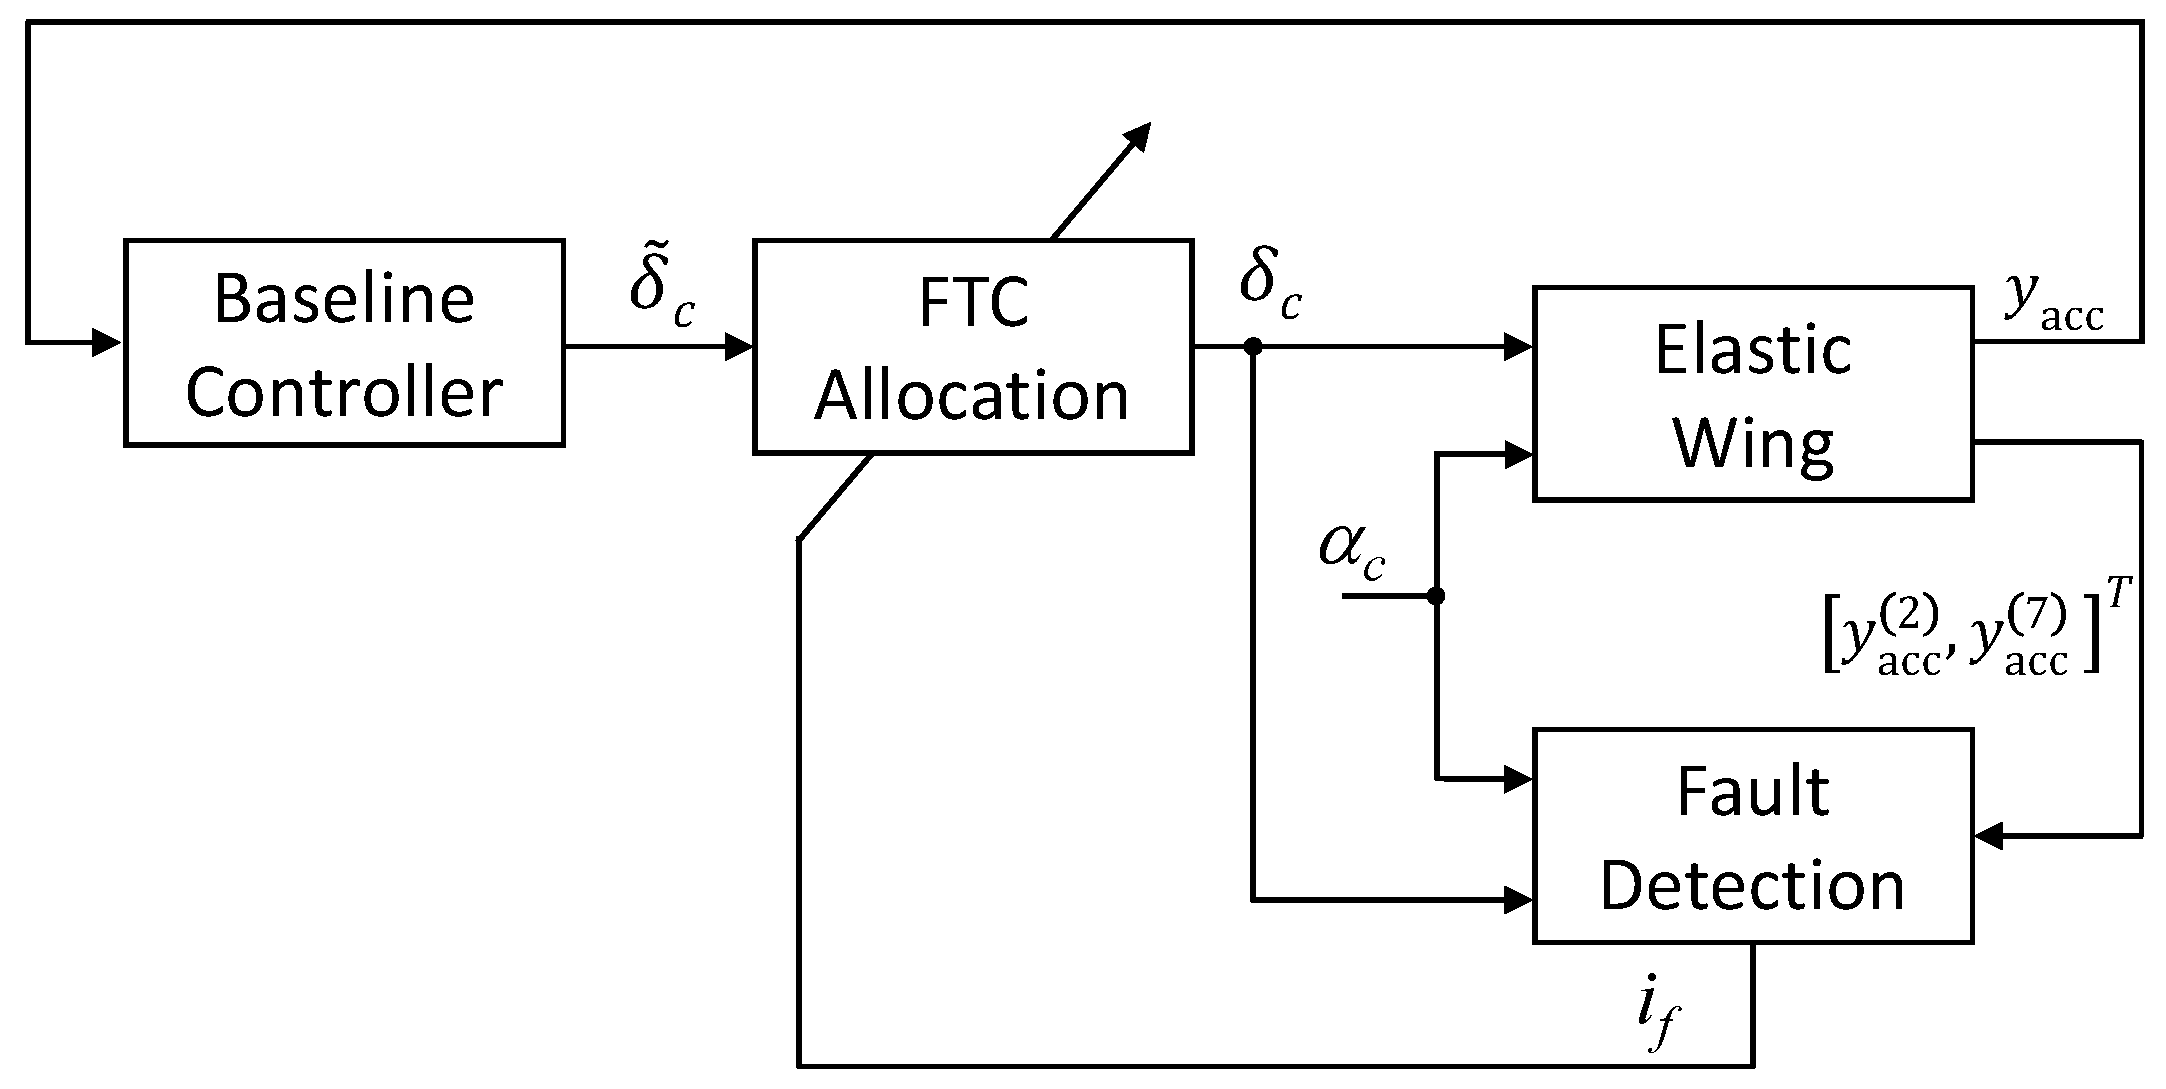
This section presents the application of the theoretical approaches from Section 3 and Section 2 to the flexible wing model discussed in Section 4. The overall control system, depicted in Figure 5, includes a baseline load alleviation controller designed to damp the first wing bending mode, a fault detection module to detect faults on the actuators and the fault tolerant control allocation module to counteract the fault effect. The design of the three components are discussed as follows.

5.1. Baseline Controller

First, a modal decomposition is carried out on the available LTI system of the wing described in (17). Thereby, it becomes clear that the lightly damped first and second wing bending modes dominate the wing root bending moment. The second wing bending mode, however, is marginally excited during gust encounter due to its high natural frequency and the low-pass characteristics of gusts. Thus, the objective for baseline load alleviation controller design is to increase the damping of the first wing bending mode. To that end, the H 2 -optimal blending approach described in Section 2 is applied. For the blending vector design, the three commanded control surface deflections δ c are considered at the input side and all eight vertical acceleration sensor signals y acc are considered on the output side. Applying the computed blending vectors isolates the first wing bending mode and enables the design of a SISO controller to increase its damping. The overall control law including the blending vectors and the SISO controller has the form
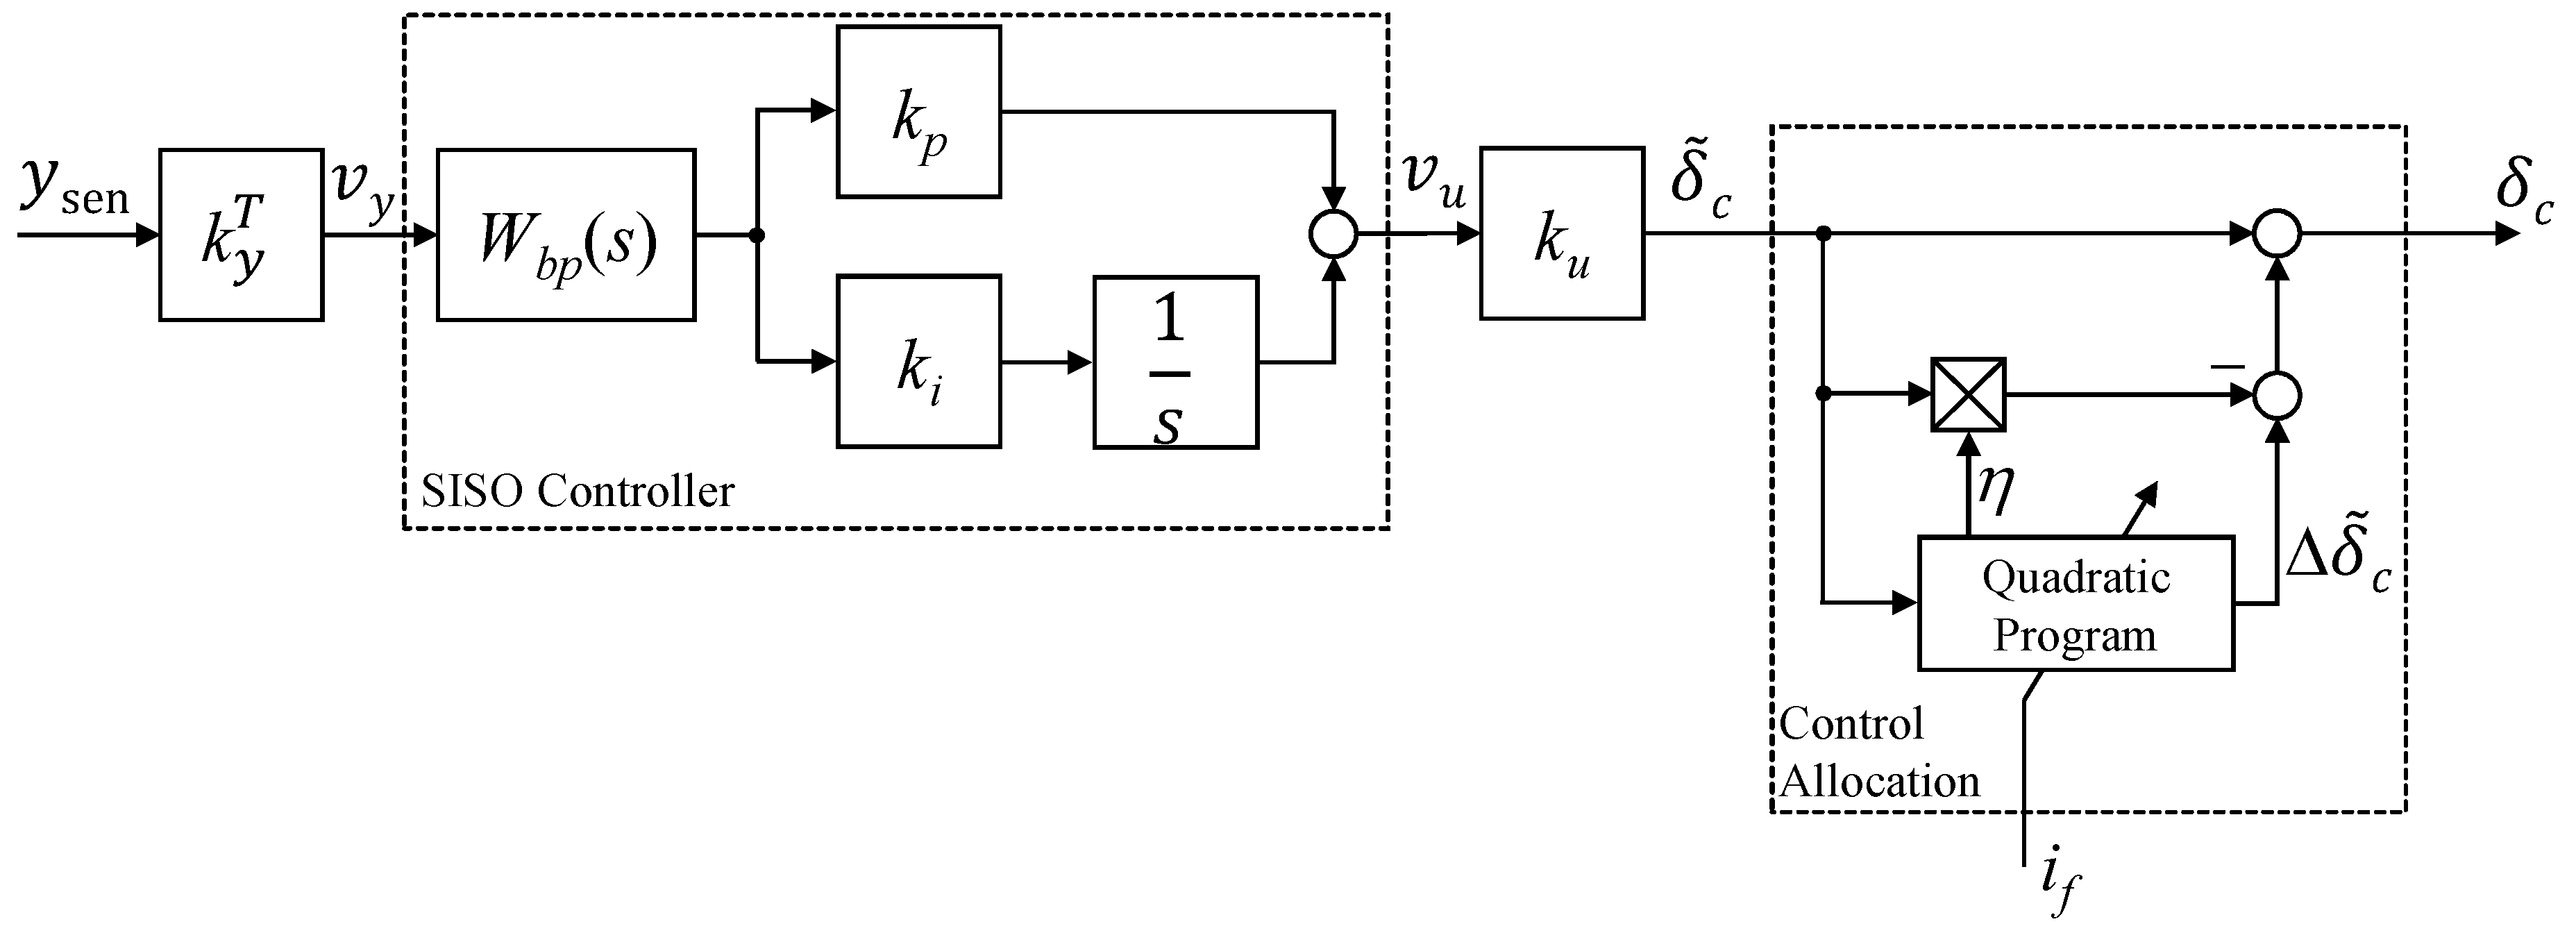
δ ˜ c ( s ) = k u c SISO ( s ) k y T y acc ( s ) = k u W b p ( s ) k p + k i s k y T y acc ( s ) ,
where δ c ( s ) is the Laplace-transformed vector of the 3-dimensional control input vector δ c ( t ) and y acc ( s ) is the Laplace-transformed vector of the 8-dimensional output vector y acc ( t ) including the eight accelerations measurements on the wing. To smoothen the transfer behavior around the isolated bending mode at 8 Hz and suppress noise at high frequencies, the blended measurements are filtered by the band-pass filter W b p ( s ) . With the goal to maximize the damping of the first wing bending mode, the proportional and integral controller gains k p = 1.6 × 10 3 and k i = 6.4 × 10 2 are determined such that actuator saturation does not occur for the considered gust excitations. Furthermore, classical gain and phase margins of at least 6 dB and 45 deg are demanded. The blending vectors in the control law (18) result in
k u = 0.208 0.565 0.798 T k y = 0.099 0.226 0.379 0.541 0.01 0.228 0.381 0.543 T .
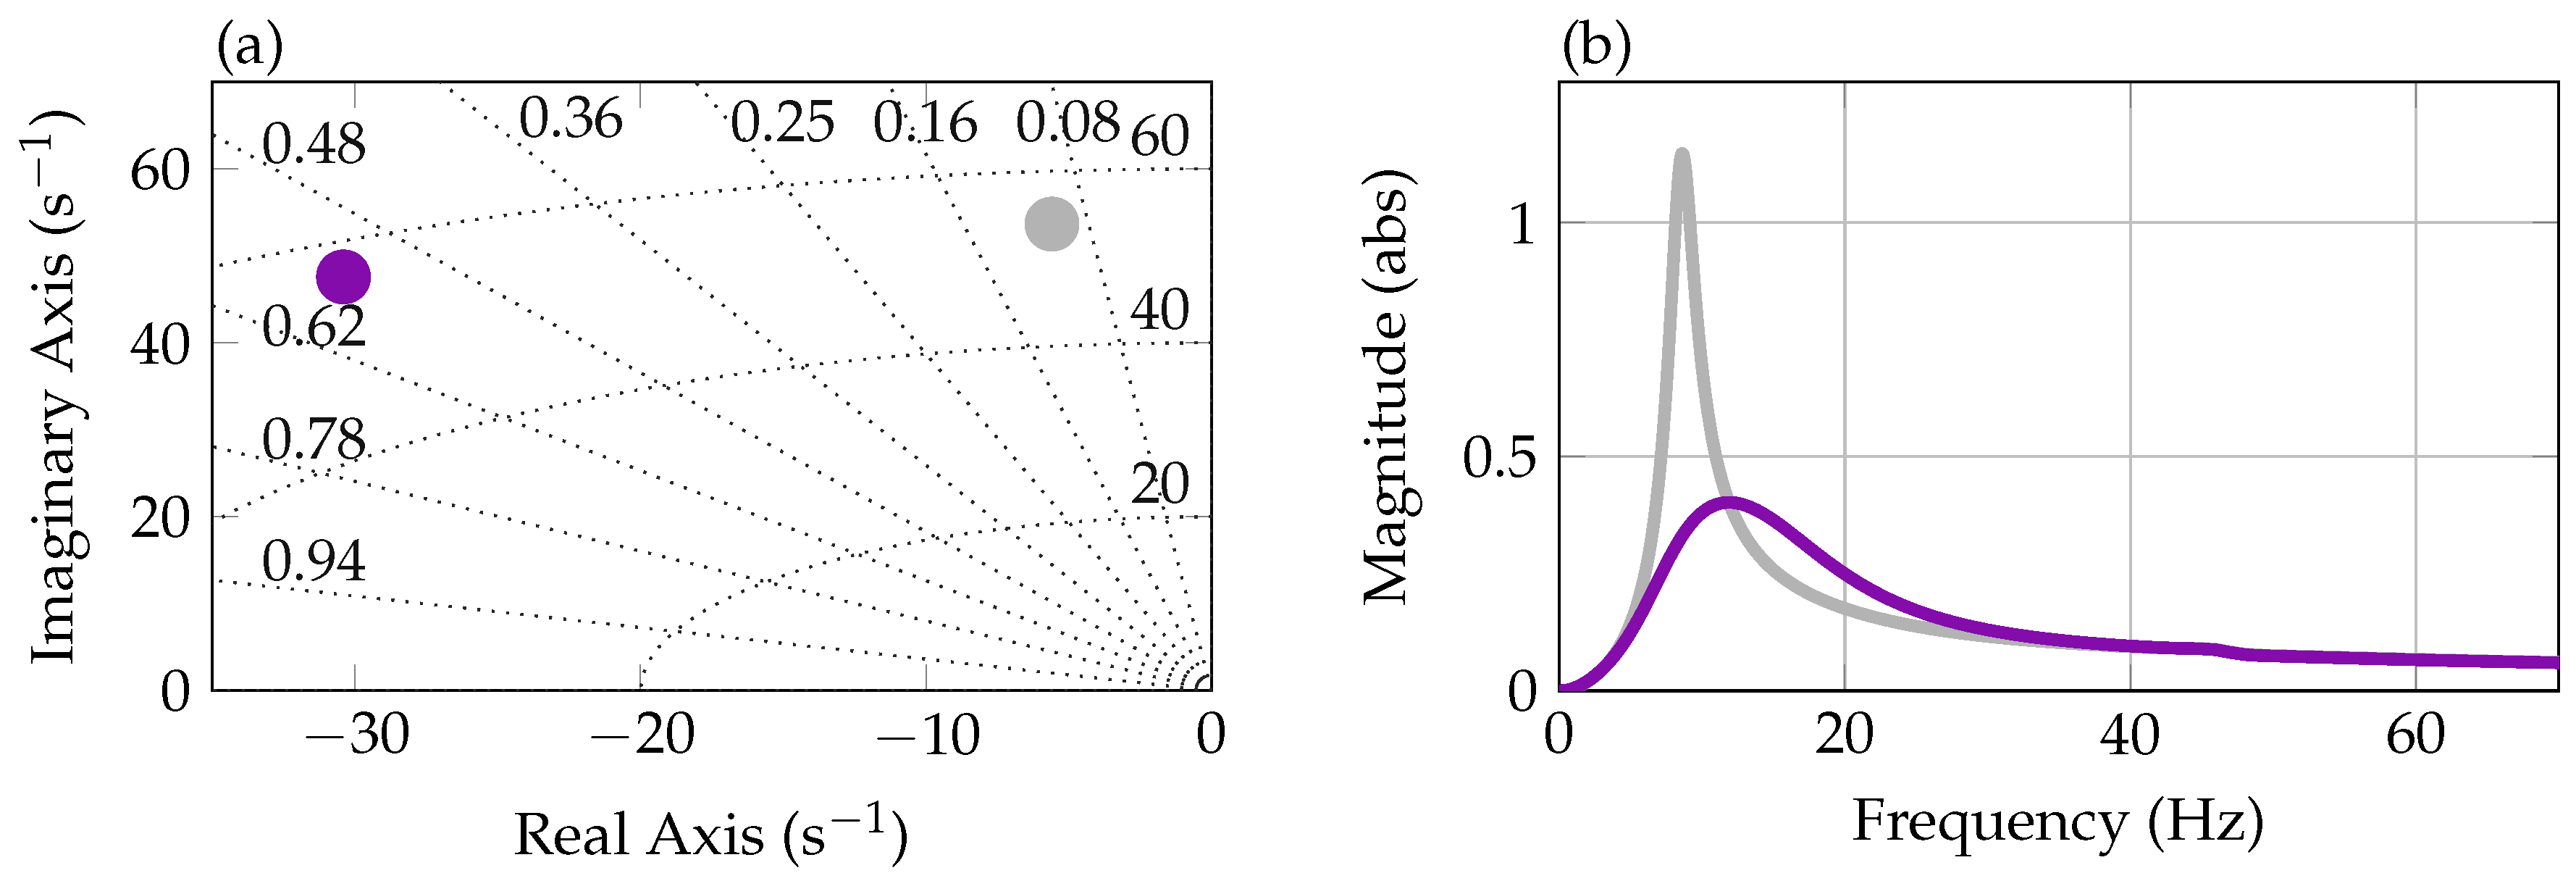
In diagram (a) of Figure 6, the comparison of the open-loop ( Aerospace 06 00076 i001) and closed-loop ( Aerospace 06 00076 i002) pole location (positive imaginary axis only) for the first wing bending mode of the aeroelastic model is shown. It is clearly visible that the damping ratio of the first bending mode is increased from about 0.1 to about 0.55 using the SISO PI controller. Note again that the damping of the open-loop aeroelastic first wing bending mode (0.1) at 40 m/s wind speed is higher than the damping of the structural first wing bending mode (0.004) introduced in Section 4 due to the aerodynamics. In diagram (b) of Figure 6, a magnitude plot of the SISO open-loop wing model ( Aerospace 06 00076 i003), that is, with blended inputs and outputs, is depicted. It shows the isolated first wing bending mode of the aeroelastic wing model at around 8 Hz. In the plot, also the magnitude of the closed-loop is shown ( Aerospace 06 00076 i004). It confirms the modal damping increase when closing the loop and that no other peaks over the frequency range occur.

5.2. Fault Detection System

The main element of the fault detection system is the linear fault detection filter. For its design, the 46 states of the wing model are reduced to ten states by deriving a canonical system realization followed by a truncation to get rid of dynamics outside the excitable frequency range using standard Matlab tools. As known input signals to the wing, the three commanded control surfaces deflections δ c ( 1 ) , δ c ( 2 ) and δ c ( 3 ) and the commanded pitch motor deflection α c are available. Considering the measurements, two of the eight acceleration sensor signals, denoted y acc ( 2 ) and y acc ( 7 ) , are selected as input signals to the filter. The indexes correspond to the sensor numbering used in Figure 3. As one sensor is located near the leading edge and the other one near the trailing edge, the sensors provide sufficiently different, that is, non-redundant, measurement information. This is important for the filter design, as redundant sensor information does not add any value for solving the fault detection problem. Due to this fact, the other six sensors are discarded in the filter design.
To design a fault detection filter, the linear model (17) of the wing is augmented with a fault input to derive a model according to (5). As faults, additive input faults on each of the three actuators are defined. The transfer behavior from the faults to the system outputs equals the transfer behavior from the actuator inputs to the system outputs [12]. Reducing and augmenting the model (17) with the new inputs and outputs leads to the design model
x ˜ ˙ = A ˜ x ˜ + b ˜ α c + B ˜ ( δ c + f ) y ˜ acc ( 2 ) y ˜ acc ( 7 ) = C ˜ x ˜ + d ˜ α c + D ˜ ( δ c + f ) ,
for the residual filter design, with x ˜ R 10 , A ˜ R 10 × 10 , b ˜ R 10 , B ˜ R 10 × 3 , C ˜ R 2 × 10 , D ˜ R 2 × 3 and d ˜ R 2 and f = [ f 1 f 2 f 3 ] T representing the three additive actuator faults.
For the available model of the wing, the fault detection problem can be solved for all three actuators, that is, the scalar residual r will be excited by any fault on either of the actuators. However, the fault isolation problem, that is, determining which actuator is faulty, is hardly solvable in practice for this example. Physically this is due to very similar effectiveness of the three actuators. The small difference in the effectiveness is not enough to overcome fault free residual excitations, for example, due to model uncertainties and sensor noise. Nevertheless, this does not restrict the possibility to validate the functionality of the methods developed herein, as on a real aircraft the required fault isolation is usually achievable, see References [13,29]. For the remainder of the paper we will assume that the fault isolation information is given if a fault is detected. Using the resulting model and applying the tools provided in Reference [12], a residual filter Q 0 of the form
x ˙ Q 0 = A Q 0 x Q 0 + B Q 0 y acc ( 2 ) y acc ( 7 ) α c δ c T T r = c Q 0 T x Q 0 + d Q 0 T y acc ( 2 ) y acc ( 7 ) α c δ c T T
is designed, where x Q 0 R 5 is the state vector of the filter and A Q 0 R 5 × 6 , B Q 0 R 5 × 5 , c Q 0 R 5 and d Q 0 R 6 the state space matrices. To ensure a fast reaction to faults real parts below -5 have been chosen during the design for the eigenvalues of the residual filter. To filter out steady state offsets due to model uncertainties in the residual, a high pass filter of the from W ω ( s ) = s / ( 0.01 s + 1 ) is multiplied to the filter leading to the overall residual filter Q = W ω ( s ) Q 0 ( s ) .
In Figure 7, the Bode magnitude plot of the filter Q 0 from (21) connected to the wing model (20) and multiplied with the filter W ω ( s ) is depicted. In diagram (a), the decoupling of the three actuator commands and the pitch motor commands from the residual is shown. The magnitude values over the whole frequency range remains close to zero so that any control inputs do not affect the residual signal. Diagram (b) shows the coupled fault to residual transfer behavior for a fault on the outer actuator. The magnitude in diagram (b) is dominated by the two main low damped modes in the system. Faults between approximately 30 rad/s and 200 rad/s are transferred to the residual with more than −10 dB. The fact that low frequency faults are not transferred to the residual is due to the acceleration measurements. Constant control surfaces deflections as well as constant motor deflections do not result in steady-state accelerations, that is, differential behavior is present in the model which cannot be compensated by stable residual filters. This behavior is also present in the fault to residual channel. Note, additional filtering can be used to shape this behavior as desired but turned out to be not necessary for the detection of the considered fault.
For the computation of the residual energy via (12) the parameters α = 0 and β = 1 are selected to allow for a better decision making, that is, not considering instantaneous contributions in the residual. A time period of 0.125 s for the time window T w in (12) is selected to accumulate enough signal energy in θ to decide if a fault is present or not. As threshold in (13) a value of τ d = 0.5 shows good coverage of the uncertainty effects. Finally, a confirmation time window of T d = 0.5 s is selected in (14).

5.3. Fault Tolerant Control Allocation

Adding the control allocation to the baseline control system leads to the controller structure illustrated in Figure 8. The control allocation receives and modifies the control signal δ ˜ c = k u v u and solves the optimization problem (15) in each time step. Thereby, it provides the slacking variable η and the additional control input Δ δ ˜ c . This input modifies the nominal control input δ ˜ c to generate the control signals δ c = δ ˜ c ( 1 η ) + Δ δ ˜ c , which is then sent to the actuators. The algorithm tries to restore the nominal control performance within the lower δ min = [ δ min ( 1 ) δ min ( 2 ) δ min ( 3 ) ] T and upper δ max = [ δ max ( 1 ) δ max ( 2 ) δ max ( 3 ) ] T control limits of the three actuators. Note that in case of the unconstrained problem, that is, if δ ˜ c is within the defined bounds δ min δ ˜ c δ max , the optimization problem (15) results in Δ δ c = 0 with η = 0 . This means that δ c = δ ˜ c and the nominal control performance is guaranteed.
The constraint allocation is activated either in case of position saturation on the actuators or in case of faults. To enable the fault tolerant control approach, the upper and lower actuation limits δ min ( i ) and δ max ( i ) are both set to zero in case a fault is detected on the i th actuator, with i = 1 , 2 , 3 . If a fault is present is indicated by the variable i f , which is received by control allocation algorithm to adapt the actuation limits in case of faults, that is, i f = 1 . Thus, the adaptive constraints in the optimization problem (15) are defined by
δ min ( i ) δ max ( i ) = 4 4 if i f = 0 0 0 otherwise ,
for i = 1 , 2 , 3 , which are re-evaluated in each time step. As described above, if i f = 1 the constrained optimization problem (15) is solved. For solving this, the weighting matrix W u = 5 × 10 9 I 3 is selected in (15). Note that the small value implies a high weighting of the slacking variable η in the optimization problem. As a large slacking variable corresponds to an increased loss of the nominal control performance, the aim is to keep this loss as small as possible by penalizing the slacking variable accordingly.

6. Wind Tunnel Based Control System Validation

The closed-loop mode, that is, the flexible wing in feedback interconnection with the fault tolerant control system, is verified at the Crosswind Simulation Facility of the German Aerospace Center (DLR) in Göttingen. The maximum flow velocity of the closed-circuit wind tunnel is 65 m/s and the dimension of the test section is 2.4 m (width) by 1.6 m (height). The pitch excitation system with the motor to excite the wing is installed outside of the wind tunnel, so that only the wing is exposed to the incoming flow. The pitch motor allows to simulating gusts via an angle of attack change. The approach to directly change the angle of attack is an elegant approximation of the gust effect and avoids the more complex but more realistic approach of generating gusts by manipulating the incoming flow, as presented in References [30,31]. The experiments presented herein are performed at a wind speed of 40 m/s, which corresponds to design speed of the controller as well as the fault detection filter. The control system itself runs outside the wind tunnel on a Jäger ADwin Gold real-time system.

6.1. Baseline Controller Validation

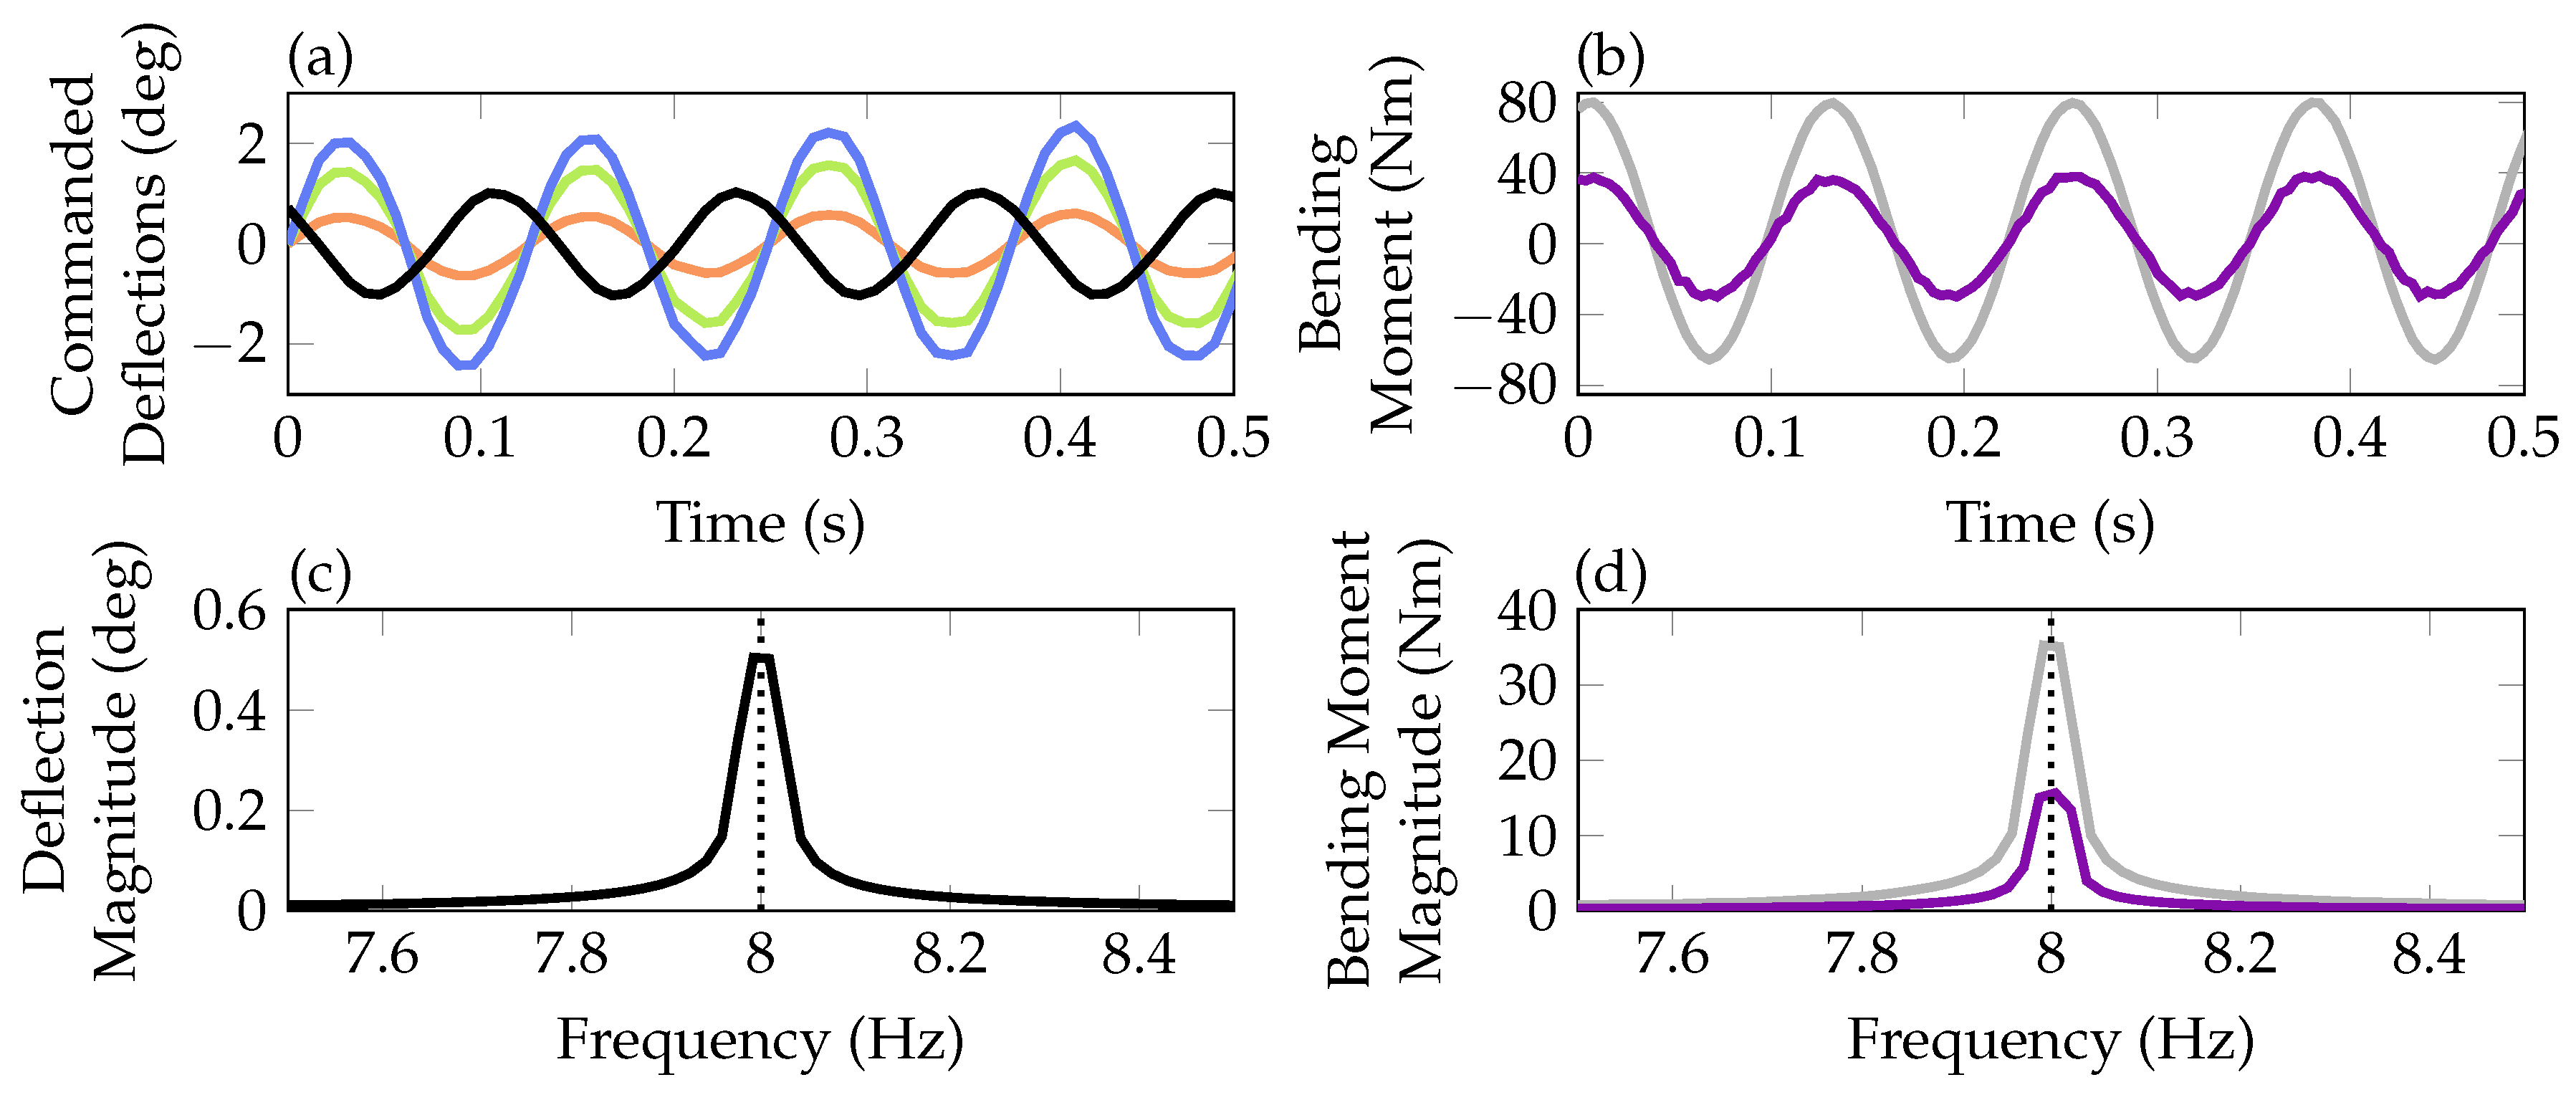
To provide insight into the performance of the baseline controller and validate the load reduction capabilities, open-loop and closed-loop experiments are performed for different pitch motor excitation signals. To start with, a sinusoidal input at 8 Hz is used, as this is the frequency of the wing’s first bending mode and thereby represents a worst-case excitation signal. To consider a broader spectrum of excitation frequencies, noise inputs are generated and tested. Further, to perform a more realistic excitation, a so called “1 minus cosine” (short: 1-cosine) excitation is applied. Such a 1-cosine gust is a standard certification requirement to test aircraft structures against incoming gusts as well as gust load alleviation capabilities of controllers [32]. Each pitch excitation is run twice, with and without gust load alleviation controller.
In the first row of Figure 9, the experimental wind tunnel data in the time domain of a sinusoidal input of 1 deg at 8 Hz is shown. The experiment is run first in open-loop, that is, the three control surfaces are maintained at their zero position throughout the experiment. In the second run, the controller is active and the control surfaces are deflected to counteract the pitch motor excitations. In diagram (a) the excitation signal of the pitch motor for both experiments is depicted ( Aerospace 06 00076 i008). For the closed-loop experiment, the commanded deflections for the inner ( Aerospace 06 00076 i005), mid ( Aerospace 06 00076 i006) and outer ( Aerospace 06 00076 i007) control surface are depicted as well. Notably, the ratio between the three control surface commands in diagram (a) remains constant, confirming that the blending vectors are unchanged by the control allocation, which is active also during the fault free scenarios but not manipulating the commanded signals. As all three signals are equal zero in the open-loop experiment they are not shown. Diagram (b) compares the bending moment of the wing measured by sensors located at the wing root as depicted in Figure 4. Clearly, the moment is reduced when closing the loop confirming the load reduction capabilities of the baseline controller for an excitation of at 8 Hz. Note that the bending moment measurement is only used for control performance analyses and is not used in the feedback channels of the controller. Thereby it provides an independent variable to validate the performance of the algorithms. In diagrams (c) and (d) the results of Fast Fourier Transformations (FFTs) of the time domain data are shown. In diagram (c) the FFT of the pitch excitation signal shows the dominant magnitude at 8 Hz. The resonance frequency at 8 Hz is indicated by the vertical dotted line. Diagram (d) compares the FFTs of the measured bending moments in the open-loop and closed-loop. As in the time domain in diagram (b), the reduction in magnitude is clearly visible.
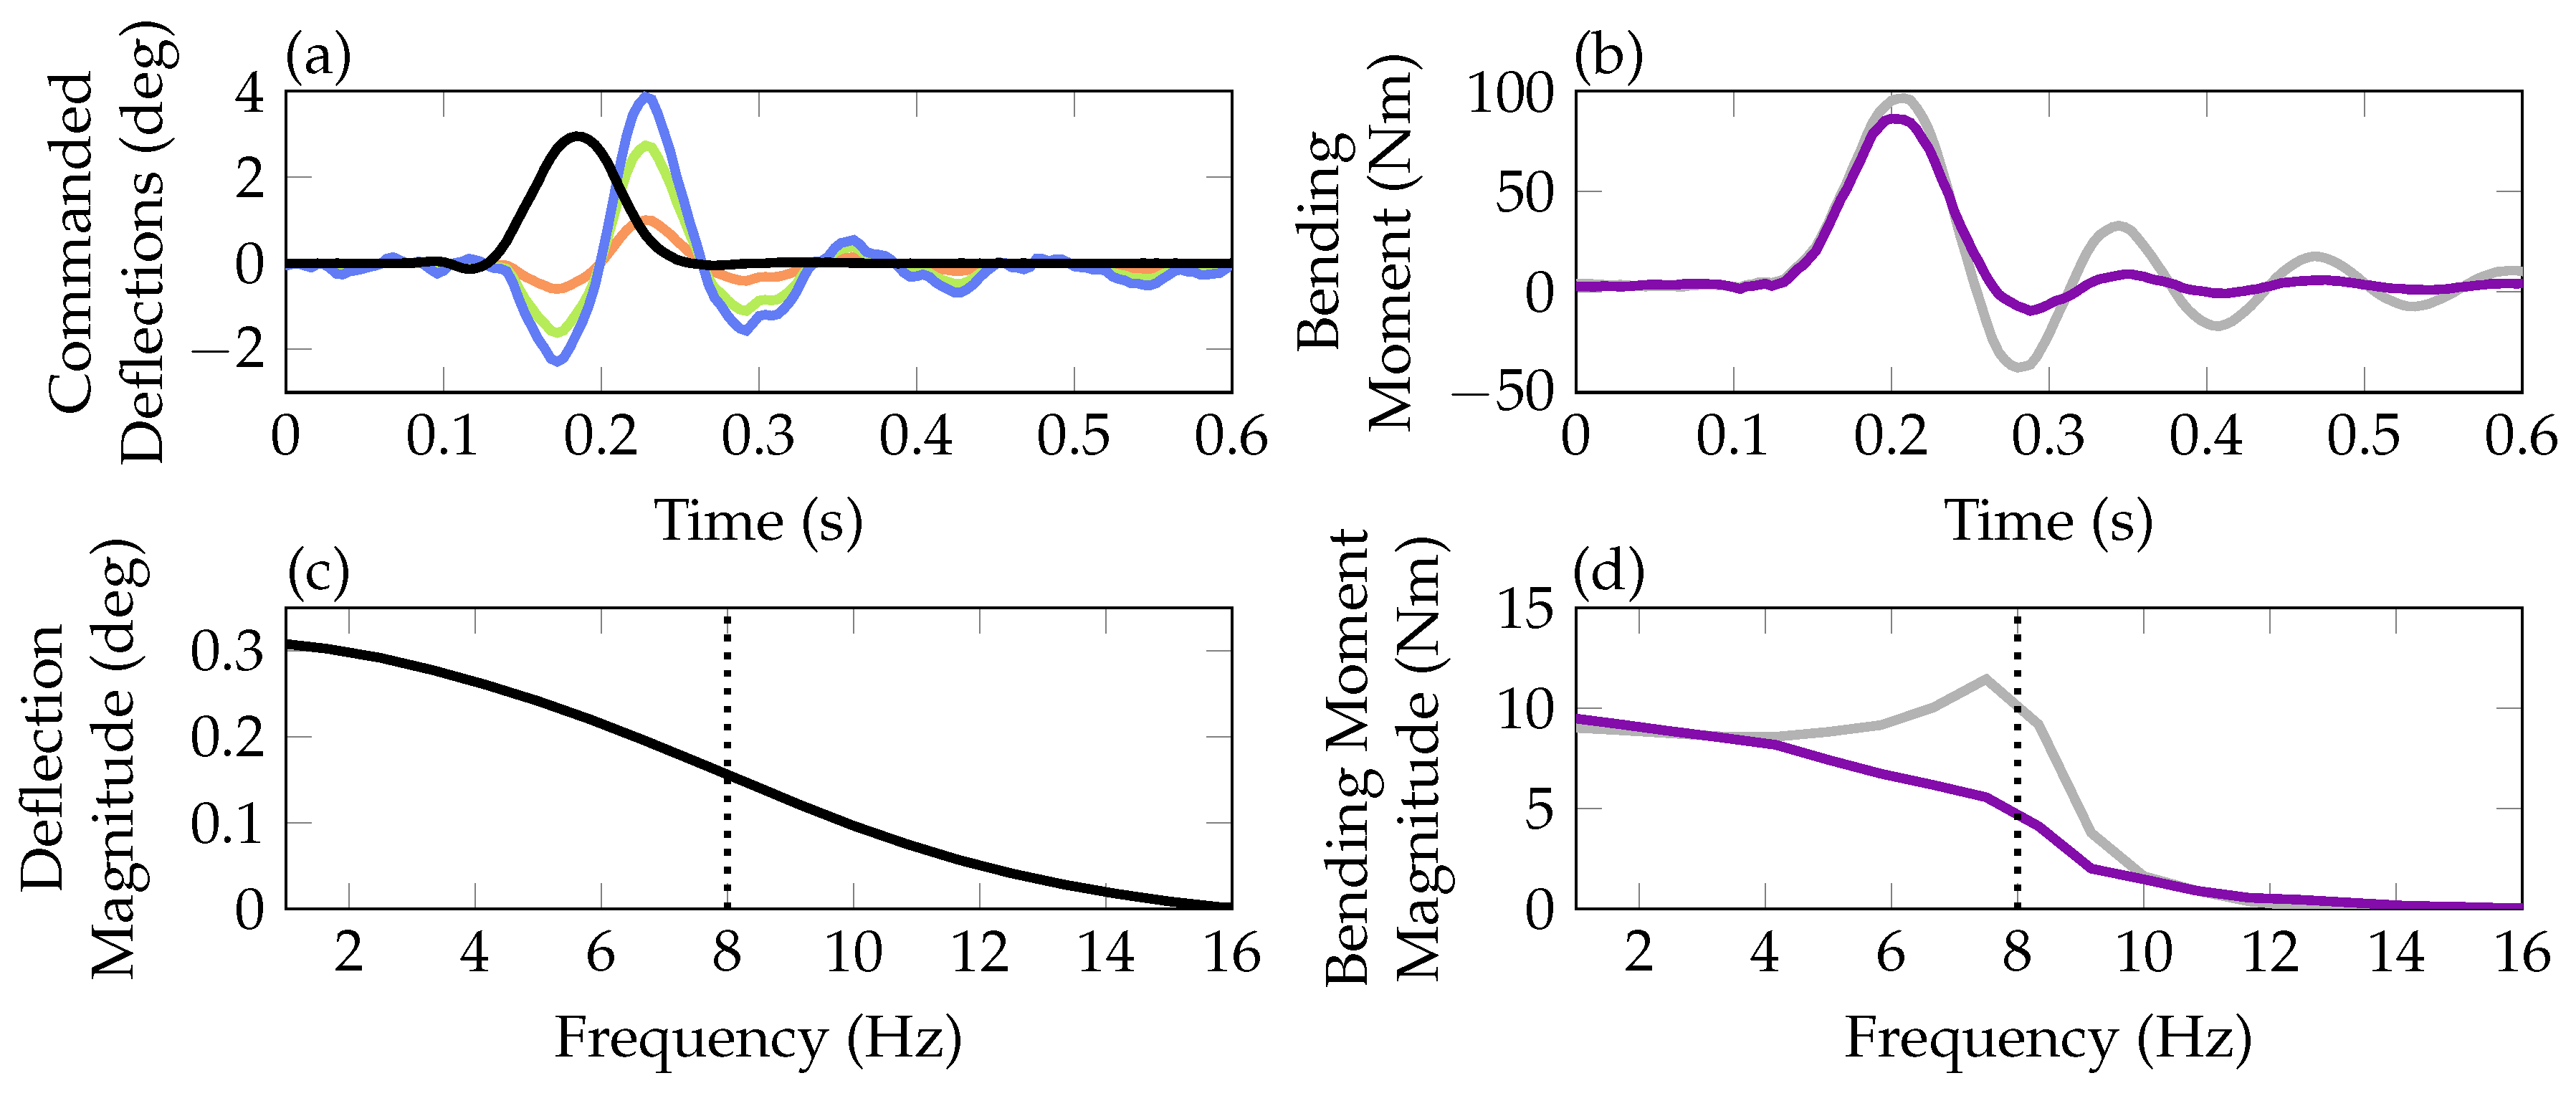
Next, the first row of Figure 10 depicts the time domain data of the experiments with a 1-cosine pitch excitation. Again, open- and closed-loop are simulated.
In diagram (a) the excitation signal for both experiments ( Aerospace 06 00076 i008) together with the closed-loop control surface commands are shown. The resulting reduction of the bending moment on the wing is visible in diagram (b), comparing open- ( Aerospace 06 00076 i003) and closed-loop ( Aerospace 06 00076 i004) responses. In the diagrams (c) and (d) the data is further analyzed using FFTs. Diagram (c) illustrates that the 1-cosine pitch signal excites the system up to a frequency of about 15 Hz, where the main energy is concentrated at the lower frequency range. In diagram (d) the peak in the open-loop response lies at around 8 Hz due to the undamped mode. The controller designed to increase the damping of this mode flattens the peak and reduce the output energy around 8 Hz.
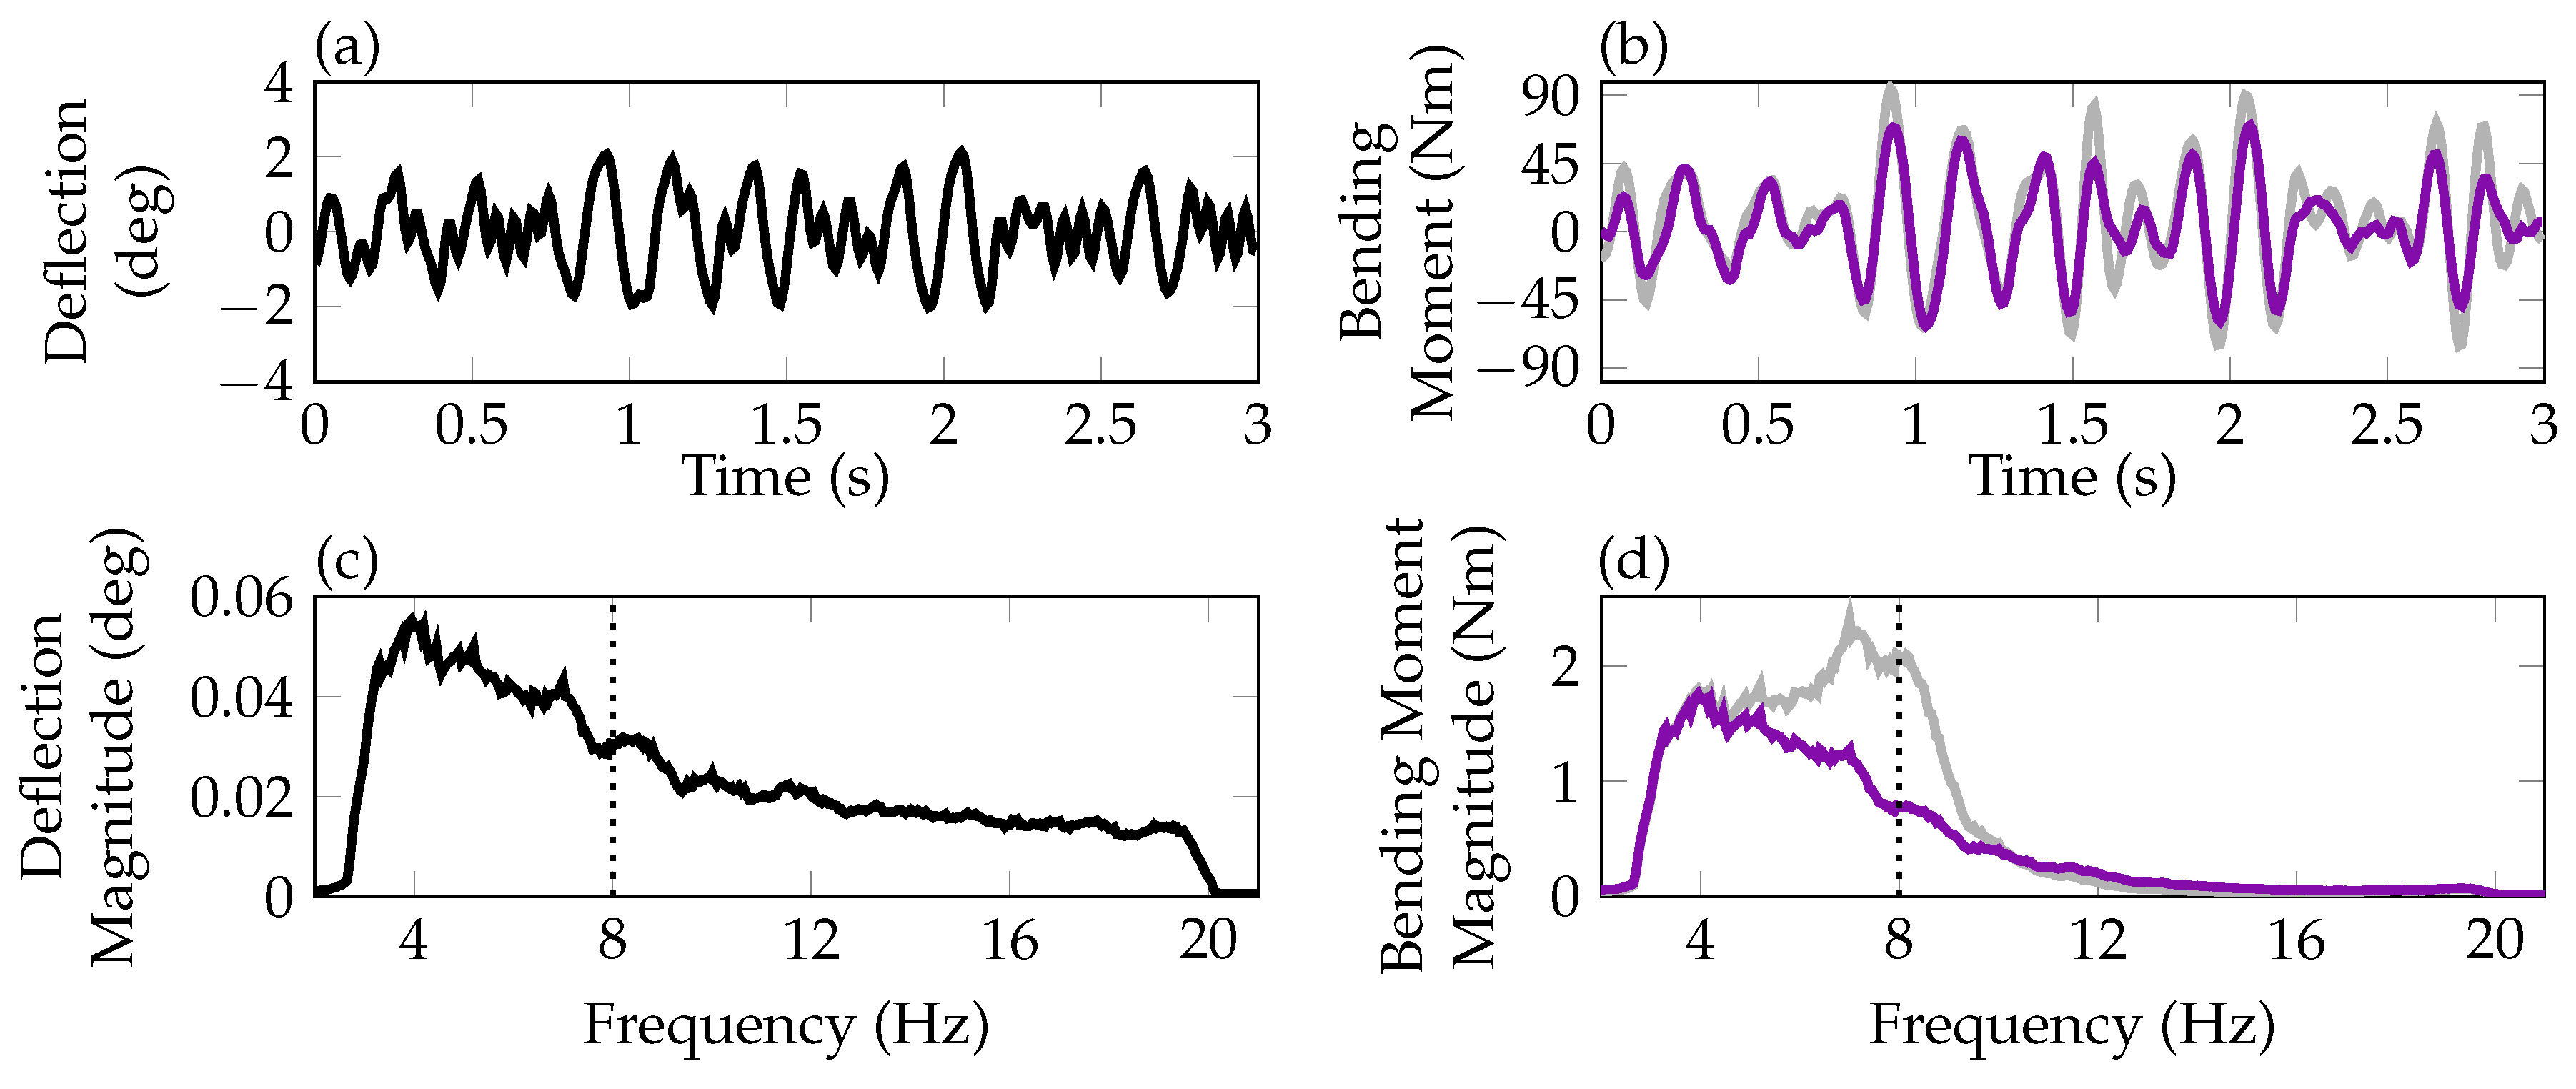
Finally, experiments with noise inputs on the pitch motor are performed to test a broader frequency range. The noise is generated with a variance of 0.7 deg within a frequency range between 3 Hz and 20 Hz. A short section of the 300 s long excitation time signal is depicted in diagram (a) in Figure 11. In diagram (c) the FFT results of the 300 s long input signal is depicted. Note that the signal has been smoothened for better readability. Clearly, the main energy of the input signal is concentrated in the lower frequency range between 3 Hz and 10 Hz. In the time domain the reduction of bending moment peaks by the controller are nicely visible when comparing the open-loop ( Aerospace 06 00076 i003) and closed-loop ( Aerospace 06 00076 i004) in diagram (b). FFTs of these two signals further reveals that energy around 8 Hz is clearly reduced in the closed-loop compared to the open-loop, see diagram (d). As for the 1-cosine excitation the main energy in the output signal is concentrated around 8 Hz in the open-loop although it is not in the input signal. This is due to the lowly damped first bending mode at 8 Hz. The increase of this damping by the controller leads to the reduction of energy in the output signal.

6.2. Fault Detection System Validation

To test the fault detection system including the residual filter and the evaluation and decision algorithms, different experiments are performed. First, the robustness against false alarms is tested. In these scenarios, the residual needs to stay below the selected threshold so that no false alarm is triggered. The scenarios and thus the input data for these experiments are the same as presented in Section 6.1 for the baseline controller validation. Again, the experiments include both open-loop and closed-loop experiments using the three different excitation signals.
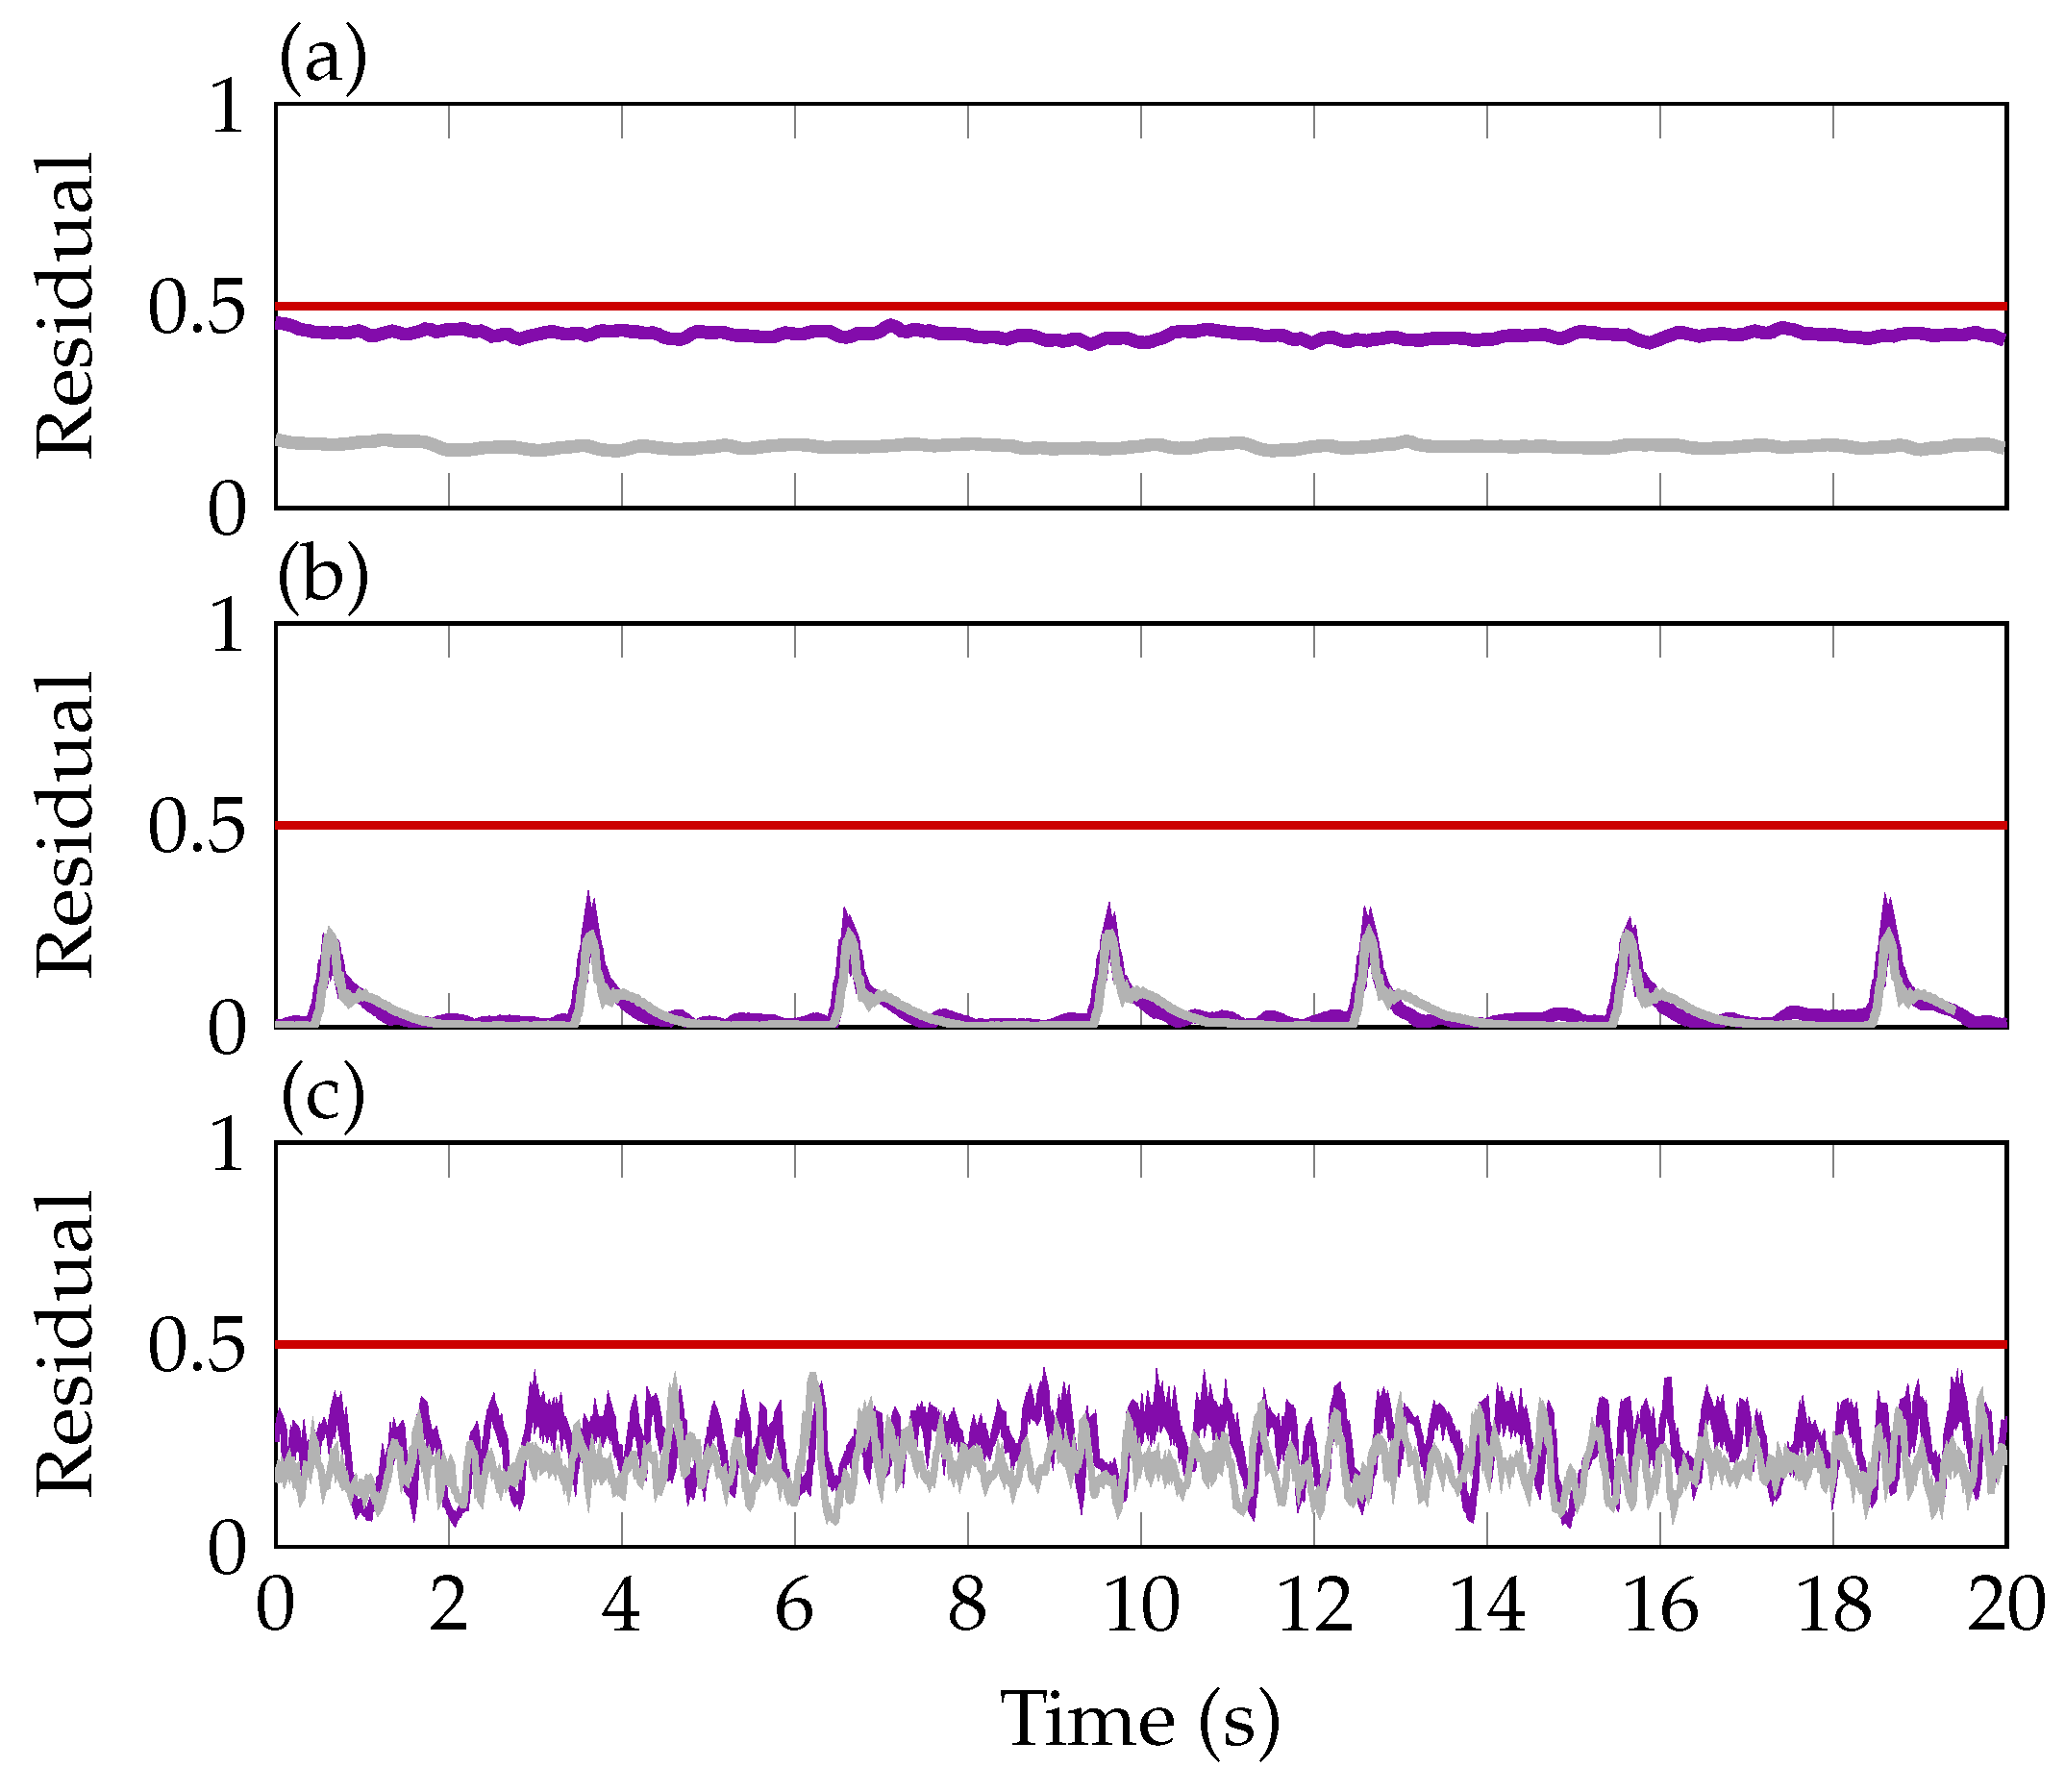
In the first diagram of Figure 12, the evaluated residual signal θ during a sinusoidal excitation with 1 deg at 8 Hz is depicted for the open-loop ( Aerospace 06 00076 i003) and closed-loop ( Aerospace 06 00076 i004). The residual is higher when performing the experiments in the closed-loop as in these scenarios also control surface commands are present. This higher input energy unavoidably leads to a higher excitation of the residual due to modeling errors and uncertainties. Both signals, however, stay below the selected threshold of 0.5. Diagram (b) shows the residuals in open- and closed-loop during succeeding 1-cosine gust excitations of 3 deg. Again, the residual is slightly higher for the closed-loop experiment. In diagram (c), the residual responses in the open-loop and closed-loop to the noise excitation with a variance of 0.7 deg in amplitude and a frequency range between 3 Hz and 20 Hz is shown. In both cases the residual stay below the selected threshold of 0.5 and the closed-loop shows a slightly increased signal compared to the open-loop.
In a second step, the detection performance in case of an occurring fault is tested. Therefore, the outer control surface is frozen at its zero position during the experiment at a predefined instant of time. As excitation, the sinusoidal input signal of 1 deg amplitude and 8 Hz frequency is commanded to the pitch actuator during the whole experiment. In Figure 13, the evaluated residual signal θ is shown, where the fault appears at about 3.8 s, indicated by the vertical dotted line. The residual crosses the threshold about 0.1 s after the fault occurrence, indicating an satisfactory detection performance.

6.3. Fault Tolerant Control Validation

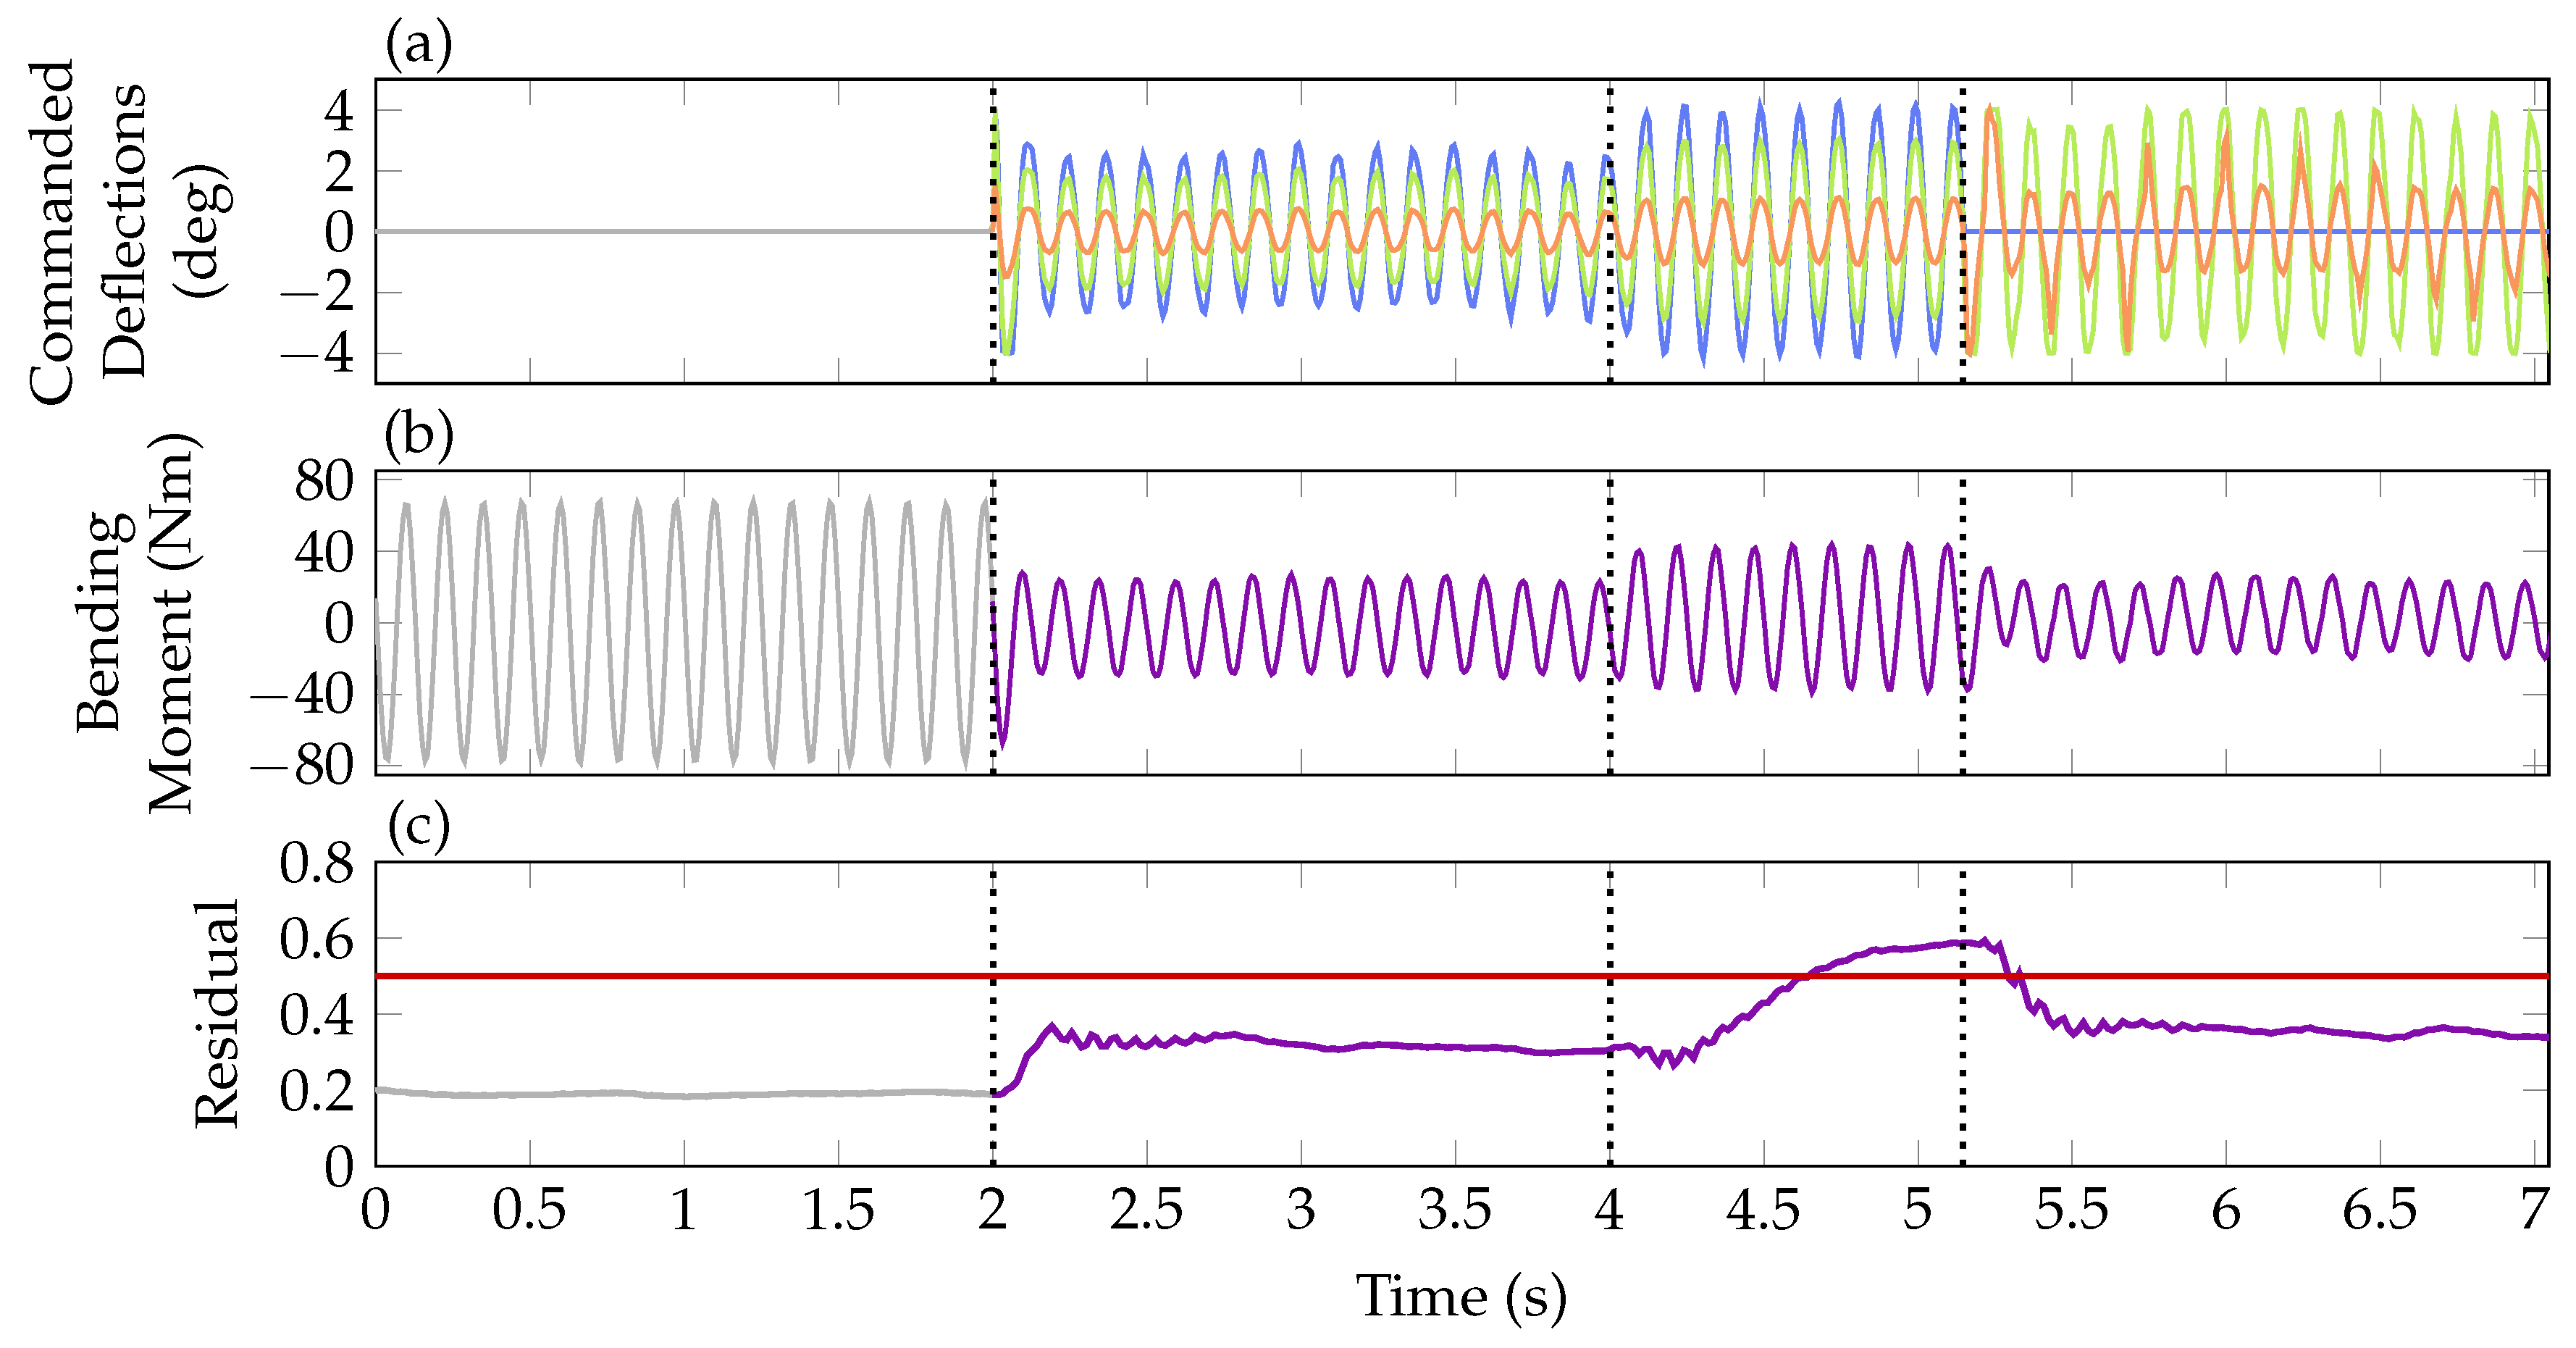
Finally, an experiment to test the overall control system, including the baseline controller, fault detection system and the reconfigurable control allocation is performed. As excitation signal, the sinusoidal input of 1 deg amplitude and 8 Hz frequency is used. As fault scenario, the outer most actuator is frozen at 2 deg. The resulting experimental data is depicted in Figure 14 and can be divided in four main sections. The test is started in open-loop, that is, only the excitation signal at the pitch motor is present and excites the wing while the baseline controller is switched off. After around 2 s the baseline controller is switched on. The first diagram (a) shows the commanded deflection signals to the inner ( Aerospace 06 00076 i005), mid ( Aerospace 06 00076 i006) and outer ( Aerospace 06 00076 i007) control surface counteracting the wing oscillations. In diagram (b) the measured wing root bending moment is depicted. As soon as the baseline controller is activated, the bending moment are reduced by about 50 %. The residual in diagram (c) is increased when activating the controller due to additionally present actuator inputs. At around 4 s the outer control surface is frozen at 2 deg. Note that the actual control surface positions are not plotted but the controller commands. As the fault is present but the controller has not been reconfigured, commands to the outer control surface are still present in the third part of the experiment, visible in diagram (a). Due to the frozen actuator position, the wing root bending moment increases as seen in diagram (b). Due to the increased control error, the baseline controller counteracts the fault, already achieving a reduction of the bending moment compared to the open-loop.
The residual in diagram (c) increases due to the appearing fault and crosses its threshold at about 4.5 s in the experiment. As 0.5 s confirmation time is considered, the control allocation is reconfigured at around 5 s in the experiment. From thereon, the required control effort is distributed to the remaining two control surfaces, while the command to the faulty actuator is set to zero. Clearly visible in diagram (a) is the increased effort commanded to the inner ( Aerospace 06 00076 i005) and mid ( Aerospace 06 00076 i006) control surface in the fourth section. With this reconfiguration, the bending moment is reduced again as in the nominal baseline control configuration (see diagram (b)). Taking a closer look, however, it can be recognized that the bending moment resulting from the reconfigured control allocation, with only two flaps in operation, is slightly smaller than the one resulting from baseline control with all three flaps working. After some closer investigation, this curious result is traced back to the large free-play of the inner flap, which is around 1.5 deg. Hence, in the nominal case with the baseline controller, the inner flap is not deflected since the commanded deflections ( Aerospace 06 00076 i005) given in diagram (a) of Figure 14 are within free-play. Obviously, this reduces nominal controller performance, which is confirmed in nonlinear simulations. In contrast, the reconfigured control allocation commands larger deflections to the inner flap yielding a smaller performance loss due to the increased operation outside of the free-play area. Note that the residual falls below its threshold after the reconfiguration. The constant mismatch between the commanded (0 deg) and actual actuator position (2 deg) is not visible due to the differentiating behavior in the fault to residual channel. Due to this phenomenon, the decision variable indicating if a fault is present on the actuator is held at 1 after the fault is confirmed at about 5 s. Finally, with this experiment, however, the fault tolerant control system including the reconfiguration of the control allocation in case of fault is successfully verified.

7. Conclusions

In this paper the successful development and validation of a fault tolerant gust load alleviation system for an aircraft wing has been presented. The control system, consisting of a baseline load alleviation controller, a fault detection module and a reconfigurable control allocation, has been developed using profound mathematical techniques. The control system for a manufactured flexible wing has been successfully verified in an extensive wind tunnel campaign. The encouraging results pave the way for further research activities to achieve the goal of an in-flight validation of the algorithms in the future.

Author Contributions

The authors jointly worked on the control system design and data analysis as well as jointly wrote this article. In detail: conceptualization: D.O.; methodology and software: M.P. and D.O.; wind tunnel experiment setup: M.P.; writing—original draft preparation: D.O.; writing—review and editing: M.P. and D.O.; visualization: D.O. and M.P.; supervision: D.O.

Funding

This research received no external funding.

Acknowledgments

The authors like to thank DLR’s Institute of Aeroelasticity in Göttingen as well as the Institute of System Dynamics and Control in Oberpfaffenhofen for supporting the extensive wind tunnel test campaign. Special thanks goes out to Johannes Dillinger, Jannis Lübker and Martin Tang for their valuable assistance.

Conflicts of Interest

The authors declare no conflict of interest.

References

  1. Pusch, M.; Knoblach, A.; Kier, T. Integrated Optimization of Ailerons for Active Gust load alleviation. In Proceedings of the International Forum on Aeroelsticity and Structural Dynamics, St. Petersburg, Russia, 28 June–2 July 2015. [Google Scholar]
  2. Pusch, M. Allocation of distributed flaps for gust load alleviation. In Proceedings of the IEEE Conference on Control Technology and Applications, Mauna Lani, HI, USA, 27–30 August 2017; pp. 2120–2125. [Google Scholar] [CrossRef]
  3. Ossmann, D.; Poussot-Vassal, C. Minimal order disturbance estimator design for aircraft load alleviation control. In Proceedings of the IEEE Conference on Control Technology and Applications, Copenhagen, Denmark, 21–24 August 2018; pp. 787–793. [Google Scholar] [CrossRef]
  4. Goupil, P.; Boada-Bauxell, J.; Marcos, A.; Cortet, E.; Kerr, M.; Costa, H. AIRBUS efforts towards advanced real-time Fault Diagnosis and Fault Tolerant Control. In Proceedings of the 19th IFAC World Congress; Elsevier: Capetown, South Africa, 2014; pp. 3471–3476. [Google Scholar] [CrossRef]
  5. Ossmann, D.; Joos, H.D.; Goupil, P. Enhanced Sensor Monitoring to Maintain Optimal Aircraft Handling in Case of Faults. AIAA J. Guid. Control Dyn. 2017, 40, 3127–3137. [Google Scholar] [CrossRef]
  6. Danowsky, B.; Thompson, P.; Lee, D.C.; Brenner, M. Modal Isolation and Damping for Adaptive Aeroservoelastic Suppression. In AIAA Atmospheric Flight Mechanics Conference; AIAA: Boston, MA, USA, 2013. [Google Scholar] [CrossRef]
  7. Pusch, M. Aeroelastic Mode Control using H2-optimal Blends for Inputs and Outputs. In Proceedings of the Guidance, Navigation, and Control Conference, AIAA SciTech Forum; AIAA: Kissimmee, FL, USA, 2018. [Google Scholar] [CrossRef]
  8. Pusch, M.; Ossmann, D. H 2 -optimal Blending of Inputs and Outputs for Modal Control. Trans. Control Syst. Technol. 2018. submitted. [Google Scholar]
  9. Pusch, M.; Ossmann, D.; Luspay, T. Structured Control Design for a Highly Flexible Flutter Demonstrator. Aerospace 2019, 6, 27. [Google Scholar] [CrossRef]
  10. Frisk, E.; Nyberg, M. A minimal polynomial basis solution to residual generation for fault diagnosis in linear systems. Automatica 2001, 37, 1417–1424. [Google Scholar] [CrossRef] [Green Version]
  11. Varga, A. On computing least order fault detection filters using rational nullspace bases. In Proceedings of the 5th IFAC Symposium on Fault Detection, Supervision and Safety for Technical Processes; Elsevier: Washington, DC, USA, 2003. [Google Scholar] [CrossRef]
  12. Varga, A. Solving Fault Diagnosis Problems—Linear Synthesis Techniques; Springer International Publishing: Cham, Switzerland, 2017. [Google Scholar]
  13. Varga, A.; Ossmann, D. LPV-techniques based robust diagnosis of flight actuator faults. Control Eng. Pract. 2014, 31, 135–147. [Google Scholar] [CrossRef]
  14. Varga, A.; Ossmann, D.; Joos, H.D. A fault diagnosis based reconfigurable longitudinal control system for managing loss of air data sensors for a civil aircraft. In Proceedings of the 18th IFAC World Congress; Elsevier: Capetown, South Africa, 2014. [Google Scholar] [CrossRef]
  15. Argha, A.; Su, S.W.; Celler, B.G. Control allocation-based fault tolerant control. Automatica 2019, 103, 408–417. [Google Scholar] [CrossRef]
  16. Hamayun, M.T.; Edwards, C.; Alwi, H. A fault tolerant control allocation scheme with output integral sliding modes. Automatica 2013, 49, 1830–1837. [Google Scholar] [CrossRef] [Green Version]
  17. Pusch, M.; Ossmann, D.; Dillinger, J.; Kier, T.; Tang, M.; Lübker, J. Aeroelastic Modeling and Control of an Experimental Flexible Wing. In Proceedings of the AIAA Scitech 2019 Forum; AIAA: San Diego, CA, USA, 2019. [Google Scholar] [CrossRef] [Green Version]
  18. Dillinger, J.; Meddaikar, Y.; Lübker, J.; Pusch, M.; Kier, T. Design and Optimization of an Aeroservoelastic Wind Tunnel Model. In Proceedings of the International Forum on Aeroelasticity and Structural Dynamics; IFASD: Savannah, GA, USA, 2019. [Google Scholar]
  19. Varga, A. The nullspace method a unifying paradigm to fault detection. In Proceedings of the IEEE Conference on Decision and Control, Shanghai, China, 15–18 December 2009. [Google Scholar] [CrossRef]
  20. Johansen, T.A.; Fossen, T.I. Control allocation—A Survey. Automatica 2013, 49, 1087–1103. [Google Scholar] [CrossRef]
  21. Schmid, C.; Biegler, L.T. Quadratic programming methods for reduced hessian SQP. Comput. Chem. Eng. 1994, 18, 817–832. [Google Scholar] [CrossRef]
  22. Krüger, W.R.; Dillinger, J.; Meddaikar, Y.; Lübker, J.; Tang, M.; Meier, W.; Pusch, M.; Kier, T. Design and Wind Tunnel Test of an Actively Controlled Flexible Wing. In Proceedings of the International Forum on Aeroelasticity and Structural Dynamics; IFASD: Savannah, GA, USA, 2019. [Google Scholar]
  23. Dillinger, J.; Klimmek, T.; Abdalla, M.; Gürdal, Z. Stiffness Optimization of Composite Wings with Aeroelastic Constraints. J. Aircr. 2013, 50, 1159–1168. [Google Scholar] [CrossRef]
  24. Roger, K.L. Airplane Math Modeling Methods for Active Control Design. In Proceedings of the 44th Structures and Materials Panel; Advisory Group for Aerospace Research and Development: Lisbon, Portugal, 1977; pp. 4.1–4.11. [Google Scholar]
  25. Govers, Y.; Böswald, M.; Lubrina, P.; Giclais, S.; Stephan, C.; Botargues, N. AIRBUS A350XWB Ground Vibration Testing: Efficient techniques for customer oriented on-site modal identification. In Proceedings of the International Conference on Noise and Vibration Engineering; Katholieke Universiteit Leuven: Leuven, Belgium, 2014; pp. 2503–2516. [Google Scholar]
  26. Böswald, M.; Schwochow, J.; Jelicic, G.; Govers, Y. New Concepts for Ground and Flight Vibration Testing of Aircraft based on Output-Only Modal Analysis. In Proceedings of the 7th International Operational Modal Analysis Conference; Shaker Verlag: Ingolstadt, Germany, 2017; pp. 15–34. [Google Scholar]
  27. Jelicic, G.; Schwochow, J.; Govers, Y.; Hebler, A.; Böswald, M. Real-time assessment of flutter stability based on automated output-only modal analysis. In Proceedings of the International Conference on Noise and Vibration Engineering; Katholieke Universiteit Leuven: Leuven, Belgium, 2014; pp. 3693–3706. [Google Scholar]
  28. Jelicic, G.; Schwochow, J.; Govers, Y.; Sinske, J.; Buchbach, R.; Springer, J. Online Monitoring of Aircraft Modal Parameters during Flight Test based on permanent Output-Only Modal Analysis. In Proceedings of the 58th AIAA/ASCE/AHS/ASC Structures, Structural Dynamics, and Materials Conference; AIAA: Grapevine, TX, USA, 2017. [Google Scholar] [CrossRef]
  29. Varga, A. Fault detection and isolation of actuator failures for a large transport aircraft. In Proceedings of the CEAS European Air and Space Conference; CEAS: Berlin, Germany, 2007. [Google Scholar]
  30. Poussot-Vassal, C.; Demourant, F.; Lepage, A.; Bihan, D.L. Gust Load Alleviation: Identification, Control, and Wind Tunnel Testing of a 2-D Aeroelastic Airfoil. IEEE Trans. Control Syst. Technol. 2017, 25. [Google Scholar] [CrossRef]
  31. Lepage, A.; Huvelin, F.; Bihan, D.L.; Poussot-Vassal, C.; Brion, V.; Naudin, P.; Rantet, E. Experimental investigation and control of gust load response in transonic flow. In Proceedings of the 3AF Greener Aviation Conference; CCSD: Brussels, Belgium, 2016. [Google Scholar]
  32. Certification Specifications and Acceptable Means of Compliance for Large Aeroplanes, CS25, Amendment 16; Technical report; European Aviation Safety Agency: Cologne, Germany, 2015.
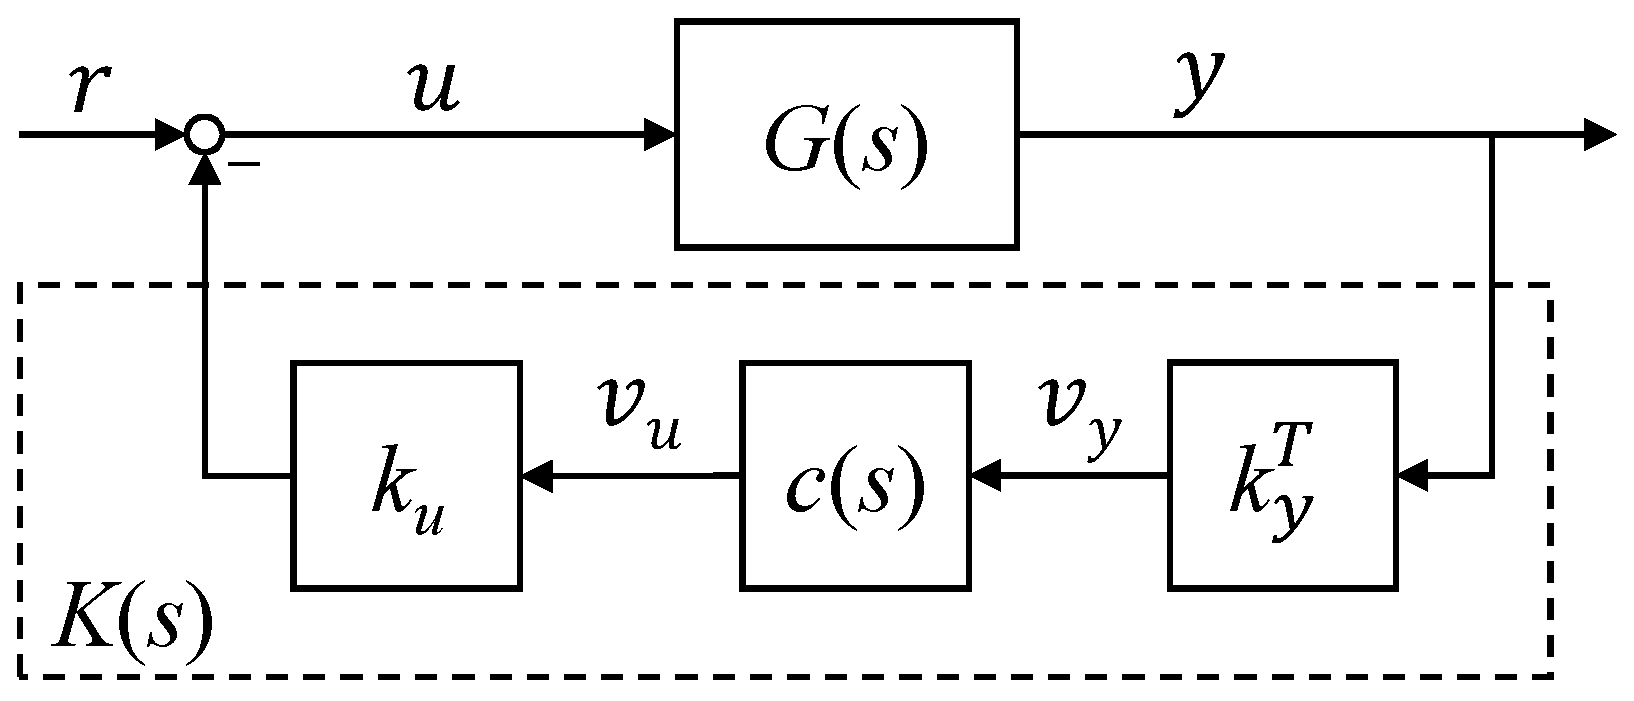
Figure 1. Block diagram representation of the blending approach.
Aerospace 06 00076 g001
Figure 2. Wing mounted to pitch motor at the wing root in the wind tunnel.
Aerospace 06 00076 g002
Figure 3. Schematic top-view illustration of the wing with three control surfaces, eight acceleration sensor locations, pitch motor and load sensor location.
Aerospace 06 00076 g003
Figure 4. Schematic block diagram of the elastic wing model structure including aerodynamics, elastic structure, control surface actuators and pitch motor.
Aerospace 06 00076 g004
Figure 5. Schematic illustration of the fault tolerant control architecture.
Aerospace 06 00076 g005
Figure 6. Open-loop ( Aerospace 06 00076 i001) and closed-loop ( Aerospace 06 00076 i002) pole location of the wing’s first bending mode depicted in (a). Magnitude plot of the wing model augmented with the blending vectors ( Aerospace 06 00076 i003) in (b) together with the magnitude of closed-loop ( Aerospace 06 00076 i004).
Aerospace 06 00076 g006
Figure 7. Bode magnitude plots from commanded deflections of inner ( Aerospace 06 00076 i005), mid ( Aerospace 06 00076 i006), outer ( Aerospace 06 00076 i007) control surfaces to residual and from pitch motor command to the residual ( Aerospace 06 00076 i008) in (a) and from fault to residual in (b).
Aerospace 06 00076 g007
Figure 8. Single-input and single-output (SISO) controller illustration with blending vectors k y and k u and control allocation.
Aerospace 06 00076 g008
Figure 9. Input and output data for a sinusoidal pitch excitation in the time domain in (a,b) and in the frequency domain in (c,d). In (a,c) the pitch excitation ( Aerospace 06 00076 i008) is depicted. In (b,d) the resulting open-loop ( Aerospace 06 00076 i003) and closed-loop ( Aerospace 06 00076 i004) bending moments are compared. Additionally, closed-loop inner ( Aerospace 06 00076 i005), mid ( Aerospace 06 00076 i006) and outer ( Aerospace 06 00076 i007) control surface commands are shown in (a).
Aerospace 06 00076 g009
Figure 10. Input and output data for a 1-cosine pitch excitation in the time domain in (a,b) and in the frequency domain in (c,d). In (a,c) the pitch excitation signal ( Aerospace 06 00076 i008) is depicted. In (b,d) the open-loop ( Aerospace 06 00076 i003) and closed-loop ( Aerospace 06 00076 i004) bending moments are compared. Additionally, closed-loop inner ( Aerospace 06 00076 i005), mid ( Aerospace 06 00076 i006) and outer ( Aerospace 06 00076 i007) control surface commands are shown in (a).
Aerospace 06 00076 g010
Figure 11. Input and output data for noise excitations in the time domain in (a,b) and the frequency domain in (c,d). In (a,c) the pitch motor noise excitation ( Aerospace 06 00076 i008) is depicted, while in (b,d) the open- ( Aerospace 06 00076 i003) and closed-loop ( Aerospace 06 00076 i004) bending moment is compared.
Aerospace 06 00076 g011
Figure 12. Residual signals during open-loop ( Aerospace 06 00076 i003) and closed-loop ( Aerospace 06 00076 i004) experiments for sinusoidal excitation (a), 1-cosine gust excitations (b) and noise excitations (c) compared to the threshold ( Aerospace 06 00076 i009).
Aerospace 06 00076 g012
Figure 13. Residual signal in a closed-loop experiment and a actuator stuck fault scenario compared to the selected threshold ( Aerospace 06 00076 i009).
Aerospace 06 00076 g013
Figure 14. Input and output data of the fault tolerant control experiment for sinusoidal pitch excitations. The diagrams show the commands for the inner ( Aerospace 06 00076 i005), mid ( Aerospace 06 00076 i006) and outer ( Aerospace 06 00076 i007) control surface in (a), measured bending moment in (b) and the residual with its threshold ( Aerospace 06 00076 i009) in (c). In (b,c), open-loop operation is indicated by ( Aerospace 06 00076 i003) and closed-loop operation by ( Aerospace 06 00076 i004).
Aerospace 06 00076 g014