Article

Effect of Various Surface Coatings on De-Icing/Anti-Icing Fluids Aerodynamic and Endurance Time Performances

Anti-icing Materials International Laboratory (AMIL), Department of Applied Sciences, Univeristé du Québec à Chicoutimi (UQAC), 555 Boulevard de l’Université, Chicoutimi, QC G7H2B1, Canada
*
Author to whom correspondence should be addressed.
Aerospace 2019, 6(10), 114; https://doi.org/10.3390/aerospace6100114
Submission received: 25 June 2019 / Revised: 12 September 2019 / Accepted: 7 October 2019 / Published: 9 October 2019

Abstract

:
The Anti-icing Materials International Laboratory (AMIL) has been testing SAE AMS1424 and AMS1428 ground de-icing/anti-icing fluids for more than 30 years. With the introduction of new surface coatings and their investigation as potential passive ice protection systems, or for hybrid use with other methods, it is important to understand their interaction with the ground de-icing/anti-icing fluids prior to applications on aircraft. In this study, five different surface coatings, both commercially available and under development, have been tested under two current test methods used to qualify the ground de-icing/anti-icing fluids: The Water Spray Endurance Test (WSET) and the Aerodynamic Acceptance Test (AAT). The tests were performed on three existing commercial de-icing/anti-icing fluids. The results have shown that the coatings tested in this study can considerably reduce the endurance time of the fluids and affect their ability to spread and wet the test surface. Superhydrophobic 1 coating also reduced the aerodynamic penalties created by the Ref. Fluid. Surface coatings, no matter their nature, can impact the performances and behaviour of the fluids and should be thoroughly tested before their use in the industry. The conclusions and methodology of this study were used in the development of sections of the SAE AIR6232 Aircraft Surface Coating Interaction with the Aircraft Deicing/Anti-Icing Fluids standard.

Graphical Abstract

1. Introduction

During winter, aircraft on the ground are affected by contamination due to cold and harsh weather conditions. These forms of contamination, like frost, snow, freezing rain, etc., affect the aerodynamic performances of the aerial vehicle and can lead to hazardous situations [1]. To counter those issues, ground de-icing and anti-icing fluids are used to clean the aircraft from the accumulated contamination and protect it from ongoing precipitations prior to and during the takeoff procedure. Those fluids need to provide a minimum amount of protection in terms of time and a maximum lift loss penalty during takeoff in order to be qualified for operational use.
Surface coatings are more and more commonly investigated as a passive solution to ice and snow contamination. Research and development in this field is growing every day with better and more efficient coatings being released on the market [2]. Some of those coatings are hydrophobic or superhydrophobic and others claim to be icephobic [3]. They could provide a certain degree of protection against icing events, especially in-flight combined with other protection systems, but unless they can provide a full protection on the ground, their interactions with the ground de-icing and anti-icing fluids need to be fully understood before their application on aircraft. The presence of a coating could impede the ability of those fluids to completely wet and adhere to the surface and accelerate its drainage off the aircraft, greatly limiting their protection capacities. It could also affect the lift loss caused by their elimination during takeoff, creating risky situations. Some researchers studied liquid film in shear flow; however none investigated the effect of surface coatings [4,5].
This paper presents the study of the effect of five different surface coatings, namely a standard epoxy, an icephobic, a hydrophobic, and two superhydrophobic coatings, on the performances of ground de-icing fluids. The Water Spray Endurance Test (WSET) is a test performed in conformity with the SAE AS5901 standard [6] and is used to define the endurance time of a fluid, which is the time before an ice front forms on the first 25 mm of the fluid during a set freezing precipitation. The Aerodynamic Acceptance Test (AAT) is a test performed as per the SAE AS5900 standard [7] and is used to determine the temperature at which the aerodynamic penalty of a given fluid exceeds 5.25%. In this paper the WSET and AAT are run with typical commercially available fluids and the results obtained with the baseline surface are compared to the results obtained with the five different coatings selected.

2. Materials and Methods

2.1. De-Icing and Anti-Icing Fluids

The fluids used in this study are presented in Table 1. The SAE AS5900 High Speed Ramp Reference fluid, an unnamed AMS1424 de-icing fluid [8], and an unnamed AMS1428 anti-icing fluid [9] were selected. De-icing fluids used were primarily hot (65 °C) to remove accumulated contamination from the aircraft and have a minimum endurance time of 3 min [8]. Anti-icing fluids are used to protect the aircraft from ongoing precipitation and those with a minimum endurance time of 80 min are classified as SAE AMS1428 Type IV fluids [9]. The composition of the SAE AS5900 Ref. Fluid is presented in Table 2.

2.2. Coatings Characteristics

The roughness and contact angle of the different surfaces are measured prior to the experiments. A Taylor-Hobson Surtronic 25 profilometer (Leicester, UK) has been used to measure the surface roughness. The apparatus has been used to obtain the average roughness by making measurements on the surface in three different orientations, 0°, 45°, and 90°. To measure the water contact angle of the different surfaces, a Krüss GmbH DSA100 drop shape analyzer (Hamburg, Germany) has been used. Fluids contact angles on the coatings have been also measured. The contact angle is the result of five measurements on each coating using 5 µL deionized water and fluid drop. The presented results consist of the average of the five measurements. An example of contact angle measurement is illustrated in Figure 1.

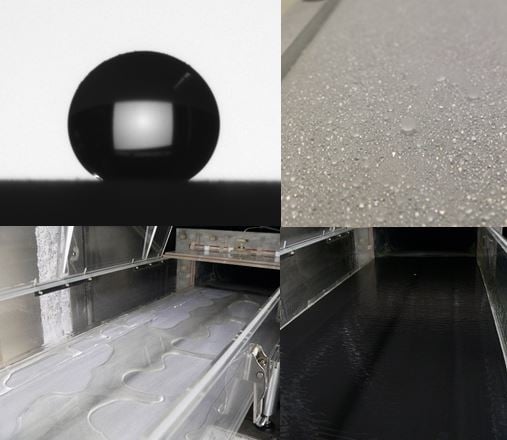
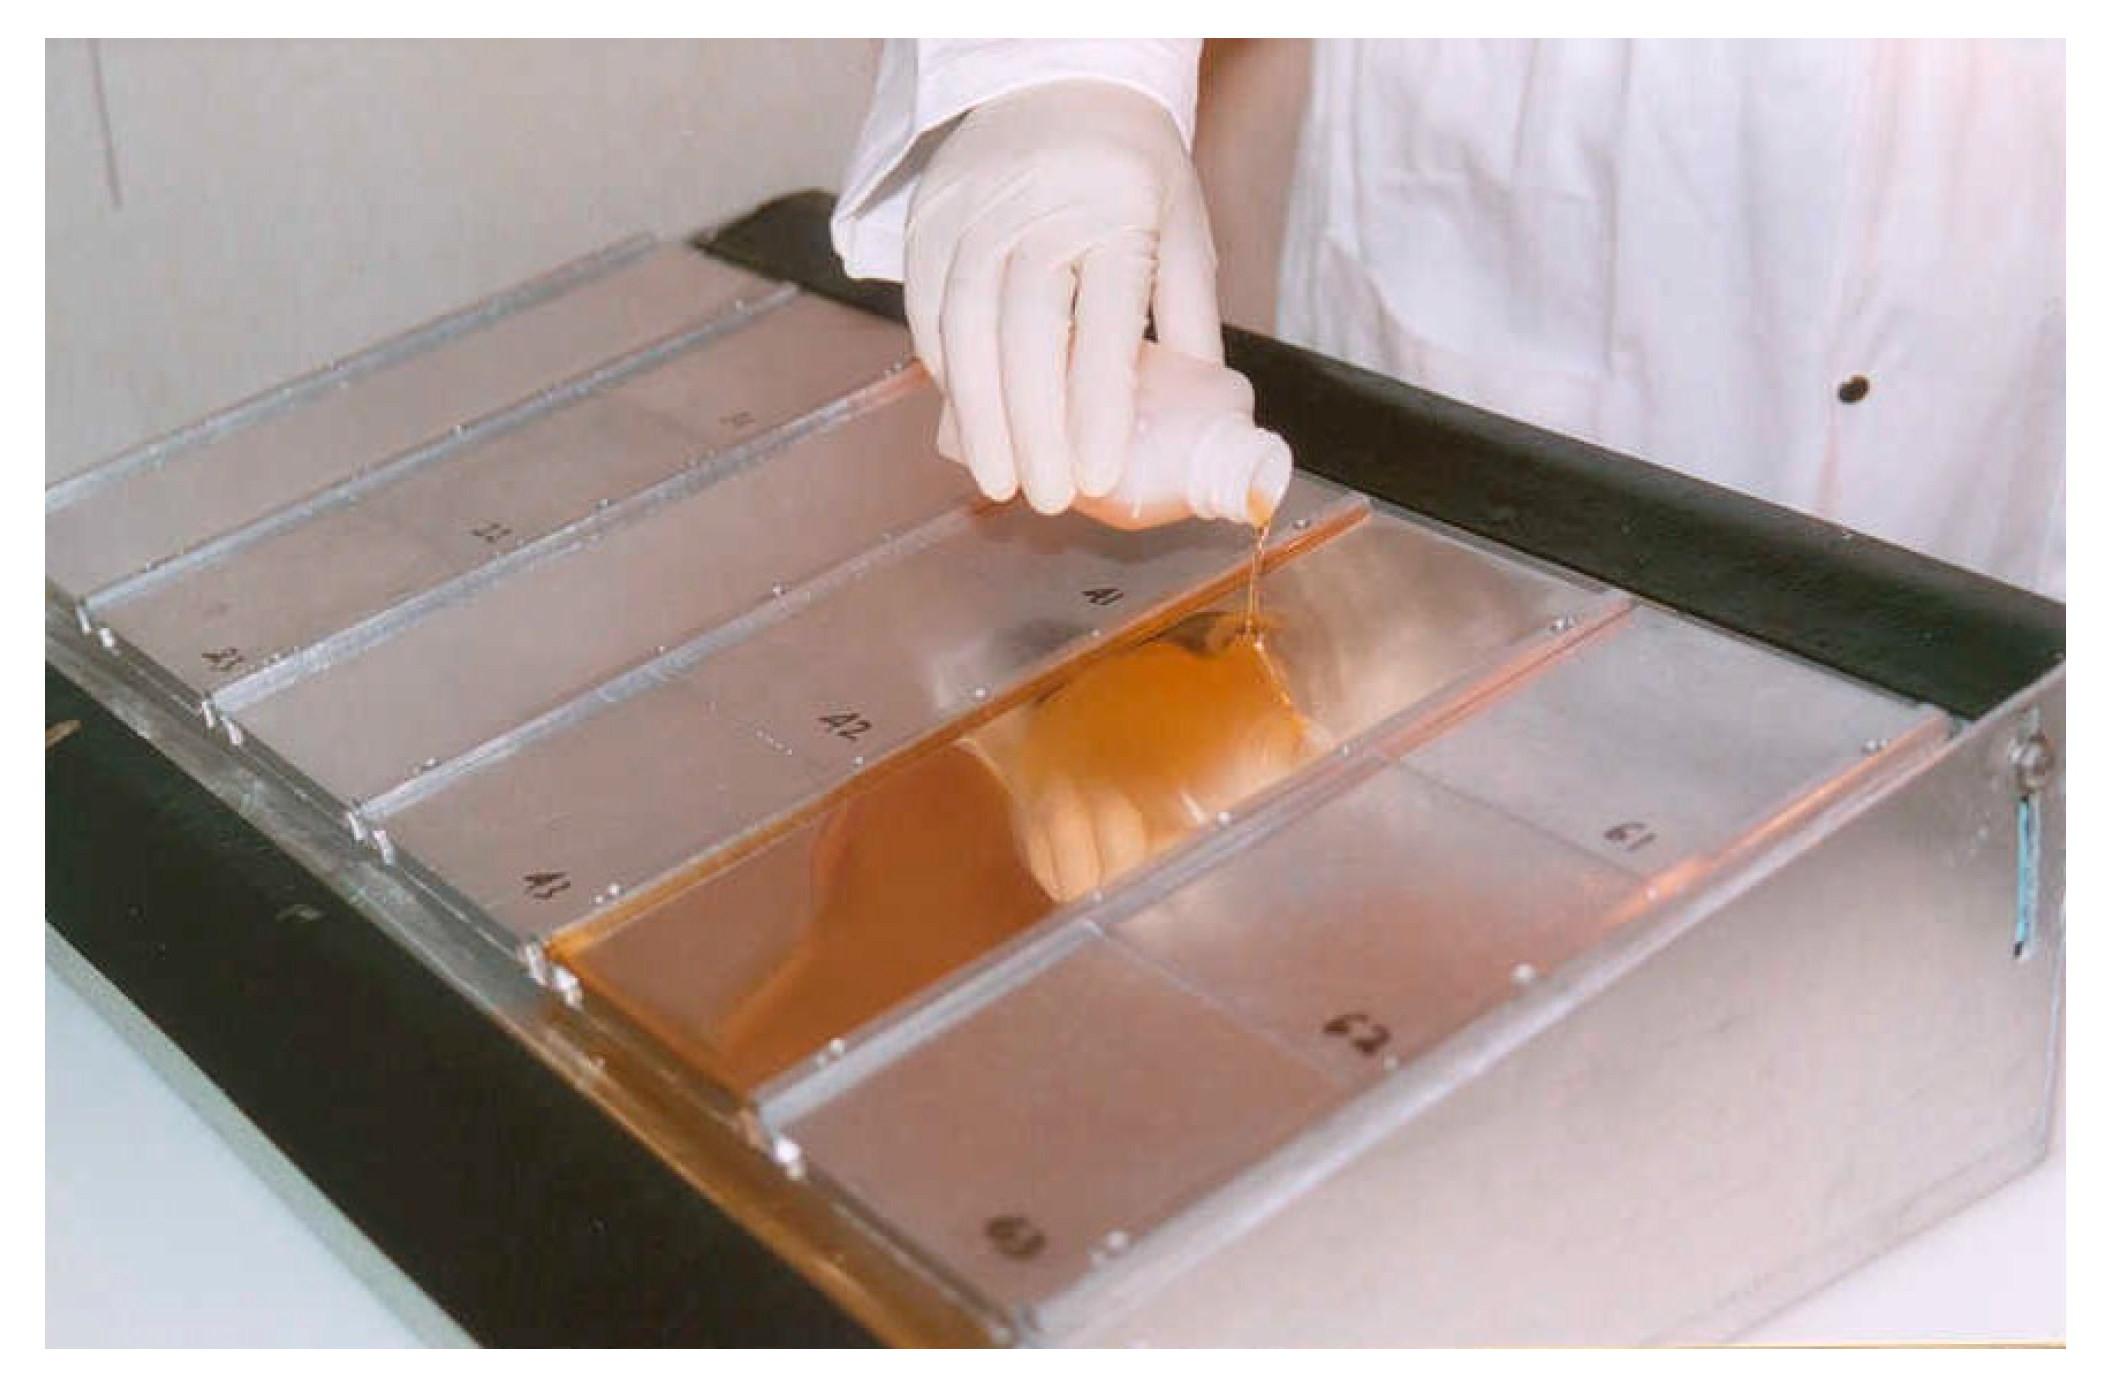
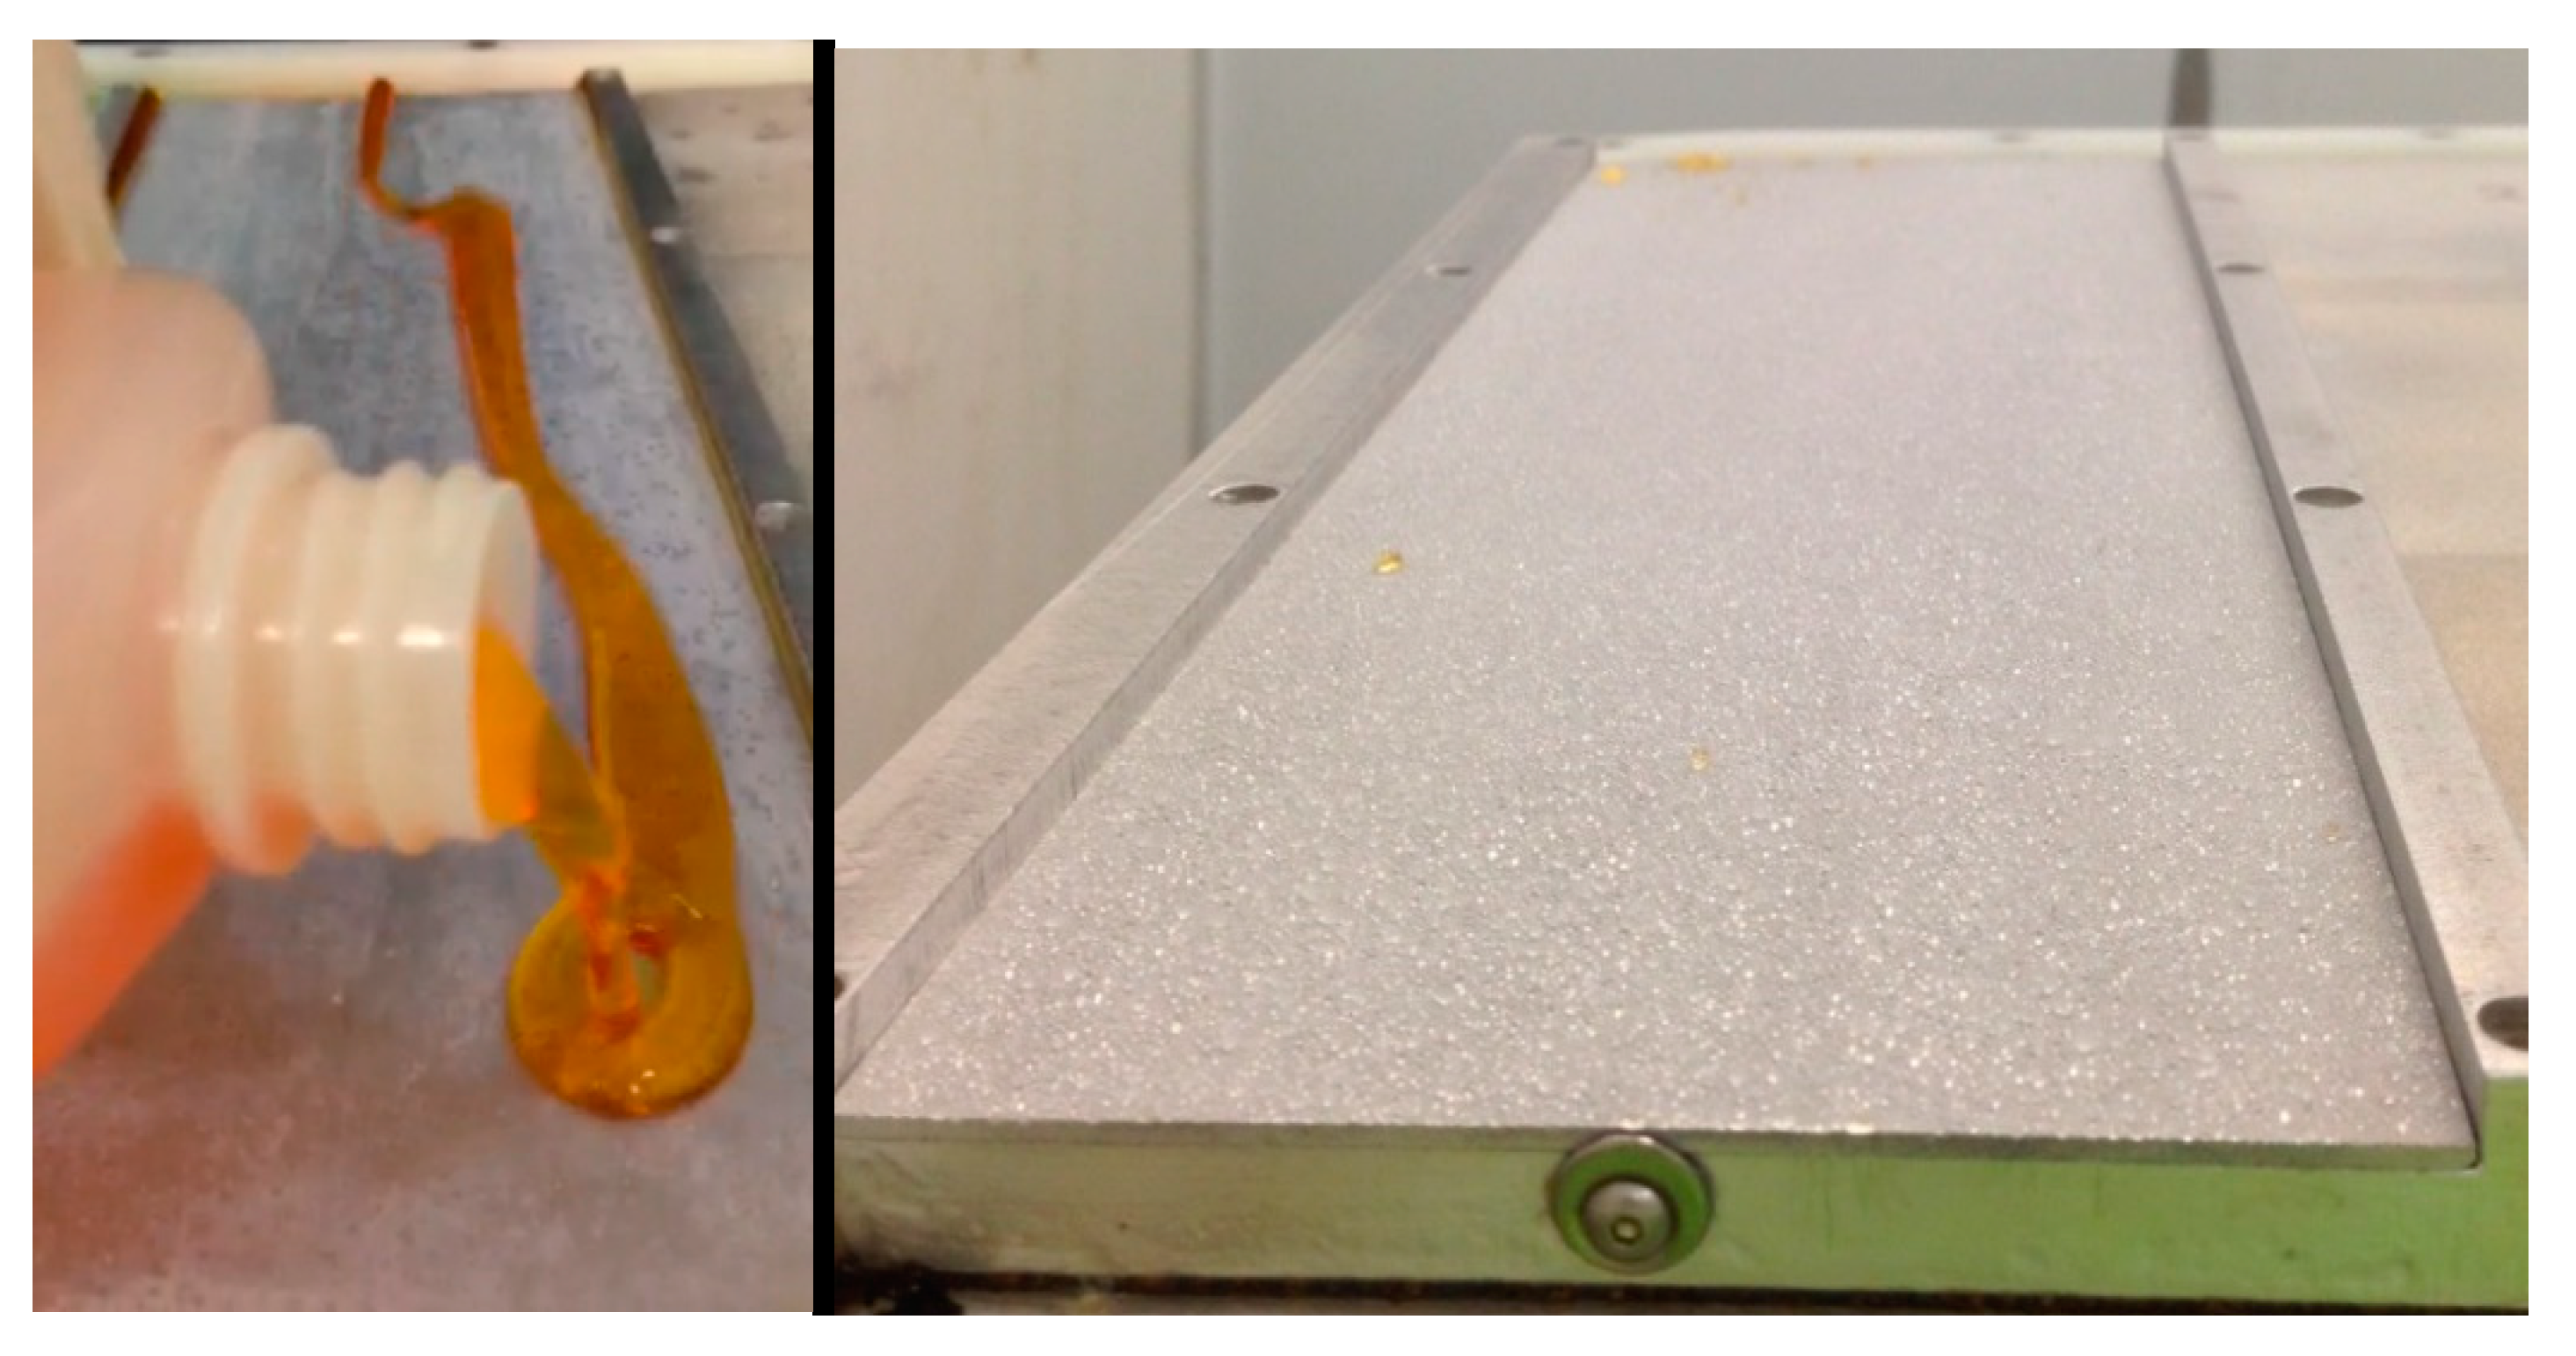
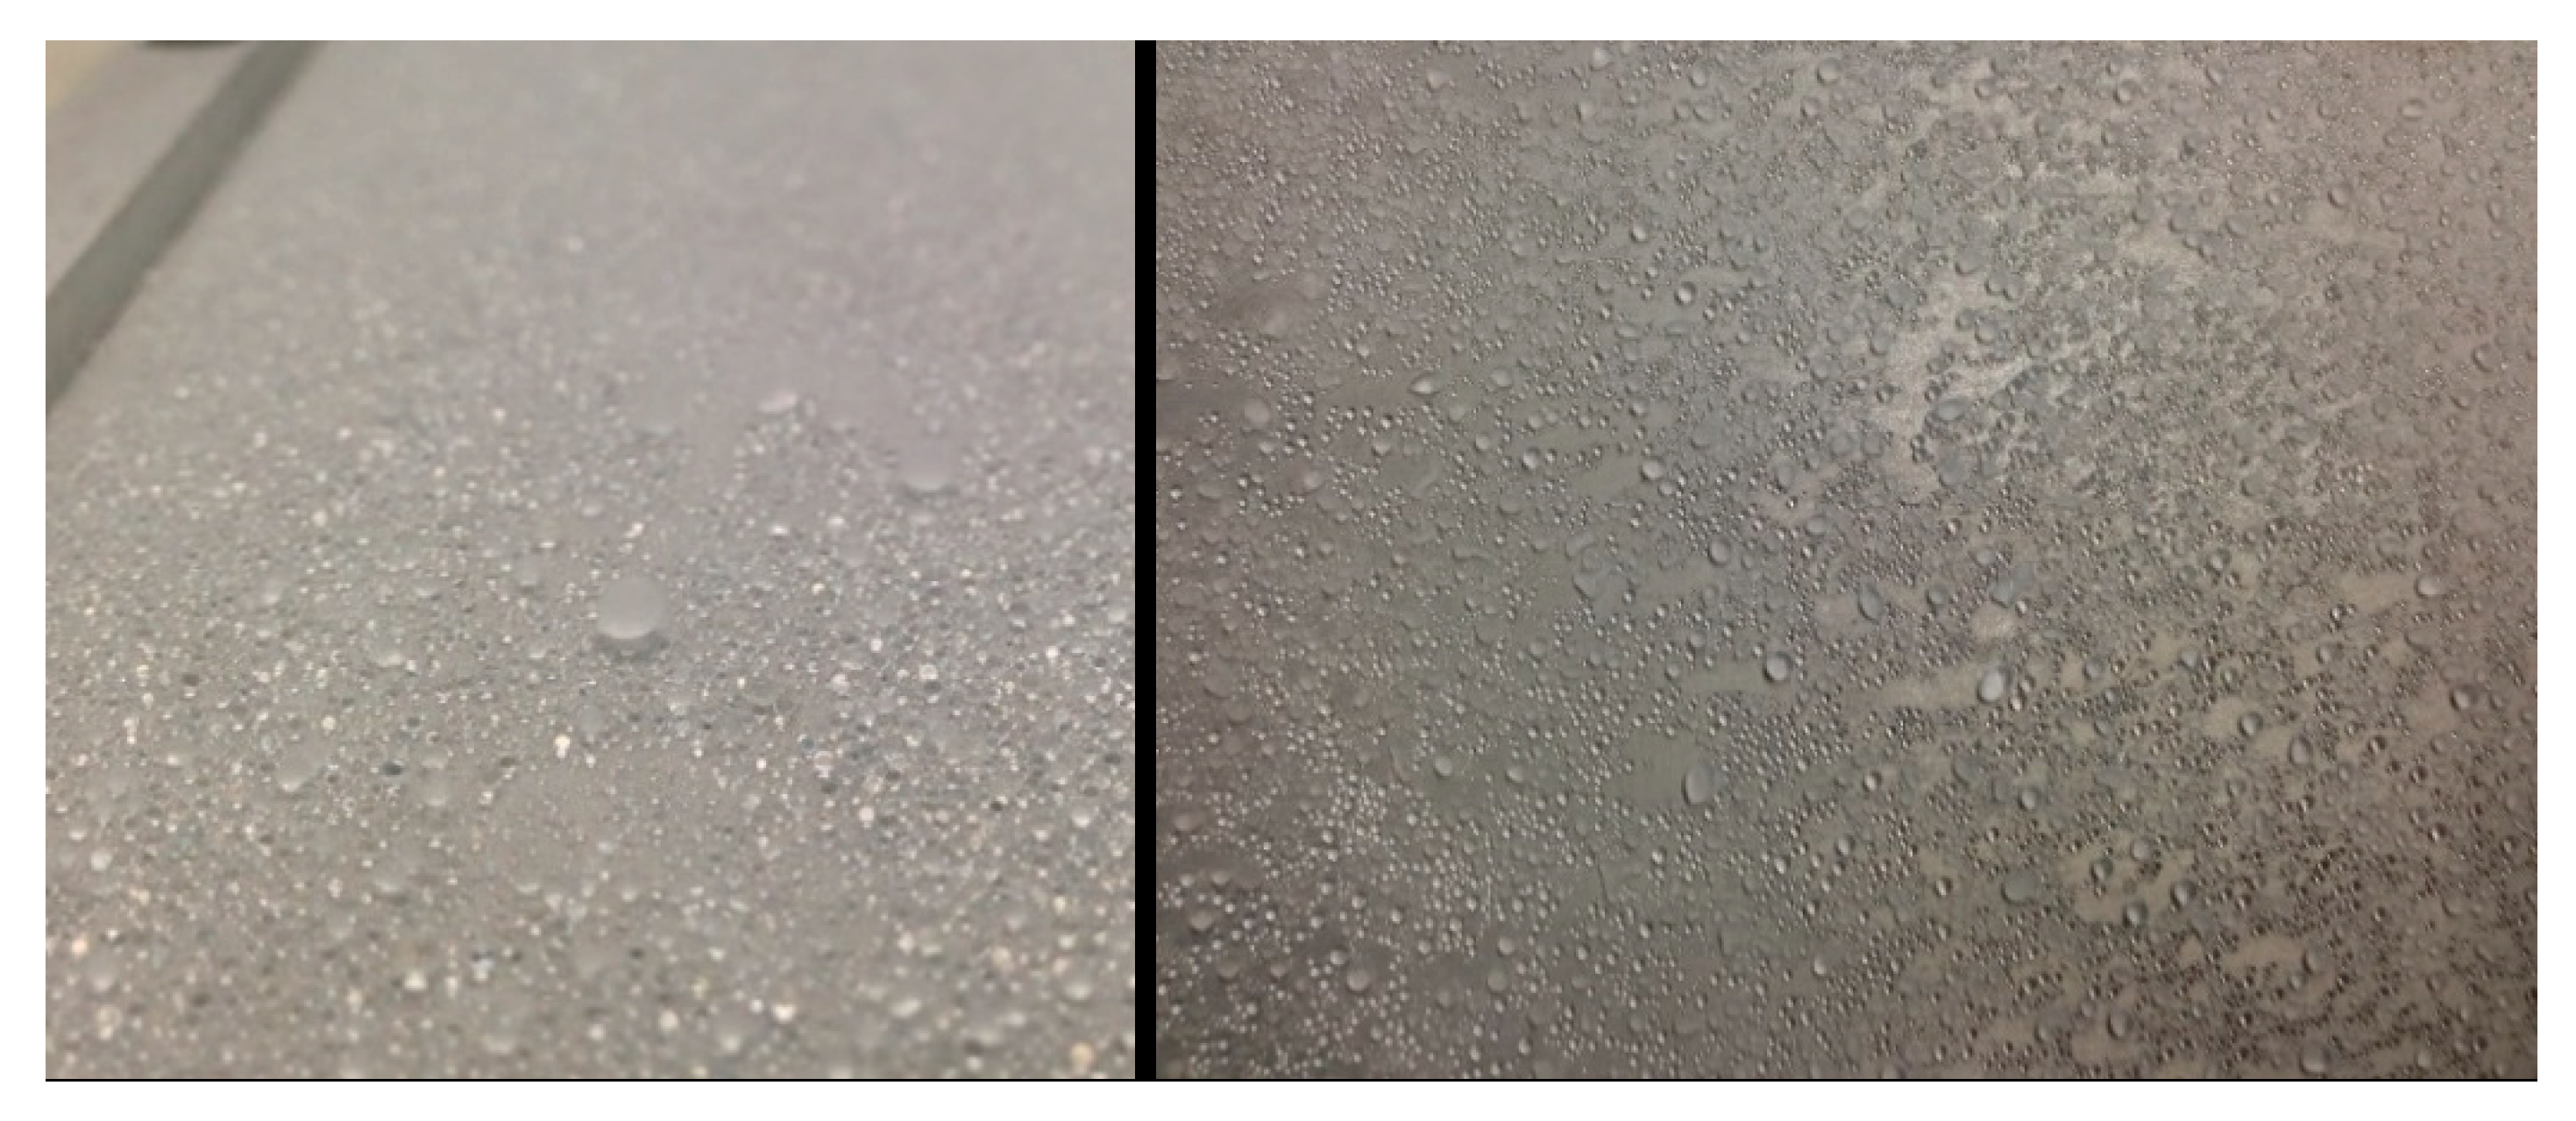
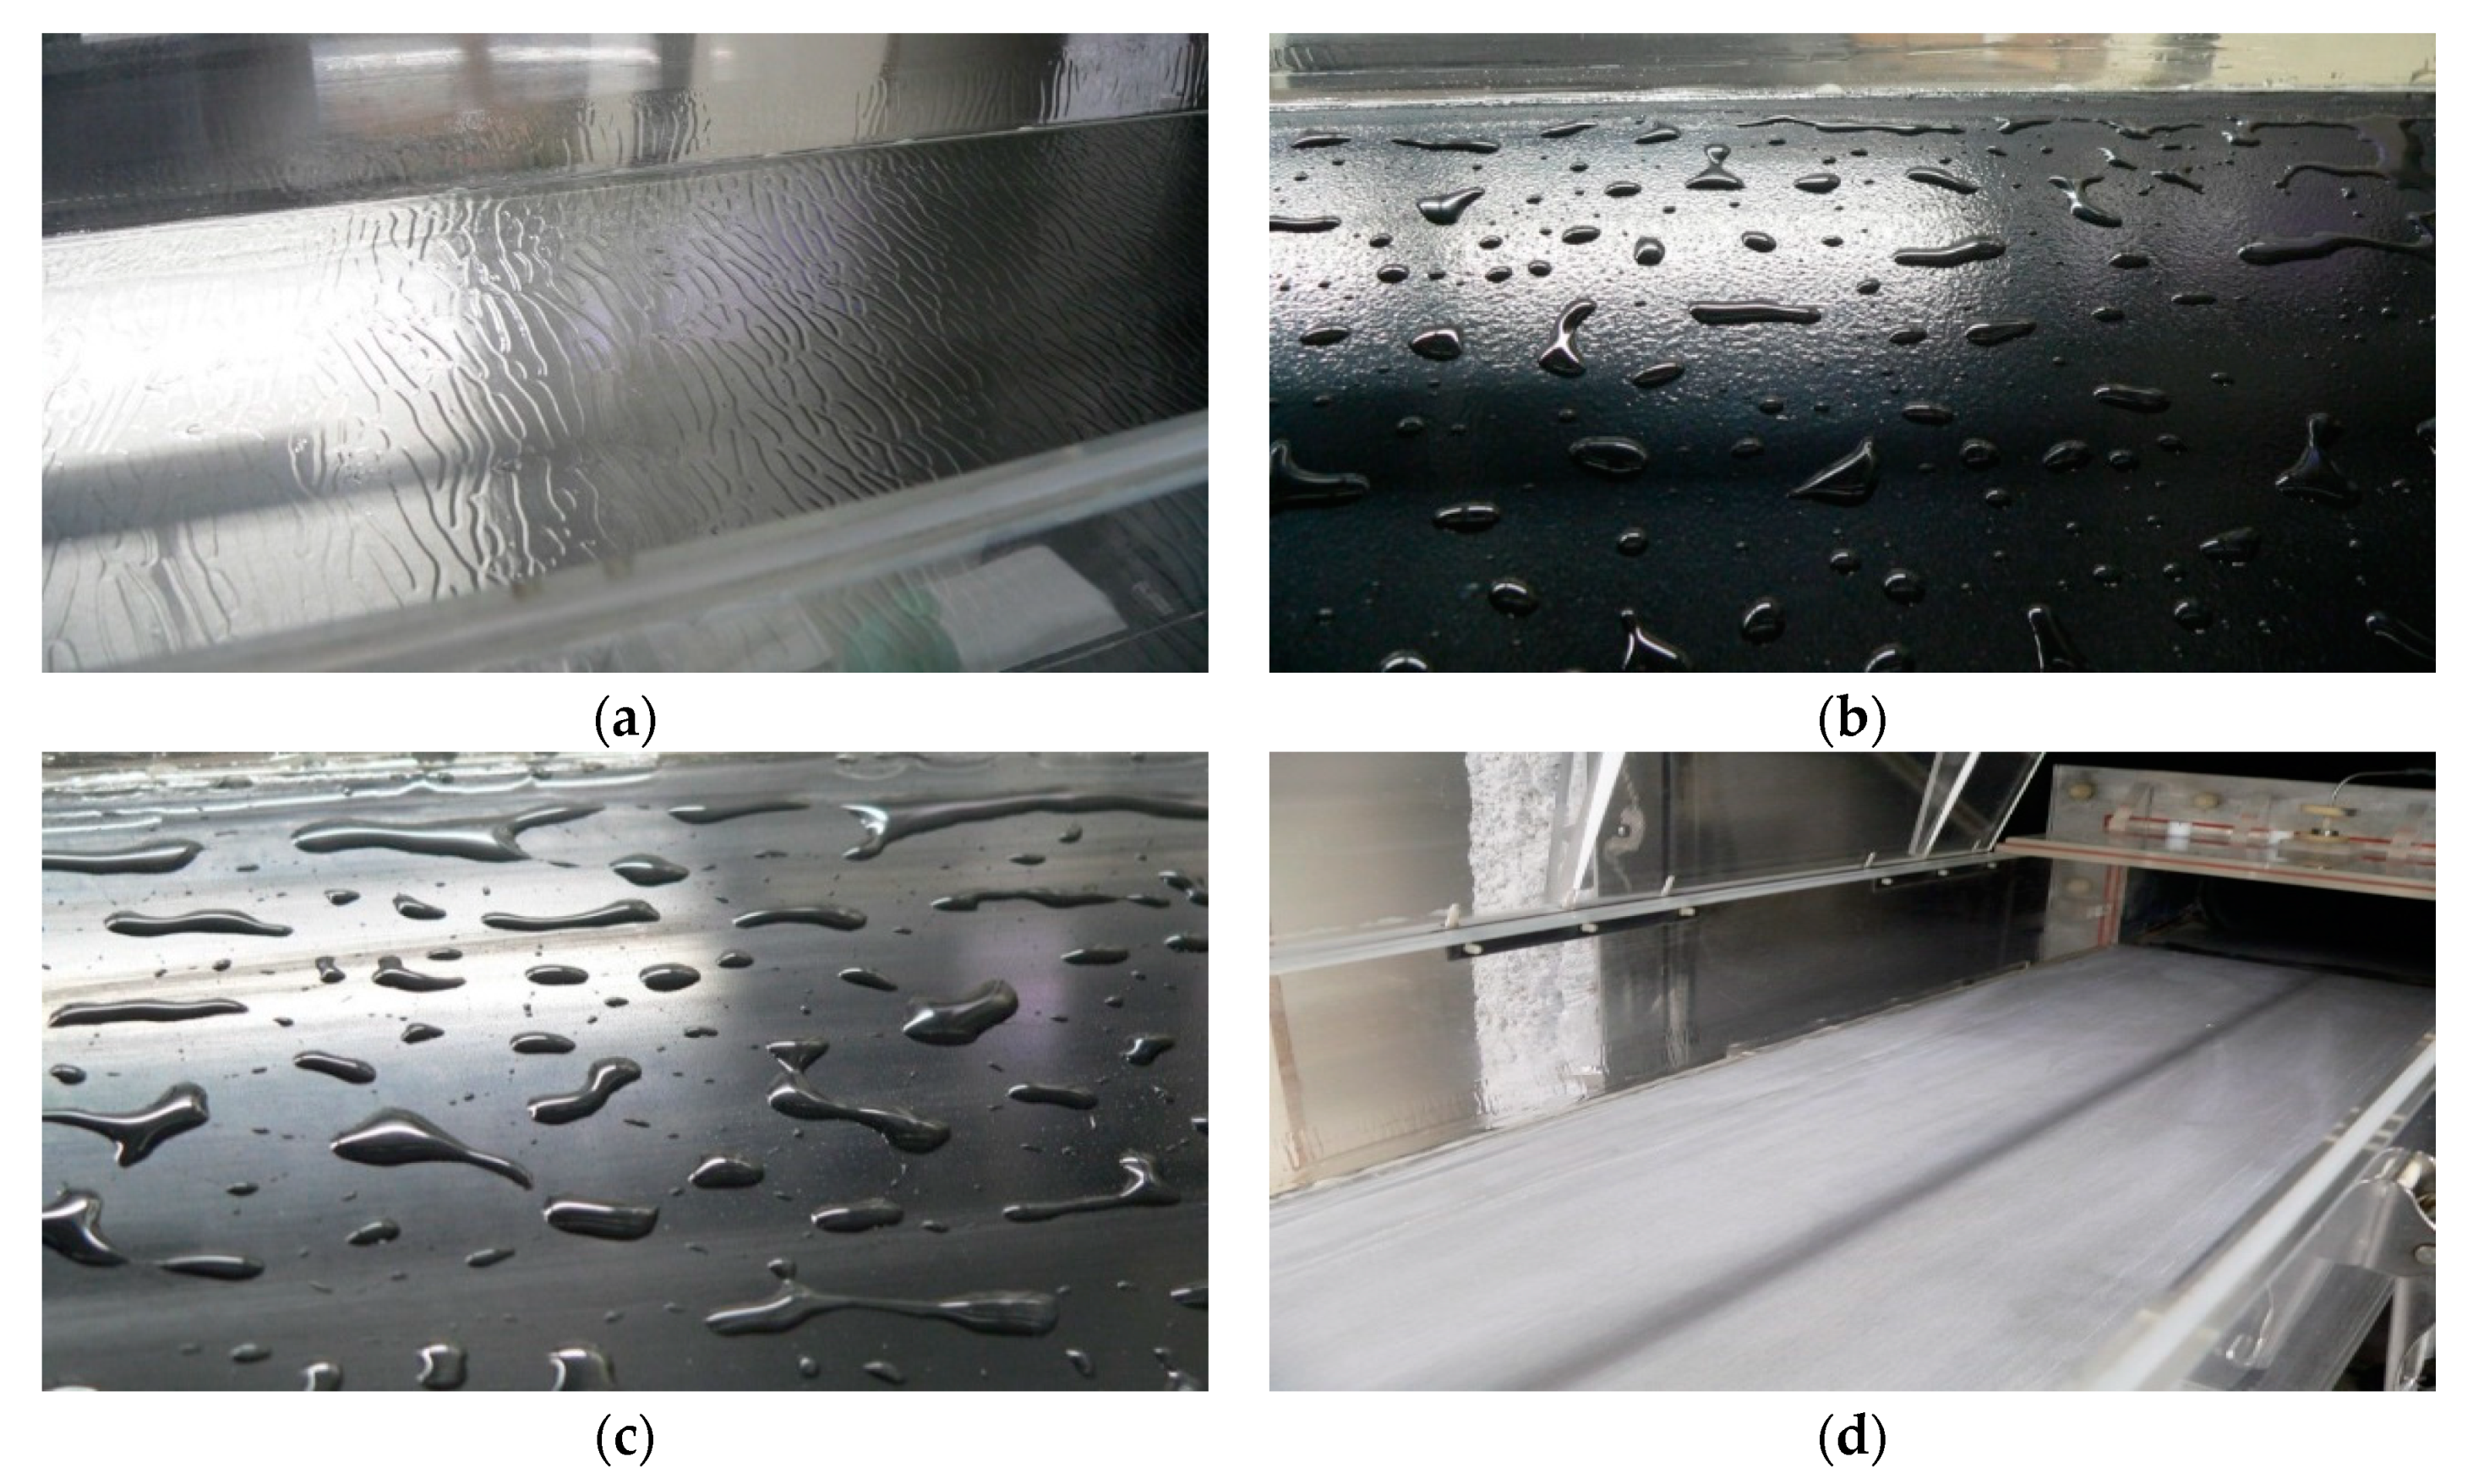
2.3. Water Spray Endurance Test (WSET)

The Water Spray Endurance Test (WSET) was performed as per the requirement of AS5901 [6]. The test was performed to determine the anti-icing endurance of SAE AMS1424 [8] and SAE AMS1428 [9] under controlled conditions inside a cold chamber. The fluids are poured onto 10° inclined aluminum test plates at a temperature of −5 °C, and submitted to a cooled water spray at an intensity of 5.0 g/dm2/h until fluid failure occurred (Figure 2). This failure occurs when ice formation reaches 25 mm from the top of the plate or after formation of slush on 10% of the plate surface. The time before fluid failure is then defined as the endurance time of the fluid.
For this study, the same aluminum WSET test panels were coated with the selected surface coatings in order to measure the effect of the coatings on the endurance time of the fluids. The coated panels are installed in the cold chamber in lieu of the standard aluminum plates and the endurance time of Fluid A and Fluid B (Table 1) were recorded.

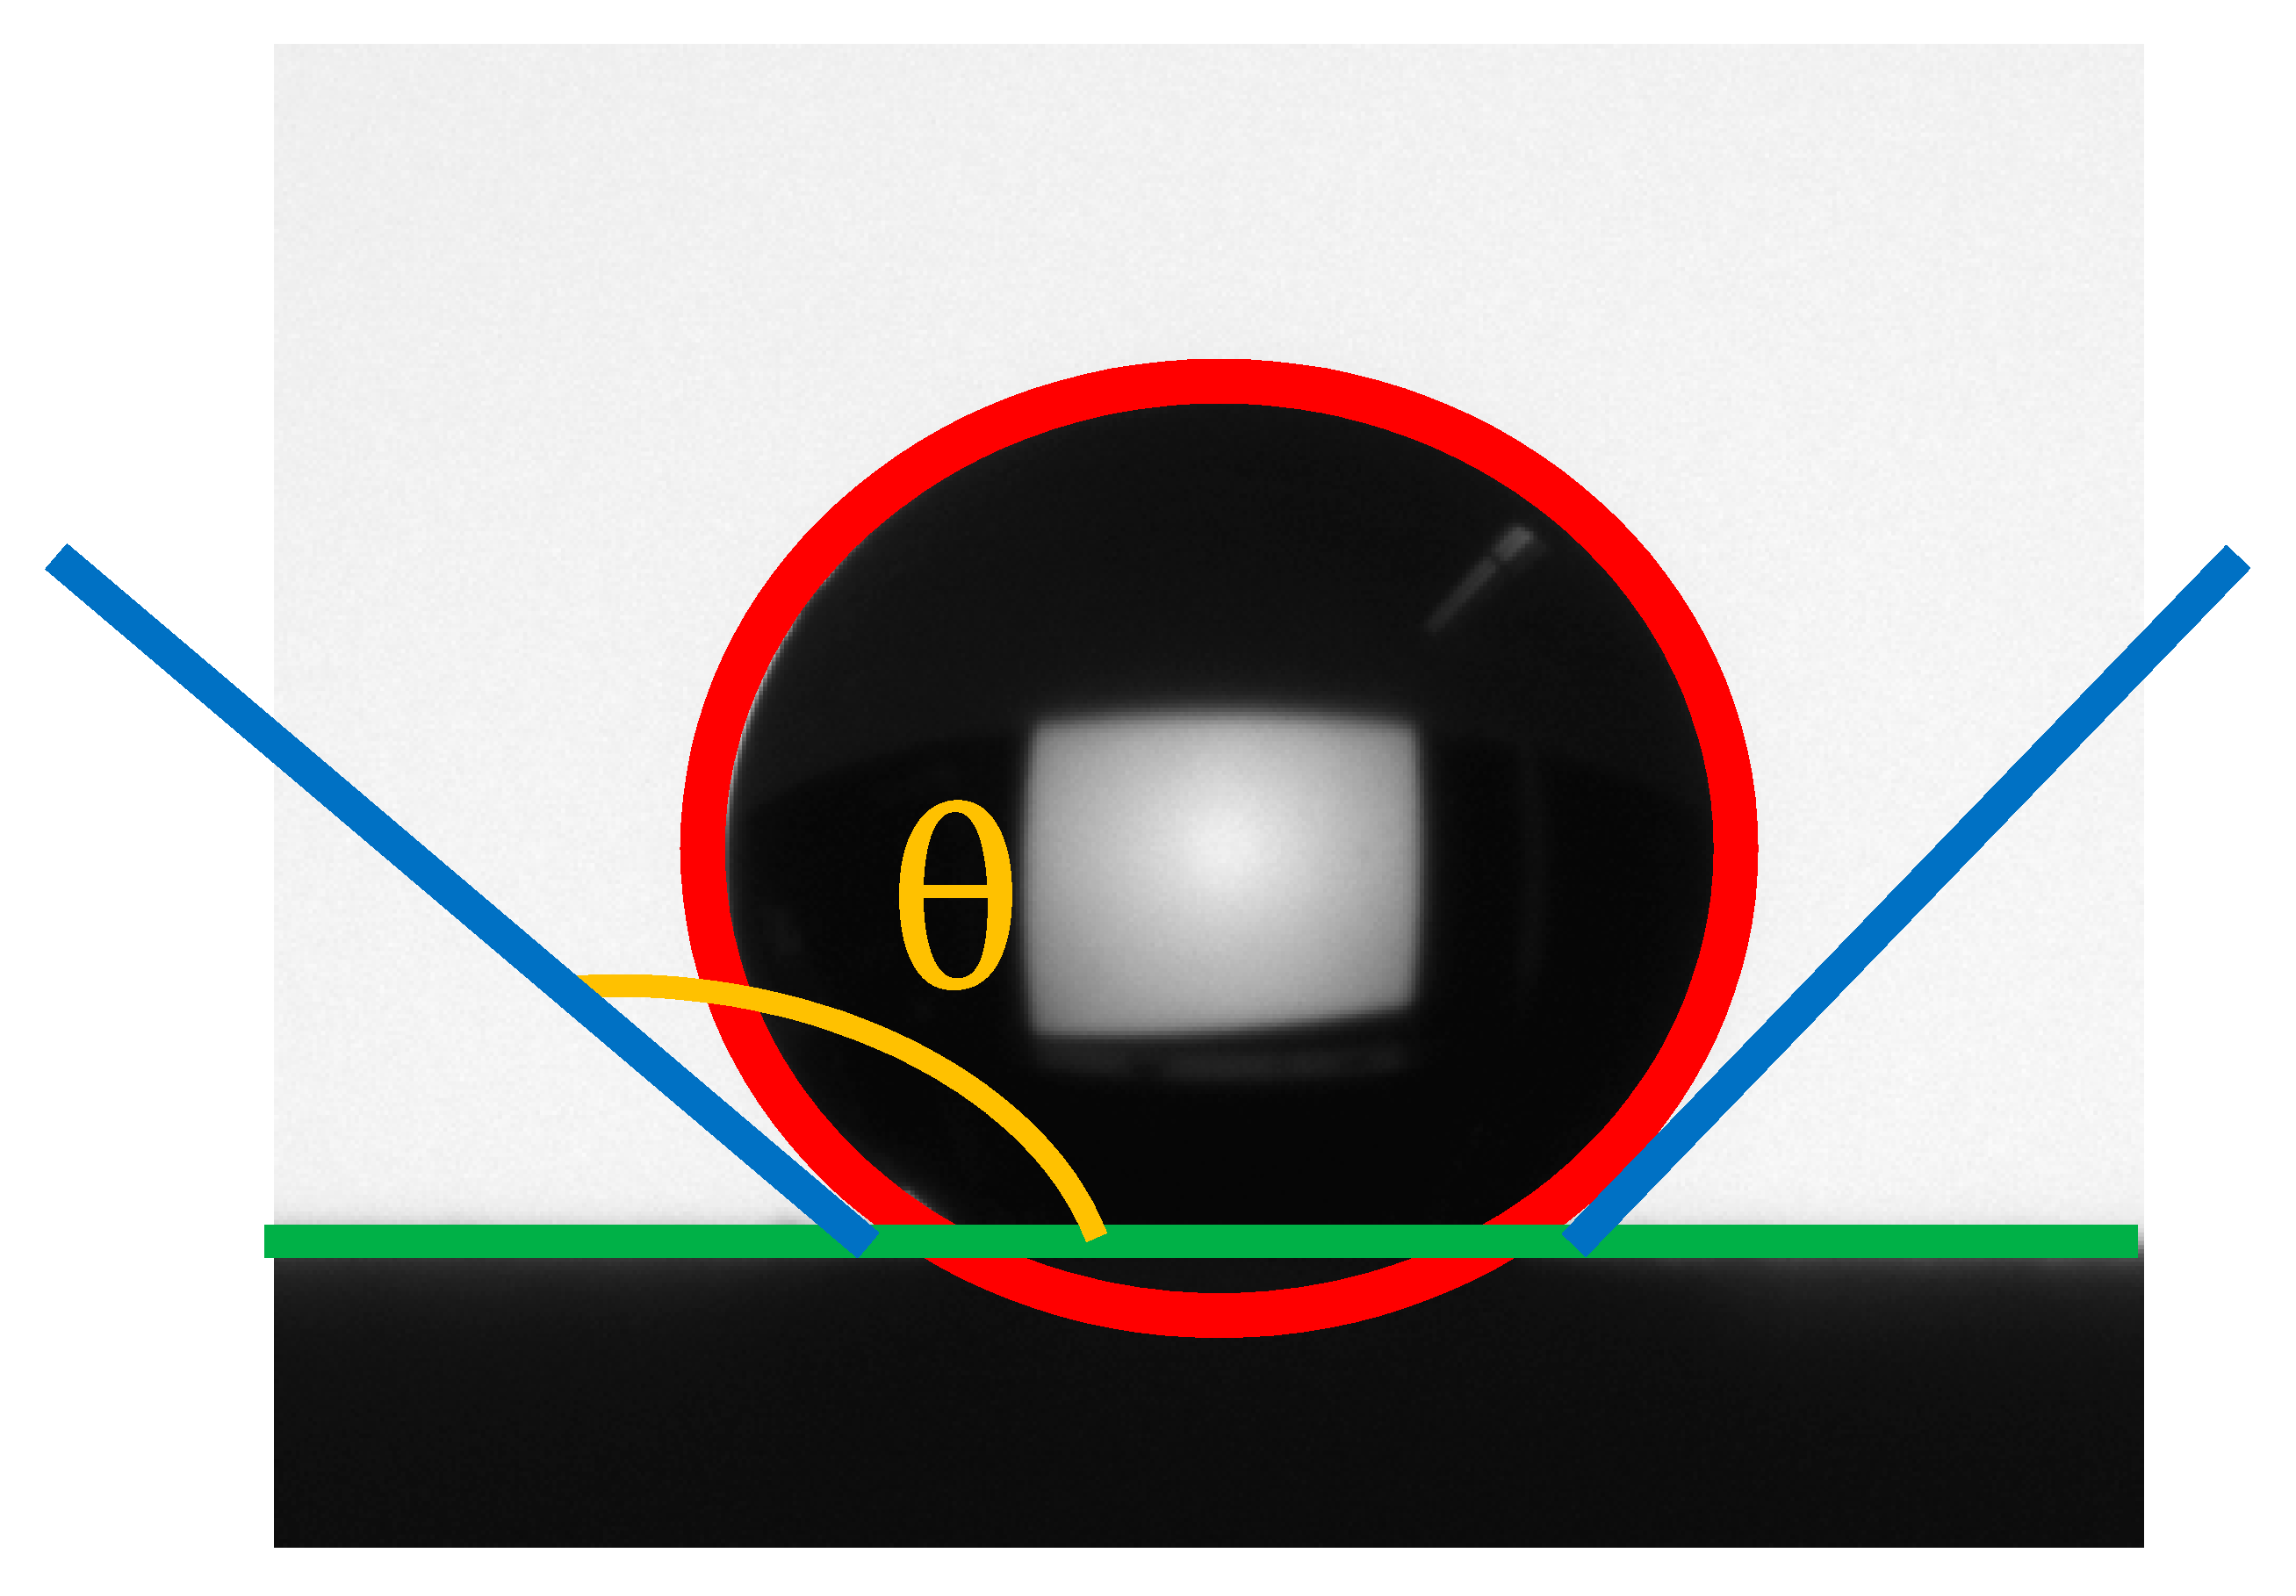
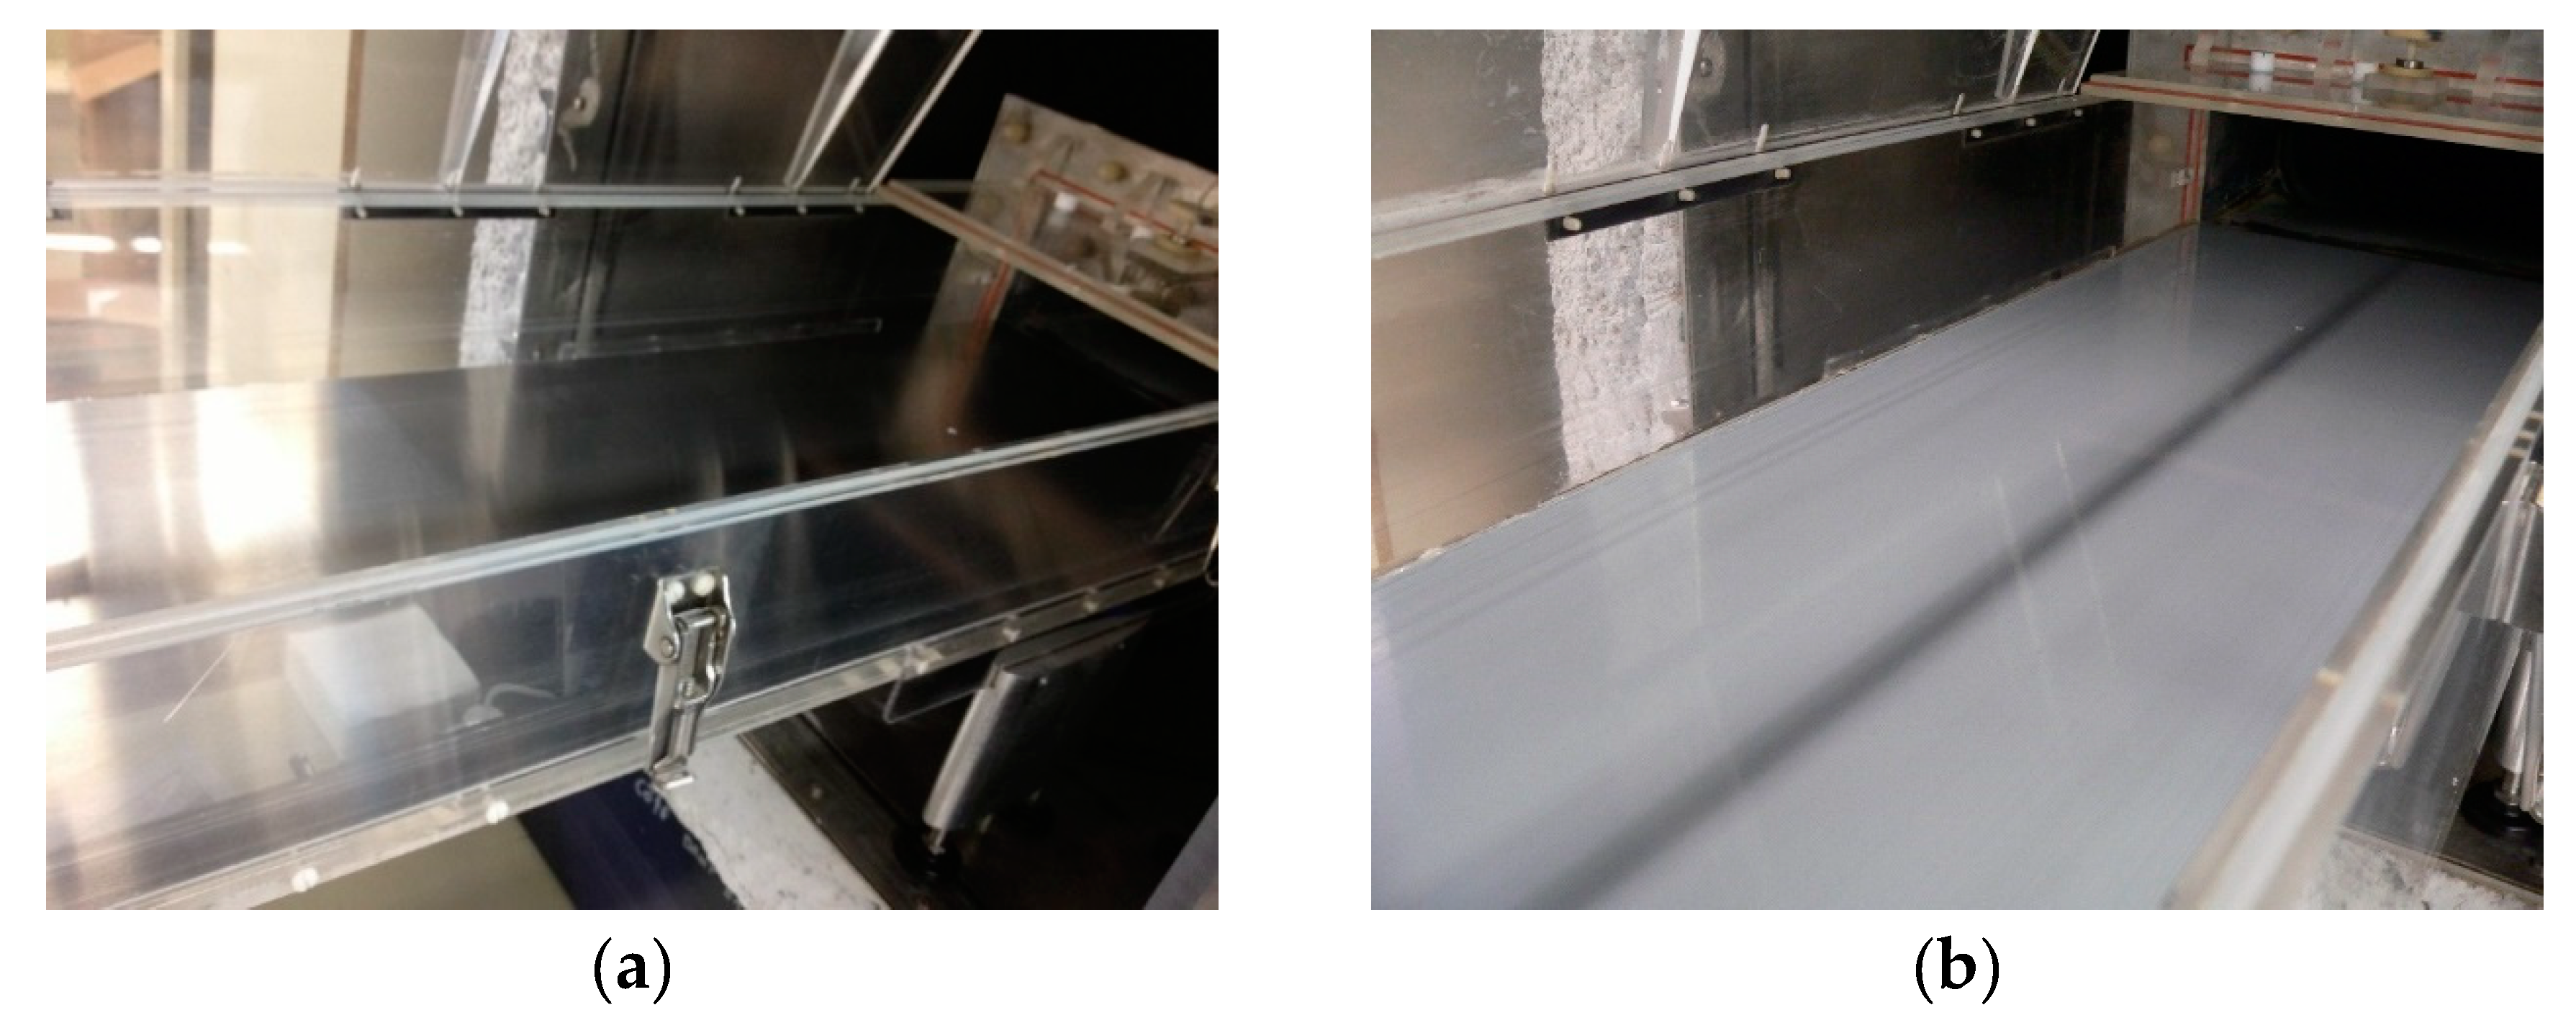
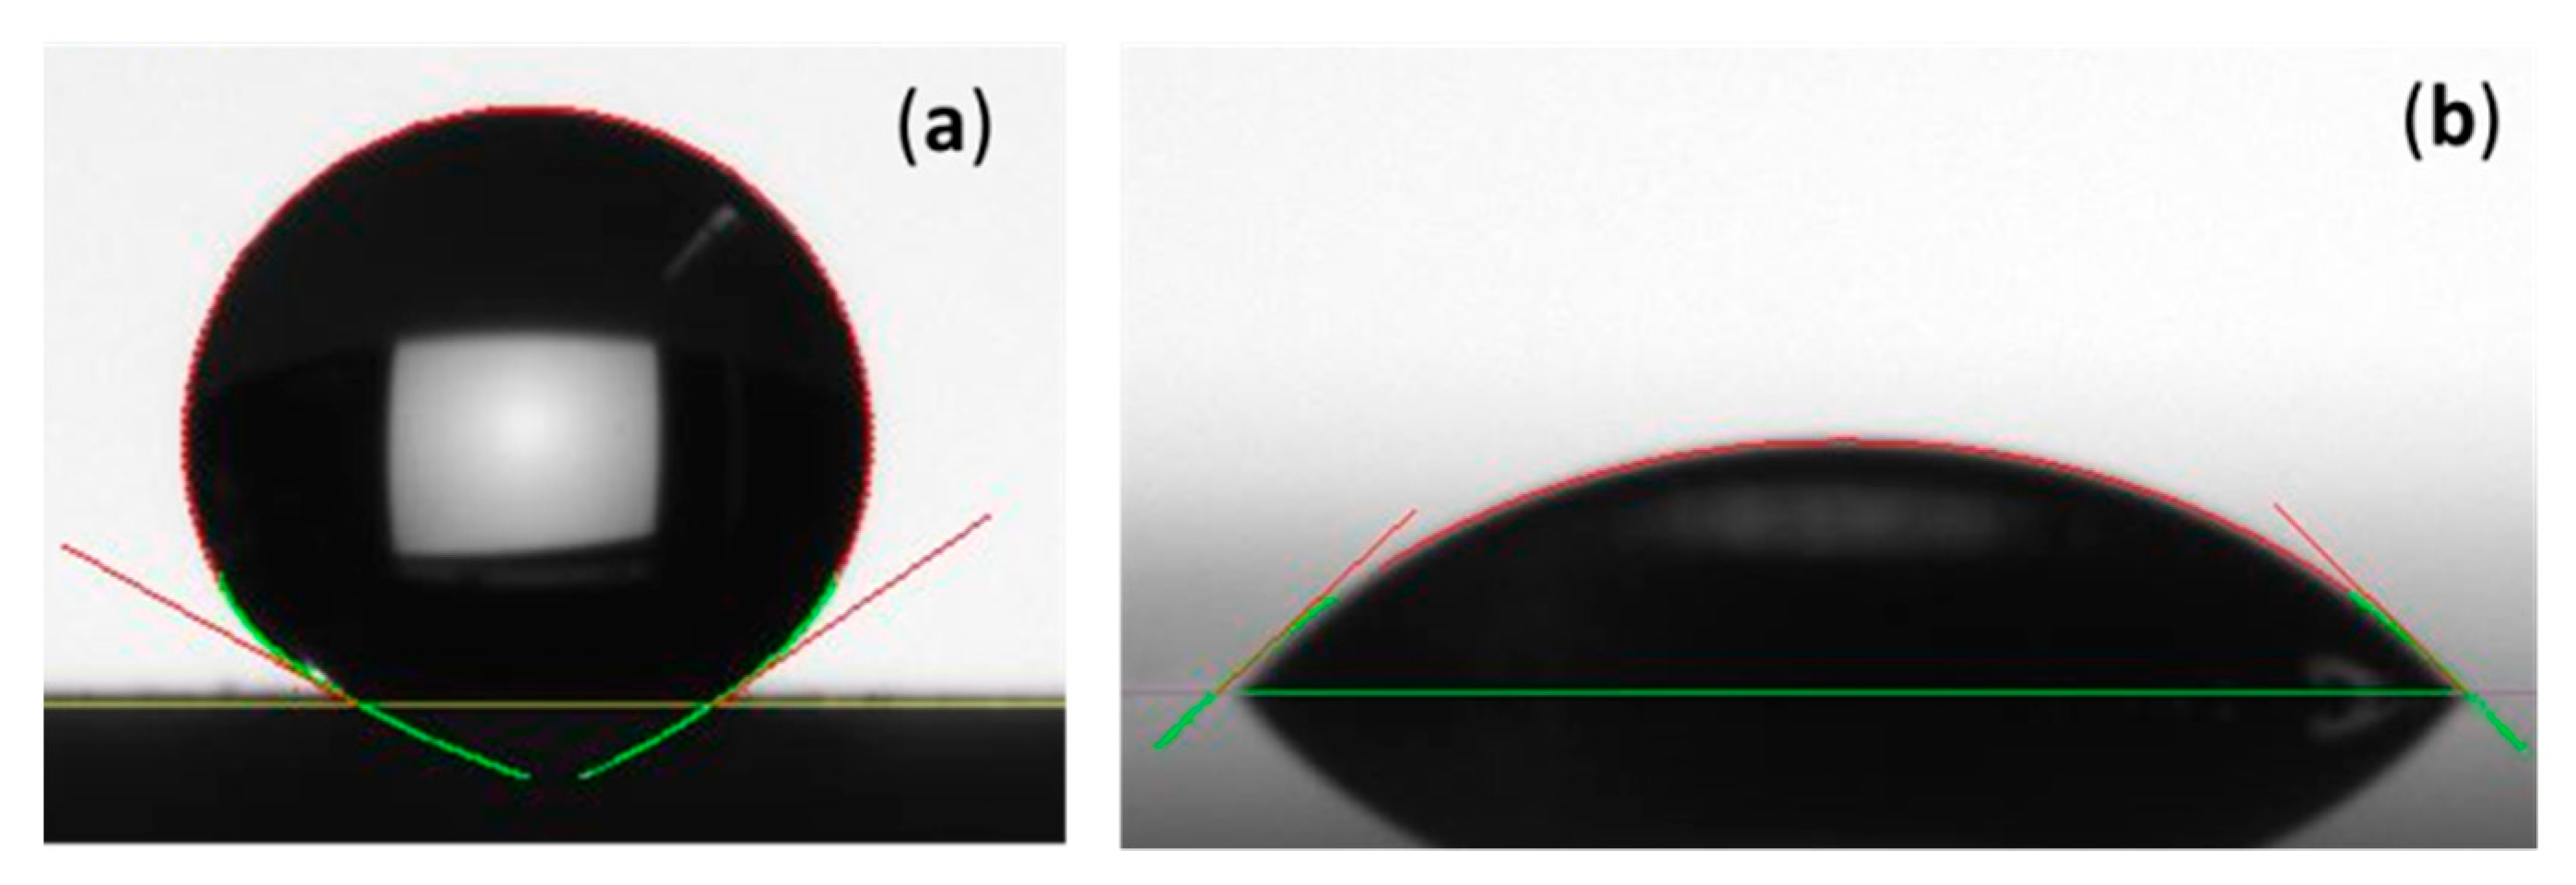
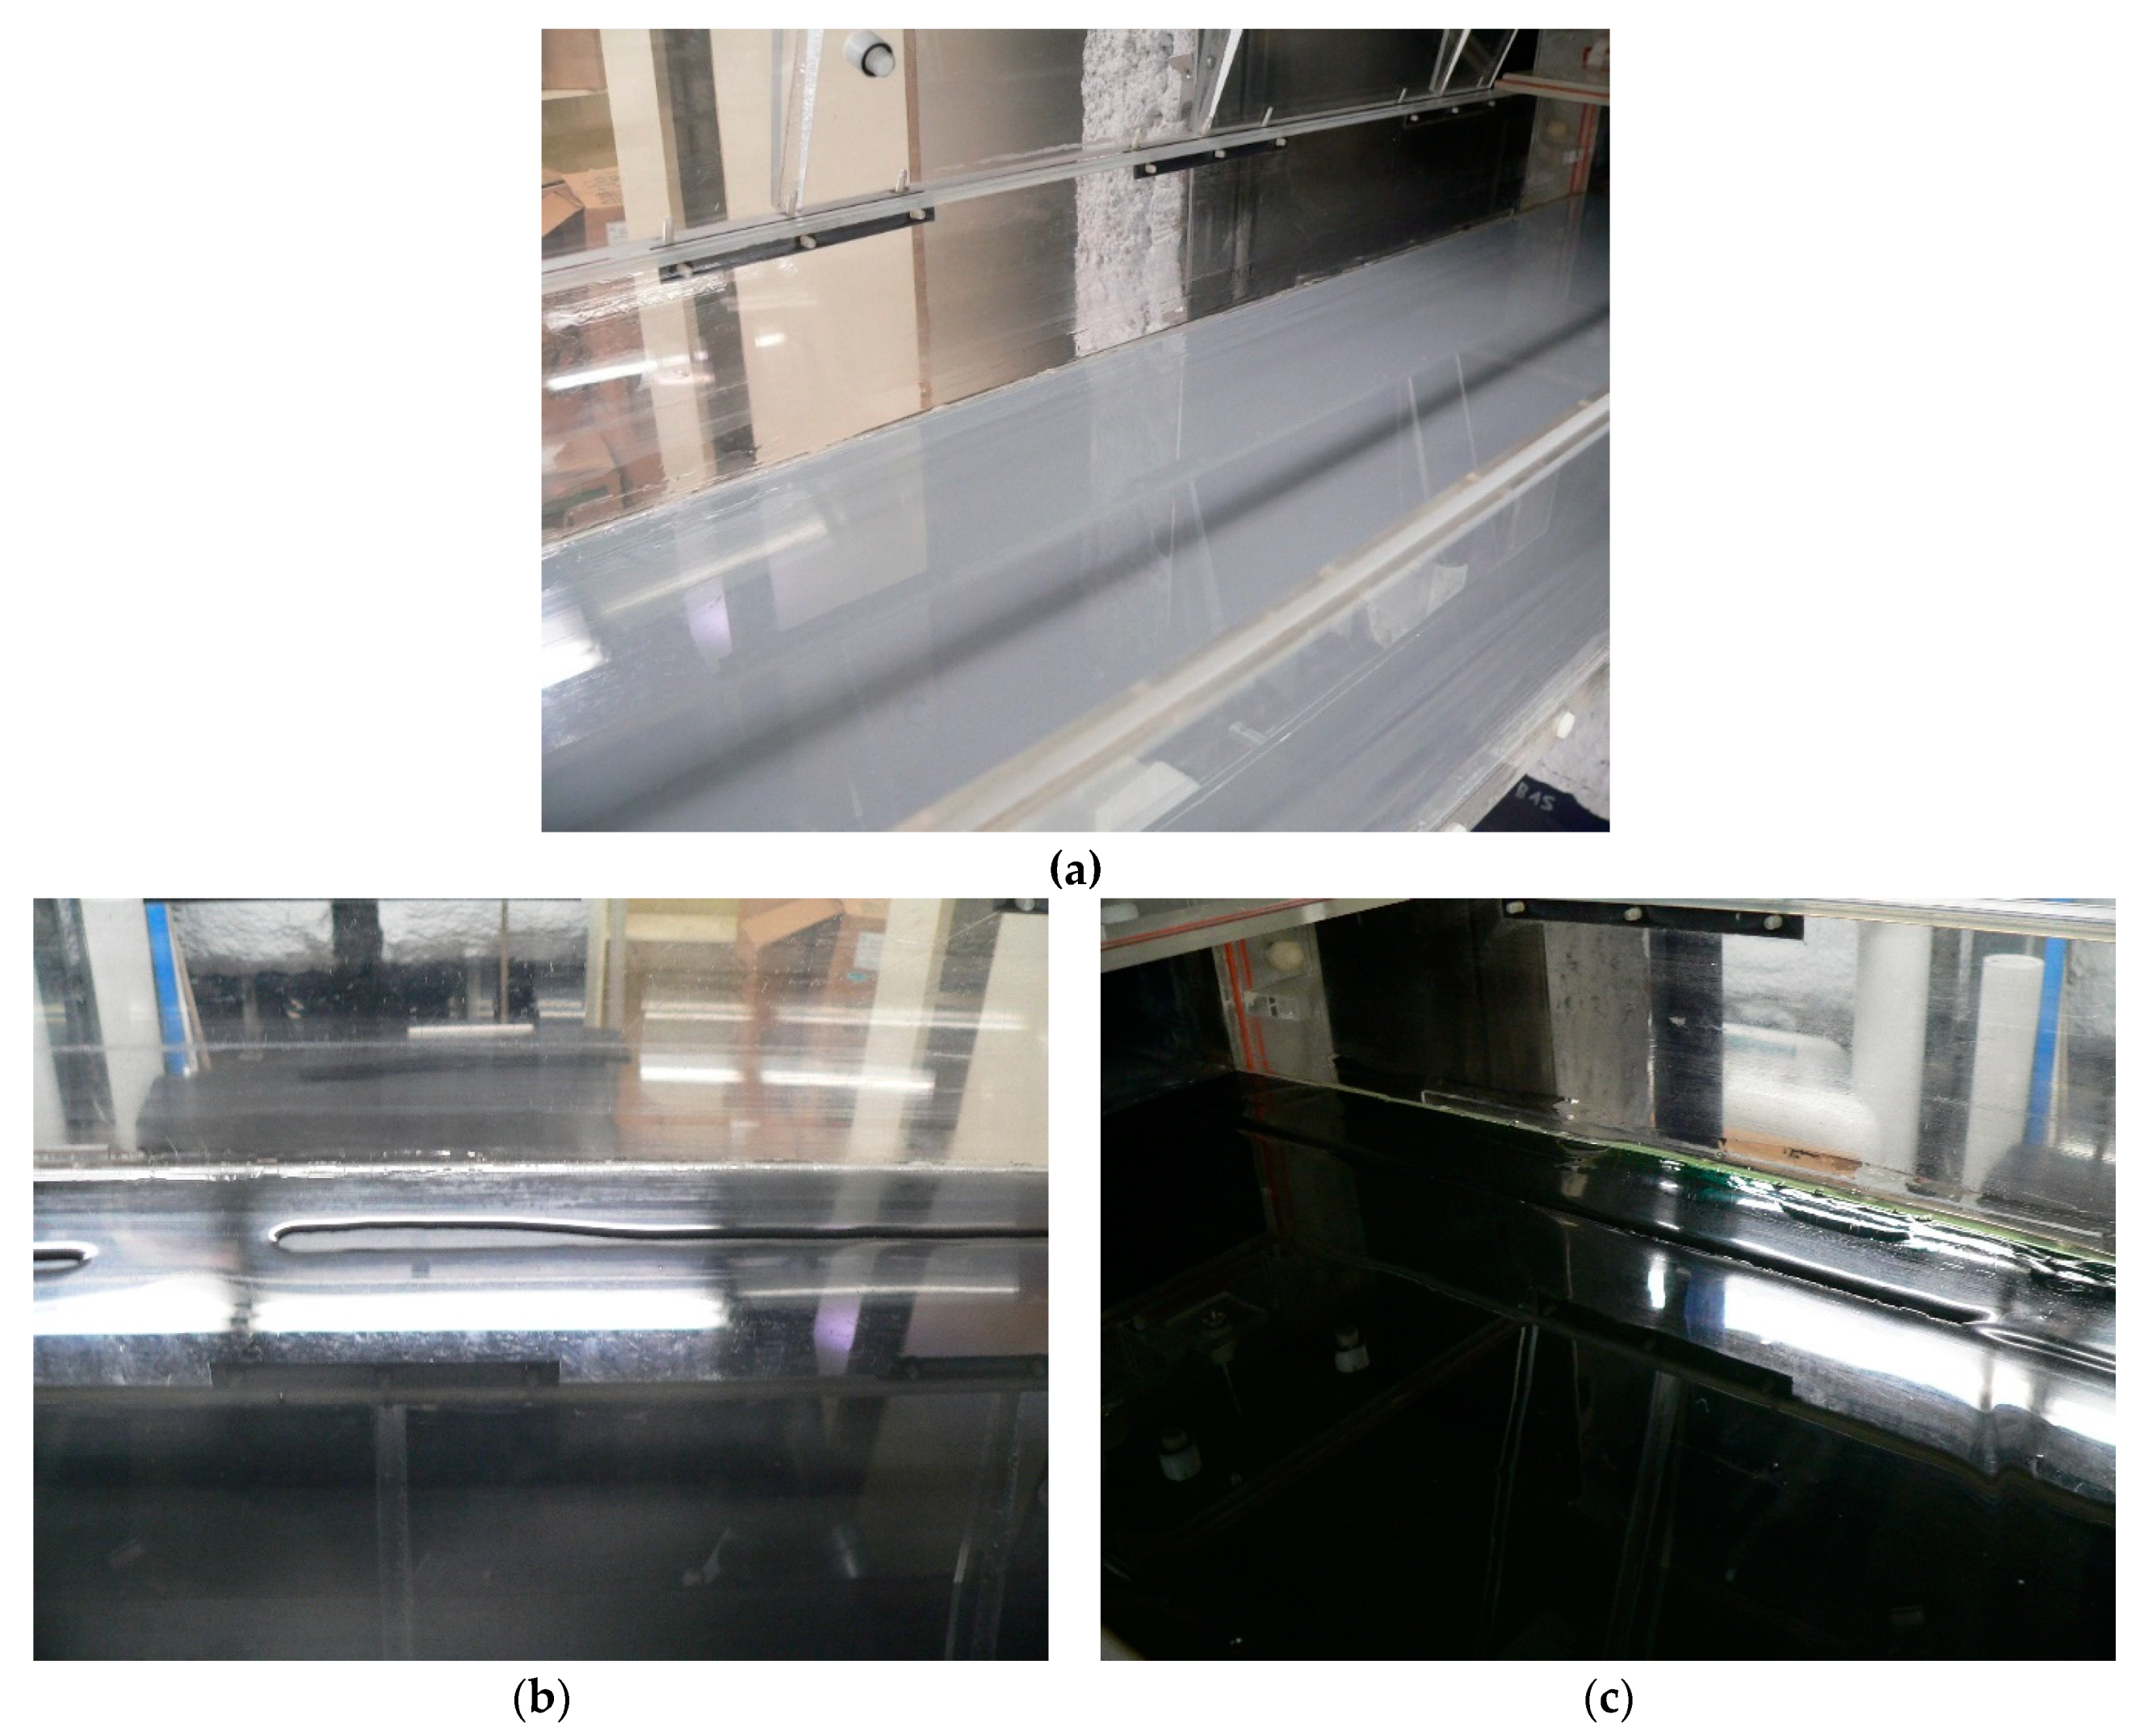
2.4. Aerodynamic Acceptance Test (AAT)

The Aerodynamic Acceptance Test (AAT) has been developed to establish a small-scale wind tunnel test to determine the aerodynamic acceptability of SAE AMS1424 and AMS1428 aircraft ground deicing/anti-icing fluids. Fluid flow-off behaviour is obtained by measuring the fluid effect on the boundary layer displacement thickness (BLDT) on a flat plate. This value can be correlated to lift loss measured on an aircraft and the results obtained are compared to an acceptance criterion, which has been correlated with in-flight data to correspond to a 5.24% lift loss at V2 during takeoff.
The AAT is run following the High Speed Ramp test procedure detailed in SAE AS5900 standard document. The test is performed in a refrigerated wind tunnel. One liter of pre-cooled fluid is poured on the Plexiglas floor of a test duct installed in the test section of the tunnel (Figure 3), resulting in a 2 mm thick fluid film. An acceleration of 2.6 m/s2 is generated in the duct for 25 s up to a final velocity of 65 m/s. This velocity is maintained and the boundary layer displacement thickness (BLDT) is measured in the duct during the 27th to 33rd seconds of the test, and the test is stopped after a total of 60 s from the beginning of acceleration. BLDT measurements are performed with three pressure probes, one positioned before the convergent of the wind tunnel, the second one at the entrance of the test duct, and the last one at the end of the test duct. The pressure differences between the measured pressures are used to calculate the average BLDT over the test duct perimeter ( δ a v e * ) at the location of the third pressure probe with Equation (1), obtained from the application of mass conservation and Bernoulli equations.
δ a v e * = 1 c [ S 3 S 2 ( P 1 P 2 ) ( P 1 P 2 ) + ( P 2 P 3 ) ]
with c being the duct perimeter at the third pressure probe, S2 the area at second pressure probe, S3 the area at third pressure probe, while P1, P2, and P3 are the pressures measured by probe 1, 2, and 3, respectively.
After the test, the remaining fluid thickness was measured at three different positions on the duct floor to determine the average final fluid thickness. The fluid thickness measurements were performed with an Elcometer 112AL punched wet film combs (Warren, MI, USA) within 5 min of the end of the test at the centerline at 1400 mm ± 10 mm from the front edge of the plate, on the centerline at 750 mm ± 10 mm from the front edge of the plate, and at 750 mm ± 10 mm from leading edge of the plate at 2.5 mm ± 0.5 mm from the inside wall of the duct. The test was repeated at different temperatures until the fluid BLDT reached the acceptance limit. The test was also performed dry, without fluid, to obtain the BLDT values of the Plexiglas surface. For more information on the test procedure, please refer to SAE AS5900 standard [7].
For this study, aluminum plates on which the coatings have been applied were installed firmly on the test duct floor (Figure 4). The fluids were then applied directly on the coated aluminum plates before the test started. The duct dimensions have been adjusted in the calculations to include the presence of the coated plates. Tests on a bare aluminum plate were also performed to assess the effect of the plates on the test results.
Dry tests are performed on all the surfaces to measure their aerodynamic effect. For the tests with fluids, the Ref. Fluid and Fluid B were tested (Table 1).

3. Results

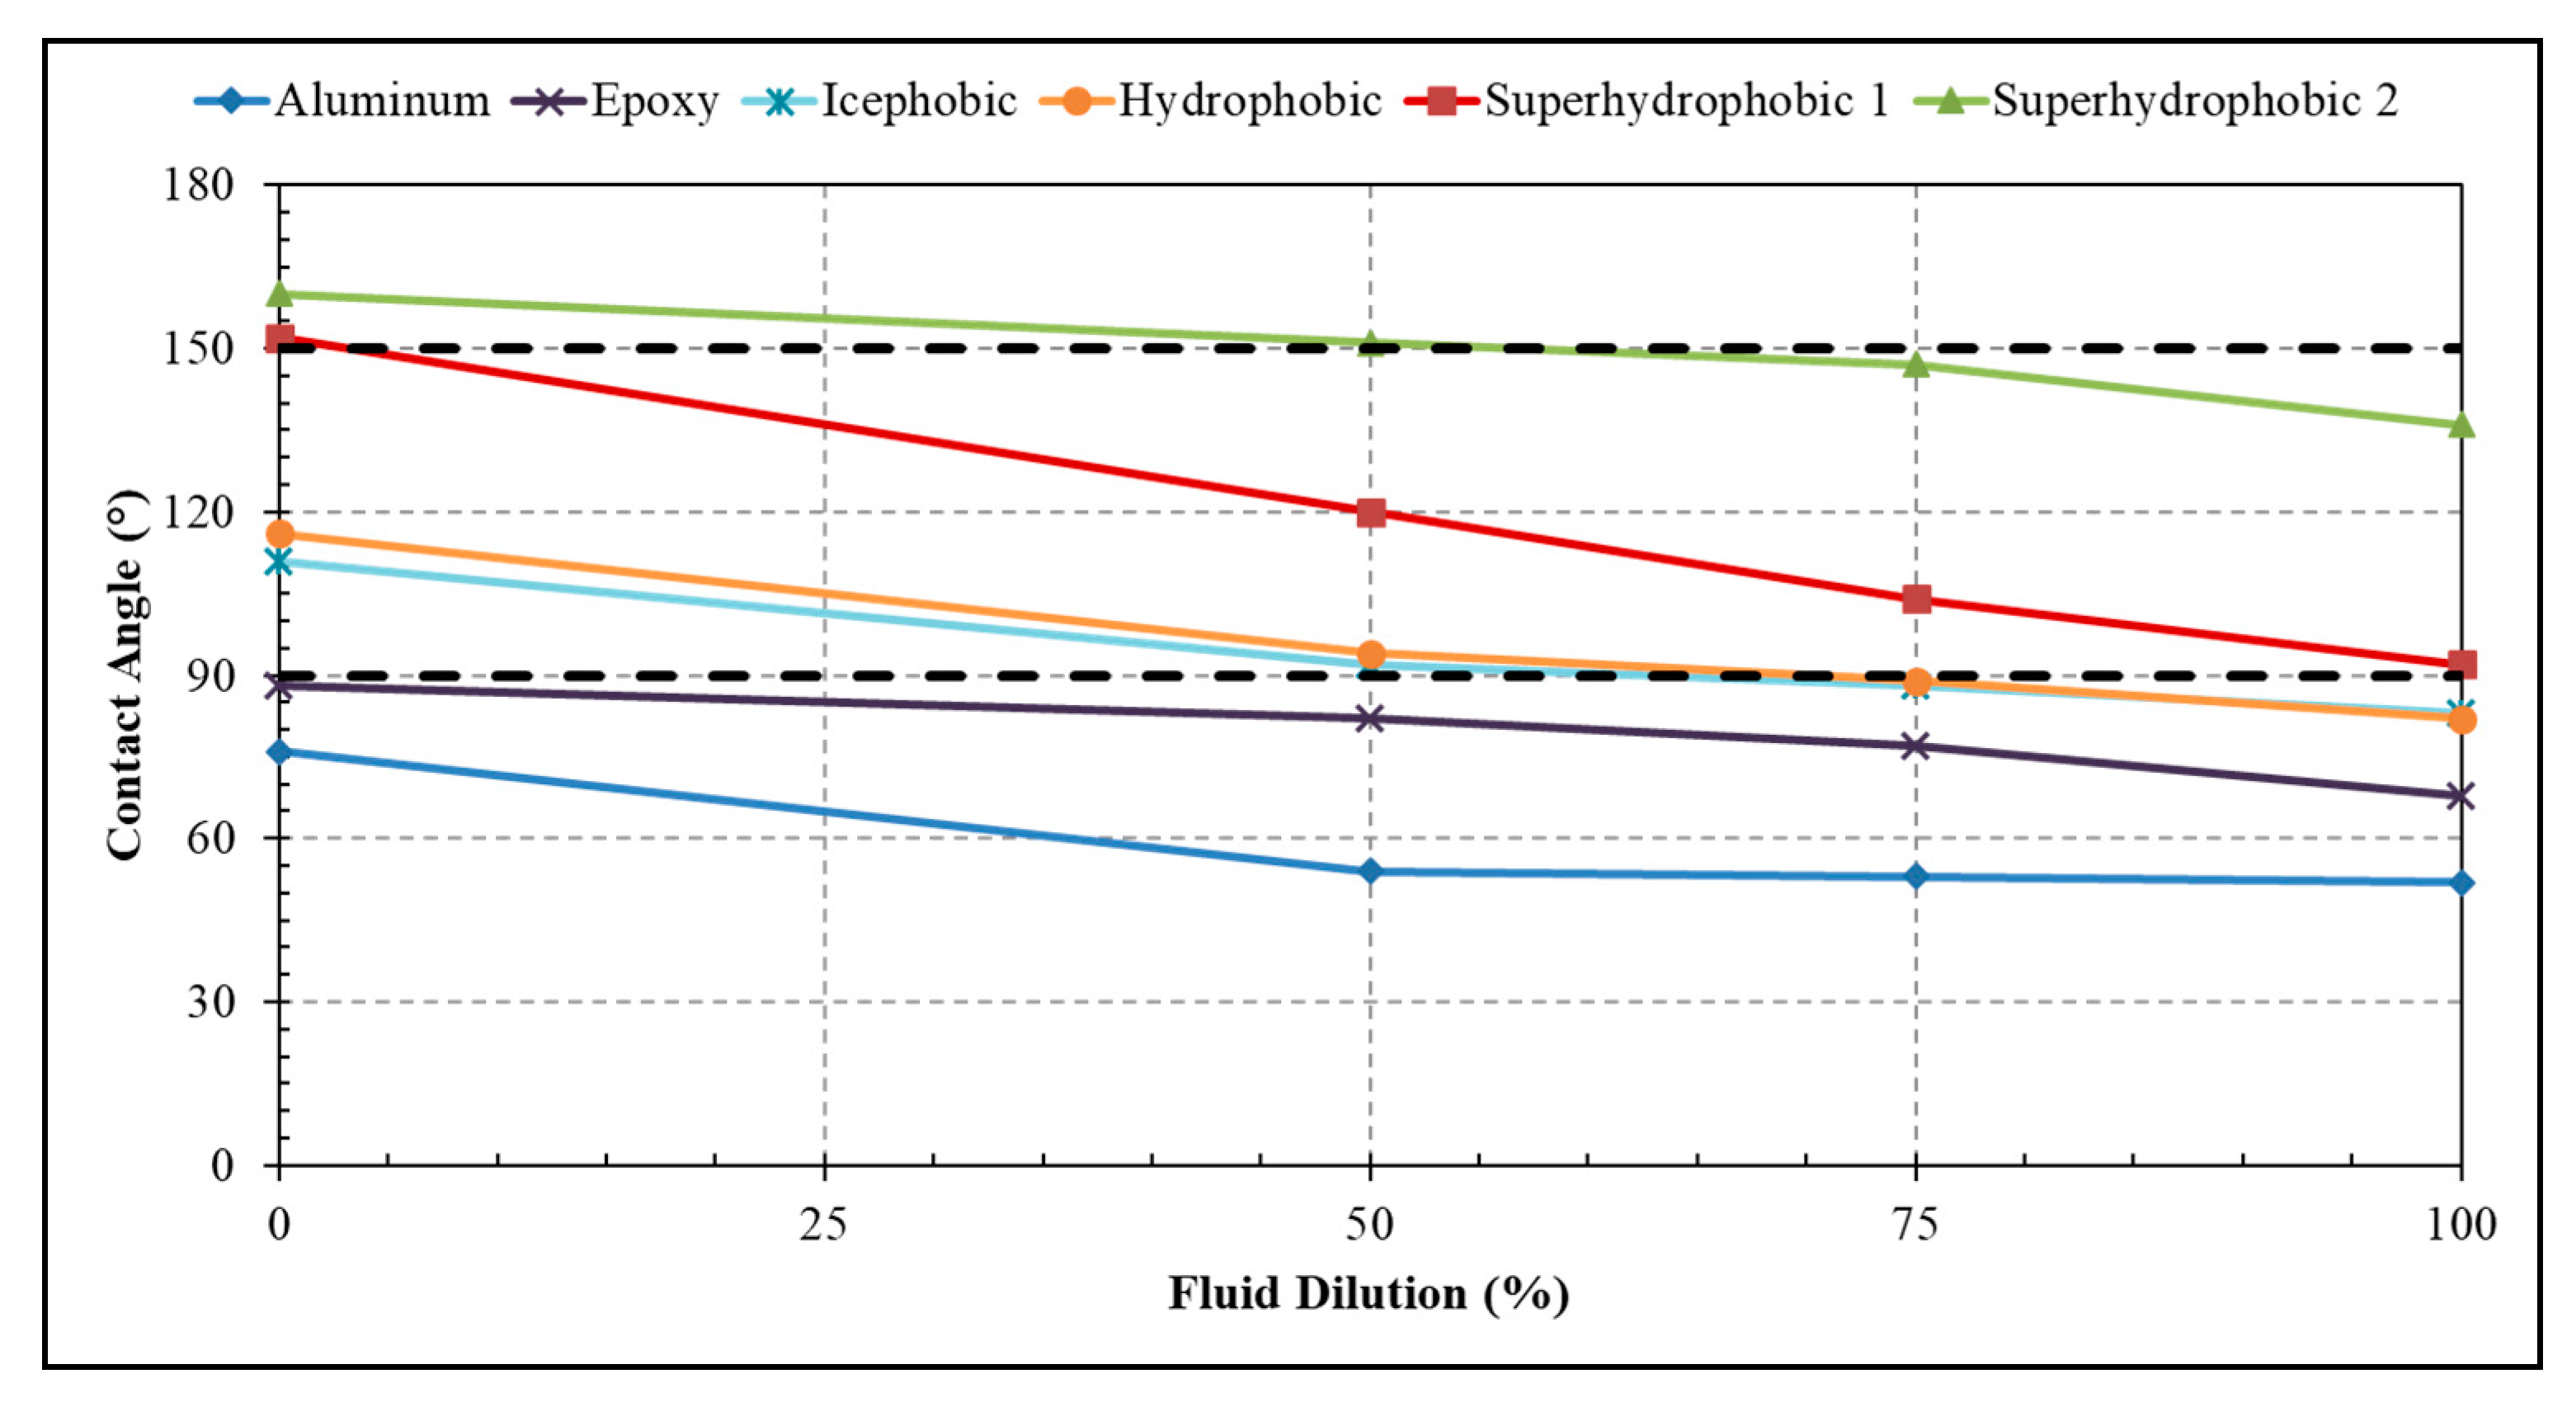
3.1. Coatings Characteristics

All the coatings have been applied following the manufacturers prescription on prewashed Al-6061T6 aluminum panels. The coatings were selected primarily for their facility of application, using a spray gun, over medium to large scale substrates. All the coatings are recognized to reduce the ice adhesion due to previous studies conducted at The Anti-icing Materials International Laboratory (AMIL) [3,10,11,12,13,14].
The average roughness and contact angle between water and the surface coatings are presented in Table 3. The four specialized coatings have an increased surface roughness compared to the aluminum and epoxy surfaces. This could result in aerodynamic penalties if applied on an aircraft. For a surface to be hydrophobic, its contact angle with water needs to be higher than 90°. The icephobic coating is considered hydrophobic as its contact angle is 111°. The epoxy surface also shows some weak hydrophobicity with a 92° contact angle, barely above the minimum value of 90°. For superhydrophobicity, a contact angle above 150° is required. Both superhydrophobic coatings respect this criterion with contact angles of 152° and 160°, which are much higher than all other surfaces.
The deicing and anti-icing fluids are mainly composed of water, glycols and additives. Anti-icing fluids are also composed of surfactants. The contact angle between droplets of fluid and the different surfaces is measured with droplets of the Ref. Fluid and Fluid B. Figure 5 presents the contact angle of the Ref. Fluid with each surface as a function of its dilutions, while Figure 6 presents the same results for Fluid B. For all contact angle measurements, the error in measurement was below ±3° from five measurements performed at random locations on the surface. At 0%, the results corresponded to the contact angle with water while at 100% the result was for a droplet of neat fluid. Figure 5 and Figure 6 show that the contact angle greatly diminishes with higher fluid concentrations. For both fluids, even when the fluid is neat, the contact angles are higher for all surfaces than for bare aluminum. The contact angle is higher for the Ref. Fluid than for the anti-icing fluid (Fluid B). On aluminum, Fluid B shows an important decrease in contact angle from 75% dilution to neat. Superhydrophobic 1 shows a sharp and important decrease with concentration increase for both fluids, with a contact angle close to the hydrophobic coating at neat concentration, while Superhydrophobic 2 shows a very small decrease for both fluids with contact angle of 136° for neat (undiluted) Ref. Fluid and 134° for neat Fluid B compared to 160° with water. Other than Superhydrophobic 2, all surfaces fall below or very close to the hydrophobic limit of 90° for both fluids neat. A comparison of the contact angle of a water droplet on Superhydrophobic 2 with a droplet of neat Ref. Fluid on aluminum is shown in Figure 7. These decreases in contact angle corresponded to an increase of the surface tension of the fluid.
The results obtained for the contact angle measurements for Ref. Fluid and Fluid B showed that the angle diminished as the concentration of fluid increased for all the surfaces tested. This implies that the coatings could have a greater impact on the performances of a fluid when used in its diluted forms. For all the surfaces, beside Superhydrophobic 2, the contact angle of the neat fluids was below or very close to 90°. For Superhydrophobic 2, the contact angle stays above 130° for both fluids, even when neat. Even if the contact angle diminishes with the fluid concentration, all surfaces still increase the contact angle with diluted and neat fluids as compared to aluminum.

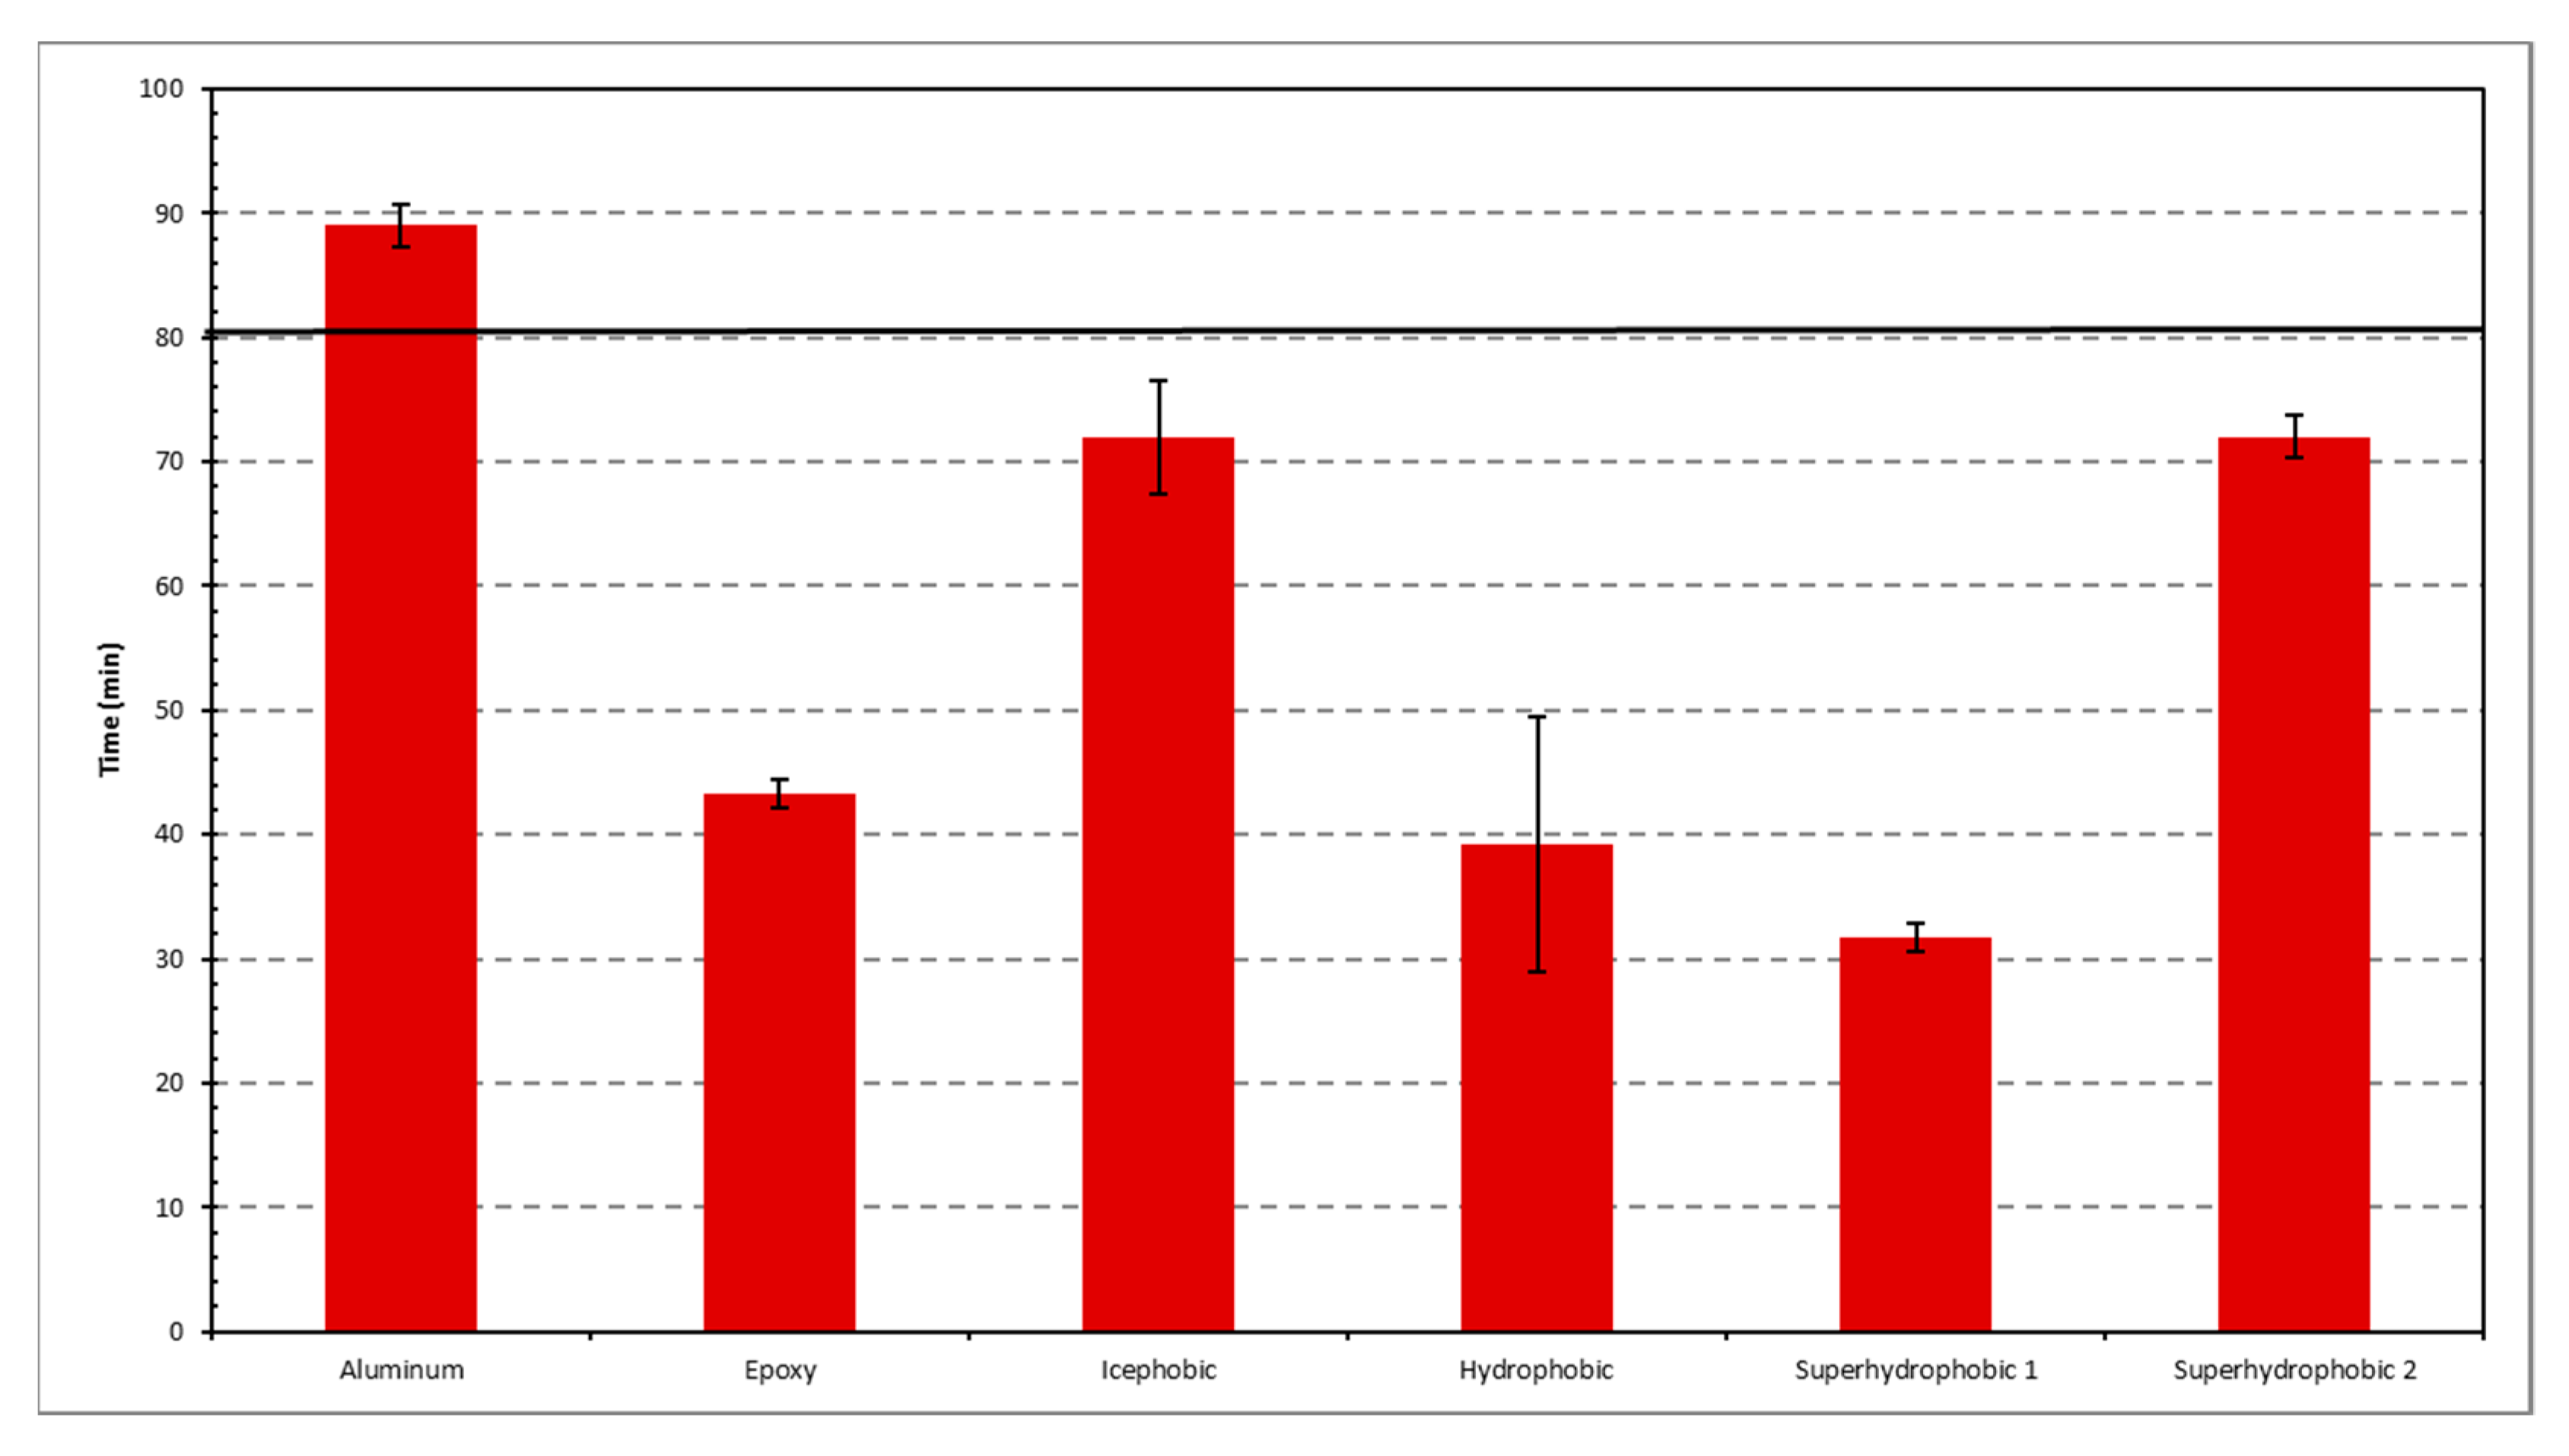
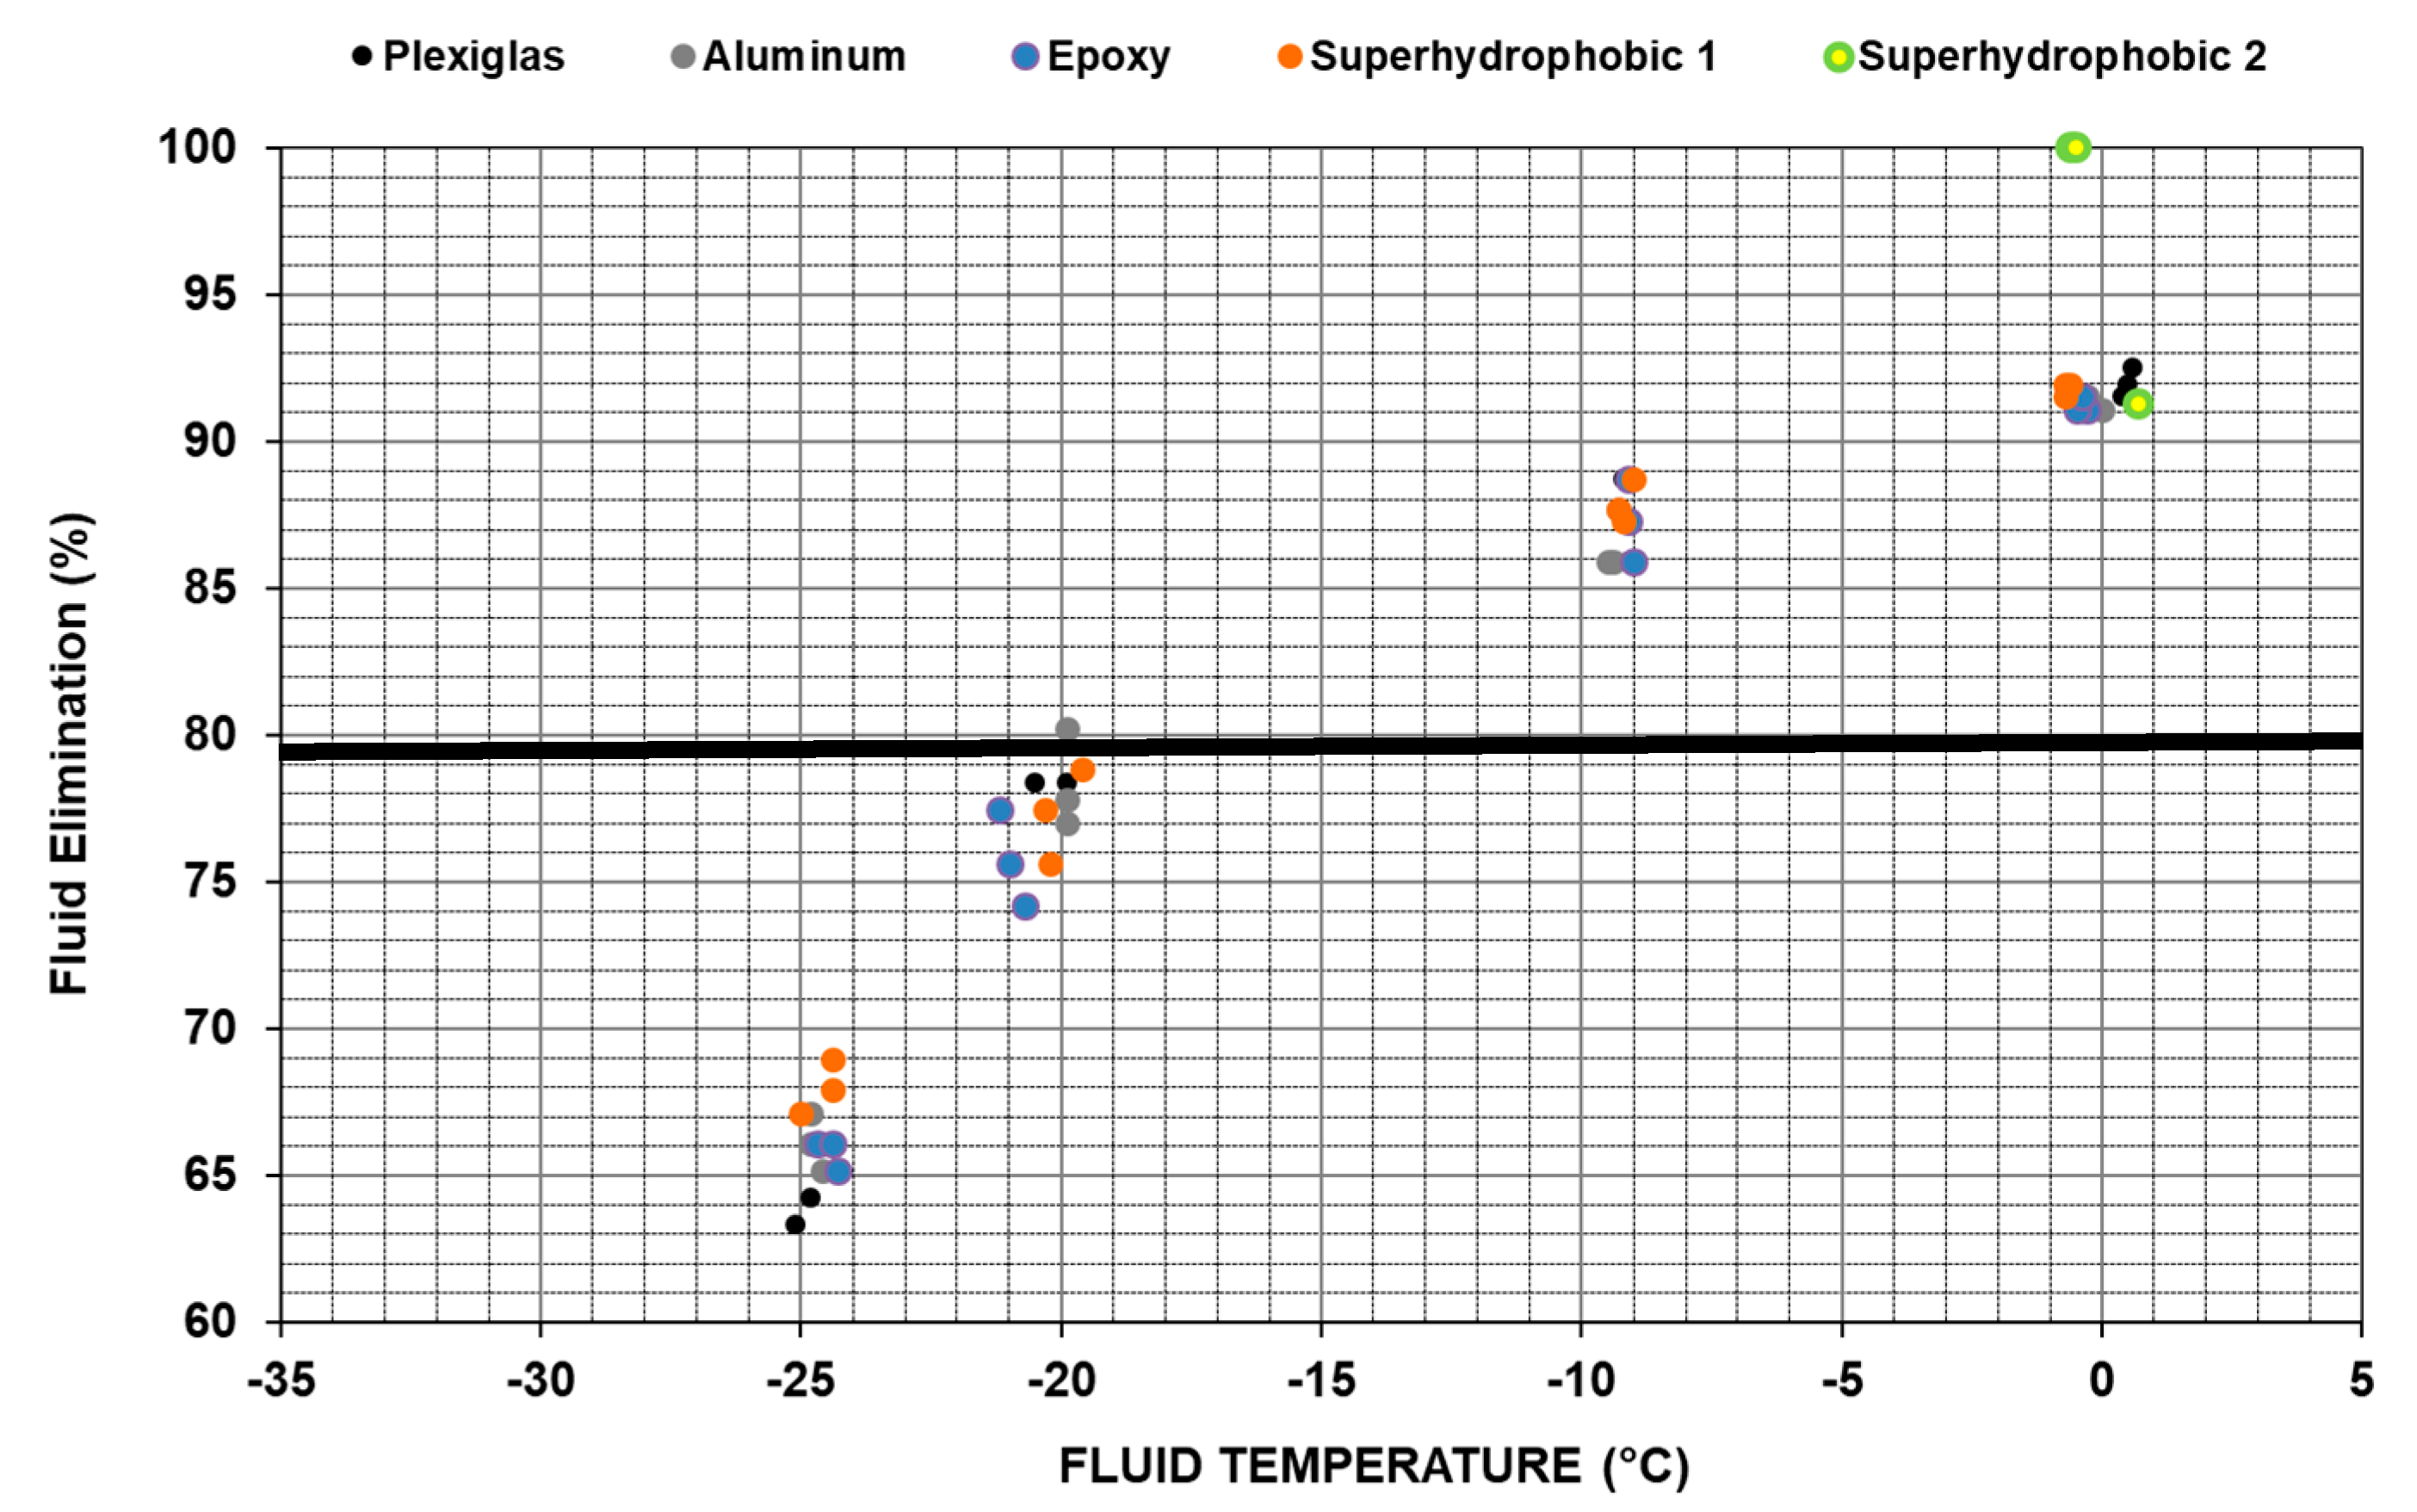
3.2. Water Spray Endurance Test

The endurance times obtained for the different surfaces with Fluid A are shown in Figure 8. The endurance time is the average of the results on three plates as per SAE AS5901. The minimum requirement for AMS1424 fluids is 3 min. Endurance time for the epoxy surface is above the 3-min line and within 20% variation of the baseline surface, which corresponds to the variability of the test. Icephobic, Hydrophobic, and Superhydrophobic 1 reduce the endurance time of the Fluid A below the minimum 3 min mark. Some early drainage occurs for those surfaces which reduces the time before an ice front is formed and the failure is declared. This is caused by lack of fluid on the top of the plate to protect from ice accumulation (Figure 9). For superhydrophobic 2, the fluid flows off the plate as it is poured onto it. No wetting or spreading of the fluid occurs on the surface and the fluid is immediately drained from the surface (Figure 10). Since no fluid is present, the ice accretes on all of the plates. The superhydrophobic properties of the coating and the warm condition (−5 °C) result in the formation of small frozen droplets on the surface (Figure 11). Even if no fluid is present, the formation of slush/ice on 10% of the plate takes ~25% longer than failure for the other surfaces. The warm conditions and the presence of the coating delays the freezing of the droplets and the superhydrophobic properties keep the droplets in an almost spherical shape allowing some of the largest droplets to flow off the plate. However, these results are questionable because the failure is more difficult to determine in those conditions and the test procedure is not defined for such a case and might be affected by subjectivity. In this particular case, the coating delayed the ice formation instead of the fluid, which occurred in the other cases.
The endurance times for Fluid B are presented in Figure 12. The minimum endurance time for AMS1428 Type IV fluids is 80 min [9]. With Fluid B, all the coatings reduce the endurance time of the fluid below the minimum requirement. Fluid B is not drained from Superhydrophobic 2 like Fluid A, but instead wets the plate properly before the test begins.
During the WSET tests, the Icephobic, Hydrophobic, and Superhydrophobic 1 reduced the endurance time below the minimum requirements of SAE AMS1424 for Fluid A. These surfaces hindered the ability of the fluid to completely wet the surface and accelerated its drainage during the tests. This leads to earlier ice formation on the plate and early failure. With Superhydrophobic 2, no wetting occurred with Fluid A and the fluid flowed off the surface before the test began. With the warm temperature, the superhydrophobic properties of the coating delayed the formation of ice on the whole plate. The failure was called when 10% of the plate was covered with ice, under the form of small frozen spherical drops distributed all over the plate.
With Fluid B, all the coatings reduced the endurance time of the fluid below the minimum requirements of SAE AMS1428. The Epoxy surface obtained a very short endurance time of 43 min with Fluid B, while it showed no effect with Fluid A. This result is lower than expected, with a small contact angle for this surface. For Superhydrophobic 2, Fluid B wetted the surface and protected the surface for 72 min, which is still lower than the minimum requirements, while it completely prevented Fluid A from wetting the surface.
Even if contact angle is an important parameter for wetting and drainage of the fluids for the different surfaces, no direct correlation could be found between the contact angle and the endurance time. As an example, Superhydrophobic 2 has the highest contact angle for both fluids, with a significant difference from the second-highest surface, Superhydrophobic 1, at neat concentration. The contact angles are similar for both neat fluids, with 136° for Fluid A and 134° for Fluid B. With Fluid A, this high contact angle resulted in no wetting of the surface and complete drainage of the fluid before the beginning of the test, while with Fluid B, the fluid wetted the surface and resulted in the second-highest endurance time after the baseline surface (Aluminum).
The endurance time of both fluids were highly affected by the presence of the coatings. Even if Fluid B is composed of surfactants, its endurance time was reduced by as much as 57 min in the presence of the various coatings. These results show that the coatings have a significant effect on the endurance time of the fluids, but that contact angle of fluid with the surface is not the only parameter of importance. The surface roughness, which affects the movement of liquids, as well as glycol concentration, hydrophilicity level of glycol, viscosity of the fluid, etc. could all influence the endurance time results.

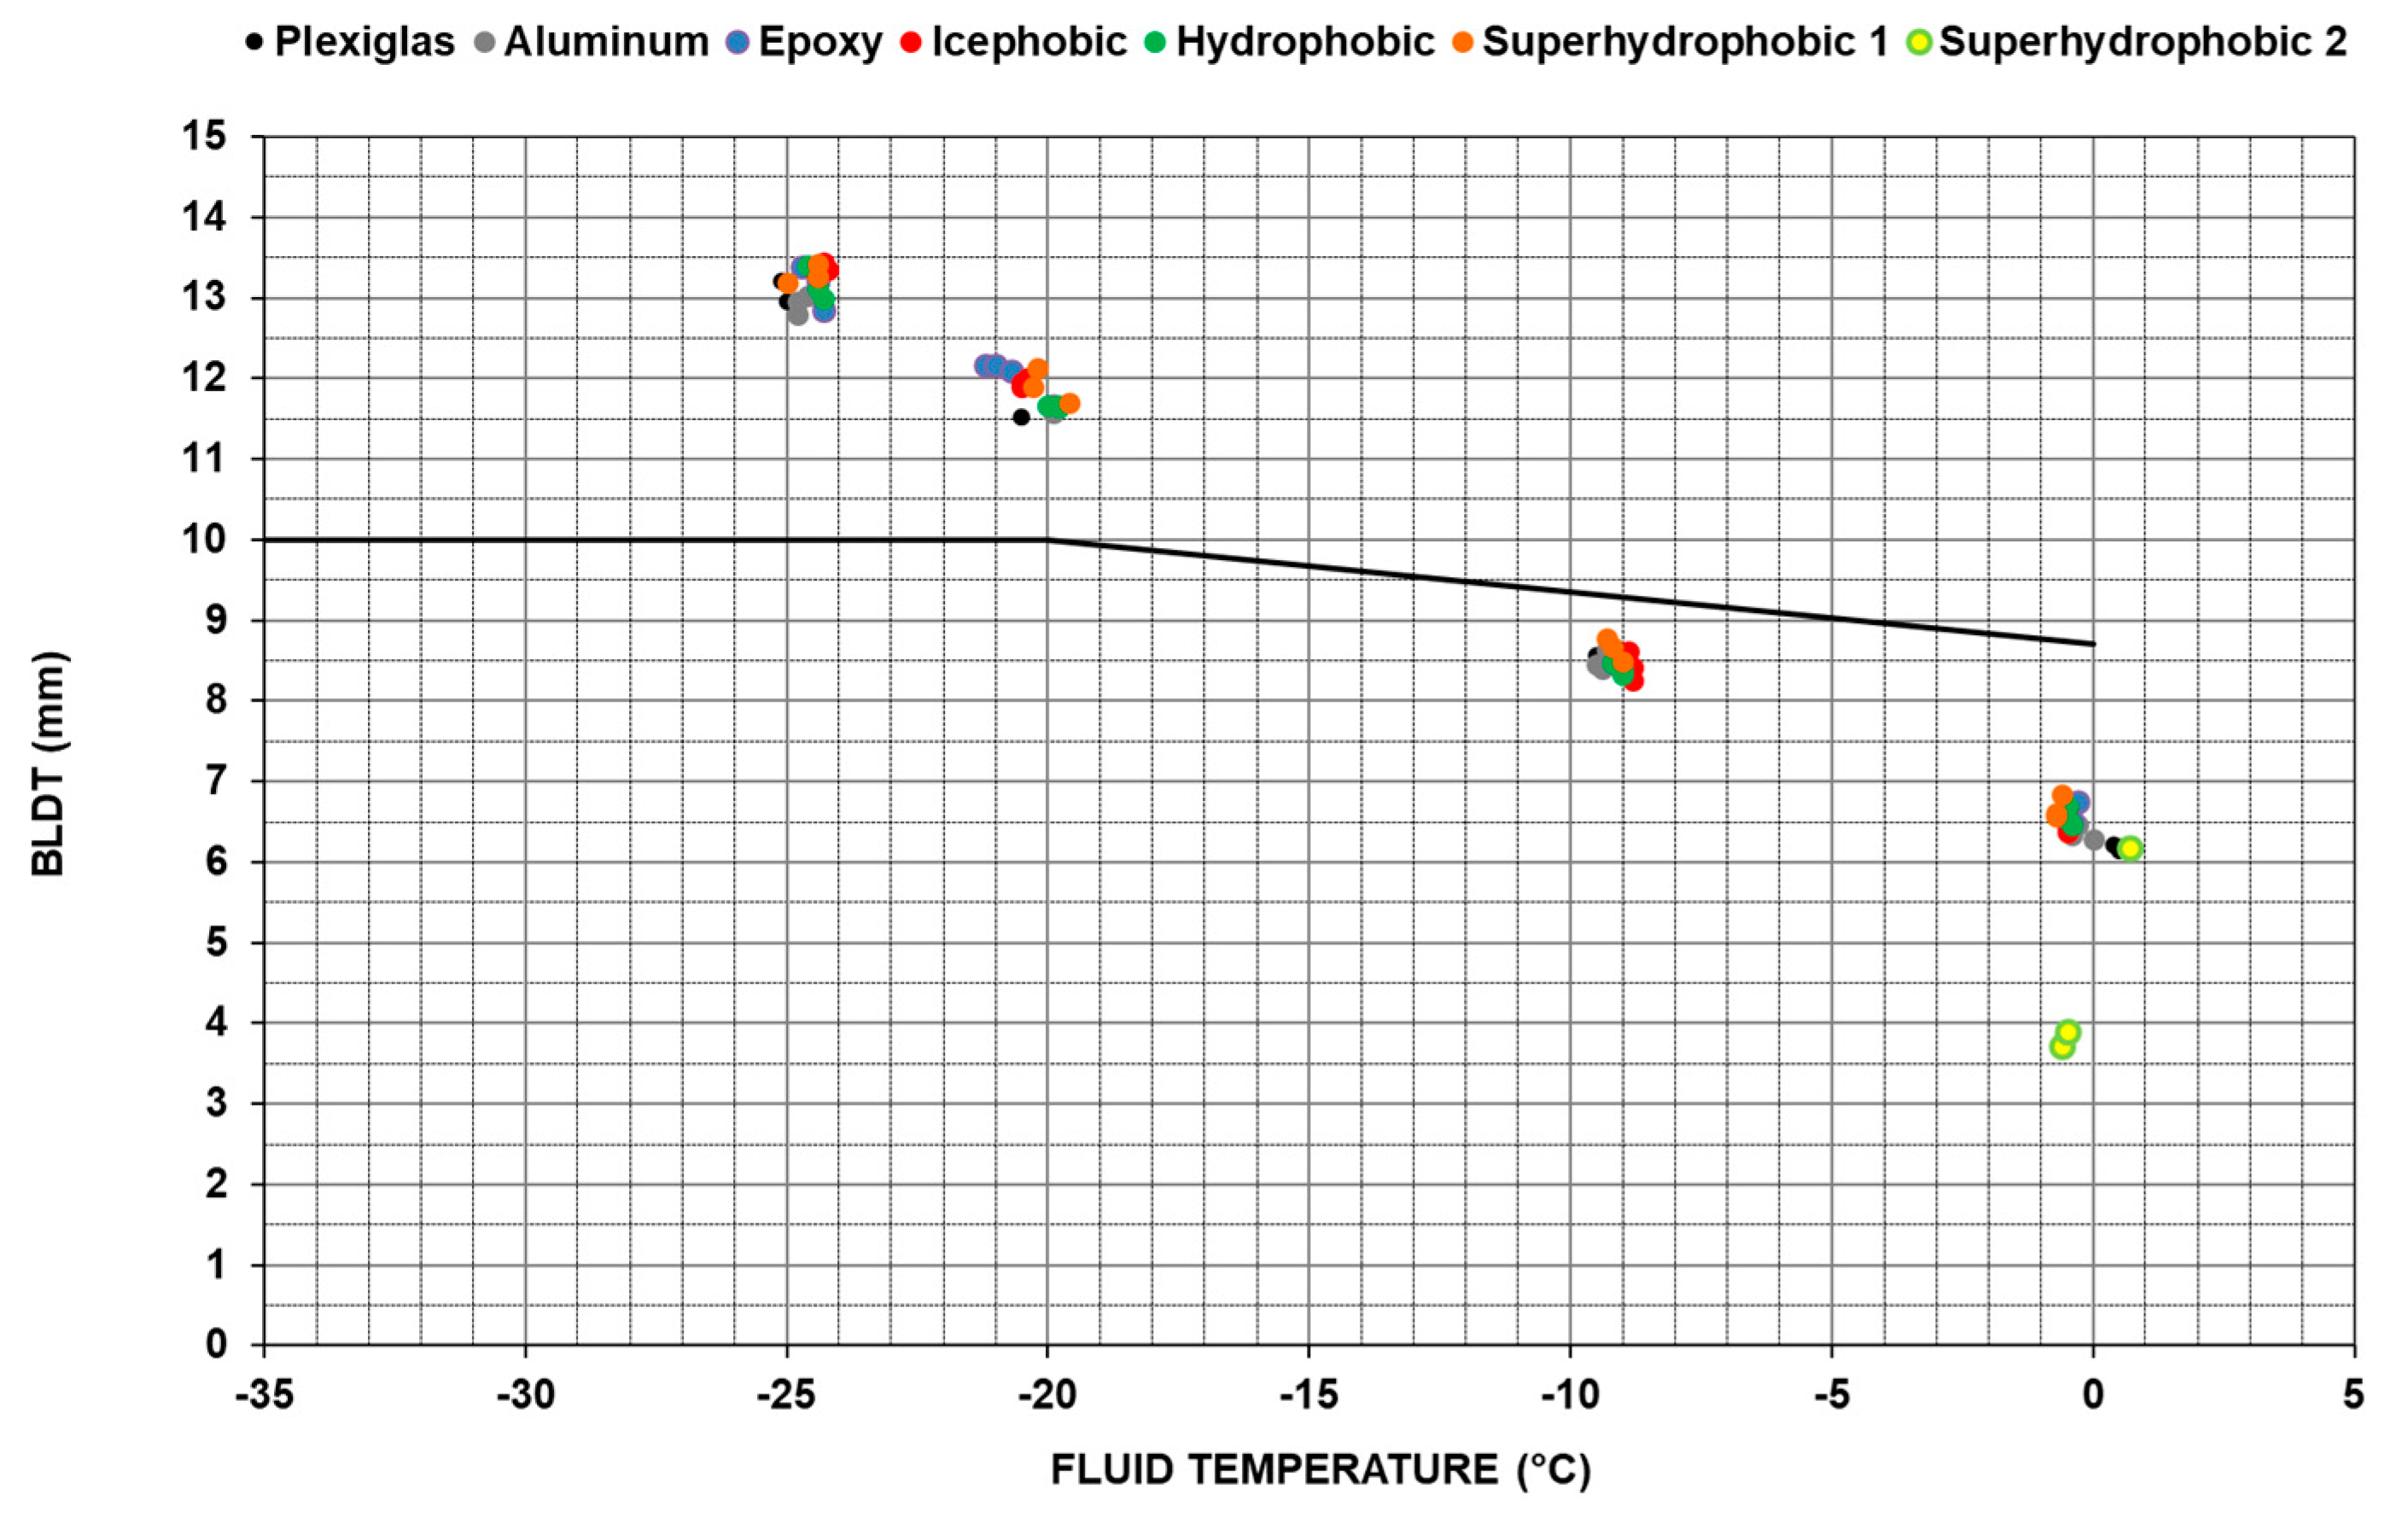
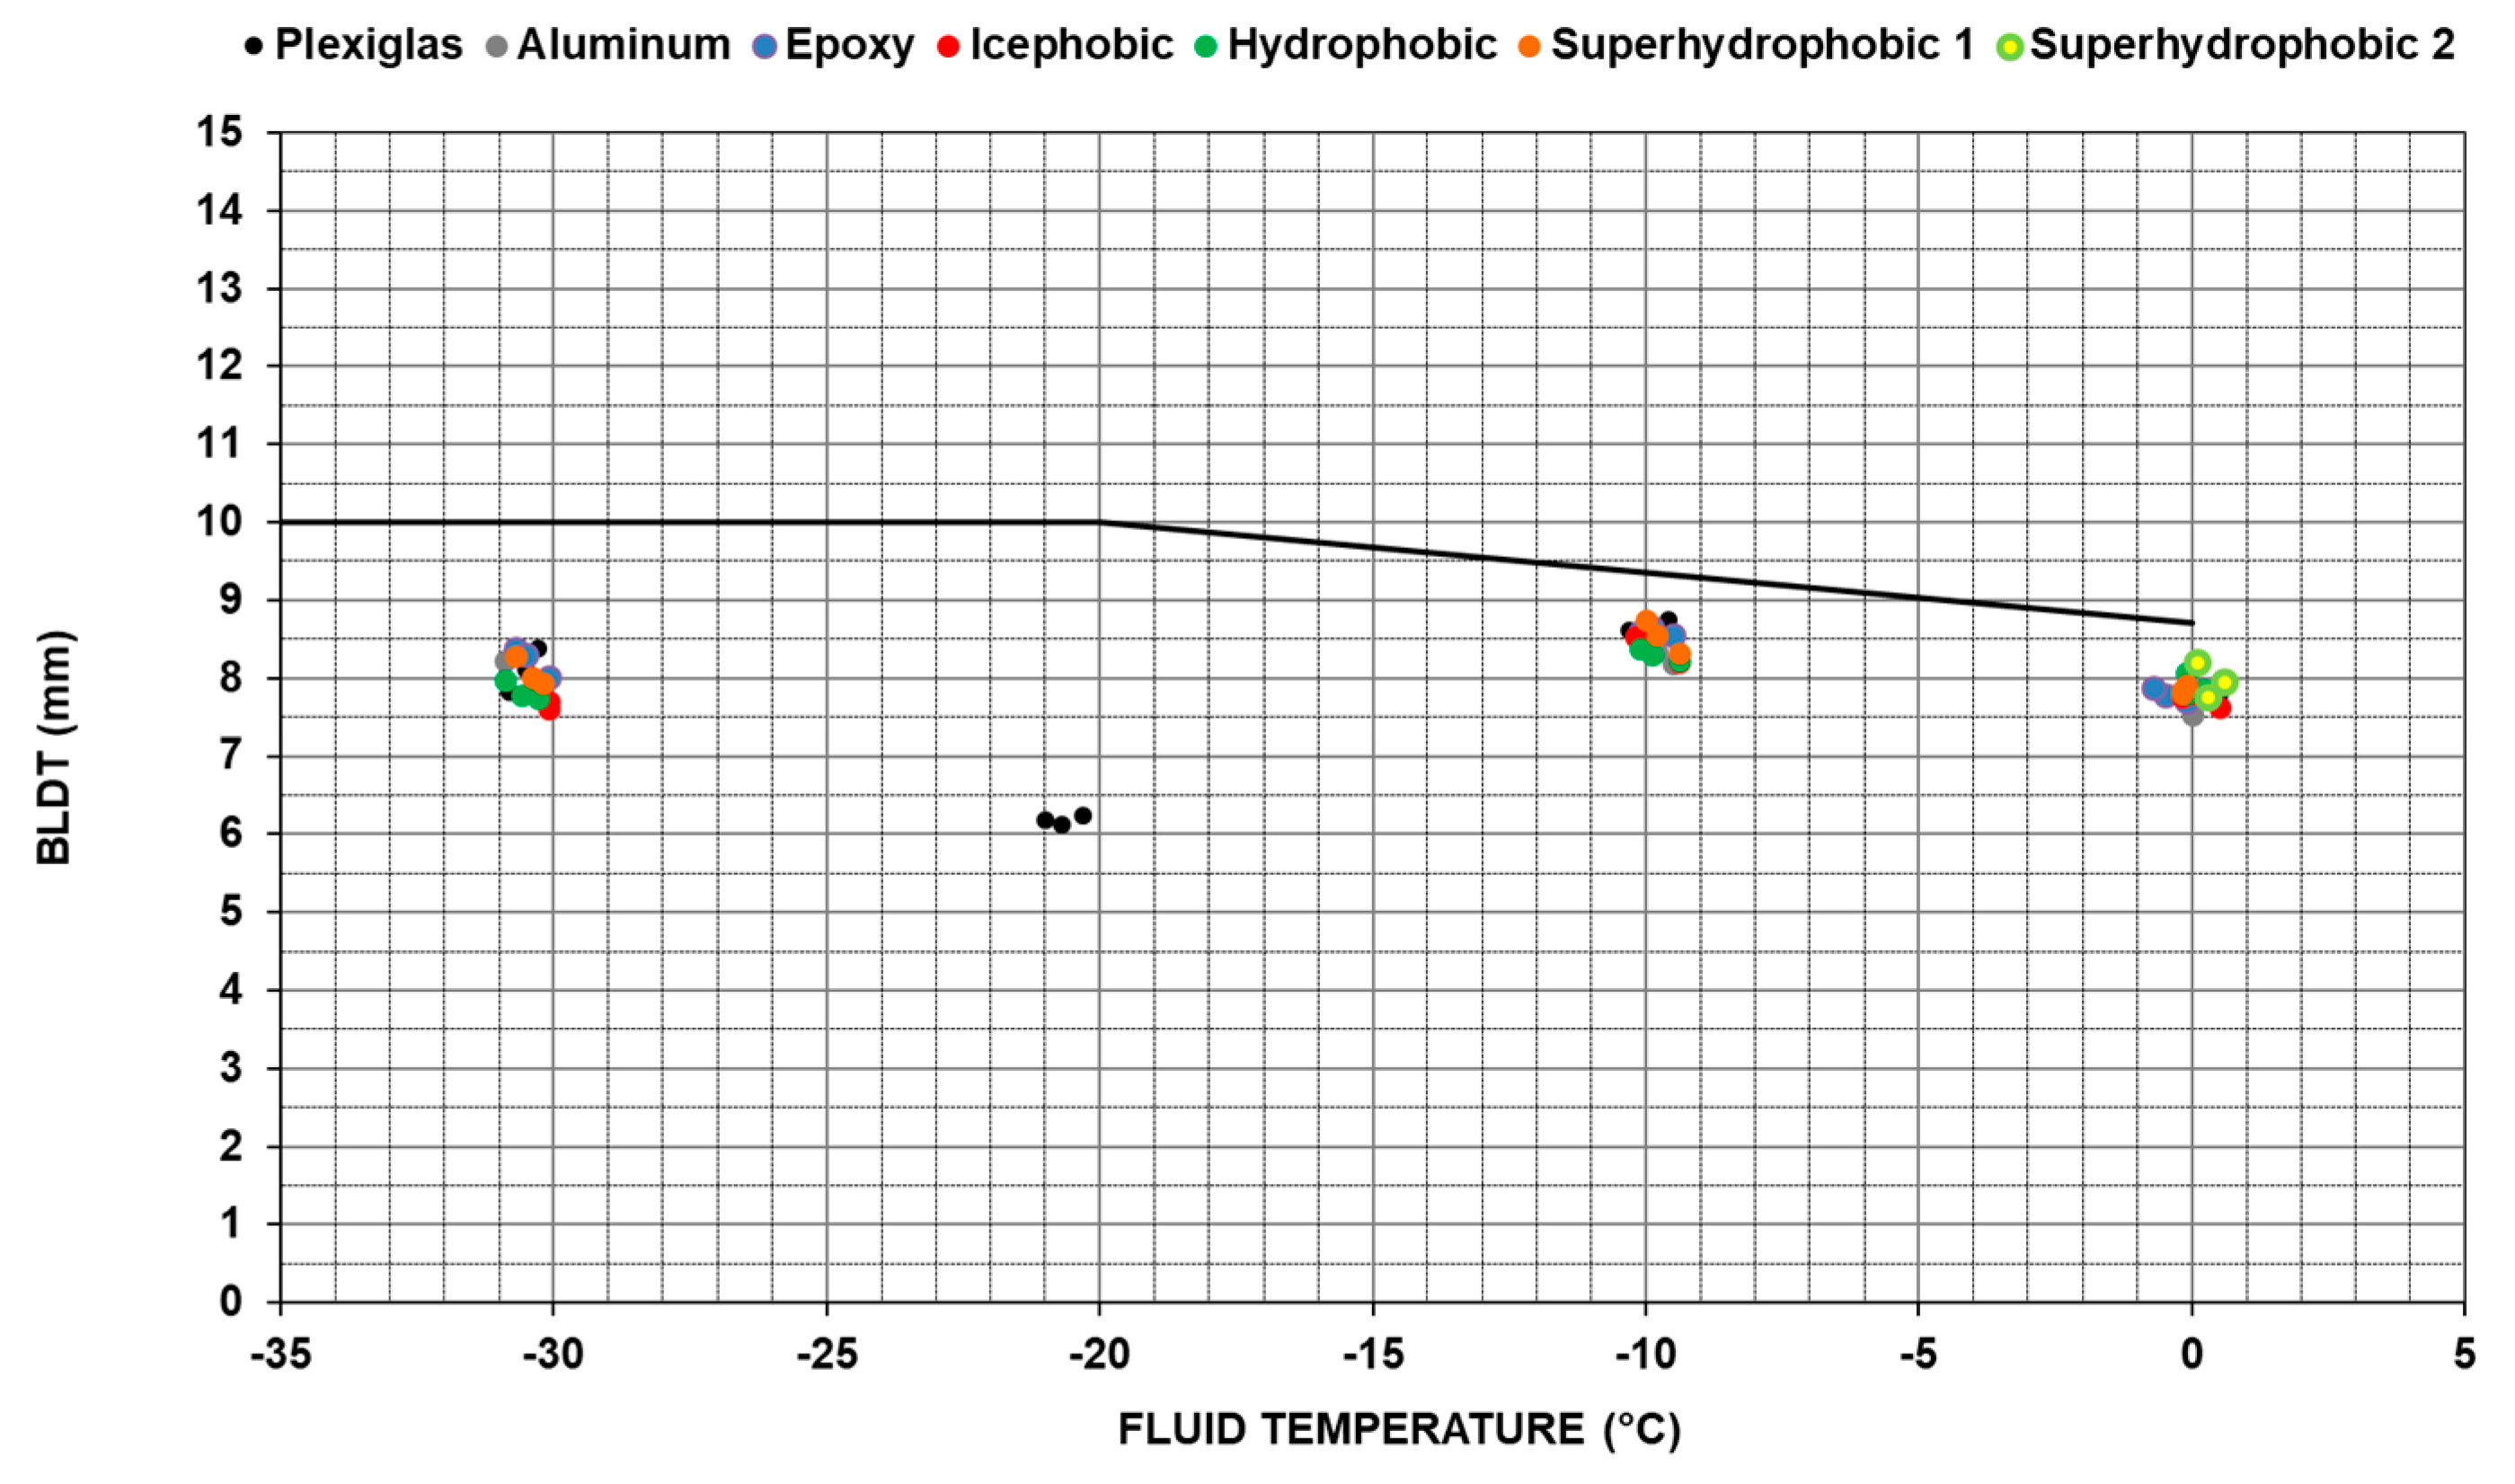
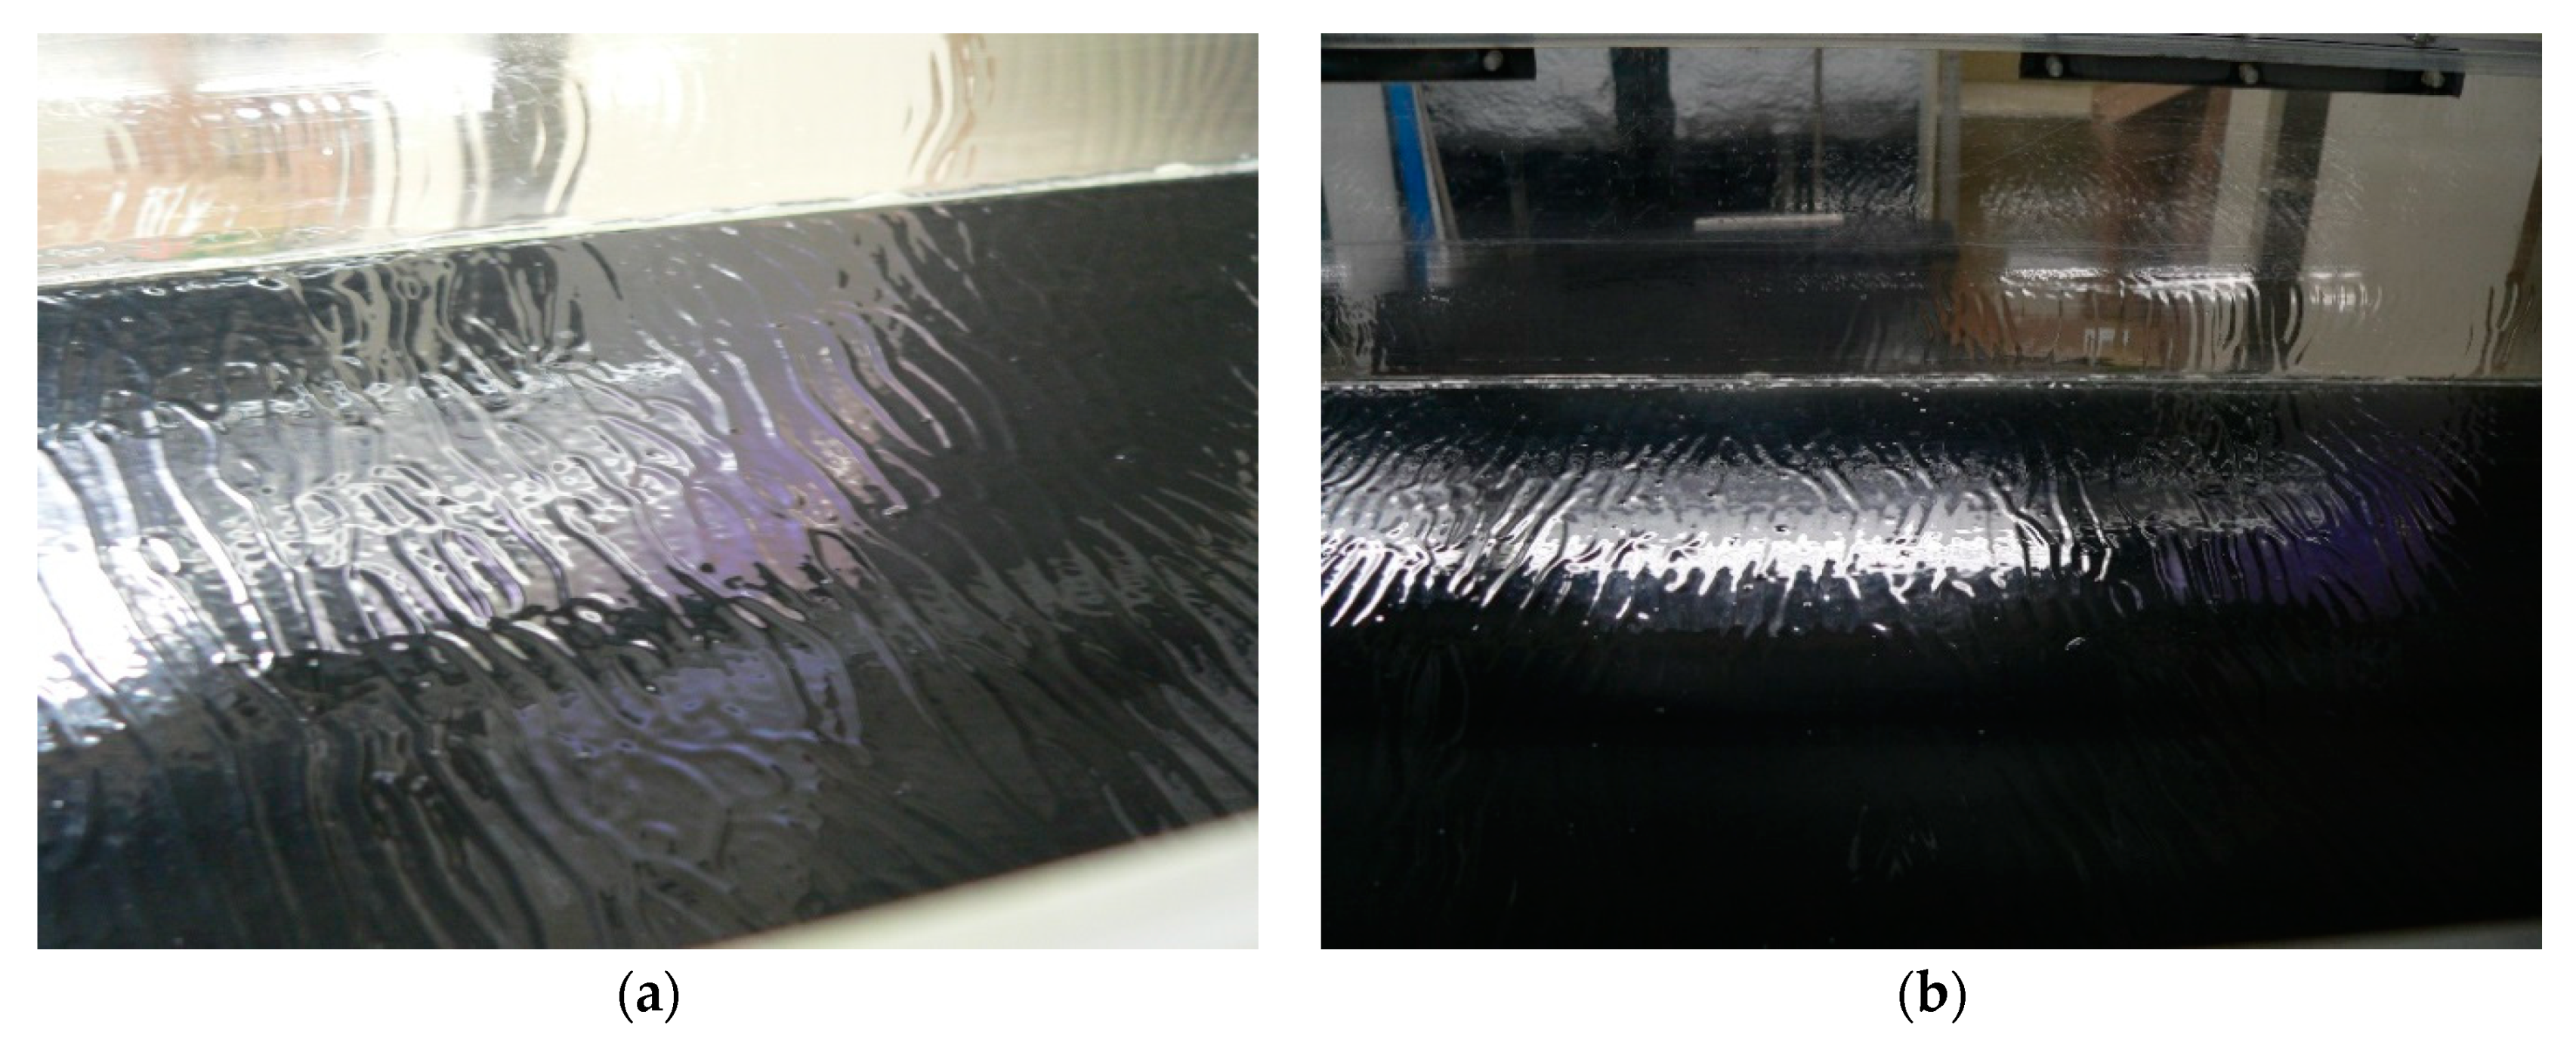
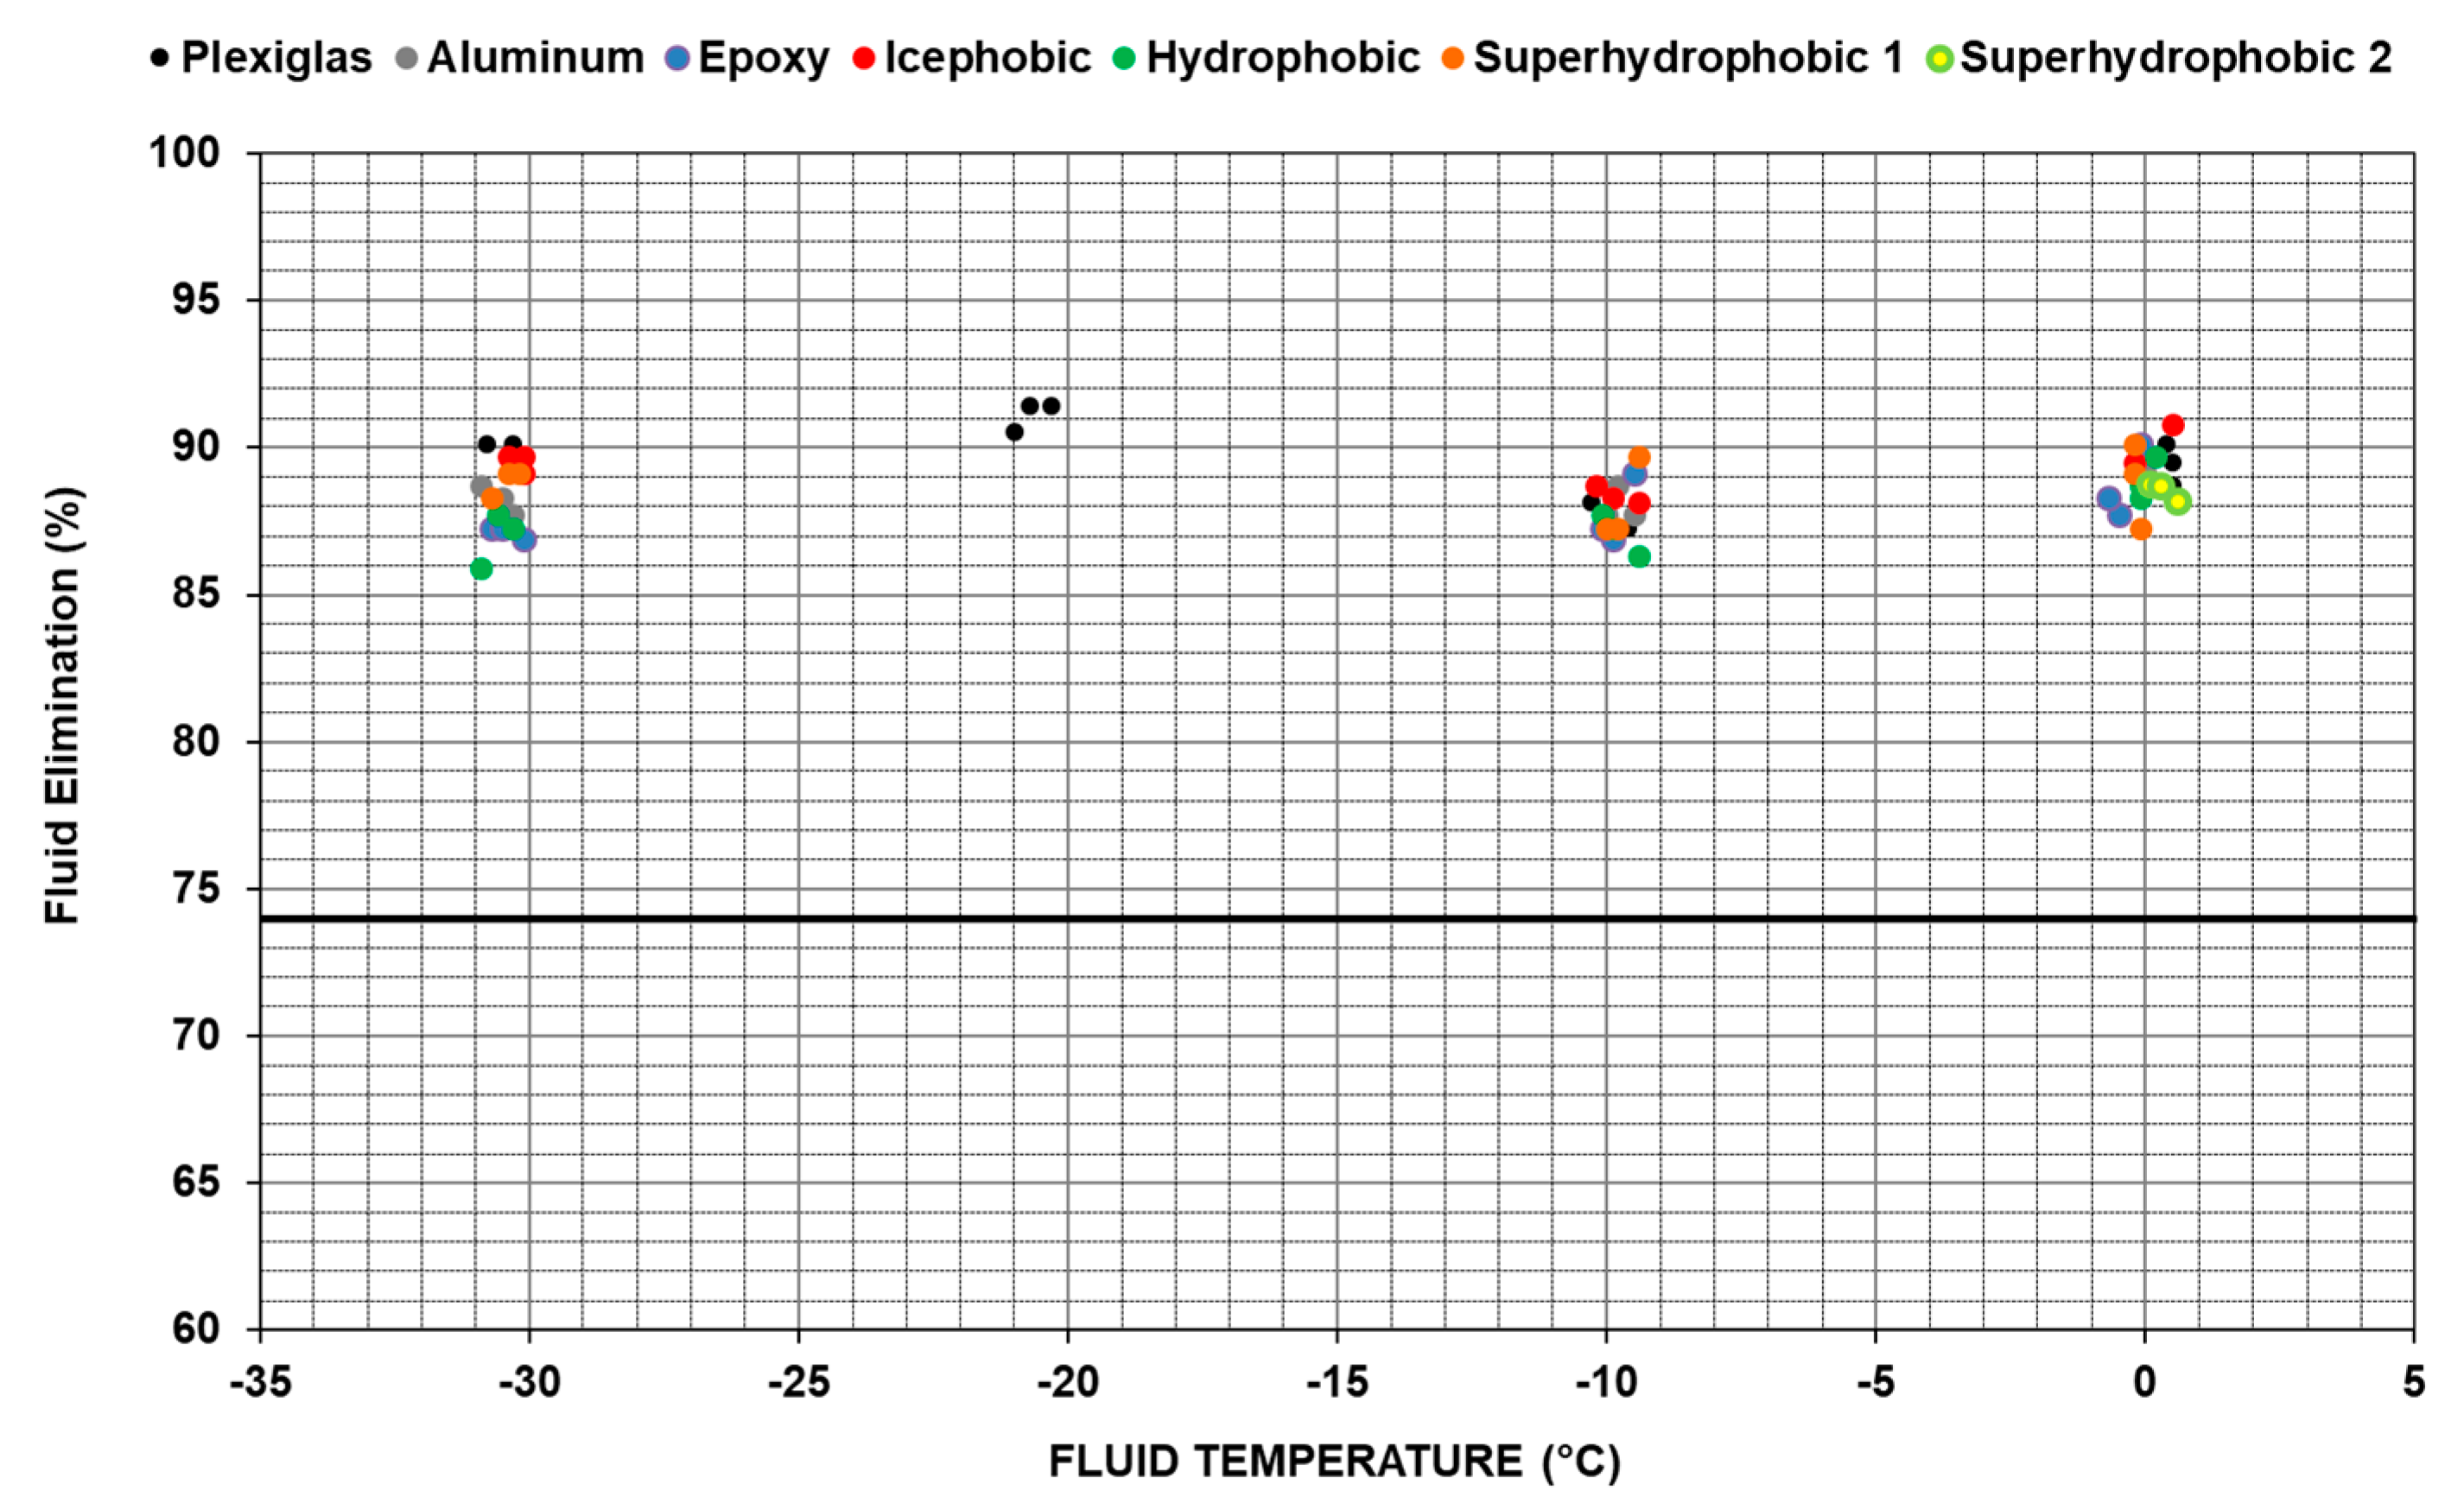
3.3. Aerodynamic Acceptance Test

3.3.1. Dry BLDT Results

Dry test runs, without fluid, are performed with the coated and bare aluminum plates installed on the floor of the duct. Those tests were performed at 0 °C. The impact of the roughness alone can be as adverse on the aerodynamic performances as the presence of a fluid.
The BLDT for the different surfaces are shown in Table 4. All surfaces are smoother than the sandpaper grit 2000. Consequently, all BLDT values of the surfaces tested are lower than the sandpaper grit 2000, used for comparison only, therefore below 3.66 mm. A maximum increase of 12.2% is obtained with the rougher surface, i.e., Superhydrophobic 2.
These increases in BLDT show that the different surfaces have an impact on the aerodynamic performances due to the enhanced roughness caused by their application. Table 5 compares the roughness of those surfaces to currently used camouflage paint as a simple comparison to other acceptable paints, showing that all the surfaces tested are below or in the same range as the camouflage paints already used on aircraft, with Fed Std 595–36118 (gray) being the roughest of all the surfaces.

3.3.2. Fluid BLDT Results

Tests with fluids are performed in conformity with the procedure in SAE AS5900 [7]. The fluids are poured directly onto the aluminum plates, bare and coated, installed on the floor of the duct. The fluids are tested in their neat concentration. Again, spreading of the fluids on the plate is affected by the presence of the coatings. Figure 13a shows the resulting fluid spreading on the epoxy surface. The spreading conforms with what is obtained on the standard Plexiglas surface during fluid qualification tests. For the other coatings, Figure 13b–e show that the fluids do not spread on the entire surface and leave some part of the flat plate not covered with any fluid. The worst case is obtained for the Superhydrophobic 2 with the Ref. Fluid, where a significant part of the plate, roughly half of it, is left free of any fluid.
Three test runs were performed at 0 °C, −10 °C, −20 °C, and −25 °C for the Ref. Fluid and at 0°, −10 °C, and −30 °C for the Fluid B. Figure 14 presents the results obtained with the Ref. Fluid for all surfaces compared with the baseline surface (Plexiglas). The results demonstrate that the surfaces tested have no impact on the BLDT results at all temperatures, excepted for Superhydrophobic 2. The first two test runs at 0 °C shows an average decrease of 40% in BLDT compared with the other surfaces. However, examination of the coating showed that it was damaged simply by gently cleaning the fluid after the tests, showing the very weak bonding of the coating with the aluminum substrate. When damaged, the surface was no longer superhydrophobic and the result of the third test run is similar to the other surfaces. Due to limited available wind tunnel time, no tests at other temperatures were performed on this surface.
The results obtained with Fluid B are presented at Figure 15. No tests were performed at −20 °C due to limited available wind tunnel time. Results at the three other temperatures were deemed sufficient to draw the required conclusions. As for the Ref. Fluid, all the tested surfaces besides Superhydrophobic 2 have no effect on the BLDT results of the fluid at all temperatures. For Superhydrophobic 2, the tests at 0 °C were performed after the damaging of the surface and no conclusions can be drawn with the results.
After each test run, the remaining fluid thickness is measured on the surface and fluid elimination is calculated as required in AS5900 [7]. Three thickness measurements are performed on the duct in order to calculate fluid elimination, as detailed in Section 2.4. Figure 16 shows the fluid after a test run on the aluminum, Hydrophobic, and Icephobic surfaces. The resulting fluid spreading after a test run for the two coatings made the calculation inaccurate with the actual method, due to the uneven distribution of the fluid on the plate, meaning that for the Icephobic and Hydrophobic coatings, the fluid elimination for the Ref. Fluid could not be calculated. An alternative method should be developed to measure fluid elimination when the fluid spreading is non-uniformly spread on the surface. Figure 16 also shows the test duct after the first two test runs with Superhydrophobic 2 (Figure 16d). The fluid was eliminated completely from the test plate due to the presence of the coating and its superhydrophobic effect, which resulted in a 100% fluid elimination for those tests since no fluid remained after the test run.
The fluid elimination for the other surfaces with Ref. Fluid is presented in Figure 17. As previously mentioned, the elimination for Superhydrophobic 2 is 100% for the two test runs before damaging of the surface. For all the other tests, the fluid eliminations are all within 6% difference at all temperatures. This small difference indicates that the coatings, besides Superhydrophobic 2, have no impact on the fluid elimination.
For Fluid B, the fluid spreading after a test run is similar for all surfaces (Figure 18), corresponding to the expected spreading on the baseline surface (Plexiglas). The fluid elimination percentages for all surfaces are within 4% difference from one another at all temperatures (Figure 19).
Results obtained during the dry runs with the AAT showed that the presence of the coatings has an impact of the aerodynamic performances by increasing the roughness of the surface. The BLDT increased with the roughness of the surface and a maximum increase of 12.2% was obtained with Superhydrophobic 2. The roughness of those surfaces is comparable to currently used camouflage paints. Those small penalties could be more important for in flight performances due to sensitivity of lift and drag performances of aerodynamic surfaces to surface roughness and different testing should be done on this matter to ensure their aerodynamic acceptability.
The coatings did not affect the BLDT results of Ref. Fluid and Fluid B, except for Superhydrophobic 2. For all the other surfaces, the BLDT obtained with both fluids were similar, within the variation of the test, to those obtained with the baseline (Plexiglas) at all temperatures. Superhydrophobic 2 significantly reduced the BLDT of the Ref. Fluid for the first two runs at 0 °C. As for the WSET test, the coating showed a very fragile nature and stopped showing any effect after the second run, with its third run at 0 °C giving a similar result to the other surfaces. Since the same coated plate was used for the Fluid B, it is not possible to tell whether the coating has an effect on the BLDT of this fluid.
The wetting of the surface prior to the test was not uniform for the Icephobic, Hydrophobic and Superhydrophobic coatings with both fluids. Wetting of Superhydrophobic 2 with the Ref. Fluid was significantly worse than for the other cases, which could explain the lower BLDT results. The fluid elimination after the test could not be measured for some surfaces with the Ref. Fluid due to uneven fluid thickness on the plates. For Fluid B, the fluid spreading was uniform for all surfaces after each test run. The coatings had no effect on the fluid elimination for all the tests where it could be measured, besides for Superhydrophobic 2 with Ref. Fluid where the fluid was completely eliminated from the surface.
Only the Superhydrophobic 2 coating had an effect on the fluid BLDT. However, the higher contact angles of the Icephobic, Hydrophobic, and Superhydrophobic coatings hindered the spreading of the fluid, which created uneven thicknesses before the test for both fluids and uneven thicknesses after the test for Ref. Fluid. The higher contact angles for Ref. Fluid can explain the uneven thicknesses after the test runs, even after being submitted to high-shearing forces due to the air flow in the duct during the test.

4. Conclusions

This paper investigated the effects of different surfaces on the performances of SAE AMS1424 and AMS1428 ground de-icing/anti-icing fluids. The results showed that while the contact angles of the fluids were lower than pure water, they were still higher on the different coatings than on bare aluminum. While no direct correlation was found between the contact angle and the endurance time, the presence of those coatings reduced greatly the endurance time as well as the ability of the fluids to wet and spread on the surface. Other important fluid and surface parameters like surface roughness, viscosity, contact angle hysteresis, surface tension etc. should be investigated to measure their impact on endurance time. For the aerodynamic acceptance test, only Superhydrophobic 2 impacted the BLDT result, and only for the Ref. Fluid. Since the coating facilitated the fluid flow-off and reduced the BLDT, it is not a concern for aerodynamic performances. Due to the fragile nature of this coating, it was not possible to run the entire test plan with Superhydrophobic 2. More testing should be done at every condition using this surface with a freshly applied layer of coating for each test. However, this still shows that the surface can affect the fluid flow-off and it is possible that different type of surfaces could create an adverse effect on aerodynamic. Other measurement techniques, like pressure rake, hotwire, or Particle Image Velocimetry could be used to strengthen those conclusions and help characterize the fluid flow field for further research on this aspect of the test. Research on dynamic interaction between coating and deicing fluids with a high-speed camera should also be considered for further research. The higher contact angle of some of the coatings affected the wetting and spreading of the fluids before and after the test run. For some surfaces, the irregular fluid spreading before and after the test made it impossible to measure the fluid elimination during the test. This is a concern and a measurement technique for such cases needs to be elaborated. This studied showed the importance of understanding and measuring the interaction of a surface with the SAE AMS1424 and AMS1428 ground de-icing/anti-icing fluids before its application on an aircraft. The conclusions of this study were used to developed parts of the SAE AIR6232 Aircraft Surface Coating Interaction with Aircraft Deicing/Anti-Icing Fluids [15] as an informative support for the industry.

Author Contributions

E.V. has designed and investigated the modified aerodynamic and endurance tests and is the main author of the paper. J.-D.B. is the specialist on coating development and properties and performed some of the coating characterization. C.V. participated in the analysis of the data and improvement of the paper.

Funding

This research received no external funding.

Conflicts of Interest

The authors declare no conflict of interest.

References

  1. Leroux, J. Guide to Aircraft Ground Deicing; Issue 11, G12; SAE International: Warrendale, PA, USA, 2019; p. 298. [Google Scholar]
  2. Laforte, C.; Blackburn, C.; Perron, J. A Review of Icephobic Coating Performances over the Last Decade, 2015-01-2149. In Proceedings of the SAE 2015 International Conference on Icing of Aircraft, Engines, and Structures, Prague, Czech Republic, 22–25 June 2015. [Google Scholar]
  3. Brassard, J.-D.; Laforte, C.; Guerin, F.; Blackburn, C. Icephobicity: Definition and Measurement Regarding Atmospheric Icing; Springer: Berlin/Heidelberg, Germany, 2017; pp. 1–21. [Google Scholar] [CrossRef]
  4. Yih, C.-S. Wave formation on a liquid layer for de-icing airplane wings. J. Fluid Mech. 1990, 212, 41–53. [Google Scholar] [CrossRef]
  5. Koivisto, P.; Soinne, E.; Kivekäs, J. Anti-Icing Fluid Secondary Wave and Its Role in Lift Loss during Takeoff. J. Aircr. 2018, 55, 2298–2306. [Google Scholar] [CrossRef]
  6. Water Spray and High Humidity Endurance Test Methods for SAE AMS1424 and SAE AMS1428 Aircraft Deicing/Anti-icing Fluids; AS5901D; SAE International: Warrendale, PA, USA, 4 September 2019; p. 13.
  7. Standard Test Method for Aerodynamic Acceptance of SAE AMS1424 and SAE AMS1428 Aircraft Deicing/Anti-icing Fluids; AS5900C; SAE International: Warrendale, PA, USA, 25 October 2016; p. 28.
  8. Deicing/Anti-icing Fluid, Aircraft, SAE Type I; AMS 1424P; SAE International: Warrendale, PA, USA, 26 September 2018.
  9. Fluid Aircraft Deicing/Anti-Icing, Non Newtonian (Pseudoplastic), SAE Types II, Type III and Type IV; AMS 1428K; SAE International: Warrendale, PA, USA, 24 October 2018.
  10. Brassard, J.D.; Sarkar, D.K.; Perron, J. Studies of drag on the nanocomposite superhydrophobic surfaces. Appl. Surf. Sci. 2015, 324, 525–531. [Google Scholar] [CrossRef]
  11. Brassard, J.-D.; Sarkar, D.K.; Perron, J. Fluorine Based Superhydrophobic Coatings. App. Sci. 2012, 2, 453–464. [Google Scholar] [CrossRef] [Green Version]
  12. Brassard, J.-D.; Sarkar, D.K.; Perron, J.; Audibert-Hayet, A.; Melot, D. Nano-micro structured superhydrophobic zinc coating on steel for prevention of corrosion and ice adhesion. J. Colloid Interface Sci. 2015, 447, 240–247. [Google Scholar] [CrossRef] [PubMed] [Green Version]
  13. Brassard, J.-D.; Laforte, C. Silicone Based Icephobic Coating Assessment Under Offshore Winter Conditions. In Proceedings of the 27th International Ocean and Polar Engineering Conference, San Francisco, CA, USA., 25–30 June 2017. [Google Scholar]
  14. Brassard, J.-D.; Laforte, J.-L.; Blackburn, C.; Perron, J.; Sarkar, D.K. Silicone based superhydrophobic coating efficient to reduce ice adhesion and accumulation on aluminum under offshore arctic conditions. Ocean Eng. 2017, 144, 135–141. [Google Scholar] [CrossRef]
  15. Aircraft Surface Coating Interaction with Aircraft Deicing/Anti-Icing Fluids; AIR6232; SAE International: Warrendale, PA, USA, 2 April 2019.
Figure 1. Contact angle of a water droplet on a superhydrophobic surface.
Aerospace 06 00114 g001
Figure 2. Typical Water Spray Endurance Test (WSET) setup used in the cold room.
Aerospace 06 00114 g002
Figure 3. Aerodynamic Acceptance Test (AAT) setup.
Aerospace 06 00114 g003
Figure 4. Aluminum plate installed on duct floor coated with (a) icephobic (b) epoxy.
Aerospace 06 00114 g004
Figure 5. Contact angle of Ref. Fluid with each set of surfaces as a function of its dilution (%V/V).
Aerospace 06 00114 g005
Figure 6. Contact angle of Fluid B with each set of surfaces as a function of its dilution (%V/V).
Aerospace 06 00114 g006
Figure 7. Contact angles of (a) water with superhydrophobic 2 (>150°) and (b) Ref. Fluid neat with aluminum (50°).
Aerospace 06 00114 g007
Figure 8. Endurance time for the different surfaces for Fluid A. Bold black line at 3 min is the minimum requirement as per AMS1424 [8].
Aerospace 06 00114 g008
Figure 9. Wetting of the WSET plate coated with hydrophobic coating before test.
Aerospace 06 00114 g009
Figure 10. Pouring of Fluid A on Superhydrophobic 2.
Aerospace 06 00114 g010
Figure 11. Precipitation on Superhydrophobic 2 during WSET with Fluid A.
Aerospace 06 00114 g011
Figure 12. Endurance time for the different surfaces for Fluid B. Bold black line at 80 min is the minimum requirement as per AMS1428 [9].
Aerospace 06 00114 g012
Figure 13. Spreading of fluid before the test (a) Ref. Fluid on epoxy, (b) Ref. Fluid on hydrophobic, (c) Fluid B on icephobic, (d) Ref. Fluid on Superhydrophobic 2, (e) Fluid B on Superhydrophobic 2.
Aerospace 06 00114 g013aAerospace 06 00114 g013b
Figure 14. BLDT results for all surfaces in function of temperature for Ref. Fluid (flat line showing acceptance limits).
Aerospace 06 00114 g014
Figure 15. BLDT results for all surfaces in function of temperature for Fluid B (flat line showing the acceptance limit).
Aerospace 06 00114 g015
Figure 16. Ref. Fluid after a test run (a) on Aluminum (b) on Icephobic (c) on Hydrophobic (d) on Superhydrophobic 2.
Aerospace 06 00114 g016
Figure 17. Fluid elimination for Ref. Fluid.
Aerospace 06 00114 g017
Figure 18. Fluid B after a test run (a) on Icephobic; (b) on Hydrophobic.
Aerospace 06 00114 g018
Figure 19. Fluid elimination for Fluid B.
Aerospace 06 00114 g019
Table 1. Fluids description.
Fluid NameFluid DescriptionFluid Type
Ref. FluidHigh speed ramp reference fluidSAE AS5900 Reference Fluid
Fluid ACommercially available Type I Ethylene Glycol based qualified fluidSAE AMS1424 Fluid
Fluid BCommercially available Type IV Propylene Glycol based qualified fluidSAE AMS1428 Fluid
Table 2. SAE AS5900 High speed ramp reference fluid composition.
ComponentPercent by Weight (%w/w)
Propylene glycol68.0 ± 0.1
Tripropylene glycol20.0 ± 0.1
Demineralized water12.0 ± 0.1
Table 3. Surface roughness and contact angles with water for the different surfaces.
SurfaceChemical InformationAverage Roughness µm (µin)Contact Angle with Water (°)
AluminumAl 6061 T60.12 (4.7)76 ± 1
EpoxyEpoxide resin0.12 (4.7)92 ± 1
IcephobicEpoxide resin1.24 (48.8)111 ± 1
HydrophobicSilicone based0.41 (16.1)116 ± 1
Superhydrophobic 1ZnO Nanoparticules Doped Epoxide resin1.24 (48.8)152 ± 1
Superhydrophobic 2Silica–silicone nanocomposite2.10 (82.7)160 ± 1
Hydrophobic > 90°, Superhydrophobic > 150°.
Table 4. Boundary layer displacement thickness (BLDT) results for the different surfaces.
SurfaceAverage Roughness µm (µin)BLDT (mm)Increase (%)
PlexiglasN/A2.700.0
Aluminum0.12 (4.7)2.700.0
Epoxy0.12 (4.7)2.762.2
Hydrophobic0.41 (16.1)2.762.2
Superhydrophobic 11.24 (48.8)2.948.9
Icephobic1.24 (48.8)3.0011.1
Superhydrophobic 22.10 (82.7)3.0312.2
2000 (Sandpaper)2.60 (102.4)3.6635.6
Table 5. Comparison of the roughness of the surfaces tested with currently used camouflage paints.
SurfaceAverage Roughness µm (µin)
Aluminum0.12 (4.7)
Epoxy0.12 (4.7)
Hydrophobic0.41 (16.1)
Superhydrophobic 11.24 (48.8)
Icephobic1.24 (48.8)
Fed Std 595–36173 (polyurethane gray)1.24 (48.8)
Fed Std 595–34102 (moss green)1.73 (68.0)
Fed Std 595–34092 (dark green)1.98 (78.0)
Superhydrophobic 22.10 (85.0)
Fed Std 595–36118 (gray)2.16 (85.0)
2000 (Sandpaper)2.60 (102.4)

