Article

The Public Safety Zones around Small and Medium Airports

by
Paola Di Mascio
1,†,
Giuseppe Perta
2,†,
Giuseppe Cantisani
1,† and
Giuseppe Loprencipe
1,*
1
Department of Civil, Constructional and Environmental Engineering, Sapienza University of Rome, Via Eudossiana 18, 00184 Rome, Italy
2
Via Luigi Pirandello, 30, 71042 Cerignola, Italy
*
Author to whom correspondence should be addressed.
These authors contributed equally to this work.
Aerospace 2018, 5(2), 46; https://doi.org/10.3390/aerospace5020046
Submission received: 27 March 2018 / Revised: 16 April 2018 / Accepted: 20 April 2018 / Published: 23 April 2018
(This article belongs to the Collection Air Transportation—Operations and Management)

Abstract

:
Proper planning around airports safeguards the surrounding territory from risks of air accidents. Many countries have defined Public Safety Zones (PSZs) beyond the runway thresholds as a result of targeted risk assessment methods. Therefore, national aviation Authorities could limit building construction and industrial development in order to contain the risk for dwellers to be involved in aircraft accidents. The number of people who live, work or congregate in these areas should be limited. The procedure to set Public Safety Zones is based on advanced technical analyses for major infrastructures. For smaller airports, simplified schemes are used, but, sometimes, they are not as effective when considering the actual safety conditions. This article aims to identify the shape and size of the Public Safety Zones for small and medium one-runway airports. The influence of the volume and mix of traffic on the PSZ geometry has been evaluated using the program named SARA (Sapienza Airport Risk Analysis); the results are correlated with the current Risk Plans generally adopted in Italy. According to the air traffic, the Risk Plans are characterized by a dynamic definition and fit the results obtained from risk assessment.

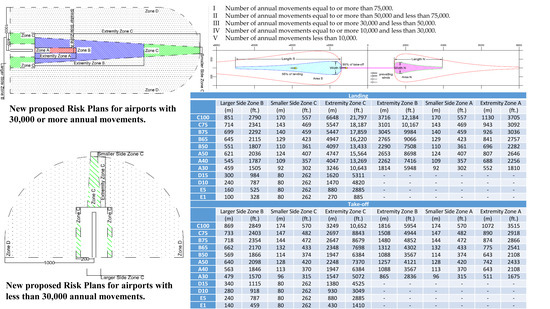
Graphical Abstract

1. Introduction

Proper planning around airports safeguards the surrounding territory from risks due to air accidents. Many countries have defined Public Safety Zones (PSZs) by means of risk assessment methods with this goal. These are areas around the runway where civil and industrial development is restricted in order to contain the risk for people living near airports to be involved in aircraft accidents. Therefore, the land use around airports implies an acceptable level of risk of accident for people on the ground caused by an aircraft landing or departure from an airport. The number of people who live, work, or congregate in these areas should be limited. The bounds of the PSZs are identified by individual risk contours and define the level of risk of being killed by aircraft crash, remaining in the same place for a certain period of time.
The statistical reports show that most air accidents occur during take-off and landing phases along the extended runway centreline [1]. As a consequence, several countries in Europe, for example, the UK [2,3], Ireland [4] and the Netherlands [5] have defined some areas beyond the runway thresholds where land use is restricted to safeguard the territory in the vicinity of the airport. The Netherlands has a long history of experience on risk assessment. The first Dutch model to calculate third-party risk around airports was implemented in 1992 and applied to major airports, for example, Schiphol at Amsterdam [6,7].
In the abovementioned countries, two kinds of PSZs are defined: the Inner and the Outer PSZ. The former area is bound by the risk contour equal to 10−5 and the second area is included between 10−5 and 10−6 risk contours. These thresholds come from an English study on the attitudes of inhabitants living around airports, that defined irrelevant a level of risk less than 10−6. In the land-use planning in the vicinity of airports, all countries prohibit any type of new buildings in the “Inner PSZ”. In the “Outer PSZ”, British laws allow construction for all uses (homes, industries and vulnerable buildings), Irish law does not allow vulnerable buildings, while Dutch law accepts only industries.
In the past, several accidents near airports involved areas lateral to the runway: more than 200 accidents since 1996 [8,9], for example, Pisa in 2009, Kinshasa in 2010, Resolute Bay in 2011, Ottawa in 2011. As a matter of fact, other countries defined safety zones beyond the runway thresholds and on the side areas of the runway. Some US States (e.g., California and Minnesota) have defined regular geometric zones around runways in which restrictions are imposed on construction of structures, certain land uses, or concentrations of people. Runway length, aircraft types, airport surroundings, such as topography and geographic features of the area [10,11] affect the shape and the dimensions of the safety zones.
Other United States (e.g., Washington) provided some guidelines on airport compatible land-use planning and defined six safety zones with respect to the runway end whose dimensions depend on the runway length [11].
As far as airports are concerned, the PSZs represent an important constraint on the territory to be considered in the land-use planning as is the case of environmental impact studies (e.g., aircraft noise and pollution [12,13]).

2. Airport Risk Plans Adopted in Italy

The Italian Civil Aviation Authority (ENAC) identifies the areas surrounding the airport subjected to constraint [14]. In addition, it establishes limitations on obstacles and potential risk to air navigation.
The local administrations must carry out their planning in full compliance with ENAC requirements.
The mitigation of accident consequences is based on:
  • human presence restriction;
  • identification of non-compatible land uses which could amplify accident consequences.
The Italian authority performs risk assessment around the airports with a traffic volume greater than 50,000 movements/year. Instead, for smaller airports, ENAC states the PSZs independently of the current air traffic. The safety zones near the airport are divided into three homogeneous sectors, characterized by increasing level of risk when approaching the runway. Figure 1 represents the zones: they have different shapes and dimensions depending on the International Civil Aviation Organization (ICAO) runway code [15].
For each zone, ENAC provides compatibility land-use for future development by preserving existing buildings. At any rate, these guidelines are most restrictive for Zone A and gradually they allow non-residential and residential use moving away from the runway, towards Zone C (Figure 1). Moreover, shopping and sports centres and intensive building, as well as transport infrastructures that could cause traffic congestion and all other high crowding land uses, should be avoided.
When analysing small and medium Italian airports, there are other relevant factors in determining possible PSZs that are more suitable to the conditions of these airports.
First, because take-off and landing operations are generally upwind, in the case of one-runway airports there is a prevalent direction of runway use. Consequently, the risk contours at the two runway ends assume distinct shapes: the risk contours at the runway end mainly concerned with landing operations are more extended than the opposite runway end. Therefore, the Risk Plan for each runway end should be different.
Secondly, the terrain of the areas surrounding airports often reduces or prevents aircraft operations along certain routes. This should be considered in order to protect areas without any risk exposure.
Finally, most of the civil Italian airports and probably most of those over the world, that have runway lengths more than 1200 m (3934 ft.), belong to ICAO category 3 or 4. As a matter of fact, these airports require the greatest Risk Plan configuration (Figure 1b, for the Italian airports), even though some of these are characterized by low air traffic. Because of this, very restrictive constraints are set on land use without an actual reason.
In Italy, as in some other countries, there is no perfect congruence between Risk Plans defined by default by the Aviation Authority and the results of risk assessment based on probability models. This article aims to propose a method to redefine the Risk Plans while considering the current number of operations on the runway. This redefinition could be considered for future changes of the existing standards.

3. Methodology for Redefining Risk Plans

3.1. Theoretical Studies on Risk Assessment in the Surrounding Areas of the Italian Airports

The redefinition of Risk Plans starts from previous studies conducted at Sapienza—University of Rome about risk assessment of air crash accidents during take-off or landing in the surrounding areas of the Italian airports with more than 30,000 annual movements and one runway. Some models to quantify the risk of aircraft accident [16,17] and the acceptance criteria [18] have been developed.
The risk assessment of the Italian airports with straight take-off and landing routes has been performed using the program named Sapienza Airport Risk Analysis (SARA) [19,20]. SARA implements methodology of third party individual risk analysis to obtain the values of aeronautical risk around a runway. The method assumes the same probabilistic curves of the Irish method [4] to calculate the risk that an aircraft along its real route may destroy an area on the ground. The program considers the actual accident rate for each type of aircraft.
The model (fully described in [19]) is composed of three sub-models: the accident occurrence model, the accident dispersion model around the runway and the accident consequences model.
The first model has been defined on the data of the international databases available online and provides the accident probability for each aircraft type and flight operation. The second model defines the transverse and longitudinal distance from the runway considering the actual routes of the aircraft. The accident location includes two probability distribution curves: the Weibull and Gamma probability density functions. The Weibull one defines the distance on an orthogonal axis to the trajectory, while the Gamma one defines the distance on the trajectory of the aircraft.
The functions have been defined for each operation and accident (i.e., take-off or landing, overrun or crash).
The examined airports have been divided into 5 categories according to the yearly number of movements:
I
Number of annual movements equal to or more than 75,000.
II
Number of annual movements equal to or more than 50,000 and less than 75,000.
III
Number of annual movements equal to or more 30,000 and less than 50,000.
IV
Number of annual movements equal to or more 10,000 and less than 30,000.
V
Number of annual movements less than 10,000.
The aircraft were grouped into the six classes established by ICAO, by the letters A to F, depending on the width of the landing gear and the wingspan. For each class, a reference airplane has been defined. The reference airplane has a maximum take-off weight (MTOW) and a risk index (IR) equal to the weighted average of the number of movements of all aircraft belonging to the same class according to the Equations (1) and (2):
M T O W W = i = 1 N M T O W i M o v i i = 1 N M o v i
I R W = i = 1 N I R i M o v i i = 1 N M o v i
where:
  • N: total number of aircraft of class x;
  • Movi: number of movements of the ith aircraft;
  • MTOWW: weighted maximum take-off weight of the reference aircraft;
  • MTOWi: maximum take-off weight of the ith aircraft;
  • IRW: weighted accident rate of the reference aircraft;
  • IRi: accident rate of the ith aircraft.
The PSZs have been defined for airports with one runway and different number of movements of commercial aviation. The sizes of the PSZs result from the risk analysis of each category of airports considering a traffic mix composed of aircraft (both passenger and cargo) with different weight and dimension. These aircraft characteristics define the consequences of the accidents and therefore the PSZs sizes. The traffic has been considered distributed as 95% on a threshold and 5% on the other one. This hypothesis reflects conditions of the majority of the Italian airports with one runway. At any rate, a variation of the distribution of traffic between the thresholds has been considered. With a traffic distribution between the thresholds equal to 40% and 60%, the PSZ length changes by 12%, while the width variation is negligible. Higher traffic variations should not be possible for airports as they would result in very frequent take-off or landing conditions non-upwind. At any rate, the results of this study are applicable only within the limits specified above.
Finally, the results have been compared with the analysis of actual airports with real traffic and airplanes and the difference are always less than 15% on the total area of the PSZ [20].
The results of the performed analysis are listed in Table 1. The category V is split in two sub-categories (V-5 and V-1) because under 1000 yearly operations the traffic mix is different (most of the aircraft belong to class A).
Only the 10−6 risk contour has been calculated (Figure 2). It defines the area within which generally restrictions on land-use are established, by considering the following levels of traffic: I100- I75- II75- II65- II50- III50- III40- III30- IV15- IV10 -V5 -V1; where the letter indicates the airport category while the number refers to the thousands of annual movements considered in the analysis. The variations of the PSZs can be evaluated for the different traffic levels on each airport category.
In the model, as confirmed in Figure 2 the two runway thresholds are conventionally indicated as North and South. Table 2 lists the area, the length and the width of the 10−6 curve on the two runway thresholds.
Figure 3 compares the 10−6 risk contour of an airport with 3000 annual movements defined with SARA and Risk Plans according to the ENAC rules and it highlights that, along the runway longitudinal axis, the ENAC constraints are applied on larger areas than necessary.

3.2. Definition of the Risk Plans according to the Risk Analysis

As a proposal, the results of this study may suggest the redefinition of Risk Plans according to the risk analysis adopted for the busiest Italian airports. This proposal is based on two main issues:
  • variable sizes of PSZs as a function of annual movements;
  • new shapes and dimensions for PSZs.
Since the 10−6 risk contour is generally considered the border of the land-use restricted zone [2,3,4,5,21], this study assumes that:
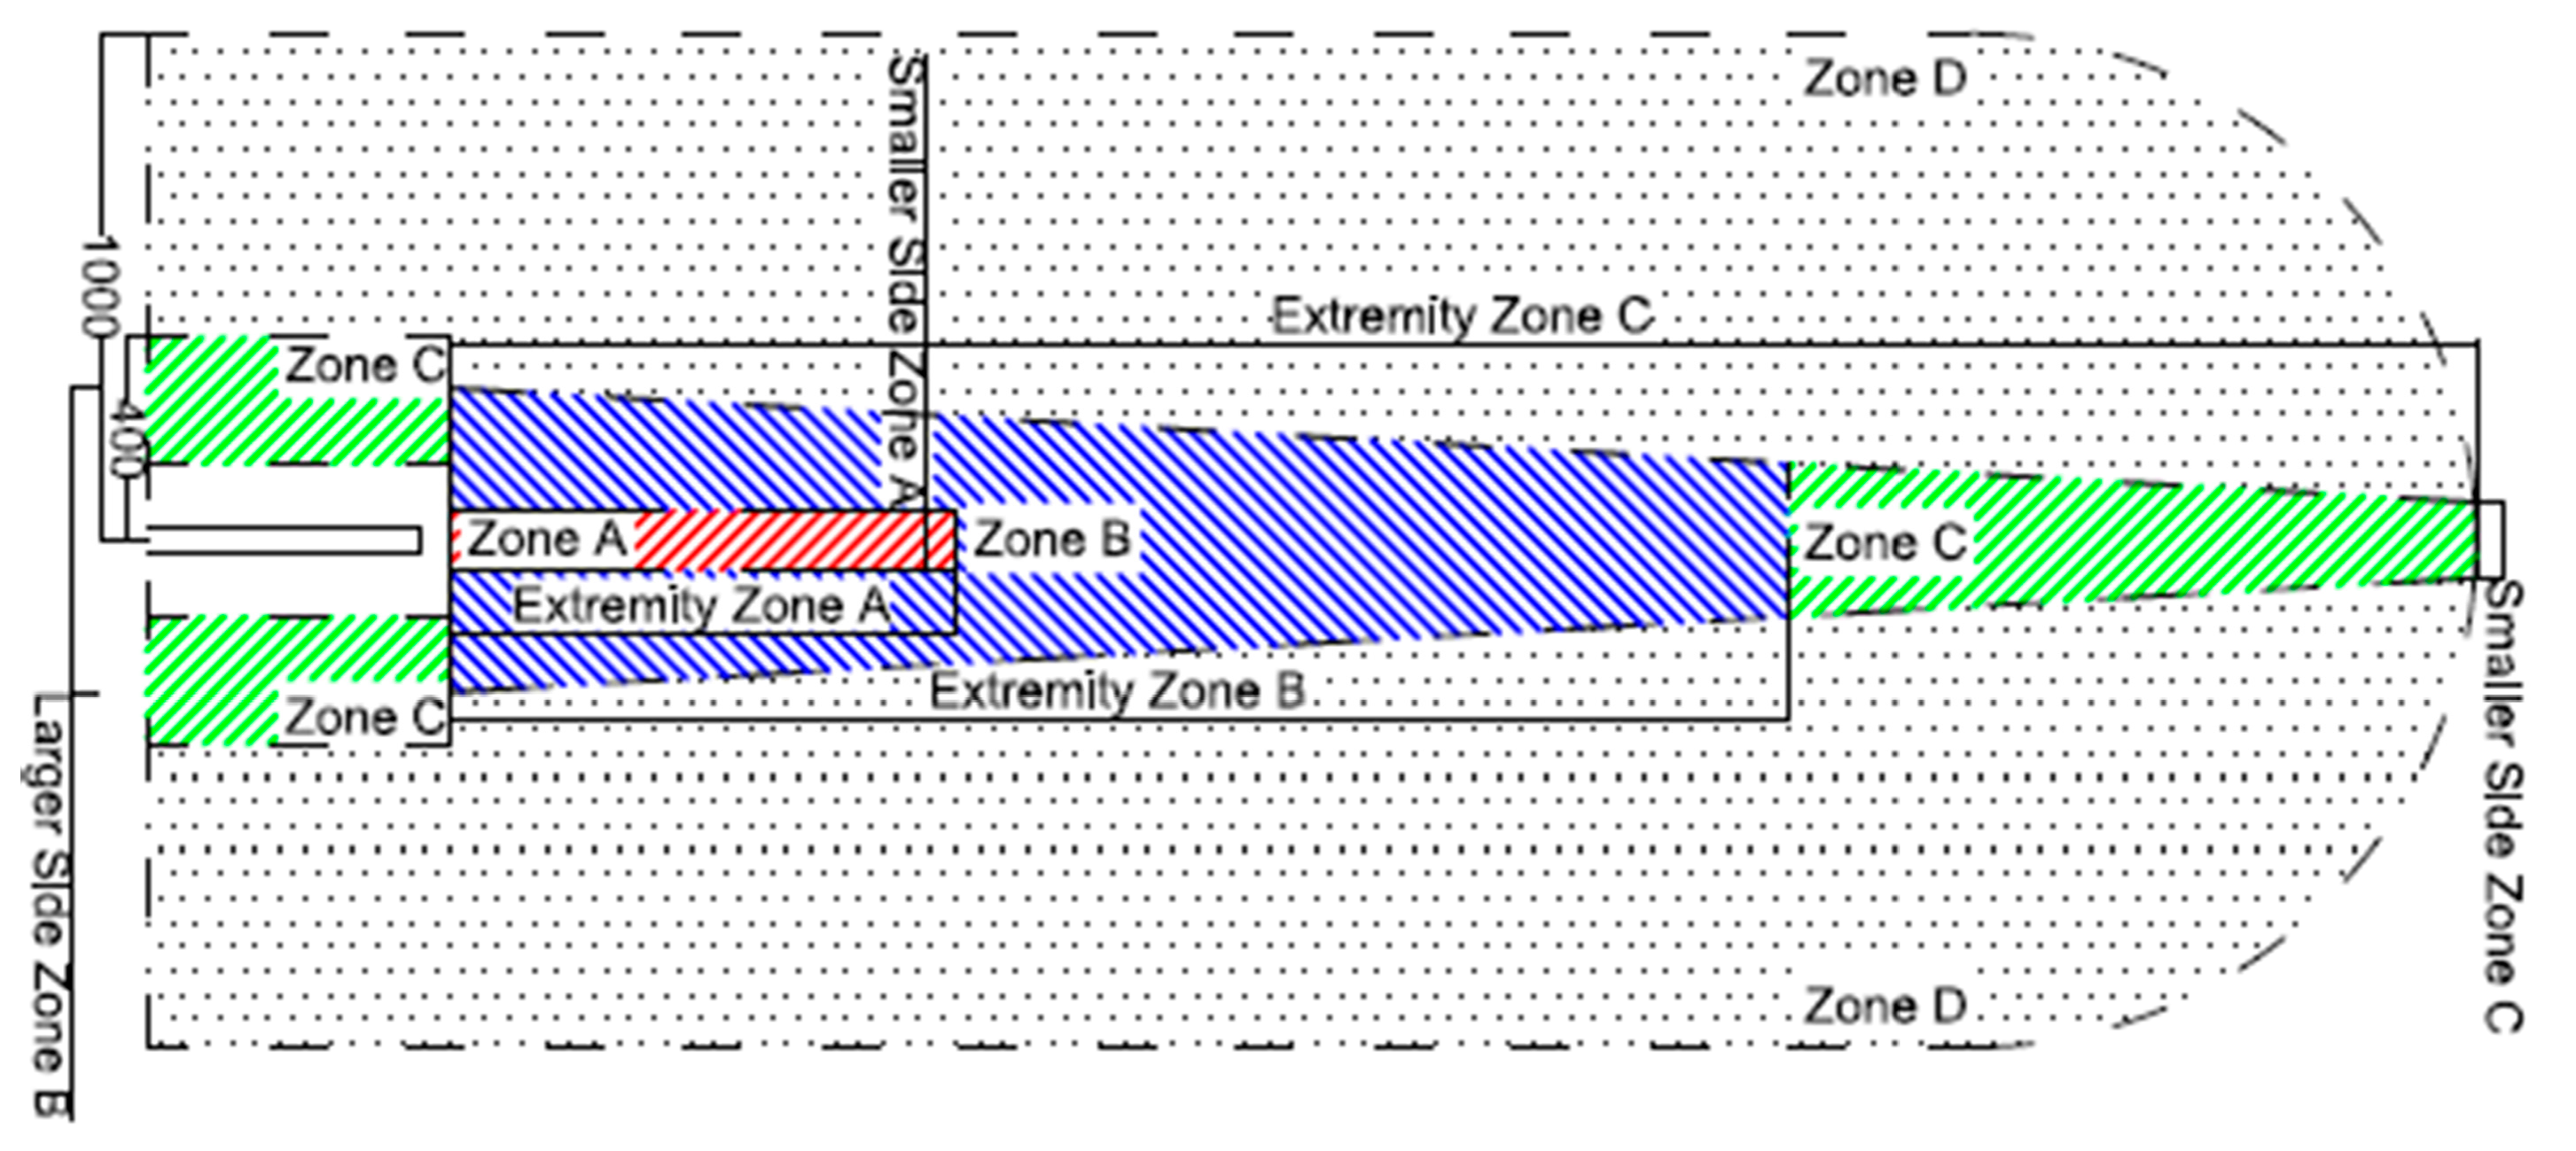
  • the boundaries of Zone C approximate 10−6 risk contour totally if there are not Zone A and Zone B; while, if there is Zone B, they approximate 10−6 risk contour only containing the most extreme area;
  • the boundaries of Zone A approximate 10−5 risk contour fully;
  • the boundaries of Zone B approximate 10−6 risk contour only containing the area between Zone A and Zone C.
Figure 4 and Figure 5 show the results, which depend on annual movements. Starting from the identification of the airport category, it is possible to draw the trapezoidal area approximating the 10−6 risk contour. Its sizes are defined as:
  • larger Side Zone B, defined as the maximum width of the Zone, near the runway;
  • smaller Side Zone C, defined as the minimum width of the Zone, near Extremity Zone C;
  • extremity Zone C, defined as the maximum distance of the runway end from the 10−6 risk contour, along the runway centreline.
The Zone A is identified by a rectangle having the following dimensions:
  • smaller Side Zone A: it is defined approximately as the width of 10−5 risk contour.
  • extremity Zone A: it is defined as the maximum distance of the runway end from the 10−5 risk contour, along the runway centreline. Its size changes for the runway ends, depending on the type of aviation operation (landing or take-off).
The Extremity Zone B is needed in order to distinguish Zone B from Zone C within the boundaries of 10−5 risk contour.
According to ENAC, the reference for this size is 1500 m (4918 ft.) [15]. In order to compare this size with the length of 10−6 risk contour, for several categories, the study needs to define the Extremity Zone B and consequently the Extremity Zone A, only for airports with more than 30,000 annual movements. The 10−6 risk contour for all other airports progressively has a length less than 1500 m (4918 ft.), while the 10−5 risk contour is often included in the airport boundary, suggesting that Zone B and Zone A are not necessary.
Table 3 lists the characteristics dimensions of the zones for landing and take-off.
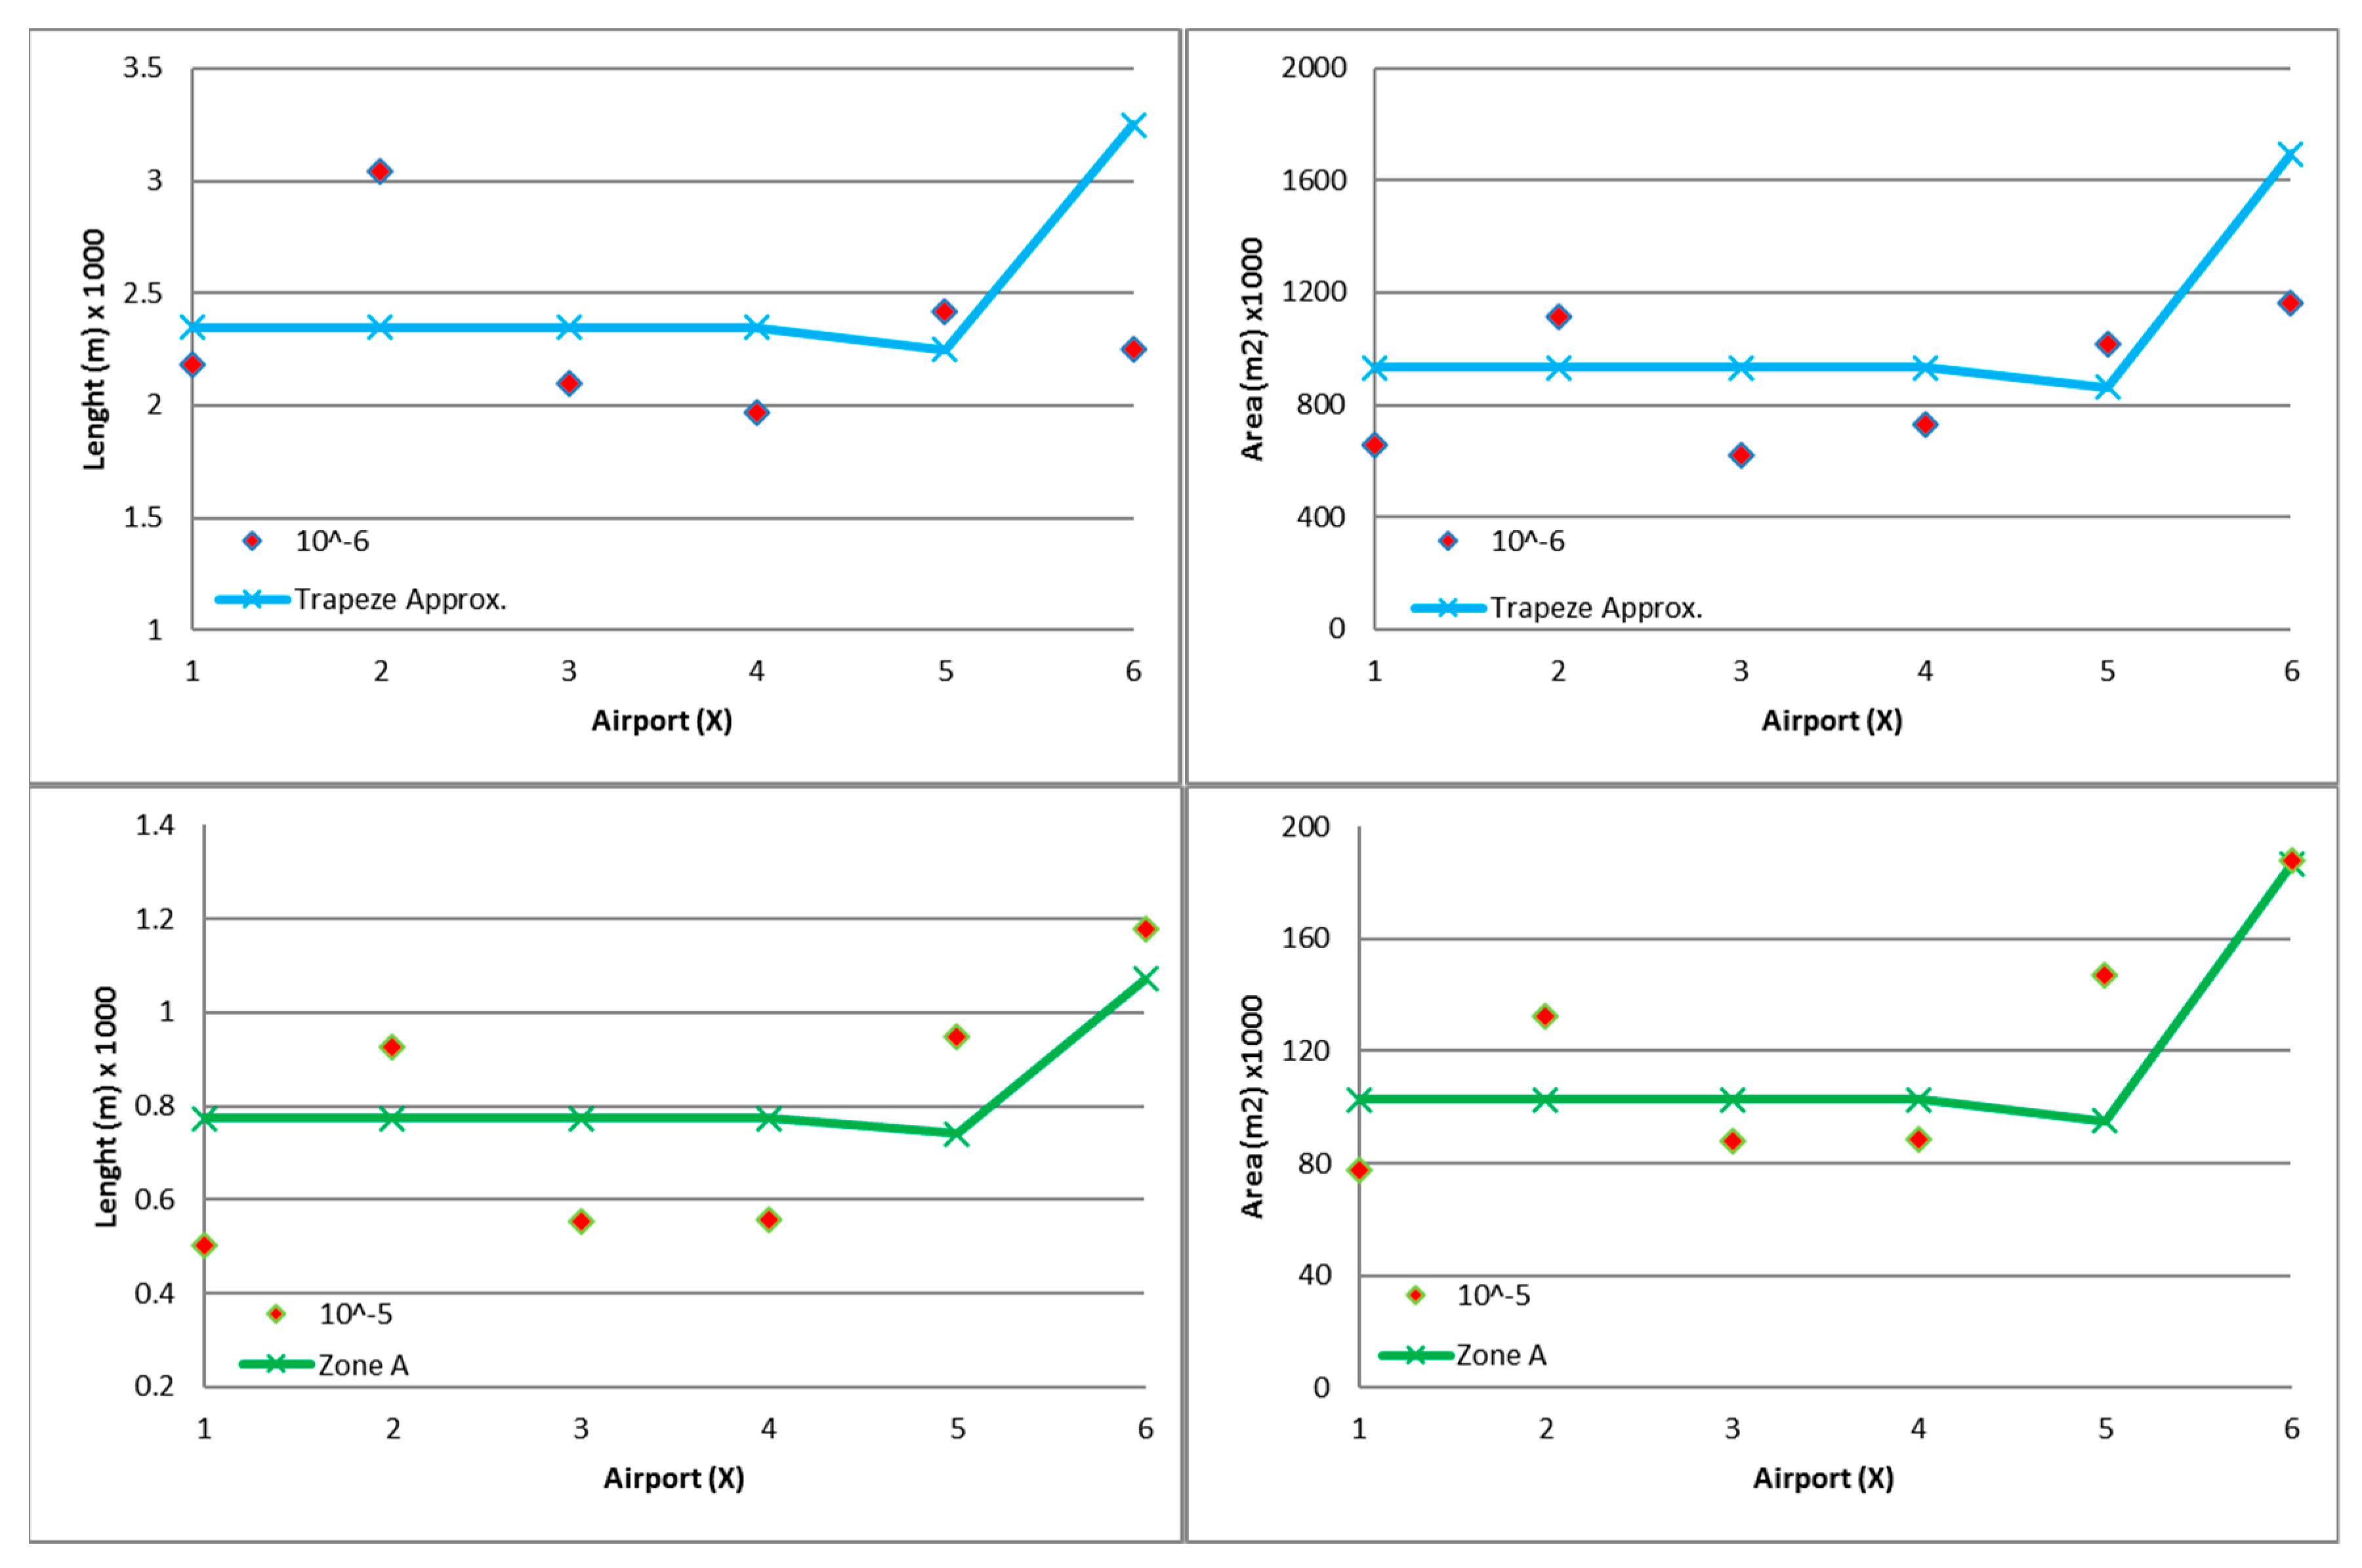
Each value has been defined to approximate, as much as possible, the risk contours derived from risk assessment for several airports. Figure 6 compares the Risk Plan Zone dimensions defined above (continuous lines) with the risk contours calculated with the SARA program (red points).
Finally, other two zones have been defined laterally to the runway:
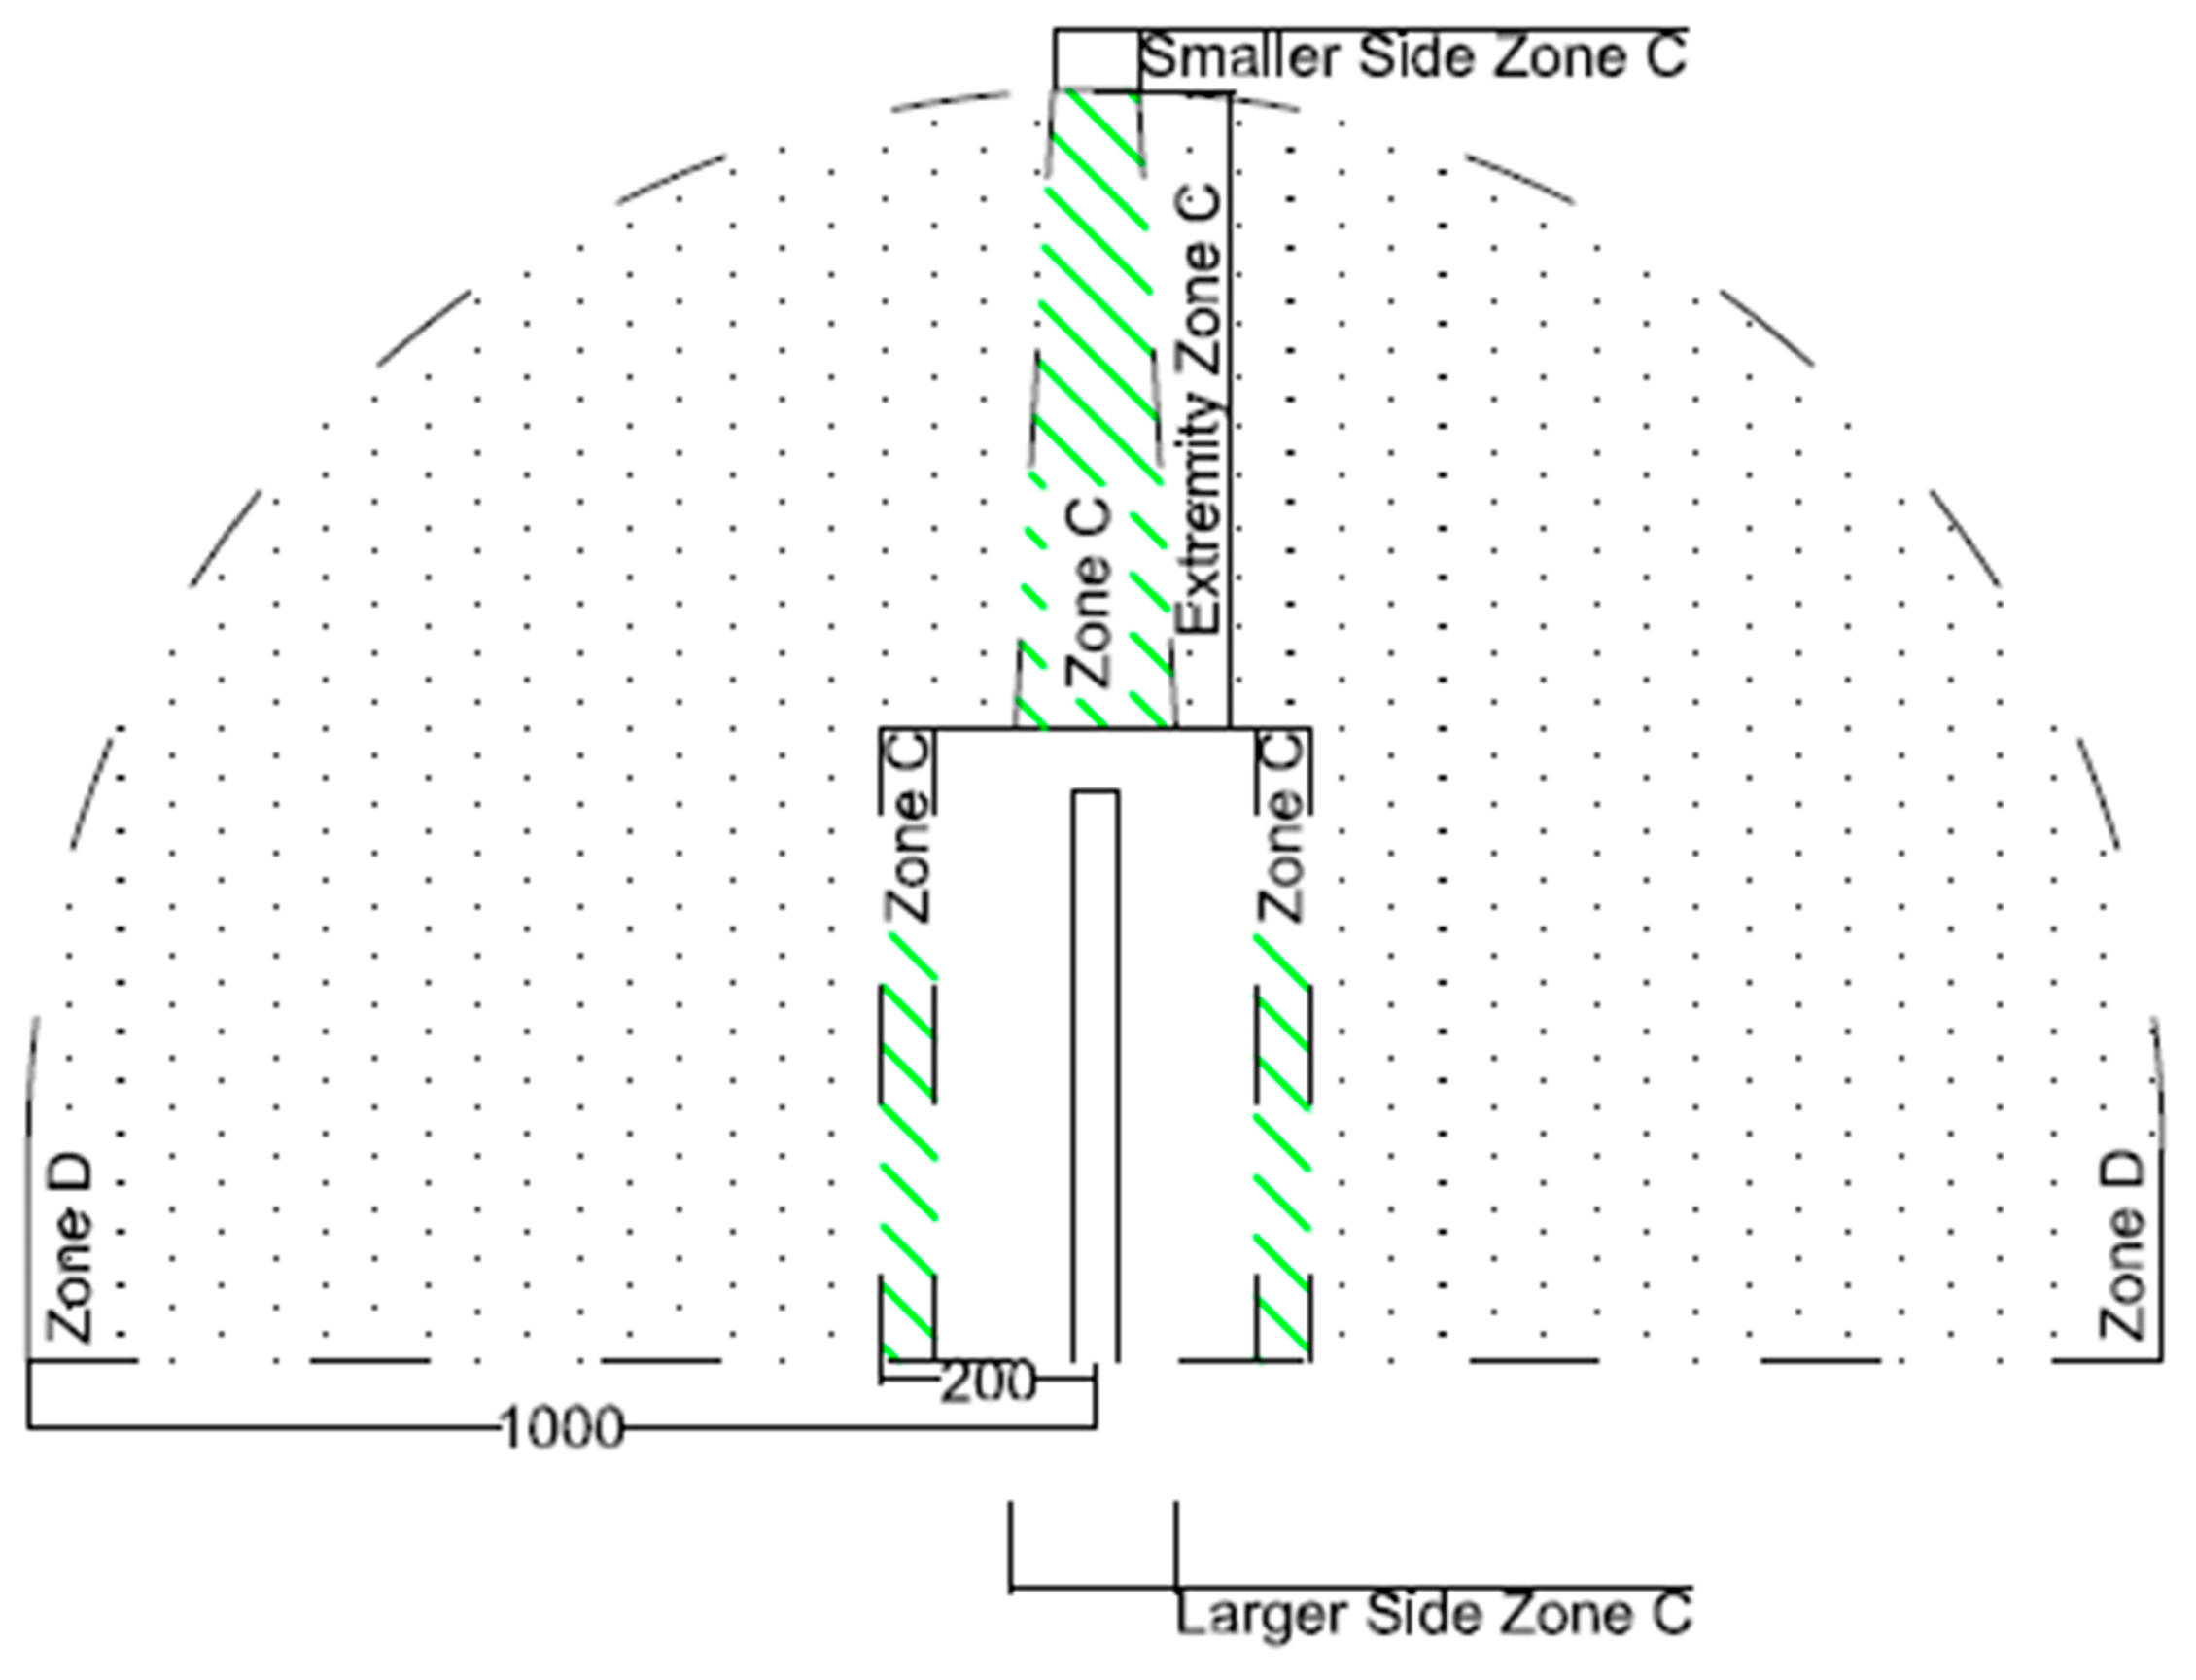
  • Zone C, extended for the entire length of the strip, with a distance of 400 m (1311 ft.) from the runway axis for A, B, C and D categories, or with a distance of 200 m (656 ft.) from the runway axis for E category, tying an area often within the airport boundary;
  • Zone D, extended for the whole length of the strip, with a distance of 1000 m (3279 ft.) from the runway axis. It continues over the runway ends for the extension of the Zone B, if present and Zone C; then it links up to end of the Zone C with a semi-circumference of 1000 m (3279 ft.) radius, for all airport categories.
This last area is the result of accident distribution analysis near airports. The sources mainly used are NTSB Aviation Accident Database [22], ASN Aviation Safety Network [23], ENAC database [8] and ICAO International Civil Aviation Organization [24]. The new Risk Plans follow the real accidents distribution, with high presence of accidents near the runway, in particular for the Zone A (Figure 7).
Moreover, Figure 8 and Figure 9 represent a comparison between the proposed new Risk Plans and the Risk Plans currently adopted in Italy (red lines).
The new Risk Plan for a V5 airport is in Figure 8. The new Risk Plan (black lines and light blue area in Figure 8) is superimposed to that one provided by the Italian regulation in force (red lines in Figure 8): the comparison shows that, for a V5 airport, the shape of the current Italian Risk Plans overestimates the areas exposed to risk. On the contrary, for a II65 airport, Figure 9 shows that the current Risk Plan underestimates the risk on one threshold and overestimates it on the other side.
The objective of the authors is not to question the current Italian Risk Plans or those of the other countries but only to highlight the importance, in the definition PSZs of carrying out an accurate risk analysis with models that take advantage of an extensive accident database, or at least with approximate methods. In this paper, the authors propose one of these methods, valid only for one-runway airports, that take into account only of the airport category and the different traffic volumes.

4. Conclusions

This study was aimed to define the shape and the dimensions of the PSZs around airports in order to protect inhabitants from the risk of air crashes. The study was performed considering the following conditions: one runway, straight take-off and landing routes and traffic volume less than 75,000 movement/year. The PSZs have been evaluated based on the risk assessment method currently adopted in Italy and the actual accident distribution around airports. The analysis shows a large difference with the current Risk Plans adopted in Italy, which only depend on the ICAO class of the runway. Indeed, many of these airports have a very low traffic even if they have a runway with the major code. The suggested shape and the dimensions of the Risk Plans result from a comparison between the third party individual risk analysis and the current Risk Plans.
The first one is a procedure based on a model that uses the real conditions of an airport (traffic, routes and dimensions). The second one is a procedure based on rules enacted by local authorities.
According to the air traffic, the new proposed plans constrain the surrounding areas fitting the results obtained from risk analysis. Especially with reference to airports with low traffic, it represents a great advantage in term of land-use if compared to current plans.

Author Contributions

Giuseppe Loprencipe and Paola Di Mascio carried out the model implementation. Giuseppe Perta analyzed the data. Giuseppe Cantisani performed the data post-processing analysis. Paola Di Mascio and Giuseppe Perta wrote sections for the first draft of the manuscript. All authors contributed to further drafts and had full access to all of the data.

Conflicts of Interest

The authors declare no conflict of interest.

References

  1. Boeing Commercial Airplanes. Statistical Summary of Commercial Jet Airplane Accidents Worldwide Operations 1959–2015; Boeing Commercial Airplanes: Seattle, WA, USA, 2016. [Google Scholar]
  2. DfT Circular 01/2010. Control of Development in Airport Public Safety Zones; Department for Transport: London, UK, 2010.
  3. Smith, E. Third Party Risk. UK Sustainable Cities and Aviation Network; Report; National Aerospace Laboratory NLR: Amsterdam, The Netherlands, 2000. [Google Scholar]
  4. Environmental Resources Management Ireland Ltd. Calculation of Third Party Individual Risk: Determining PSZs for Airports; ERM: Dublin, Ireland, 2005. [Google Scholar]
  5. NLR, AA.VV. Third Party Risk Analysis for Aircraft Accidents around Airports; Report; National Aerospace Laboratory NLR: Amsterdam, The Netherlands, 2000. [Google Scholar]
  6. Ale, B.J.M.; Piers, M. The assessment and management of third party risk around a major airport. J. Hazard. Mater. 2000, 71, 1–16. [Google Scholar] [CrossRef]
  7. Pikaar, C.J.M.; De, J.; Weijts, J. An Enhanced Method for the Calculation of Third Party Risk around Large Airports with Application to Schiphol; NLR-CR-2000-147; NLR Amsterdam: Amsterdam, The Netherlands, 2000. [Google Scholar]
  8. Cardi, A.; Di Mascio, P.; Di Vito, M.; Pandolfi, C. Distribution of air accidents around runways. Procedia Soc. Behav. Sci. 2012, 53, 861–870. [Google Scholar] [CrossRef]
  9. Moretti, L.; Di Mascio, P.; Nichele, S.; Cokorilo, O. Runway veer-off accidents: Quantitative risk assessment and risk reduction measures. Saf. Sci. 2018, 104, 157–163. [Google Scholar] [CrossRef]
  10. California Department of Transportation (CDP). California Airport Land Use Planning Handbook; State of California, Department of Transportation, Division of Aeronautics: Sacramento, CA, USA, October 2011.
  11. Airport Cooperative Research Program (ACRP) Report 27. Enhancing Airport Land Use Compatibility Volume 1: Land Use Fundamentals and Implementation Resources; The National Academies Press: Washington, DC, USA, 2010; ISBN 978-0-309-43094-4. [Google Scholar] [CrossRef]
  12. Ho-Huu, V.; Hartjes, S.; Visser, H.G.; Curran, R. An Efficient Application of the MOEA/D Algorithm for Designing Noise Abatement Departure Trajectories. Aerospace 2017, 4, 54. [Google Scholar] [CrossRef]
  13. Sarrat, C.; Aubry, S.; Chaboud, T.; Lac, C. Modelling Airport Pollutants Dispersion at High Resolution. Aerospace 2017, 4, 46. [Google Scholar] [CrossRef]
  14. Italian Legislative Decree ILD of 9-5-2005 n. 96. Revisione Della Parte Aeronautica del Codice Della Navigazione, a Norma Dell’articolo 2 Della L. 9 Novembre 2004, n. 265; Published by the Italian Official Gazette of 8-6-2005, n. 131, S.O.; Italian Official Gazette: Rome, Italy, 2005. (In Italian) [Google Scholar]
  15. ENAC Ente Nazionale per L’aviazione Civile (Italian Civil Aviation Authority). Regolamento per la Costruzione e L’esercizio Degli Aeroporti; Edition n. 21-10-2003; Italian Civil Aviation Authority: Rome, Italy, 2003.
  16. Čokorilo, O. Quantified risk assessment modelling of aircraft landing operations. Sci. Res. Essays 2011, 6, 4406–4413. [Google Scholar]
  17. Moretti, L.; Cantisani, G.; Caro, S. Airport veer-off risk assessment: An Italian case study. ARPN J. Eng. Appl. Sci. 2017, 12, 900–912. [Google Scholar]
  18. Guarascio, M.; Lombardi, M.; Rossi, G.; Sciarra, G. Risk analysis and acceptability criteria. WIT Trans. Built Environ. 2007, 94, 8. [Google Scholar] [CrossRef]
  19. Attaccalite, L.; Di Mascio, P.; Loprencipe, G.; Pandolfi, C. Risk assessment around airport. Procedia Soc. Behav. Sci. 2012, 53, 851–860. [Google Scholar] [CrossRef]
  20. Di Mascio, P.; Loprencipe, G. Risk analysis in the surrounding areas of one-runway airports: A methodology to preliminary calculus of PSZs dimensions. ARPN J. Eng. Appl. Sci. 2016, 11, 13641–13649. [Google Scholar]
  21. ENAC Ente Nazionale per L’aviazione Civile (Italian Civil Aviation Authority). Policy di Attuazione Dell’art. 715 Del Codice Della Navigazione. Definizione Della Metodologia e Della Policy di Attuazione del Risk Assessment; Edition. n. 12-01-2010; Italian Civil Aviation Authority: Rome, Italy, 2010. (In Italian)
  22. National Transportation Safety Board. Available online: http://www.ntsb.gov/_layouts/ntsb.aviation/index.aspx (accessed on 15 March 2017).
  23. Aviation Safety Network. Available online: https://aviation-safety.net/ (accessed on 15 March 2017).
  24. ICAO International Civil Aviation Organization Accident Investigation Section. Available online: http://www.icao.int/safety/airnavigation/AIG/Pages/default.aspx (accessed on 15 March 2017).
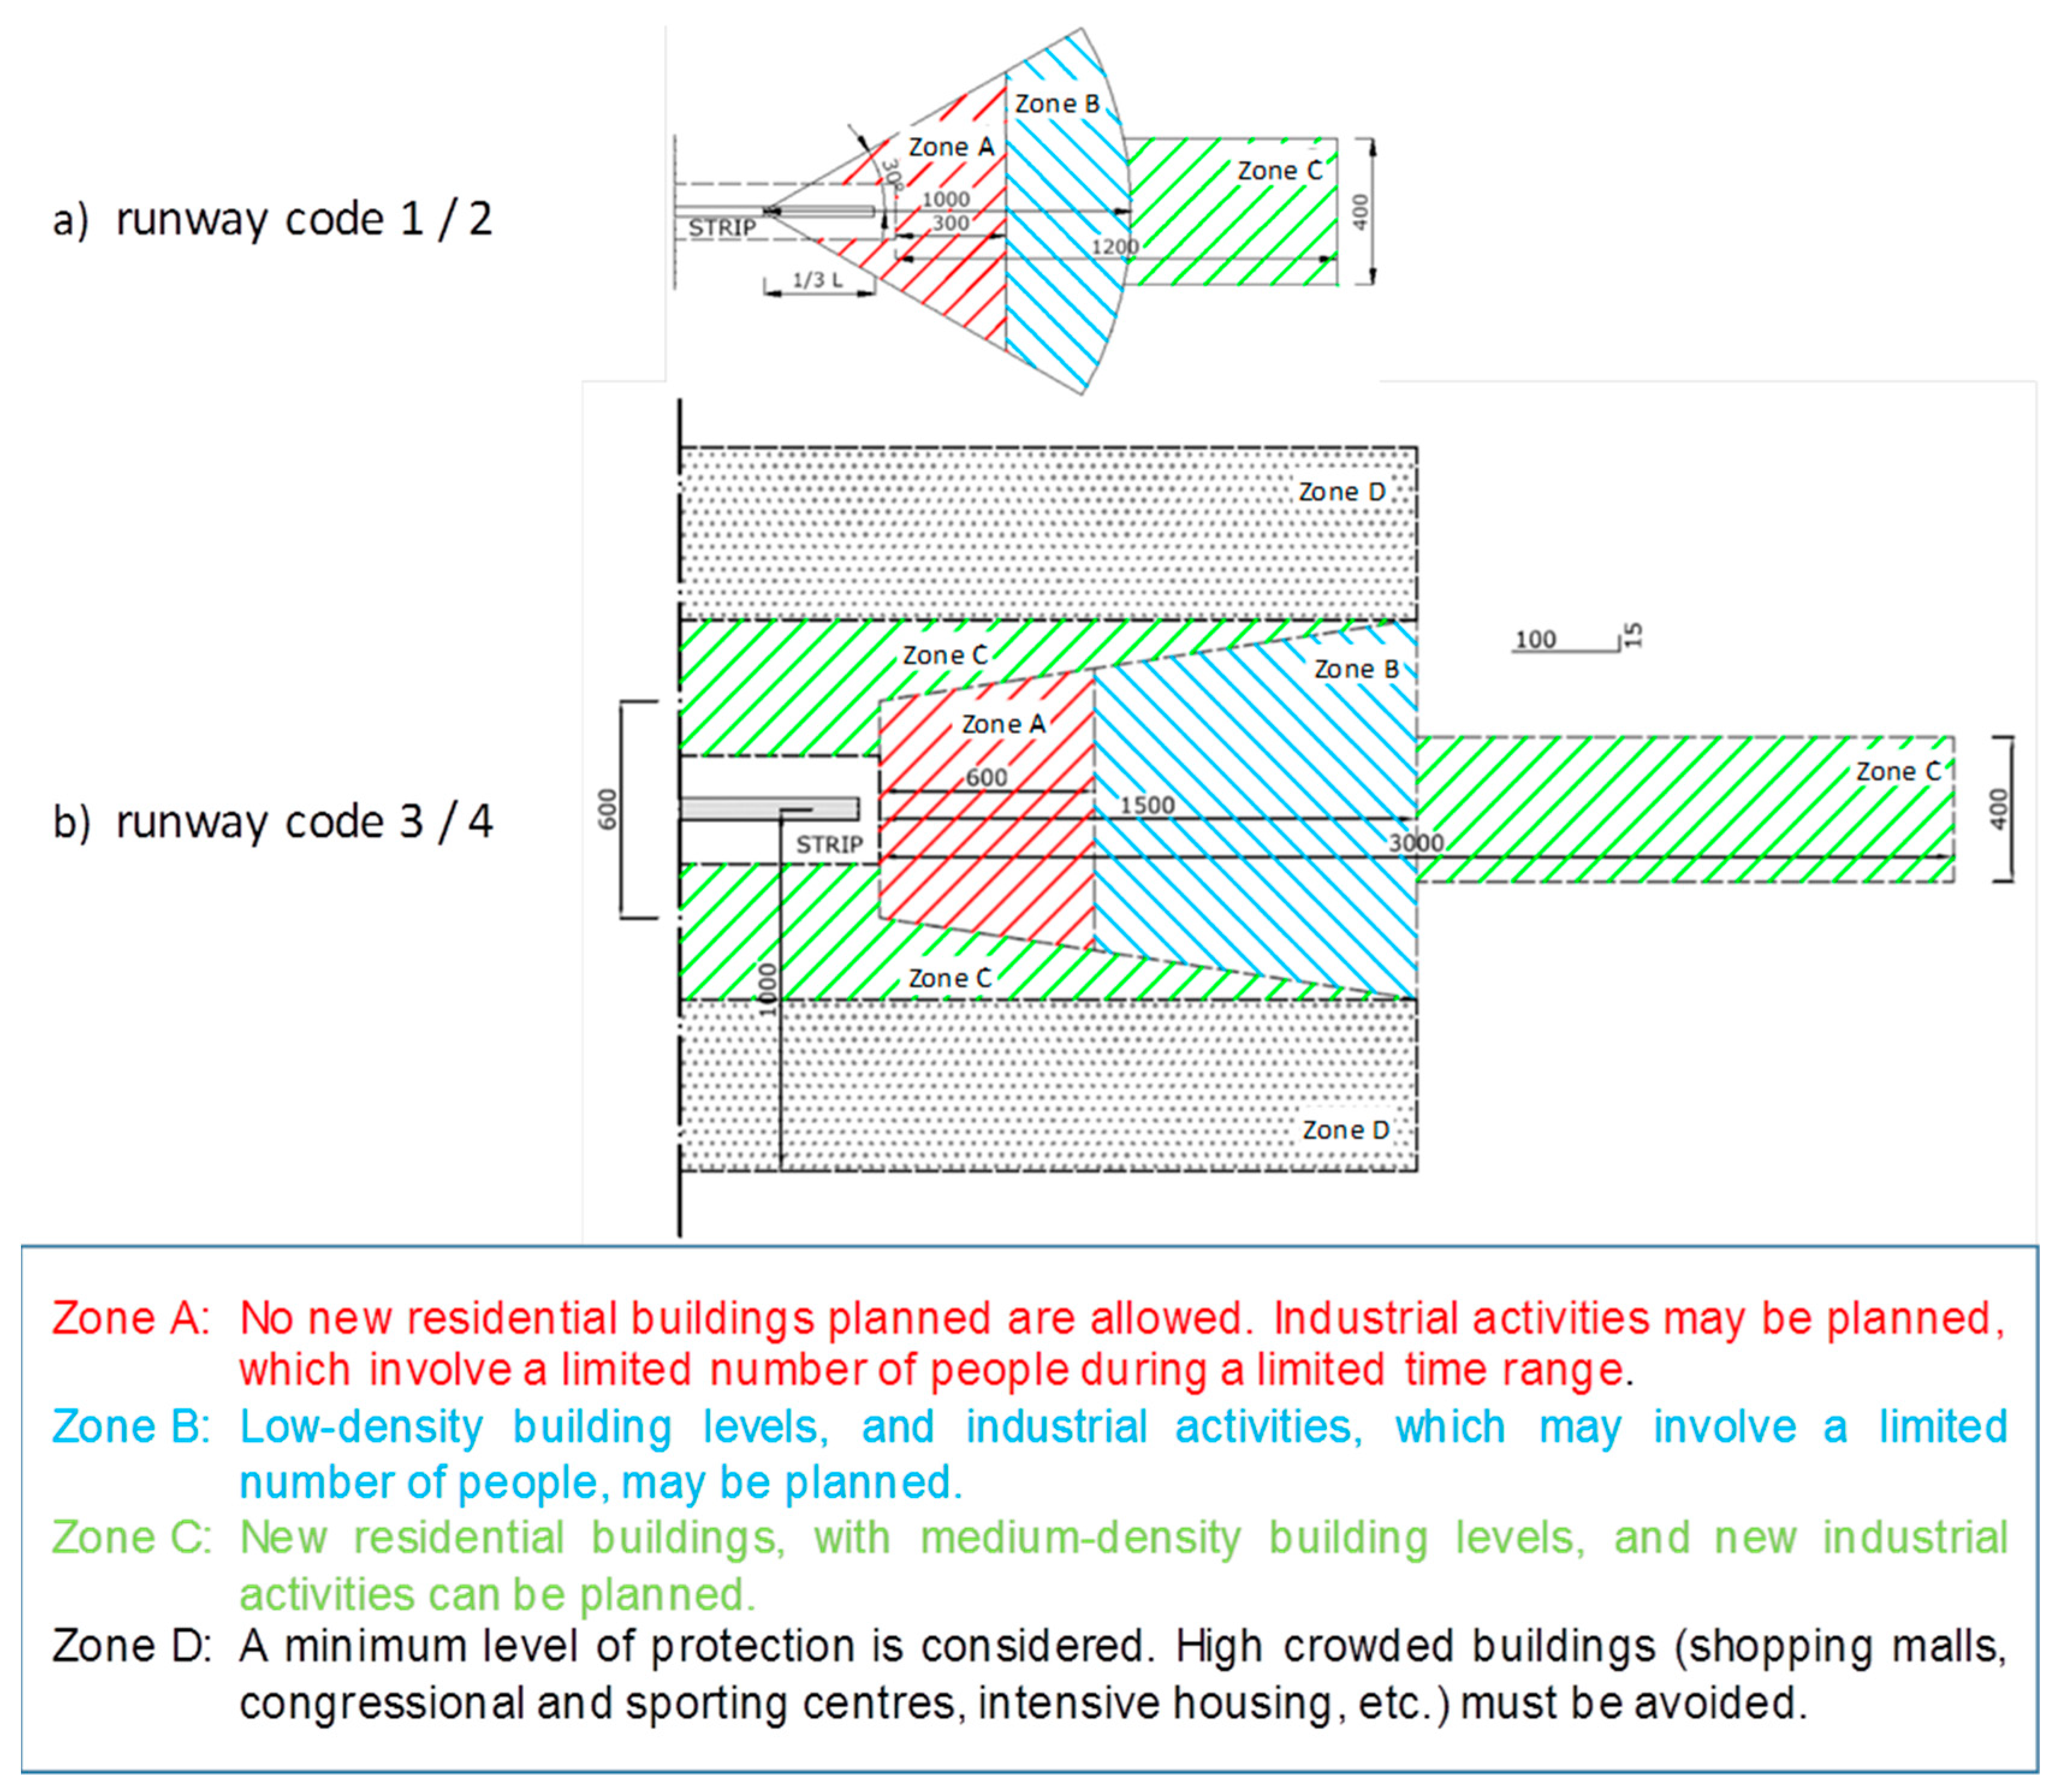
Figure 1. Risk Plans adopted in Italy for different International Civil Aviation Organization (ICAO) runway codes.
Aerospace 05 00046 g001
Figure 2. Scheme of the risk contours related to a runway.
Aerospace 05 00046 g002
Figure 3. Risk Plans (green lines) compared to 10−6 risk contour (red lines) for low traffic airports.
Aerospace 05 00046 g003
Figure 4. New proposed Risk Plans for airports with 30,000 or more annual movements.
Aerospace 05 00046 g004
Figure 5. New proposed Risk Plans for airports with less than 30,000 annual movements.
Aerospace 05 00046 g005
Figure 6. Comparison between new Risk PSZs and risk assessment curves, in terms of area and length.
Aerospace 05 00046 g006
Figure 7. Accidents Distribution around runway.
Aerospace 05 00046 g007
Figure 8. Risk Plan for a V5 airport.
Aerospace 05 00046 g008
Figure 9. Risk Plan for a II 65 airport.
Aerospace 05 00046 g009
Table 1. Airport classification results.
Percentage
Airplane ClassABCDEF
Airport Category
I0.010.4498.960.540.040.01
II1.005.2288.704.980.090.01
III0.501.9293.902.431.240.01
IV18.003.3278.68000
V-525.005.8869.12000
V-170.002.3527.65000
MTOW (t)
Airplane ClassABCDEF
Airport Category
I91668172270405
II91757111212405
III91559133175405
IV83774000
V86276000
IR
Airplane ClassABCDEF
Airport Category
I0.010.470.270.540.010.79
II0.630.880.210.380.200.79
III0.240.690.230.460.340.80
IV0.060.020.26000
V0.060.540.26000
Table 2. Sizes of Public Safety Zones (PSZs) for each airport category and for different traffic volumes.
Area NWidth NLength N Area SWidth SLength S
(m2) × 1000(yd2) × 1000(m)(ft.)(m)(ft.)(m2) × 1000(yd2) × 1000(m)(ft.)(m)(ft.)
I-100145917458702852325010,656281733708502787665021,803
I-7510361239730239327008852206324687102328555018,197
II-759961191720236126508689199223837002295545017,869
II-65833996660216423507705170020336502131495016,230
II-50605724570186919506393126115085501803410013,443
III-50776928640209822507377159219046202033475015,574
III-40594711560183619506393123414765501803405013,279
III-3041649848015741550508288010534601508325010,656
IV1525931034011151380452534541330098416205311
IV10153183280918930304923728324078714704820
V512715224078788028851141361605258802885
V1495914045943014102429100328270885
Table 3. Characteristic dimensions of the zones, for landing or take-off operations.
Landing
Larger Side Zone BSmaller Side Zone CExtremity Zone CExtremity Zone BSmaller Side Zone AExtremity Zone A
(m)(ft.)(m)(ft.)(m)(ft.)(m)(ft.)(m)(ft.)(m)(ft.)
C1008512790170557664821,797371612,18417055711303705
C757142341143469554718,187310110,1671434699433092
B756992292140459544717,859304599841404599263036
B656452115129423494716,220276590661294238412757
B505511807110361409713,433229075081103616962282
A506212036124407474715,564265386981244078072646
A405451787109357404713,269226274161093576882256
A30459150592302324610,64318145948923025521810
D15 3009848026216205311------
D10 2407878026214704820------
E5160525802628802885------
E1 10032880262270885------
Take-Off
Larger Side Zone BSmaller Side Zone CExtremity Zone CExtremity Zone BSmaller Side Zone AExtremity Zone A
(m)(ft.)(m)(ft.)(m)(ft.)(m)(ft.)(m)(ft.)(m)(ft.)
C1008692849174570324910,6521816595417457010723515
C75733240314748226978843150849441474828902918
B75718235414447226478679148048521444728742866
B65662217013243323487698131243021324337752541
B50569186611437419476384108835671143746432108
A50640209812842022487370125741211284207422433
A40563184611337019476384108835671133706432108
A30479157096315154750728652836963155111675
D15 34011158026213804525------
D10280918802629303049------
E5240787802628802885------
E1140459802624301410------