Simulation-Based Virtual Cycle for Multi-Level Airport Analysis
Abstract
1. Introduction
2. Literature Review
3. Methodological Approach
- (1)
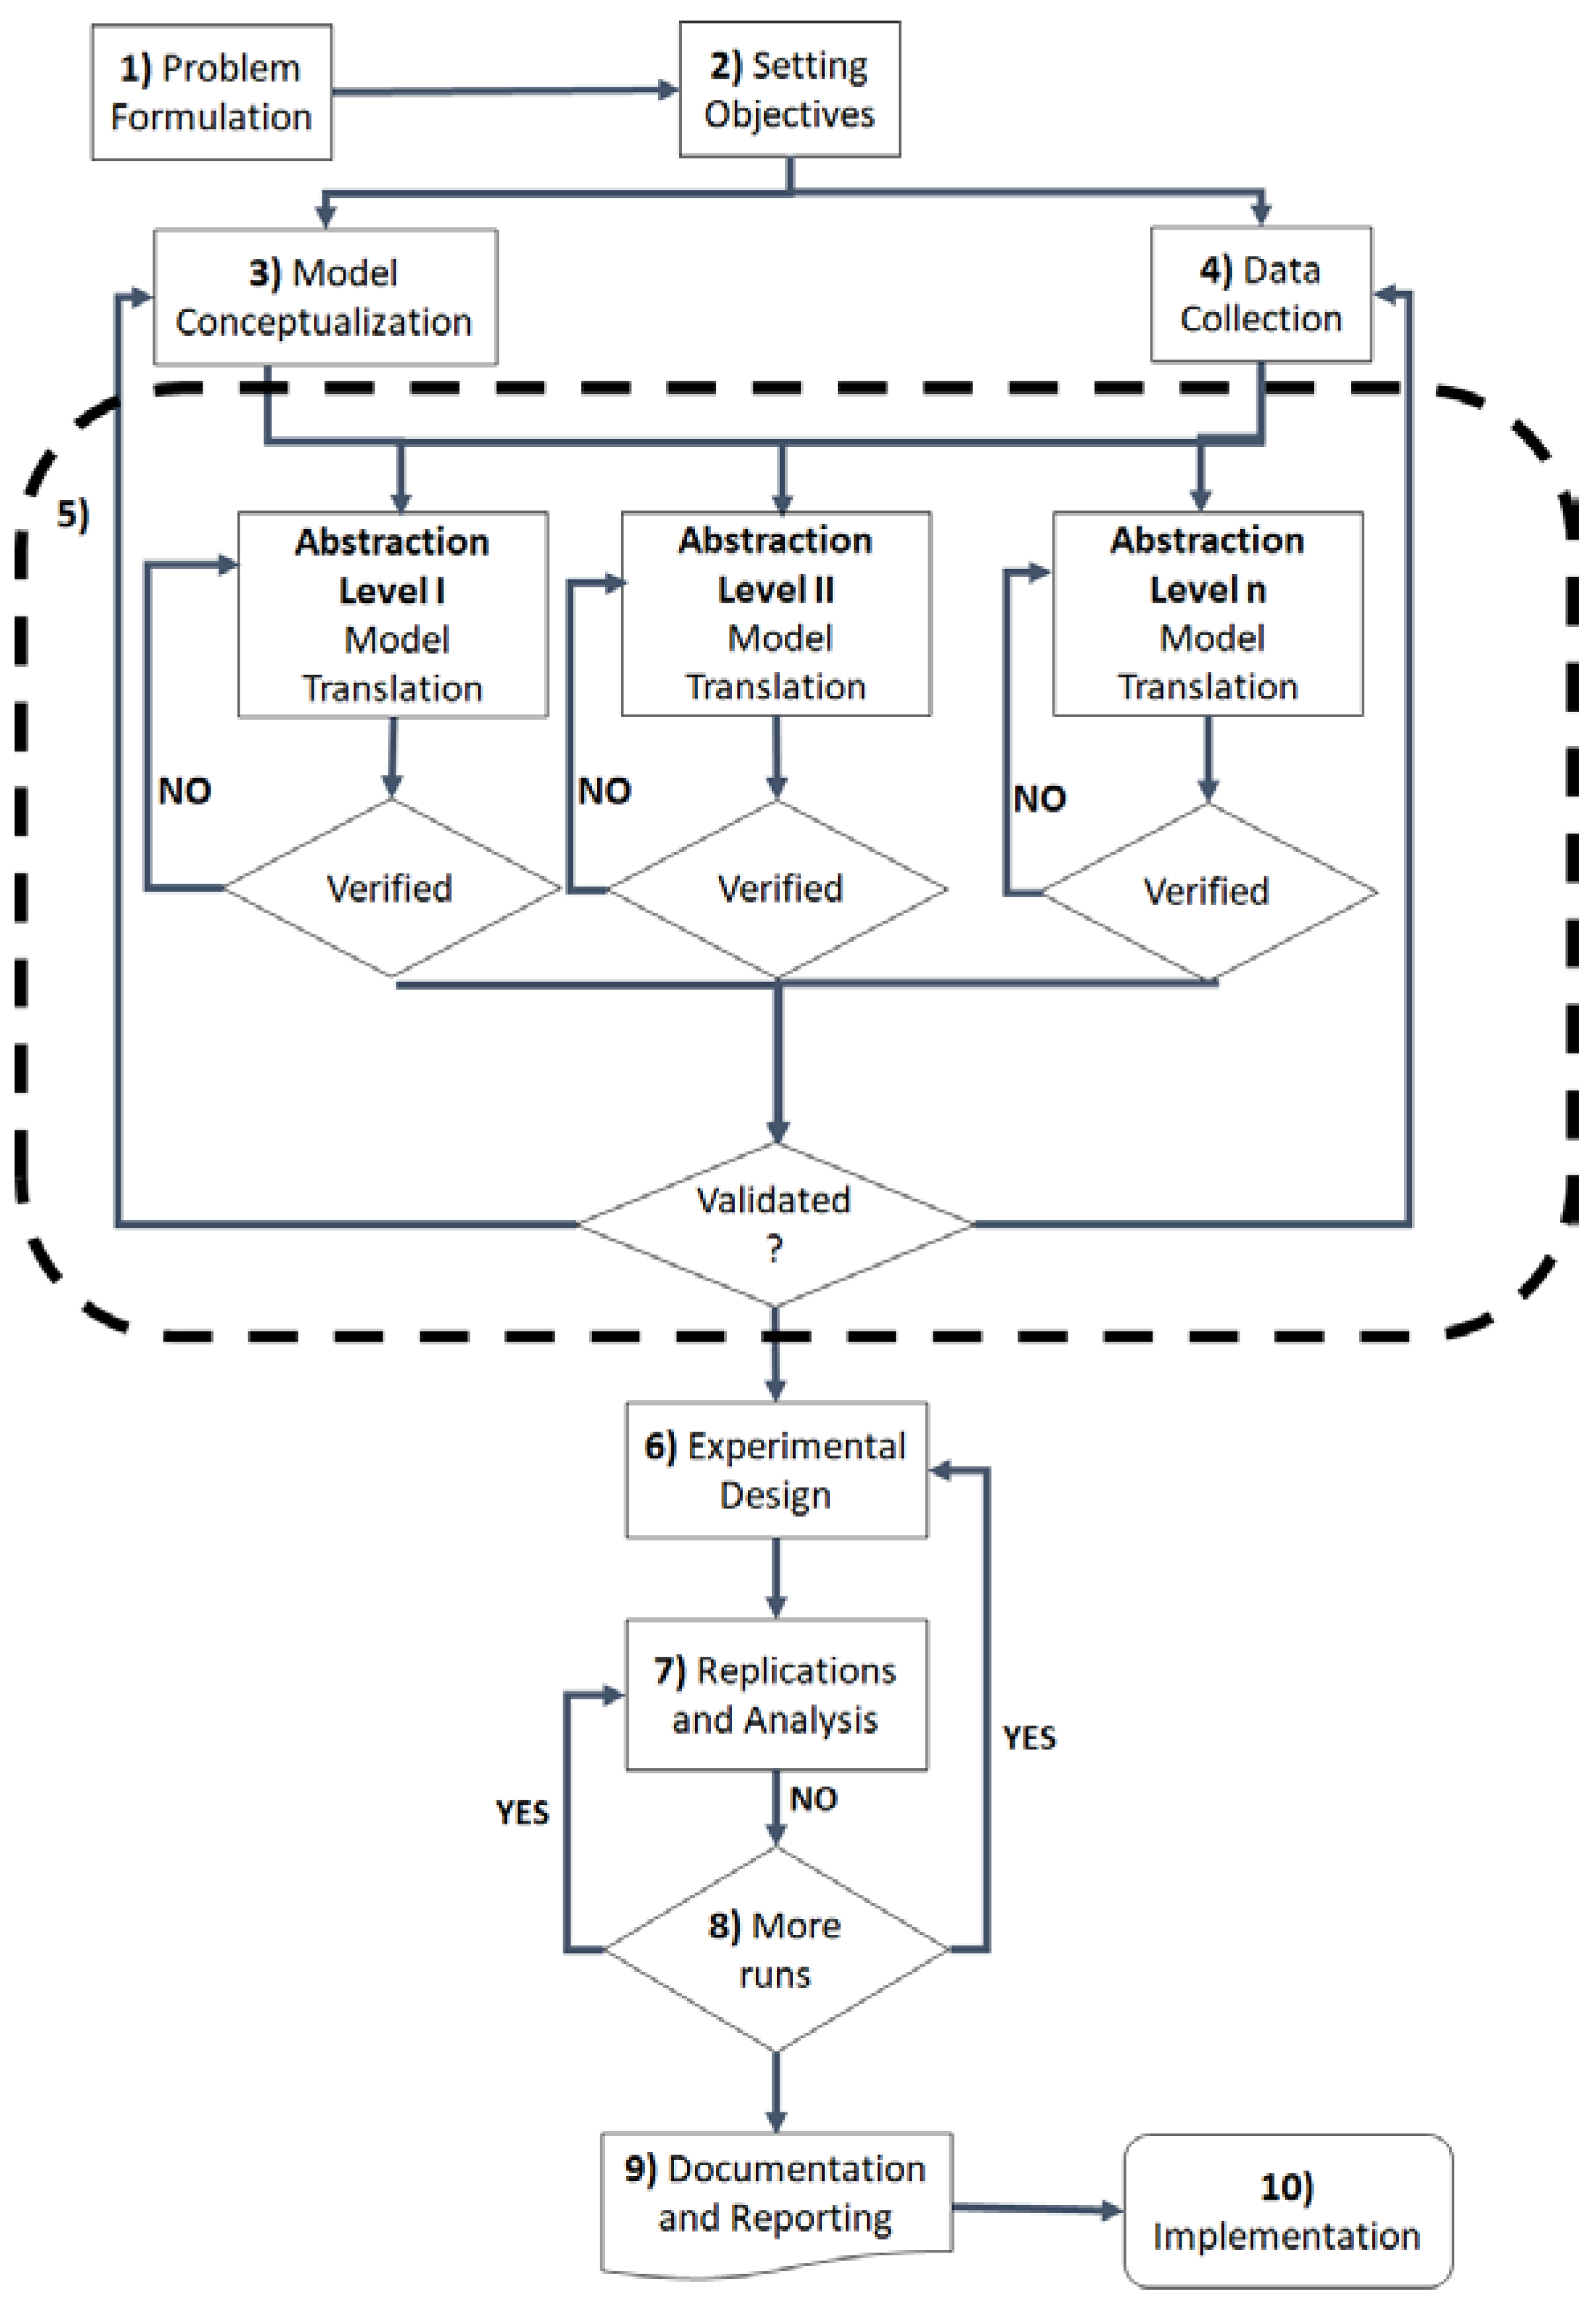
- Problem formulation. In this step, the problem under study should be clearly described making use of descriptive elements that help to provide a clear understanding of the nature of the problem.
- (2)
- Setting objectives. Based on the problem formulation, the analyst should set the objectives pursued by the study. This step is fundamental, since it will determine different key decisions, such as the abstraction level and boundaries of the study (i.e., what is included and what is excluded).
- (3)
- Model conceptualization. In this step, as described in [20], the logic of the model and the artefacts that are within the scope of the model are defined. The analyst can make use of descriptive tools like flowcharts or Petri nets for this task.
- (4)
- Data collection. This step will iterate with the previous elements to identify the data that is required beforehand, what sources of data are available, and which need to be collected or not.
- (5)
- Model translation, verification and validation (V&V). It is in this step that the proposed methodology differs from those presented by other authors. In this case, the models with different abstraction levels are developed and verified. If the data and information is available, then the different models are validated. This step is a combination of models, which can number more than two, but the modelling effort will depend directly on the number of models to be developed.
- (6)
- Experimentation. In this step, and once the model(s) are validated, an experimental design is performed, making use of the different developed models and identifying the outcomes that should be in line with the objective stated. The experimental design can be a complex process, since it must deal not only with the combinatorial nature of the decision variables of each model but also with the outcomes of the interaction of the models once the cycle is progressing, as the example below illustrates.
- (7)
- Replications and analysis. This corresponds to the definition of the sample size of the model and the analysis of the data it generates. In comparison with standard methodology, this activity is more time-consuming, since the number of replications will increase linearly with the number of models in the cycle.
- (8)
- Documentation and reporting. This step relates to the description of the analysis and the reporting of results used by decision-makers.
- (9)
- Implementation. In the best situation, the insight gained from the analysis with the model(s) is implemented in the real system. However, this step does not always imply that the suggestions are implemented, but if the model is developed during the planning phase of a project, the results will serve to make corrections to the original plan. With this action, the risk of failure or over-/under-design are minimized in infrastructure projects.
4. Example Case: Airport of Lelystad, The Netherlands
4.1. Model Interaction Architecture
4.2. Model A Characteristics
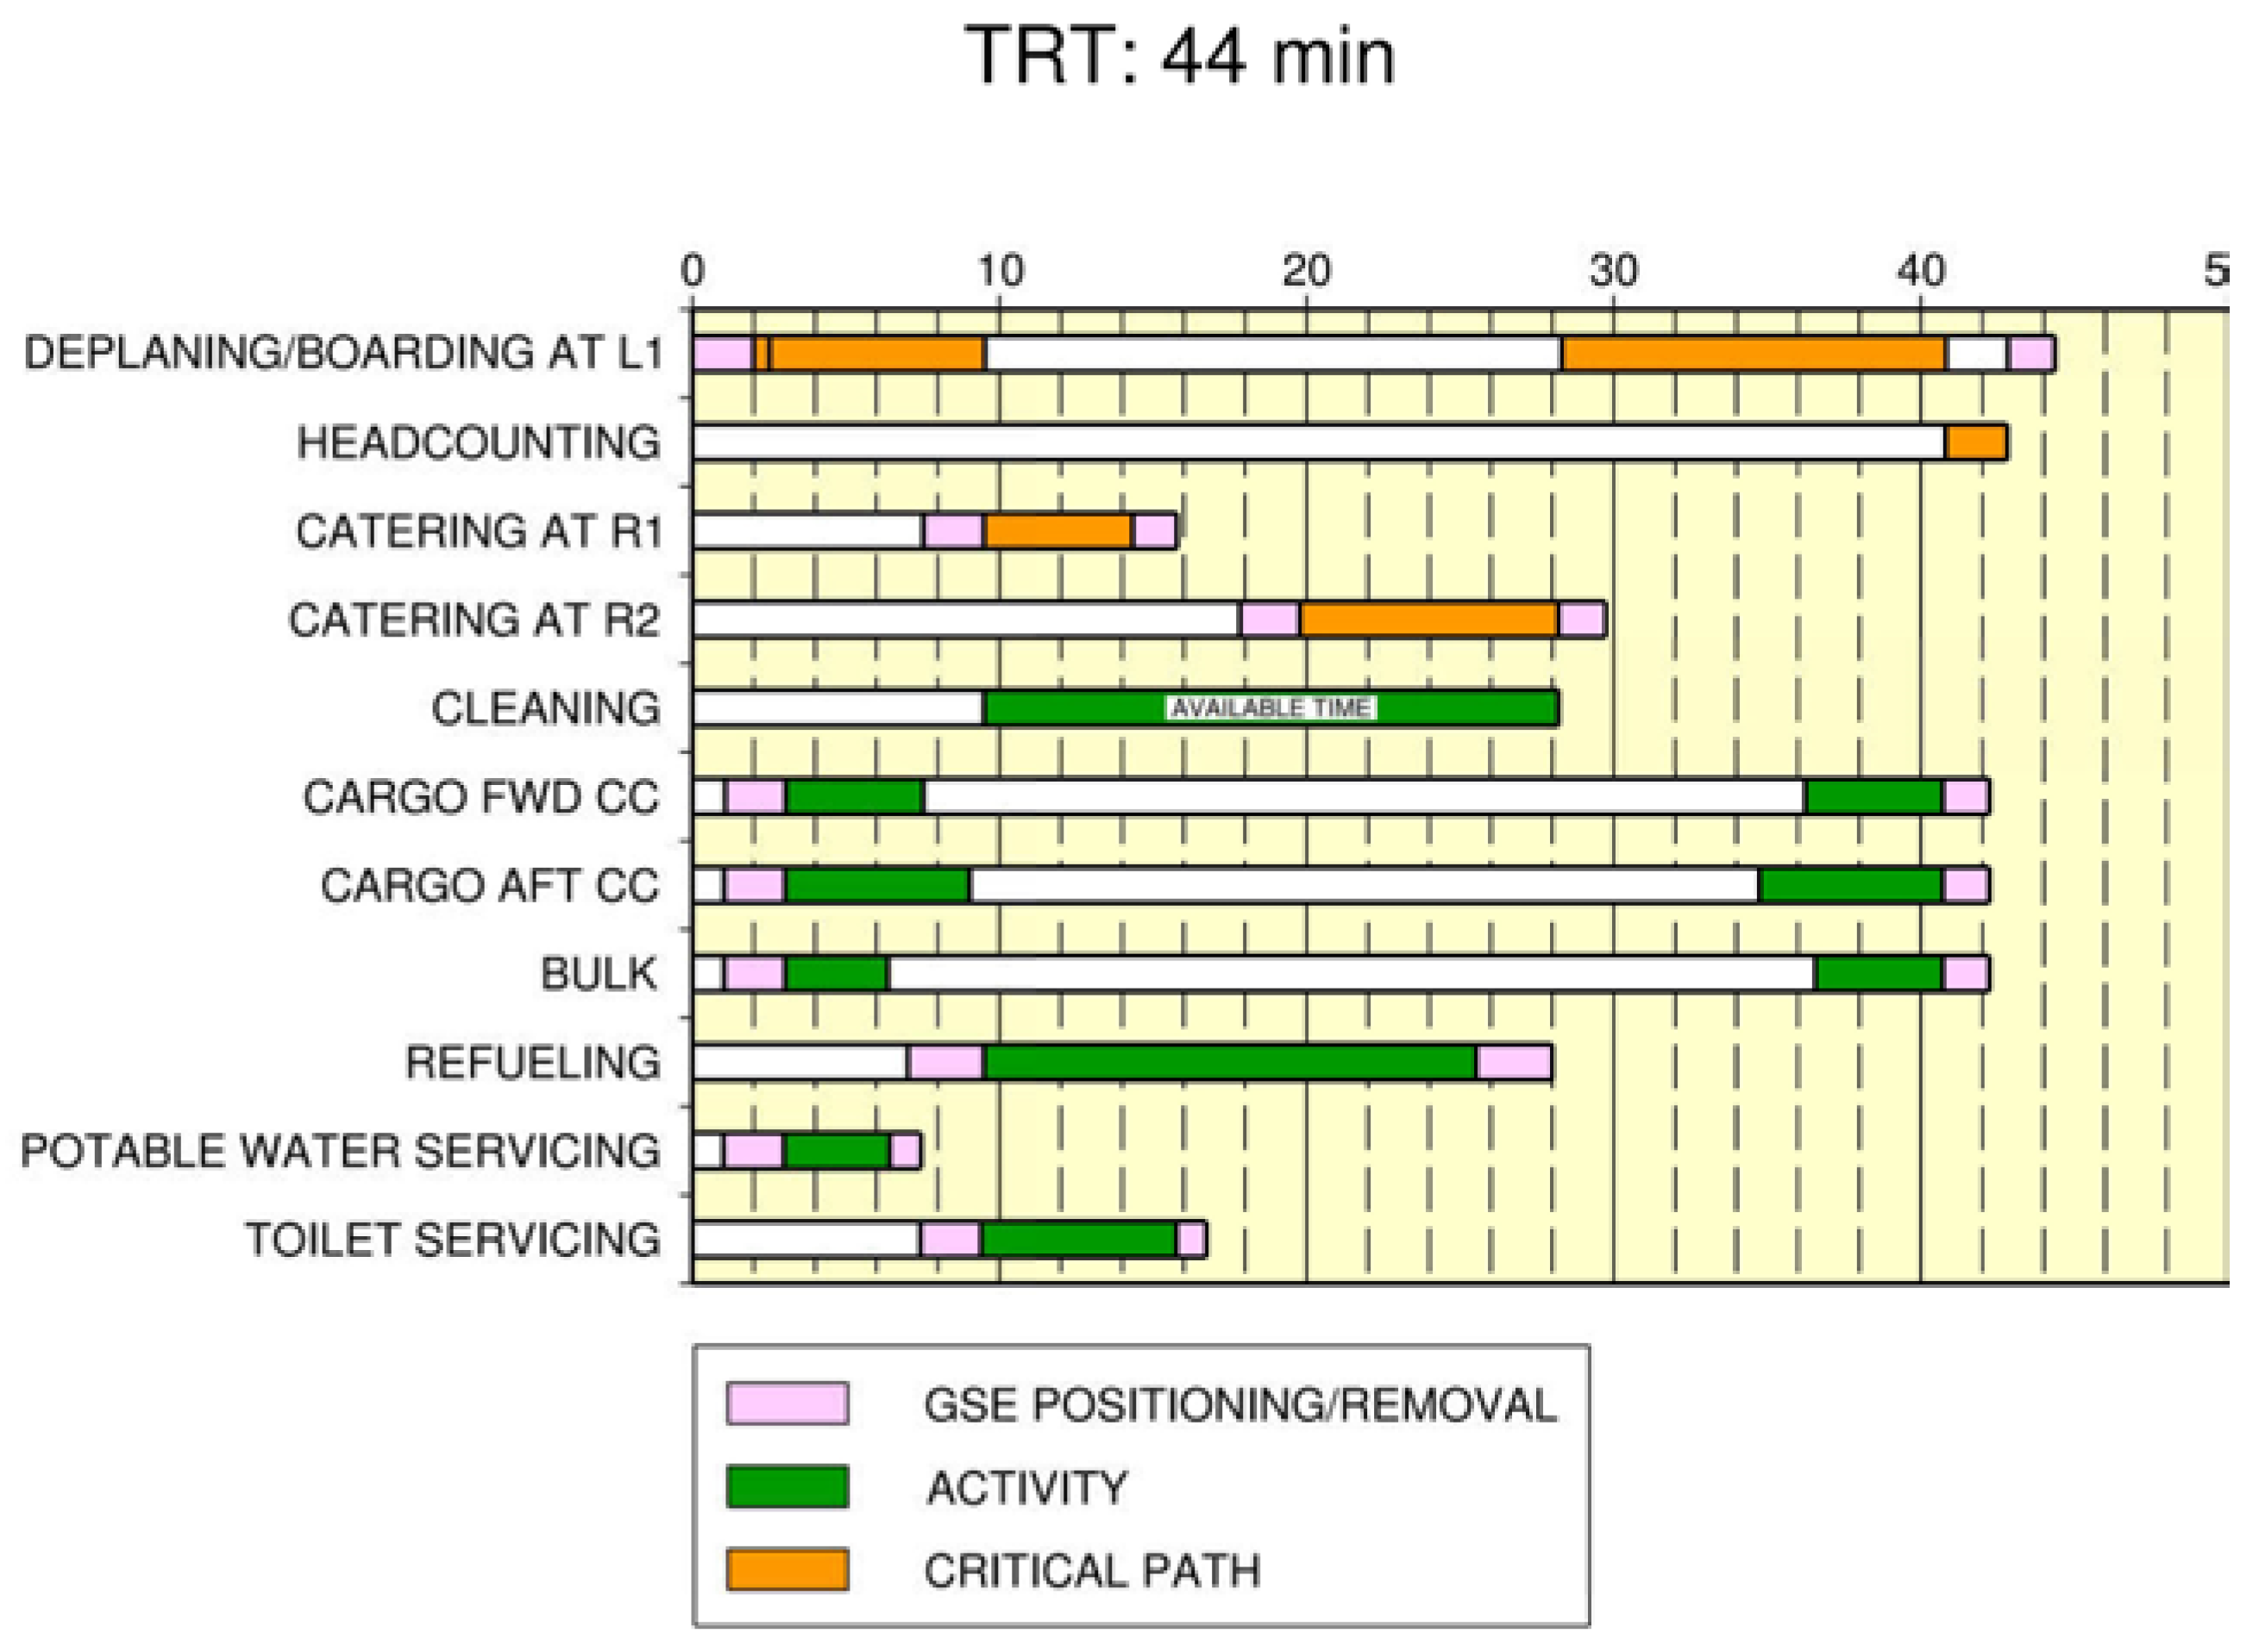
- 1 fuelling truck
- 1 bus boarding
- 1 bus for deboarding
- 2 stairs (for dual boarding)
- 1 water truck
- 1 cleaning truck
- 1 baggage cart for baggage in and out
4.2.1. Runway Module
4.2.2. Stand Module
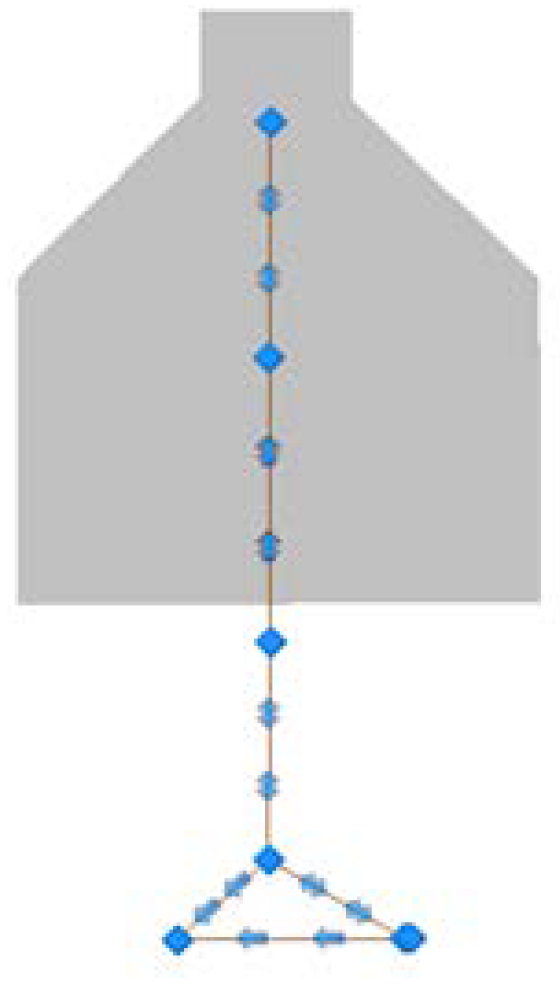
4.2.3. Taxiway Network Module
4.2.4. Assumptions
- the turnaround processes start as soon as the aircraft has blocked in;
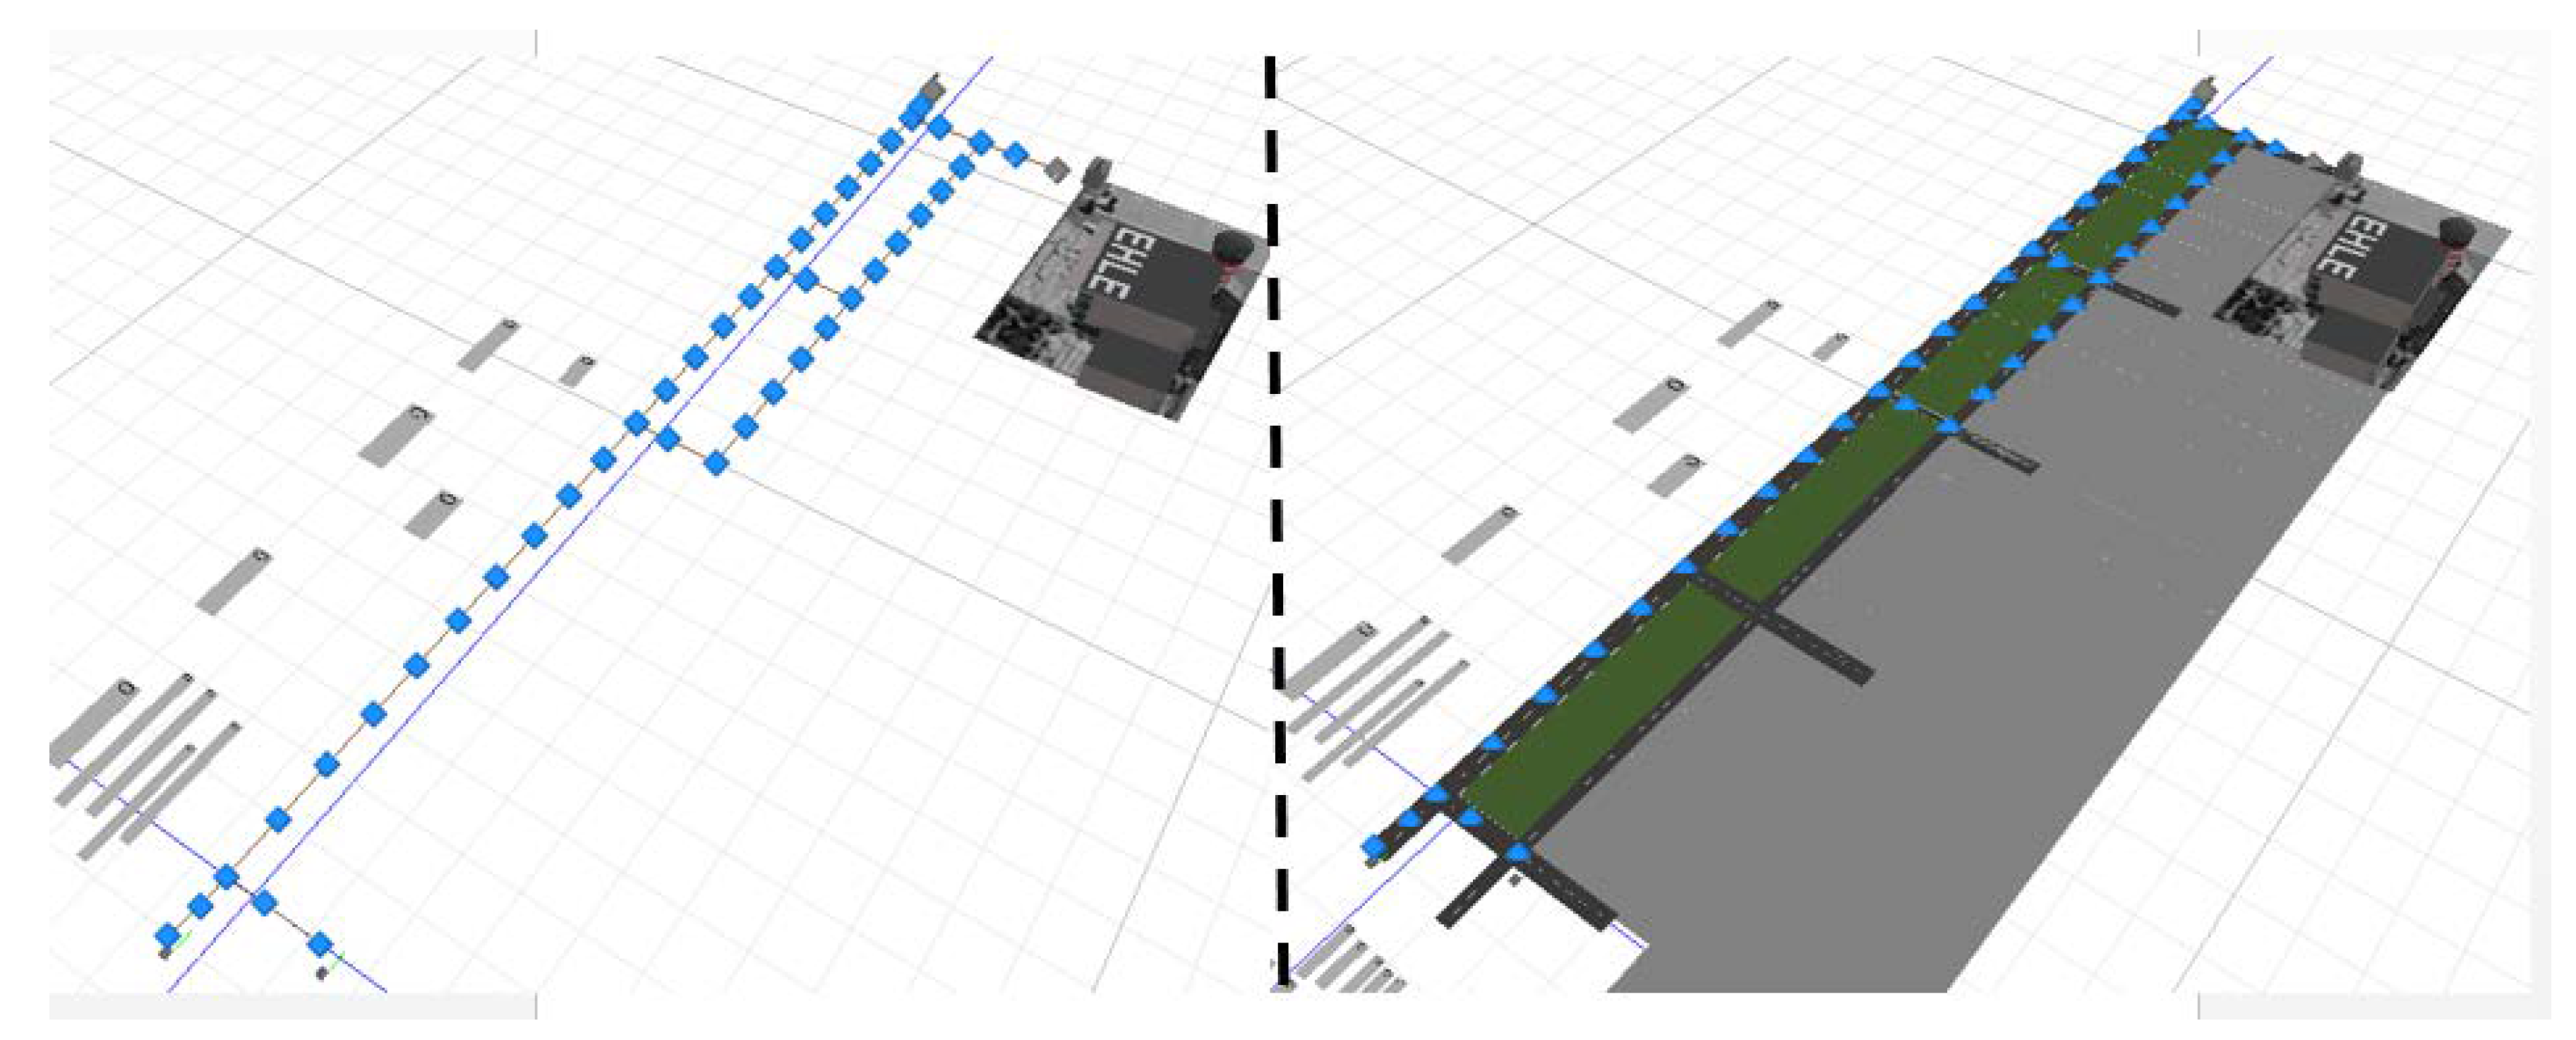
- the vehicles that perform the ground operations are in depots at one extreme of the apron;
- the engines’ jet blasts are neglected in the apron operation;
- the exact dimension is not considered in the operation, just an approximation that allows a smooth approach to the parking positions;
- the different operations at the parking positions follow the probability distributions reported in literature [13].
4.3. Model B Characteristics
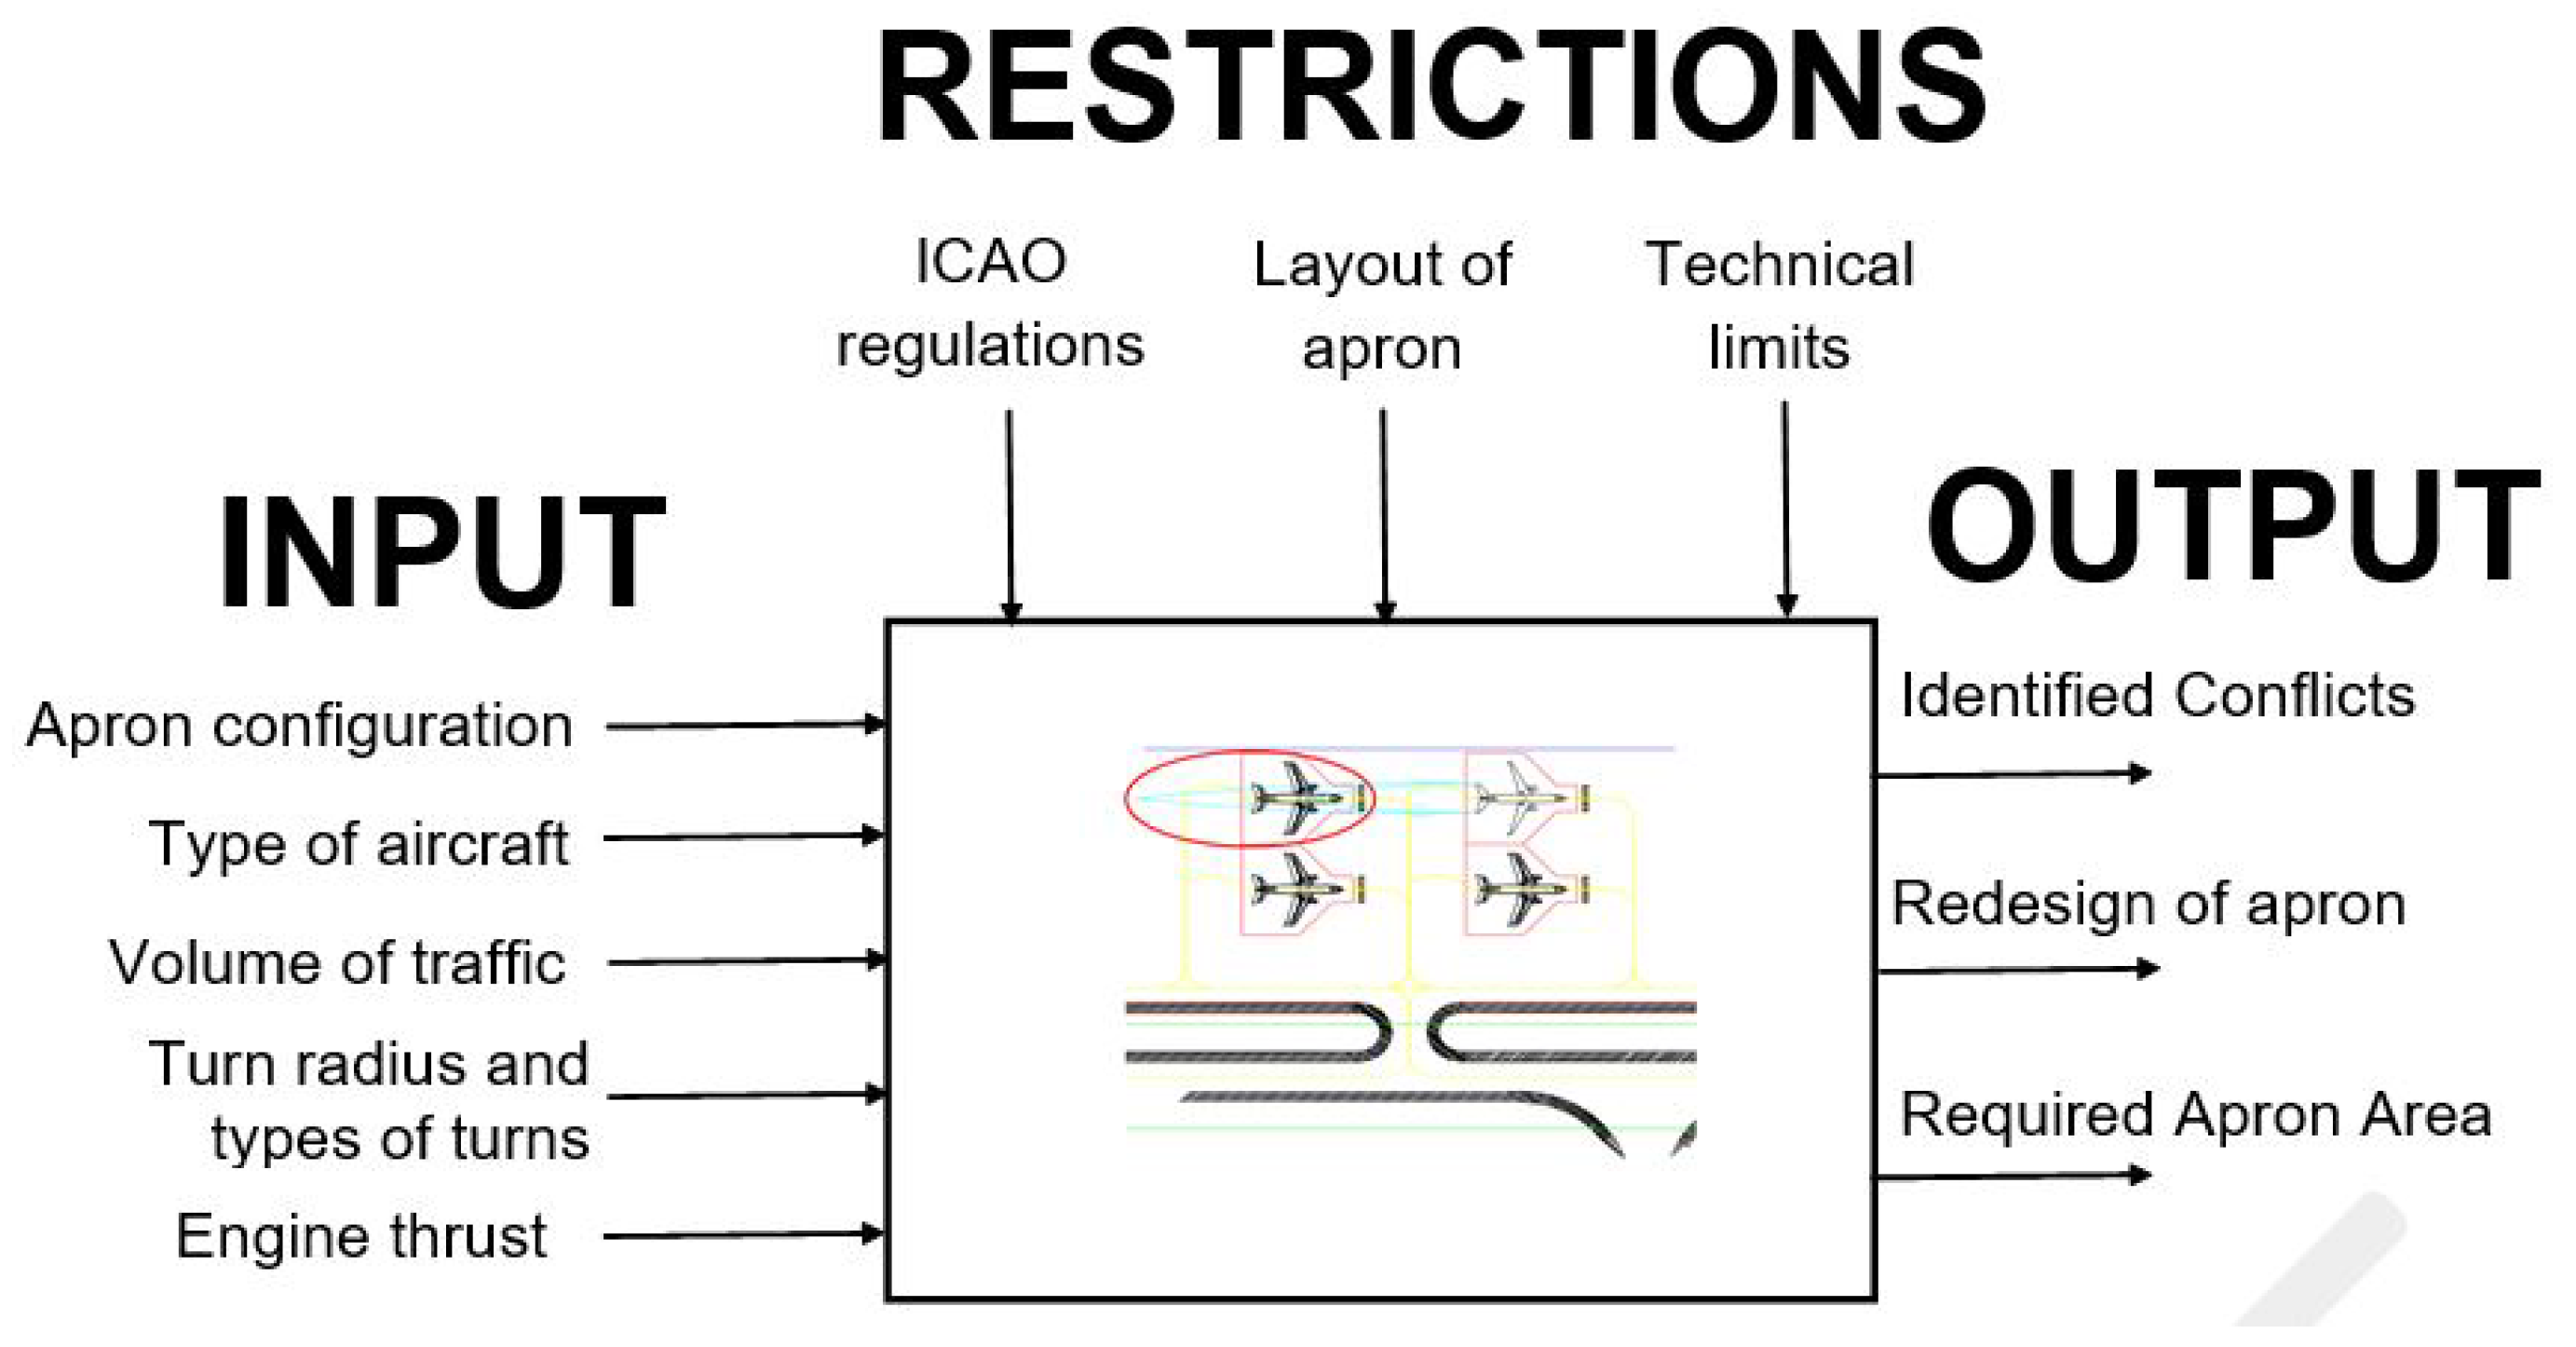
- aircraft performance, such as speed and turning angles required for the operation;
- aircraft push-back operations with tractor/towbar configurations and those without;
- jet blast contours and impact surfaces for various engine thrust levels;
- design of taxiway intersections, including fillets;
- definition of safety areas.
4.3.1. Apron Configuration
4.3.2. Characteristics of the Traffic
4.3.3. Operational Procedures
- the taxiing manoeuvres are made in an autonomous way, with the engines in the slow-speed regime;
- the taxiing-out manoeuvres are made with a push-back truck until the aircraft is aligned with the apron stand taxi lane.
- the taxiing manoeuvres towards the parking positions are made in an autonomous way with the engines in the slow-speed regime;
- the taxiing-out manoeuvres are made in an autonomous way, with the engines in start-up mode for the first 10 m and then in the slow-speed regime for the remainder of the manoeuvre.
4.3.4. Assumptions
- For jet engines, the critical admissible speed in the area of manoeuvres is 56 km/h as advised by ICAO. The aircraft considered in the study were the B737-800 (w/winglets) and the A320-200 (sharklet).
- The scenarios at the apron that do not include the jet in the analysis allow the apron dimension to be minimized.
- The operation with the engine jet assumes that the apron dimension will be bigger in order to minimize potential conflicts.
5. Experimental Design and Results
5.1. Results
5.1.1. Model A
5.1.2. Model B
6. Conclusions and Future Work
Acknowledgments
Author Contributions
Conflicts of Interest
References
- EUROCONTROL. Industry Monitor; Issue N. 169; EUROCONTROL: Brussels, Belgium, 30 January 2015. [Google Scholar]
- IATA. Fact Sheet: Industry Statistics; IATA: Hong Kong, China, December 2014. [Google Scholar]
- Airport Council International. A Vision for European Aviation; ITM Publishing Services: Brussels, Belgium, 2005. [Google Scholar]
- Becu, N.; Bousquet, F.; Barretau, O.; Perez, P.; Walker, A. A Methodology for Eliciting and Modelling Stakeholders’ Representations with Agent Based Modelling; Multi-Agent-Based Simulation 3. MABS2003. Lecture Notes in Computer Science; Hales, D., Edmonds, B., Norlina, E., Touchier, J., Eds.; Springer: Berlin/Heidelberg, Germany, 2003; Volume 2927, pp. 131–148. ISBN 978-3-540-20736-8. [Google Scholar]
- Mujica, M.; Flores, I. Revisiting the Flaws and Pitfalls using Simulation in the Analysis of Aviation Capacity Problems. Case Stud. Transp. Policy 2018. [Google Scholar] [CrossRef]
- Adacher, L.; Flamini, M.; Romano, E. A model to optimize the airport terminal departure operations. Transp. Res. Proced. 2017, 27, 53–60. [Google Scholar] [CrossRef]
- Chen, C.; Schonfeld, P. Uncertainty Analysis for Flexible Airport Gate Development. Proced. Soc. Behav. Sci. 2013, 96, 2953–3961. [Google Scholar] [CrossRef][Green Version]
- Hamzah, S.; Adisasmita, S.A. Aircraft parking stands: Proposed model for Indonesian airports. Proced. Environ. Sci. 2015, 28, 324–329. [Google Scholar] [CrossRef][Green Version]
- Sun, Y.; Schonfeld, P. Stochastic capacity expansion models for airport facilities. Transp. Res. Part B 2015, 80, 1–18. [Google Scholar] [CrossRef]
- Martinez, J.; Trani, A.; Ioannou, P. Modelling Airside Airport Operations Using General-Purpose, Activity-Based, discrete-Event Simulation Tools. Transp. Res. Rec. J. Transp. Res. Board 2011, 1744, 65–71. [Google Scholar] [CrossRef]
- Khoury, H.M.; Ramat, V.R.; Ioannou, P.G. Evaluation of General-purpose Construction Simulation and Visualization tools for Modeling and Animating AirSide Airport Operations. Simulation 2007, 83, 663–679. [Google Scholar] [CrossRef]
- Chen, X.; Li, J.-H.; Gao, Q. A simple process simulation model for strategic planning on the airside of an airport: A case study. J. Simul. 2015, 9, 64–72. [Google Scholar] [CrossRef]
- Mujica, M.; Boosten, G.; de Bock, N.; Jimenez, E.; Pinho de Souza, J. Simulation-Based Turnaround Evaluation for Lelystad Airport. J. Air Transp. Manag. 2017, 64, 21–32. [Google Scholar] [CrossRef]
- An, R.; Yang, X.K. Application of Simulation Technology on Airport System. Appl. Mech. Mater. 2013, 392, 936–940. [Google Scholar] [CrossRef]
- Danesi, A.; Mantecchini, L.; Paganelli, F. Long-Term and Short-Term Forecasting Techniques for Regional Airport Planning. ARPN J. Eng. Appl. Sci. 2017, 12, 739–745. [Google Scholar]
- Scala, P.; Mujica, M.; de Bock, N. A divide a conquer approach for simulating an airport system. Int. J. Simul. Proc. Model. 2016, 12, 470–484. [Google Scholar] [CrossRef]
- Mujica, M. Check-in allocation improvements through the use of a simulation–optimization approach. Transp. Res. Part A 2015, 77, 320–335. [Google Scholar] [CrossRef]
- Mujica, M.; Scala, P.; Boosten, G. Simulation-based capacity analysis for a future airport. In Proceedings of the 2014 Asia-Pacific Conference on Computer Aided System Engineering (APCASE), Bali, Indonesia, 10–12 February 2014. [Google Scholar]
- Aldres, H. Presentatie en Toelichting van de in Het MER te Ondezoeken Routevarianten. Informatiebijeenkomst voor Bewoners in de Region Gelderland/Overijssel en Bewoners van Flevoland. Available online: http://slideplayer.nl/slide/10267236/ (accessed on 13 January 2014).
- Banks, J.; Carson, J.S.; Nelson, B.; Nicol, D.M. Discrete-Even System Simulation, 5th ed.; Pearson: Westlake Village, CA, USA, 2009. [Google Scholar]
- Schiphol Magazine. Available online: http://trafficreview2014.schipholmagazines.nl/air-transport-movements.html#atmmainairlinesa (accessed on 31 March 2015).
- Schiphol Group. Ondernemingsplan Lelystad Airport. Available online: https://www.rijksoverheid.nl/documenten/rapporten/2014/04/08/ondernemingsplan-lelystad-airport (accessed on 19 April 2018).
- European Court of Auditors. EU-Founded Airport Infrastructure: Poor Value for Money; European Union: Brussels, Belgium, 2014. [Google Scholar]
- EUROCONTROL. Technical Note: “Measuring Operational ANS Performance at Airports”; Version 1.01; EUROCONTROL: Brussels, Belgium, 9 May 2011. [Google Scholar]
- SIMIO. Available online: https://www.simio.com/applications/industry-40/index.php (accessed on 19 April 2018).
- TransoftSolutions. Aeroturn 5.0. Available online: http://www.transoftsolutions2015.com/aeroturnpro (accessed on 19 April 2018).





| Input | Description | Assumptions |
|---|---|---|
| Airside configuration | 1. Linear with nose-in apron configuration. 16 stands 2. Linear with taxi-in taxi-out apron configuration. Parallel parking stands | Scenarios created, according to [13] |
| Stand Allocation | 1. Left–right 2. Centre–out | Aircraft enter the apron area from the closest parking gate available on the left (left–right), or from the closest gate available centered with respect to the apron area (centre–out) based on the dominant runway in use. |
| Apron Configuration | Manoeuvres | Margin | Type of Aircraft | Analysis | Scenario |
|---|---|---|---|---|---|
| Linear nose | Taxi in: autonomous manoeuvre Taxi out: assisted manoeuvre with towing | dependent | A320 | no engine jet | 1 |
| with engine jet | 2 | ||||
| B737 | no engine jet | 3 | |||
| with engine jet | 4 | ||||
| independent | A320 | no engine | 5 | ||
| with engine jet | 6 | ||||
| B737 | no engine | 7 | |||
| with engine jet | 8 | ||||
| Linear w/parallel parking | Taxi in: autonomous manoeuvre Taxi out: autonomous manoeuvre | dependent | A320 | no engine | 9 |
| with engine jet | 10 | ||||
| dependent | B737 | no engine | 11 | ||
| with engine jet | 12 |
| Configuration | Performance Indicator | Statistics | ||||
|---|---|---|---|---|---|---|
| Average (minutes) | Min. (minutes) | Max. (minutes) | Half Width | |||
| Linear nose in | Left–right parking allocation | Turnaround time | 30.75 | 27.86 | 33.9 | 1.43 |
| Expected delay | 2.42 | 2.09 | 2.88 | 0.19 | ||
| Centre–out parking allocation | Turnaround time | 30.95 | 28.86 | 33.83 | 1.16 | |
| Expected delay | 3.56 | 2.13 | 7.89 | 1.45 | ||
| Linear w/parallel parking positions | Left–right parking allocation | Turnaround time | 30.40 | 27.85 | 34.19 | 1.75 |
| Expected delay | 2.18 | 1.97 | 2.50 | 0.16 | ||
| Centre–out parking allocation | Turnaround time | 29.66 | 27.31 | 33.06 | 1.37 | |
| Expected delay | 2.17 | 1.83 | 2.83 | 0.32 | ||
| Physical Characteristics of the Apron | Independent Margins | Dependent Margins |
|---|---|---|
| Parking position (length) | 48.5 m | 48.5 m |
| Parking position (max. width) | 45.0 m | 45.0 m |
| Separation between central axis in parking positions | 45.0 m | 40.5 m |
| Distance between the axis of the taxi entrance to the parking position and the security line | 24.5 m | 24.5 m |
| Distance between the taxiway to the parking position and the service road | 73.0 m | 73.0 m |
| Required length for the parking positions (total width) | 180.0 m | 166.5 m |
| Approx. apron area (4 positions) | 13,140 m2 | 12,154 m2 |
| Physical Characteristics of the Apron | Minimum Distances According to Regulations | Distances According to Modules | |
|---|---|---|---|
| A320-200 (Sharklet) | B737-800 (Winglets) | ||
| Parking positions (length) | 48.5 m | 48.5 m | 48.5 m |
| Parking positions (max. width) | 45.0 m | 45.0 m | 45.0 m |
| Separation between parking positions central axis | 45.0 m | 45.0 m | 45.0 m |
| Distances between axis of taxiway to parking positions and security lines | 24.5 m | 28.5 m | 72.5 m |
| Distance between taxiways axis in apron and security line | 26.0 m | 26.0 m | 26.0 m |
| Distance between taxiway axis in apron and service path | 118.0 m | 123.0 m | 123.0 m |
| Separation between taxiway axis towards parking positions | 97.5 m | 107.5 m | 193.5 m |
| Total length required for the parking positions (total width) | 195.0 m | 215.0 m | 387.0 m |
| Approx. apron area (4 positions) | 23,010 m2 | 26,445 m2 | 47,601 m2 |
© 2018 by the authors. Licensee MDPI, Basel, Switzerland. This article is an open access article distributed under the terms and conditions of the Creative Commons Attribution (CC BY) license (http://creativecommons.org/licenses/by/4.0/).
Share and Cite
Mota, M.M.; Di Bernardi, A.; Scala, P.; Ramirez-Diaz, G. Simulation-Based Virtual Cycle for Multi-Level Airport Analysis. Aerospace 2018, 5, 44. https://doi.org/10.3390/aerospace5020044
Mota MM, Di Bernardi A, Scala P, Ramirez-Diaz G. Simulation-Based Virtual Cycle for Multi-Level Airport Analysis. Aerospace. 2018; 5(2):44. https://doi.org/10.3390/aerospace5020044
Chicago/Turabian StyleMota, Miguel Mujica, Alejandro Di Bernardi, Paolo Scala, and Gabriel Ramirez-Diaz. 2018. "Simulation-Based Virtual Cycle for Multi-Level Airport Analysis" Aerospace 5, no. 2: 44. https://doi.org/10.3390/aerospace5020044
APA StyleMota, M. M., Di Bernardi, A., Scala, P., & Ramirez-Diaz, G. (2018). Simulation-Based Virtual Cycle for Multi-Level Airport Analysis. Aerospace, 5(2), 44. https://doi.org/10.3390/aerospace5020044


