Article

Surrogate-Assisted Multi-Objective Aeroacoustic Optimization of a Small-Scale Rotor in Hover Mode


1
School of Aerospace Engineering, Zhengzhou University of Aeronautics, Zhengzhou 450046, China
2
Aviation Industry Development Research Center of China, Beijing 100029, China
*
Author to whom correspondence should be addressed.
Aerospace 2026, 13(9), 841; https://doi.org/10.3390/aerospace13090841
Submission received: 18 August 2026 / Revised: 12 September 2026 / Accepted: 13 September 2026 / Published: 15 September 2026
(This article belongs to the Section Aeronautics)

Abstract

Small-scale rotor design must balance hover efficiency and acoustic performance; however, costly aeroacoustic evaluations make multi-objective optimization computationally demanding. This study develops a surrogate-assisted framework using eight radial basis-function variables to parameterize spanwise chord and twist variations. Aerodynamic loads are evaluated with a reformulated vortex-particle method, while acoustic models estimate tonal and broadband noise. Baseline validation results in a 3.1% thrust coefficient error and captures the principal acoustic directivity trend. Gradient-boosted regression trees guide adaptive sampling, with candidate designs required to retain at least 95% of the baseline thrust coefficient. A total of 304 direct evaluations identify a 16-design thrust-feasible Pareto front. At 5400 RPM, the maximum-FM design improves FM by 11.31% while reducing OASPL by 1.06 dB, whereas the minimum-noise design reduces OASPL by 2.97 dB while increasing FM by 3.00%. Thrust-matched reassessment confirms that these performance benefits are maintained with lower shaft-power requirements. The improvements are primarily the result of the selective spanwise redistribution of thrust and torque rather than uniform unloading; the minimum-noise design shifts loading inboard and weakens the outer-span wake, whereas the maximum-FM design increases thrust while limiting torque growth and produces stronger downstream momentum transfer.

1. Introduction

Small-scale rotors are central to unmanned aerial vehicles (UAVs), multirotor platforms, and emerging electric vertical take-off and landing aircraft. As low-altitude aircraft become increasingly prevalent in urban and populated environments, rotor noise has become an important factor affecting their operational suitability and public acceptance [1]. Meanwhile, rotor design must also account for aerodynamic performance, including thrust, power, and hover efficiency, making noise reduction difficult to consider independently of aerodynamic performance [2]. Therefore, improving aerodynamic efficiency and reducing noise while satisfying thrust requirements has become an important multi-objective problem in small-scale rotor design [3].
Recent work has addressed this coupled problem using targeted geometric changes and several distinct optimization strategies. Sun et al. [4] combined experiments, particle-image velocimetry, CFD, and acoustic prediction to show that spanwise twist can improve hover efficiency while reducing noise through changes in the tip-region flow. Li et al. [5] used a genetic algorithm with CFD and an acoustic analogy to optimize blade number and radial twist during hovering. In contrast, Klimczyk and Sieradzki [6] and Sarikaya et al. [7] coupled global sensitivity or surrogate models with aerodynamic and acoustic solvers for higher-dimensional blade reshaping. Multi-fidelity strategies have subsequently combined inexpensive and expensive evaluations through transfer learning, neural network surrogates, or adaptive data fusion [3,8,9], whereas Zhi et al. [10] developed a pseudorotation adjoint method for efficient aerodynamic and tonal-noise optimization of isolated rotors. Together, these studies show that the preferred design depends on the operating condition, acoustic metric, parameterization, and fidelity of the evaluated model. Recent high-resolution and experimental studies have also clarified how local blade modifications alter the radiated sound. Rong et al. [11] used LES and FW–H calculations to relate leading-edge serrations to changes in large-scale vortices and pressure fluctuations near the tip. Gu et al. [12] combined numerical and experimental analyses of serrated trailing-edge propellers and associated broadband reduction with faster wake and tip-vortex dissipation. Candeloro et al. [13] used force, microphone, PIV, and modal measurements to connect tonal and broadband changes to loading, trailing-edge vorticity, and wake coherence. Although these passive treatments differ from smooth chord–twist reshaping, they reinforce the need to interpret an optimized geometry through both its loading and its resolved flow structures.
These studies indicate that the acoustic effects of blade reshaping are closely related to the associated changes in loading distribution and local flow. Tonal noise is associated with deterministic periodic loading and its harmonics [14,15,16], whereas broadband components can arise from turbulent boundary-layer scattering, trailing-edge noise, laminar-separation-bubble shedding, and inflow or wake interactions [17,18]. Experimental studies by Loessle et al. and Thai et al. provide further indication that trailing-edge scattering and blade self-noise are important contributors to broadband radiation [19,20]. At the low Reynolds numbers typical of small-scale rotors, boundary-layer transition and laminar-separation phenomena may also play important roles in broadband noise. Because the local rotational velocity increases with radius, outboard loading strongly affects both aerodynamic power and acoustic radiation. Classical rotor-aeroacoustic theory identifies unsteady loading, wake evolution, and tip-vortex dynamics as central contributors [21,22]; the small-rotor study conducted by Casalino et al. shows that these mechanisms can vary with blade geometry and installation conditions [23]. Accordingly, interpreting an optimized design requires not only examining changes in total loading, but also resolving the spanwise redistribution of thrust and torque and its influence on local flow and acoustic radiation.
Numerical methods for this problem span a broad range of cost and fidelity. Blade-element and lifting-line approaches are efficient for preliminary design [24] but depend on simplified representations of the wake and unsteady loading. URANS, LES, and related CFD approaches provide greater flow detail [25], but repeated evaluations become expensive in an eight-dimensional design space. Recent benchmark and cross-validation studies show that agreement is response-dependent: mean loads may be reproduced economically, while wake details, directivity, and higher-order spectral content remain more sensitive to model fidelity [26,27,28]. Vortex particle methods offer an intermediate route by representing the wake with Lagrangian vortex elements and retaining coherent vortical structures with comparatively low numerical diffusion [29,30]. Hybrid vortex methods couple a lifting-line/vortex-lattice description of the blades to a reformulated vortex-particle wake and have been developed for interactional rotor aerodynamics [31,32]. For noise prediction, the Ffowcs Williams–Hawkings (FW–H) analogy and the Brooks–Pope–Marcolini (BPM) model provide complementary estimates of tonal noise, including loading and thickness contributions, and broadband airfoil self-noise [33,34,35].
The efficiency and interpretability of the search also depend on how the blade geometry is parameterized. Free-form deformation and high-order surface descriptions provide substantial geometric freedom but increase dimensionality and can obscure the physical meaning of individual variables. Therefore, reduced descriptions based on radial chord, twist, and sweep controls are common in rotor and propeller optimization. Poggi et al. [36] represented chord and twist by low-order radial functions and compared data-driven surrogates for performance and tonal-noise prediction. Sarikaya et al. [7] and Ye et al. [3] retained similarly interpretable spanwise design functions while expanding the aerodynamic and acoustic search. Such parameterizations retain interpretable spanwise design variables while keeping the dimensionality of the optimization problem manageable. Beyond physically interpretable parameterizations, Wang et al. [37] explored a generative, data-driven representation of complex three-dimensional propeller geometries, embedding complex geometric features in a compact latent space and thereby offering an alternative route to expanding geometric design freedom.
Even with a compact parameterization, direct evolutionary optimization is impractical when every design requires an unsteady aeroacoustic calculation. Available strategies include gradient-free direct search for relatively compact problems [38], adjoint methods when differentiable solver sensitivities are available [10], and surrogate-assisted evolutionary search for expensive black-box responses [39]. NSGA-II provides non-dominated sorting and diversity preservation [40], while surrogate models can reduce the number of direct evaluations required for expensive engineering design [41,42,43]. Recent propeller applications have used single- and multi-fidelity surrogates to connect aerodynamic and acoustic solvers with multi-objective search [8,9]. However, surrogate accuracy near the high-performance boundary may deteriorate when direct samples are sparse. Surrogate predictions are therefore used to guide candidate selection, while the reported optimal designs are confirmed via direct numerical evaluation.
The present study investigates the DJI–9443 small-scale rotor in hover using eight radial basis function perturbations of the chord and twist distributions. The primary optimization is conducted at the validated reference speed of 5400 RPM. The objectives are to maximize the figure of merit (FM) and minimize OASPL while retaining at least 95% of the baseline numerical thrust coefficient. Direct evaluations combine lifting-line/vortex-lattice blade aerodynamics and a reformulated vortex-particle wake with FW–H and BPM acoustic predictions. Gaussian-process and tree-based regression models are compared, after which a gradient-boosted regression tree model is used with NSGA-II to identify candidates for additional direct evaluation. The reported non-dominated set is identified exclusively from directly evaluated, thrust-feasible designs. After the fixed-speed optimization, the representative geometries are re-evaluated at the baseline dimensional thrust to examine whether the aerodynamic and acoustic benefits persist under thrust-matched operation.
The study separates the surrogate-guided candidate search from the final direct-evaluation ranking and assesses surrogate performance for aerodynamic efficiency, thrust, and noise over an adaptively sampled rotor database. The resulting designs are further examined through geometric sensitivity, spanwise loading, and wake structure to clarify the physical mechanisms underlying the efficiency–noise trade-off. A subsequent thrust-matched comparison verifies that these benefits are not obtained simply by reducing the generated thrust.

2. Methodology

2.1. Rotor Blade Parameterization

The DJI–9443 rotor geometry (SZ DJI Technology Co., Ltd., Shenzhen, China) used in the experimental study of Zawodny et al. [44] is adopted as the numerical reference baseline in this study. This geometry is used directly as the starting point for the present RBF parameterization and optimization, and the chord and twist distributions of all candidate designs are defined relative to the same reference geometry.
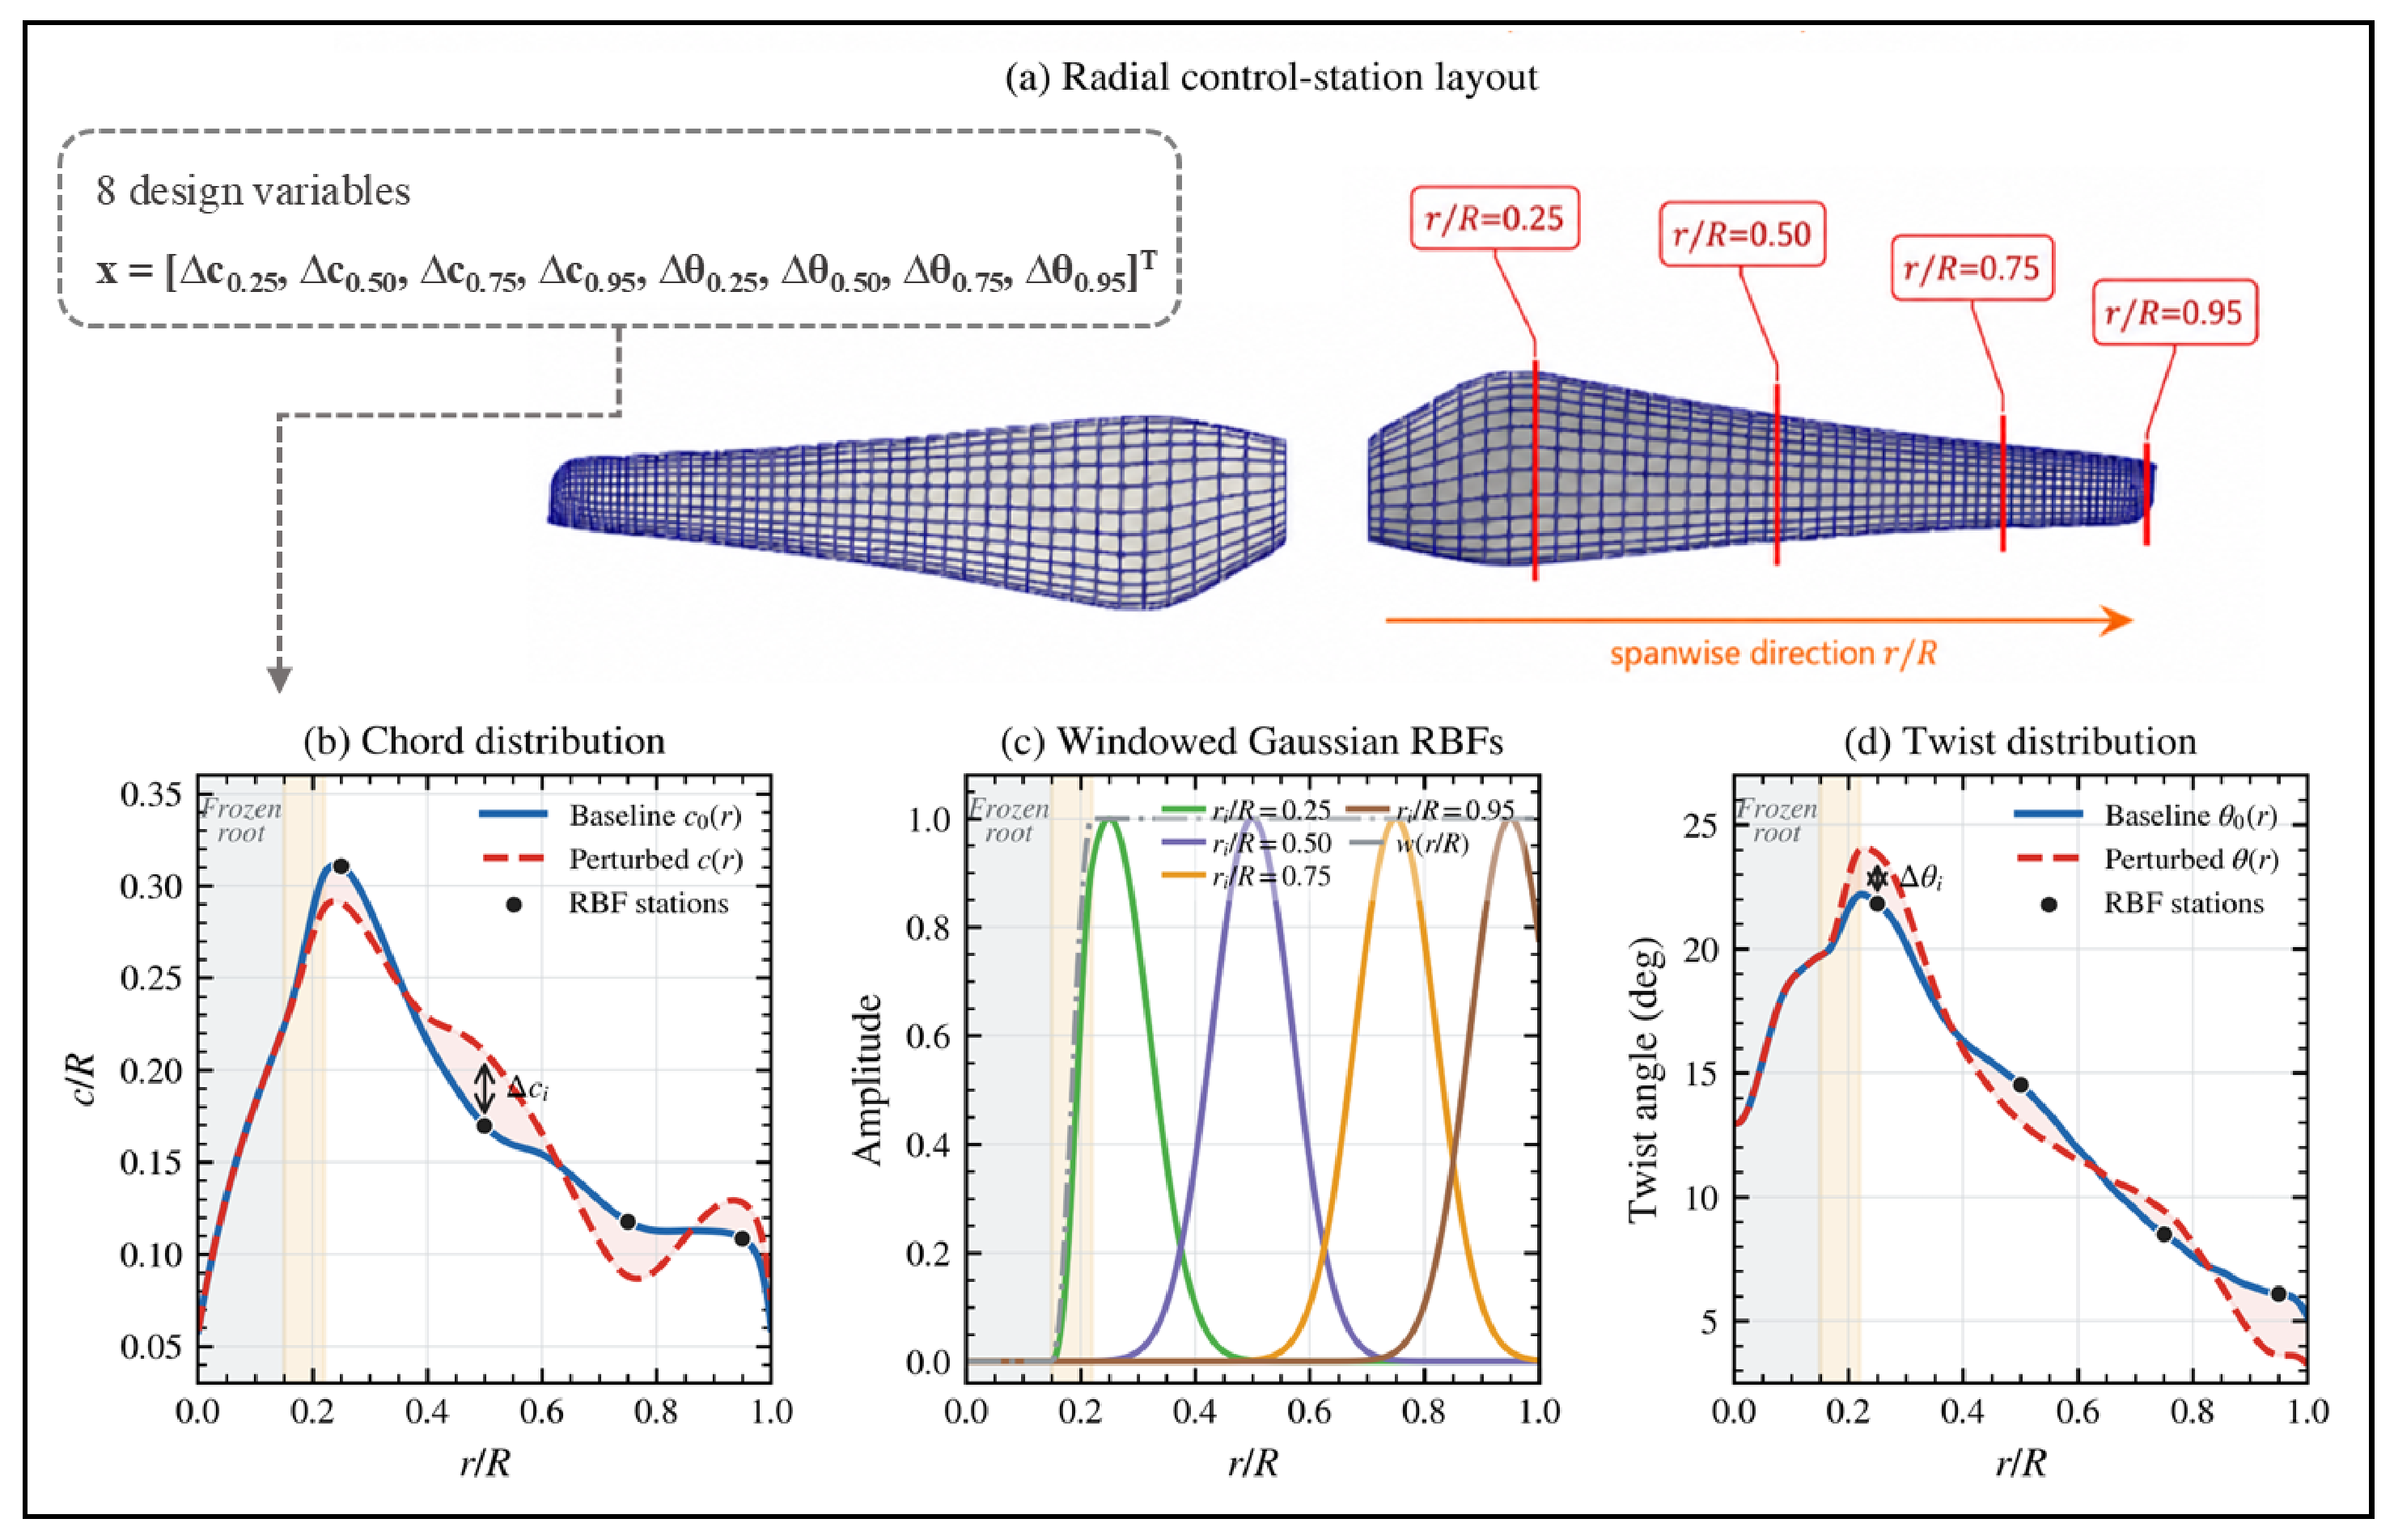
Eight design variables are defined at four spanwise control stations, r / R = 0.25 , 0.50 ,   0.75 , 0.95 . At each station, one chord perturbation Δ c i and one twist perturbation Δ θ i are prescribed. The perturbed chord and twist distributions are written as
c ( r ) R = c 0 ( r ) R + i = 1 4 Δ c i ϕ r R , r i R w r R ,
θ ( r ) = θ 0 ( r ) + i = 1 4 Δ θ i ϕ r R , r i R w r R ,
where c 0 ( r ) and θ 0 ( r ) are the baseline chord and twist distributions, and Δ c i denotes the non-dimensional chord increment Δ ( c / R ) at the corresponding control station. The Gaussian RBF is defined as
ϕ r R , r i R = exp r R r i R 2 σ 2 , σ = 0.10 .
A hub-protection window function is applied to suppress perturbations near the blade root:
w r R = 0 , r / R 0.15 , 1 2 1 cos π r / R 0.15 0.22 0.15 , 0.15 < r / R < 0.22 , 1 , r / R 0.22 .
This window keeps the hub region unchanged and introduces a smooth transition before the active blade region.
The complete design vector is
x = Δ c 0.25 , Δ c 0.50 , Δ c 0.75 , Δ c 0.95 , Δ θ 0.25 , Δ θ 0.50 , Δ θ 0.75 , Δ θ 0.95 T .
The design variables, bounds, and constraints are summarized in Table 1.
Before each simulation, the parameterized chord and twist distributions are checked against the prescribed geometric-feasibility conditions. The chord is required to remain positive at all tabulated chord-distribution nodes. Over the active design region ( r / R 0.22 ), the twist is required to remain non-negative and monotonically non-increasing at the corresponding tabulated pitch-distribution nodes. Designs that violate these conditions are rejected before the aerodynamic simulation. The tabulated chord and twist distributions are subsequently linearly interpolated onto the UVLM spanwise discretization.
The prescribed normalized airfoil profiles and their spanwise interpolation are retained, and each local airfoil section is scaled in both the chordwise and thickness directions according to the local chord. Consequently, the local relative thickness t / c remains unchanged, while the absolute thickness varies proportionally with the local chord. Designs that fail the thrust constraint are retained in the database for model training and analysis, but are excluded from the reported non-dominated ranking. The RBF-based blade parameterization is illustrated in Figure 1.

2.2. Aerodynamic Solver

Aerodynamic simulations are performed using FLOWUnsteady [31,32], an unsteady aerodynamics framework based on the coupling between the unsteady vortex lattice method (UVLM) and the reformulated vortex particle method (rVPM). The UVLM resolves the bound circulation on the blade surface, while the VPM represents the shed wake using Lagrangian vortex particles. This formulation is well suited for rotor-hover simulations because it can capture the development of helical tip vortices without introducing excessive numerical diffusion from a fixed grid.
The vortex particles carry circulation and evolve according to
d x p d t = u ( x p , t ) ,
d Γ p d t = Γ p · u ( x p , t ) ,
where x p and Γ p are the particle position and vector circulation, respectively. The induced velocity field u is evaluated using a regularized Biot–Savart formulation.
The measured DJI–9443 section contours and the seven section-specific aerodynamic polar tables supplied with the FLOWUnsteady rotor database are used. The polar data are assigned according to radial position, and the sectional coefficients are interpolated with respect to the angle of attack. The same polar assignment is retained for the baseline and all candidate geometries, without candidate-specific retuning.
The nominal Reynolds numbers associated with the supplied polar tables are of the same order as the estimated operating Reynolds numbers over the active blade region. The polar database is used as a common aerodynamic closure for relative design comparison, providing a consistent basis for the baseline and candidate geometries rather than a candidate-specific Reynolds-resolved polar representation. Its practical accuracy at the reference condition is assessed through the baseline thrust and spanwise-loading validation presented in Section 3.
The numerical setup used for all optimization evaluations is summarized in Table 2. A single consistent setup is used throughout the optimization database so that the relative comparison among candidate designs remains internally consistent. All cases were simulated for ten revolutions under this common configuration.
The thrust and torque coefficients are defined as
C T = T ρ n 2 D 4 , C Q = Q ρ n 2 D 5 ,
where T is the thrust, Q is the torque, n is the rotational frequency in revolutions per second, ρ is the air density, and D = 0.2400 m is the nominal diameter of the numerical rotor model. This numerical diameter is used consistently for all reported computational coefficients and dimensional thrust values. The figure of merit is computed as
FM = T T / ( 2 ρ A ) Ω Q ,
where A = π R 2 is the rotor disk area and Ω is the angular speed. The corresponding shaft power is P shaft = Ω Q .

2.3. Aeroacoustic Solver

The aeroacoustic prediction combines the Ffowcs Williams–Hawkings (FW–H) acoustic analogy for deterministic tonal noise with the Brooks–Pope–Marcolini (BPM) model for broadband self-noise. This separation is consistent with recent small-propeller studies that distinguish deterministic tonal components from broadband radiation [15,16,45]. All acoustic predictions are performed directly for the modeled small-scale rotor geometry, rotational speed, local section Reynolds-number regime, and ambient fluid properties. No full-scale similarity law or post-processing scale transformation is applied.

2.3.1. FW–H Tonal Noise

The tonal component is evaluated using an impermeable-surface implementation of Farassat Formulation 1A [34]. The rotating three-dimensional blade surface provides the source geometry, surface normals, and kinematics for the thickness contribution, while the FLOWUnsteady blade-load histories provide the aerodynamic input for the loading contribution. Retarded source time is accounted for in the acoustic calculation. The quadrupole volume term is not included in the present impermeable-surface formulation. Similar surface-source FW–H treatments have been applied to small rotors in hover [20,46].
The loading and thickness pressures are added coherently at the observer, after which the temporal mean is removed,
p FW H ( t ) = p loading ( t ) + p thickness ( t ) , p FW H ( t ) = p FW H ( t ) p FW H ¯ ,
and the tonal OASPL is evaluated from the mean-removed pressure history,
L FW H = 10 log 10 mean [ p FW H ( t ) ] 2 p ref 2 , p ref = 20   μ Pa .
FFT processing is used separately for harmonic-resolved analysis.
The aerodynamic source histories contain 72 time steps per revolution. At 5400 RPM, the corresponding source-time sampling rate is 6.48 kHz, with a Nyquist limit of 3.24 kHz. The resolved FW–H frequency-domain analysis is therefore limited to frequencies up to 3.24 kHz, corresponding to approximately 18 BPF for the two-bladed rotor. The spanwise discretization and simulated history length are as described in Table 2.
Far-field observers are distributed around the rotor at r obs = 1.905   m . The optimization objective is the OASPL at the 45 observer, measured from the rotor plane toward the wake side.

2.3.2. BPM Broadband Noise

Broadband airfoil self-noise is estimated using the BPM model [35]. The BPM calculation is implemented as one-way acoustic post-processing of the rotor geometry and operating condition. For each blade section, the interface supplies the local chord, geometric pitch, radial position, rotational speed, freestream condition, and fluid properties.
The sectional BPM spectra are evaluated over 27 one-third-octave bands from 100 Hz to 40 kHz. Each reported spectral value represents the mean-square acoustic energy integrated over the corresponding one-third-octave band and is plotted at the band center frequency. Azimuthal dependence is represented at four uniformly spaced blade azimuths, and the corresponding mean-square pressures are averaged before being converted to decibels. The reported BPM OASPL is unweighted and uses the reference pressure p ref = 20 μ Pa . Sectional broadband contributions are summed on a mean-square-pressure basis. A 72-location observer arc is placed at r obs = 1.905 m.
At the present low-Reynolds-number operating conditions, the BPM formulation provides a consistent semi-empirical estimate of broadband self-noise across the candidate geometries. Its predictions are therefore used primarily to characterize relative broadband-noise trends within the common computational framework.

2.3.3. Total OASPL

The FW–H tonal and BPM broadband components are combined by energetic summation,
OASPL total = 10 log 10 ( 10 L FW H / 10 + 10 L BPM / 10 )
This total OASPL is used for the acoustic results reported in the validation, optimization, and mechanism analyses.

2.4. Multi-Objective Optimization Framework

The design problem seeks to maximize hover efficiency and minimize the total OASPL at the selected 45 observer while retaining the thrust capability of the baseline rotor:
max x FM ( x ) , min x OASPL 45 ( x ) .
subject to the geometric constraints defined in Section 2.1 and the thrust constraint
C T ( x ) 0.95 C T , 0 VPM .
Here, C T , 0 VPM denotes the baseline thrust coefficient obtained using the same numerical setup as the optimization database. This relative definition avoids mixing experimental and computational thrust levels.
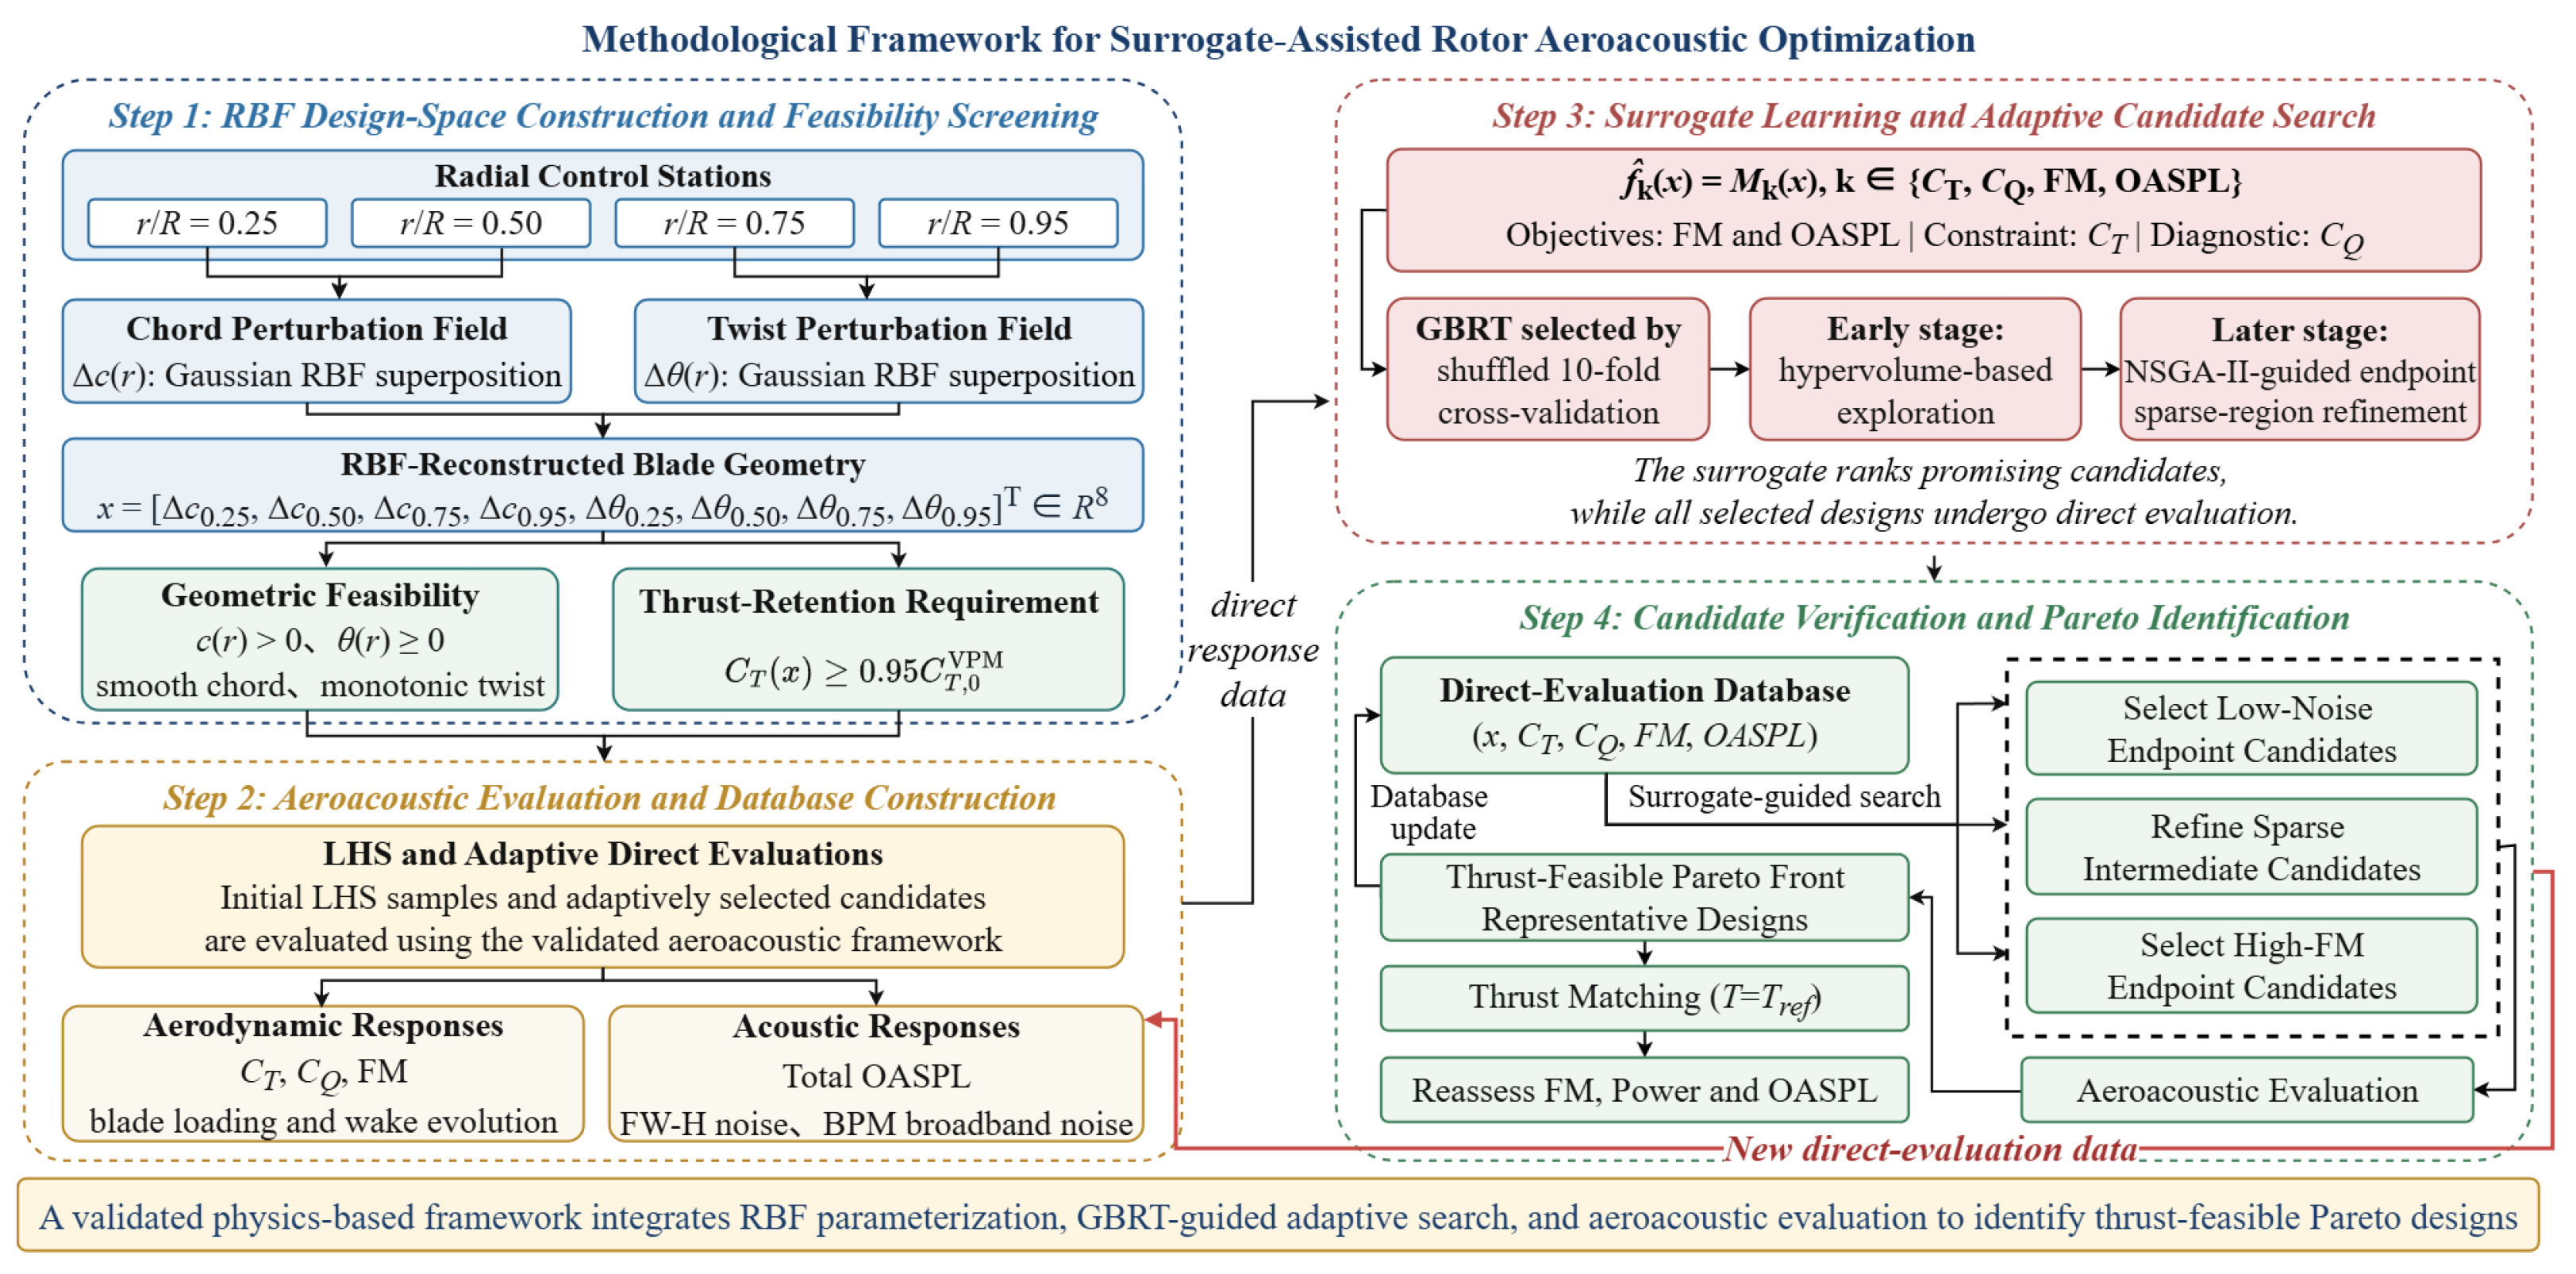
Figure 2 summarizes the optimization workflow. An initial Latin hypercube sample [47] provides broad coverage of the eight-dimensional RBF design space. Geometrically admissible candidates are evaluated directly to obtain C T , C Q , FM, and OASPL. These results form the common database used for surrogate-model assessment, candidate search, thrust-feasibility screening, and final non-dominated sorting.
Because repeated direct evaluations are computationally expensive, four regression approaches are compared through shuffled 10-fold cross-validation: Gaussian-process regression with RBF and Matérn kernels, random-forest regression [48], and gradient-boosted regression trees [49]. The comparison avoids assuming that a single regression structure is uniformly suitable for both objectives. GBRT is retained for the final candidate search because it gives the highest cross-validated accuracy for FM while remaining competitive for OASPL.
Separate GBRT response models are fitted for FM and OASPL, and an additional C T model supports thrust-feasibility screening. A C Q model is also assessed diagnostically because torque enters the definition of FM. All cross-validation metrics are calculated using the unique complete directly evaluated designs. The thrust constraint is subsequently imposed during candidate screening, Pareto extraction, and sensitivity analysis.
The sampling strategy combines global design-space exploration with adaptive sampling near the high-performance boundary. During the early adaptive stage, surrogate-estimated hypervolume improvement relative to the current directly evaluated non-dominated set was used to prioritize additional candidates. After the database became sufficiently populated, NSGA-II [40] was applied to the GBRT response surfaces. The search uses a population of 200 for 200 generations, simulated-binary crossover with probability 0.9 and distribution index 15, polynomial mutation with probability 0.1 and distribution index 20, duplicate elimination, and a fixed reproducible random seed for each iteration. Candidate selection covers the low-noise endpoint, the high-FM endpoint, and sparsely sampled intermediate regions. Each selected candidate is evaluated using the same aerodynamic and aeroacoustic procedure and appended to the database before model retraining.
Throughout adaptive sampling, changes in the non-dominated boundary, prediction errors for newly evaluated candidates, and the appearance of new objective extremes were monitored to assess whether additional evaluations continued to alter the high-performance region. The campaign was closed at the available direct-evaluation budget of 304 unique complete designs. Final non-dominated sorting was then applied to the thrust-feasible directly evaluated designs, satisfying Equation (14).
After the fixed-speed optimization, a separate thrust-matched assessment is performed to examine whether the benefits of the three representative geometries persist at the baseline dimensional thrust, T ref = C T , 0 ρ n 0 2 D 4 = 1.98250 N, evaluated using the nominal numerical diameter D = 0.2400 m. For each geometry, the rotational speed is updated according to
Ω i ( k + 1 ) = Ω i ( k ) T ref T i ( k ) 1 / 2 ,
until
| T i T ref | T ref 0.5 % .
Each thrust-matched operating point is obtained by iterating complete ten-revolution VPM simulations rather than by a one-step coefficient scaling. Shaft power, FM, and the FW–H, BPM, and total OASPL quantities are then recomputed at the trimmed speed using the same analysis procedure. This secondary assessment does not feed back into surrogate training and does not redefine the observed fixed-speed non-dominated set.

3. Validation

The numerical setup was assessed for the baseline DJI–9443 rotor at 5400 RPM in hover before constructing the optimization database. The validation serves two purposes: to establish the accuracy of the aerodynamic performance prediction and to determine whether the acoustic model reproduces the overall level and directivity trends needed for consistent design comparison. This strategy follows established small-rotor benchmark practice by assessing integral aerodynamic quantities together with radiated noise and directivity [50,51].
Table 3 isolates the effect of spanwise blade discretization. All three calculations use 72 time steps per revolution, third-order Runge–Kutta integration, two particles released per time step, ten rotor revolutions, and identical post-processing. The experimental references are C T , exp = 0.0710 and an OASPL of 62.6 dB at the selected observer [44].
Increasing the spanwise discretization from 40 to 60 elements changes C T by approximately 0.15% and does not alter OASPL at the reported precision, while FM changes only slightly. The 40-element configuration is therefore adopted for the optimization database.

3.1. Aerodynamic Validation

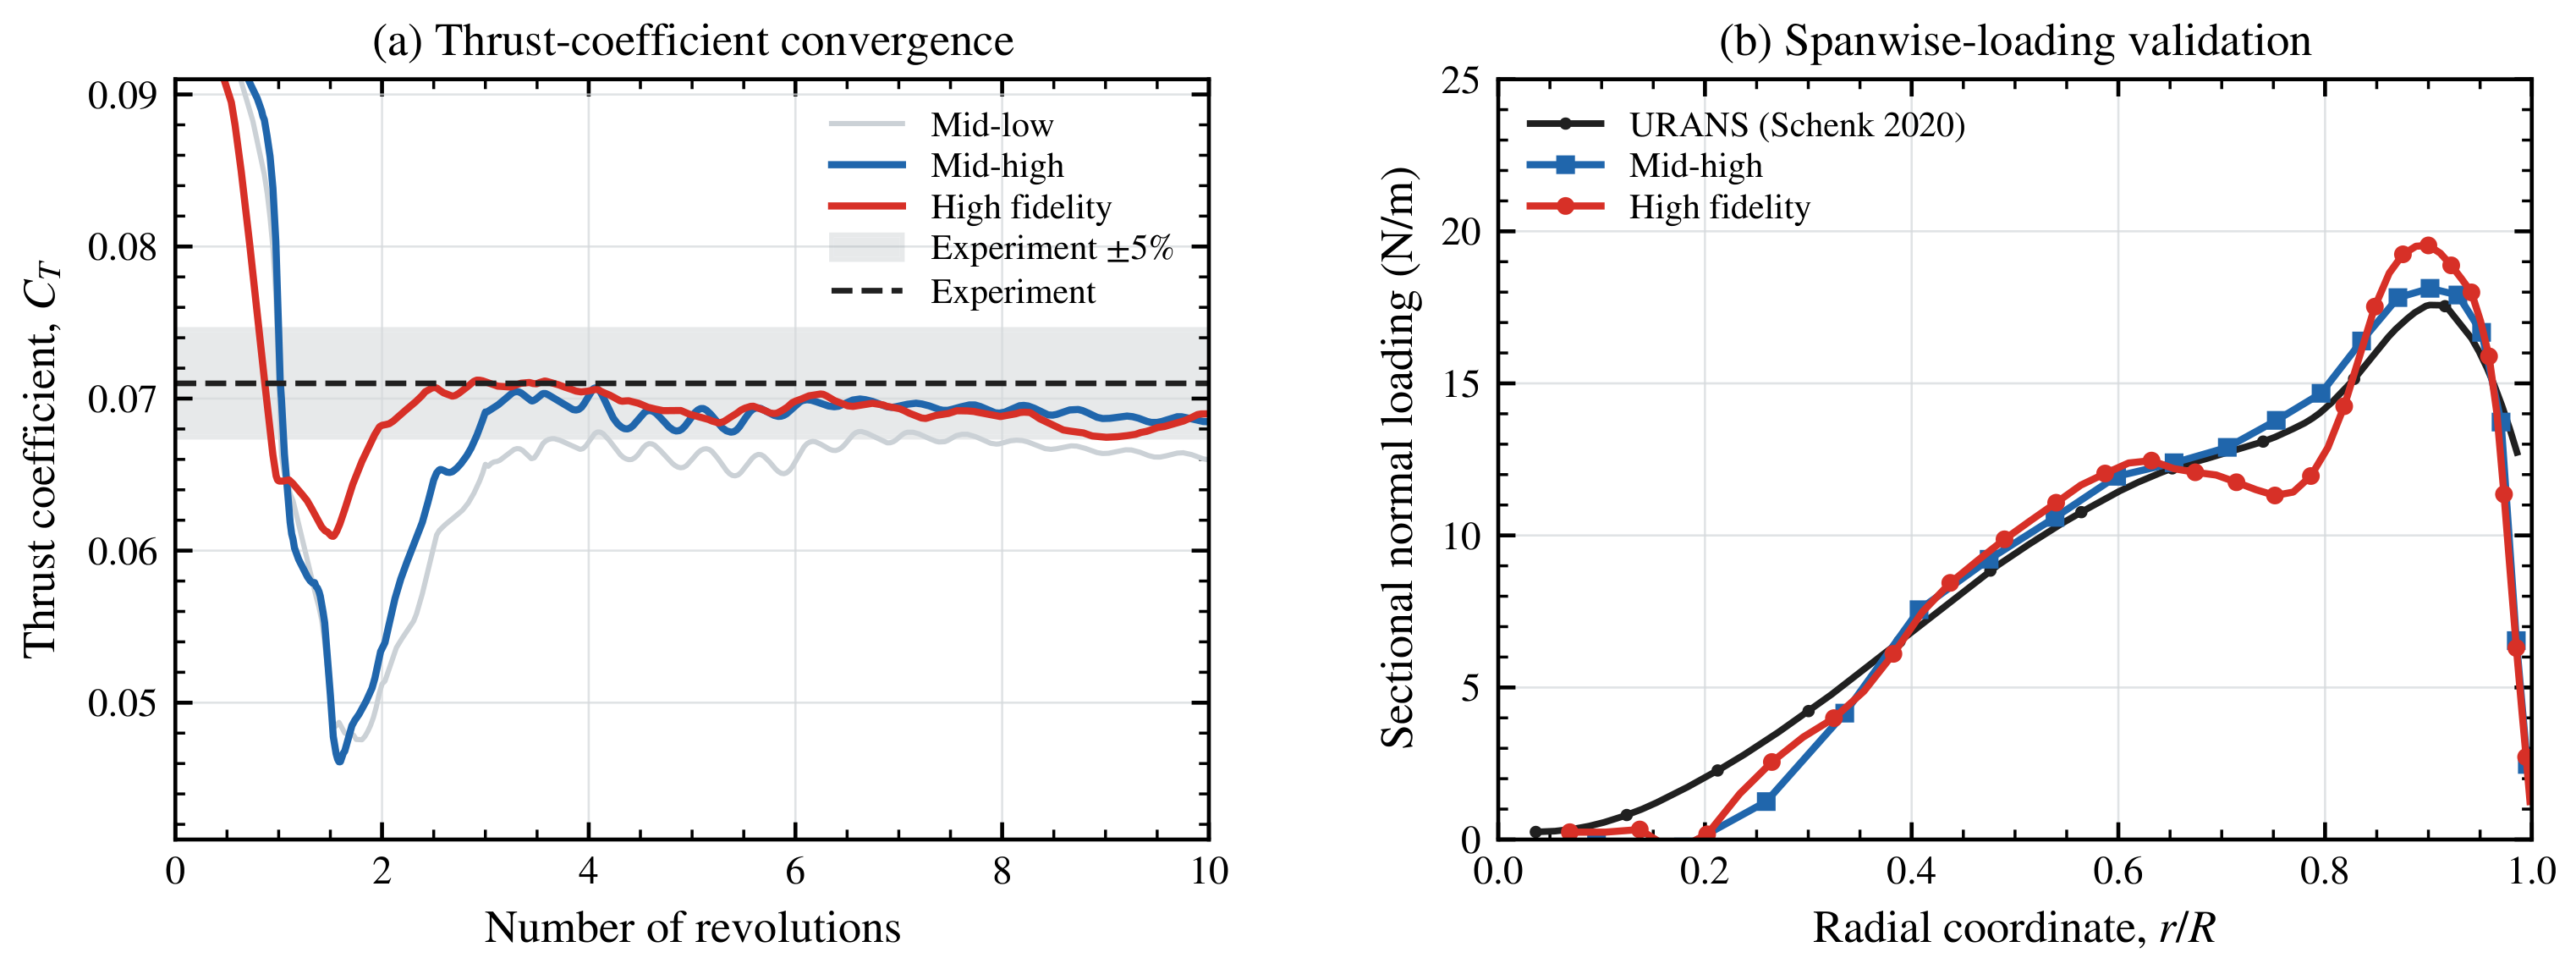
The DJI–9443 is a two-bladed rotor with a nominal diameter of 9.4 in. (approximately 0.24 m). Consistent with the FLOWUnsteady reference geometry, the numerical model uses a tip radius of 0.12 m, corresponding to D = 0.2400 m. At 5400 RPM, the tip Mach number is approximately 0.198 and the chord-based Reynolds number at 0.75 R is approximately 4.5 × 10 4 . The adopted 40-element model predicts a mean thrust coefficient of C T = 0.0688 , compared with the experimental value of 0.0710, corresponding to an underprediction of approximately 3.1%. Figure 3a shows that the computed thrust coefficient approaches a repeatable periodic state during the ten-revolution simulation, while Figure 3b shows that the computed spanwise normal loading reproduces the principal trend of the URANS reference. The agreement in both integrated thrust and spanwise loading supports the use of the adopted numerical setup for the subsequent design comparisons.

3.2. Acoustic Validation

The aeroacoustic framework is assessed against the experimental measurements reported for the DJI–9443 rotor at 5400 RPM in hover. The baseline calculation uses the FW–H tonal-noise and BPM broadband-noise procedures described in Section 2.3; the FW–H pressure contains both loading and thickness contributions, and the two acoustic components are combined according to Equation (12).
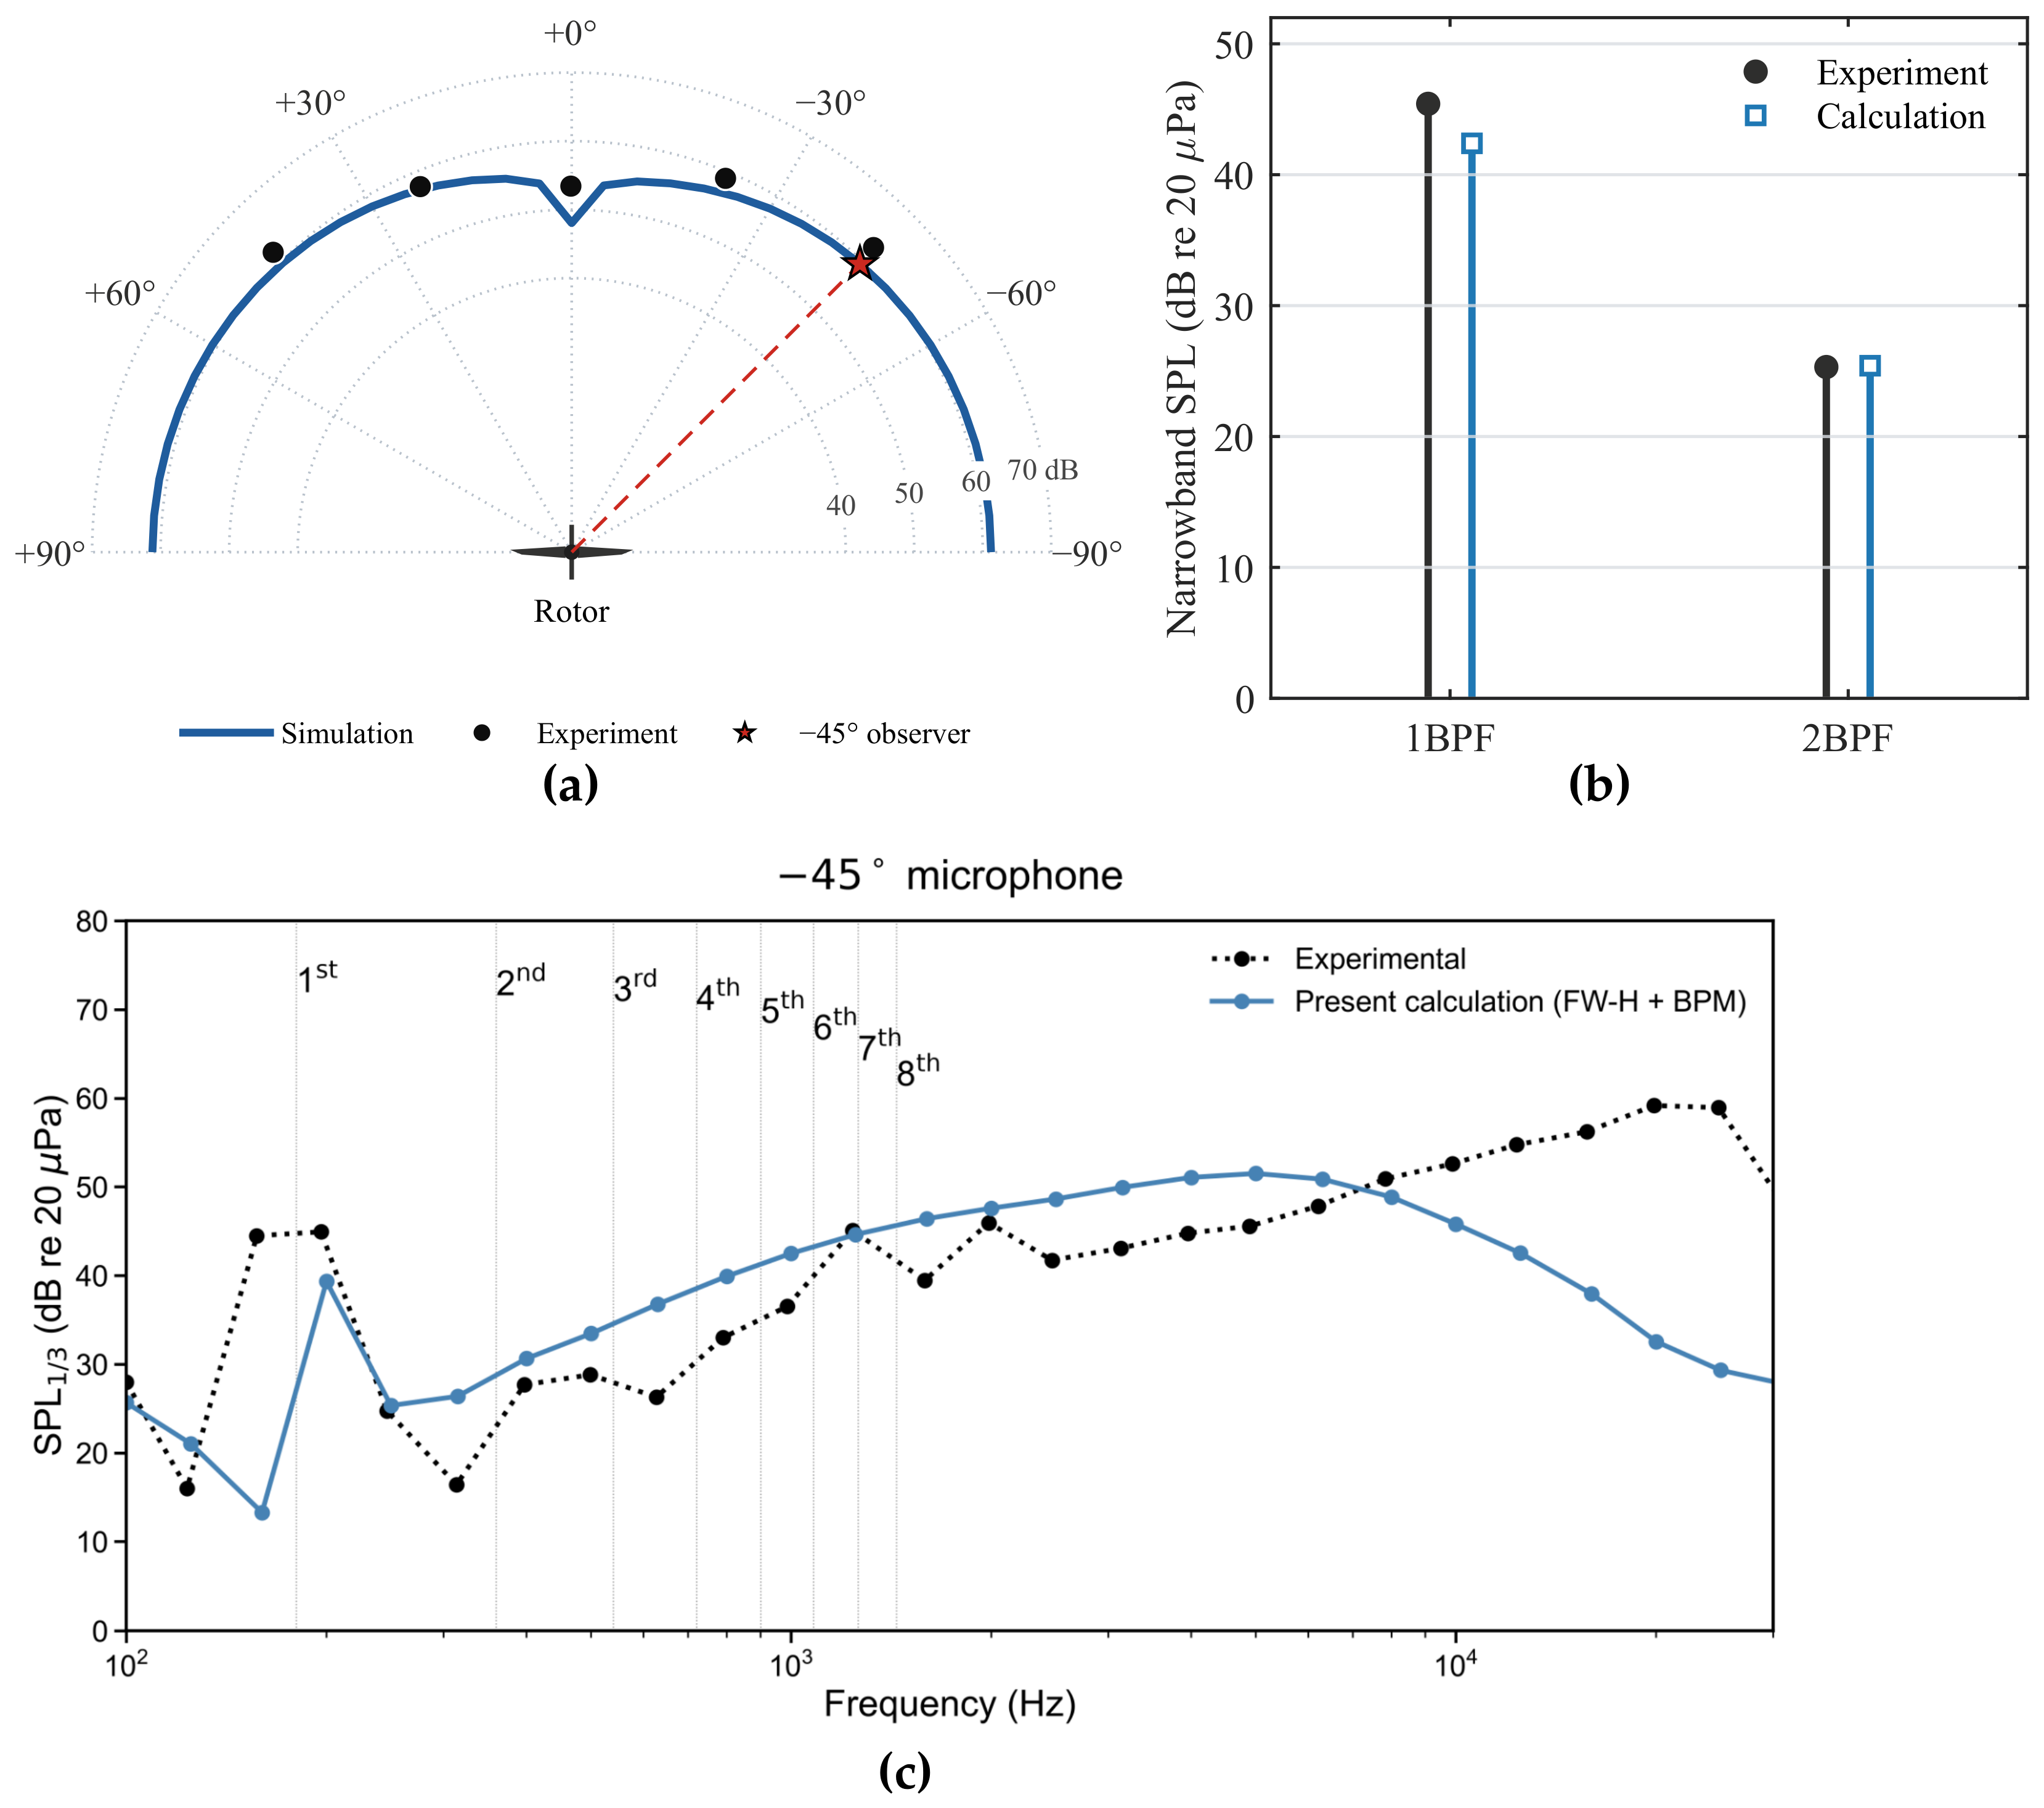
Across the five measured directions, the predicted directivity reproduces the principal angular variation observed experimentally, with a mean absolute error of 2.62 dB. The largest discrepancy occurs near the rotor-plane direction, where the numerical prediction remains lower than the measured level. This near-plane discrepancy may be influenced by this observer direction having stronger sensitivity to thickness-related radiation, together with motor/system and installation effects present in the experiment but not fully represented by the isolated-rotor calculation. At this experimental observer location, the predicted total OASPL is 59.47 dB, compared with the measured value of 62.6 dB, corresponding to an underprediction of approximately 3.13 dB. The remaining difference is also consistent with uncertainties in the semi-empirical broadband treatment and numerical resolution.
Figure 4b compares the measured and calculated low-order tonal levels at the experimental observer used for the harmonic comparison. The measured 1BPF and 2BPF levels are 45.42 and 25.31 dB, while the FW–H calculation gives 42.40 and 25.41 dB, corresponding to differences of 3.02 and + 0.10 dB, respectively. These levels are extracted from the mean-removed, coherently combined loading and thickness pressure histories using the same FFT-based mean-square definition as the harmonic results in Section 4.4.2. The low-order agreement provides a frequency-resolved assessment of the tonal prediction. Higher-order experimental tones may be sensitive to aerodynamic-source resolution, small rotational-speed fluctuations, and test-system effects that are not represented in the idealized constant-speed isolated-rotor model. Therefore, the harmonic validation focuses on 1BPF and 2BPF.
Figure 4c further assesses the prediction in the frequency domain using the published measurement at the 45 observer. For the spectral validation shown in Figure 4c, the FW–H tonal contribution and the BPM broadband contribution are first represented using the same one-third-octave-band basis and then combined energetically within each corresponding band. The resulting total one-third-octave spectrum is directly compared with the published experimental spectrum at the same observer location. The measured and predicted spectra are therefore expressed using the same one-third-octave representation, allowing a consistent band-by-band comparison. The calculation reproduces the overall spectral magnitude and the principal spectral trend reasonably well over the main frequency range, while larger discrepancies remain in several higher-frequency bands. These differences are consistent with the semi-empirical nature of the broadband model and with the fact that the measurement represents the complete rotor–motor acoustic response, whereas the present calculation contains only the aerodynamic source mechanisms represented by FW–H and BPM. In the absence of source-separated experimental spectra, strict band-by-band agreement in the mid- and high-frequency ranges is therefore difficult to achieve.
The present quantitative tonal-noise validation primarily addresses the low-order BPF components. For higher-order harmonics, the prediction reliability still requires further confirmation through order-by-order experimental comparison under consistent operating, observer, and spectral-processing conditions; source separation should also be introduced where necessary to distinguish rotor aerodynamic harmonics from motor- and system-related tonal contributions.
The agreement in the principal directivity trend, the OASPL error levels, and the low-order harmonic comparison, together with the additional one-third-octave spectral comparison, supports the use of the present framework for comparing the acoustic response of different rotor geometries. Subsequent optimization results are therefore interpreted primarily through changes relative to the baseline under the same computational framework.

4. Results and Discussion

4.1. Design-Space Exploration and Surrogate Assessment

An initial 120-point Latin hypercube design [47] provided broad coverage of the eight-dimensional parameter space, followed by adaptive sampling near the feasible high-performance boundary. The resulting database contains 304 unique designs with complete aerodynamic and acoustic responses, of which 242 satisfy the thrust-retention requirement in Equation (14). Within this thrust-feasible subset, FM [ 0.5606 , 0.6730 ] and OASPL [ 56.48 , 61.33 ] dB. Because later samples were concentrated near the high-performance boundary, the final database is denser in that region than in the interior. The database composition is summarized in Table 4.

Surrogate Model Assessment

Surrogate performance was assessed using the 304 unique complete designs and shuffled 10-fold cross-validation with a fixed random seed. For the Gaussian-process models, input and response scaling was fitted independently within each training fold. All metrics in Table 5 were calculated from out-of-fold predictions and therefore quantify generalization over the evaluated design space rather than training-set fit. The comparison includes Gaussian processes with radial basis function (RBF) and Matérn kernels, random forest, and gradient-boosted regression trees (GBRTs).
Considering the two objectives together, GBRT provides the strongest overall generalization, with the highest R 2 and the lowest RMSE for both FM and OASPL. Although GP–Matérn provides lower MAE values for both objectives, GBRT better captures the overall response variance and limits larger prediction errors. It is therefore selected for candidate ranking and sequential search. Its corresponding cross-validated thrust and torque models yield R 2 = 0.778 and 0.777 , with MAEs of 0.00158 and 9.6 × 10 5 , respectively.
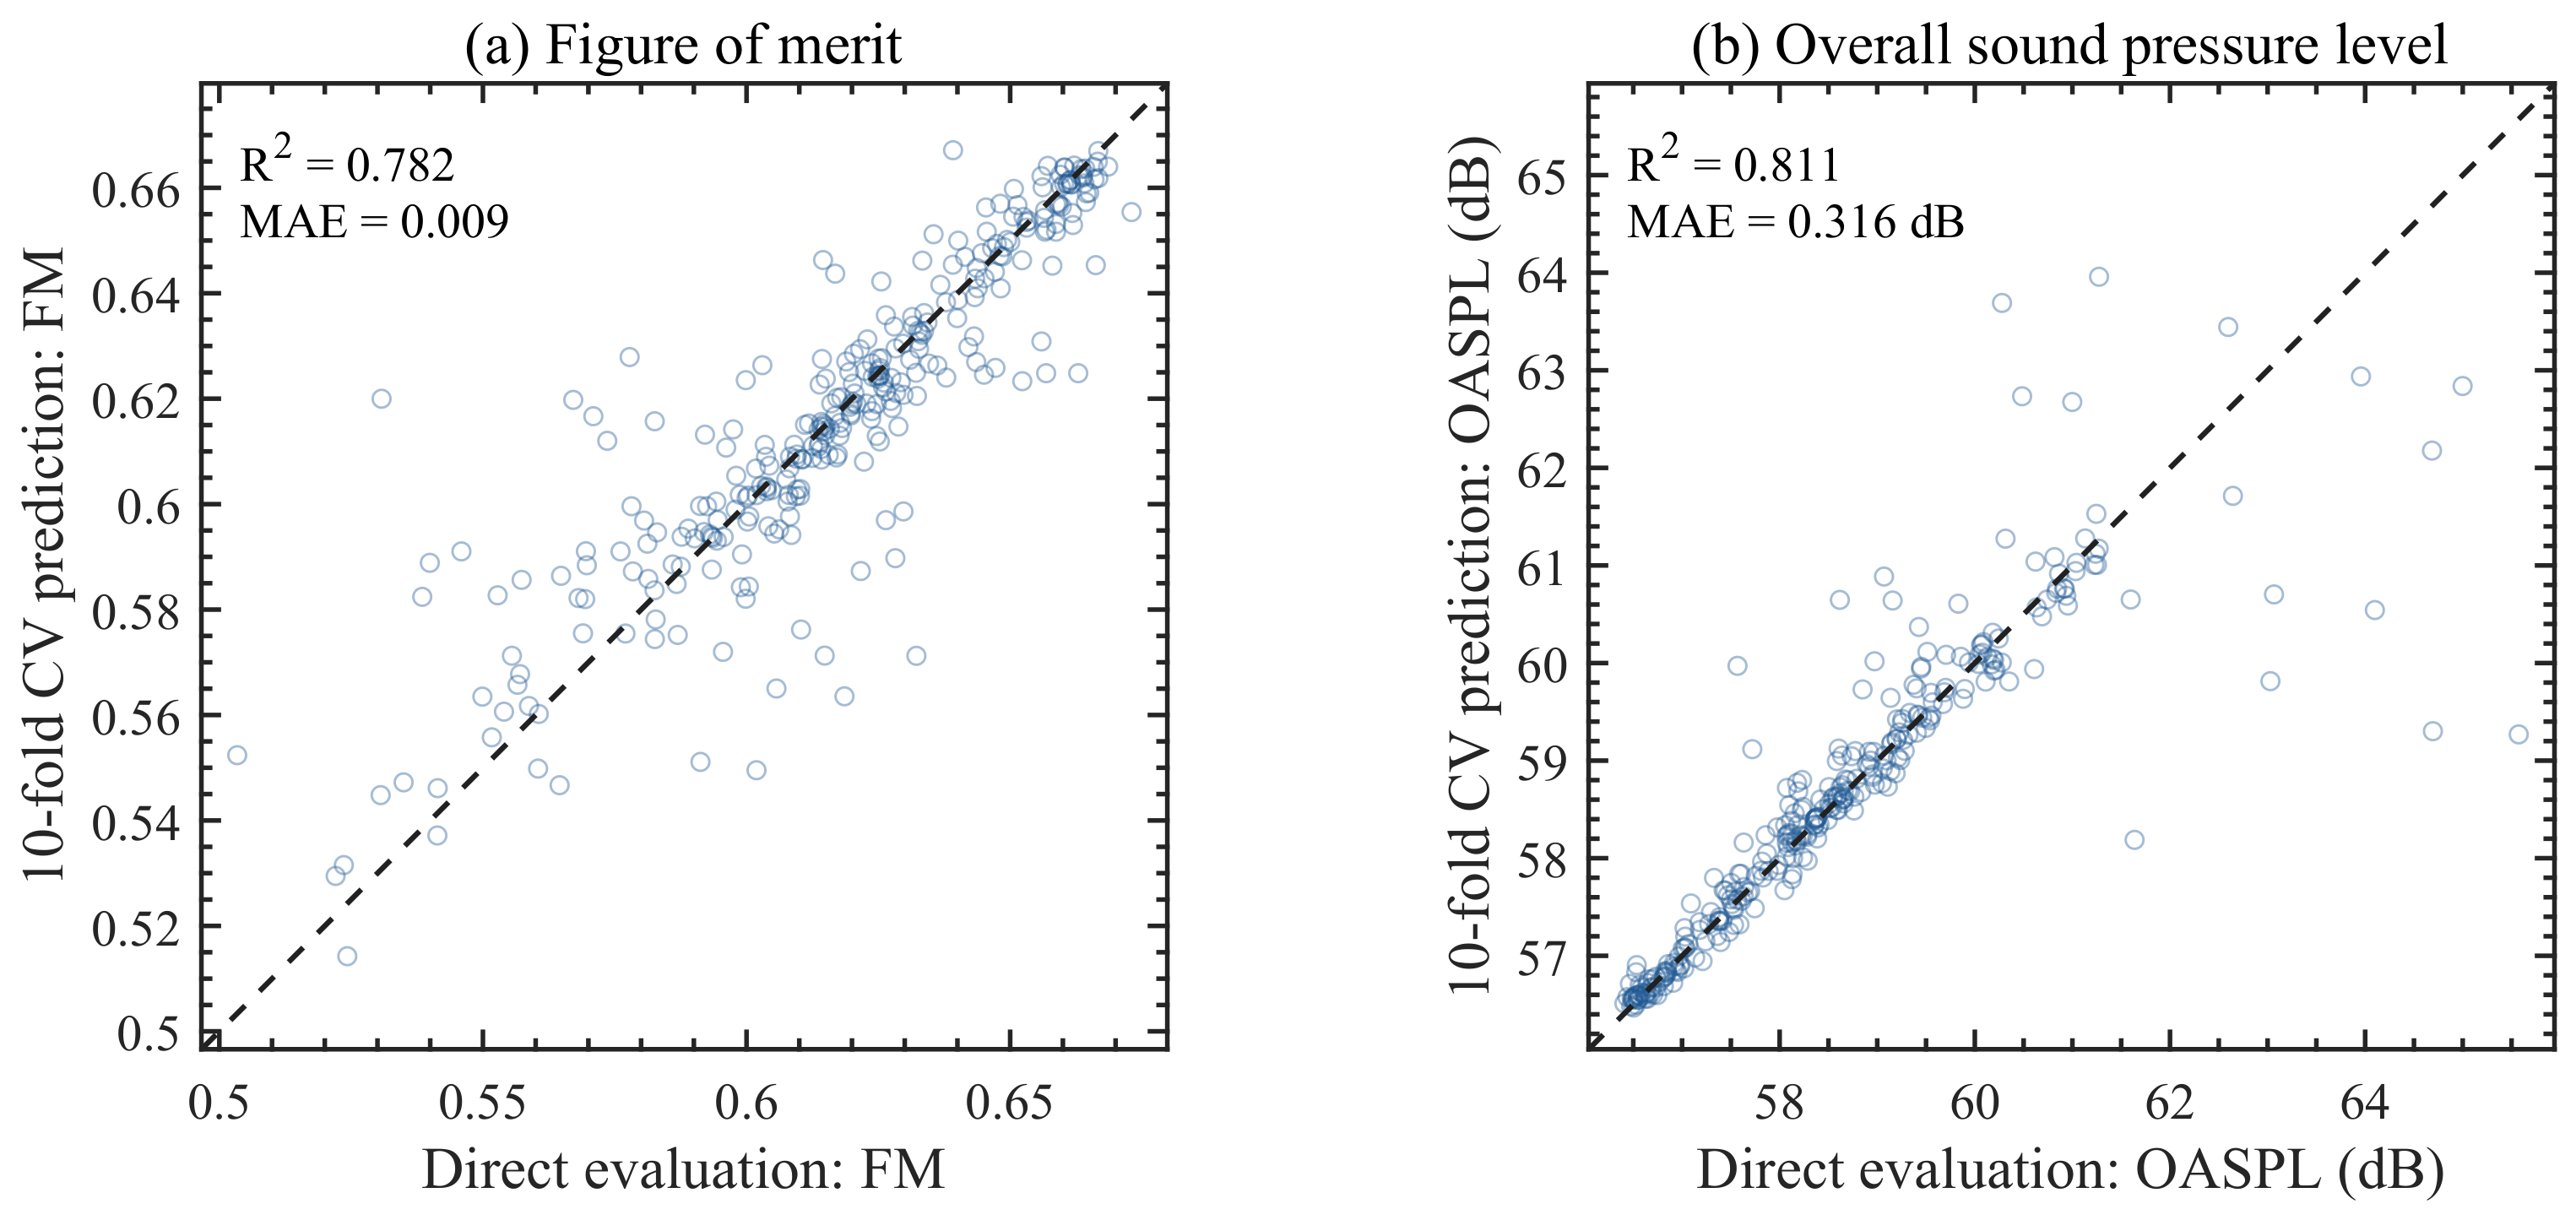
Figure 5 shows the out-of-fold GBRT predictions for the two optimization objectives. Most designs remain close to the line of perfect agreement, whereas the residual spread increases near the more sparsely populated response extremes. The lower FM accuracy is also consistent with FM being a nonlinear combination of thrust and torque, for which errors in both responses propagate into a comparatively narrow efficiency range. These results support the use of GBRT for candidate ranking and sequential search.

4.2. Pareto Front and Representative Designs

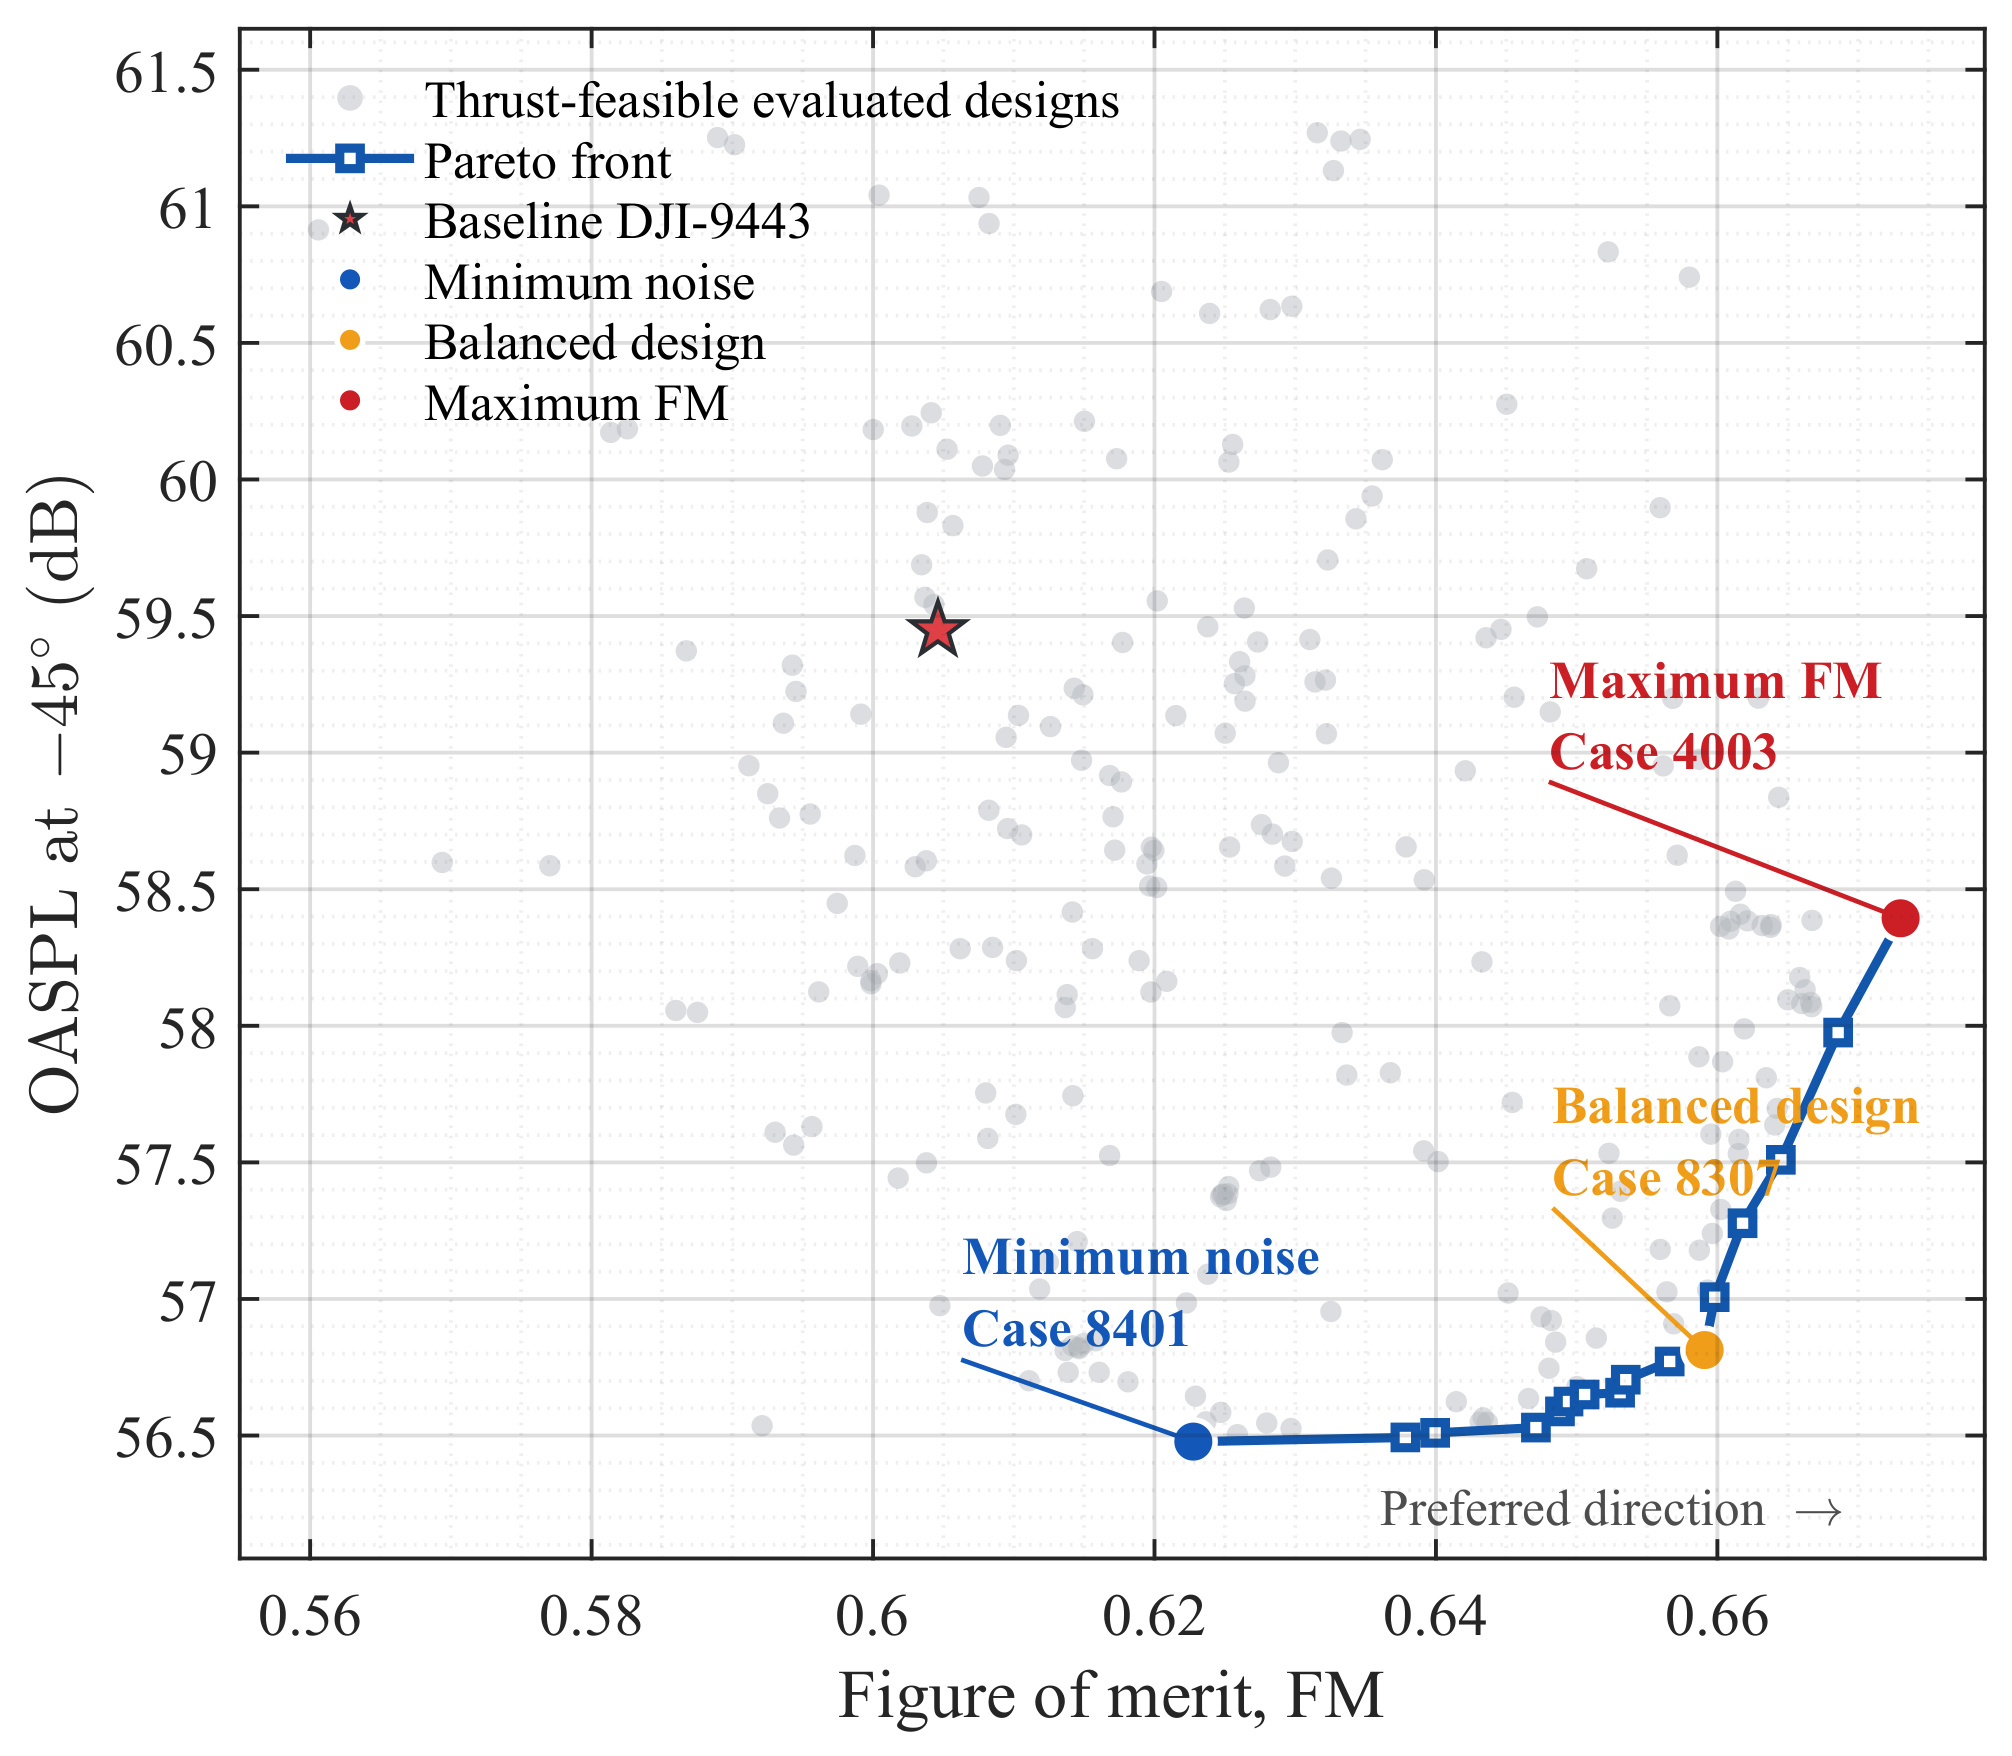
Non-dominated sorting [40] of the 242 thrust-feasible evaluated designs identifies 16 Pareto designs. Figure 6 presents their distribution in the FM–OASPL objective space. The Pareto front spans FM [ 0.6228 , 0.6730 ] and OASPL [ 56.48 , 58.39 ] dB. Its comparatively even coverage results from the later targeted evaluations, which reduced the former gap between the low-noise endpoint and the higher-FM branch.
Table 6 compares three representative positions on the Pareto front with the baseline. The minimum-noise endpoint gives the lowest OASPL, and the maximum-FM endpoint gives the highest FM. The balanced design is selected using equal weights and the Euclidean distance to the empirical ideal point,
d i = FM max FM i FM max FM min 2 + L i L min L max L min 2 1 / 2 ,
where L i denotes OASPL and the extrema are evaluated over the 16-point Pareto front. Their database identifiers are retained only for traceability. All three improve both objectives relative to the baseline, although the minimum-noise endpoint lies close to the thrust-retention limit.
The Pareto designs achieve higher FM and lower OASPL than the baseline. Across the full set of 242 thrust-feasible designs, however, FM and OASPL exhibit only a weak negative rank correlation ( ρ s = 0.256 ), with a similar Pearson correlation ( r = 0.274 ). The evaluated design space therefore contains geometric changes that improve or degrade both responses together.
Within the Pareto front, progression from the minimum-noise endpoint toward the maximum-FM endpoint increases both FM and OASPL, revealing a local efficiency–noise trade-off. The geometric variables associated with this behavior are examined in Section 4.3.
To assess the representative geometries at equal thrust, the baseline and three representative designs were recalculated at the baseline thrust of 1.98250 N using the thrust-matching procedure described in Section 2.4. Table 7 summarizes the converged operating points. All thrust errors are below 0.03%, well inside the prescribed tolerance. The listed speeds are the converged results of iterative ten-revolution recalculations rather than estimates from a single coefficient scaling.
The simultaneous efficiency and acoustic gains therefore persist when the representative rotors are compared at the same task thrust. The minimum-noise geometry remains the quietest of the three representative designs, with an OASPL of 56.78 dB and a 2.61 dB reduction relative to the baseline. Although restoring its thrust requires a modest increase in rotational speed, its principal acoustic benefit is retained. The balanced design similarly retains a 2.24 dB reduction at the thrust-matched condition. In contrast, the high-loading maximum-FM geometry reaches the target thrust at 5026.86 RPM and achieves an OASPL of 56.89 dB, corresponding to a 2.50 dB reduction relative to the baseline. Its reduced rotational speed therefore provides an additional acoustic benefit under equal-thrust operation.
At the common thrust, the shaft power decreases from 14.83 W for the baseline to 14.39, 13.60, and 13.32 W for the minimum-noise, balanced, and maximum-FM geometries, corresponding to reductions of 2.91, 8.27, and 10.15%, respectively. Although this comparison is limited to the three representative designs, their retained simultaneous improvements support the robustness of the selected fixed-speed geometries under thrust-matched operation.

4.3. Parameter Sensitivity Analysis

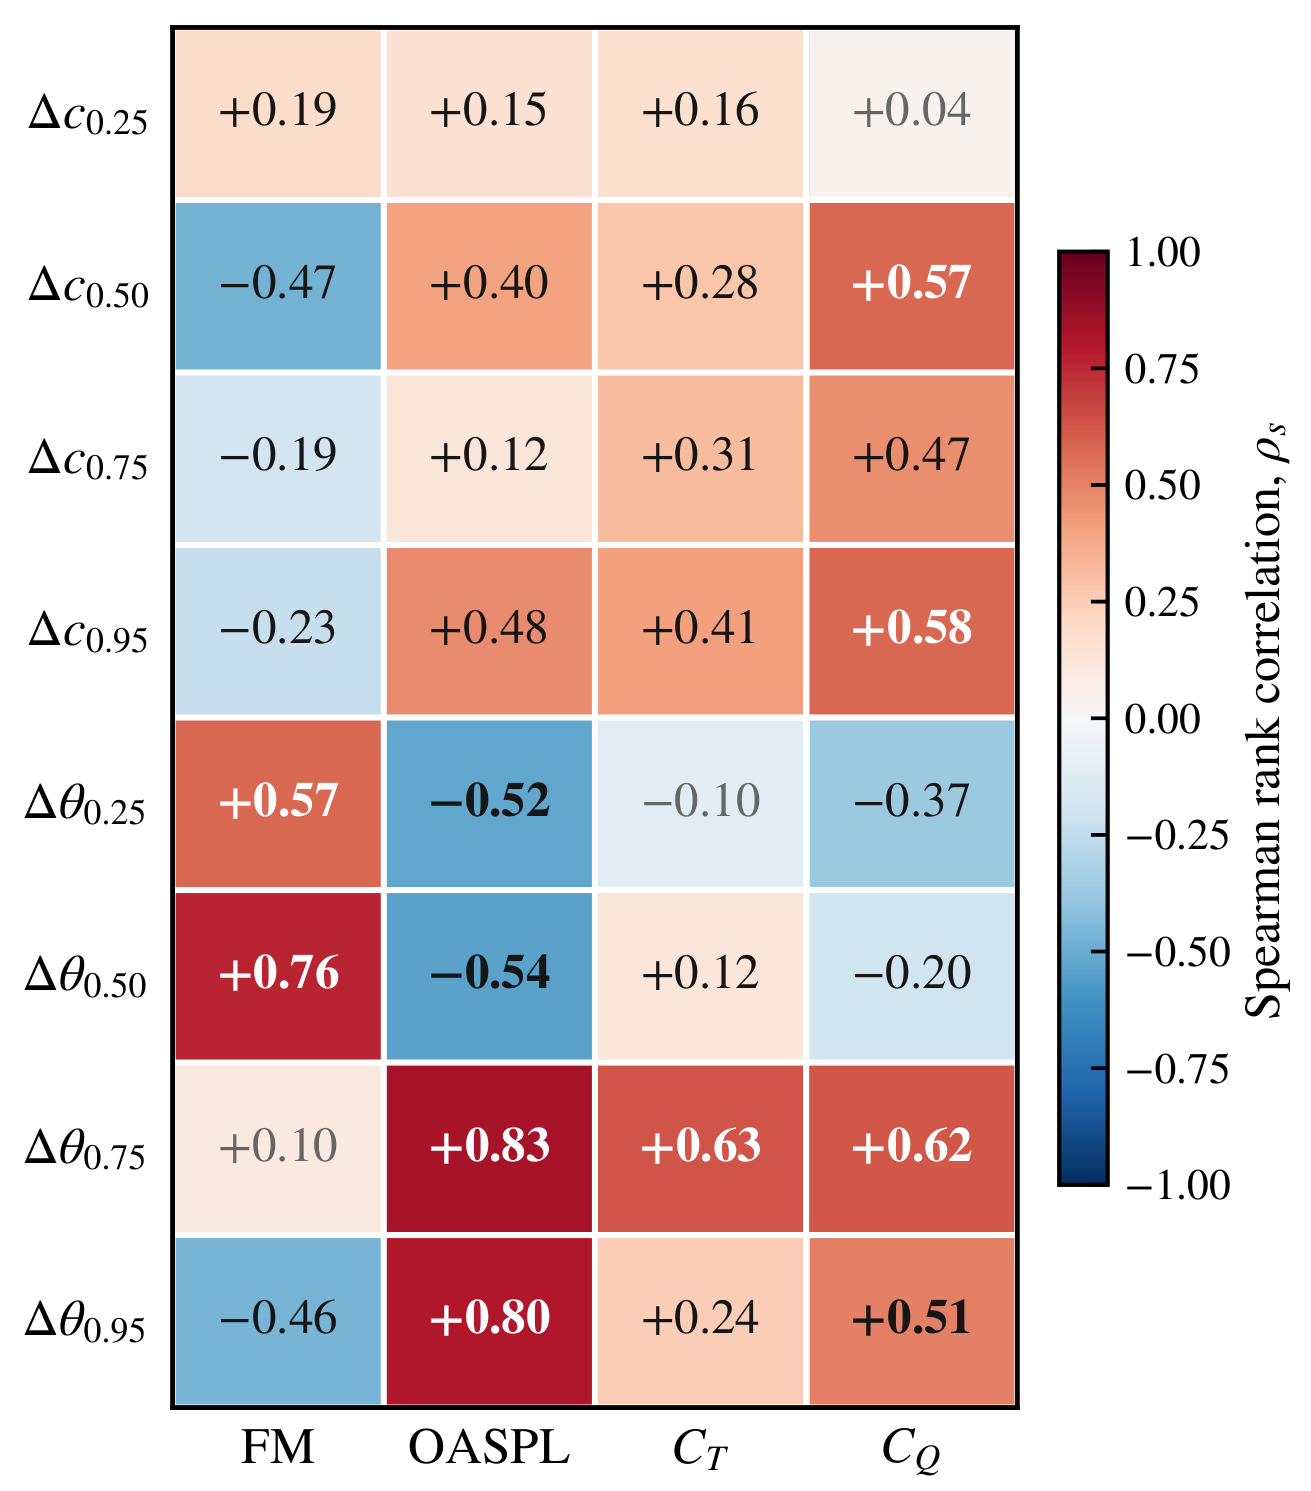
Spearman rank correlation coefficients [52] were calculated over the 242 thrust-feasible designs to quantify monotonic associations between the eight geometric variables and the aerodynamic and acoustic responses. Because the database was enriched adaptively near the high-performance region and the design variables may interact, the coefficients characterize monotonic trends within the sampled design space. The resulting correlation matrix is shown in Figure 7.

4.3.1. Aerodynamic Efficiency

The mid-span twist perturbation Δ θ 0.50 has the strongest positive association with FM ( ρ s = 0.763 ), followed by the inboard twist Δ θ 0.25 ( ρ s = 0.572 ). The strongest chord association is observed for Δ c 0.50 ( ρ s = 0.473 ), while the tip-twist perturbation Δ θ 0.95 is also negatively associated with FM ( ρ s = 0.463 ). The higher-FM region is therefore associated with increased inboard and mid-span twist, reduced mid-span chord, and restrained tip twist. Because all variables were varied simultaneously, these coefficients describe coupled chord–twist reshaping rather than isolated one-dimensional effects.
The correlations with C T and C Q provide additional context for these efficiency trends. The mid-span twist perturbation Δ θ 0.50 is only weakly associated with C T ( ρ s = 0.123 ) but is negatively associated with C Q ( ρ s = 0.202 ). Conversely, Δ c 0.50 is positively associated with torque ( ρ s = 0.571 ) while being negatively associated with FM. This pattern suggests that the favorable mid-span modifications improve the thrust–torque balance rather than merely increasing the total blade loading.

4.3.2. Acoustic Response

The strongest monotonic associations with OASPL occur for the outer-span twist variables. The largest coefficient is obtained for Δ θ 0.75 ( ρ s = 0.825 ), followed by Δ θ 0.95 ( ρ s = 0.798 ). Therefore, increasing either variable is strongly associated with higher noise. In contrast, Δ θ 0.50 and Δ θ 0.25 are negatively correlated with OASPL ( ρ s = 0.535 and 0.516 , respectively). These opposing trends are consistent with shifting useful loading toward the inner and middle blade regions while avoiding excessive loading over the acoustically sensitive outer span.
Chord changes also contribute to the acoustic response. In particular, Δ c 0.95 and Δ c 0.50 are positively associated with OASPL ( ρ s = 0.477 and 0.400 , respectively). The outer-span acoustic response cannot therefore be interpreted through twist alone because the local chord and twist changes jointly affect sectional loading and broadband self-noise.

4.3.3. Implications for the Pareto Set

Two geometric tendencies are consistent across the Pareto front. First, Δ θ 0.50 is positively associated with FM and negatively associated with OASPL, and all Pareto designs employ a positive mid-span twist perturbation of approximately 2.27 2.84 . Second, Δ θ 0.95 is negatively associated with FM but positively associated with OASPL, and every Pareto design employs a negative tip-twist perturbation of approximately 2.18 2.62 . Increased mid-span twist and reduced tip twist therefore emerge as common geometric features of the optimized blade family.
The role of Δ θ 0.75 requires a more precise interpretation. It is strongly correlated with OASPL, C T , and C Q ( ρ s = 0.825 , 0.627 , and 0.618 , respectively), whereas its association with FM over the complete thrust-feasible database is weak ( ρ s = 0.101 ). Along the Pareto front, however, Δ θ 0.75 progresses from negative values on the low-noise branch toward near-zero or positive values on the high-FM branch. It is therefore better interpreted as an indicator of position along the local efficiency–noise trade-off than as a globally dominant efficiency variable. The spanwise loading analysis in the following section examines this proposed radial redistribution directly rather than inferring it from geometry and correlation alone.

4.4. Aerodynamic and Aeroacoustic Mechanisms

To interpret these associations physically, the baseline rotor is compared with the minimum-noise, balanced, and maximum-FM designs at 5400 RPM. The analysis proceeds from geometry and spanwise loading to the FW–H tonal and BPM acoustic contributions, angular directivity, frequency-domain response, and wake structure. Rotor-axis-plane wake fields provide complementary spatial evidence for the baseline and the two fixed-speed endpoints. The thrust-matched results in Section 4.2 provide an additional equal-thrust assessment.

4.4.1. Geometry and Aerodynamic Loading

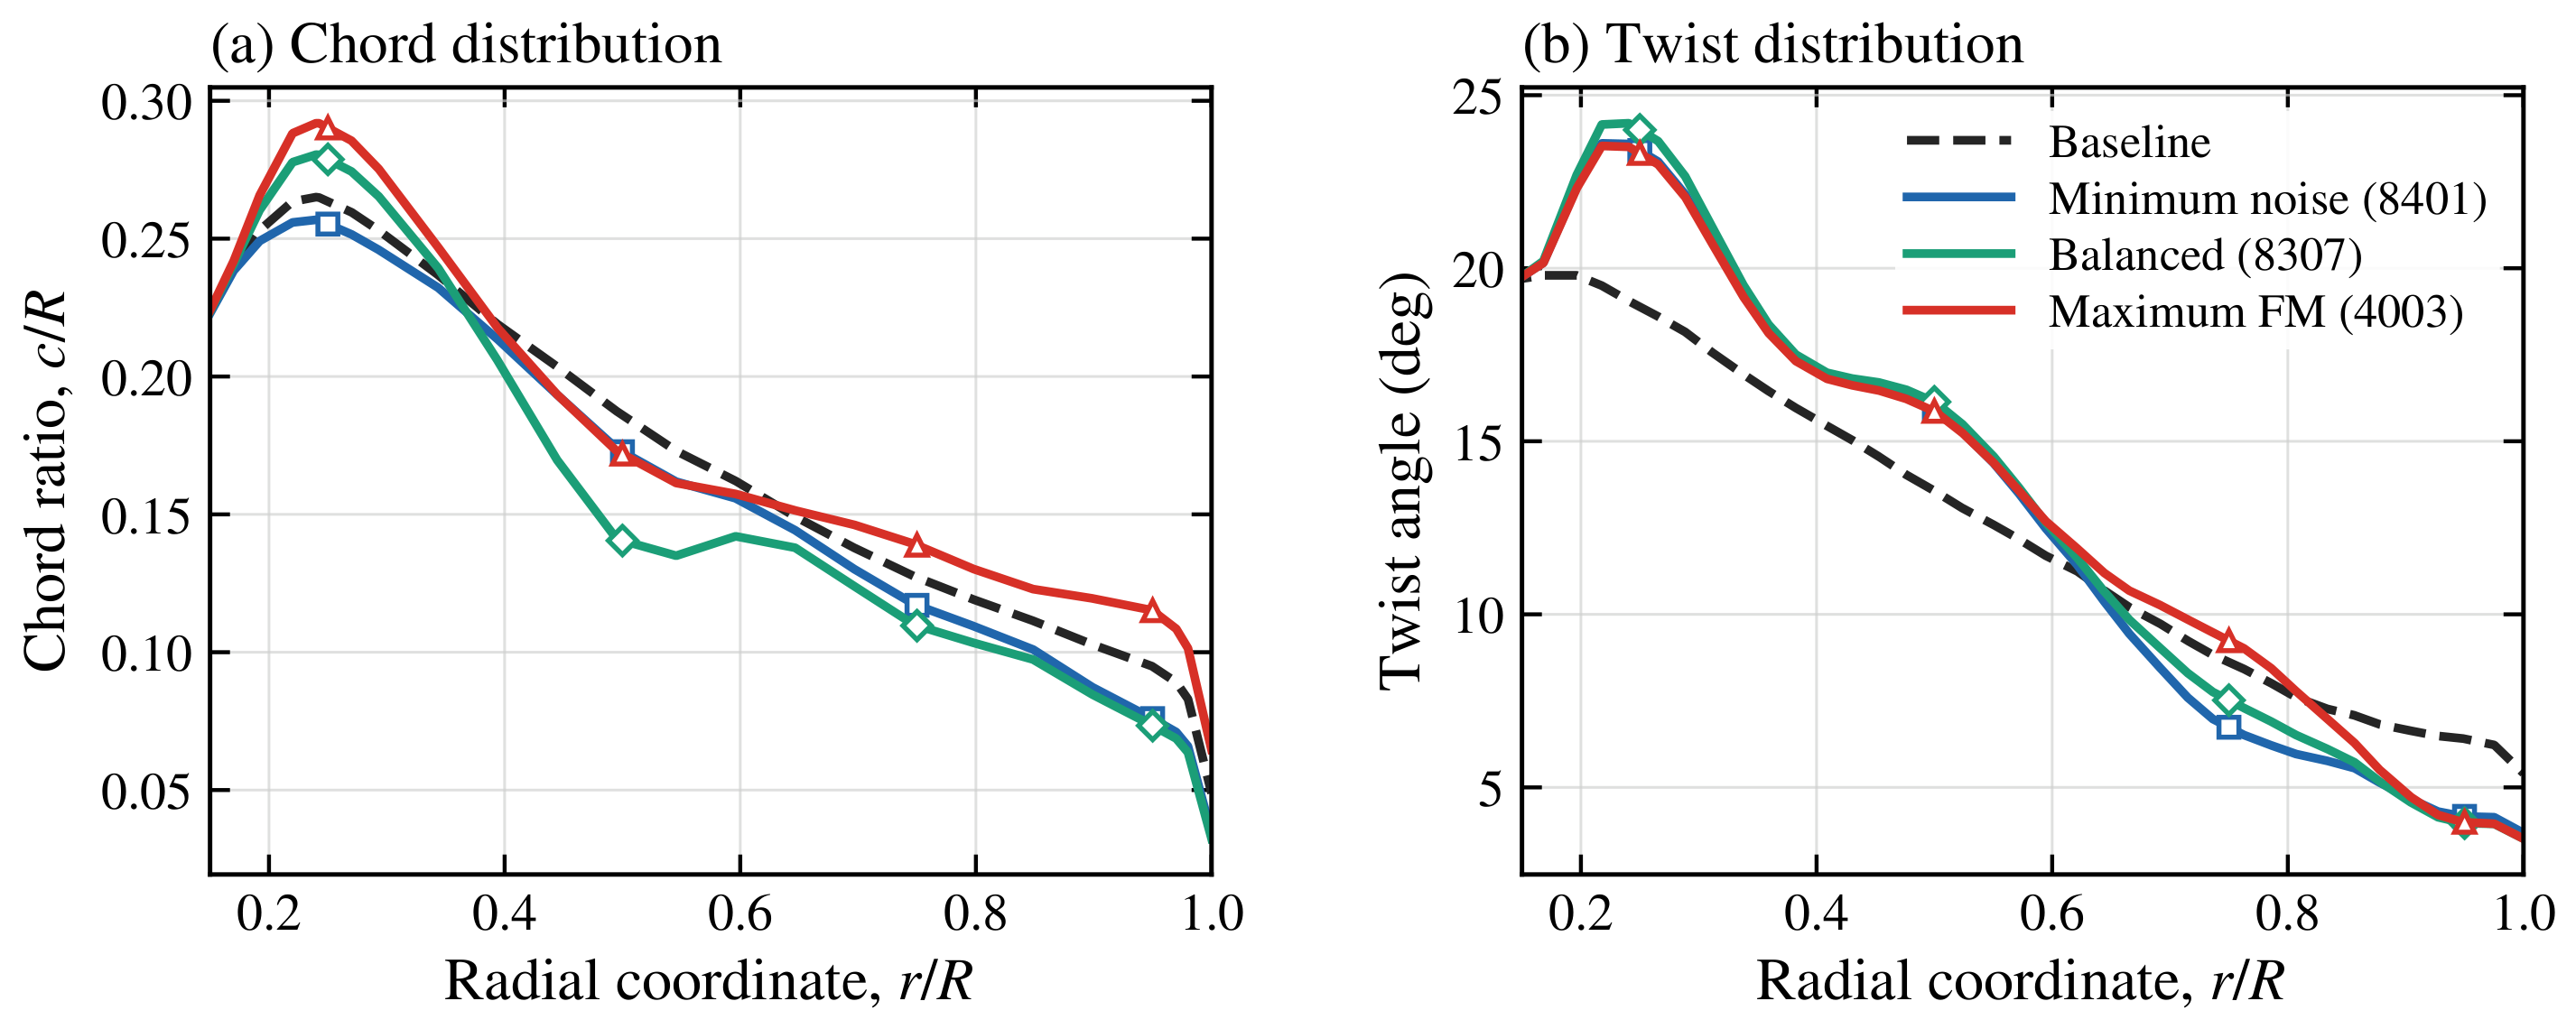
Figure 8 compares the chord and twist distributions of the baseline rotor and three representative designs. All three optimized designs increase the inboard and mid-span twist while retaining a negative twist perturbation at r / R = 0.95 . Differences among the representative designs are most apparent near r / R = 0.75 : the minimum-noise and balanced designs reduce the outer-span twist, whereas the maximum-FM design uses a slightly positive perturbation at this station. The chord changes are less uniform. The minimum-noise design reduces chord at all four control stations, the balanced design combines an inboard increase with mid- and outer-span reductions, and the maximum-FM design retains more chord toward the outer blade. The optimized family is therefore characterized by coupled chord–twist reshaping rather than uniform scaling of the baseline geometry.
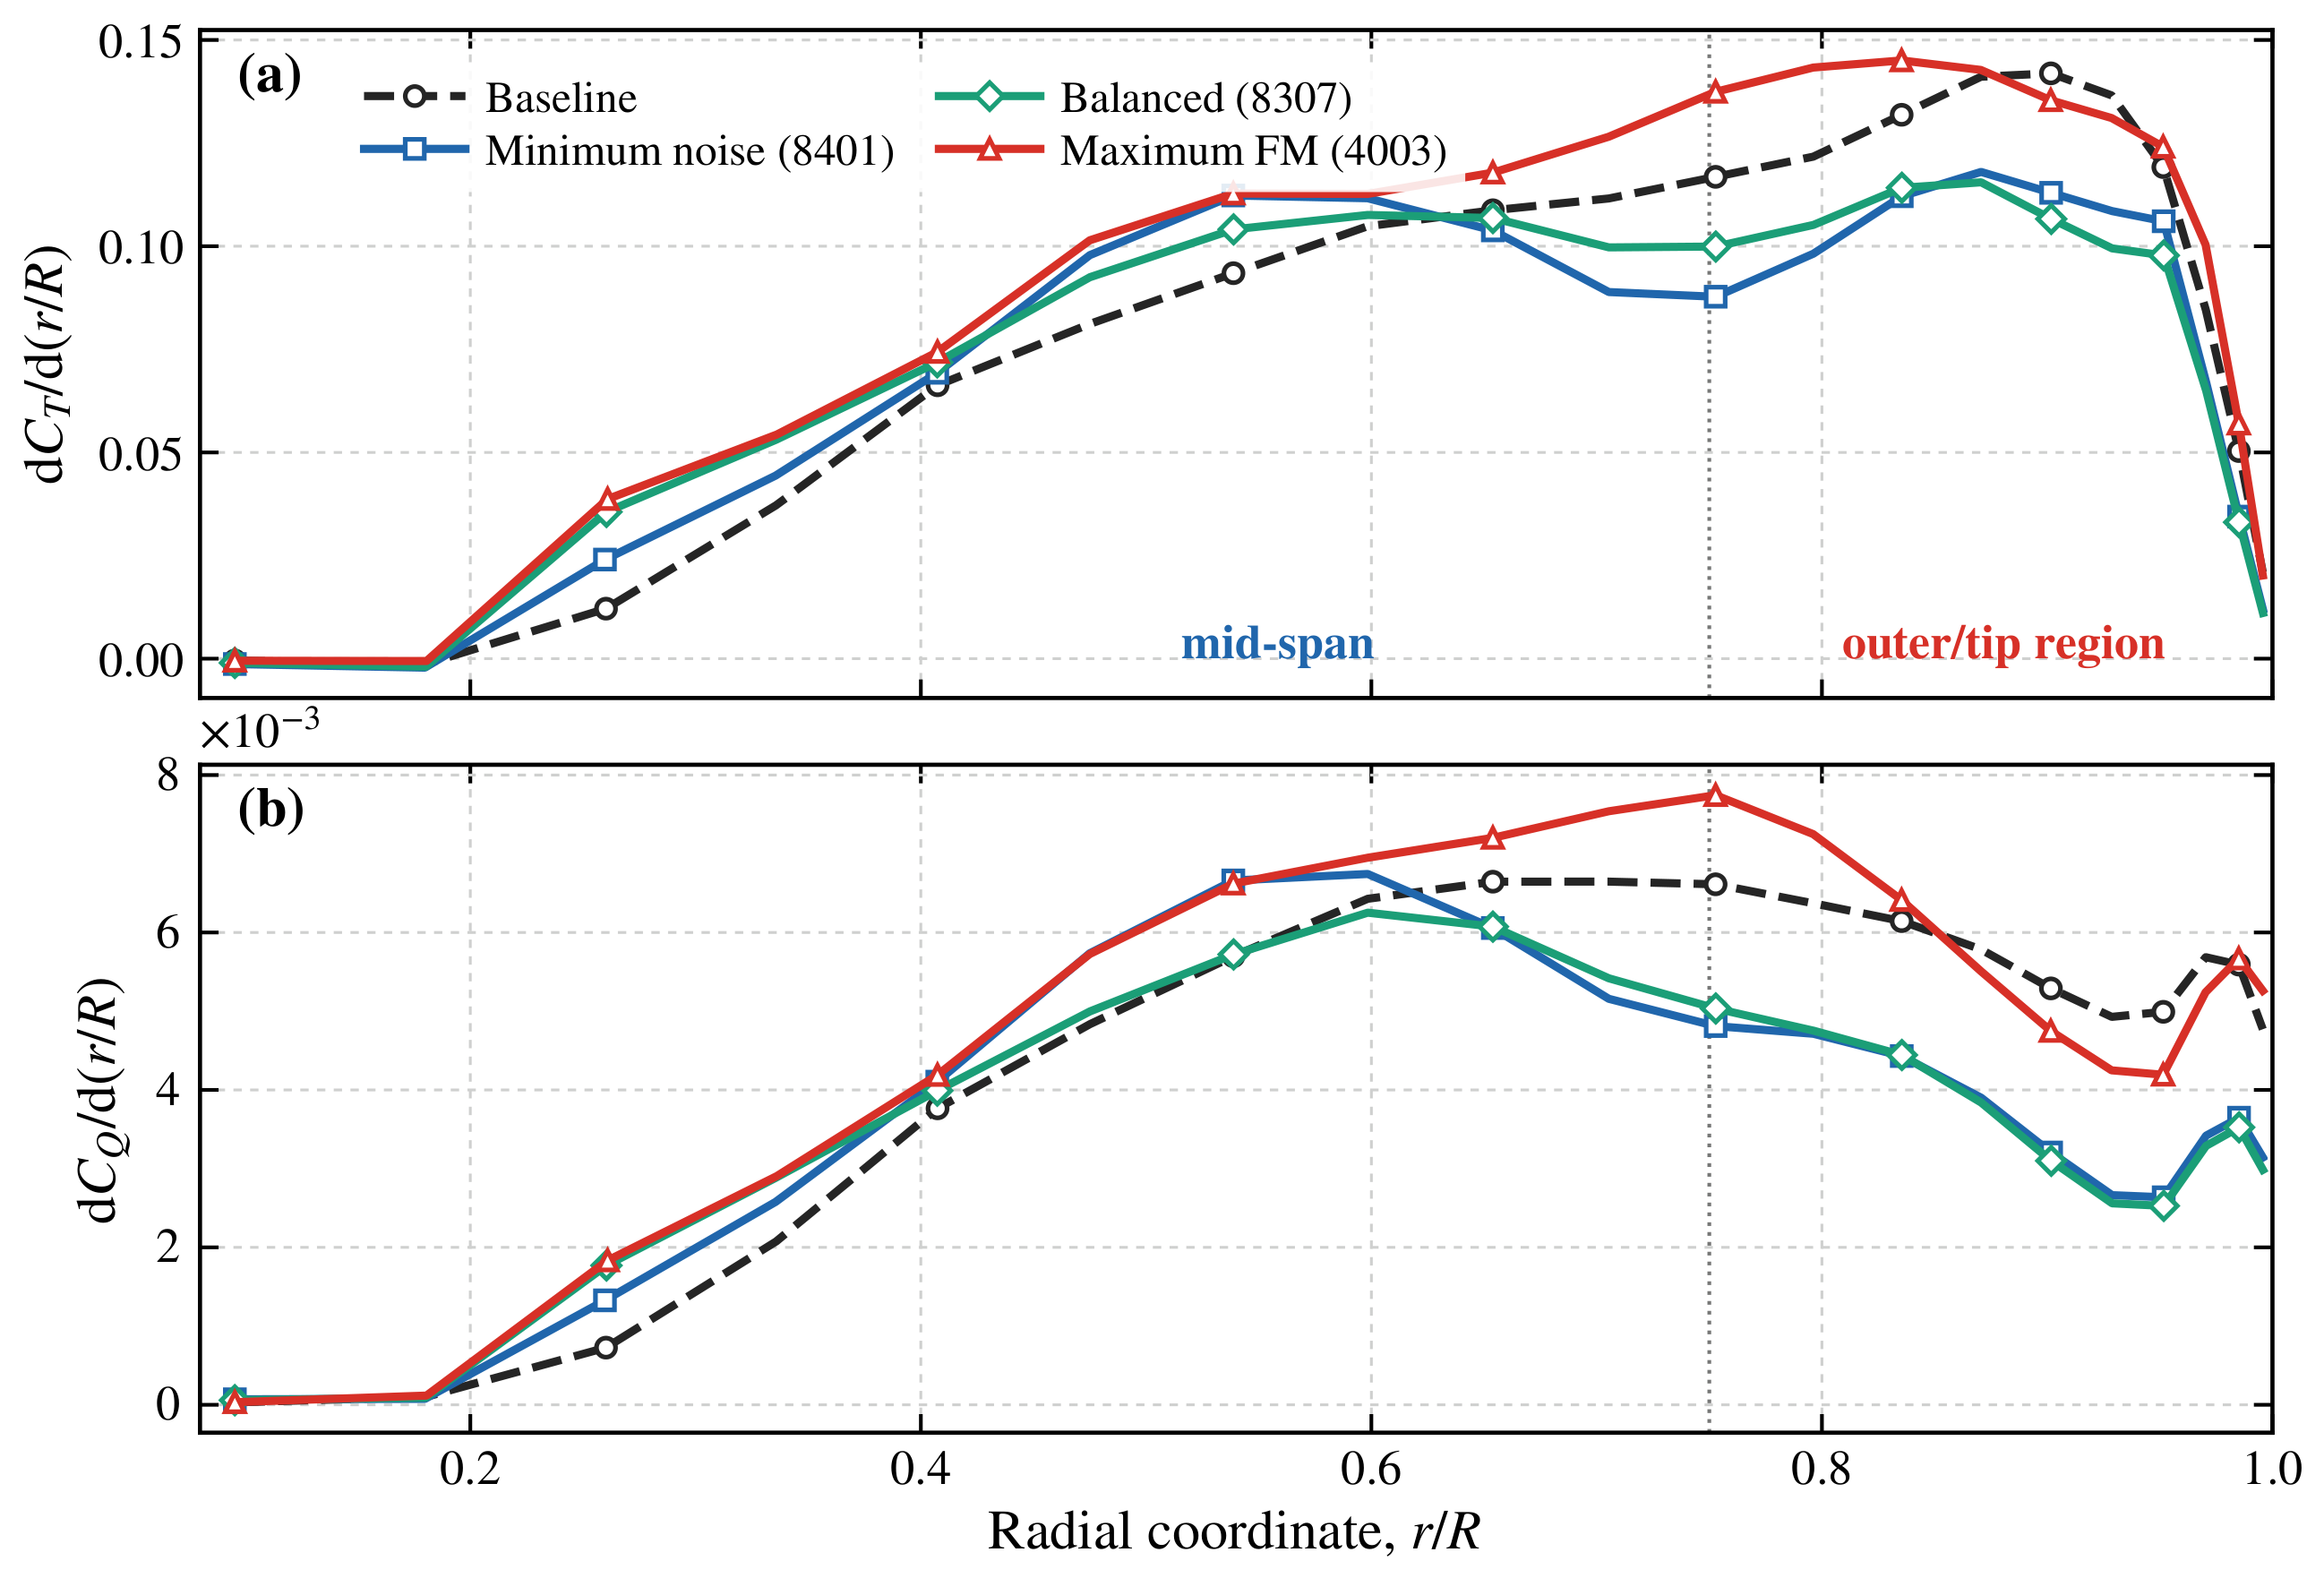
To determine how these geometric changes alter the aerodynamic loading, Figure 9 compares the sectional thrust and torque coefficients on a common absolute scale. The distributions satisfy
0 1 d C T d ( r / R ) d ( r / R ) = C T , 0 1 d C Q d ( r / R ) d ( r / R ) = C Q ,
so differences between curves retain their absolute coefficient scale rather than being obscured by normalization to the maximum of each design. The numerical integrals recover the independently reported C T and C Q to within 0.14% and 0.51%, respectively. For the regional comparisons below, the blade is divided at r / R = 0.45 and 0.75 into inboard, mid-span, and outer-span regions.
The minimum-noise design operates close to the thrust-retention limit and reduces total thrust by 4.9% relative to the baseline. This reduction is not uniform: its absolute thrust contribution increases by 18.8% inboard and 4.5% at mid-span, while the outer-span contribution decreases by 19.2%. The corresponding outer-span torque contribution decreases by 33.0%. The required thrust is therefore retained by moving part of the aerodynamic loading away from the high-speed outer blade, rather than by unloading the entire span.
The balanced design exhibits a similar redistribution with a more favorable thrust–power balance. Its total C T is only 2.7% below the baseline, whereas C Q is reduced by approximately 11.9%. Relative to the baseline, its outer-span thrust and torque contributions decrease by 18.6% and 33.2%, respectively, while the inboard thrust contribution increases by 39.9%. The larger reduction in torque than in thrust explains the 9.0% increase in FM and distinguishes this design from a uniformly lower-loaded rotor.
The maximum-FM design follows a different mechanism. Its total C T is 15.5% above the baseline, and its absolute outer-span thrust contribution is 7.7% higher. However, the outer-span torque contribution increases by only 2.4%, and total C Q increases by approximately 11.5%. Since FM scales with C T 3 / 2 / C Q for the present coefficient definitions, the thrust gain outpaces the torque penalty. This endpoint is therefore better described as enhanced spanwise thrust production with controlled torque growth, rather than as an absolute tip-unloading design.
These results refine the tendency inferred from the sensitivity analysis. Increased mid-span twist and restrained tip twist recur across the optimized family, but they do not produce one universal loading response. The minimum-noise and balanced designs shift absolute thrust and torque away from the outer span, whereas the maximum-FM design retains substantial outer-span thrust and achieves a more favorable overall thrust– torque scaling.

4.4.2. Acoustic Contributions, Directivity, and Frequency-Domain Response

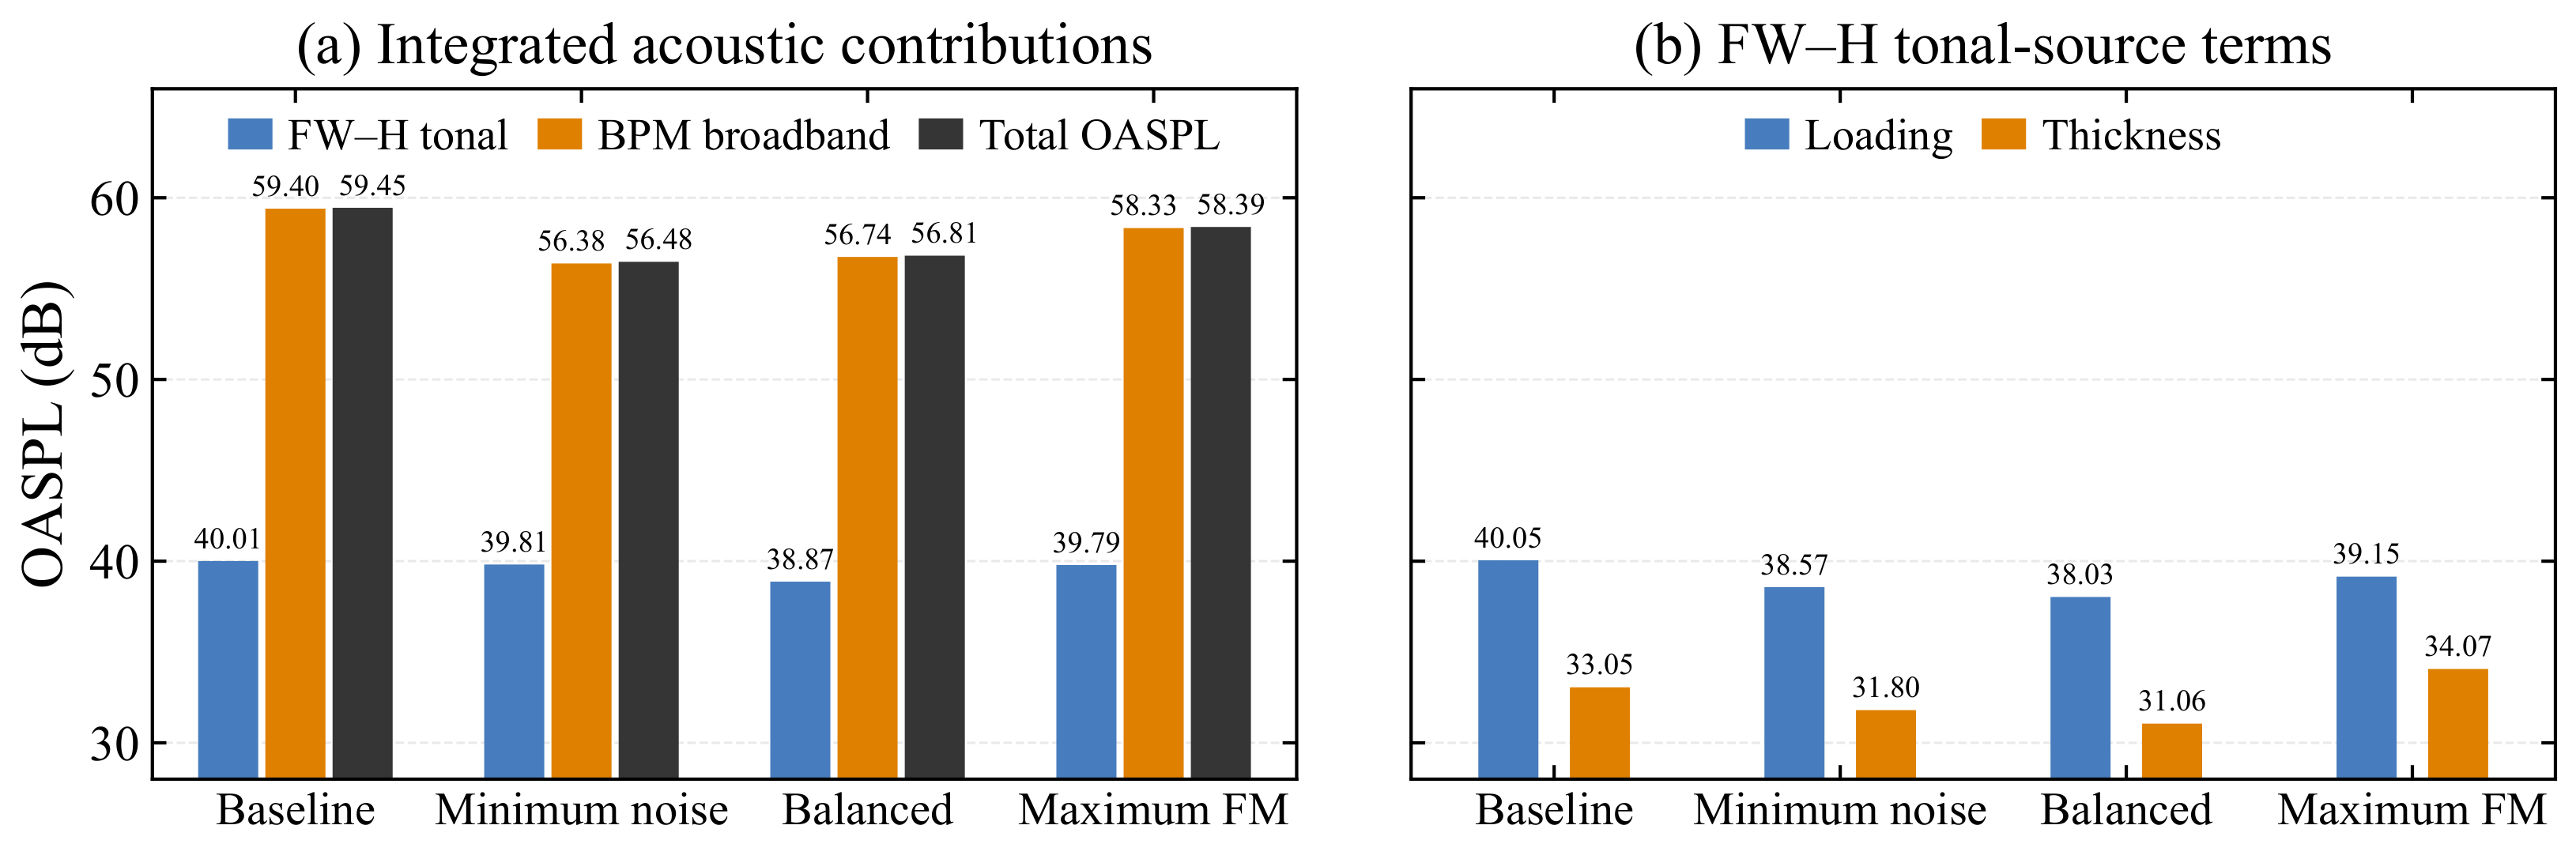
The acoustic response is examined through integrated source contributions, angular radiation, and frequency-dependent behavior. Figure 10a compares the integrated FW–H tonal, BPM broadband, and total OASPL levels of the baseline and representative Pareto designs at the 45 optimization observer. For the present cases, the separation among the representative designs in total OASPL is largely reflected in the corresponding changes in the BPM broadband levels, whereas the integrated FW–H tonal levels vary over a comparatively narrower range. The broadband response therefore contributes substantially to the overall acoustic differences among the representative designs, while the FW–H analysis reveals changes in the low-order BPF harmonics and tonal-source composition. The distinct roles of tonal and broadband components are also consistent with previous experimental and computational rotor-noise studies [20,53].
The minimum-noise design achieves the largest overall noise reduction, lowering the total OASPL by 2.97 dB relative to the baseline. More notably, the balanced design reaches 56.81 dB, only 0.33 dB above the minimum-noise design, while providing substantially higher aerodynamic efficiency. It therefore retains most of the acoustic benefit of the minimum-noise solution at a more favorable aerodynamic operating point. In contrast, the maximum-FM design represents the high-efficiency end of the local Pareto trade-off and provides a smaller acoustic improvement.
For the minimum-noise and balanced designs, the lower broadband levels occur together with the chord–twist reshaping and spanwise loading redistribution shown in Figure 8 and Figure 9. Both designs reduce the loading contribution of the high-speed outer blade region while retaining or increasing part of the thrust contribution over the inboard and mid-span regions, consistent with the accompanying reduction in broadband self-noise.
Figure 10b shows that the two FW–H source terms respond differently to blade reshaping. Both the loading and thickness levels decrease for the minimum-noise and balanced designs, whereas the maximum-FM design exhibits a lower loading level but a higher thickness level than the baseline. The change in the loading term is associated with the modified aerodynamic-force distribution, whereas the thickness term is more directly influenced by blade geometry and surface motion. In particular, the maximum-FM design retains a greater amount of chord toward the outer blade; because the local relative thickness t / c is preserved, this also corresponds to greater absolute blade thickness in that region and is consistent with the increase in its thickness term. The complete tonal response results from the coherent superposition of the loading and thickness pressures and therefore depends on both their amplitudes and relative phase.
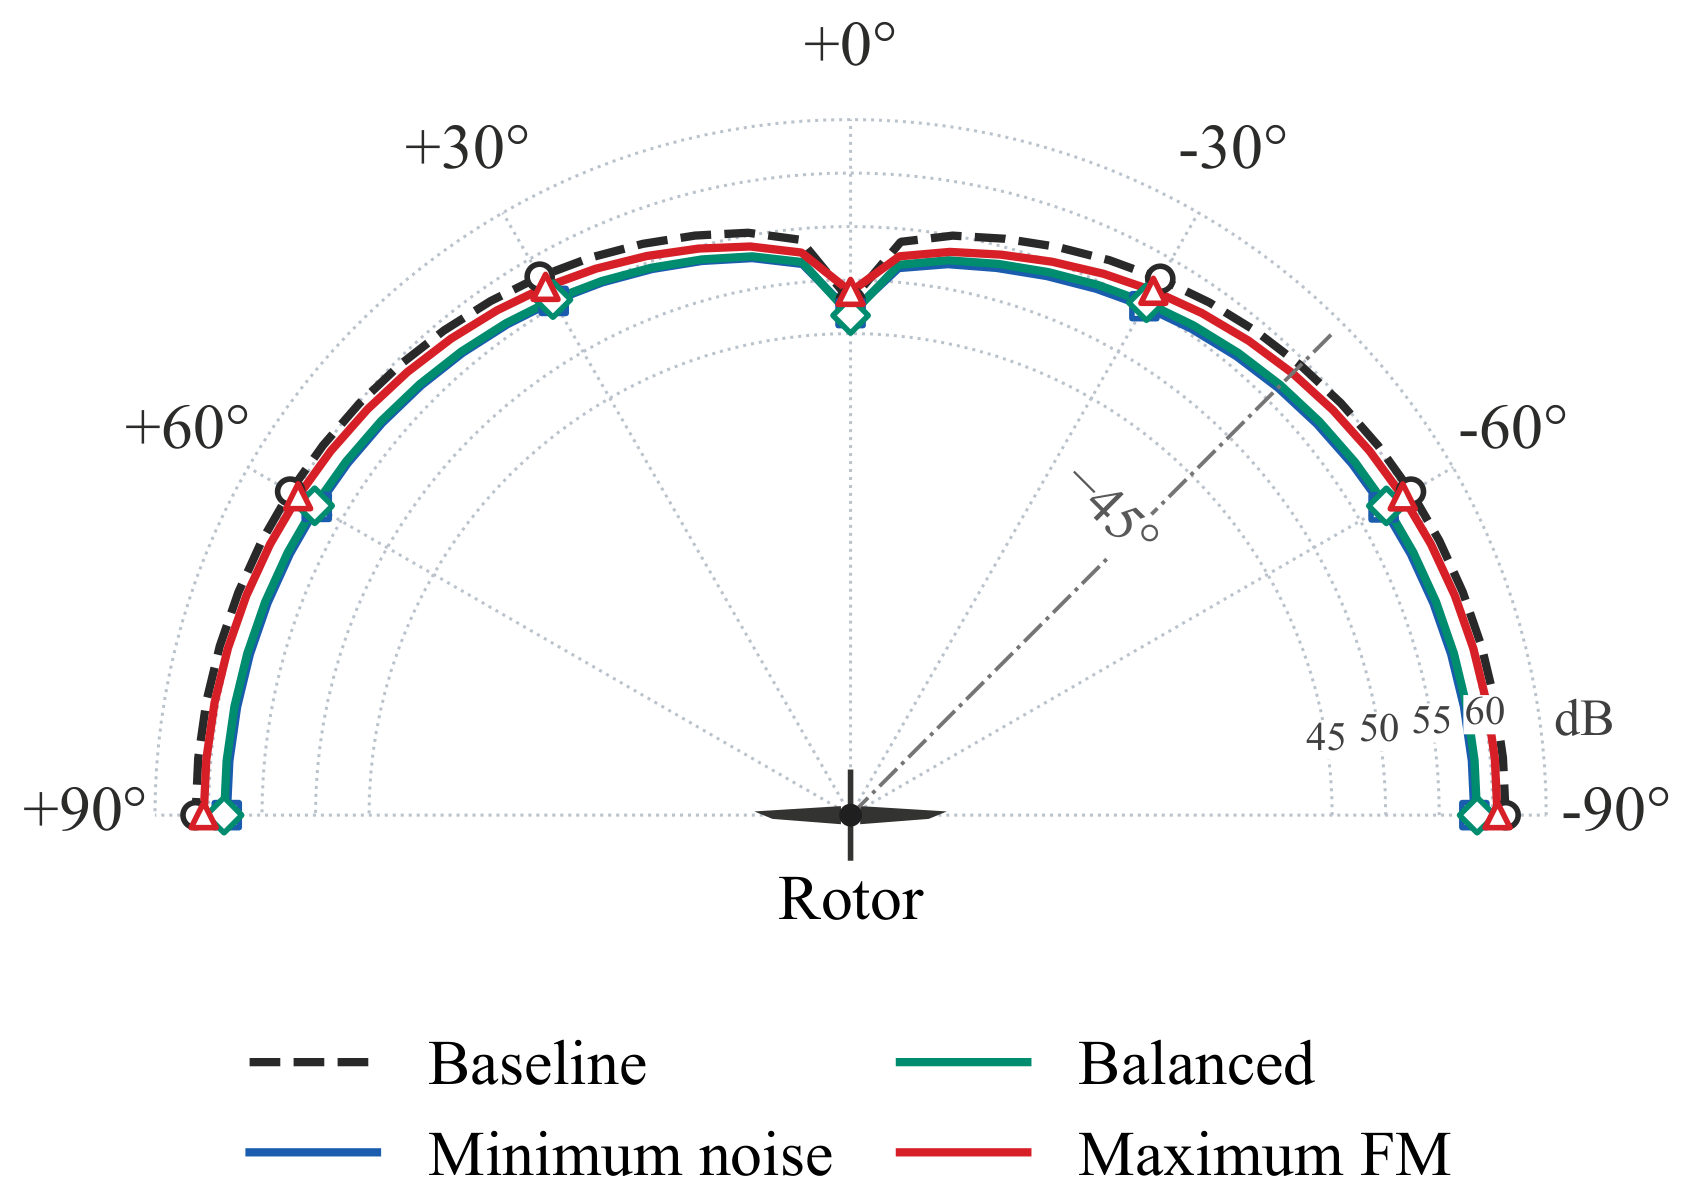
To examine whether the acoustic benefits extend beyond the optimization observer, Figure 11 compares the total OASPL directivity of the baseline rotor and the three representative Pareto designs. The angular response is summarized using the sampled-angle energetic average,
L ¯ θ = 10 log 10 1 N θ i = 1 N θ 10 L i / 10 .
This metric assigns equal weight to the sampled directions and characterizes the discrete angular response; it is not a hemispherical sound-power integral. Table 8 summarizes the levels and local changes over 37 observer directions from 90 to + 90 at 5 intervals, evaluated at 5400 RPM and an observer radius of 1.905 m. Here, Δ L denotes the difference from the baseline at the same angle.
Relative to the baseline, the sampled-angle energetic-average levels decrease by 2.86, 2.60, and 0.93 dB for the minimum-noise, balanced, and maximum-FM designs, respectively. The minimum-noise and balanced designs remain below the baseline in all 37 sampled directions. Even at their least favorable rotor-plane direction, the reductions remain 1.11 and 1.33 dB, respectively, while both designs achieve reductions of at least 2.0 dB for the other 36 directions. The maximum-FM design is at least 0.50 dB quieter than the baseline in 36 directions but exhibits a local increase of 0.87 dB near the rotor plane.
This localized increase is consistent with the greater outer-span chord and the higher outer-span loading retained by the maximum-FM design at the fixed rotational speed. These changes modify the in-plane radiation of the periodic aerodynamic and thickness-related pressure components, producing a locally stronger tonal response even though the broadband level remains below the baseline. The reductions at the optimization observer are accompanied by lower acoustic levels over the sampled angular range, particularly for the minimum-noise and balanced designs. This behavior is also consistent with previous measurements showing that rotor-noise radiation can vary substantially with observer direction [54,55].
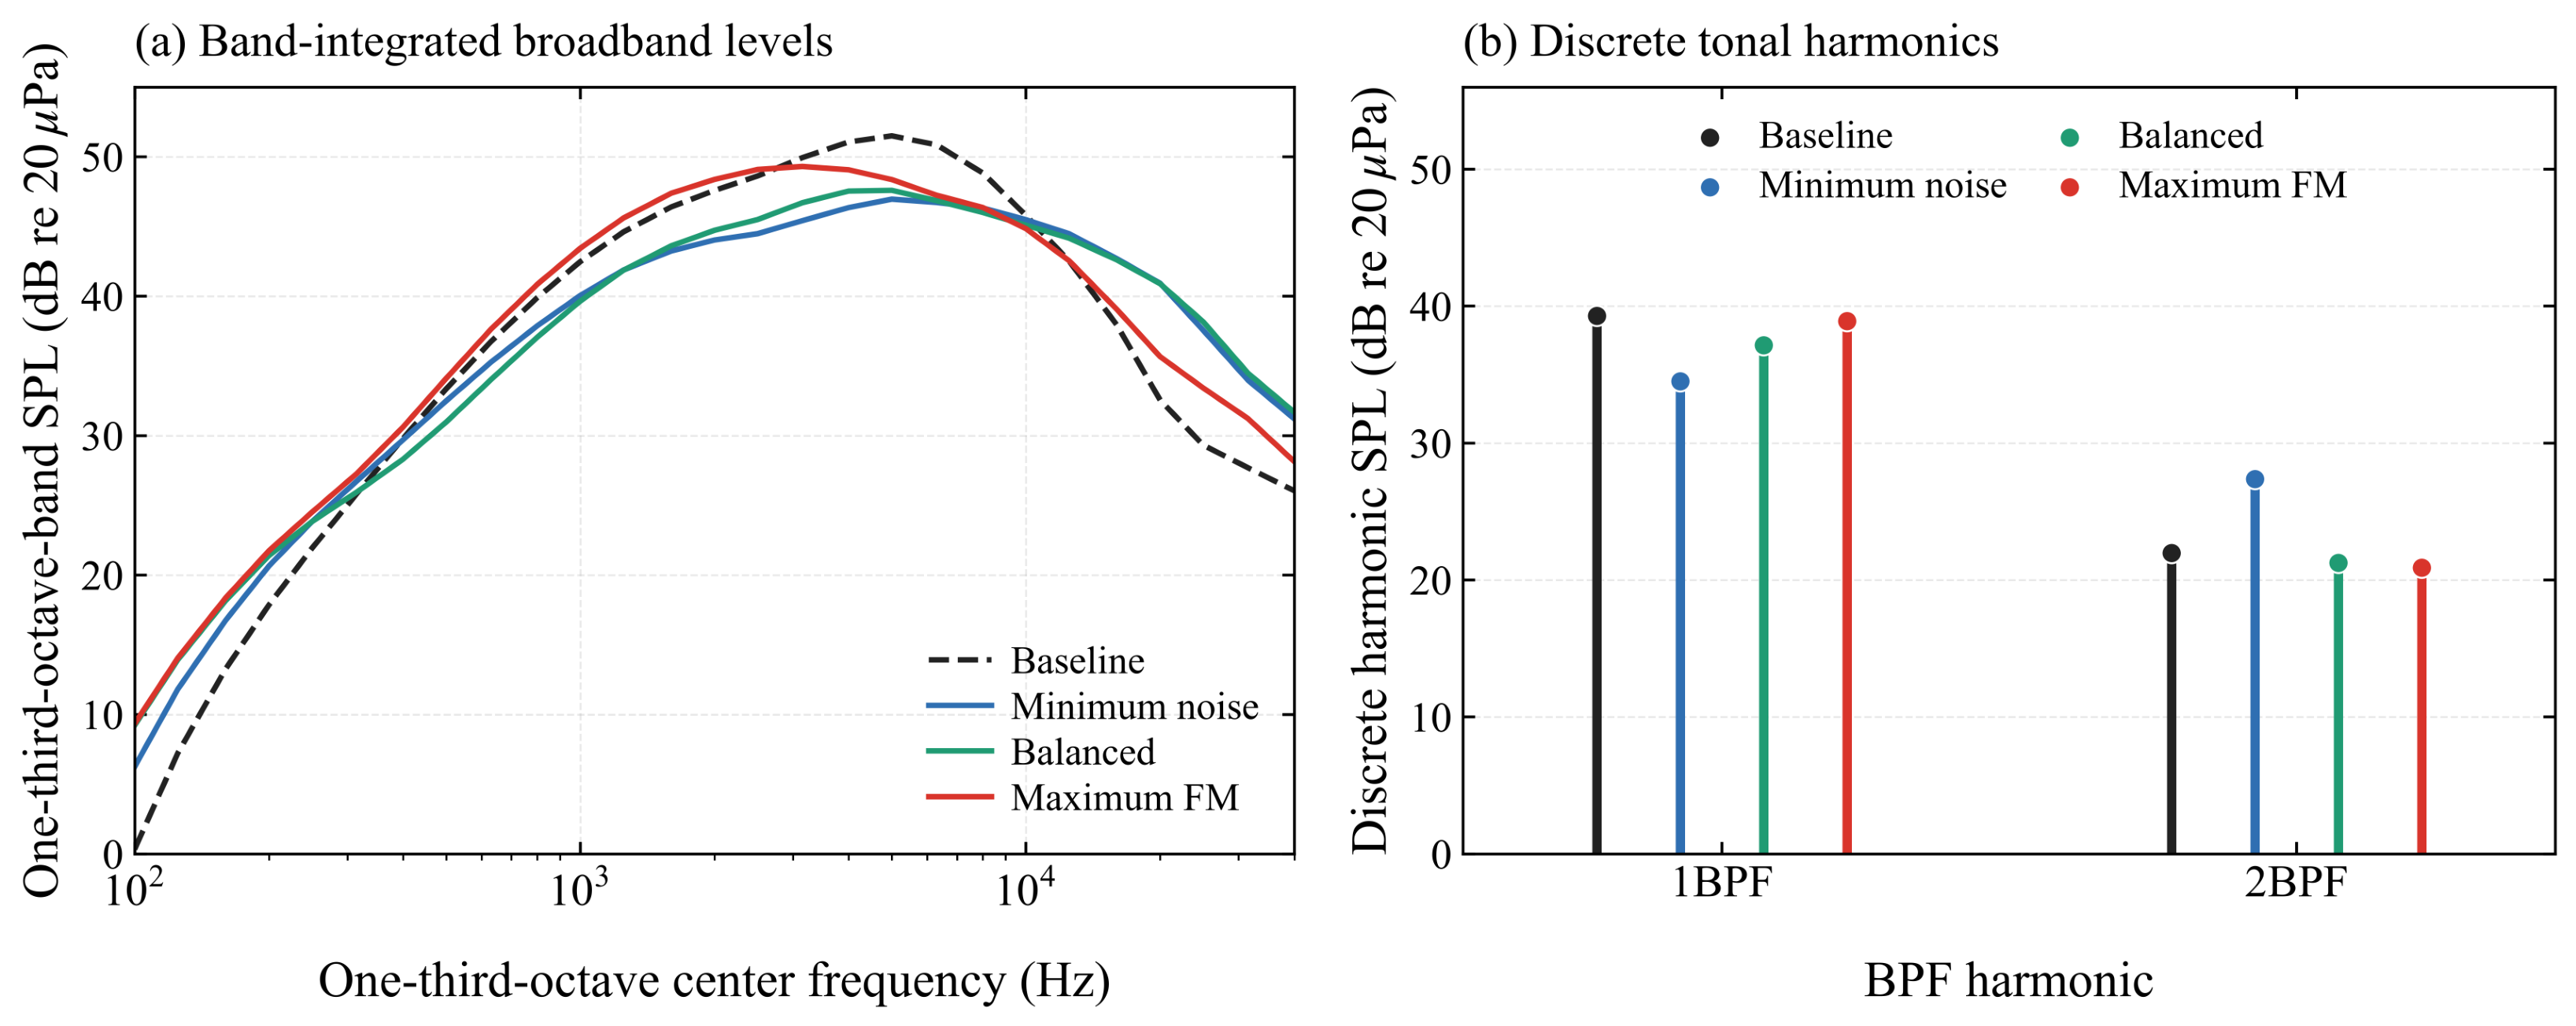
Figure 12 provides a complementary frequency-domain view of the acoustic changes. Figure 12a compares the BPM one-third-octave-band spectra, while Figure 12b compares the 1BPF and 2BPF components extracted from the coherently combined FW–H loading and thickness pressure histories. The level plotted at the 5-kHz center frequency in Figure 12a represents the acoustic energy integrated over the corresponding one-third-octave band (approximately 4.45–5.61 kHz), rather than a narrow-band SPL at exactly 5 kHz. Its numerical magnitude should therefore not be directly compared with the discrete BPF harmonic levels in Figure 12b as if the two quantities had the same spectral bandwidth.
The minimum-noise and balanced designs exhibit their clearest broadband reductions across the one-third-octave bands spanning approximately 1–10 kHz, whereas the maximum-FM spectrum remains close to the baseline over much of the frequency range. At the tonal frequencies, the minimum-noise design produces the largest reduction at 1BPF but increases the 2BPF component. The balanced design reduces the fundamental tone while maintaining a lower integrated FW–H tonal level, whereas the maximum-FM design shows comparatively modest changes in the low-order harmonics.

4.4.3. Wake Response

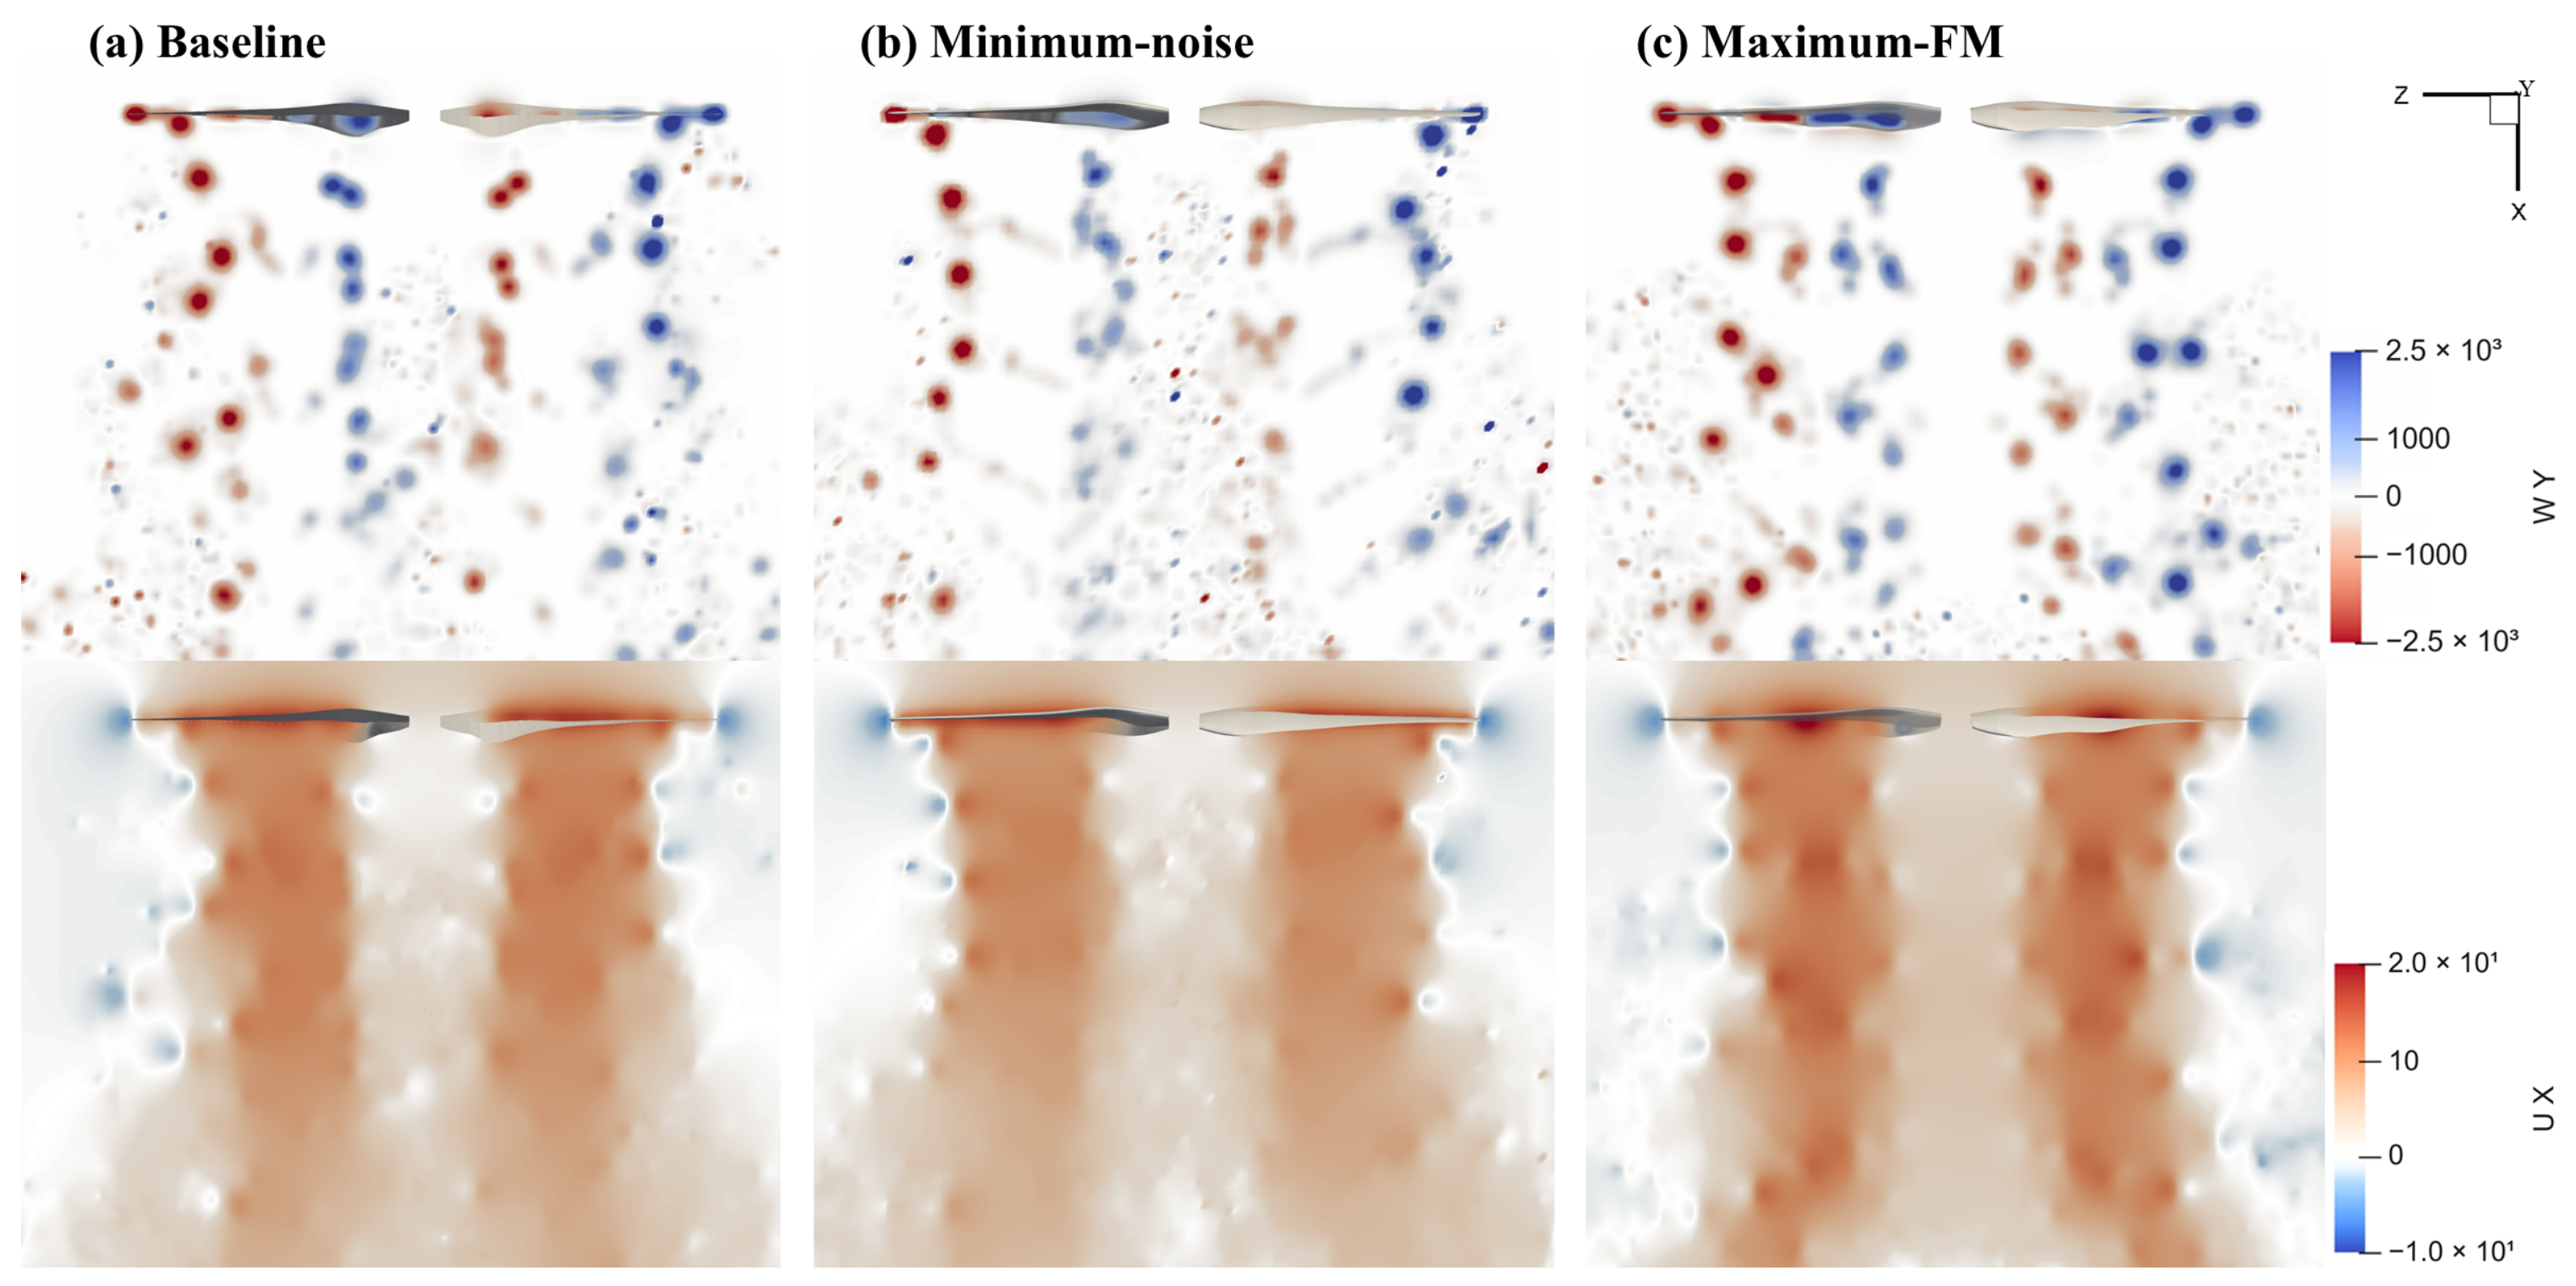
Figure 13 compares the signed transverse vorticity ω y and axial velocity U x of the baseline, minimum-noise, and maximum-FM rotors during the final revolution of the ten performed in the simulations. In the vorticity fields, the red and blue regions denote opposite signs of ω y , whereas their color intensity indicates the local vorticity magnitude. The axial-velocity fields characterize the strength and spatial distribution of the downstream momentum imparted to the wake.
At the fixed reference rotational speed, the maximum-FM design produces C T = 0.07947 , approximately 15.5% greater than the baseline value of 0.06883. Consistent with this increase, its wake exhibits more prominent and spatially persistent alternating vortical structures together with a stronger and more continuous region of downstream axial velocity. These features are consistent with increased momentum transfer to the wake and with the enhanced mid- and outer-span loading identified from the sectional thrust distribution. The baseline rotor exhibits an intermediate response, with weaker axial momentum transfer than the maximum-FM design but more pronounced outer-wake structures than the minimum-noise design.
The minimum-noise design exhibits a distinctly different wake response. Although its total thrust coefficient is approximately 4.9% below the baseline value, the change is not characterized by uniform unloading of the entire blade. The sectional results show that the inboard and mid-span thrust contributions increase by approximately 18.8% and 4.5%, respectively, whereas the outer-span thrust and torque contributions decrease by approximately 19.2% and 33.0%. Correspondingly, the axial-velocity field retains a substantial downstream momentum region, while the vortical structures associated with the outer blade and tip region become less pronounced and less spatially persistent. This behavior is consistent with radial loading redistribution, in which part of the aerodynamic loading is transferred inboard while the outer blade is unloaded.
Because the three configurations operate at the same rotational speed but at different thrust levels, the differences in wake strength cannot be attributed to geometry alone. The lower thrust of the minimum-noise design contributes to its weaker wake response, whereas the higher thrust of the maximum-FM design contributes to its stronger axial momentum transfer. The wake fields are therefore interpreted together with the common-scale sectional loading distributions. Taken together, these results provide complementary evidence consistent with a sequence from geometric reshaping to radial loading redistribution, modified tip-wake structure, and the observed aerodynamic and acoustic responses.

5. Conclusions

A surrogate-assisted multi-objective optimization framework was developed for a small-scale rotor in fixed-speed hover, combining RBF blade parameterization, reformulated-vortex-particle aerodynamic evaluation, aeroacoustic prediction, and GBRT-guided adaptive sampling. Ten-fold cross-validation of the GBRT models yielded R 2 values of 0.782 for FM and 0.811 for OASPL. The final database contains 304 directly evaluated designs, of which 242 satisfy the thrust constraint. Non-dominated sorting based on the direct evaluations identifies 16 Pareto designs.
At the reference speed of 5400 RPM, the maximum-FM design reaches FM = 0.6730 , representing an 11.31% improvement over the baseline, while reducing OASPL by 1.06 dB. The minimum-noise design reduces OASPL by 2.97 dB to 56.48 dB while increasing FM by 3.00%. These results show that aerodynamic efficiency and acoustic performance can be improved simultaneously relative to the baseline, although further increases in efficiency along the Pareto front are accompanied by an acoustic penalty. The thrust-matched reassessment further confirms that these performance benefits are retained: relative to the baseline at the same thrust, the three representative designs achieve FM improvements of 3.01–11.25% and OASPL reductions of 2.24–2.61 dB, while reducing shaft power by 2.91–10.15%.
The underlying mechanism is primarily associated with selective spanwise redistribution of thrust and torque rather than uniform unloading of the blade. The minimum-noise design shifts loading toward the inboard region and weakens the wake structures over the outer span and tip region; the maximum-FM design maintains relatively high outer-span thrust while improving aerodynamic efficiency with controlled torque growth. The Pareto designs also exhibit distinct acoustic benefits. The minimum-noise and balanced designs remain quieter than the baseline at all sampled observer directions, with sampled-angle energetic-average reductions of 2.86 and 2.60 dB, respectively. The maximum-FM design provides a smaller acoustic benefit and shows a local increase near the rotor-plane direction. Spectral analysis further shows that the minimum-noise design achieves more pronounced reductions across the one-third-octave bands spanning approximately 1–10 kHz together with a significant reduction in the 1BPF component, whereas the balanced design has a lower FW–H tonal OASPL.

Future Work

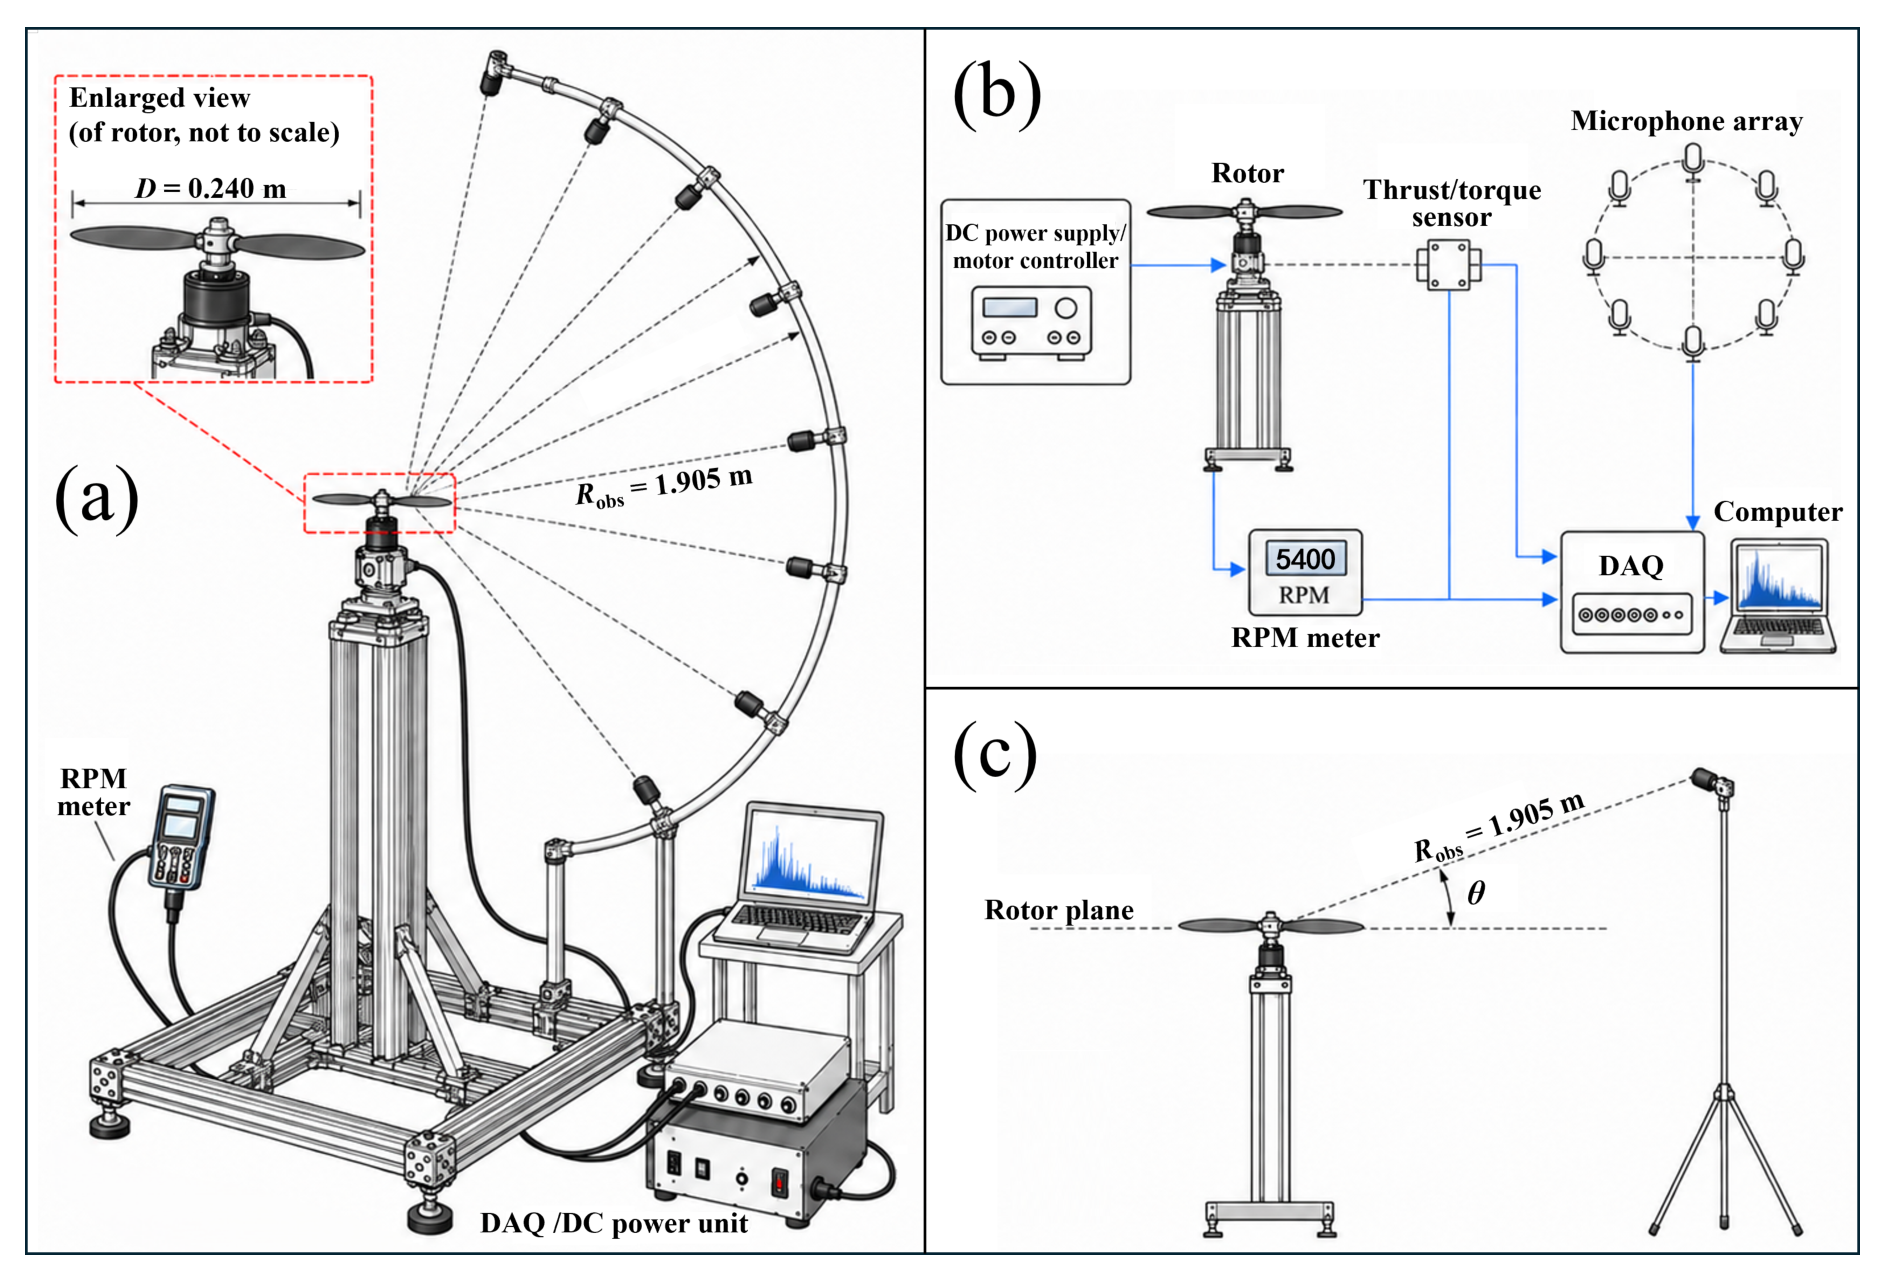
This study is mainly limited by the optimization being restricted to a single fixed-speed hover condition and the acoustic objective being defined at a single observer direction, so multidirectional noise radiation is not directly incorporated into the optimization. Future work will begin by assessing the structural and manufacturing feasibility of the optimized blades and will then use the hover-test arrangement shown in Figure 14 to conduct combined aerodynamic and acoustic validation of the baseline rotor and representative optimized designs. Thrust, torque, rotational speed, and far-field acoustic pressure will be measured synchronously, with the microphones arranged on a mechanically isolated arc at R obs = 1.905 m. Particular attention will be given to the 5400-RPM fixed-speed and thrust-matched conditions, including the maximum-FM and minimum-noise designs as representative demanding cases. The analysis will then be extended to neighboring rotational speeds, different target-thrust levels, and low-speed axial inflow to assess performance retention under off-design conditions. Future optimization may further formulate acoustic objectives for the spatial sound field to improve the spatial applicability of the optimized designs.

Author Contributions

Conceptualization, X.W.; Methodology, Y.Z.; Software, Y.Z.; Validation, J.L., J.F. and Z.D.; Formal analysis, Y.Z.; Investigation, J.L. and J.F.; Resources, L.Q.; Data curation, J.L. and Z.D.; Visualization, Y.Z.; Writing—original draft preparation, Y.Z.; Writing—review and editing, X.W., Y.Z., Z.D. and L.Q.; Supervision, X.W.; Project administration, X.W.; Funding acquisition, X.W. All authors have read and agreed to the published version of the manuscript.

Funding

This study was supported by the Foundation of the National Key Laboratory of Aircraft Configuration Design (Grant No. JBGS-202501) and the Henan Provincial Science and Technology Research Project (Grant No. 252102220060).

Institutional Review Board Statement

Not applicable.

Informed Consent Statement

Not applicable.

Data Availability Statement

Data is contained within the article.

Conflicts of Interest

The authors declare no conflicts of interest.

Abbreviations

The following abbreviations are used in this manuscript:
BPFBlade-passing frequency
BPMBrooks–Pope–Marcolini
CFDComputational fluid dynamics
eVTOLElectric vertical take-off and landing
FMFigure of merit
FW–HFfowcs Williams–Hawkings
GBRTGradient-boosted regression tree
GPGaussian process
LESLarge-eddy simulation
LHSLatin hypercube sampling
NSGA-IINon-dominated Sorting Genetic Algorithm II
OASPLOverall sound pressure level
RBFRadial basis function
rVPMReformulated vortex particle method
UAVUnmanned aerial vehicle
URANSUnsteady Reynolds-averaged Navier–Stokes
UVLMUnsteady vortex lattice method
VPMVortex particle method

References

  1. Zhao, C.; Yang, Y.; Cheng, Z.; Zhang, T.; Liu, Y. Recent Advancements and Challenges for eVTOL Aircraft Aerodynamic Noise in Urban Air Mobility. Prog. Aerosp. Sci. 2026, 161, 101184. [Google Scholar] [CrossRef] [Scilit]
  2. Kostek, A.A.; Lößle, F.; Wickersheim, R.; Keßler, M.; Boisard, R.; Reboul, G.; Visingardi, A.; Barbarino, M.; Gardner, A.D. Experimental Investigation of UAV Rotor Aeroacoustics and Aerodynamics with Computational Cross-Validation. CEAS Aeronaut. J. 2024, 15, 643–658. [Google Scholar] [CrossRef] [Scilit]
  3. Ye, Y.; Liang, Y.; Shan, X.; Huang, K. Design Approach for Tilt Propellers of UAM/eVTOLs for Cruise and Hover Considering Aerodynamic and Aeroacoustic Characteristics via a Multi-Fidelity Model. Aerosp. Sci. Technol. 2025, 156, 109739. [Google Scholar] [CrossRef] [Scilit]
  4. Sun, J.; Yonezawa, K.; Tanabe, Y.; Sugawara, H.; Liu, H. Blade Twist Effects on Aerodynamic Performance and Noise Reduction in a Multirotor Propeller. Drones 2023, 7, 252. [Google Scholar] [CrossRef] [Scilit]
  5. Li, P.; Yang, Y.; Li, Q.; Arcondoulis, E.J.G.; Noack, B.R.; Liu, Y. Effect of Blade Number on Rotor Efficiency and Noise Emission at Hovering Condition. Phys. Fluids 2024, 36, 027142. [Google Scholar] [CrossRef] [Scilit]
  6. Klimczyk, W.; Sieradzki, A. RANS-Based Aeroacoustic Global Sensitivity Study and Optimization of UAV Propellers. Aerospace 2023, 10, 306. [Google Scholar] [CrossRef] [Scilit]
  7. Sarikaya, B.; Zarri, A.; Christophe, J.; Hassanine Aissa, M.; Verstraete, T.; Schram, C. Aerodynamic and Aeroacoustic Design Optimization of UAVs Using a Surrogate Model. J. Sound Vib. 2024, 589, 118539. [Google Scholar] [CrossRef] [Scilit]
  8. Geng, X.; Liu, P.; Hu, T.; Qu, Q.; Dai, J.; Lyu, C.; Ge, Y.; Akkermans, R.A.D. Multi-Fidelity Optimization of a Quiet Propeller Based on Deep Deterministic Policy Gradient and Transfer Learning. Aerosp. Sci. Technol. 2023, 137, 108288. [Google Scholar] [CrossRef] [Scilit]
  9. Wu, X.; Zuo, Z.; Ma, L.; Zhang, W. Multi-Fidelity Neural Network-Based Aerodynamic Optimization Framework for Propeller Design in Electric Aircraft. Aerosp. Sci. Technol. 2024, 146, 108963. [Google Scholar] [CrossRef] [Scilit]
  10. Zhi, H.; Deng, S.; Chang, J.; Xiao, T.; Lu, Y. Pseudorotation Adjoint-Based Aerodynamic and Aeroacoustic Optimization Method for Isolated Rotors. AIAA J. 2025, 63, 2680–2694. [Google Scholar] [CrossRef] [Scilit]
  11. Rong, J.; Mizumoto, K.; Takami, Y.; Tanaka, S.; Ishikawa, H.O.; Yonezawa, K.; Liu, H. Owl-Inspired Leading-Edge Serrations for Aerodynamic Noise Mitigation in Drone Propellers. Phys. Fluids 2025, 37, 051914. [Google Scholar] [CrossRef] [Scilit]
  12. Gu, Y.; Song, F.; Bai, H.; Wu, J.; Liu, K.; Nie, B.; Wang, L.; Zhang, Z.; Lu, Z. Numerical and Experimental Studies on the Owl-Inspired Propellers with Various Serrated Trailing Edges. Appl. Acoust. 2024, 220, 109948. [Google Scholar] [CrossRef] [Scilit]
  13. Candeloro, P.; Ragni, D.; Pagliaroli, T. Experimental Investigation on the Application of Serrated Trailing Edge Propellers for Drone Noise Reduction. Appl. Acoust. 2026, 242, 111045. [Google Scholar] [CrossRef] [Scilit]
  14. Zhong, S.; Zhou, P.; Fattah, R.; Zhang, X. A Revisit of the Tonal Noise of Small Rotors. Proc. R. Soc. A 2020, 476, 20200491. [Google Scholar] [CrossRef] [Scilit] [PubMed]
  15. Wu, H.; Jiang, H.; Zhou, P.; Zhong, S.; Zhang, X.; Zhou, G.; Chen, B. On Identifying the Deterministic Components of Propeller Noise. Aerosp. Sci. Technol. 2022, 130, 107948. [Google Scholar] [CrossRef] [Scilit]
  16. Little, D.S.; Majdalani, J.; Hartfield, R.J.; Ahuja, V. Improved Prediction of Propeller Tonal Noise through Integration of Hanson’s Model into a Modern Surface-Vorticity Panel Code. Aerosp. Sci. Technol. 2025, 164, 110381. [Google Scholar] [CrossRef] [Scilit]
  17. Grande, E.; Ragni, D.; Avallone, F.; Casalino, D. Laminar Separation Bubble Noise on a Propeller Operating at Low Reynolds Numbers. AIAA J. 2022, 60, 5324–5335. [Google Scholar] [CrossRef] [Scilit]
  18. Jia, B.; Li, G.; Yin, Z.; Qiang, X.; Li, W. Effects of Axial Distance on the Noise Characteristics of Contra-Rotating Coaxial Rotors with Identical/Different Rotor Diameters. Appl. Acoust. 2026, 241, 111027. [Google Scholar] [CrossRef] [Scilit]
  19. Lößle, F.; Schmid, R.; Kostek, A.A.; Ernst, D.; Schwarz, C.; Braukmann, J.N.; Wolf, C.C. Experimental Investigation of Broadband Noise Generation of a Small Rotor in Hover and Forward Flight. CEAS Aeronaut. J. 2026, 17, 245–258. [Google Scholar] [CrossRef] [Scilit]
  20. Thai, A.D.; De Paola, E.; Di Marco, A.; Stoica, L.G.; Camussi, R.; Tron, R.; Grace, S.M. Experimental and Computational Aeroacoustic Investigation of Small Rotor Interactions in Hover. Appl. Sci. 2021, 11, 10016. [Google Scholar] [CrossRef] [Scilit]
  21. Brentner, K.S.; Farassat, F. Modeling Aerodynamically Generated Sound of Helicopter Rotors. Prog. Aerosp. Sci. 2003, 39, 83–120. [Google Scholar] [CrossRef] [Scilit]
  22. Yu, Y.H. Rotor Blade–Vortex Interaction Noise. Prog. Aerosp. Sci. 2000, 36, 97–115. [Google Scholar] [CrossRef] [Scilit]
  23. Casalino, D.; Romani, G.; Pii, L.M.; Colombo, R. Flow Confinement Effects on sUAS Rotor Noise. Aerosp. Sci. Technol. 2023, 143, 108756. [Google Scholar] [CrossRef] [Scilit]
  24. Wang, X.; Chen, C.; Liu, Y.; Liu, D.; Luo, M. Aerodynamic Interactions Analysis of Propeller Configurations and Spatial Parameters on a Twin-Boom Unmanned Aerial Vehicle. Eng. Appl. Comput. Fluid Mech. 2026, 20, 2678120. [Google Scholar] [CrossRef] [Scilit]
  25. Wang, X.; Li, G.; Zhao, Y.; Li, J.; Zhang, L.; Luo, M. Aerodynamic Interaction Analysis of a Tiltrotor Electric Vertical Takeoff and Landing Aircraft: A Comparative Study of Tiltrotor and Tiltwing Configurations. J. Appl. Fluid Mech. 2026, 19, 2493–2504. [Google Scholar] [CrossRef] [Scilit]
  26. Goyal, J.; Sinnige, T.; Avallone, F.; Ferreira, C. Benchmarking of Aerodynamic Models for Isolated Propellers Operating at Positive and Negative Thrust. AIAA J. 2024, 62, 3758–3775. [Google Scholar] [CrossRef] [Scilit]
  27. Yin, J.; De Gregorio, F.; Rossignol, K.S.; Rottmann, L.; Ceglia, G.; Reboul, G.; Barakos, G.; Qiao, G.; Muth, M.; Kessler, M.; et al. Acoustic and Aerodynamic Evaluation of DLR Small-Scale Rotor Configurations within GARTEUR AG26. CEAS Aeronaut. J. 2024, 16, 1175–1196. [Google Scholar] [CrossRef] [Scilit]
  28. Shenoy, D.V.; Gojon, R.; Jardin, T.; Jacob, M.C. Aerodynamic and Acoustic Study of a Small-Scale Lightly Loaded Hovering Rotor Using Large-Eddy Simulation. Aerosp. Sci. Technol. 2024, 150, 109219. [Google Scholar] [CrossRef] [Scilit]
  29. Winckelmans, G.S.; Leonard, A. Contributions to Vortex Particle Methods for the Computation of Three-Dimensional Incompressible Unsteady Flows. J. Comput. Phys. 1993, 109, 247–273. [Google Scholar] [CrossRef] [Scilit]
  30. Cottet, G.H.; Koumoutsakos, P.D. Vortex Methods: Theory and Practice; Cambridge University Press: Cambridge, UK, 2000. [Google Scholar]
  31. Alvarez, E.J.; Mehr, J.; Ning, A. FLOWUnsteady: An Interactional Aerodynamics Solver for Multirotor Aircraft and Wind Energy. In Proceedings of the AIAA AVIATION 2022 Forum, Chicago, IL, USA, 27 June–1 July 2022. [Google Scholar] [CrossRef] [Scilit]
  32. Alvarez, E.J.; Ning, A. Stable Vortex Particle Method Formulation for Meshless Large-Eddy Simulation. AIAA J. 2024, 62, 637–656. [Google Scholar] [CrossRef] [Scilit]
  33. Ffowcs Williams, J.E.; Hawkings, D.L. Sound Generation by Turbulence and Surfaces in Arbitrary Motion. Philos. Trans. R. Soc. Lond. A 1969, 264, 321–342. [Google Scholar] [CrossRef] [Scilit]
  34. Farassat, F. Derivation of Formulations 1 and 1A of Farassat; Technical Report NASA/TM-2007-214853; NASA: Washington, DC, USA, 2007.
  35. Brooks, T.F.; Pope, D.S.; Marcolini, M.A. Airfoil Self-Noise and Prediction; Technical Report NASA Reference Publication 1218; NASA: Washington, DC, USA, 1989.
  36. Poggi, C.; Rossetti, M.; Bernardini, G.; Iemma, U.; Andolfi, C.; Milano, C.; Gennaretti, M. Surrogate Models for Predicting Noise Emission and Aerodynamic Performance of Propellers. Aerosp. Sci. Technol. 2022, 125, 107016. [Google Scholar] [CrossRef] [Scilit]
  37. Wang, C.; Chen, B.; Fu, H.; Fan, Y.; Li, W. MS-GAN: 3D Deep Generative Model for Multi-Species Propeller Parameterization and Generation. Chin. J. Aeronaut. 2025, 38, 103404. [Google Scholar] [CrossRef] [Scilit]
  38. Hamedi, M.; Vermeire, B. Near-Field Aeroacoustic Shape Optimization at Low Reynolds Numbers. AIAA J. 2024, 62, 3127–3141. [Google Scholar] [CrossRef] [Scilit]
  39. Wang, X.; Zhang, Z.; Li, J.; Zhao, Y.; Luo, M. Aerodynamic Optimization of a Folding Tandem-Wing UAV: Parameter Interaction Analysis and Surrogate Modeling. Aerospace 2026, 13, 224. [Google Scholar] [CrossRef] [Scilit]
  40. Deb, K.; Pratap, A.; Agarwal, S.; Meyarivan, T. A Fast and Elitist Multiobjective Genetic Algorithm: NSGA-II. IEEE Trans. Evol. Comput. 2002, 6, 182–197. [Google Scholar] [CrossRef] [Scilit]
  41. Queipo, N.V.; Haftka, R.T.; Shyy, W.; Goel, T.; Vaidyanathan, R.; Tucker, P.K. Surrogate-Based Analysis and Optimization. Prog. Aerosp. Sci. 2005, 41, 1–28. [Google Scholar] [CrossRef] [Scilit]
  42. Jin, Y. Surrogate-Assisted Evolutionary Computation: Recent Advances and Future Challenges. Swarm Evol. Comput. 2011, 1, 61–70. [Google Scholar] [CrossRef] [Scilit]
  43. Yondo, R.; Andrés, E.; Valero, E. A Review on Design of Experiments and Surrogate Models in Aircraft Real-Time and Many-Query Aerodynamic Analyses. Prog. Aerosp. Sci. 2018, 96, 23–61. [Google Scholar] [CrossRef] [Scilit]
  44. Zawodny, N.S.; Boyd, D.D., Jr.; Burley, C.L. Acoustic Characterization and Prediction of Representative, Small-Scale Rotary-Wing Unmanned Aircraft System Components. In Proceedings of the AHS International 72nd Annual Forum and Technology Display, West Palm Beach, FL, USA, 17–19 May 2016. [Google Scholar] [CrossRef] [Scilit]
  45. Wu, H.; Zhou, P.; Wang, P.; Zhou, G.; Chen, B.; Zhong, S.; Zhang, X. Broadband Noise of a Hovering Rotor: Measurement, Prediction, and Reduction. AIAA J. 2025, 63, 3275–3287. [Google Scholar] [CrossRef] [Scilit]
  46. Greenwood, E.; Brentner, K.S.; Rau, R.F., II; Gan, Z.F.T. Challenges and Opportunities for Low Noise Electric Aircraft. Int. J. Aeroacoust. 2022, 21, 315–381. [Google Scholar] [CrossRef] [Scilit]
  47. McKay, M.D.; Beckman, R.J.; Conover, W.J. A Comparison of Three Methods for Selecting Values of Input Variables in the Analysis of Output from a Computer Code. Technometrics 1979, 21, 239–245. [Google Scholar] [CrossRef] [Scilit]
  48. Breiman, L. Random Forests. Mach. Learn. 2001, 45, 5–32. [Google Scholar] [CrossRef] [Scilit]
  49. Friedman, J.H. Greedy Function Approximation: A Gradient Boosting Machine. Ann. Stat. 2001, 29, 1189–1232. [Google Scholar] [CrossRef] [Scilit]
  50. Casalino, D.; Grande, E.; Romani, G.; Ragni, D.; Avallone, F. Definition of a Benchmark for Low Reynolds Number Propeller Aeroacoustics. Aerosp. Sci. Technol. 2021, 113, 106707. [Google Scholar] [CrossRef] [Scilit]
  51. Romani, G.; Grande, E.; Avallone, F.; Ragni, D.; Casalino, D. Performance and Noise Prediction of Low-Reynolds Number Propellers Using the Lattice-Boltzmann Method. Aerosp. Sci. Technol. 2022, 125, 107086. [Google Scholar] [CrossRef] [Scilit]
  52. Spearman, C. The Proof and Measurement of Association between Two Things. Am. J. Psychol. 1904, 15, 72–101. [Google Scholar] [CrossRef] [Scilit] [PubMed]
  53. Johnson, C.; Sirohi, J.; Jacobellis, G.; Singh, R. Experimental and Computational Investigation of Rotor Noise in Hover. J. Aircr. 2024, 61, 1006–1015. [Google Scholar] [CrossRef] [Scilit]
  54. Fasulo, G.; Longobardo, G.; De Gregorio, F.; Barbarino, M. Experimental Acoustic Investigation of Rotor Noise Directivity and Decay in Multiple Configurations. Aerospace 2025, 12, 647. [Google Scholar] [CrossRef] [Scilit]
  55. Gandhi, F.; Keller, A.; Whitt, J.; Smith, B. Acoustic Characteristics of Urban Air Mobility-Scale Rotors of Increasing Size. J. Aircr. 2026; Articles in Advance. [CrossRef] [Scilit]
Figure 1. Schematic of the RBF-based blade parameterization: (a) radial control-station layout, (b) chord distribution, (c) Gaussian RBF basis functions and hub-protection window, and (d) twist distribution. The control stations are located at r / R = 0.25 , 0.50, 0.75, and 0.95. In panel (d), the black star marks the perturbed twist at the selected RBF control station, and Δ θ i denotes its deviation from the baseline.
Aerospace 13 00841 g001
Figure 2. Surrogate-assisted multi-objective optimization framework. Surrogate models guide candidate selection, while the reported non-dominated set is extracted from thrust-feasible direct evaluations.
Aerospace 13 00841 g002
Figure 3. Aerodynamic validation of the baseline rotor at 5400 RPM: (a) thrust-coefficient convergence for three VPM resolutions and (b) spanwise normal loading compared with the URANS reference.
Aerospace 13 00841 g003
Figure 4. Acoustic validation of the baseline rotor at 5400 RPM: (a) predicted and measured OASPL directivity; (b) measured and calculated 1BPF and 2BPF levels at one of the experimental observer locations; and (c) measured and predicted one-third-octave spectra at the 45 observer, R obs = 1.905 m.
Aerospace 13 00841 g004
Figure 5. Out-of-fold GBRT predictions of (a) FM and (b) OASPL for 304 complete evaluations. The dashed line denotes perfect agreement. The reported statistics are based on shuffled 10-fold cross-validation.
Aerospace 13 00841 g005
Figure 6. FM–OASPL objective space for the 242 thrust-feasible designs. The line connects the 16 Pareto designs, the colored markers identify the representative designs, and the star denotes the baseline rotor.
Aerospace 13 00841 g006
Figure 7. Spearman rank correlations between the eight geometric design variables and FM, OASPL, C T , and C Q for the 242 thrust-feasible designs. Positive and negative values denote increasing and decreasing monotonic associations, respectively.
Aerospace 13 00841 g007
Figure 8. Chord and twist distributions of the baseline rotor and three representative non-dominated designs. Symbols indicate the four RBF control stations.
Aerospace 13 00841 g008
Figure 9. Common-scale spanwise distributions of (a) sectional thrust coefficient and (b) sectional torque coefficient for the baseline and representative designs.
Aerospace 13 00841 g009
Figure 10. Acoustic contributions at the 45 ° optimization observer: (a) FW–H tonal, BPM broadband, and total OASPL; (b) separately evaluated loading and thickness OASPL. The FW–H tonal level in panel (a) is obtained from the coherent sum of the loading and thickness pressures.
Aerospace 13 00841 g010
Figure 11. Calculated total OASPL directivity of the baseline and representative designs at an observer distance of 1.905 m. Angles are measured from the rotor plane, with negative values toward the wake side. The dash-dotted line indicates the 45 optimization direction.
Aerospace 13 00841 g011
Figure 12. Frequency-domain acoustic comparison at the 45 optimization observer: (a) BPM one-third-octave-band spectra; (b) 1BPF and 2BPF levels obtained by FFT of the mean-removed, coherently combined FW–H loading and thickness pressures. Panels (a,b) show band-integrated and discrete harmonic levels, respectively, and their local SPL magnitudes should not be interpreted as a direct pointwise comparison because the corresponding spectral bandwidths are different.
Aerospace 13 00841 g012
Figure 13. Wake fields in the rotor-axis plane for the baseline, minimum-noise, and maximum-FM rotors. The upper and lower rows show transverse vorticity ω y and axial velocity U x , respectively.
Aerospace 13 00841 g013
Figure 14. A conceptual layout of the proposed experimental validation setup (not to scale): (a) instrumented vertical hover test rig and mechanically isolated far-field microphone arc; (b) measurement and data-acquisition scheme; and (c) observer-angle convention. The rotor diameter is D = 0.240 m and the observer distance is R obs = 1.905 m . Negative observer angles are defined toward the wake side.
Aerospace 13 00841 g014
Table 1. Design variables and constraints used in the blade parameterization.
VariableStation r / R TypeUnitBound
Δ c 0.25 0.25Chord perturbation [ 0.0659 , + 0.0659 ]
Δ c 0.50 0.50Chord perturbation [ 0.0465 , + 0.0465 ]
Δ c 0.75 0.75Chord perturbation [ 0.0318 , + 0.0318 ]
Δ c 0.95 0.95Chord perturbation [ 0.0237 , + 0.0237 ]
Δ θ 0.25 0.25Twist perturbationdeg [ 8 , + 8 ]
Δ θ 0.50 0.50Twist perturbationdeg [ 8 , + 8 ]
Δ θ 0.75 0.75Twist perturbationdeg [ 8 , + 8 ]
Δ θ 0.95 0.95Twist perturbationdeg [ 8 , + 8 ]
Geometric feasibility constraints require positive chord length, non-negative twist, and monotonically decreasing twist in the active blade region. The thrust-retention requirement is defined relative to the baseline thrust coefficient predicted using the same numerical setup as the optimization database.
Table 2. Numerical setup used for the optimization evaluations.
ParameterValue
RotorDJI–9443, two-bladed rotor
Numerical rotor diameter D = 0.2400 m
Operating conditionNear-hover, 5400 RPM
Advance ratio J = 0.0001
Air density ρ = 1.071778 kg m 3
Dynamic viscosity μ = 1.85508 × 10 5 Pa s
Speed of sound a = 342.35 m s 1
Spanwise blade elements40 per blade
Time steps per revolution72
Time-step resolution 5 per step
Particles shed per step2
Total simulated revolutions10
Time integrationThird-order Runge–Kutta
VPM formulationInviscid rVPM
Acoustic modelsFW–H tonal noise (loading + thickness) + BPM broadband noise
Acoustic objectiveTotal OASPL at the 45 observer
Observer distance r obs = 1.905 m
Thrust requirementAt least 95% of the numerical baseline value
Table 3. Effect of spanwise blade discretization on the baseline-rotor predictions at 5400 RPM.
ResolutionElements per Blade C T C T ErrorFMOASPL (dB)
Coarse200.0664 6.5 % 0.60159.4
Adopted400.0688 3.1 % 0.60559.5
Fine600.0689 3.0 % 0.61059.5
Table 4. Composition of the optimization database.
ItemValue
Design variables8
Initial LHS designs120
Unique complete evaluated designs304
Thrust-feasible evaluated designs242
Non-dominated designs16
Table 5. Ten-fold cross-validation results for the objective surrogate models.
ModelResponse R 2 MAERMSE
GP–RBFFM0.7670.008450.01599
GP–RBFOASPL0.7380.293 dB0.833 dB
GP–MatérnFM0.7650.008150.01603
GP–MatérnOASPL0.7820.249 dB0.760 dB
Random forestFM0.7700.009860.01589
Random forestOASPL0.7890.297 dB0.749 dB
GBRTFM0.7820.009220.01544
GBRTOASPL0.8110.316 dB0.706 dB
Table 6. Baseline and three representative Pareto designs.
DesignCase C T FMOASPL (dB) Δ FM (%)Reduction (dB)
Baseline0.068830.604659.45
Minimum noise84010.065440.622856.483.002.97
Balanced design83070.067000.659156.819.012.64
Maximum FM40030.079470.673058.3911.311.06
Table 7. Post-optimization thrust-matched assessment of the representative geometries. Design roles refer to the fixed-speed non-dominated set.
DesignRPM Δ T (%) P shaft (W)FMOASPL (dB) Δ FM (%)Reduction (dB)
Baseline5400.000.000014.830.604659.39
Minimum noise5537.69 + 0.0085 14.390.622856.783.012.61
Balanced5473.01 0.0040 13.600.659157.159.012.24
Maximum FM5026.86 0.0272 13.320.672656.8911.252.50
Table 8. Total OASPL statistics over the 37 sampled observer directions. Δ L ¯ θ is the change in the sampled-angle energetic average relative to the baseline. Negative changes denote reductions. An em dash indicates not applicable for the baseline reference case.
Design L ¯ θ
(dB)
Δ L ¯ θ
(dB)
Median Δ L
(dB)
Local Δ L Range(dB)Below Baseline
Baseline59.30
Minimum-noise56.45 2.86 2.90 2.97 to 1.11 37/37
Balanced56.70 2.60 2.62 2.67 to 1.33 37/37
Maximum-FM58.37 0.93 0.97 1.55 to + 0.87 36/37
Disclaimer/Publisher’s Note: The statements, opinions and data contained in all publications are solely those of the individual author(s) and contributor(s) and not of MDPI and/or the editor(s). MDPI and/or the editor(s) disclaim responsibility for any injury to people or property resulting from any ideas, methods, instructions or products referred to in the content.