1. Introduction
Additive manufacturing enables lattice architecture and relative density to be treated as design variables in periodic cellular solids. Bernard and ElSayed compared the dynamic crashworthiness of multiple three-dimensional lattice topologies [
1]. Alqahtani et al. investigated the influence of lattice topology on the thermal and mechanical response of additively manufactured polymer lattices [
2]. Walker et al. examined heat treatment effects in Grade 300 maraging steel strut lattices [
3]. Ding et al. reviewed three-dimensional lattice topologies and compared their convective heat transfer characteristics [
4]. These studies establish lattice architecture as an important variable in both structural and thermal design.
For thermal management, lattice architectures provide connected solid paths for conduction and internal surfaces that exchange heat with a fluid. Luo et al. developed a three-dimensional multiscale topology optimization method for porous heat sinks under natural convection [
5]. Rees et al. combined topology optimization, additive manufacturing, computational prediction, and experimental testing in a compact heat exchanger design workflow [
6]. Narkhede et al. investigated a heat sink with liquid cooling integrated with a three-dimensional lattice over different blockage ratios [
7]. Umemoto et al. measured the effective thermal conductivity of additively manufactured truncated octahedron lattices and reported a strong dependence on wire diameter [
8]. Together, these studies show that thermal design of lattices must account for both transport through the solid architecture and access of the cooling fluid.
Triply periodic minimal surface structures have received particular attention for thermal applications. Saghir and Yahya analyzed TPMS heat exchangers for lightweight aerospace and space thermal systems using Gyroid, Diamond, and Fischer Koch S structures [
9]. Wang et al. performed numerical and experimental investigation of additively manufactured heat exchangers based on several TPMS geometries [
10]. Dixit et al. numerically evaluated lattice cell architectures for heat sink applications under low Reynolds number flow and constant temperature base conditions [
11]. Yeranee et al. studied a serpentine cooling channel containing topology-optimized TPMS porous structures [
12]. Barakat and Sun examined controlled deformation of Diamond and Gyroid TPMS structures for convective heat transfer enhancement [
13]. Baobaid et al. investigated TPMS heat sinks under free convection [
14]. These studies consistently show that topology and operating condition influence the thermal response of architected heat transfer surfaces.
The design space has also been extended through hierarchical, graded, and thermally coupled lattice concepts. Xu et al. developed hierarchical sheet TPMS lattices and evaluated their thermal hydraulic performance [
15]. Pan et al. reviewed lattice structure design and optimization methods enabled by additive manufacturing [
16]. Huang and Wang investigated effective thermal conductivity in a BCC lattice microstructure with gradient porosity [
17]. Guo et al. combined a three-dimensional printed lattice with phase change material for thermal energy storage relevant to space applications [
18]. Ornelas-Ramón et al. numerically investigated laminar fluid flow and heat transfer in a Gyroid TPMS structure while varying velocity, working fluid, and porosity [
19]. These studies further demonstrate that internal architecture changes both heat transport and fluid flow behavior.
Architecture and modeling assumptions are especially important when lattice heat transfer is interpreted. Oh et al. introduced functional morphology changes in TPMS structures for compact heat exchanger design [
20]. Shahrzadi et al. analyzed conduction, convection, and radiation in periodic BCC lattice materials [
21]. Park et al. experimentally and numerically investigated the influence of unit cell length and strut diameter on natural convection in additively manufactured BCC lattices [
22]. The reported results show that performance comparisons must be tied to the specific geometry, design parameters, and heat transfer modes included in the analysis.
Comparative studies are increasingly mapping thermal behavior across lattice families. Christo compared the heat transfer performance of lattice-structured heat sinks using steady thermal analysis [
23]. Zhou et al. evaluated effective heat conduction in lattice structures produced by selective laser melting [
24]. Song et al. proposed an alveolar biomimetic interlaced hollow lattice metastructure for enhanced heat transfer [
25]. Zhang et al. analyzed multi-morphology lattice structures for thermal management of high-speed aircraft and identified lattice architecture as a candidate for lightweight structures with high heat dissipation capability [
26]. This aerospace context is particularly relevant when mass, volume, and thermal performance must be considered together.
Recent investigations have combined experiments, computational analysis, and multiple performance measures. Batikh et al. performed computational and experimental investigation of additively manufactured lattice heat sinks for liquid cooling of railway power electronics [
27]. Liu et al. studied fluid flow and heat transfer in aluminum alloy TPMS lattices [
28]. Singh et al. experimentally characterized flow and thermal transport in additively manufactured lattices based on a cube-shaped unit cell [
29]. Bai et al. evaluated static performance and heat dissipation in lattice structures produced by laser powder bed fusion [
30]. These studies show that engineering selection of lattice architectures can involve thermal, hydraulic, manufacturing, and structural considerations.
More transferable design measures and broader frameworks are also being developed. Zhao et al. investigated exposed area-dependent forced convective heat transfer in periodic lattice structures [
31]. Sun et al. reviewed advanced design and manufacturing approaches for thermal management structures [
32]. Vaglio et al. examined heat transfer and pressure loss in annular channels containing additively manufactured BCC, Octahedral, and Gyroid inserts [
33]. Ma et al. reviewed multiphysical lattice metamaterials and the interaction of structural, thermal, and other functional responses [
34]. The cited studies use different unit cell sizes, fluids, materials, boundary conditions, and performance metrics. This variation makes direct ranking across published architectures difficult.
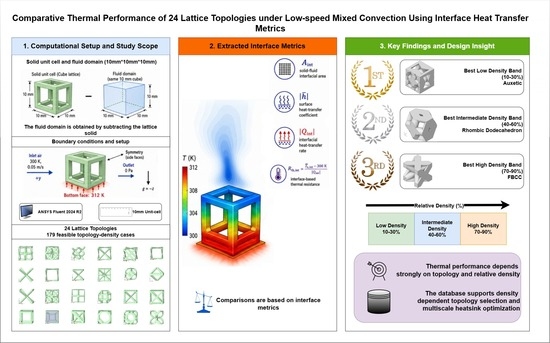
The present study addresses this comparison problem by evaluating 24 lattice topologies within one consistent computational framework. In total, 179 topology and relative density combinations are analyzed at a common 10 mm unit cell scale using the same solid and fluid properties, inlet condition, fixed base temperature, gravity vector, solver formulation, and postprocessing definitions. The objective is not to identify a universally optimal lattice. Instead, the study quantifies how topology and relative density affect the solid–fluid interfacial area, the magnitude of the ANSYS Fluent surface heat-transfer coefficient, the interfacial heat-transfer rate, and a consistently defined interface-based thermal resistance under the specified low-speed mixed-convection condition with perpendicular forced-flow and buoyancy directions. The resulting database is intended to support subsequent multiscale design optimization of lightweight heatsinks, including aerospace thermal management problems in which lattice topology and relative density are available as design variables [
35]. Most previous lattice heat-transfer studies have focused on individual lattice families, a small number of candidate architectures, or operating conditions that differ in unit-cell size, material, fluid, thermal loading, and performance metric. Consequently, their reported values do not provide a direct density-by-density ranking across a broad architecture set. The contribution of the present work is therefore not a new CFD formulation but a controlled cross-topology comparison in which 24 architectures are evaluated over their feasible relative density ranges under one common conjugate heat transfer framework. The resulting dataset reveals density-dependent performance crossovers that cannot be inferred from isolated single topology studies: Auxetic structures are favored at low density, Rhombic Dodecahedron and FBCC become strongest at intermediate densities, and BCC variants become competitive among the topologies that remain feasible at high density. This density-dependent crossover map, rather than the number of simulations alone, is the principal engineering contribution of the study.
2. Methodology
The study uses a controlled conjugate heat transfer framework to compare lattice geometries while keeping the computational domain, fluid, solid material, thermal boundary conditions, and inlet conditions consistent. All simulations were performed in ANSYS Fluent 2024 R2. The 24 topologies were evaluated only over geometrically feasible relative density ranges, producing 179 converged topology and density cases in total.
2.1. Geometry Generation and Parametrization
All lattice geometries were generated in ANSYS 2024 R2 SpaceClaim using the parametric construction procedure established for the lattice library. Relative density was defined using Equation (1).
For each topology, the strut radius was varied according to the radius-to-relative-density relationship established for the corresponding lattice definition [
1]. The solid volume fraction was therefore controlled while the connectivity and orientation of each topology were preserved.
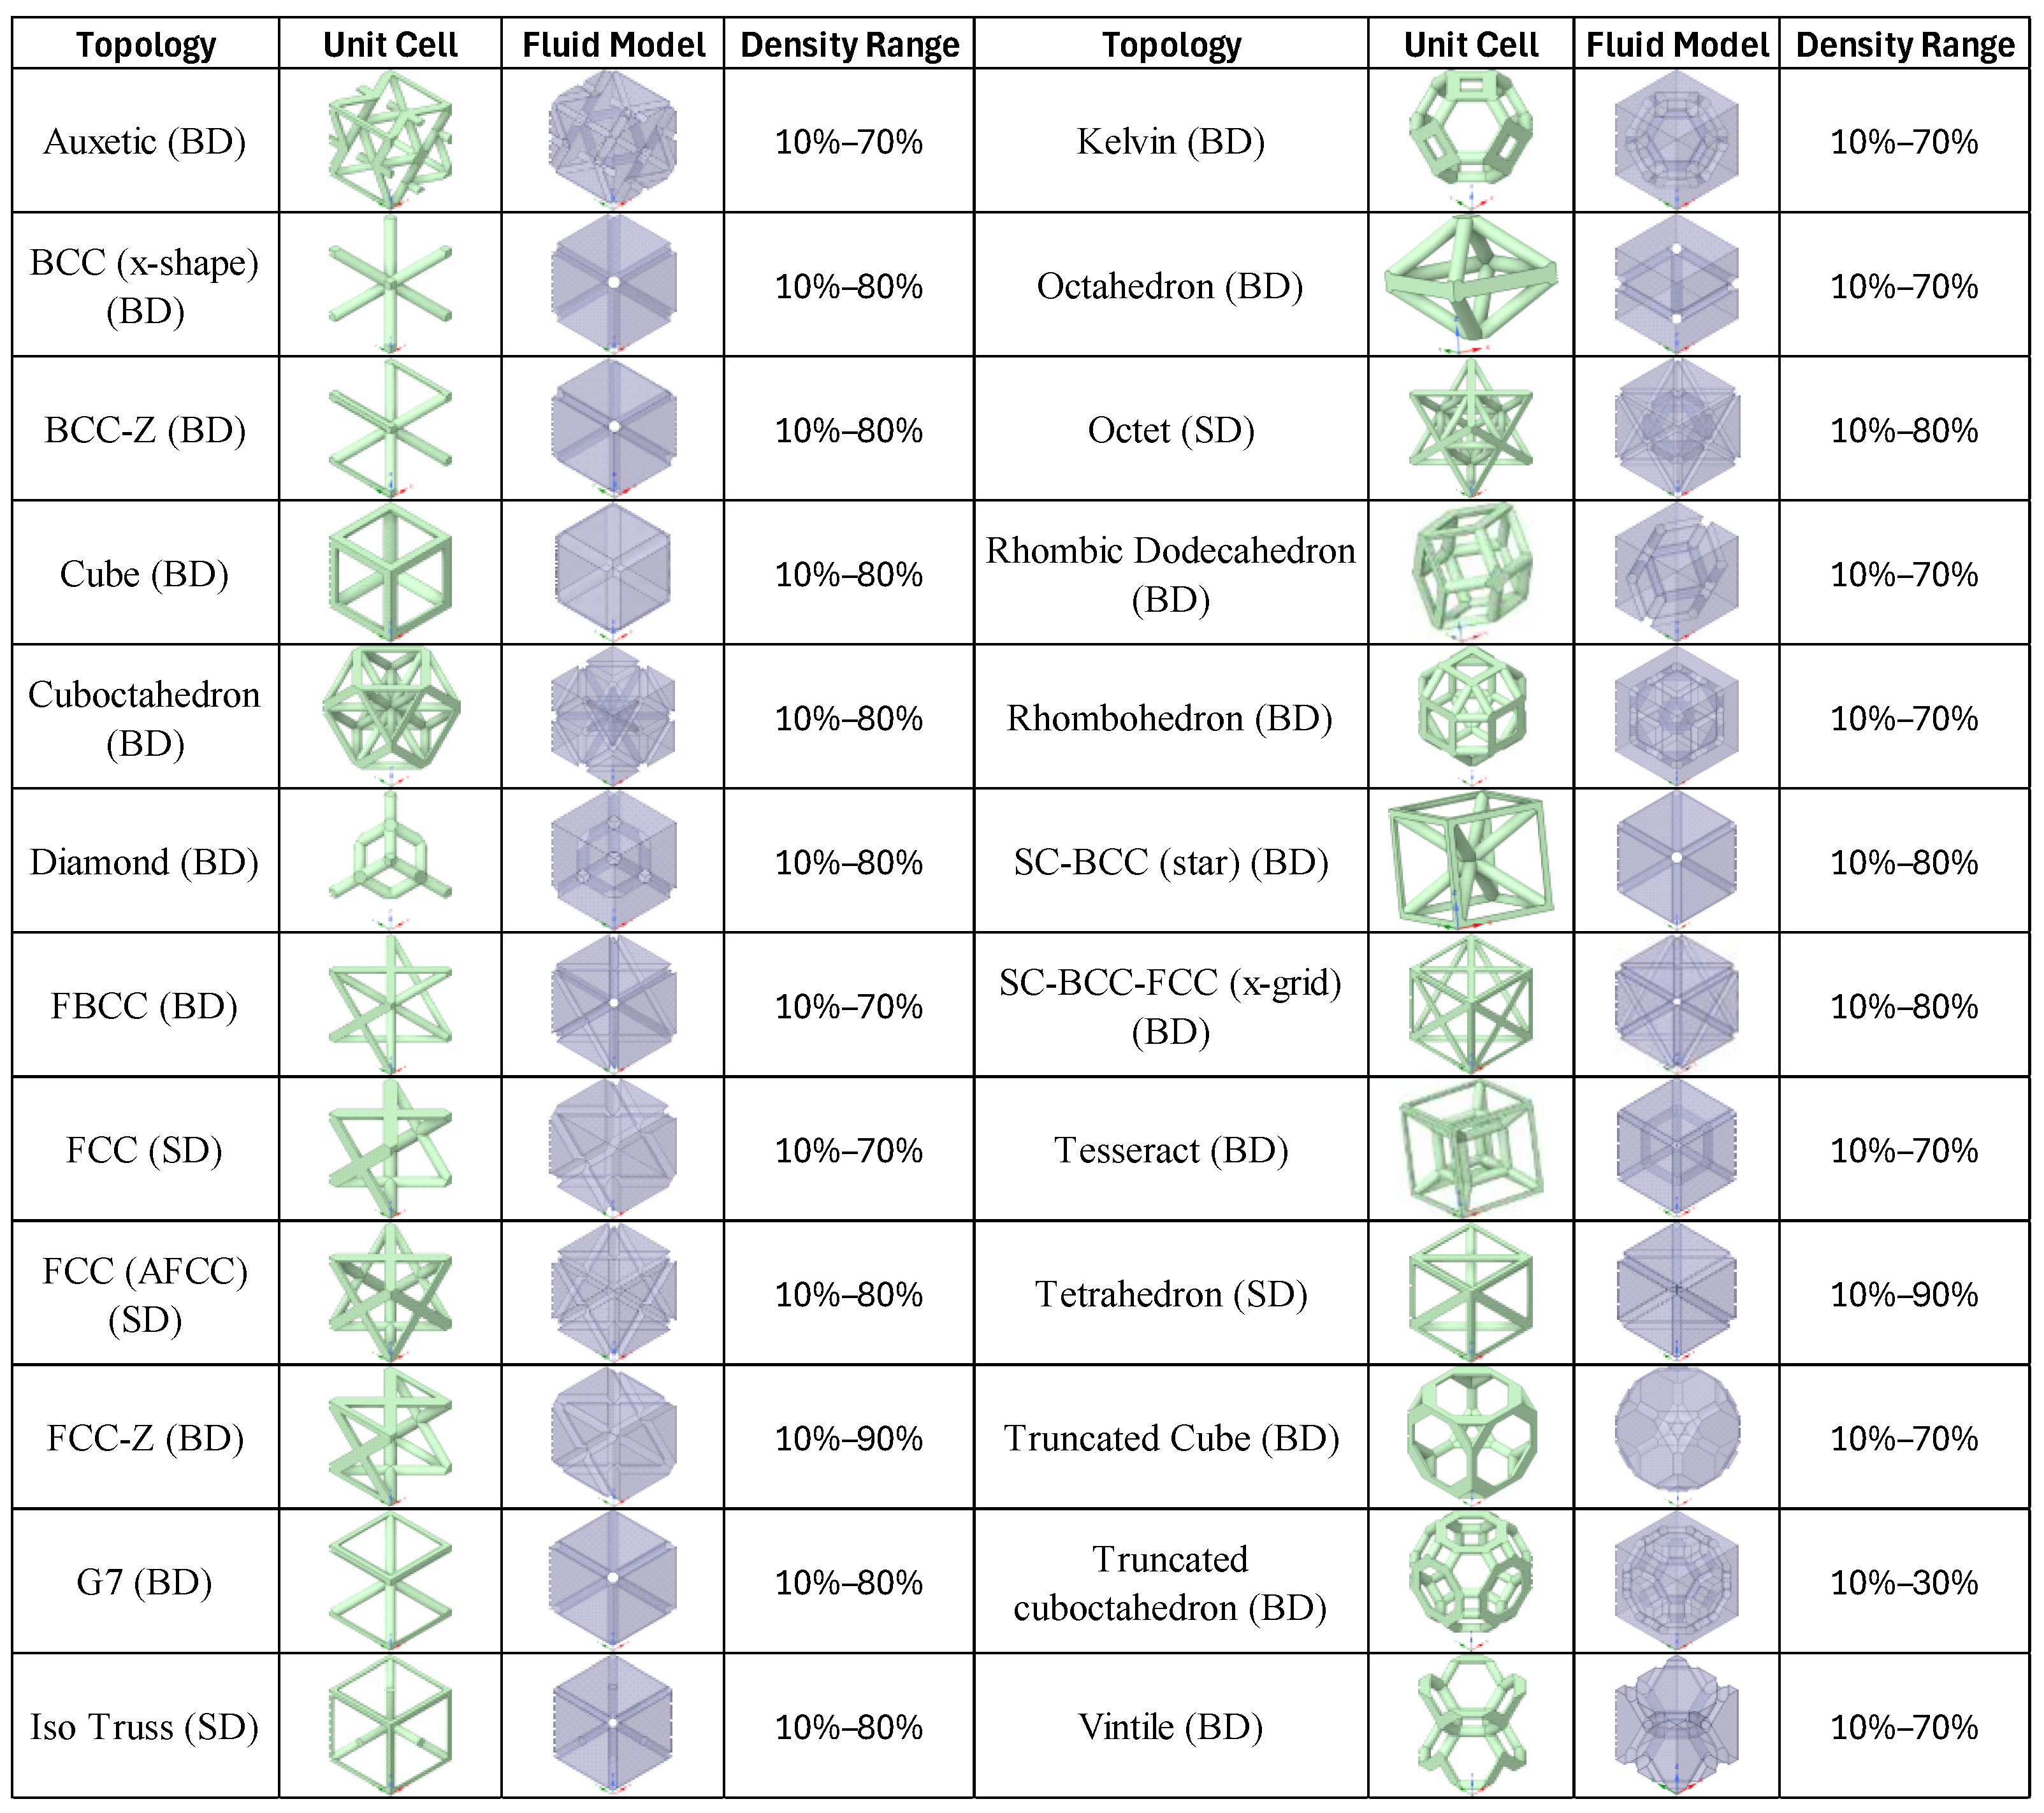
Each unit cell occupied a 10 mm × 10 mm × 10 mm cubic domain. The investigation ranged from simple Cube and BCC variants to more complex architectures including Cuboctahedron, Rhombic Dodecahedron, Tesseract, and Truncated Cuboctahedron. Relative density varied in 10 percentage point increments from 10% to the highest feasible value for each topology. The 10-percentage point interval represents the discrete sampling resolution of the parametric study and does not represent an uncertainty or ±10% error in relative density. For each generated geometry, relative density was determined from the solid volume fraction defined in Equation (1), while the ranges reported in
Figure 1 indicate the discrete relative density levels that remained geometrically feasible for each topology. Cases were stopped when additional strut growth caused geometric overlap or loss of a valid open fluid region.
Figure 1 summarizes the 24 topologies and their feasible ranges.
The fluid domain was obtained by subtracting the solid lattice from the enclosing cubic domain. All configurations were meshed in ANSYS Fluent Meshing using a poly-hexcore strategy, with finer elements applied near the solid–fluid interface and the temperature-controlled base. A formal mesh independence assessment was performed for the Cube topology at 10% relative density under the final production boundary conditions by progressively refining the grid from 89,163 to 638,219 cells. Since the base temperature was prescribed at 312 K, mesh sensitivity was evaluated using the area-weighted solid–fluid interface temperature, interfacial heat transfer rate, surface heat transfer coefficient, and interface-based thermal resistance. The results showed that a mesh containing 434,017 cells provided an appropriate balance between numerical accuracy and computational cost. Further refinement to 638,219 cells changed the interface temperature by less than 0.001% and did not alter the comparative interpretation of the integral thermal performance quantities. Therefore, a nominal production mesh level of approximately 4.0 × 10⁵ cells was adopted for the present comparative study. A secondary mesh-independence assessment was also performed for the BCC X Shape topology to examine whether the convergence behavior established for the Cube case remained representative for a geometrically different lattice architecture. The BCC X Shape exhibited the same convergence trend, with the monitored thermal quantities approaching stable values under successive grid refinement. These two assessments were used to verify the production meshing strategy and are not interpreted as individual mesh independence demonstrations for every topology density combination in the database. The same meshing strategy and quality controls verified for the Cube and BCC X Shape cases were subsequently applied consistently across the complete database, with topology- and density-dependent variations in cell count arising from geometric differences. Numerical convergence was required for every case, with the scaled residuals for continuity, the three velocity components, and energy reduced below 10−6. Energy conservation was additionally verified by confirming that the imbalance between the heat transfer rates at the prescribed-temperature base and the solid–fluid interface remained below 0.001%.
2.2. Boundary Conditions and Physical Model
The simulations used a steady, pressure-based, laminar conjugate heat transfer model.
The governing equations used in the conjugate heat transfer model are given in Equations (2)–(7). Conservation of mass in the incompressible fluid domain is expressed by Equation (2):
The steady momentum equation, including buoyancy through the Boussinesq approximation, is given by Equation (3):
Under the Boussinesq approximation, ρ(T) = ρo = [1 − β(Tf − To)], with density variation retained only in the gravitational body force term.
The steady energy equation in the fluid domain is given by Equation (4):
Steady heat conduction through the solid lattice is governed by Equation (5):
At the coupled solid–fluid interface, temperature continuity is imposed according to Equation (6):
and normal heat-flux continuity is imposed according to Equation (7):
Here, u is the fluid velocity vector, p is pressure, Tf and Ts are the fluid and solid temperatures, respectively, To is the Boussinesq reference temperature, and n is the unit normal vector at the solid–fluid interface. These governing equations, together with the boundary conditions described below, define the conjugate heat transfer problem solved consistently for all topology and relative density cases.
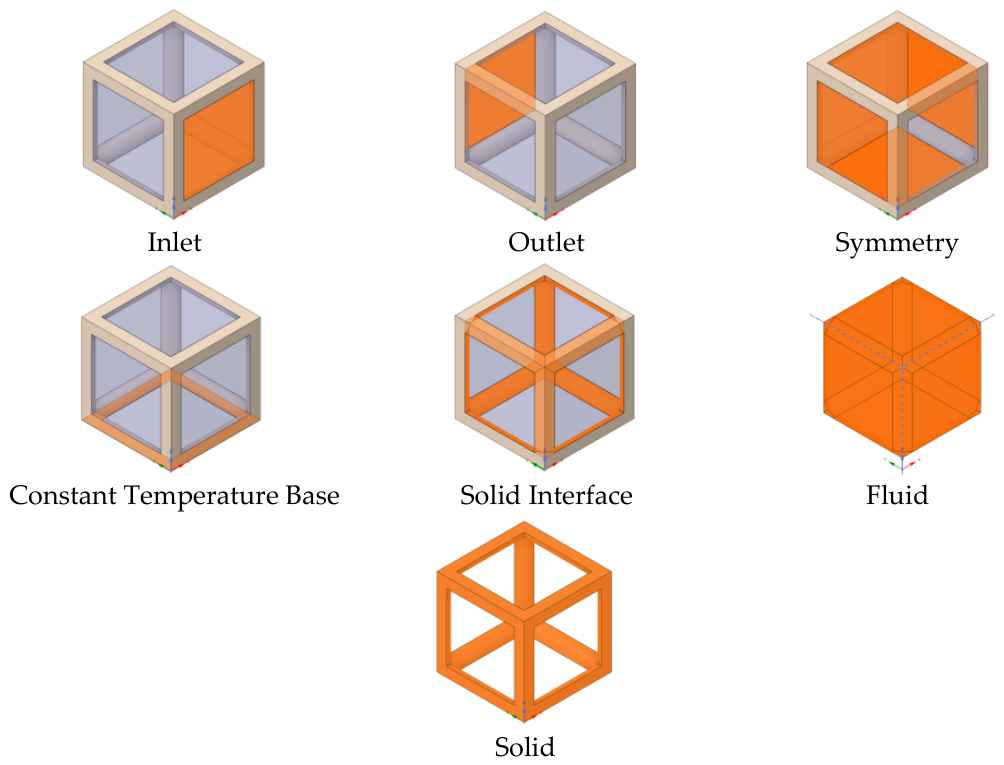
Air entered through an XZ face at a uniform velocity of 0.05 m/s in the positive y direction and a temperature of 300 K. The opposite XZ face was specified as a pressure outlet at 0 Pa gauge pressure. A constant temperature of 312 K was imposed on the base of the solid lattice. Gravity was specified as 9.81 m/s
2 in the negative
z direction, normal to the temperature-controlled base and perpendicular to the imposed inlet flow in the positive
y direction. The remaining external faces were assigned symmetry boundary conditions. A no-slip condition was applied to the fluid at the lattice walls, and thermal coupling was enforced across the solid-to-fluid interface, as shown in
Figure 2.
Buoyancy was represented with the Boussinesq approximation. The air properties used in the model were ρ0 = 1.1925 kg/m3, kf = 2.582 × 10⁻² W/(m·K), μ = 1.8348 × 10⁻⁵ kg/(m·s), ν = 1.5387 × 10⁻⁵ m2/s, cp = 1006.2 J/(kg·K), and β = 3.38 × 10⁻³ K−1. The solid phase was Aluminum 6061 T6 with density 2700 kg/m3 and thermal conductivity 167 W/(m·K). Energy transport was solved in both domains, with temperature and heat flux continuity imposed across the coupled solid-to-fluid interface.
The imposed velocity means that the model is not a pure natural convection problem. Using the unit cell length L = 0.01 m, the inlet Reynolds number is approximately 32.5 as given by Equation (8). The prescribed characteristic temperature difference is ΔT = Tb − Tin = 12 K, where Gr ≈ 1.68 × 10³ and Ri ≈ 1.59, as given by Equations (9) and (10), respectively. The Richardson number is of order unity, indicating that buoyancy and the imposed flow are both relevant. Because the buoyant motion is primarily in the positive z direction while the imposed flow is in the positive y direction, the operating condition is classified as low-speed mixed convection with perpendicular forced flow and buoyancy directions. The inlet Reynolds number characterizes the imposed external flow condition but does not account for local acceleration through the restricted passages of high-density lattices. Therefore, a conservative pore-scale Reynolds-number check was additionally performed for Tetrahedron and FCC-Z at 90% relative density, the two topologies remaining feasible at the highest density considered. The pore hydraulic diameter was evaluated as , where Vf is the fluid volume and Aint is the solid–fluid interfacial area, and the pore-scale Reynolds number was calculated as using the maximum local fluid velocity. For Tetrahedron at 90%, Dh was 1.313 mm and Rep was approximately 49.0, while for FCC-Z at 90%, Dh was 3.160 mm and Rep was approximately 85.8. These values remain well within the laminar regime and support the use of the laminar-flow formulation for the present operating condition.
Pressure velocity coupling was handled with the SIMPLE algorithm. Radiation was intentionally excluded so that the present database isolates conduction and convection under a common set of assumptions. No claim is made that including radiation would preserve the numerical performance ratios or topology ranking. Radiative exchange depends on absolute temperature, emissivity, surface finish, and topology-dependent view factors, none of which were varied or modeled in the present study. The reported ranking therefore applies specifically to the conduction-convection model and should be reevaluated for applications in which radiation is significant. This qualification is consistent with Shahrzadi et al. [
21], who demonstrated that the contribution of radiation in BCC lattices varies with thermal, material, flow, and geometric conditions.
The lateral symmetry boundaries impose zero normal velocity and zero normal gradients of the transported variables on the four side faces. They are used here as a controlled mirror symmetry treatment and are not intended to represent mathematically periodic boundary conditions. The inlet and outlet remain explicitly prescribed on the two streamwise faces; consequently, the model represents the response of a single lattice unit cell under the stated entrance and exit conditions rather than a fully developed infinite periodic medium. The same boundary treatment was applied consistently to every topology so that the database provides an internally consistent unit-cell comparison.
2.3. Postprocessing and Performance Metrics
The principal comparison metric was an interface-based thermal resistance. For each converged case, ANSYS Fluent was used to extract the area-weighted average solid wall temperature at the solid–fluid interface,
Ts,int, and the surface integrated heat transfer rate across the same interface,
Qint. The inlet air temperature
Tin was 300 K for all cases. The thermal resistance was calculated directly from the exported dataset as follows in Equation (11):
The interface-based resistance was selected because the present study is a unit cell topology screening analysis rather than a complete packaged heat sink model. It relates the heat transferred through the lattice–fluid interface to the corresponding interface-to-inlet temperature difference and can be interpreted directly alongside interfacial area and the Fluent surface heat transfer coefficient. It is therefore an interface-based comparative metric and is not intended to replace the conventional base to inlet thermal resistance of a complete heat sink. Lower
Rth indicates greater interfacial heat transfer for the corresponding interface to inlet temperature difference. To verify that the topology ranking was not an artifact of using the interface-based temperature, a conventional base-to-inlet thermal resistance was also evaluated from the existing dataset using Equation (12):
where
Tb = 312 K is the prescribed base temperature and
Qb is the heat transfer rate entering through the temperature-controlled base. A solid-side conduction contribution between the base and the solid–fluid interface was additionally defined using Equation (13):
The steady-state energy balance confirmed that the heat transfer rates at the prescribed temperature base and the solid–fluid interface agreed to within 0.001%. Therefore, |
Qb| ≈ |
Qint|, and the conventional base to inlet resistance can be approximately decomposed as given by Equation (14):
Evaluation of the conventional resistance across the complete dataset showed that inclusion of the solid side conduction temperature drop did not change the topology providing the minimum resistance at any of the sampled relative density levels. The interface-based resistance was therefore retained as the primary comparative metric because it directly characterizes the lattice fluid heat exchange process examined in this study, while the conventional resistance provides an additional check on the resulting topology ranking.
The surface-integrated heat transfer rate reported by Fluent was negative because the interface normal defined heat leaving the solid in the negative convention. The magnitude |Qint| was therefore used in the thermal resistance calculation. The heat transfer coefficient used in this study was the ANSYS Fluent Surface Heat Transfer Coef. field variable, area weighted over the solid–fluid interface. Fluent defines this quantity as , where q″ is the surface heat flux, Tw is the wall temperature, and Tref is the constant reference temperature specified in the Reference Values. In the present simulations, Tref = 300 K, corresponding to the common inlet air temperature. Because heat leaving the solid is negative under the adopted Fluent sign convention while Tw > Tref, the exported coefficient values are negative. The physical comparisons therefore use the magnitude |h|.
The interface-based resistance was selected because the present study is a unit cell topology screening analysis rather than a complete packaged heatsink model. The metric focuses the comparison on heat transferred through the lattice–fluid interface and the corresponding interface-to-inlet temperature difference, allowing the resistance trends to be examined directly alongside the interfacial area and surface heat transfer coefficient. It is therefore an interface-based comparative resistance and should not be interpreted as the complete junction-to-ambient resistance of a full heatsink assembly. Lower Rth indicates greater interfacial heat transfer for the corresponding interface to inlet temperature difference, and the same definition was applied consistently to all 179 cases.
Two additional quantities were used to interpret the resistance trends. The solid–fluid interfacial area Aint measures the wetted geometric surface available for convection, while the area-weighted surface heat transfer coefficient h describes the local convective response reported by Fluent. Because neither Aint nor |h| alone determines the interfacial heat transfer rate, both metrics are considered together when explaining the topology trends.
The fixed 312 K base temperature is the prescribed thermal boundary condition. By contrast, the surface integrated interfacial heat transfer rate is extracted across the solid-to-fluid interface and is used in the interface-based resistance metric. These quantities are kept distinct so that the postprocessed metric is not interpreted as a whole device energy balance.
2.4. Data Collection
Each topology was simulated over its feasible relative density range in 10 percentage point increments. The final dataset contains 179 valid cases. For every case, the same postprocessing sequence was used to extract
Qint,
Aint,
Ts,int,
h, and
Rth. The complete numerical dataset for all topology-density combinations is provided in
Figure 1. The dataset was then organized by topology and relative density to support the subsequent comparative analysis and to identify density-dependent performance changes.
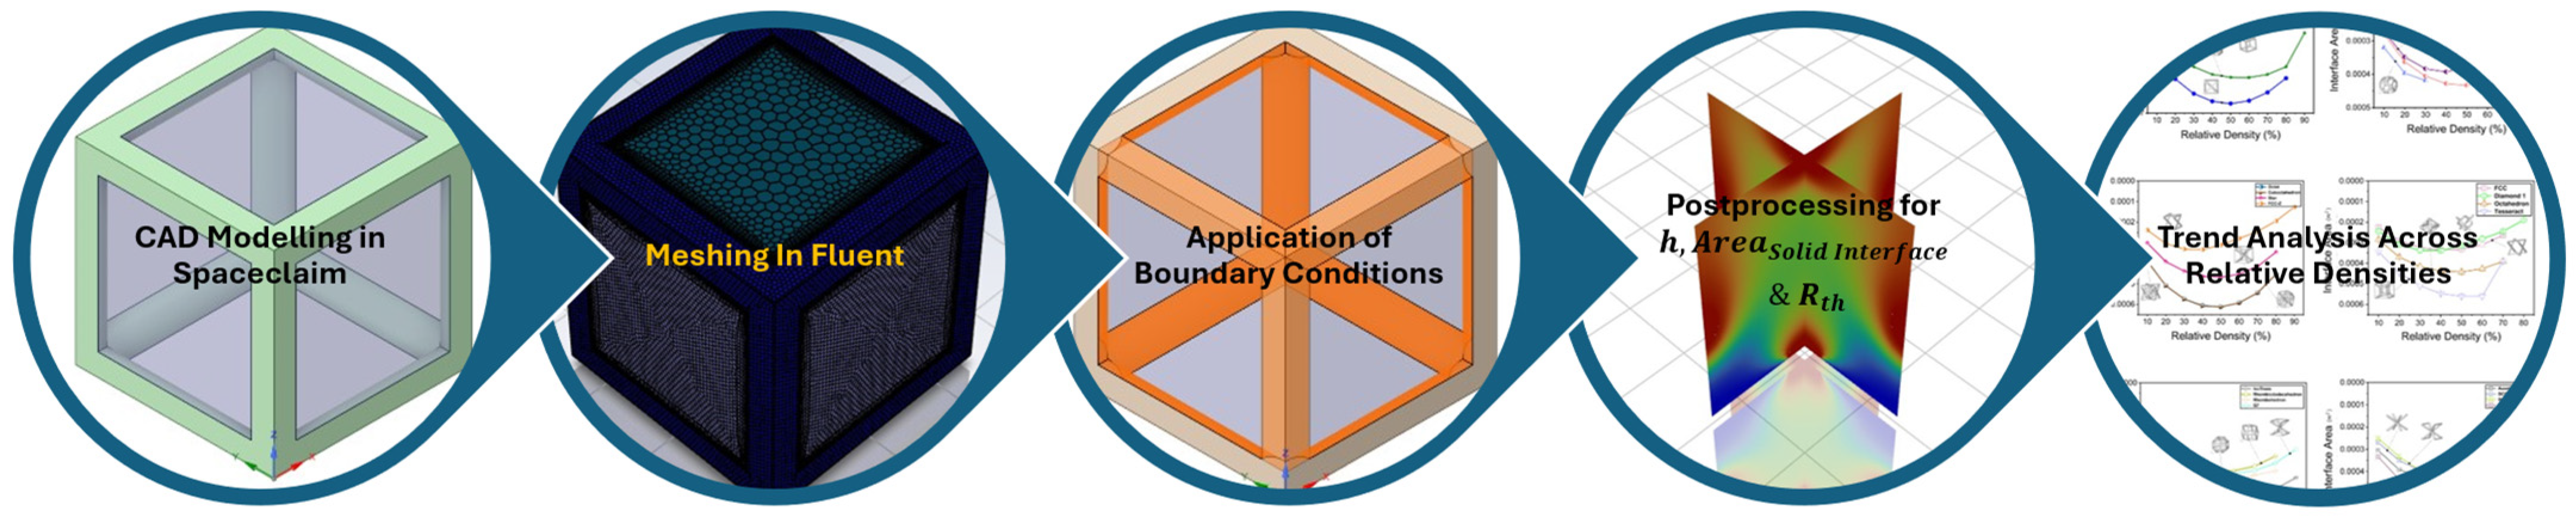
The workflow as shown in
Figure 3 was designed as a comparative screening framework. Accordingly, conclusions are restricted to the defined unit cell scale, material properties, thermal loading, inlet condition, gravity orientation, symmetry boundaries, and omitted radiation model. The ranking should not be interpreted as a universal ranking for every flow regime or device scale.
2.5. Hydrodynamic Model Validation
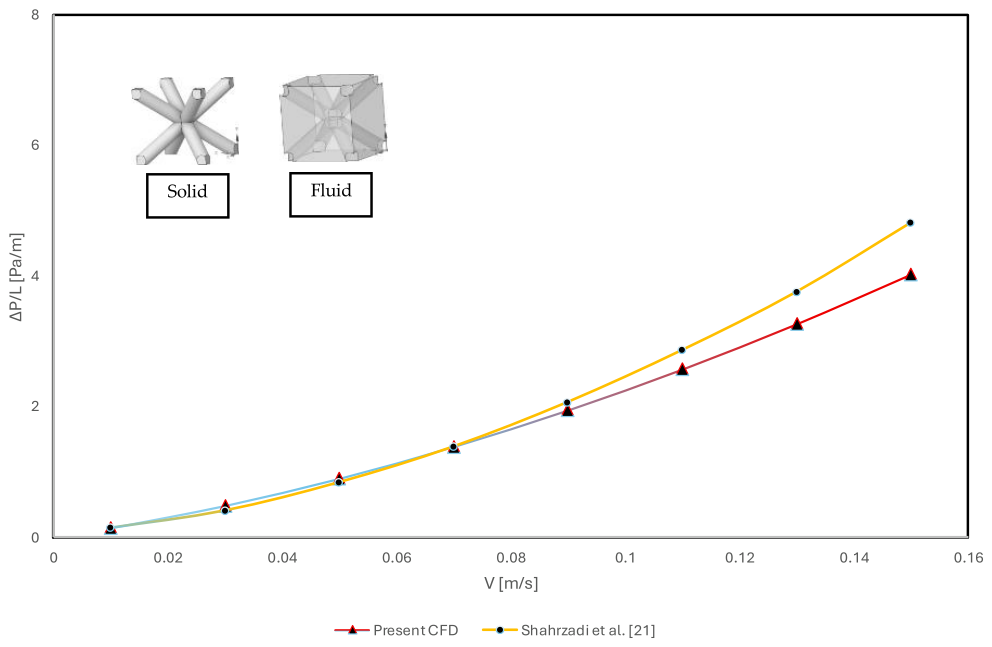
The hydrodynamic component of the numerical framework was benchmarked against the pressure gradient results reported by Shahrzadi et al. [
21] for a BCC lattice with a porosity of
ϕ = 0.85. Because Shahrzadi et al. [
21] did not provide tabulated numerical values, the published pressure-gradient curve was digitized graphically using a plot-digitization tool. Coordinate values were extracted from the published curve at the eight superficial velocities used in the present CFD comparison.
Figure 4 therefore presents these eight extracted published values together with the corresponding present CFD predictions.
Figure 4 compares the resulting published comparison data with the present numerical predictions over the velocity range investigated. Because the comparison values were extracted graphically from the published curve, a small digitization uncertainty is inherent in the benchmark dataset. The comparison is therefore intended to assess agreement in magnitude and trend rather than to imply greater precision than the source figure permits.
The present CFD model reproduces the nonlinear increase in pressure gradient with superficial velocity observed in the published study of Shahrzadi et al. [
21]. The mean absolute percentage error across the eight comparison points was approximately 9.0%, with a root mean square error of 0.348 Pa/m and a coefficient of determination of R
2 = 0.950. The present model slightly underpredicts the published comparison values as velocity increases. Nevertheless, the overall magnitude and nonlinear dependence of pressure gradient on superficial velocity are reproduced with reasonable agreement. The present comparison is a hydrodynamic benchmark of the fluid-domain implementation and does not constitute direct validation of the thermal-resistance metric. Accordingly, the thermal results are interpreted as internally consistent comparative predictions under the stated boundary conditions rather than as experimentally validated absolute heat-sink performance values. The topology rankings should therefore be transferred to a full device only after validation under the intended geometry, heat load, surface condition and flow environment.
3. Results and Discussion
The 179 converged cases were analyzed using the representative temperature fields and the three quantitative interface metrics: the Fluent surface heat transfer coefficient, the solid–fluid interfacial area, and the interface-based thermal resistance. The discussion below distinguishes measured trends in the extracted data from physical interpretations. Where velocity fields or wall shear were not directly plotted, the discussion avoids treating those mechanisms as independently demonstrated results.
3.1. Temperature Contour Analysis
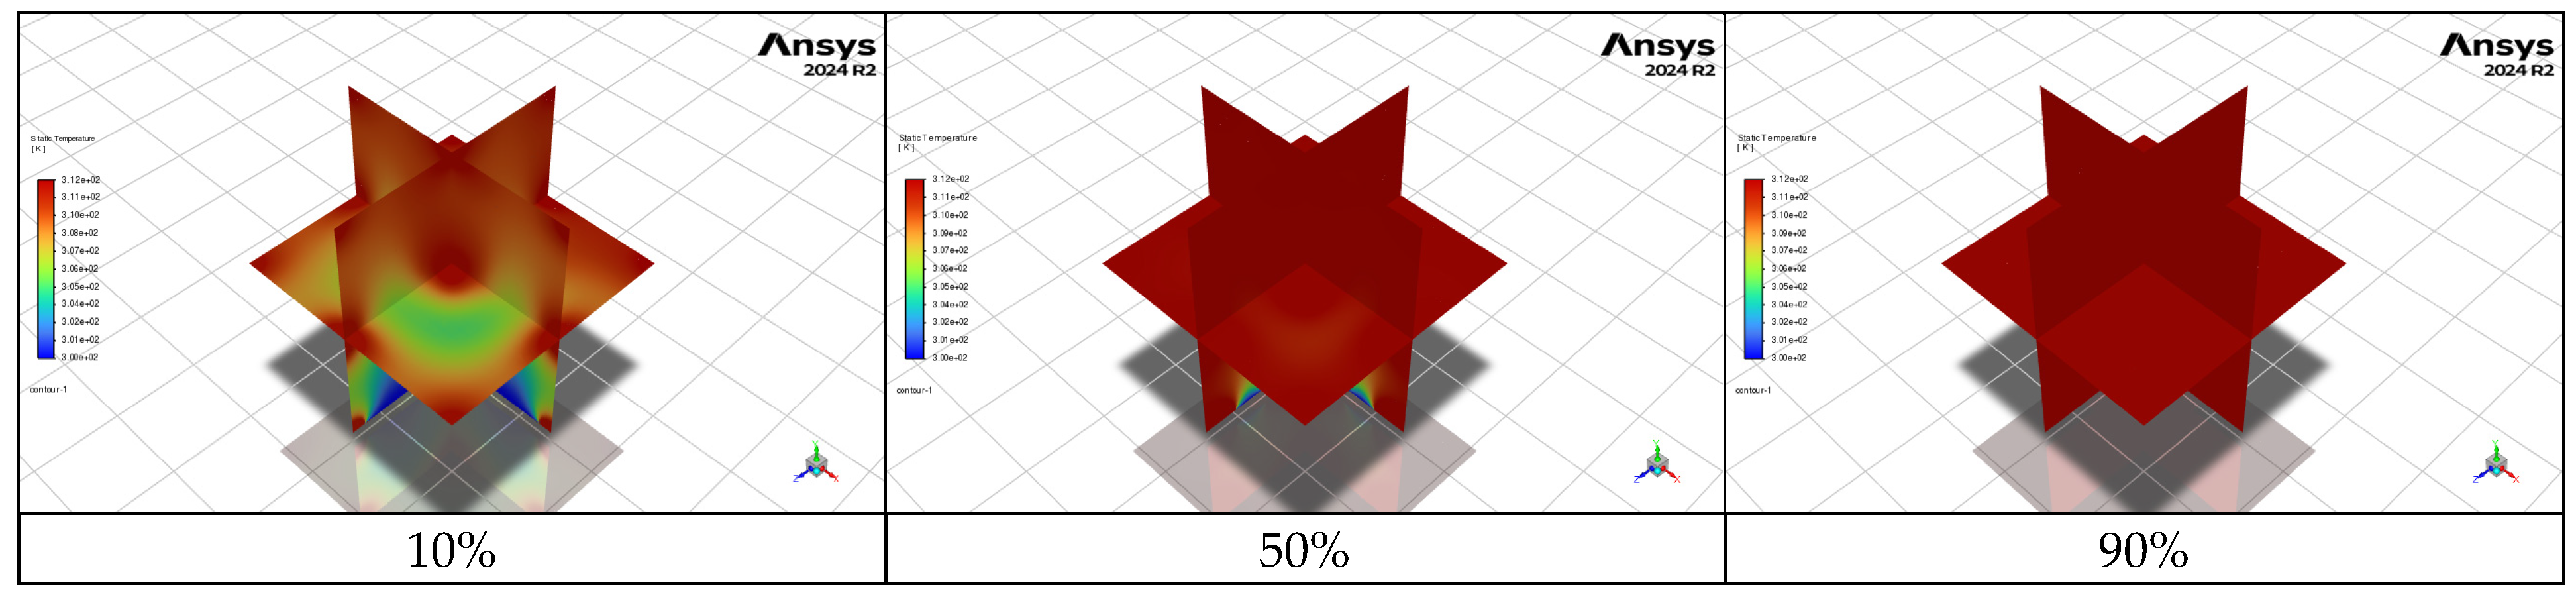
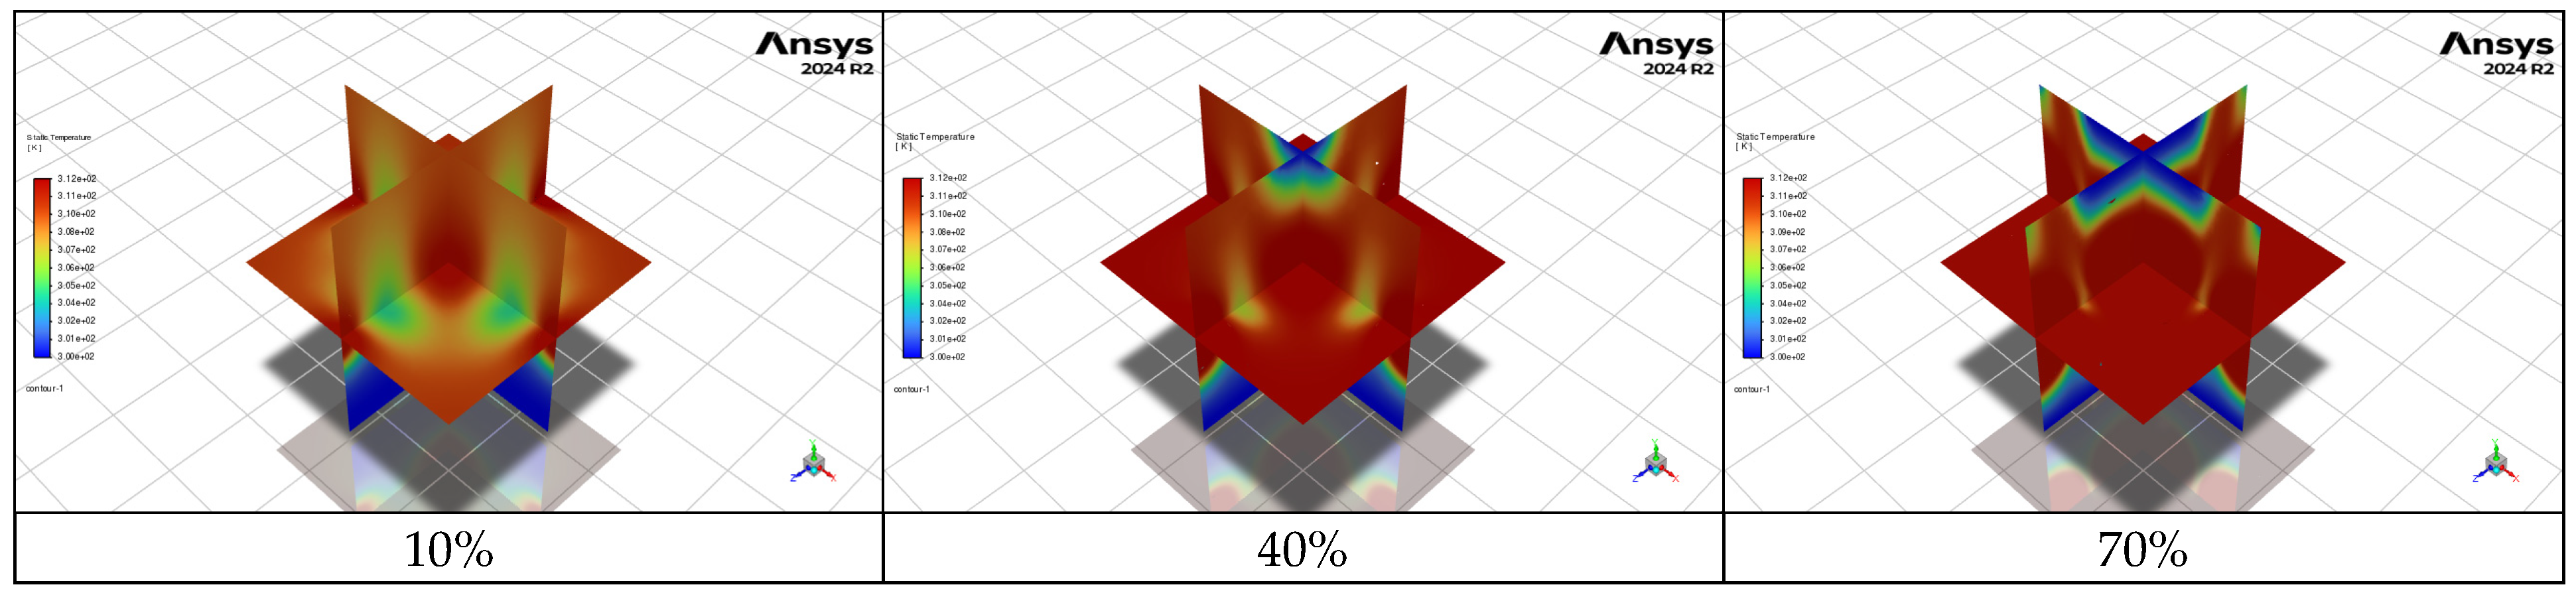
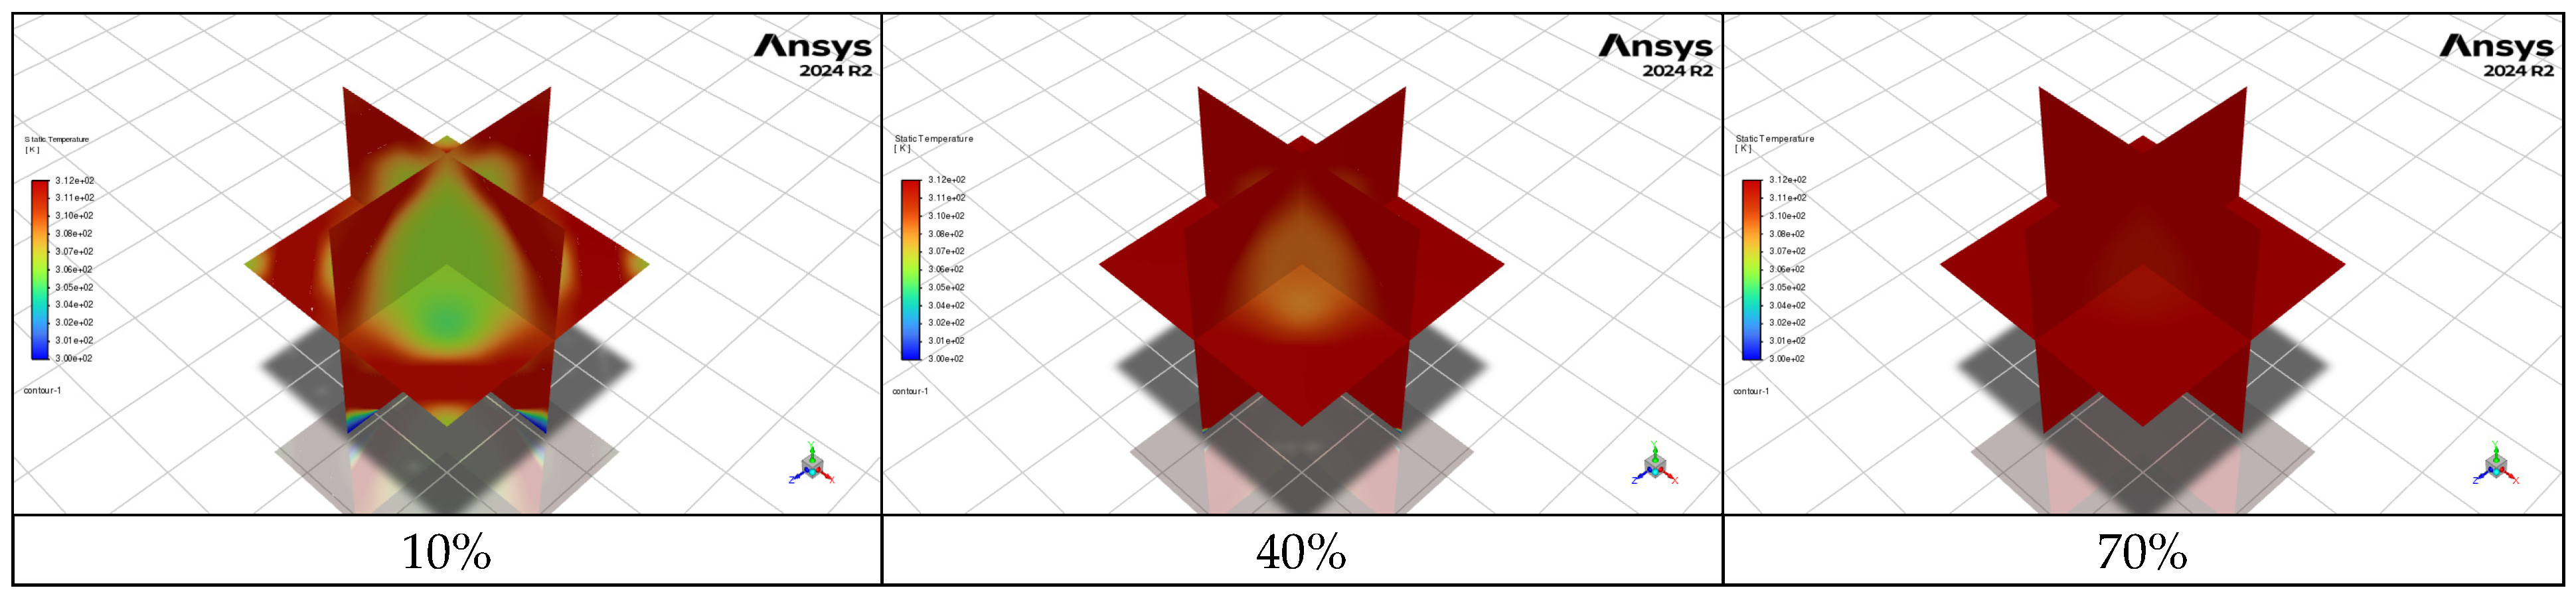
Figure 5,
Figure 6 and
Figure 7 present representative temperature contours for FBCC, Kelvin, and Tetrahedron. These three topologies were selected because their quantitative resistance trends diverge strongly as relative density increases. FBCC improves continuously over its feasible range, Kelvin deteriorates after its low-density minimum, and Tetrahedron deteriorates sharply with densification.
The contour plots are used qualitatively to show how the temperature field changes within each topology. Quantitative cross-topology ranking is based on the extracted metrics rather than color alone because contour limits and local field scaling can affect visual comparison. For FBCC, Rth decreases from 152.37 K/W at 10% to 118.76 K/W at 40% and 97.56 K/W at 70%, while |Qint| increases from 0.0767 W to 0.1005 W and then 0.1226 W.
This monotonic improvement is consistent with the combined interface metrics. FBCC reaches its largest interfacial area near 40% relative density, 5.08 × 10⁻⁴ m2, after which Aint decreases, but |h| increases from 16.59 W/(m2·K) at 40% to 24.44 W/(m2·K) at 70%. The increase in convective coefficient magnitude compensates for the reduction in area and produces a larger interfacial heat transfer rate at the highest feasible density.
Kelvin shows a different response. Its minimum Rth occurs at 20% relative density, 156.69 K/W. The resistance then rises to 169.23 K/W at 40% and 249.06 K/W at 70%. Over the same range, Aint peaks at 3.93 × 10⁻⁴ m2 at 40%, whereas |h| decreases from 22.73 W/(m2·K) at 10% to 15.07 W/(m2·K) at 40% and 11.91 W/(m2·K) at 70%. Thus, the increase in available surface through the intermediate densities is not sufficient to offset the decreasing convective coefficient magnitude.
Tetrahedron exhibits the strongest deterioration among the three representative cases. Rth increases from 168.59 K/W at 10% to 317.84 K/W at 50% and 1063.51 K/W at 90%. Although Aint grows from 3.16 × 10⁻⁴ m2 at 10% to approximately 5.25 × 10⁻⁴ m2 at 50%, |h| falls from 18.90 to 6.00 W/(m2·K). At 90%, |h| is only 1.53 W/(m2·K) and Qint is 0.0113 W. The data therefore show that a larger interface area at intermediate density does not guarantee a lower thermal resistance when the convective response weakens strongly.
Taken together,
Figure 5,
Figure 6 and
Figure 7 show that the divergent density trends arise from architecture-specific coupling between interfacial area and the computed interface heat-transfer response rather than from an unspecified limitation of the numerical model. FBCC improves because the increase in |
h| at higher density compensates for the post-40% reduction in interfacial area and increases
Qint, Kelvin deteriorates because its declining |
h| is not offset by the intermediate-density area increase; and Tetrahedron exhibits the strongest deterioration because |
h| and
Qint decrease sharply despite its larger intermediate density area. These directly extracted quantities explain the observed
Rth trends within the present model. Identification of a unique local flow mechanism would require additional velocity, wall shear, or local heat transfer field analysis.
3.2. Surface Heat Transfer Coefficient Trends
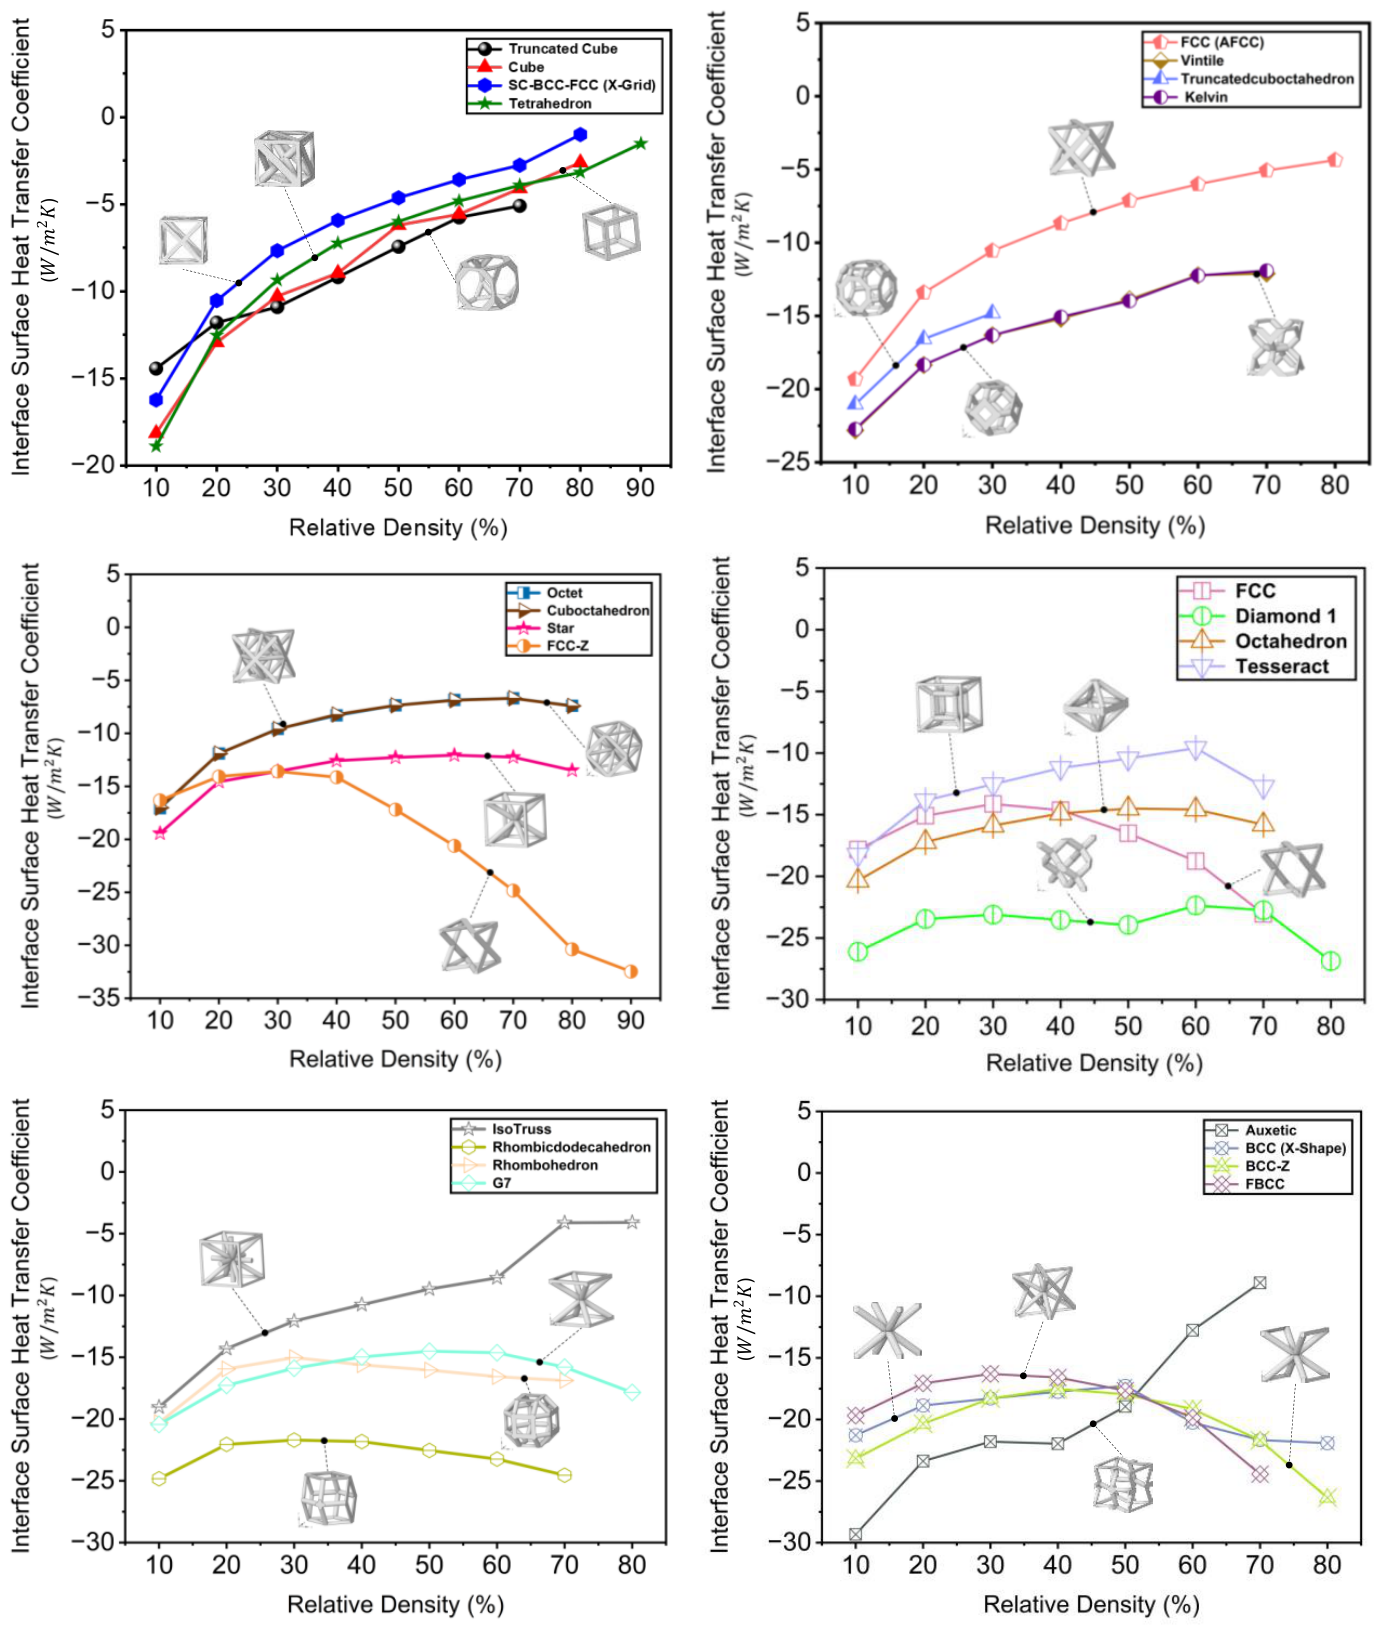
Figure 8 presents the area-weighted surface heat transfer coefficient reported by Fluent. The plotted values are negative because of the wall normal and heat flux sign convention. The sign indicates direction and is not interpreted as a negative physical convection coefficient; the discussion therefore uses the magnitude |
h|. The common reference condition for all cases is the 300 K inlet air temperature.
At 10% relative density, |h| ranges from 14.44 to 29.33 W/(m2·K) across the 24 topologies. The highest value is for Auxetic and the lowest for Truncated Cube. As density increases, the topologies separate into markedly different trends. This separation is important because densification does not produce a uniform increase or decrease in convective response.
BCC Z, BCC X Shape, Diamond, and FBCC preserve relatively large coefficient magnitudes over much of their feasible ranges. BCC Z decreases from 23.17 W/(m2·K) at 10% to a minimum of 17.53 W/(m2·K) at 40%, then increases to 26.35 W/(m2·K) at 80%. FBCC similarly reaches a minimum of 16.30 W/(m2·K) at 30% before increasing to 24.44 W/(m2·K) at 70%. Diamond remains between 22.36 and 26.86 W/(m2·K) across its complete 10% to 80% range. These data show that some architectures recover or maintain their interfacial convective response after the intermediate density region.
Other topologies show a gradual or moderate decline. G7 decreases from 20.44 W/(m2·K) at 10% to values near 14.5 to 17.8 W/(m2·K) over the higher densities. Octahedron follows a similar intermediate pattern, while Kelvin decreases from 22.73 W/(m2·K) at 10% to 11.91 W/(m2·K) at 70%. These cases produce moderate resistance trends because the coefficient decline is partly offset by changes in area and solid connectivity.
The strongest deterioration occurs for Cube, Cross X, Tetrahedron, and several other increasingly obstructed cases. Cube decreases from |h| = 18.16 W/(m2·K) at 10% to 2.61 W/(m2·K) at 80%. Cross X decreases from 16.24 to 1.01 W/(m2·K) over the same density range. Tetrahedron decreases from 18.90 W/(m2·K) at 10% to 1.53 W/(m2·K) at 90%. The extracted coefficient therefore identifies a major reason why the high-density thermal resistance of these topologies increases despite their additional solid material.
The coefficient trends should be interpreted as an interface metric, not as independent evidence of a single flow mechanism. Because |h| and Rth are both derived from the same wall heat-flux and temperature solution, their correlation is interpreted as a coupled numerical trend rather than proof that a change in |h| independently causes the corresponding change in thermal resistance. The results demonstrate that topology and density strongly alter the combined interfacial response; therefore, Aint, |h| and Qint are considered together when interpreting the resistance trends. Representative velocity, wall-shear, or local heat transfer fields would be required to isolate the detailed flow mechanism responsible for each change.
3.3. Solid–Fluid Interfacial Area Trends
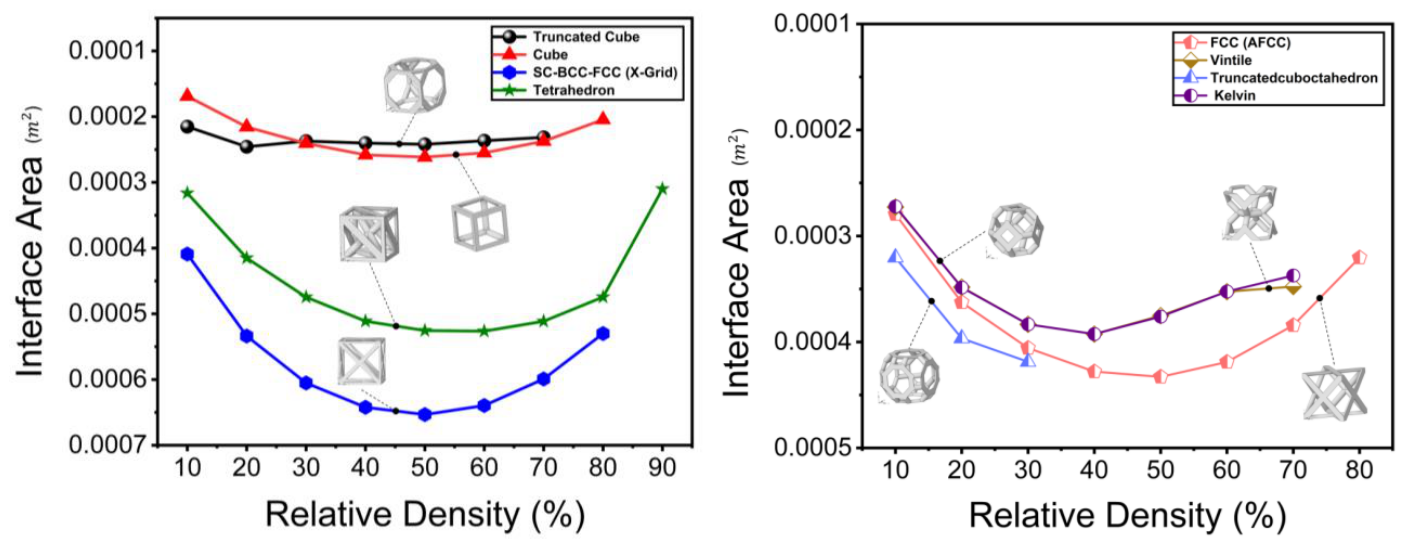
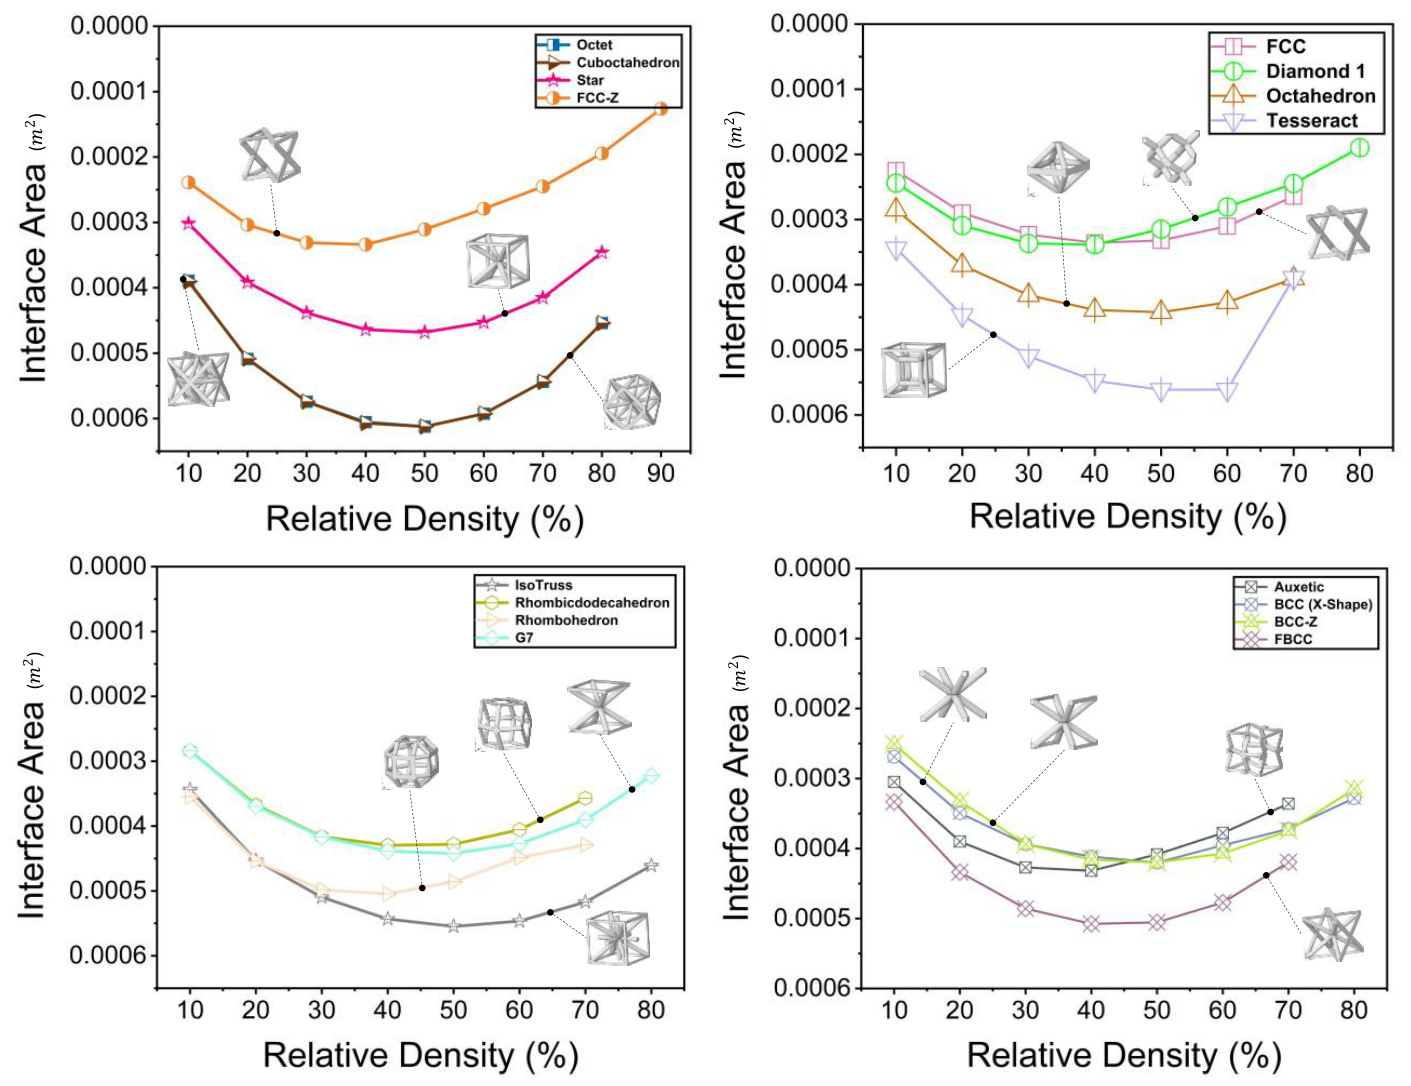
Figure 9 shows the solid–fluid interfacial area
Aint. Unlike |
h|, which may increase or decrease strongly with density,
Aint generally rises from low density to an architecture-dependent maximum and then declines when growing struts merge and the exposed fluid solid boundary is reduced. The exact peak therefore depends on topology.
Cross X has the largest area in the dataset over much of the common density range. Aint increases from 4.09 × 10⁻⁴ m2 at 10% to 6.53 × 10⁻⁴ m2 at 50%, then decreases to 5.30 × 10⁻⁴ m2 at 80%. Cuboctahedron and Octet reach similar peaks of approximately 6.12 × 10⁻⁴ m2 at 50%. Nevertheless, these topologies do not provide the lowest thermal resistance at high density. Cross X, for example, reaches 942.02 K/W at 80% because |h| has fallen to approximately 1.01 W/(m2·K).
FBCC illustrates a more favorable balance. Its area increases from 3.33 × 10⁻⁴ m2 at 10% to a maximum of 5.08 × 10⁻⁴ m2 at 40%, then decreases to 4.20 × 10⁻⁴ m2 at 70%. Over the same upper density range, however, |h| increases and |Qint| continues to rise, so Rth continues to fall. Rhombic Dodecahedron follows a related pattern: its interfacial area peaks near 40%, while its resistance reaches a minimum of 103.71 K/W at 50%.
Cube and Truncated Cube remain area-limited compared with the largest area architectures. Cube increases from 1.69 × 10⁻⁴ m2 at 10% to only 2.62 × 10⁻⁴ m2 at 50% before declining. Truncated Cube remains between approximately 2.15 × 10⁻⁴ and 2.46 × 10⁻⁴ m2 over its feasible range. Their limited area is compounded by decreasing |h|, producing large increases in Rth with density.
The interfacial area results therefore provide a necessary but incomplete explanation of thermal performance. A topology can have a large surface area and still perform poorly if the effective convective coefficient collapses, while a topology with a smaller area can remain competitive when it preserves a strong interface coefficient and connected solid heat spreading pathways. The resistance trends in the next section reflect the combined outcome of these effects.
3.4. Interface-Based Thermal Resistance Trends
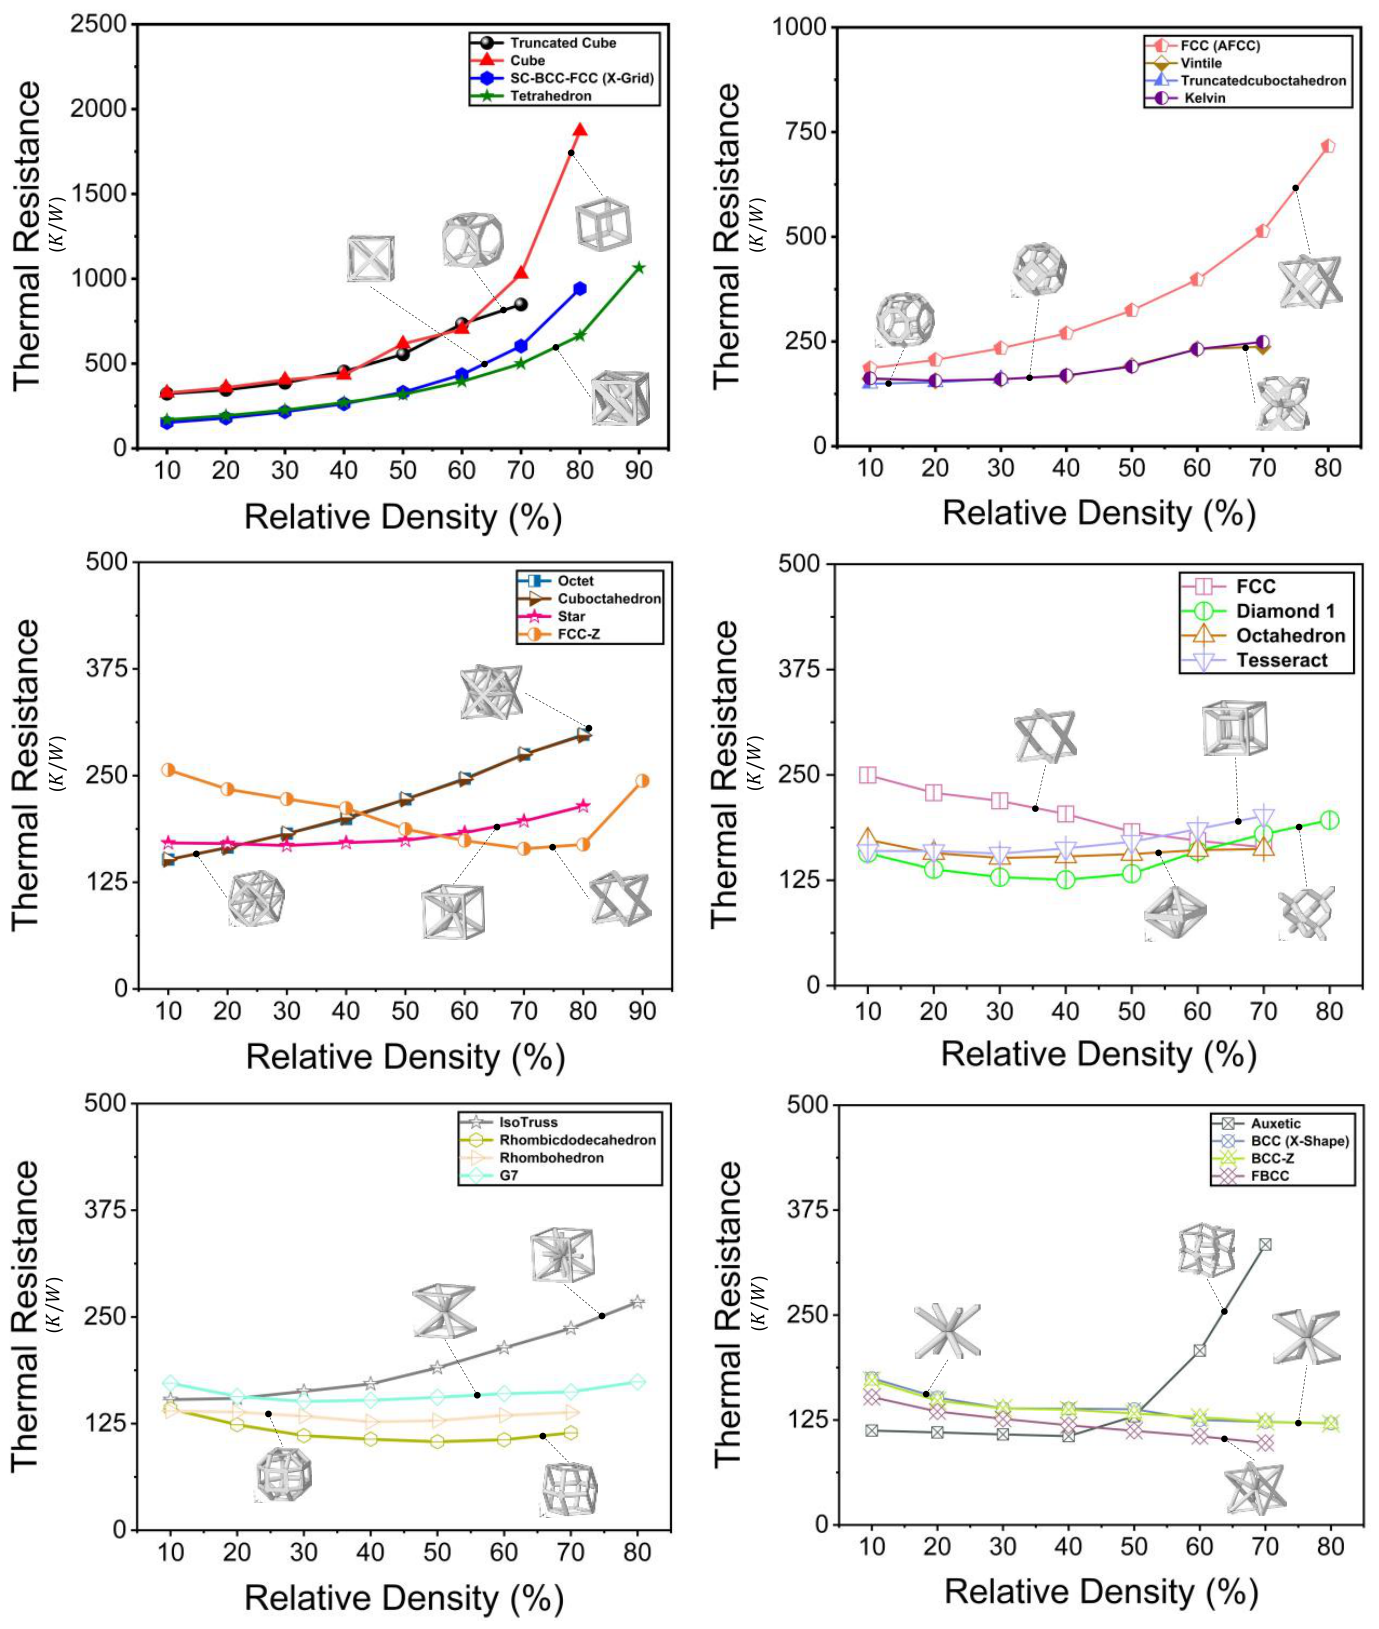
Figure 10 presents
Rth for all valid topology and density cases. Because the feasible upper density differs among topologies, comparisons are made at common density levels whenever possible. At 10%, all 24 topologies are represented. Auxetic gives the lowest
Rth, 112.34 K/W, followed by Rhombohedron at 139.72 K/W and Rhombic Dodecahedron at 142.27 K/W. Cube and Truncated Cube are the two highest resistance cases at 327.51 and 322.44 K/W, respectively.
From 20% to 40%, Auxetic remains the minimum resistance topology, reaching 105.74 K/W at 40%. Rhombic Dodecahedron remains close at 106.76 K/W, while FBCC improves to 118.76 K/W. Over the same range, Cube and Truncated Cube deteriorate to 432.70 and 453.19 K/W at 40%. The separation between the best and worst feasible cases therefore increases from 215.18 K/W at 10% to 347.45 K/W at 40%.
At 50%, Rhombic Dodecahedron gives the lowest resistance, 103.71 K/W, followed by FBCC at 112.08 K/W. At 60% and 70%, FBCC becomes the minimum resistance case, reaching 105.59 and 97.56 K/W, respectively. BCC Z and BCC X Shape improve steadily at the upper densities and become the two lowest resistance topologies among the 13 cases that remain feasible at 80%, with values of 120.61 and 121.03 K/W.
Several architectures show the opposite response. Cube increases from 327.51 K/W at 10% to 1871.16 K/W at 80%. Truncated Cube reaches 848.00 K/W at its 70% limit. Cross X increases from 152.45 K/W at 10% to 942.02 K/W at 80%, despite having one of the largest interfacial areas in the study. Tetrahedron increases from 168.59 K/W at 10% to 1063.51 K/W at 90%. These cases demonstrate that densification can be strongly detrimental when the reduction in effective convective transfer outweighs gains in solid fraction or surface area.
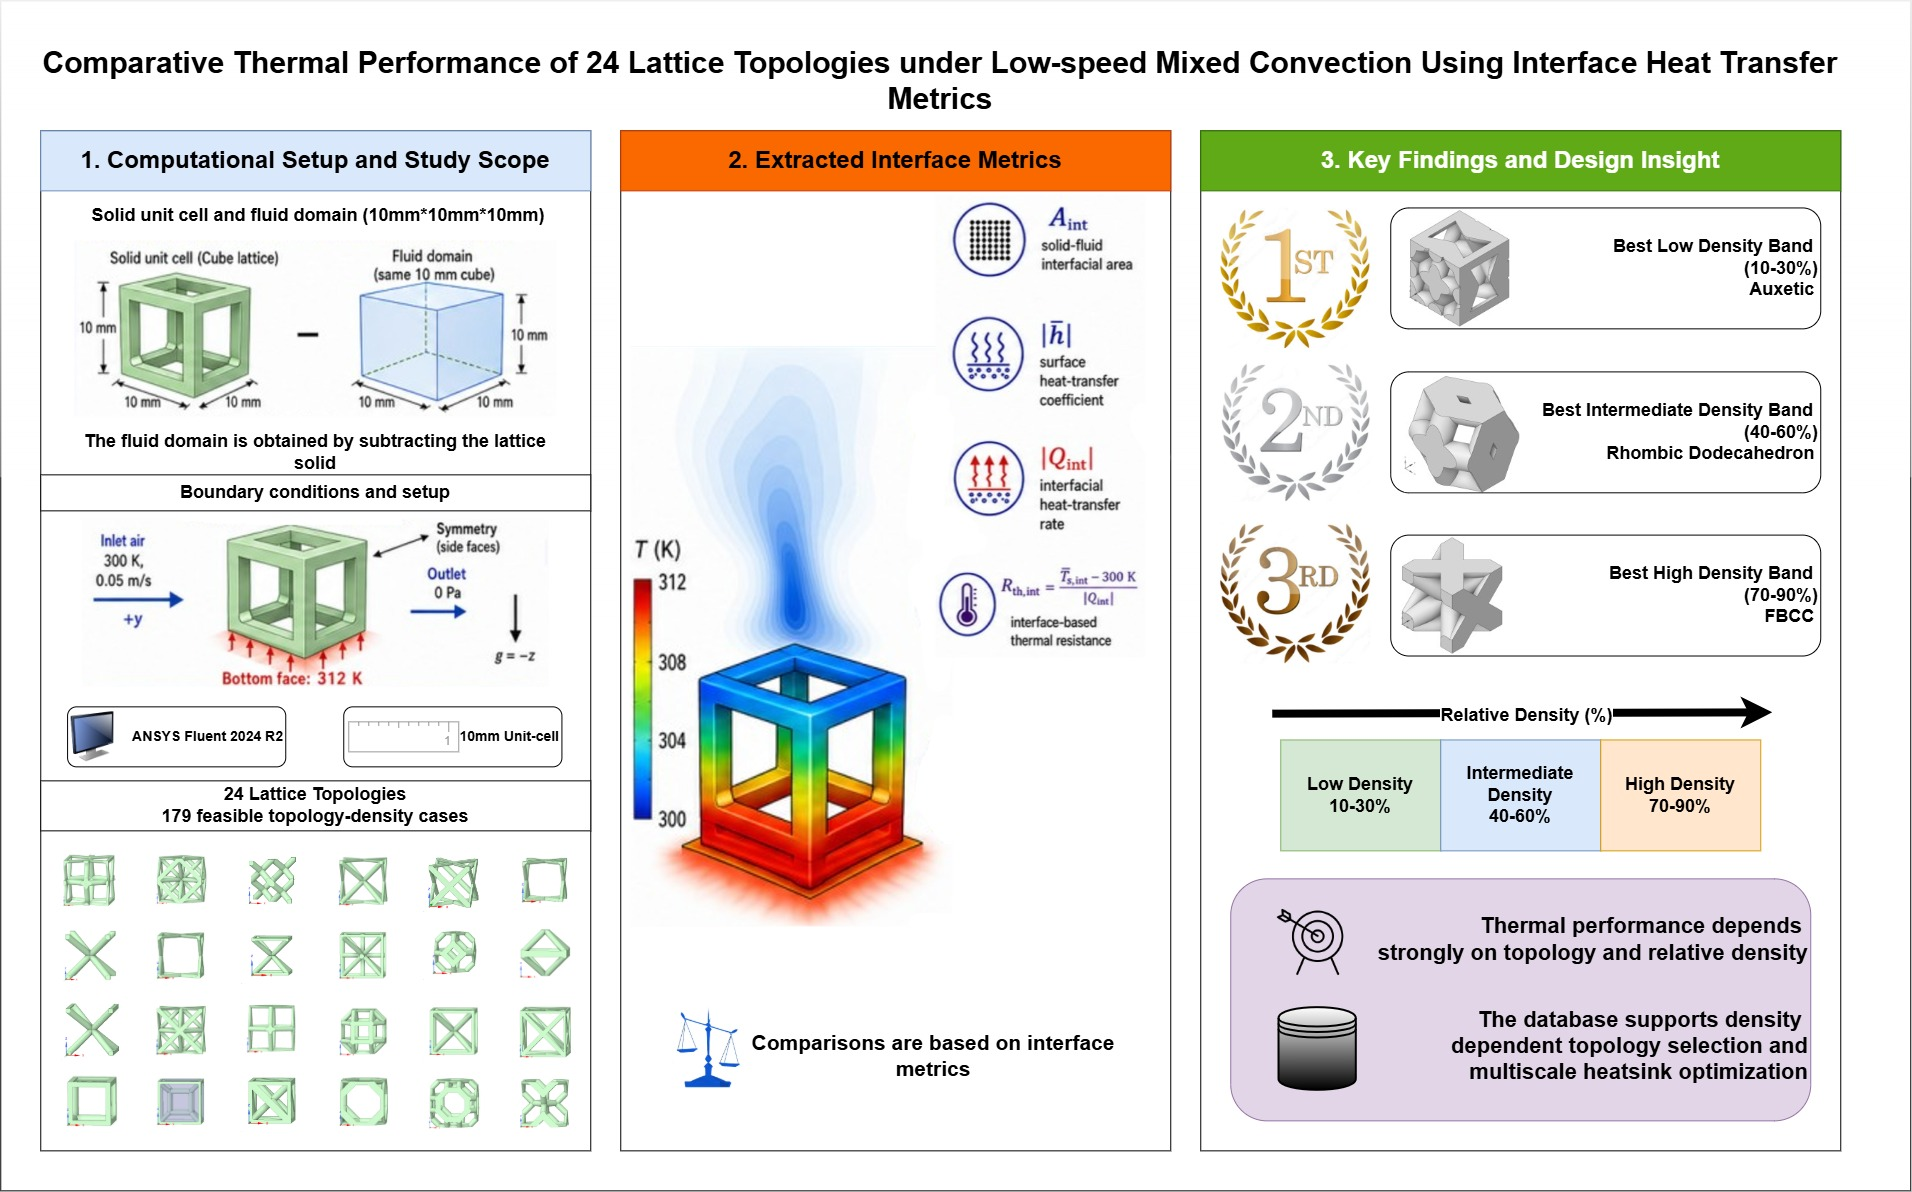
The data also show that no single topology dominates every density. Auxetic is the best case from 10% through 40% but deteriorates rapidly above 40%. Rhombic Dodecahedron is strongest near the intermediate density range, and FBCC becomes strongest from 60% to 70%. BCC Z and BCC X Shape are the leading high-density options at 80%. The most useful design conclusion for the present operating condition is therefore density-dependent topology selection rather than a universal ranking.
The ranking presented here is strictly a thermal ranking under the common imposed inlet velocity of 0.05 m/s and should not be interpreted as a thermal hydraulic or pumping power optimum. A topology with a low thermal resistance may simultaneously impose a larger pressure drop penalty, particularly as relative density increases and the available fluid passages become more restricted. Accordingly, the topologies identified as favorable in the present study should be interpreted as thermally favorable candidates under the specified flow condition rather than universally optimal heat exchanger architectures.
For aerospace and electronic heatsink design, this density dependence is important because topology and solid fraction may be selected locally within a multiscale design. The present dataset provides the comparative thermal screening information required for that type of architecture assignment, subject to the operating assumptions of the current CFD framework and the additional hydraulic assessment required for practical system-level selection.
3.5. Thermal Performance Envelope
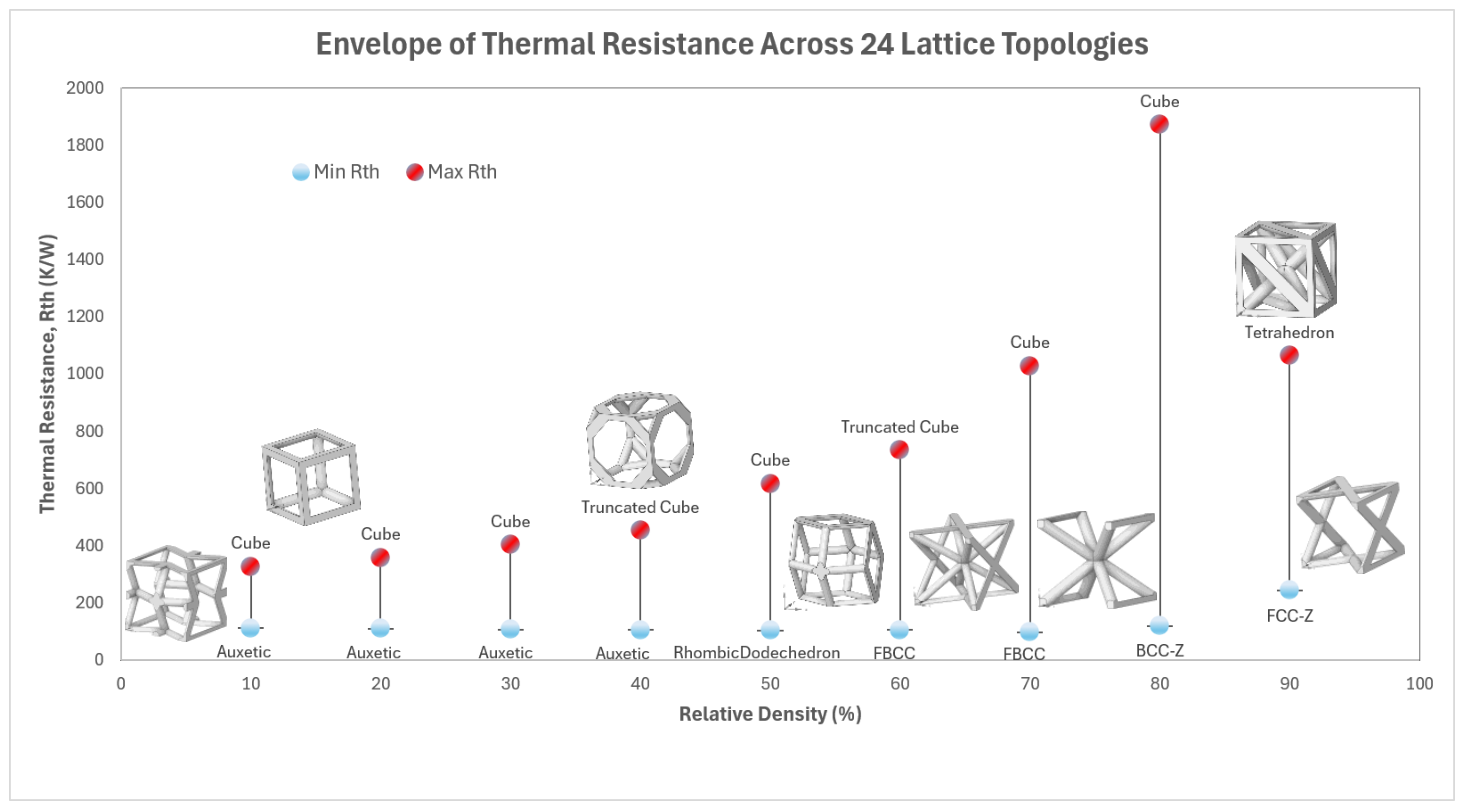
Figure 11 condenses the resistance results into the minimum and maximum feasible value at each density. The number of contributing topologies changes with density: 24 topologies are available from 10% to 30%, 23 from 40% to 70%, 13 at 80%, and only 2 at 90%. The envelope must therefore be interpreted as the spread among the topologies that are geometrically feasible at each density rather than as a comparison of all 24 topologies at every point.
The envelope widens strongly with densification. Its span increases from 215.18 K/W at 10% to 512.78 K/W at 50%, 930.56 K/W at 70%, and 1750.55 K/W at 80%. The lower bound shifts from Auxetic at 10% to 40%, to Rhombic Dodecahedron at 50%, to FBCC at 60% and 70%, and to BCC Z at 80%. At 90%, FCC-Z provides the lower resistance of the two geometrically feasible topologies. The upper bound is dominated by Cube or Truncated Cube over most of the common density range. This widening envelope is the clearest evidence that topology selection becomes increasingly consequential as the lattice is densified.
4. Conclusions
This study compared 24 lattice topologies over 179 geometrically feasible relative density cases using a common ANSYS Fluent 2024 R2 conjugate heat transfer framework. The model used 10 mm unit cells, air at 300 K, an inlet velocity of 0.05 m/s, a constant base temperature of 312 K, and gravity in the negative z direction. Gravity was therefore normal to the heated base and perpendicular to the imposed streamwise flow. The solid phase was Aluminum 6061 T6, and identical postprocessing definitions were applied to all cases. The inlet Reynolds number is approximately 32.5 and the representative Richardson number is approximately 1.59, so the condition is correctly described as low-speed mixed convection rather than pure natural convection.
The results demonstrate that relative density alone does not determine thermal performance. At low density, Auxetic provides the lowest interface-based thermal resistance, reaching 112.34 K/W at 10% and 105.74 K/W at 40%. Rhombic Dodecahedron becomes the best case at 50%, with 103.71 K/W. FBCC then reaches the overall minimum in the dataset, 97.56 K/W at 70%. At 80%, BCC Z and BCC X Shape are the two strongest feasible cases, at 120.61 and 121.03 K/W.
The poorest high-density responses occur when the decrease in the effective surface heat transfer coefficient overwhelms any benefit from additional solid material or interfacial area. Cube rises to 1871.16 K/W at 80%, Cross X to 942.02 K/W at 80%, and Tetrahedron to 1063.51 K/W at 90%. Cross X is particularly instructive because it has the largest interfacial area over much of the common density range but still performs poorly at high density after the magnitude of |h| decreases sharply. Interfacial area must therefore be interpreted together with the convective coefficient and interfacial heat transfer rate.
For the specific unit cell size, inlet velocity, temperature difference, gravity orientation, material properties, and boundary conditions examined in this study, the practical outcome is a density-dependent topology map rather than one universally optimal architecture. Auxetic is favored in the low-density range, Rhombic Dodecahedron and FBCC are strongest through the intermediate to upper common range, and BCC-Z and BCC X Shape become competitive among the topologies that remain feasible at 80% relative density. This behavior is directly relevant to multiscale design optimization, where different local density regions of an aerospace heatsink can be assigned different lattice architectures instead of using one topology throughout the component.
The identified crossover densities should therefore be interpreted as operating-condition-specific results rather than universal transition points, and additional inlet velocities, unit cell sizes, thermal loads, and gravity orientations, material properties, and radiative conditions would be required before the same ranking could be generalized to other operating conditions. The study also establishes the limits of the present conclusions. The thermal metric is an interface-based resistance derived from the solid–fluid interface temperature and interfacial heat transfer rate. The validation is hydrodynamic, not direct thermal validation. Radiation was intentionally excluded; accordingly, the reported topology ranking is specific to the conduction-convection model and may change when radiation is significant. Pressure drop was not compared across all 24 topologies, so the present ranking represents thermal performance at a common imposed inlet velocity rather than combined thermal-hydraulic performance or pumping power efficiency. Only one unit-cell size and one inlet velocity were considered, and lateral symmetry was used as a controlled single-cell boundary treatment. These limitations should be retained when transferring the rankings to a complete heatsink or a different operating regime.
Future work should extend the database across unit cell size, flow velocity, gravity orientation, and thermal loading; include topology-wide pressure loss and thermal hydraulic measures; perform direct thermal validation; and evaluate full heatsink assemblies. Within these limitations, the present database provides a consistent numerical screening basis for selecting candidate lattice architectures for subsequent experimentally validated, full-device thermal design.