Article

Study on Rain Erosion Damage Characteristics of Oriented Polymethyl Methacrylate Based on a Continuous Jet Rain Erosion Test System

1
School of Aeronautics, Northwestern Polytechnical University, Xi’an 710072, China
2
National Key Laboratory of Strength and Structural Integrity, Xi’an 710072, China
*
Author to whom correspondence should be addressed.
Aerospace 2026, 13(9), 756; https://doi.org/10.3390/aerospace13090756
Submission received: 15 July 2026 / Revised: 17 August 2026 / Accepted: 18 August 2026 / Published: 24 August 2026
(This article belongs to the Section Aeronautics)

Abstract

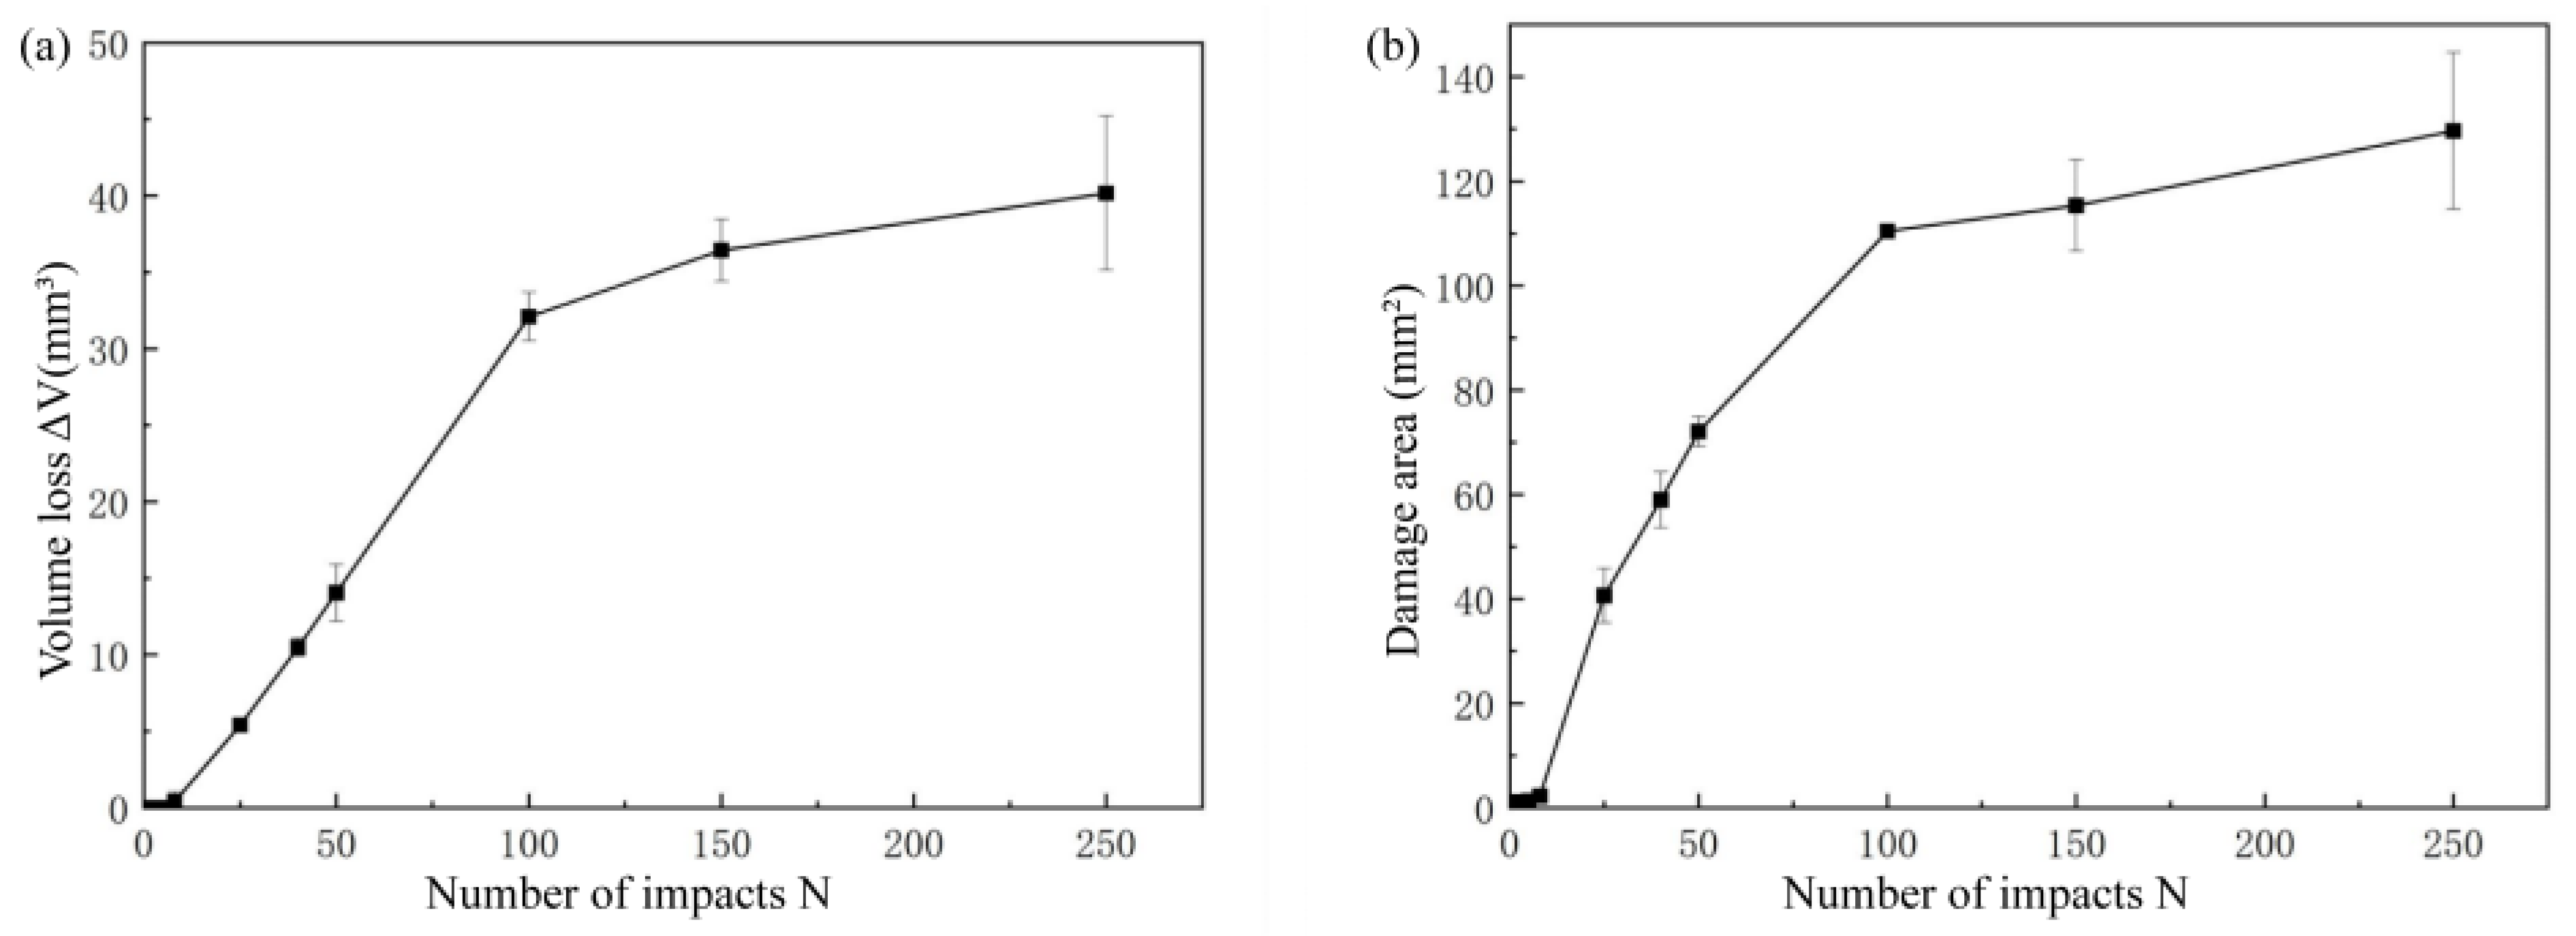
To address rain erosion damage of oriented polymethyl methacrylate (PMMA) under high-speed droplet impact, three types of tests (single pulsed jet impact, continuous single pulsed jet impact and continuous twin pulsed jet coupled impact) were conducted using a self-developed continuous jet rain erosion test system. High-speed photography, optical microscopy, optical profilometer and computed tomography (CT) were used to investigate the effects of impact velocity, number of impacts, and twin pulsed jet coupling on damage evolution. Single pulsed jet impact tests show that with increasing velocity, damage evolves from slight annular crazing to a central undamaged region surrounded by extensive annular crazing. Continuous single pulsed jet impact tests indicate that higher velocity shortens the incubation period and accelerates volume loss and damage area growth. The erosion crater profile exhibits a “two valleys and one peak” morphology: a central protrusion from repeated water-hammer compression, and side depressions from lateral outflow scouring. Continuous twin pulsed jet coupled impact tests reveal distinct features: due to mutual hindrance of lateral flows, ring cracks appear only on the side away from the adjacent impact; stress wave superposition may cause stress concentration between impact points, resulting in an asymmetric “single-peak” crater cross-section. This study achieves laboratory simulation of twin pulsed jet coupled impacts, providing an experimental basis for multi-jet interaction damage mechanisms.

1. Introduction

When a high-speed aircraft passes through clouds or rainy areas, a significant relative velocity exists between the aircraft and raindrops, leading to high-speed impacts that may cause damage to the aircraft’s surface materials. This phenomenon of high-speed liquid-solid impact accompanied by surface erosion is termed “rain erosion”. The surface damage caused by rain erosion can impair certain structures of the aircraft, affect its performance, and even shorten its service life [1,2,3].
Numerous studies on rain erosion have been conducted by researchers worldwide, with experimental investigation being one of the most effective means to explore this issue. In-flight testing is a highly convincing method for evaluating rain erosion resistance. As early as 1968, to assess the effects of rain erosion, flight tests were performed on 15 different coatings applied to the horizontal stabiliser, vertical stabiliser, front spar, and leading edge of an F-100F aircraft, and the tested materials were ranked according to their rain erosion tolerance [4]. However, flight tests have limitations such as high risk and high cost. Therefore, researchers have established artificial rain zones on the ground to simulate specific rainfall conditions for testing the rain erosion resistance of materials. Examples include rocket sled tests [5,6] and rotating arm tests [7,8]. These facilities can obtain erosion curves (incubation period, acceleration period, steady-state period, etc.) of materials, but they have limitations such as difficult control of jet morphology, difficulty in coupling droplet diameter and velocity adjustment, and difficulty in observing details of a single impact.
To investigate fundamental issues in the rain erosion process, researchers have adopted single-droplet test methods to observe the impact process of an individual droplet. The Cavendish Laboratory used a method of accelerating water droplets to form a jet with a specific shape that impacts a stationary specimen, evaluating the differences between a jet and a spherical droplet [9,10,11]. They found that a jet with a smooth, slightly curved front having a certain radius of curvature can generate pressures similar to those of a droplet impact. Moreover, real raindrops are not perfectly spherical [12]. The single impact jet apparatus (SIJA), first developed by Bowden et al. [13,14], produces jets with a highly reproducible radius of curvature, allowing easy comparison of results between different tests. However, single-impact devices cannot efficiently simulate the cumulative effect of thousands of consecutive impacts in actual rain erosion. Consequently, some researchers have built continuous jet impact systems, such as the pulsating jet erosion test (PJET) device developed by Tobin [15] and the multi-impact jet apparatus (MIJA) built at the Cavendish Laboratory [16]. In recent years, Kumar et al. [17] further developed a novel high-speed waterjet erosion test (HSJET) rig based on previous designs. This apparatus features a simple structure and low cost, offering flexible adjustment over a wide range of jet velocities (101.3 to 197.2 m/s) and nozzle-to-sample distances (220 to 700 mm). The jet velocity and droplet size distribution were systematically characterized using a phase Doppler particle analyzer. Moreover, cross-calibration with the PJET facility was performed using aerospace-grade coating samples, establishing a clear correlation between erosion depth and impact duration, with a strong statistical relationship between the two facilities. The pulsating jet device and the continuous jet test apparatus well meet the requirements of continuous single-droplet testing. However, simulating only the continuous impact of a single droplet is insufficient. For instance, during heavy rainfall, the number density of raindrops in the air is high, and coupled multi-droplet impacts are likely to occur in actual impact processes. Such coupling can easily alter the internal stress state of the solid [18]. Overall, existing experimental methods still have shortcomings in simulating real rain erosion environments: first, detailed characterisation of material damage evolution under repeated consecutive impacts is still insufficient; second, studies on asymmetric damage caused by coupled double-droplet or even multi-droplet impacts and the underlying mechanisms are extremely rare.
Research on rain erosion damage has mainly focused on isotropic materials such as metals, glass, and ceramics. In addition, driven by the application background of aircraft components and wind turbine blades, some researchers have investigated the erosion behaviour of polymer composites and surface-coated composites. Obara [10] conducted droplet impact tests on a liquid surface and a PMMA plate using a single-jet apparatus and observed with a high-speed camera that after the stress wave reaches the interface, reflection generates a release wave, and simultaneously bubbles are created along the central axis of the droplet. Wang Xuan et al. [19] carried out jet impact tests at different velocities on aeronautical oriented and non-oriented PMMA. Extensive experiments have shown that shear waves dominate beneath the surface of oriented PMMA, making it more prone to delamination. Gohardani et al. [20] used the MIJA device to conduct rain erosion tests on carbon nanotube-reinforced polymer matrix composites and determined the threshold impact velocity for water droplets. They found that carbon nanotube reinforcement did not significantly affect the rain erosion resistance of the polymer matrix composite. Jackson et al. [21] also used the MIJA device to test the rain erosion resistance of single-crystal MgO. By varying material parameters such as defect size, fracture stress, and fracture toughness, they studied the effect on the damage threshold velocity. Coto et al. [22] conducted rain droplet erosion tests on a Ti/TiN-coated carbon fibre-reinforced polymer (CFRP) composite specimen and found that increasing the coating thickness might instead reduce rain erosion resistance. Thinner coatings provided better adhesion to the substrate material, thus exhibiting higher rain erosion resistance. Hou Naidan et al. [23] used single-jet and multi-jet impact test devices to investigate the rain erosion resistance of CFRP with a surface coating. The results showed that the damage initiation characteristics of the coated CFRP specimens mainly depended on the properties of the surface coating. Coating increased the single-impact threshold velocity, prolonged the incubation period of multiple impacts, and improved the rain erosion resistance of the CFRP specimens themselves. Sha Minggong et al. [24] used a single-jet test platform built with a one-stage light gas gun and a multi-jet test platform modified from a waterjet cutting device to simulate high-speed impacts of raindrops on the skin coating of an aircraft’s windward surface. They found that the damage mechanisms of single-jet and multi-jet impacts were similar: each impact generated a stress cycle composed of a high-pressure shock wave and a reflected tensile wave, and the cyclic superposition led to fatigue crack initiation and propagation. Valentin et al. [25] reported that after 60 min of accelerated rain erosion (80 m/s, LWC = 16.0 g/m3), the superhydrophobic WX 2100 coating maintained a contact angle above 90° despite a noticeable decrease, while its ice adhesion strength rose from approximately 200 kPa to about 450 kPa. This suggests that the coating retains some durability under rain erosion, but its anti-icing performance progressively deteriorates with prolonged erosion time.
Aeronautical oriented PMMA is widely used in aircraft windshields, canopies, and other key components due to its excellent optical transparency, high specific strength, and good toughness. However, this material is sensitive to rain erosion. Under repeated high-speed raindrop impacts, it easily develops crazing, cracks, and even spallation, directly affecting flight safety [26]. Therefore, in-depth investigation of the damage evolution law and mechanism of oriented PMMA under high-speed raindrop impact is of great engineering value and theoretical significance. Aiming at the damage evolution law of oriented PMMA under high-speed raindrop impact, this study, based on a self-developed continuous jet rain erosion test system (which can generate high-speed jets with continuously adjustable velocity in the range of 80 m/s to 500 m/s and with a well-formed arc-shaped head to simulate single and multiple droplet impacts; moreover, using a two-orifice nozzle, it realises two synchronised jets to simulate coupled double-droplet impact), takes oriented PMMA as the research object and carries out three levels of tests: single pulsed jet impact, continuous single pulsed jet impact and continuous twin pulsed jet coupled impact. Using high-speed photography, optical microscopy, optical profilometer and CT, the damage morphology, volume loss, damage area, and three-dimensional erosion crater profile of specimens under different impact velocities and numbers of impacts are systematically observed. The complete evolution process of oriented PMMA from crazing initiation, microcrack propagation, to material spallation is revealed. In particular, the differences in damage patterns between continuous single pulsed jet impact and continuous twin pulsed jet coupled impact are compared and analysed, and the mechanisms by which mutual interference of lateral flows from adjacent jets and stress wave superposition affect the damage morphology are discussed.

2. Materials and Methods

2.1. Continuous Jet Rain Erosion Test System

2.1.1. Principle of Jet Generation

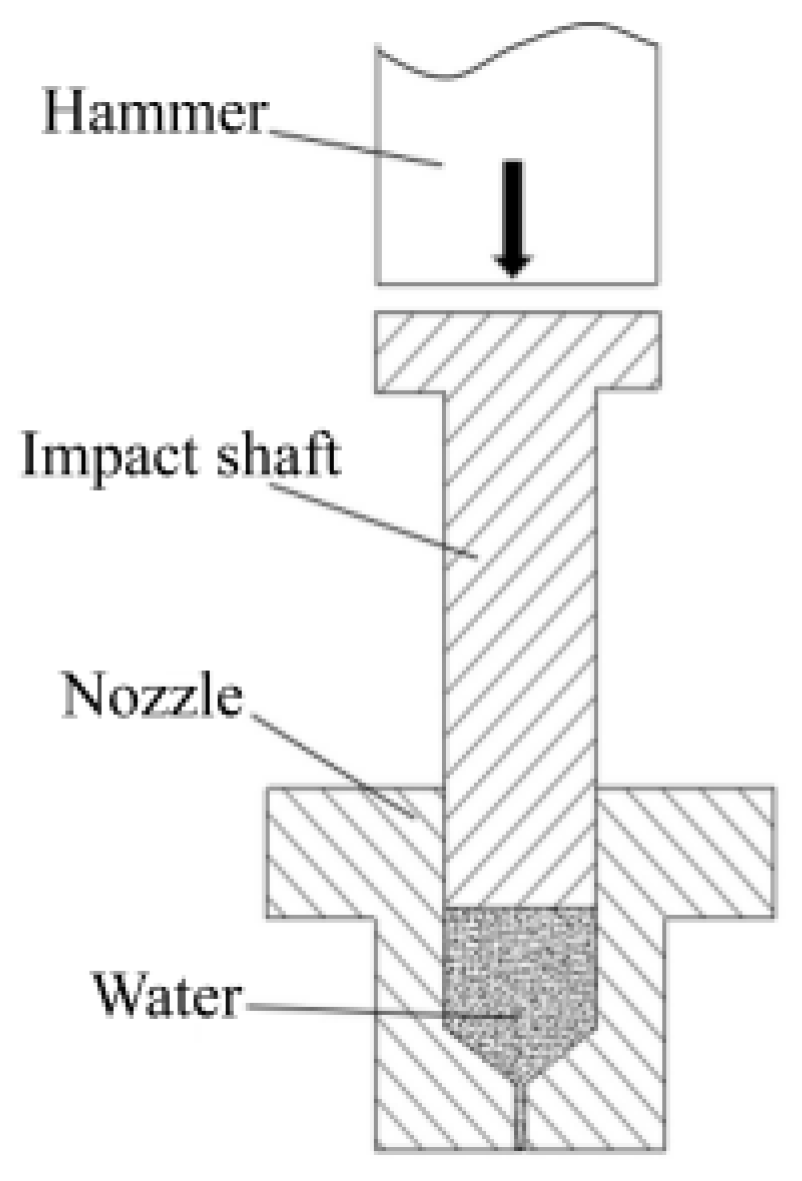
The test system adopts the method of generating a jet by impact. The principle is shown in Figure 1. The impact shaft can slide freely in the axial direction at the nozzle end. When a high-speed hammer impacts one end of the impact shaft, the other end of the shaft obtains a high velocity, thereby generating high pressure in the nozzle, which drives the liquid to eject from the nozzle orifice and form a high-speed liquid jet. At the same time, a velocity amplification mechanism based on the lever principle (lever ratio 5:1) is employed. Energy stored in a tension spring is released to give the hammer a high impact velocity. By adjusting the spring specifications or the pre-tension distance, the hammer velocity can be adjusted within the range of 3–15.2 m/s, corresponding to a jet velocity of 80–500 m/s.
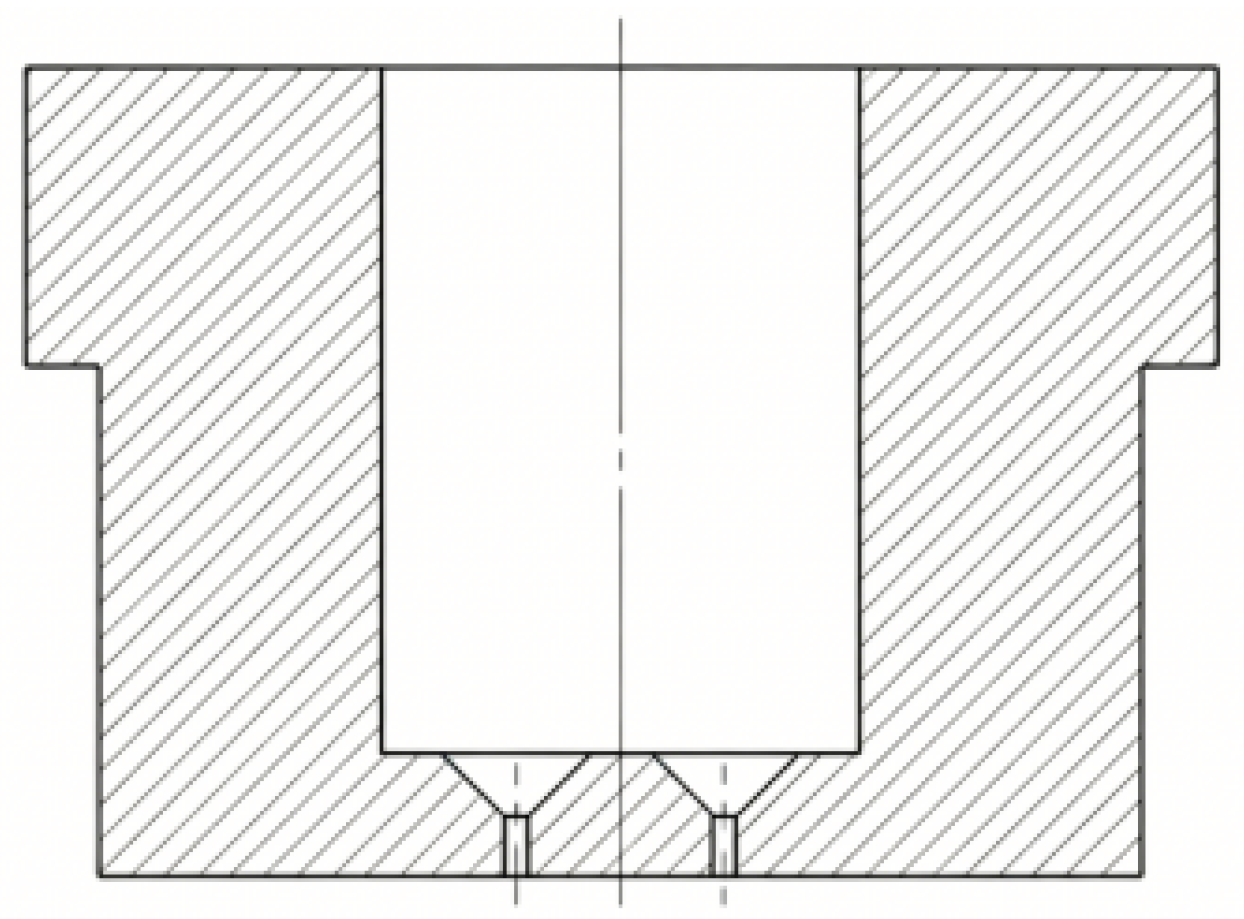
To conveniently generate a twin pulsed jet and simulate the twin pulsed jet coupled impact, in this study, by analogy with the structure of the single-orifice nozzle, a two-orifice nozzle as shown in Figure 2 was designed. Its overall dimensions, the dimensions of the nozzle outlets, and the dimensions of the side water supply holes are the same as those of the single-orifice nozzle, and it is used to generate twin pulsed jets.

2.1.2. Reciprocating Mechanism for Achieving Continuous Impact

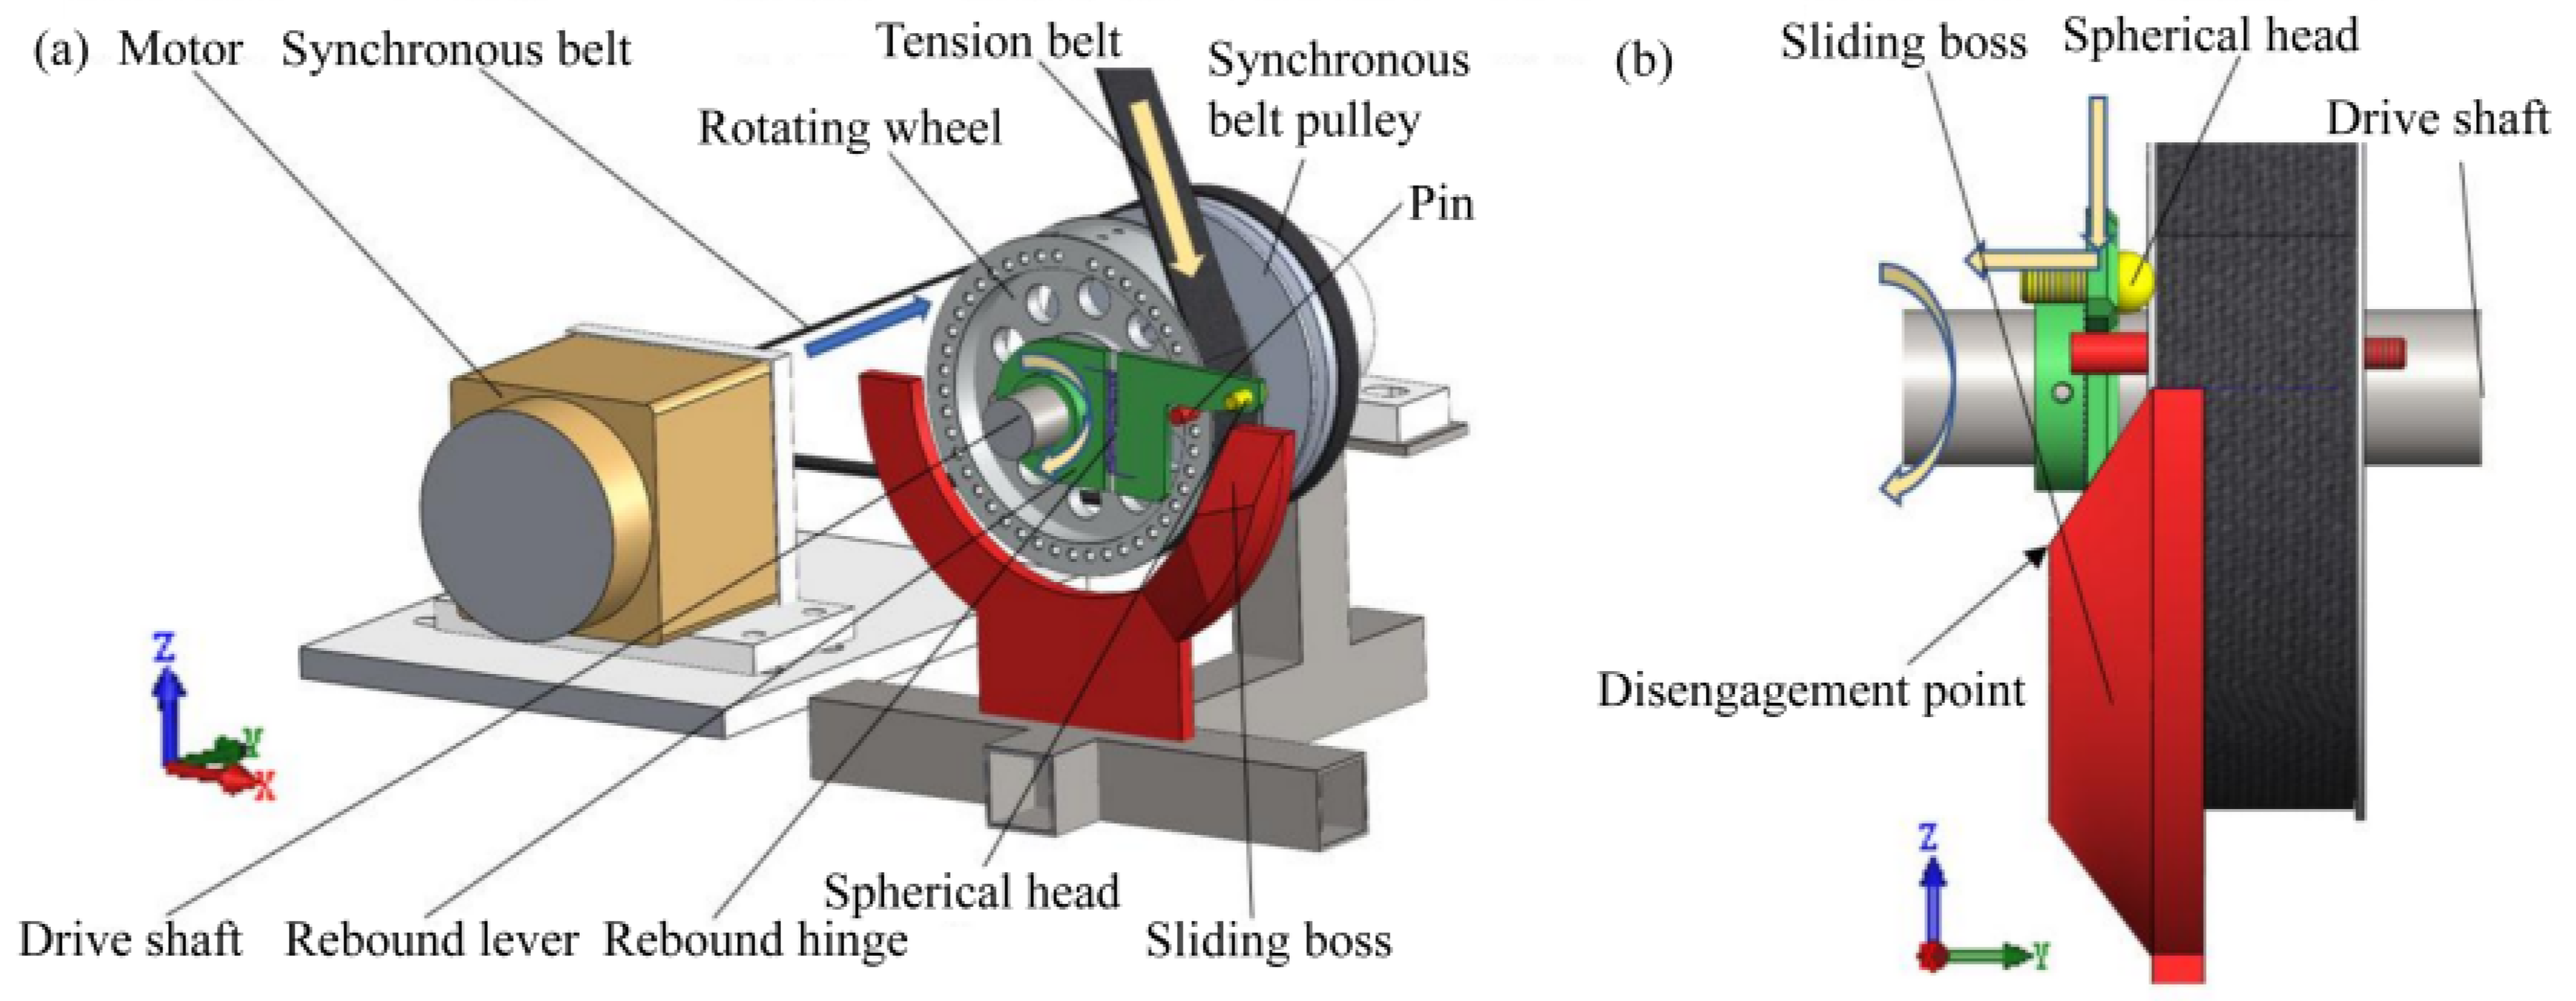
To enable the hammer to perform high-speed reciprocating impacts at a certain frequency, a reciprocating mechanism was designed. Its composition is shown in Figure 3. The mechanism consists of a synchronous belt pulley, a drive shaft, a rotating wheel, a tension belt, a rebound lever, a pin, and a sliding boss. It converts the motor torque into belt tension to stretch the spring. During operation, the motor drives the synchronous belt pulley and the drive shaft to rotate via a synchronous belt, causing the rebound lever to rotate. When the front end of the lever contacts the pin, the “clutch” is engaged, and torque is transmitted to the rotating wheel, which winds the tension belt to generate tension, thereby pulling the lever to stretch the spring. Subsequently, the spherical head of the lever contacts the inclined surface of the sliding boss, forcing the lever to bend and disengage from the pin, thus disconnecting the “clutch”. The spring releases its energy, causing the lever to drive the hammer to impact at high speed. At the same time, the rotating wheel returns in the opposite direction due to the belt reaction, and the lever returns to its original state under the action of the rebound hinge.

2.1.3. Overall Composition of the Test System

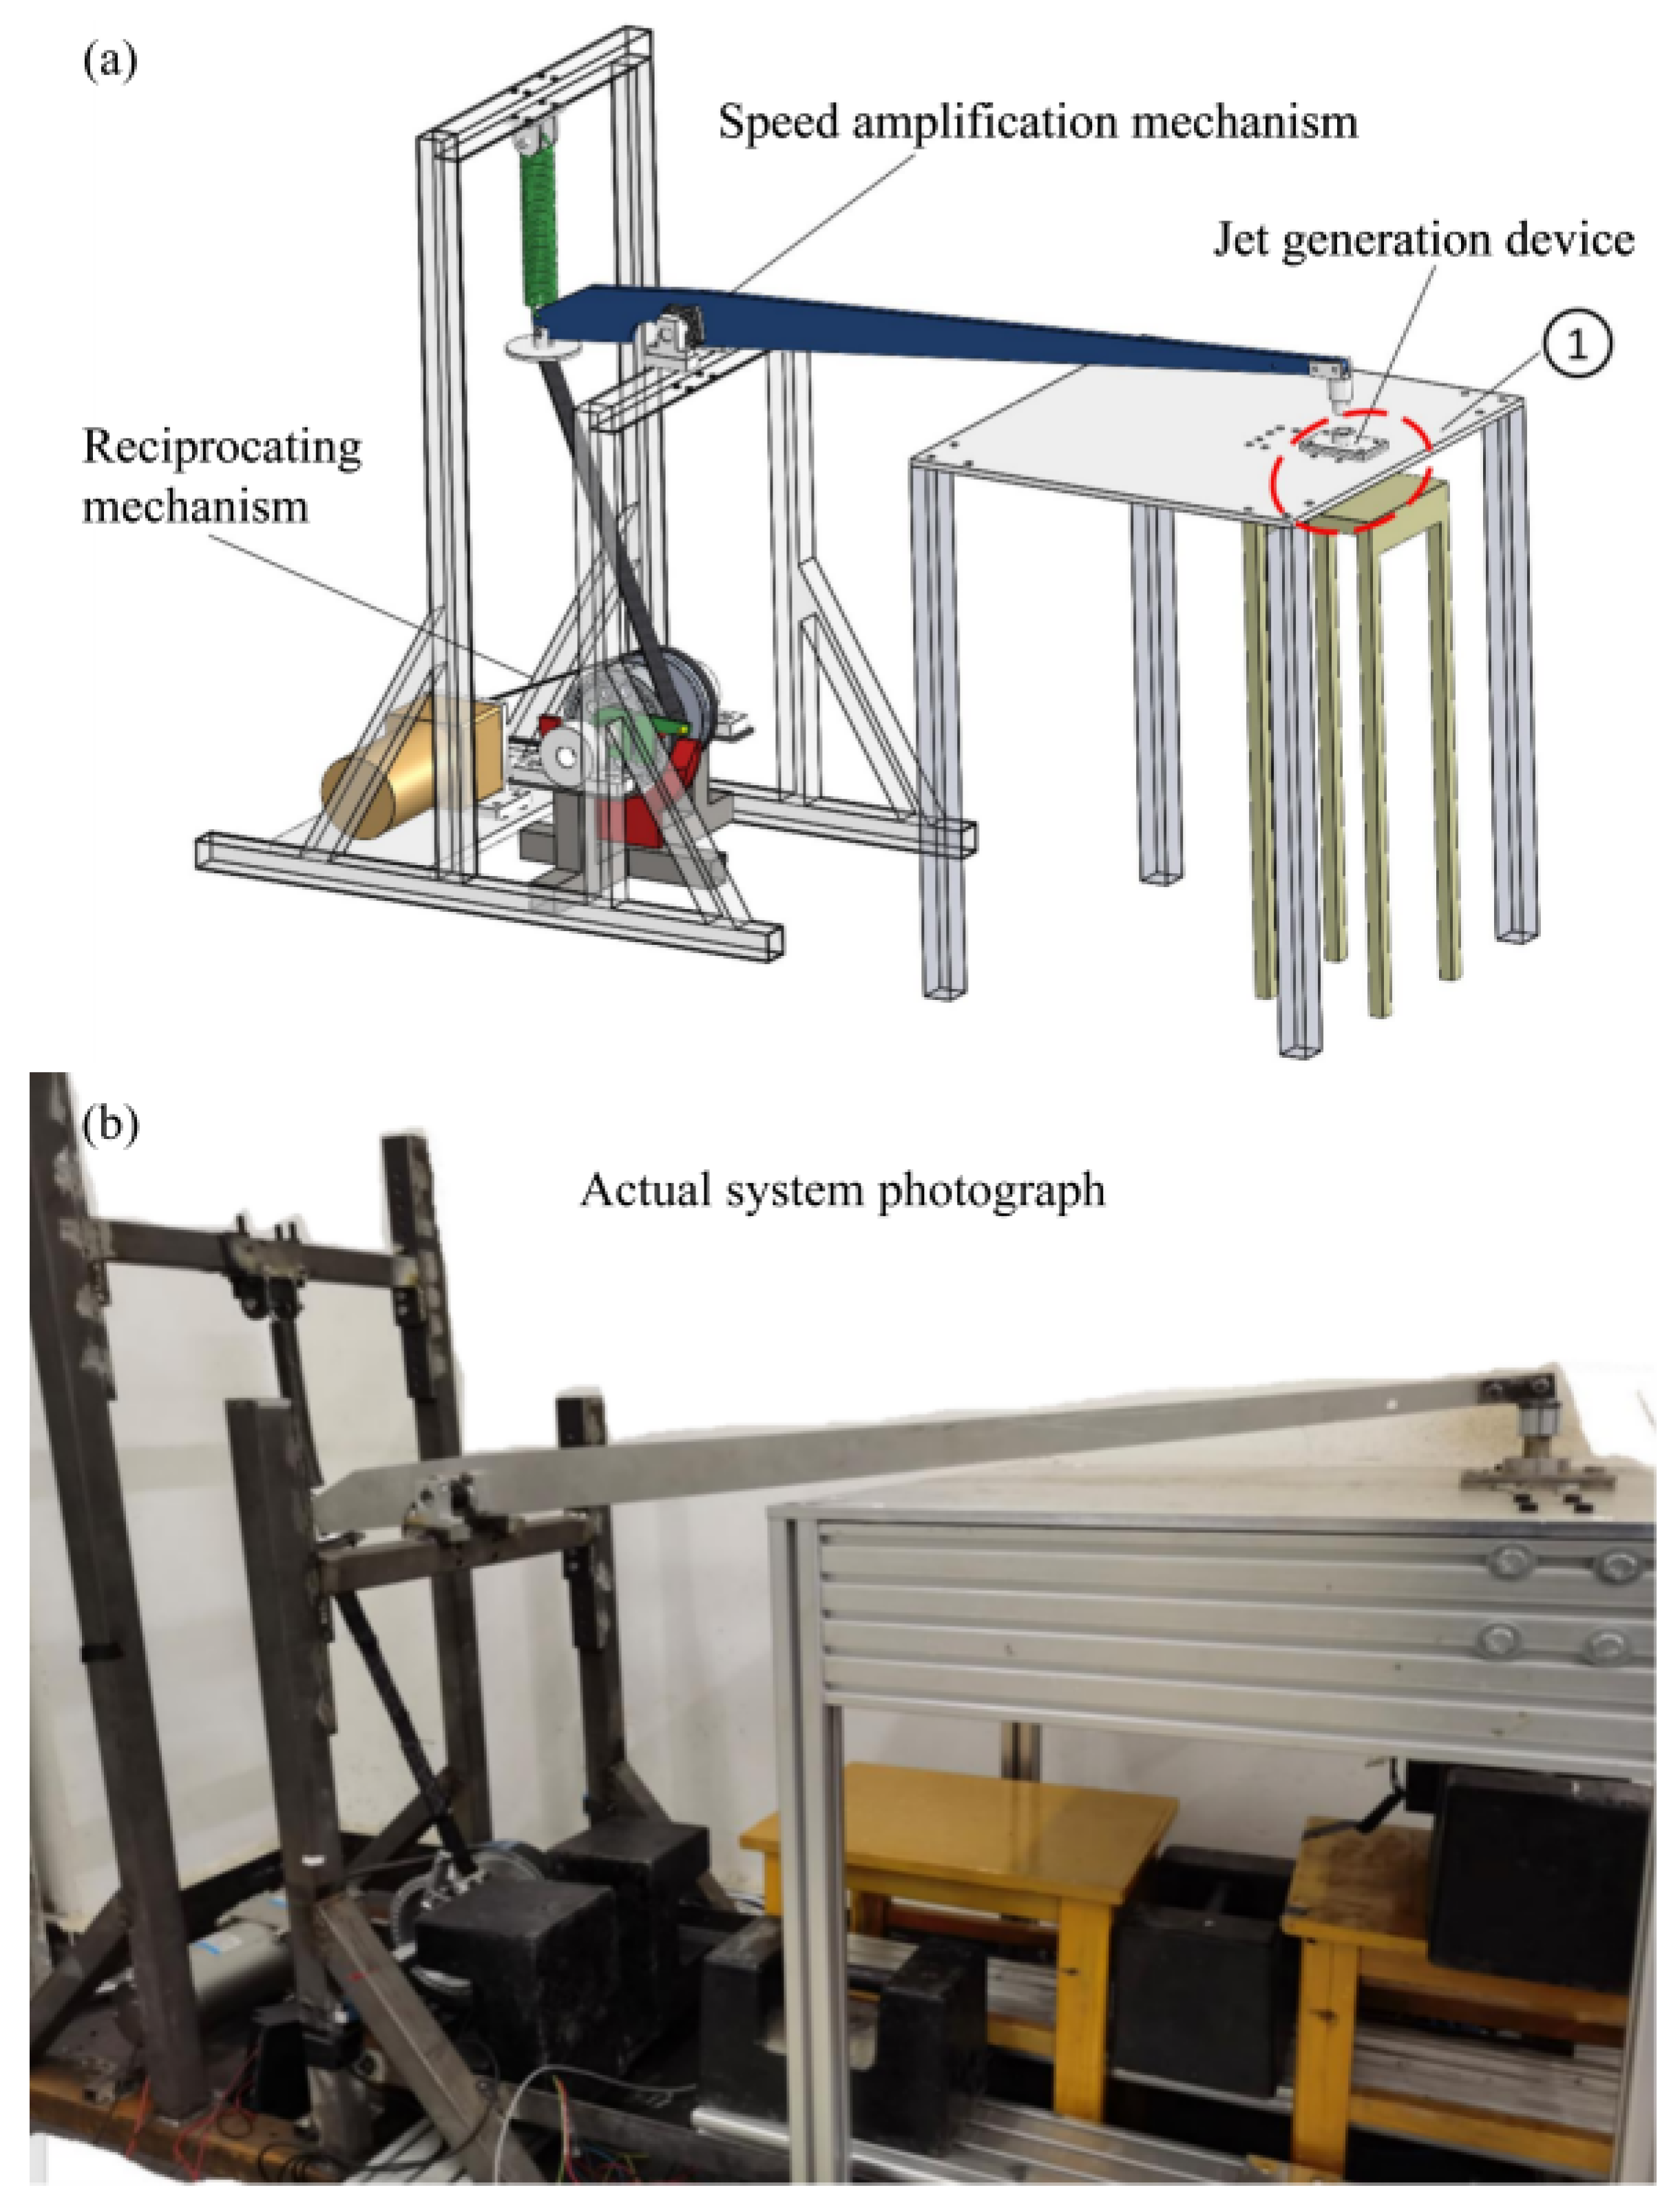
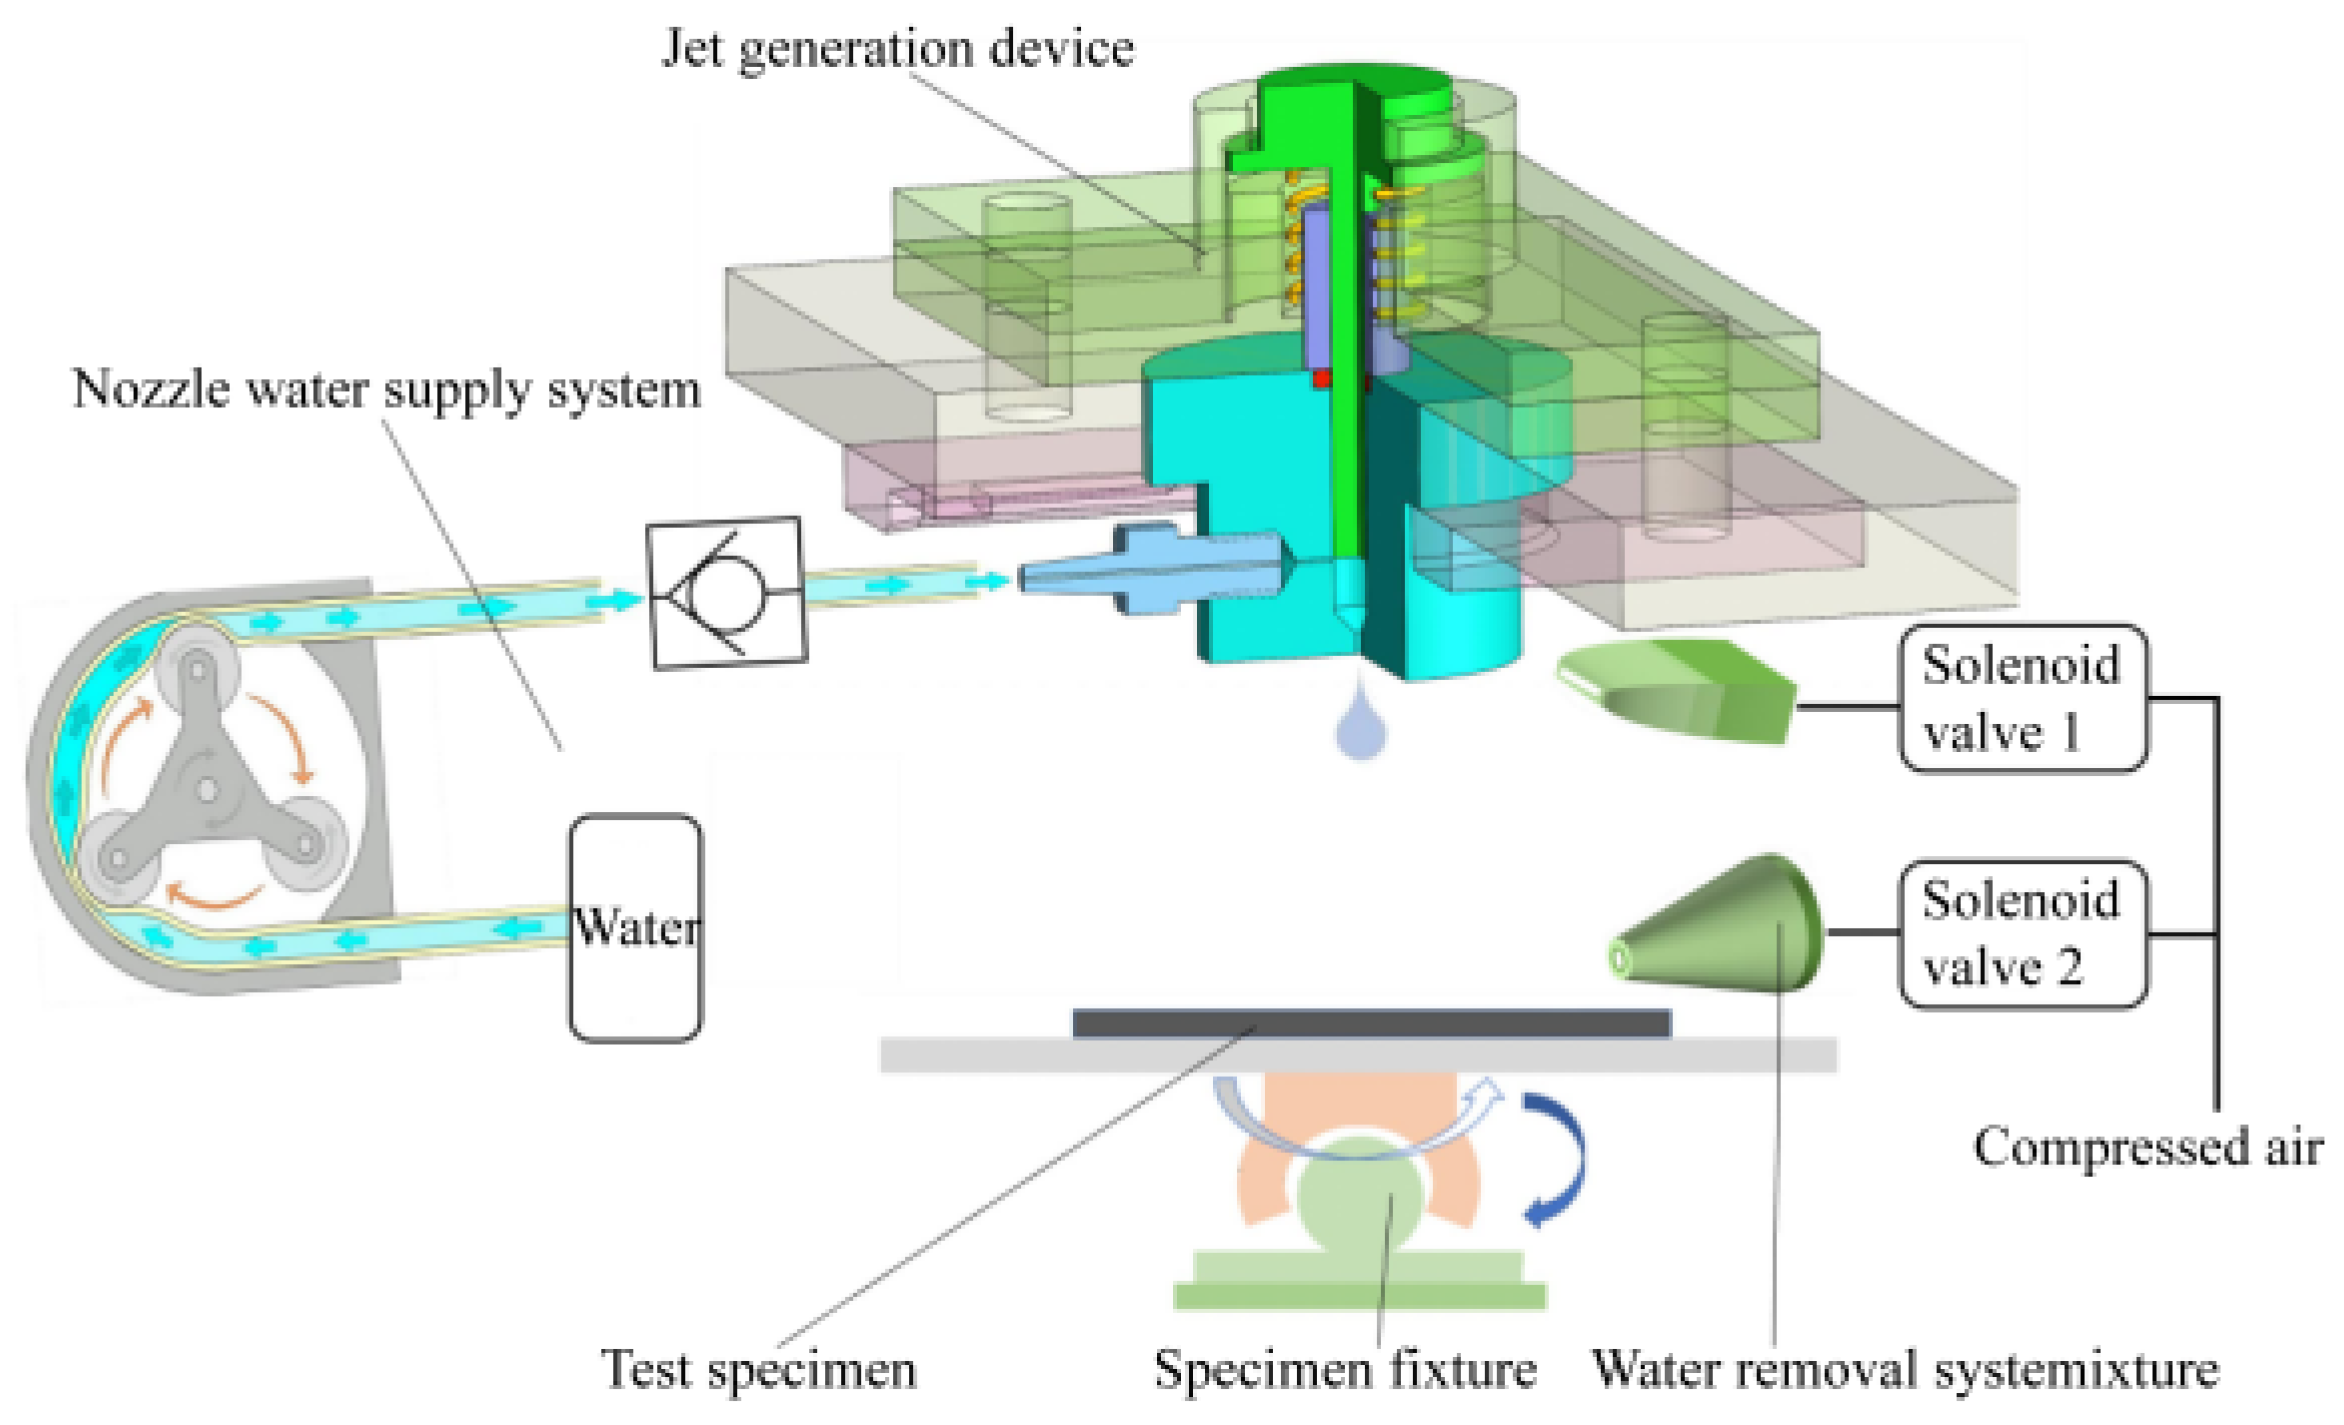
The continuous jet rain erosion test system is shown in Figure 4 and Figure 5. It mainly consists of five parts: a jet generation device, a continuous impact device, a nozzle water supply system, a water removal system, and a specimen fixture. The jet generation device is used to produce a well-formed and controllable jet. Through the coordinated action of the reciprocating mechanism and the speed amplification mechanism, high impact energy is transmitted to the jet generation device at a certain frequency. The nozzle water supply system ensures that the nozzle is filled with water before impact. The water removal system removes excess water from the nozzle outlet end face and the specimen surface.

2.2. Specimen and Test Methods

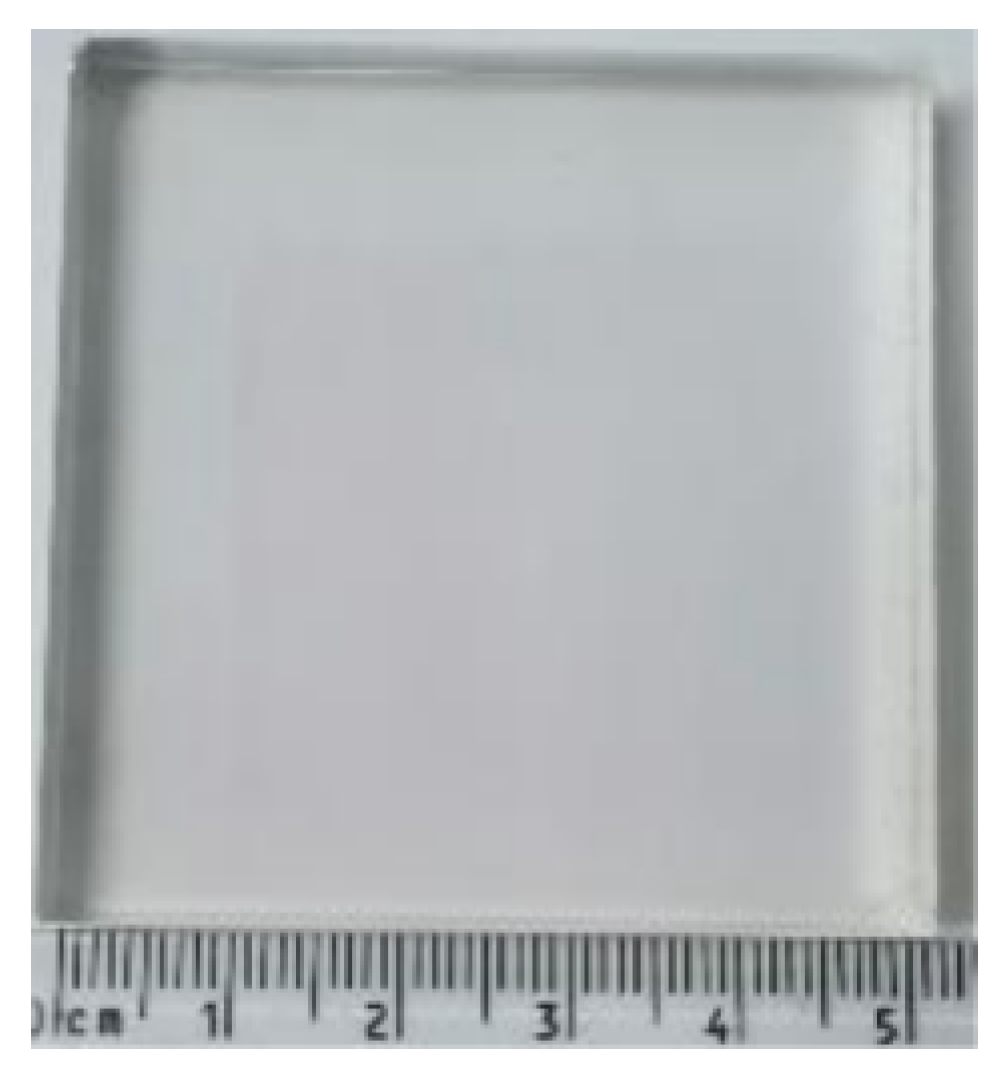
Oriented PMMA possesses good transparency, strength, and toughness, making it a common material for aircraft windshields and fighter jet canopies. However, it exhibits high sensitivity to high-speed droplet impact [26]. The oriented PMMA specimens used in this study were provided by Jiangsu Taomao Glass Co., Ltd. (Hai’an, Jiangsu, China). The specimen dimensions are 50 mm × 50 mm with a thickness of 9 mm. A photograph of the actual specimen is shown in Figure 6. The macroscopic mechanical properties and surface properties of the oriented PMMA specimens are shown in Table 1. The surface roughness of the oriented PMMA ranged from 1.09 to 3.36 nm, which meets the application standards of the aviation industry. Therefore, no additional surface treatment was required for the specimens.
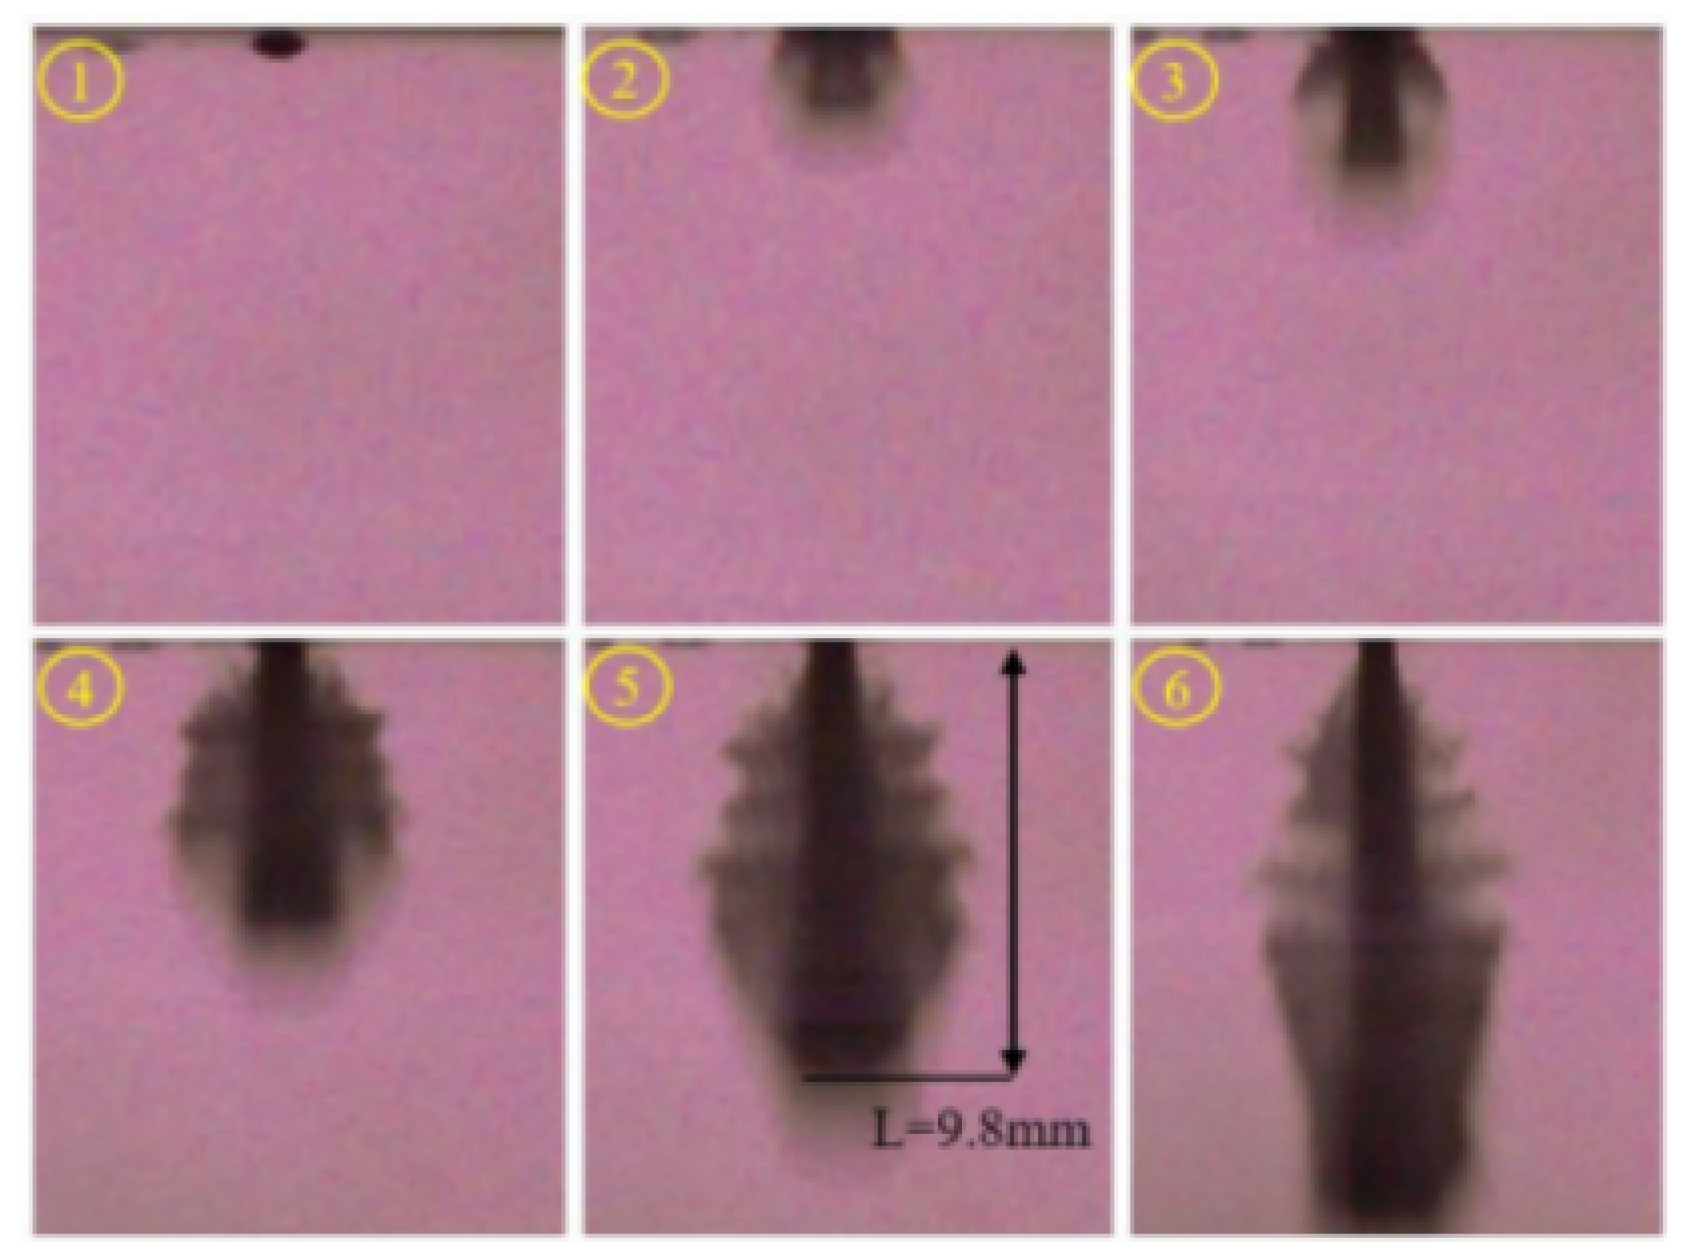
Using a Phantom V711 high-speed camera (Vision Research, Inc., Wayne, NJ, USA), the motion process of the jet was recorded to observe the jet morphology and measure the jet velocity. The camera resolution was 144 × 152 pixels, the frame rate was f = 130,500 fps, and the inter-frame interval was 7.66 μs. The jet velocity was calculated from the displacement of the pixel points at the jet front. In the single pulsed jet tests, the nozzle outlet diameter was 0.8 mm, and the resulting jet diameter was 4.74 mm. Figure 7 shows the morphological evolution of a jet produced by the 0.8 mm nozzle, as captured by the high-speed camera. As shown in Figure 7-①, before jet generation, a convex liquid meniscus spontaneously formed at the nozzle outlet under gravity. Owing to the presence of this convex meniscus, a “mushroom-like” head with a certain curvature was formed at the initial stage of jet generation. This favourable head morphology gradually disappeared after the jet had travelled a distance of 9.8 mm. Combined with the analysis of the variation in jet velocity and jet diameter from previous tests, it is known that the jet exhibits an ideal morphology with relatively stable velocity and diameter when it travels 8–10 mm. Therefore, it was finally determined that the optimum mounting position of the specimen in the rain erosion tests is 10 mm away from the nozzle outlet. Unless otherwise stated, the jet velocities reported hereafter refer to the values measured at the instant when the jet has traveled a distance of 10 mm from the nozzle outlet.
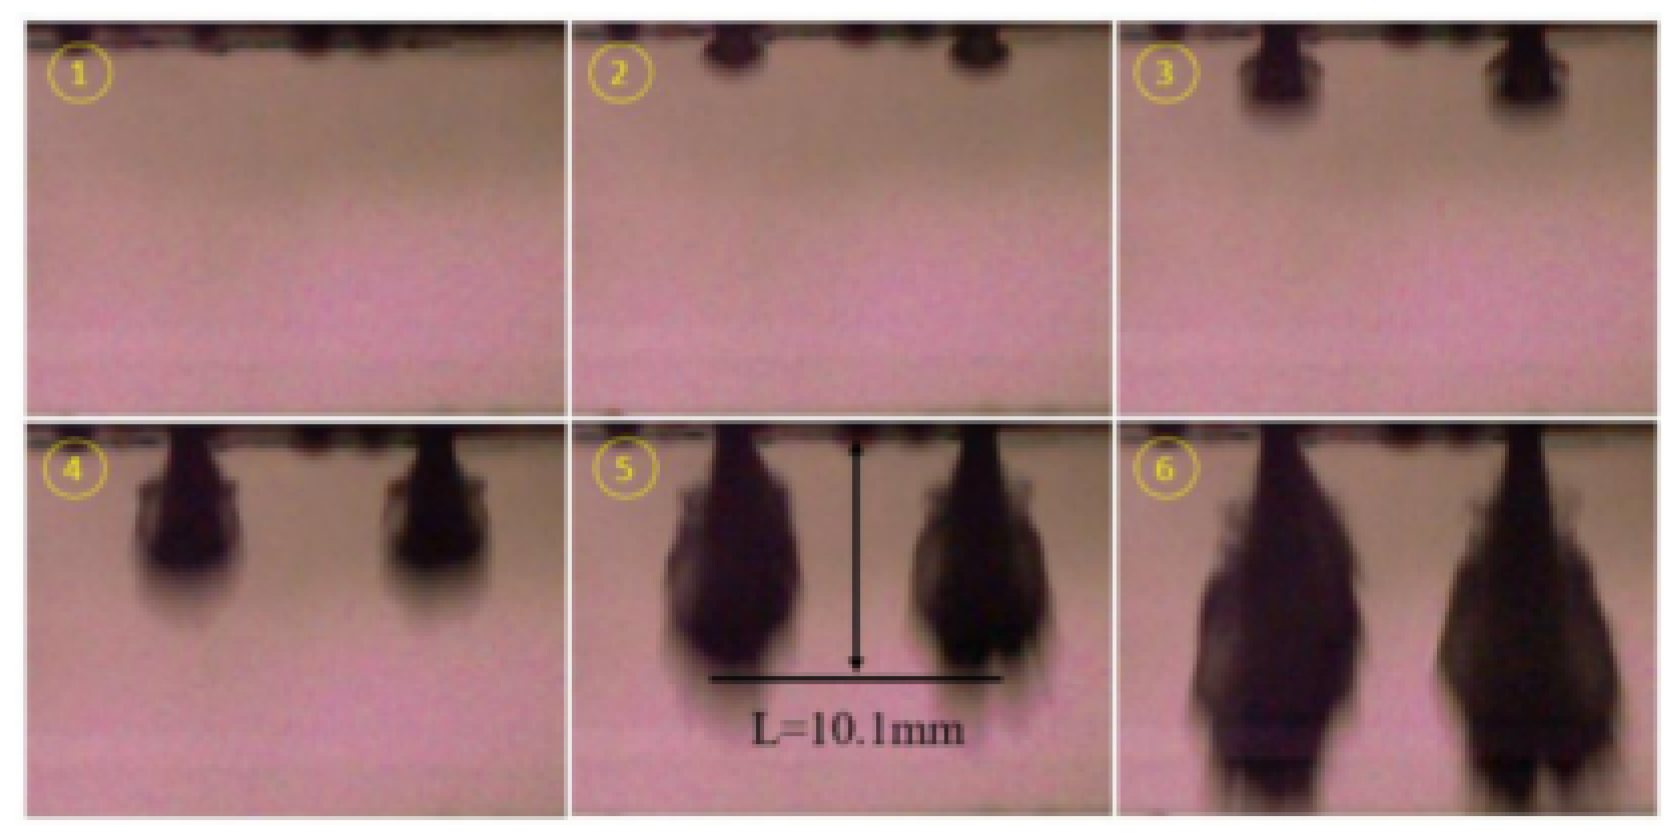
The specifications of the two-orifice nozzle are an orifice diameter of 0.8 mm and an orifice spacing of 7 mm. The two jets generated by this nozzle exhibit very small differences in morphology, velocity, and diameter, effectively simulating coupled double-droplet impact. The morphological evolution of the jets produced by this nozzle was captured using a high-speed camera, as shown in Figure 8. It can be seen from the figure that after leaving the nozzle, the morphological changes in the two jets are basically the same, and their displacements at different times are essentially consistent. At a distance of 10.1 mm from the nozzle, both jets have nearly arc-shaped heads.
To analyze the differences between the two jets, the diameters and velocities of the left and right jets shown in Figure 8 were measured, and the data are listed in Table 2. When the jet displacement reached 10.1 mm, the velocity of the left jet was 351.5 m/s, while that of the right jet was 359.8 m/s, differing by only 2.4%. Since the difference in the diameters of the two jets did not exceed one pixel, the measured diameters were the same, both being 4.72 mm.
Based on the above-described apparatus, three types of high-speed jet impact tests were conducted on the aviation-oriented PMMA specimens: single pulsed jet impact tests, continuous single pulsed jet impact tests and continuous twin pulsed jet coupled impact tests. The test conditions for the single pulsed jet impact tests were impact velocities of 210, 316, and 335 m/s. For the continuous single pulsed jet impact tests, the impact velocities were 239 m/s and 335 m/s, corresponding to maximum impact numbers of 450 and 250 times, respectively. For the continuous twin pulsed jet coupled impact tests, the impact velocity was 330 m/s with a maximum impact number of 250 times. In the single pulsed jet impact tests and continuous single pulsed jet impact tests, the nozzle orifice diameter was 0.8 mm, producing a jet diameter of approximately 4.74 mm. In the continuous twin pulsed jet coupled impact tests, the nozzle orifice diameter was also 0.8 mm, producing a jet diameter of approximately 4.9 mm. All tests were conducted at an impact angle of 90°. To obtain valid conclusions, at least three repeated impact tests were performed for each set of conditions. The complete experimental matrix, including impact velocity, jet diameter, number of impacts, impact frequency, and replicates, is summarized in Table 3.

3. Result and Discussion

3.1. Single Pulsed Jet Impact Tests

Single pulsed jet impacts at different velocities were performed on oriented PMMA specimens using the continuous jet rain erosion test system. The nozzle outlet diameter used in the tests was 0.8 mm, producing a jet diameter of approximately 4.74 mm. The jet velocity and diameter were measured with a high-speed camera. Before the tests, the jet velocity of the test system was adjusted in advance to ensure that it reached the preset target value. The specimen was fixed on the fixture with the impacted surface kept horizontal. The height of the fixture was adjusted so that the vertical distance between the impact position on the specimen and the nozzle outlet was 10 mm.
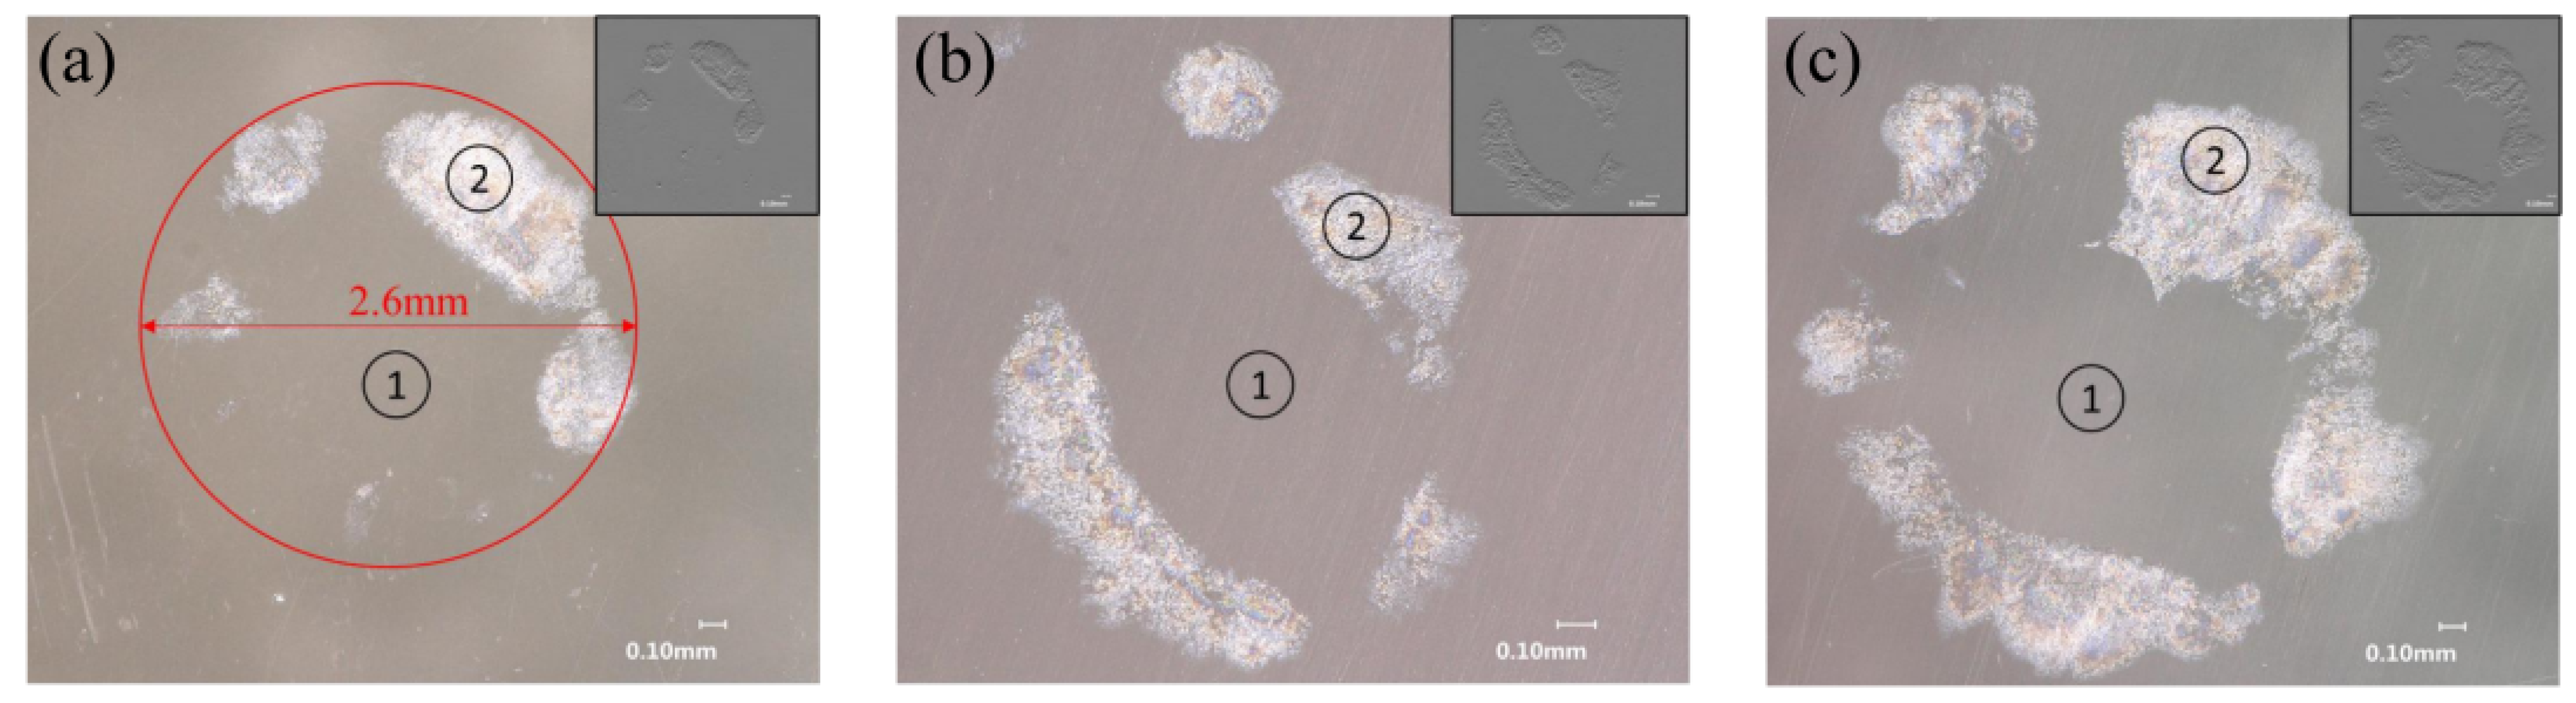
Figure 9 shows the microscopic images of damage caused by a single impact of jets at different velocities on the test specimens, where v is the jet impact velocity. As the impact velocity increases, the area of crazing damage enlarges. As shown in Figure 9a, when the impact velocity is 210 m/s, only slight crazing damage appears around the impact point, with the outer diameter of the damaged region being approximately 2.6 mm. When the impact velocity is 316 m/s, the area of peripheral crazing damage expands, as shown in Figure 9b. When the impact velocity is 335 m/s, the damage mode in the impacted zone exhibits a morphology characterised by a central undamaged region ① surrounded by extensive annular crazing damage ②, as shown in Figure 9c.
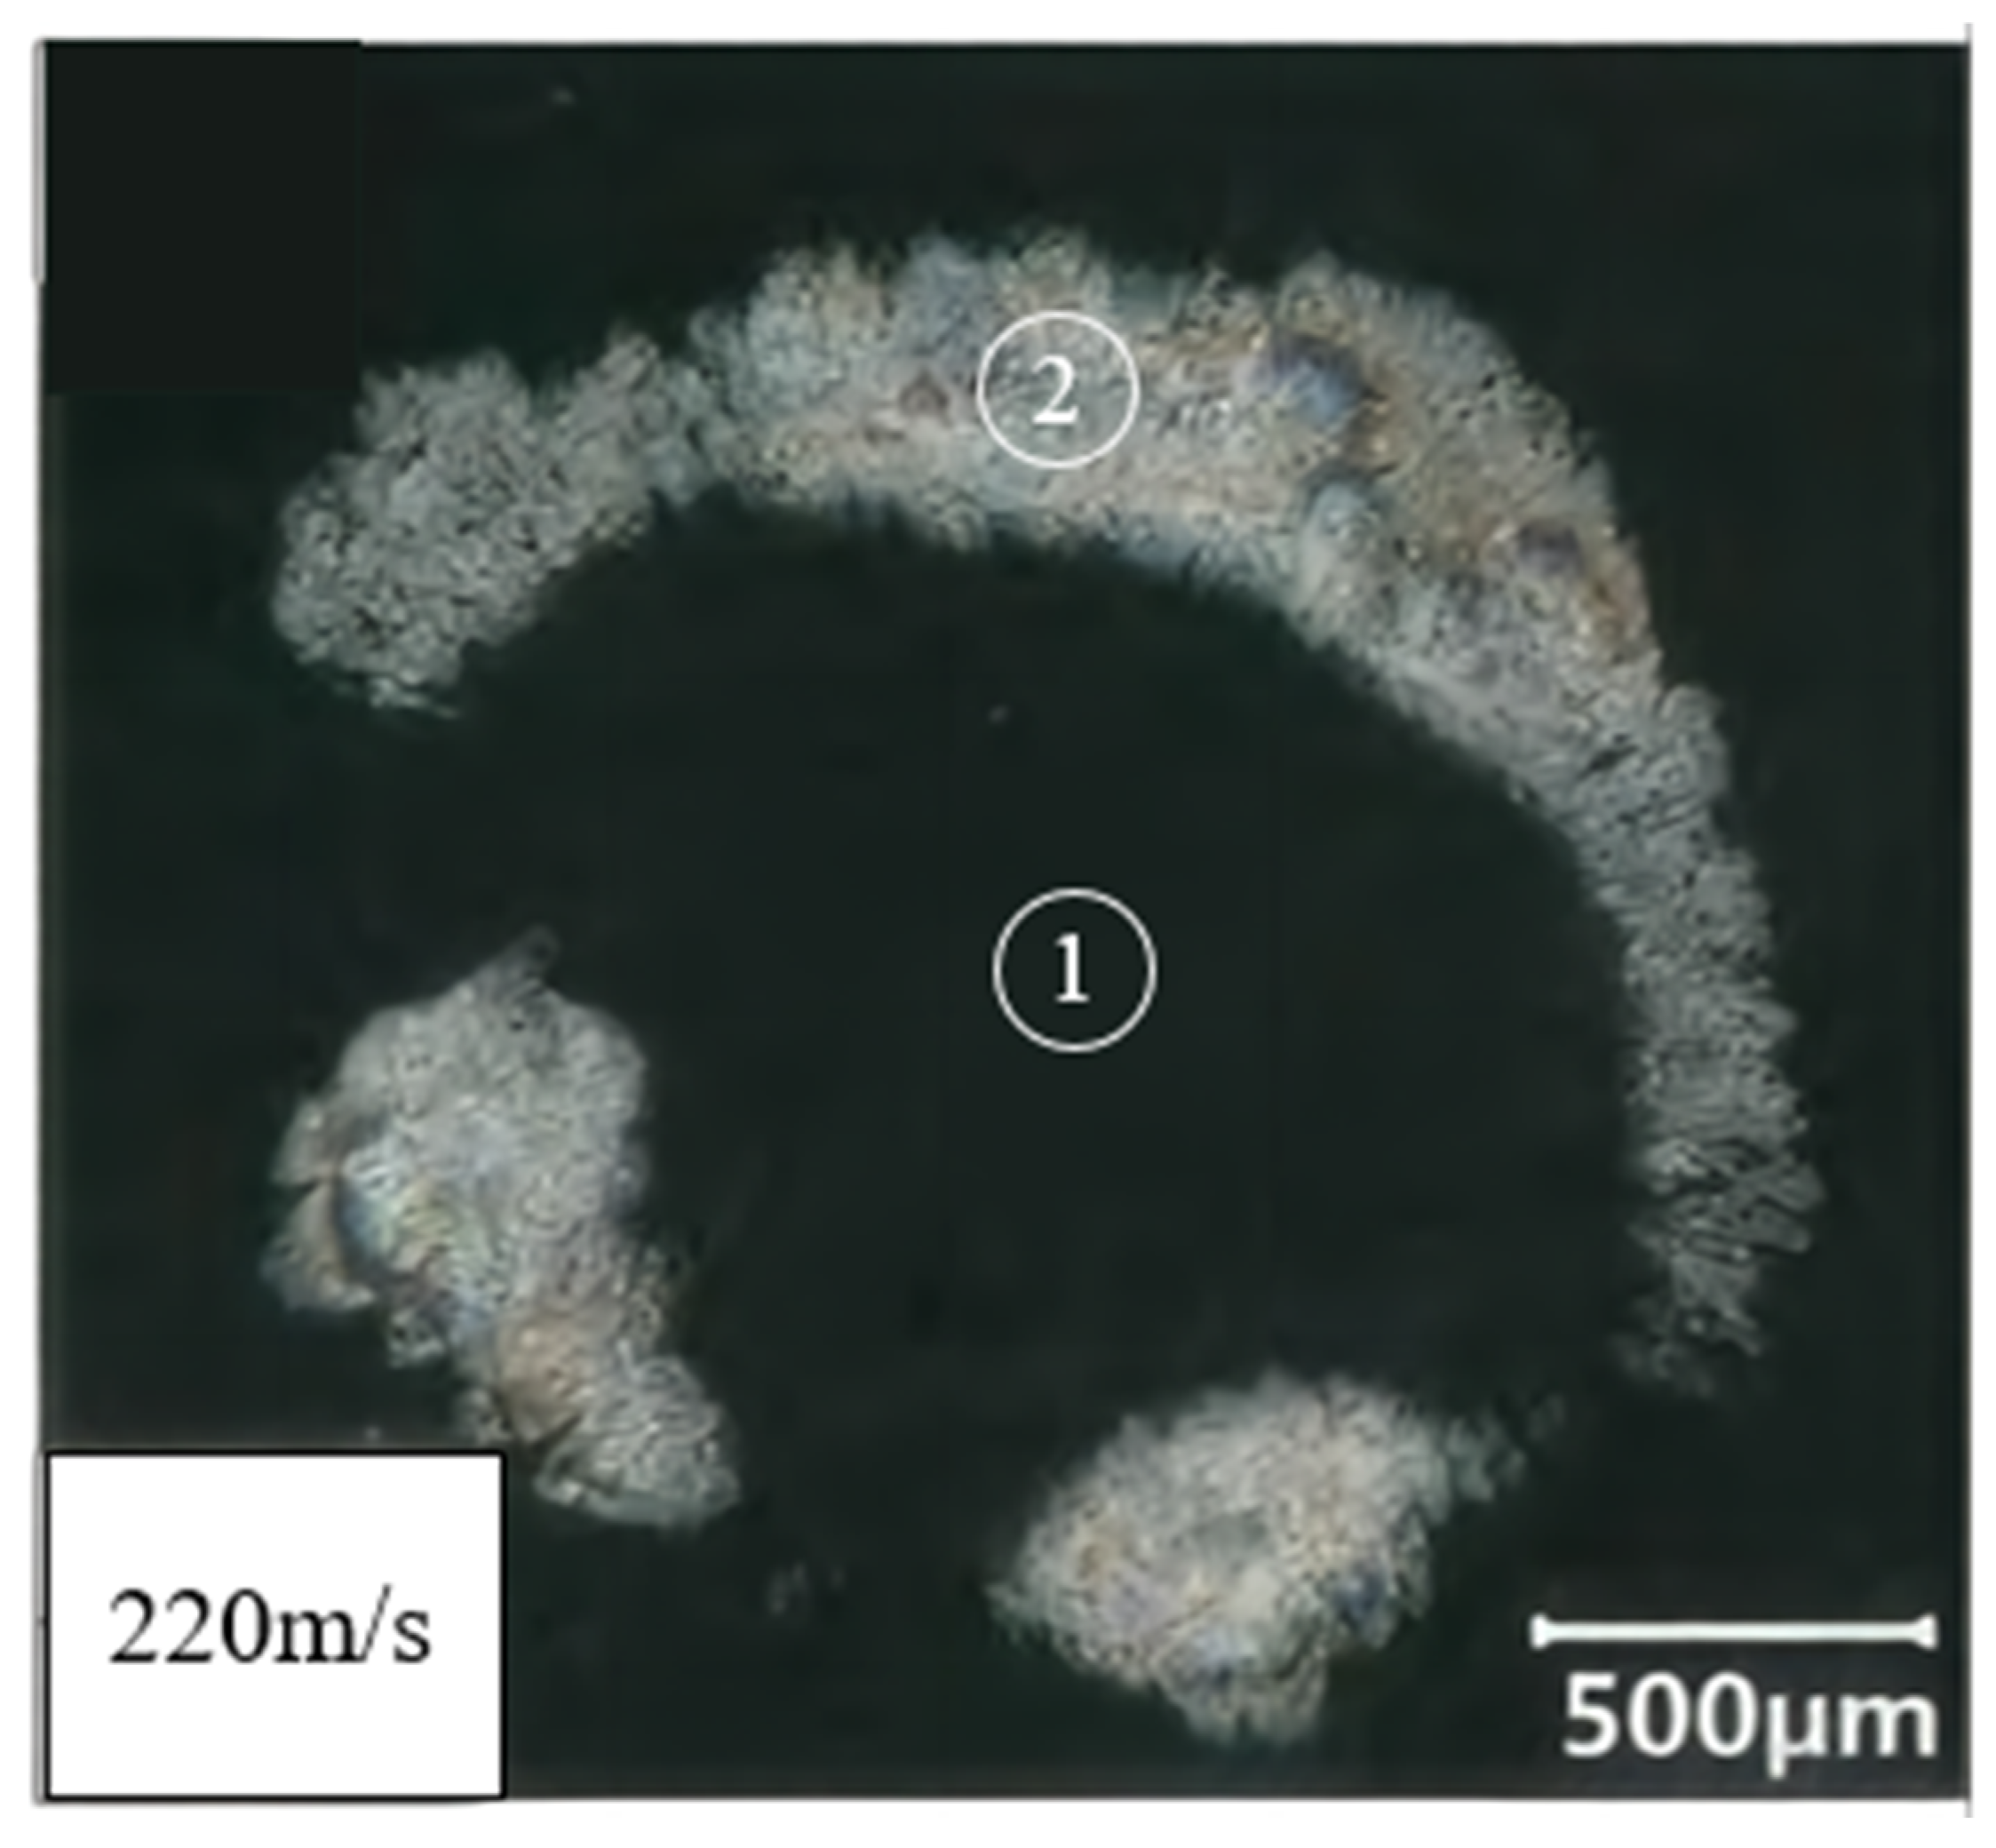
The validity of the single impact jet apparatus in simulating spherical droplet impact has been demonstrated in previous studies [9,10,11]. Therefore, the feasibility and effectiveness of the continuous jet rain erosion test system developed in this work for simulating spherical droplet impact were verified by comparing the above experimental results with those obtained from the single impact jet apparatus. Figure 10 shows the micrograph of the damage on oriented PMMA caused by the jet generated by the single impact jet apparatus at an impact velocity of 220 m/s [19]. It can be observed from Figure 10 that the damage induced by the single impact jet apparatus also exhibits a central undamaged region ① and surrounding annular crazing damage ②. By comparing Figure 9 and Figure 10, it is evident that the continuous jet rain erosion test system and the single impact jet apparatus produce identical damage morphologies on oriented PMMA. Based on the established validity of the single impact jet apparatus in simulating spherical raindrop impact, the feasibility and effectiveness of the continuous jet rain erosion test system designed in this study for simulating spherical droplet impact are thus validated.

3.2. Continuous Single Pulsed Jet Impact Tests

Continuous single pulsed jet impact tests at velocities of 239 m/s and 335 m/s were carried out on oriented PMMA to obtain the erosion curves. Before the tests, the specimen was fixed on the fixture with the impacted surface kept horizontal, and the vertical distance between the impact position and the nozzle outlet was adjusted to 10 mm. During the tests, the jet velocity was adjusted to the predetermined value, and a specific number of impacts were applied at the predetermined position. Each condition was repeated three times under the same test conditions. When the number of impacts was varied, a new oriented PMMA specimen was used for each set of tests. However, for a given number of impacts, three repeated tests were conducted at different locations on the same specimen, with sufficient spacing between adjacent impact sites to ensure that no mutual interference occurred between successive impacts.

3.2.1. Test Results

The rain droplet erosion process consists of five stages: incubation stage, acceleration stage, maximum erosion rate stage, deceleration stage, and final steady-state stage. In a typical erosion curve, the abscissa represents the cumulative exposure time and the ordinate represents the cumulative erosion (mass or volume loss) [27,28]. In actual tests, operations such as repeated cleaning, drying, and weighing of the specimens lead to large measurement errors in mass loss. For homogeneous materials, volume loss is often used as an alternative.
Given a specific impact velocity and droplet diameter, the process starts with the incubation stage, where material loss is slight or absent but surface fading and increased roughness often occur. The end of this stage marks the onset of erosion and is a key parameter. Then, significant damage appears and the erosion accelerates, with the curve rising steeply. The erosion rate reaches its maximum when lateral jets interact with surface defects, causing material spallation—this corresponds to the steepest slope of the curve. As the erosion crater deepens, lateral jet spread is hindered, the erosion rate decreases, and the process decelerates. Eventually, the erosion rate reduces to a constant value, entering the final steady-state stage where the curve flattens out.
The continuous single droplet impact tests adopted the above typical erosion curve to characterise the damage of the oriented PMMA specimens. To obtain the volume loss of the oriented PMMA during the erosion process, CT was used to perform three-dimensional scanning and reconstruction of the internal damage of the specimens. Based on the three-dimensional reconstruction results, the volume loss at each impact point could be measured. The CT scans were performed using an AX2000 micro-CT system (Always Imaging, Shanghai, China) with a microfocus X-ray source (focal spot size 1.5–2 μm), operated at 90 kV and 70 μA, using a detector with a pixel size of 139 μm and an array of 3072 × 3072, in translation-rotation mode. The projection data were reconstructed by filtered back-projection using the system’s built-in software. Segmentation was carried out by global intensity thresholding based on the gray-level histogram, with the threshold set at the midpoint between the peaks of air and PMMA. Volumetric quantification was performed with VG Studio MAX software (version 3.3).
An optical profilometer was used to measure the damage area of oriented PMMA during the erosion process. The optical profilometer employed in this study is a Veeco Wyko NT1100 (Veeco Instruments Inc., Plainview, NY, USA) white light interferometer, with a vertical measurement range of 0.1 nm to 1 mm and a resolution of 1 nm. The severity of damage was quantitatively assessed by measuring the dimensions of the damaged region, including the areas of the annular depression zone and the surface spalling region.
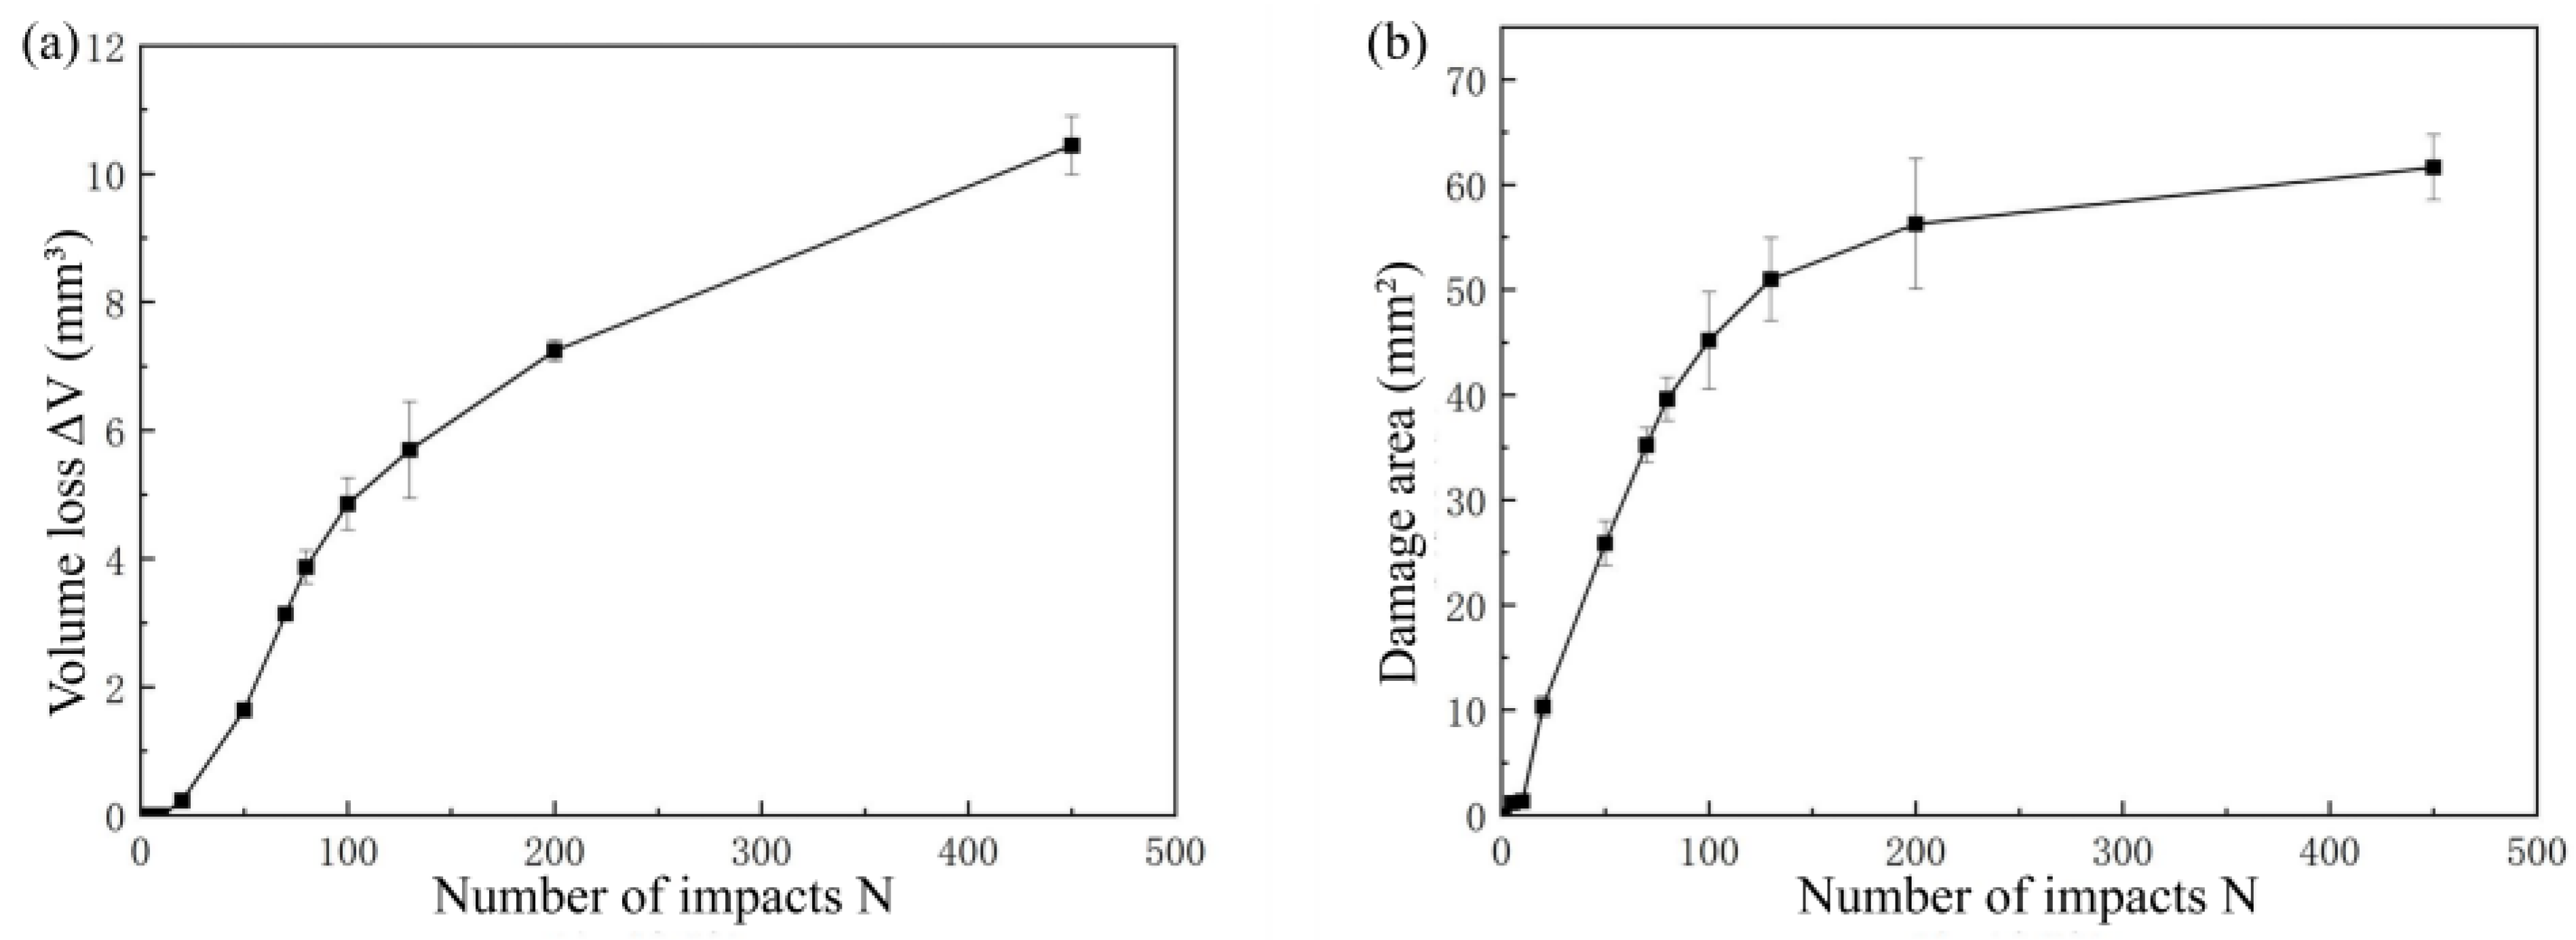
Figure 11 shows the variation in volume loss and damage area of the oriented PMMA specimens as a function of the number of impacts under continuous impact at a jet velocity of 239 m/s. Each data point is the average value of repeated experimental tests. As shown in Figure 11a, the volume loss of the specimen increases with the number of impacts. When the number of impacts is less than 25, the specimen exhibits almost no volume loss, indicating that the erosion process is in the incubation stage. After 25 impacts, significant volume loss appears. As the number of impacts increases, the erosion damage intensifies and the erosion rate reaches its maximum, during which a large amount of material spallation occurs. With a further increase in the number of impacts, the slope of the volume loss curve decreases, and the erosion enters the deceleration stage. Figure 11b shows that in the later period of the incubation stage, the damage area increases sharply. As impacts continue, the damage area keeps increasing. After the maximum erosion rate, the growth rate of the damage area slows down.
Figure 12 shows the variation in volume loss and damage area of the oriented PMMA specimens as a function of the number of impacts under continuous impact at a jet velocity of 335 m/s. From the curves, it can be seen that both the volume loss curve and the damage area curve exhibit the same trend as those in Figure 11, i.e., they increase with the number of impacts. The difference is that at the same number of impacts, the values of volume loss and damage area caused by continuous impact at 335 m/s are larger, indicating that the damage degree caused by continuous jet impact at 335 m/s is more severe. Moreover, measurable volume loss appears at only 10 impacts, indicating that the incubation stage ends at this point and significant material spallation begins. Comparing the test results in Figure 11 and Figure 12, it can be concluded that a higher impact velocity leads to a shorter incubation period and a higher erosion rate.

3.2.2. Analysis of Erosion Process

To facilitate understanding of the damage evolution process and to analyse the damage mechanism of oriented PMMA, the damage of the specimens under different numbers of impacts was observed using an optical microscope (model VHX-5000 digital microscope, Keyence Corporation, Osaka, Japan) with magnifications ranging from 20 to 2000.
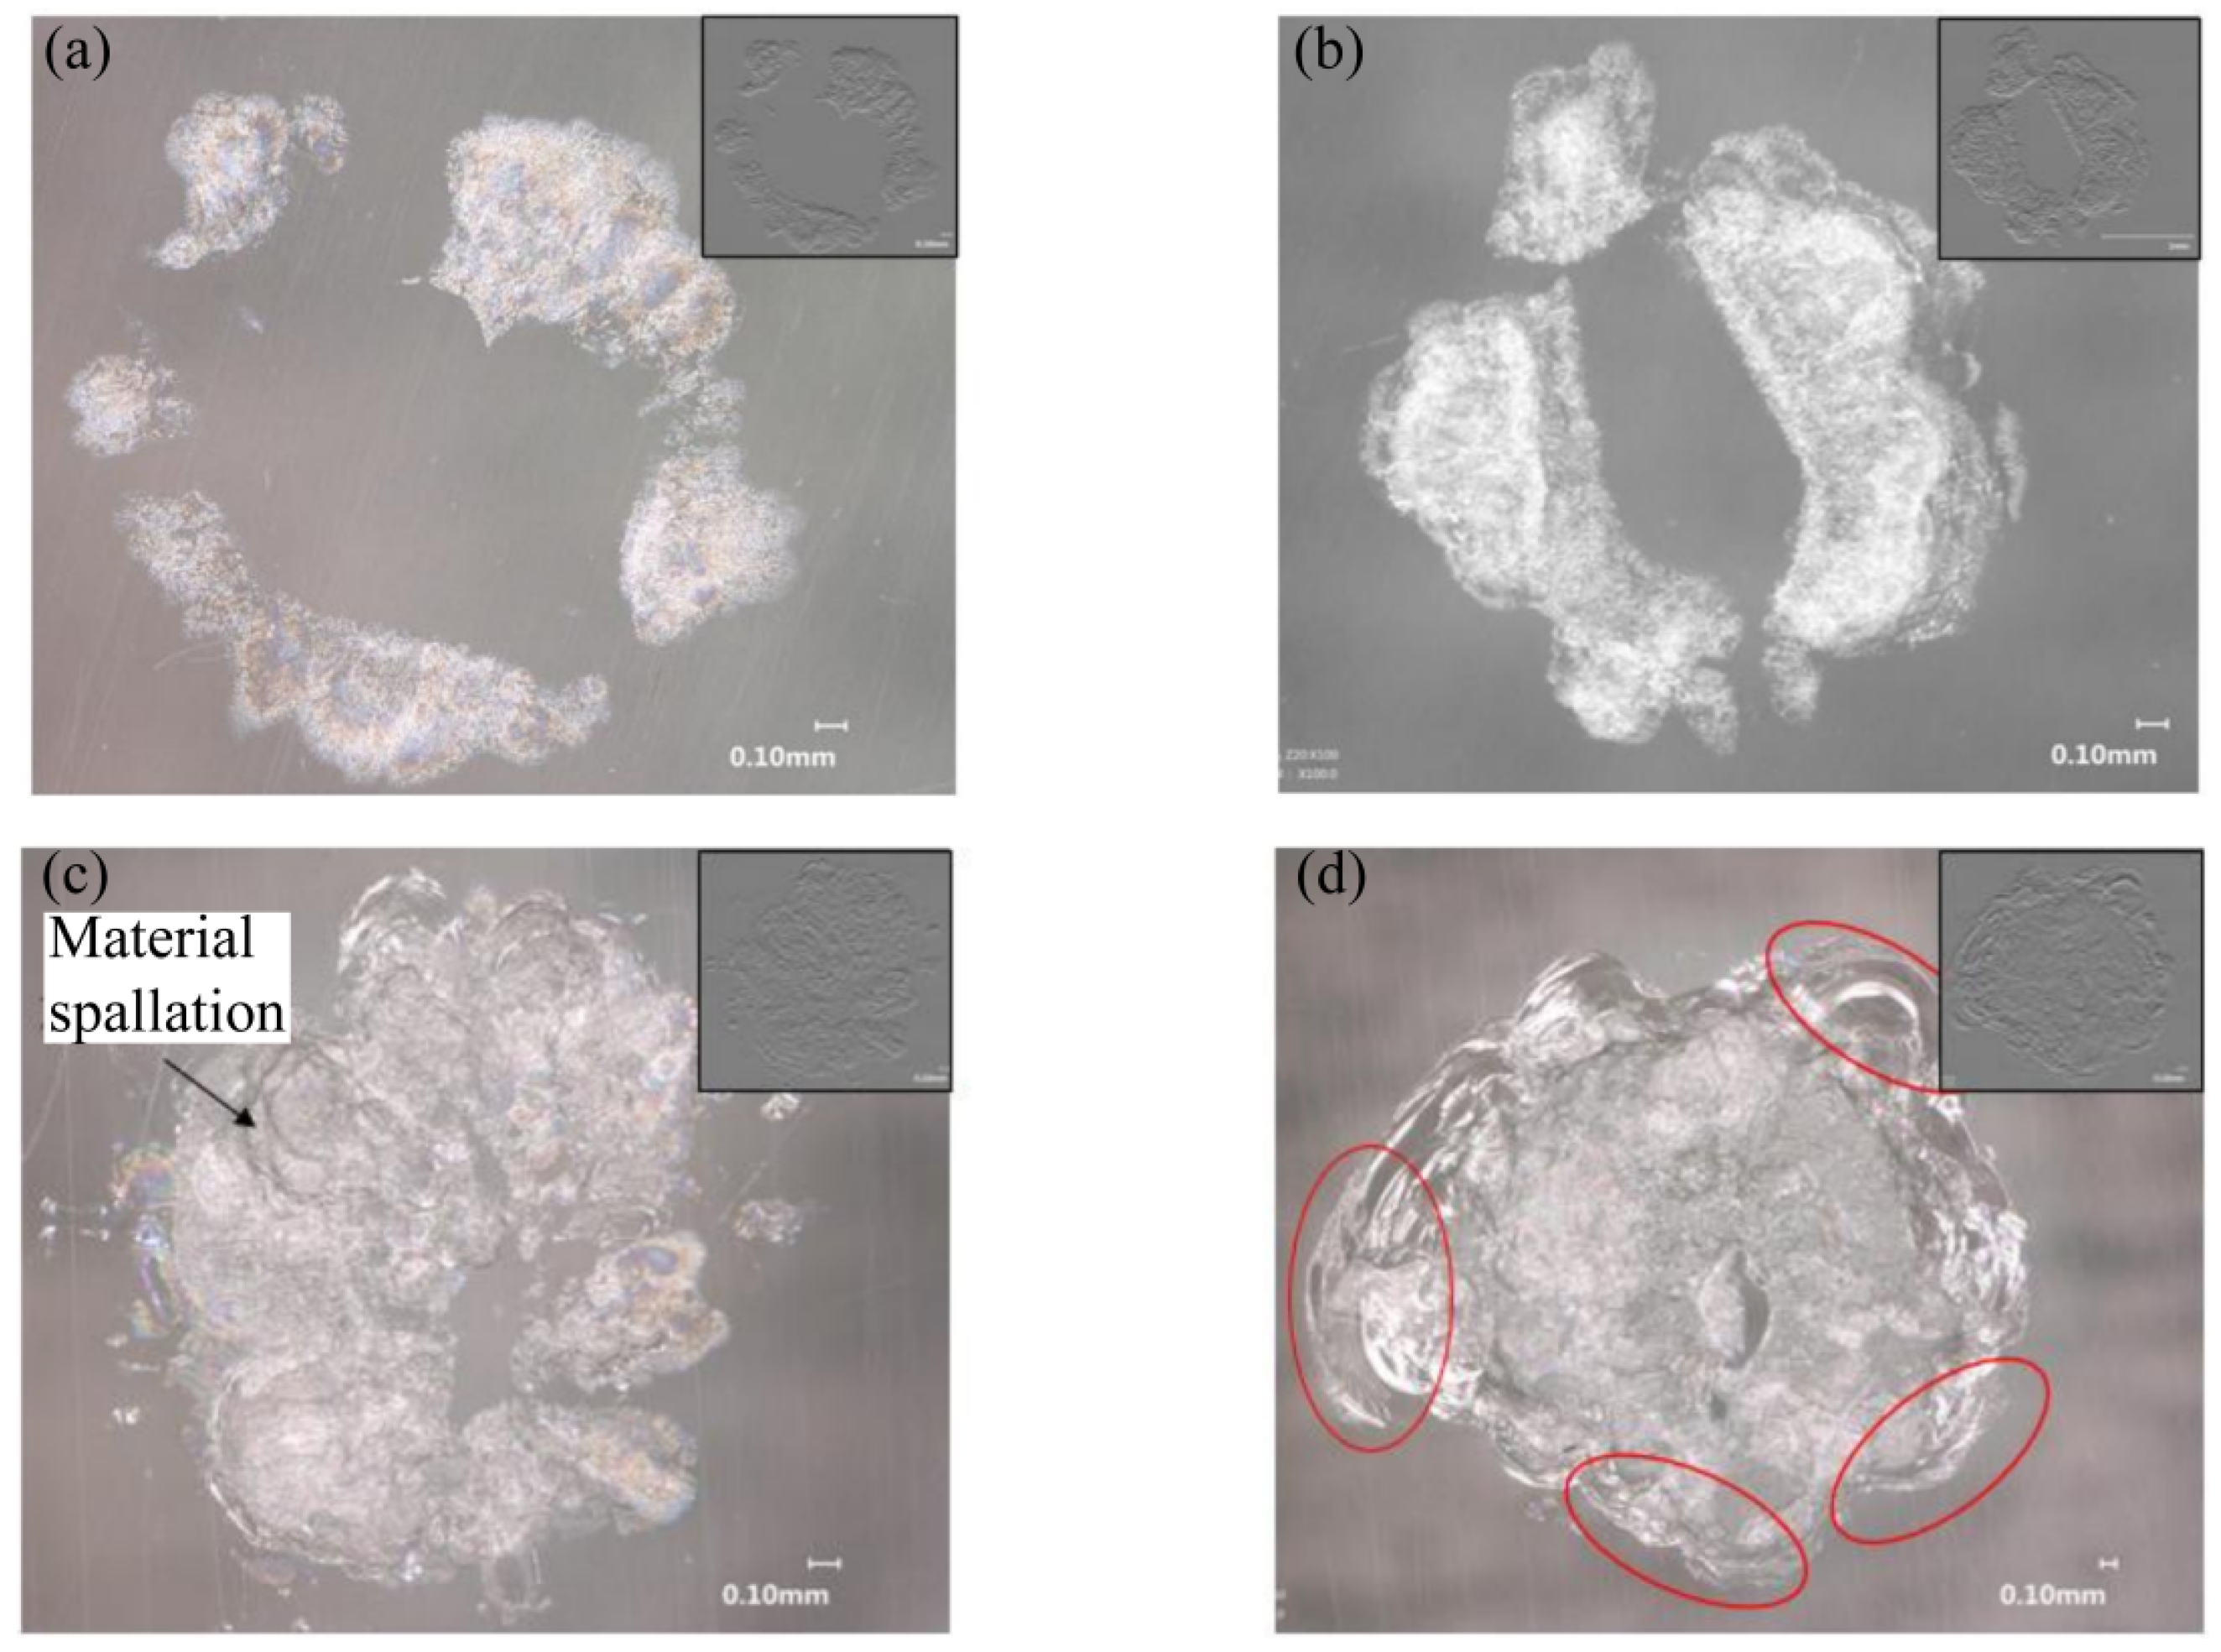
As shown in Figure 13, a single jet impact causes annular crazing damage on the specimen surface. With increasing impact number, the area of annular crazing damage gradually expands. After 5 impacts, surface cracks and small-area material spallation appear on the specimen, and the central undamaged region shrinks. After 10 impacts, large-area spallation occurs, ring-shaped cracks form around the erosion crater, and the crater depth reaches approximately 0.4 mm.
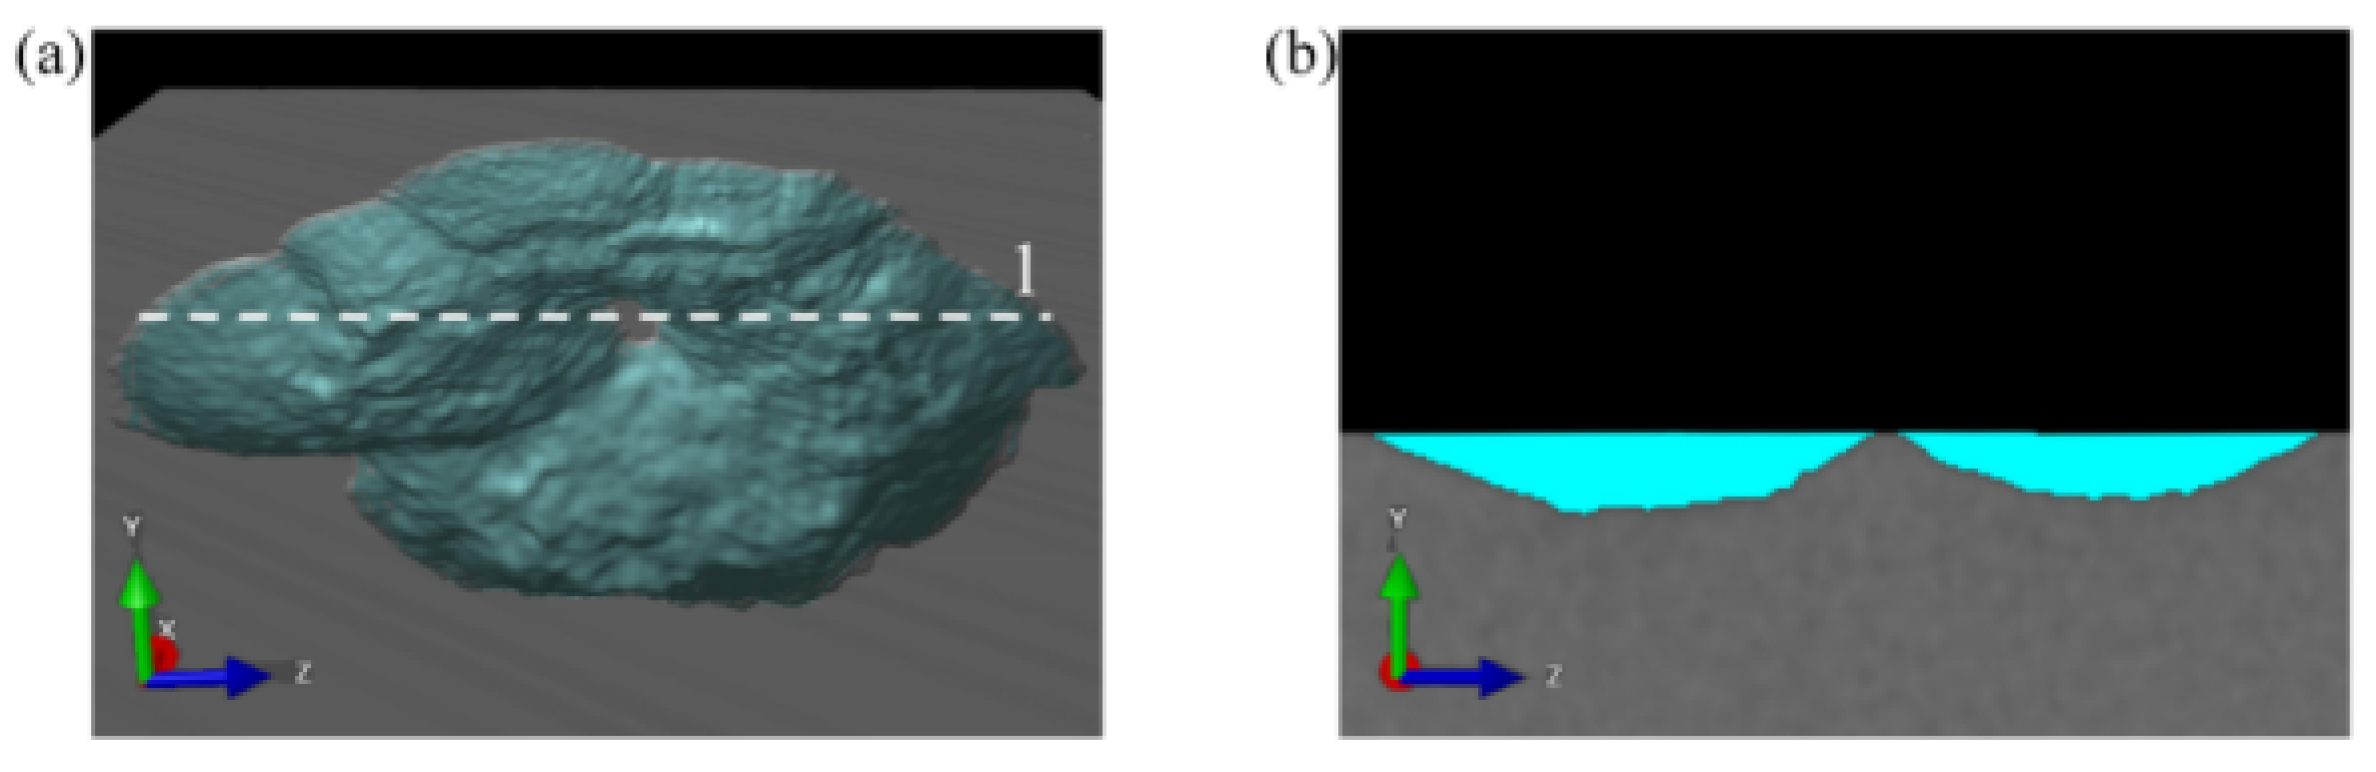
Due to the shallow depth of field of optical microscopy, it is not suitable for observing damage with a large depth. When the number of impacts exceeds 10, CT scanning technology is required to reconstruct the three-dimensional morphology of the erosion crater. The three-dimensional reconstruction of the erosion crater after 40 impacts is shown in Figure 14a. It can be seen from the figure that the material spallation at the impacted position is mainly concentrated around the impact centre. To visualise the crater morphology, a cross-sectional profile of the erosion crater was extracted along line 1 in Figure 14a, as shown in Figure 14b. It can be seen from the profile that the cross-section exhibits a morphology with a central elevation and depressions on both sides.
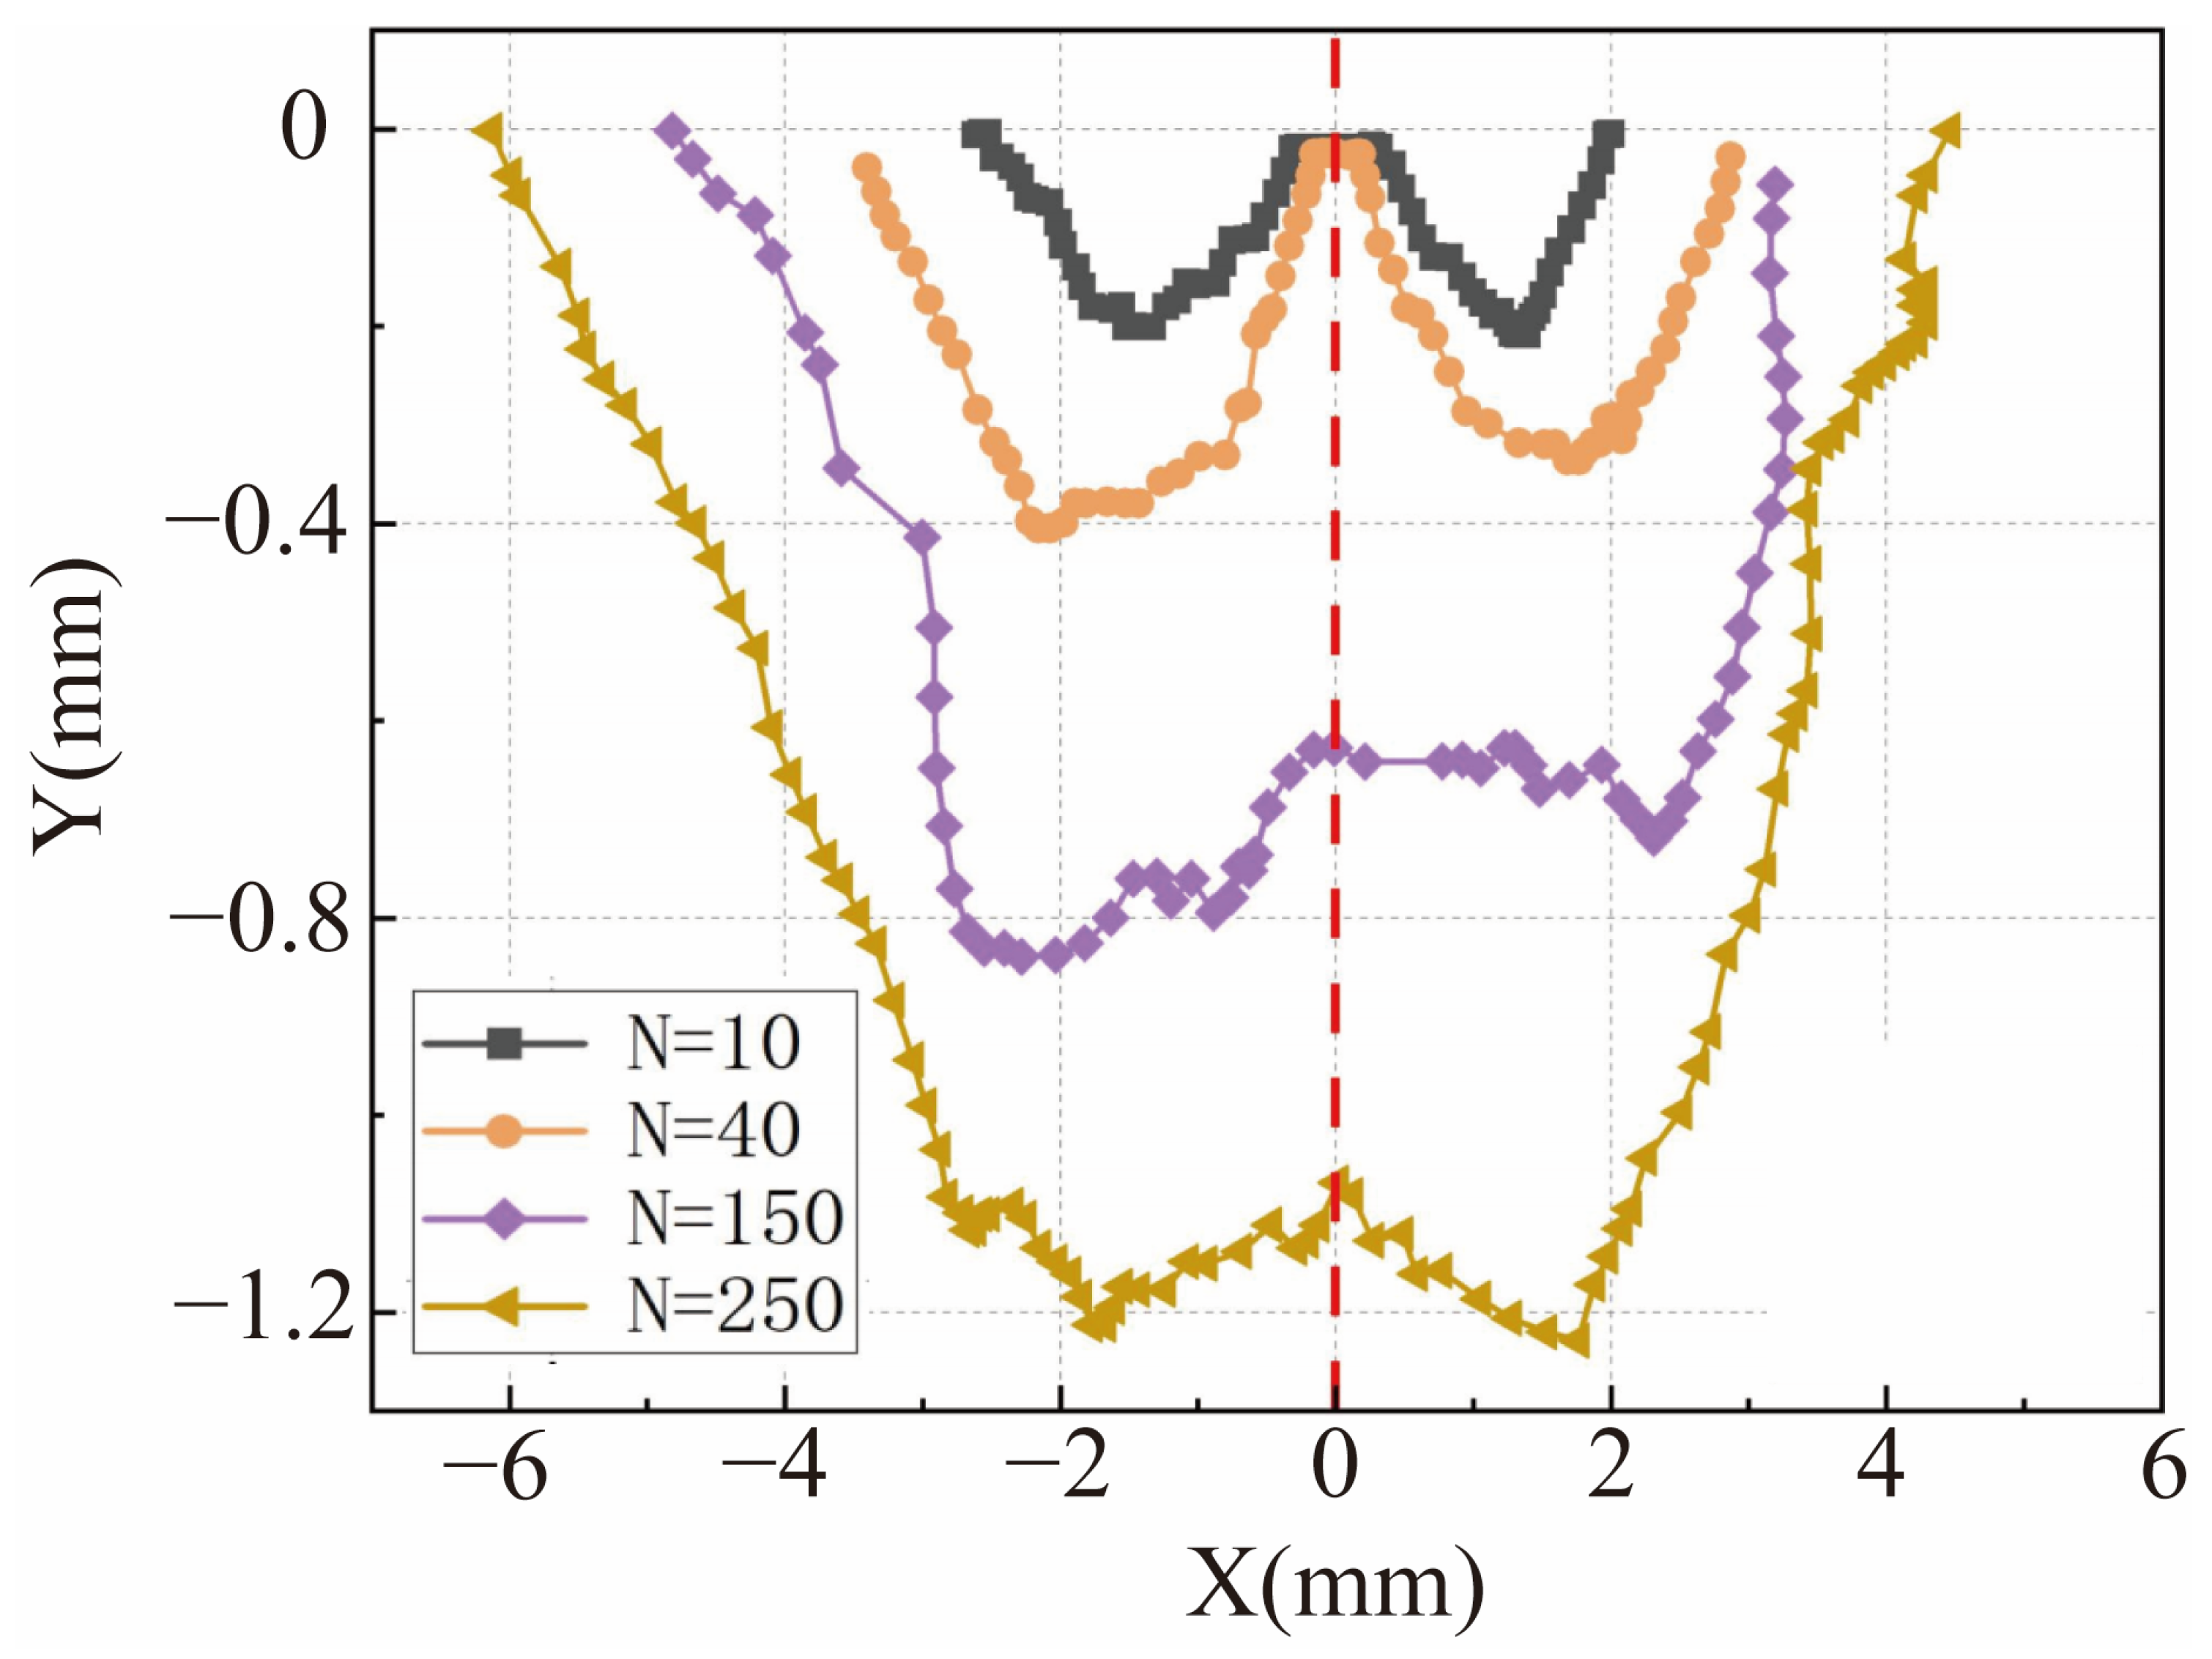
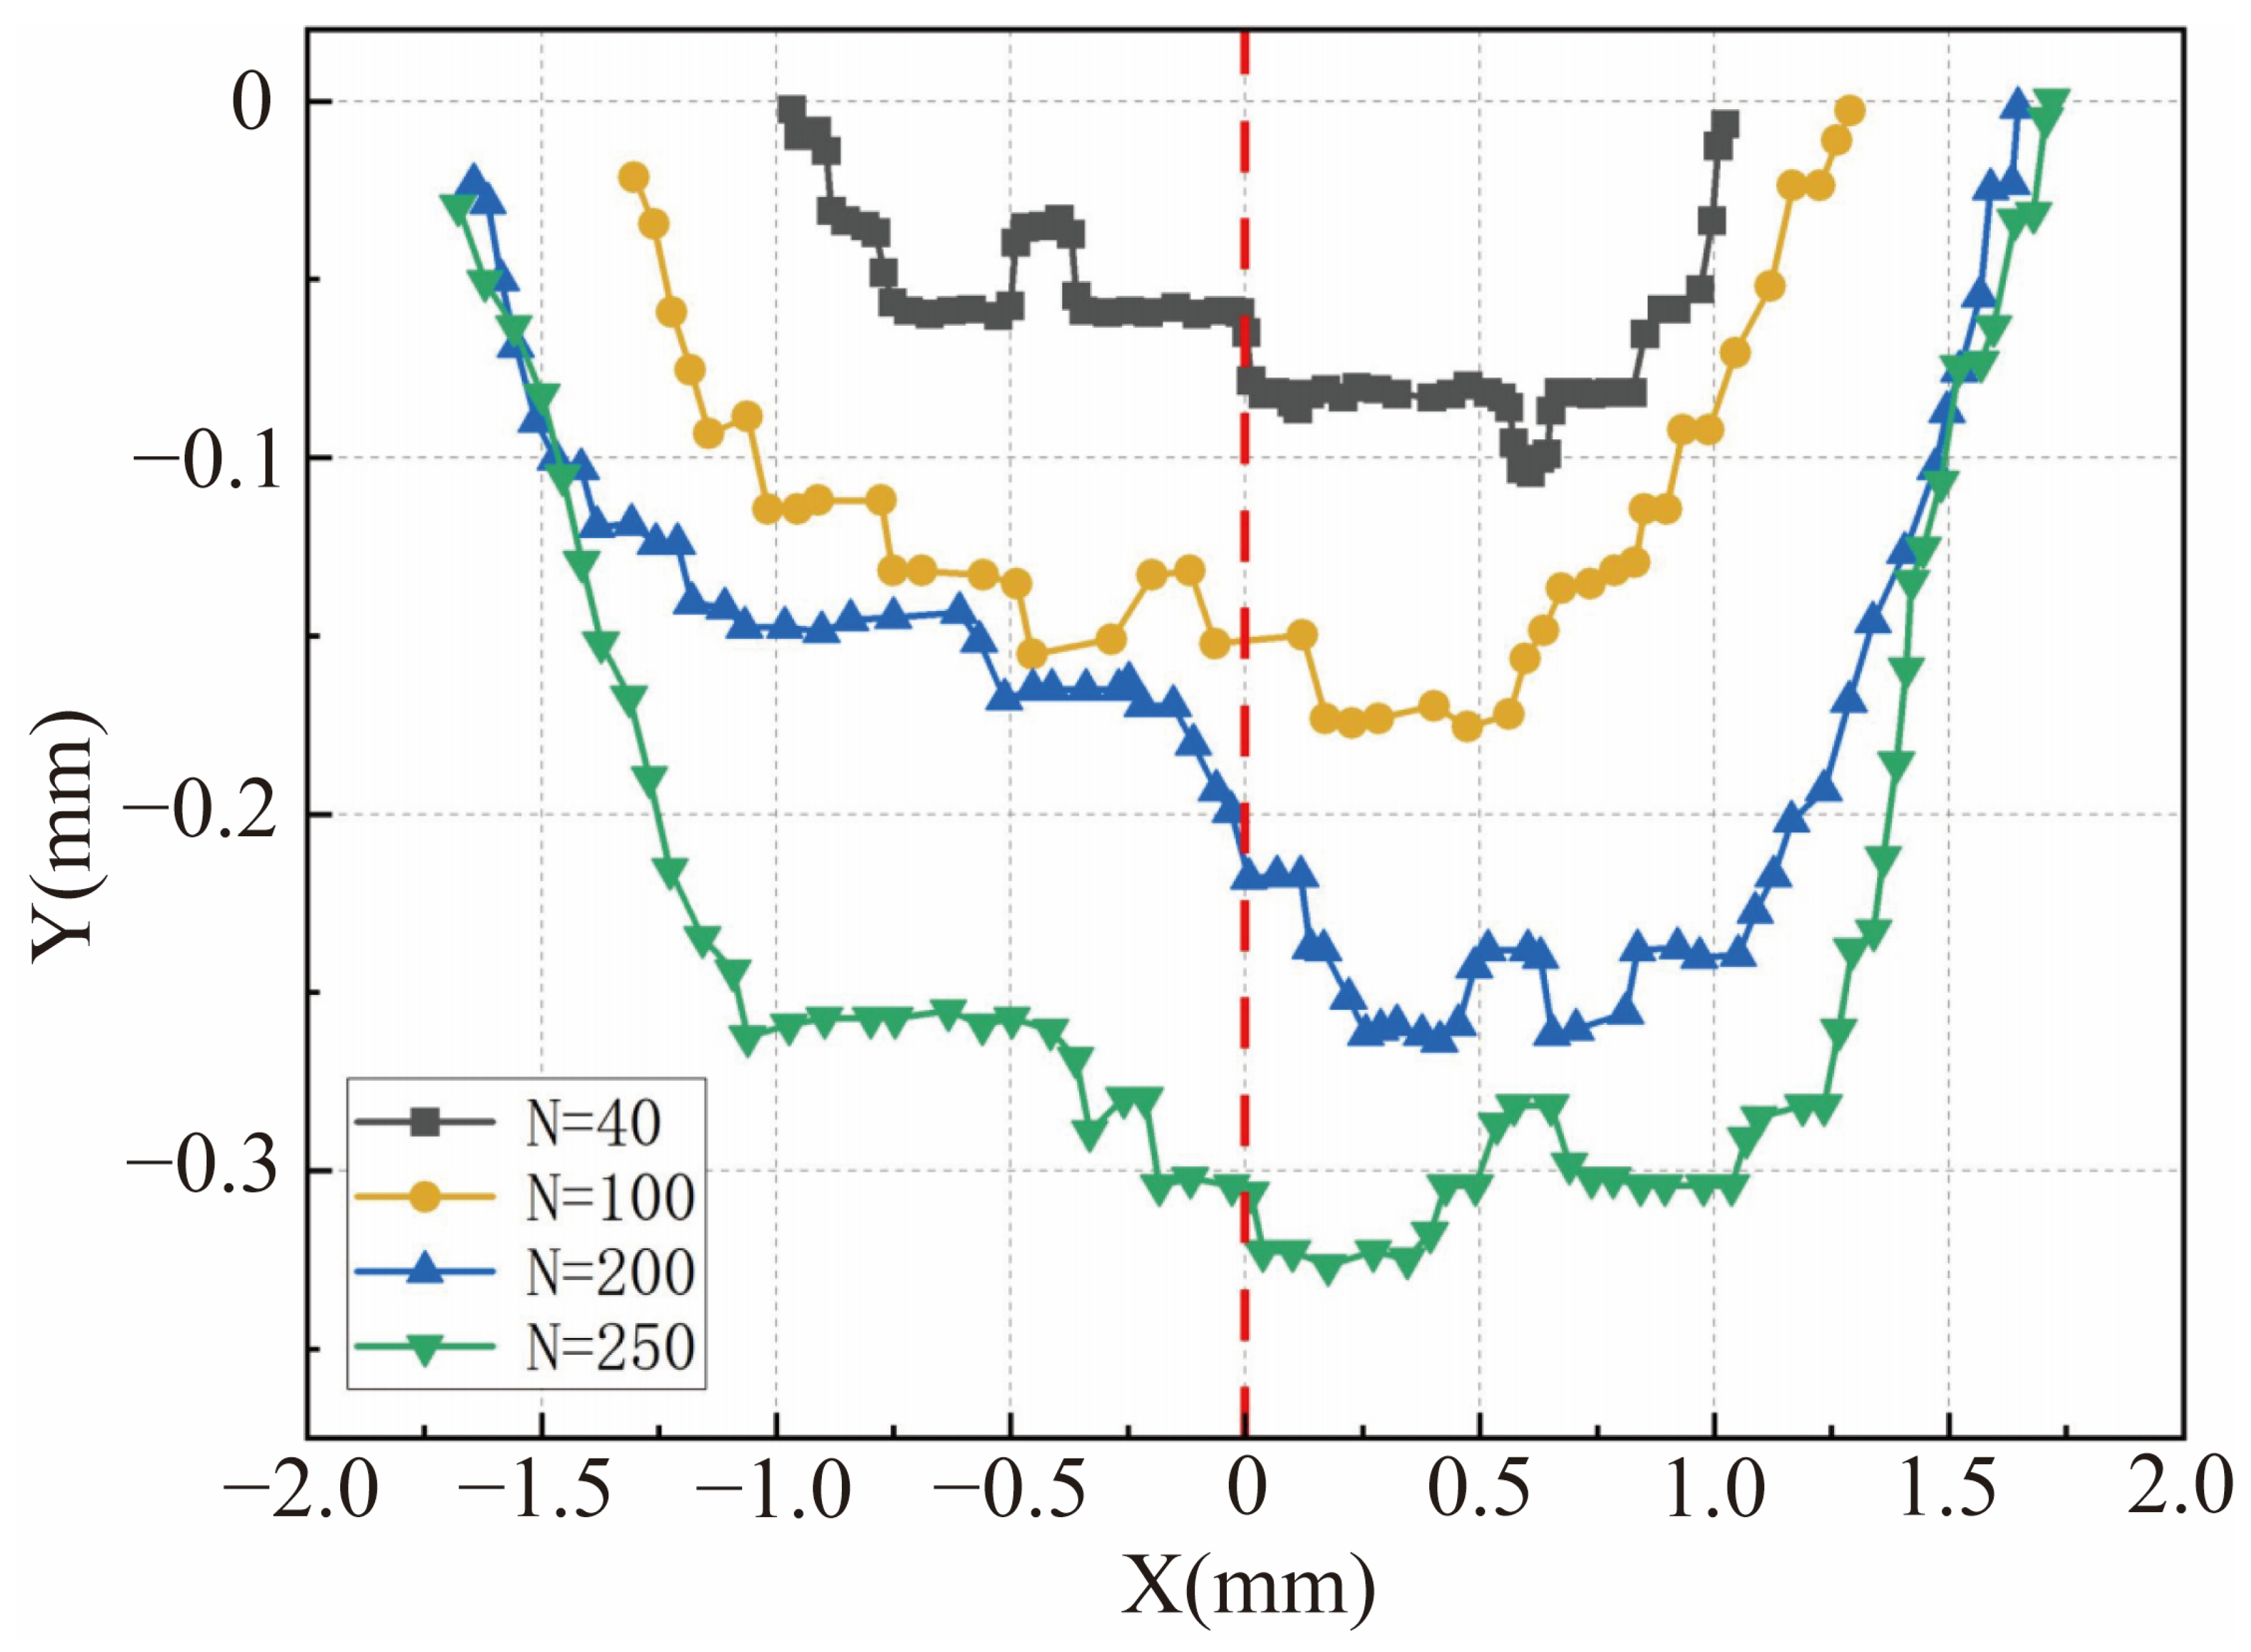
To quantitatively compare the erosion conditions of the specimens under different numbers of impacts, depth values at different positions were extracted from the cross-sectional profiles of various erosion craters, and the profile curves were plotted, as shown in Figure 15. It can be seen from Figure 15 that as the number of impacts increases, the magnitude of the erosion depth increases. Under different numbers of impacts, the profile curves of the erosion craters all exhibit a “two valleys and one peak” morphology.
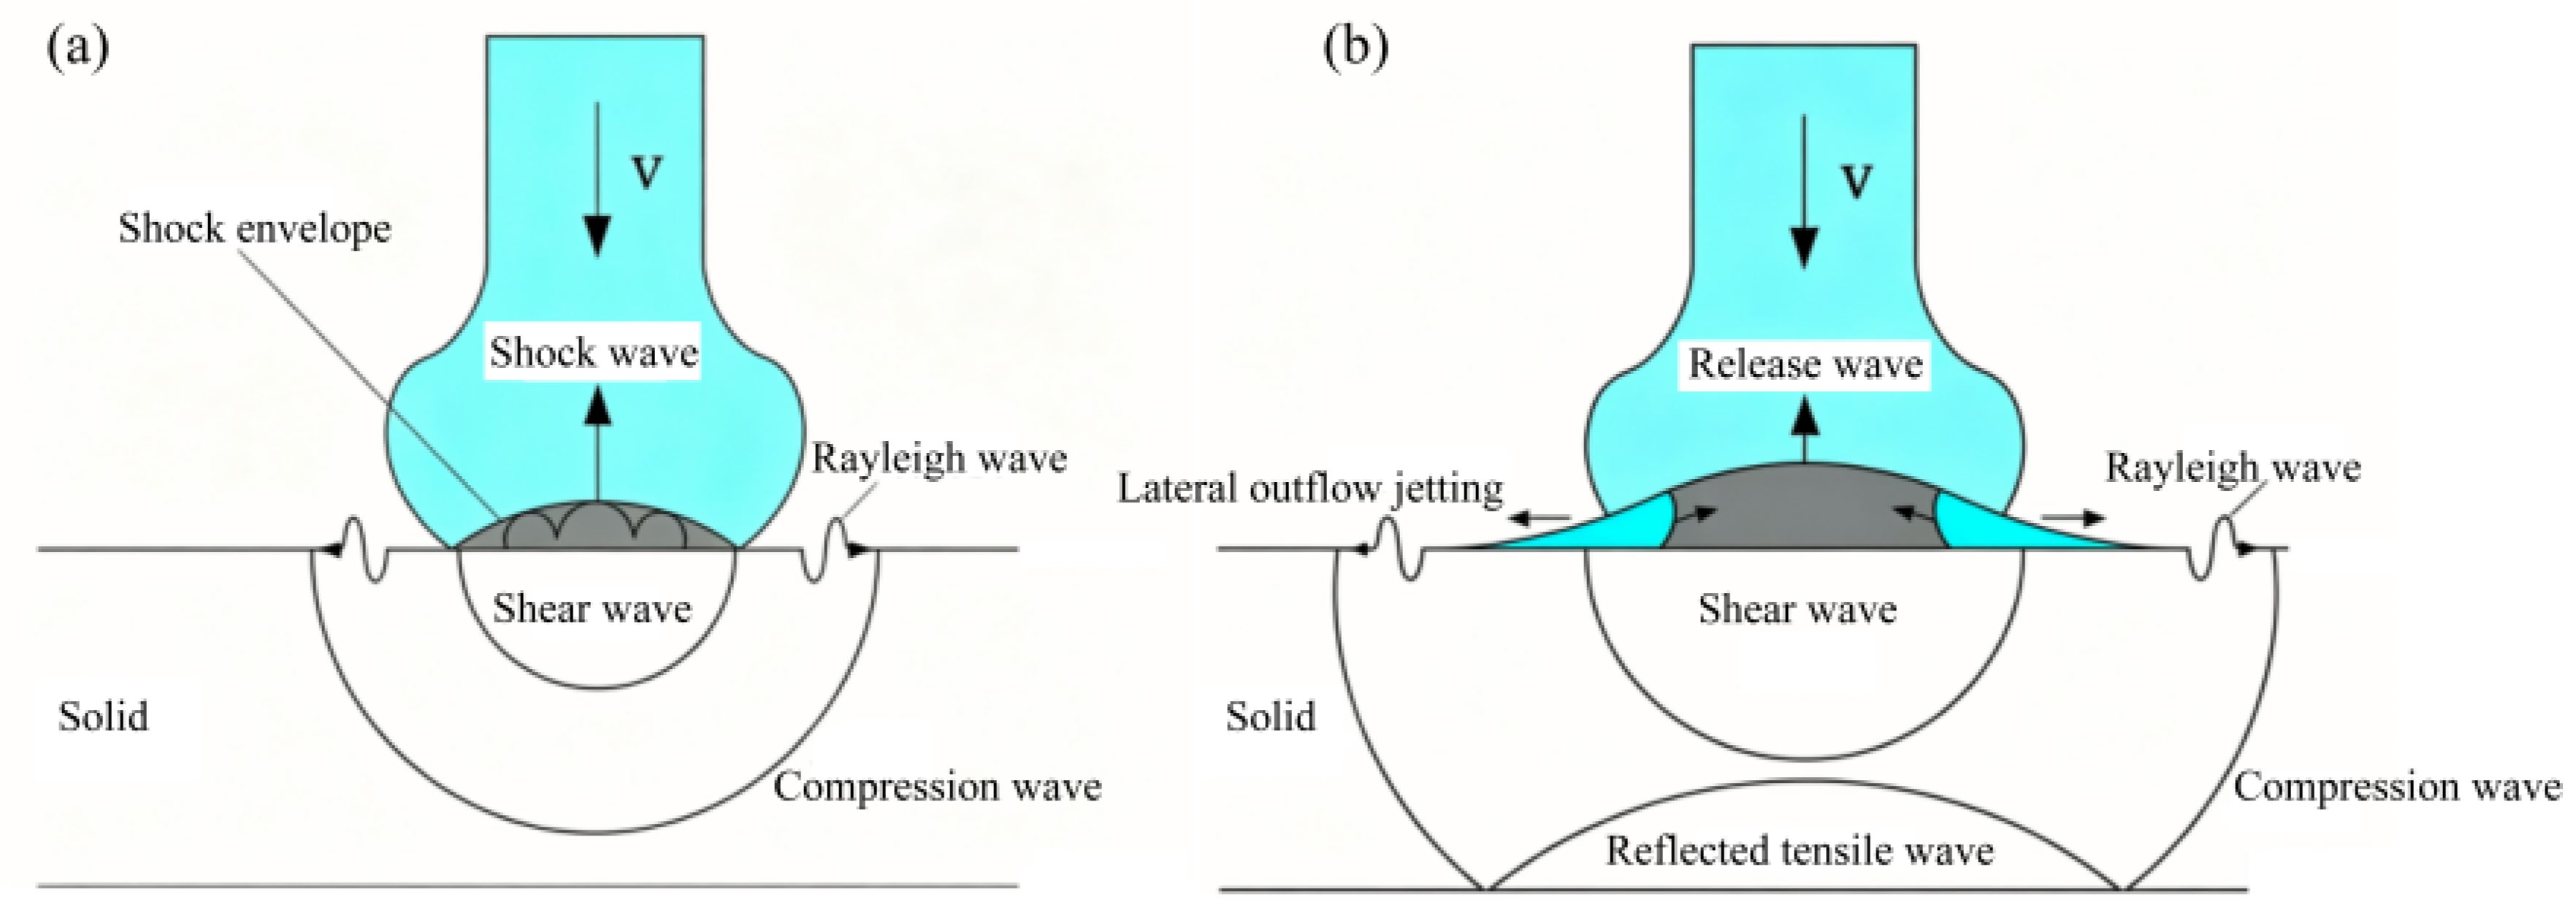
To facilitate understanding of the formation and evolution of the erosion crater morphology, it is necessary to analyse the formation mechanism of the erosion crater in conjunction with the liquid-solid impact process. As shown in Figure 16a, at the instant of jet impact on the specimen surface, the jet is in the compressible stage. The expansion velocity of the liquid-solid contact boundary is greater than the propagation velocity of the stress wave inside the liquid. The liquid at the centre is compressed, generating a “water-hammer pressure” at the contact centre. At the same time, stress waves are generated within both the liquid and the specimen: compression waves and shear waves propagate through the specimen interior, while Rayleigh waves propagate along the specimen surface. Rayleigh waves carry the majority of the energy, accounting for approximately 67% of the total energy [29]. The Rayleigh waves, possessing both vertical and horizontal components, induce tensile and shear stresses on the material surface, which lead to the initiation and propagation of material damage. As shown in Figure 16b, when the velocity of the shock wave inside the liquid equals the expansion velocity of the liquid-solid contact boundary, the shock wave detaches from the boundary, and the high internal pressure is released in the form of high-speed lateral outflow jetting.
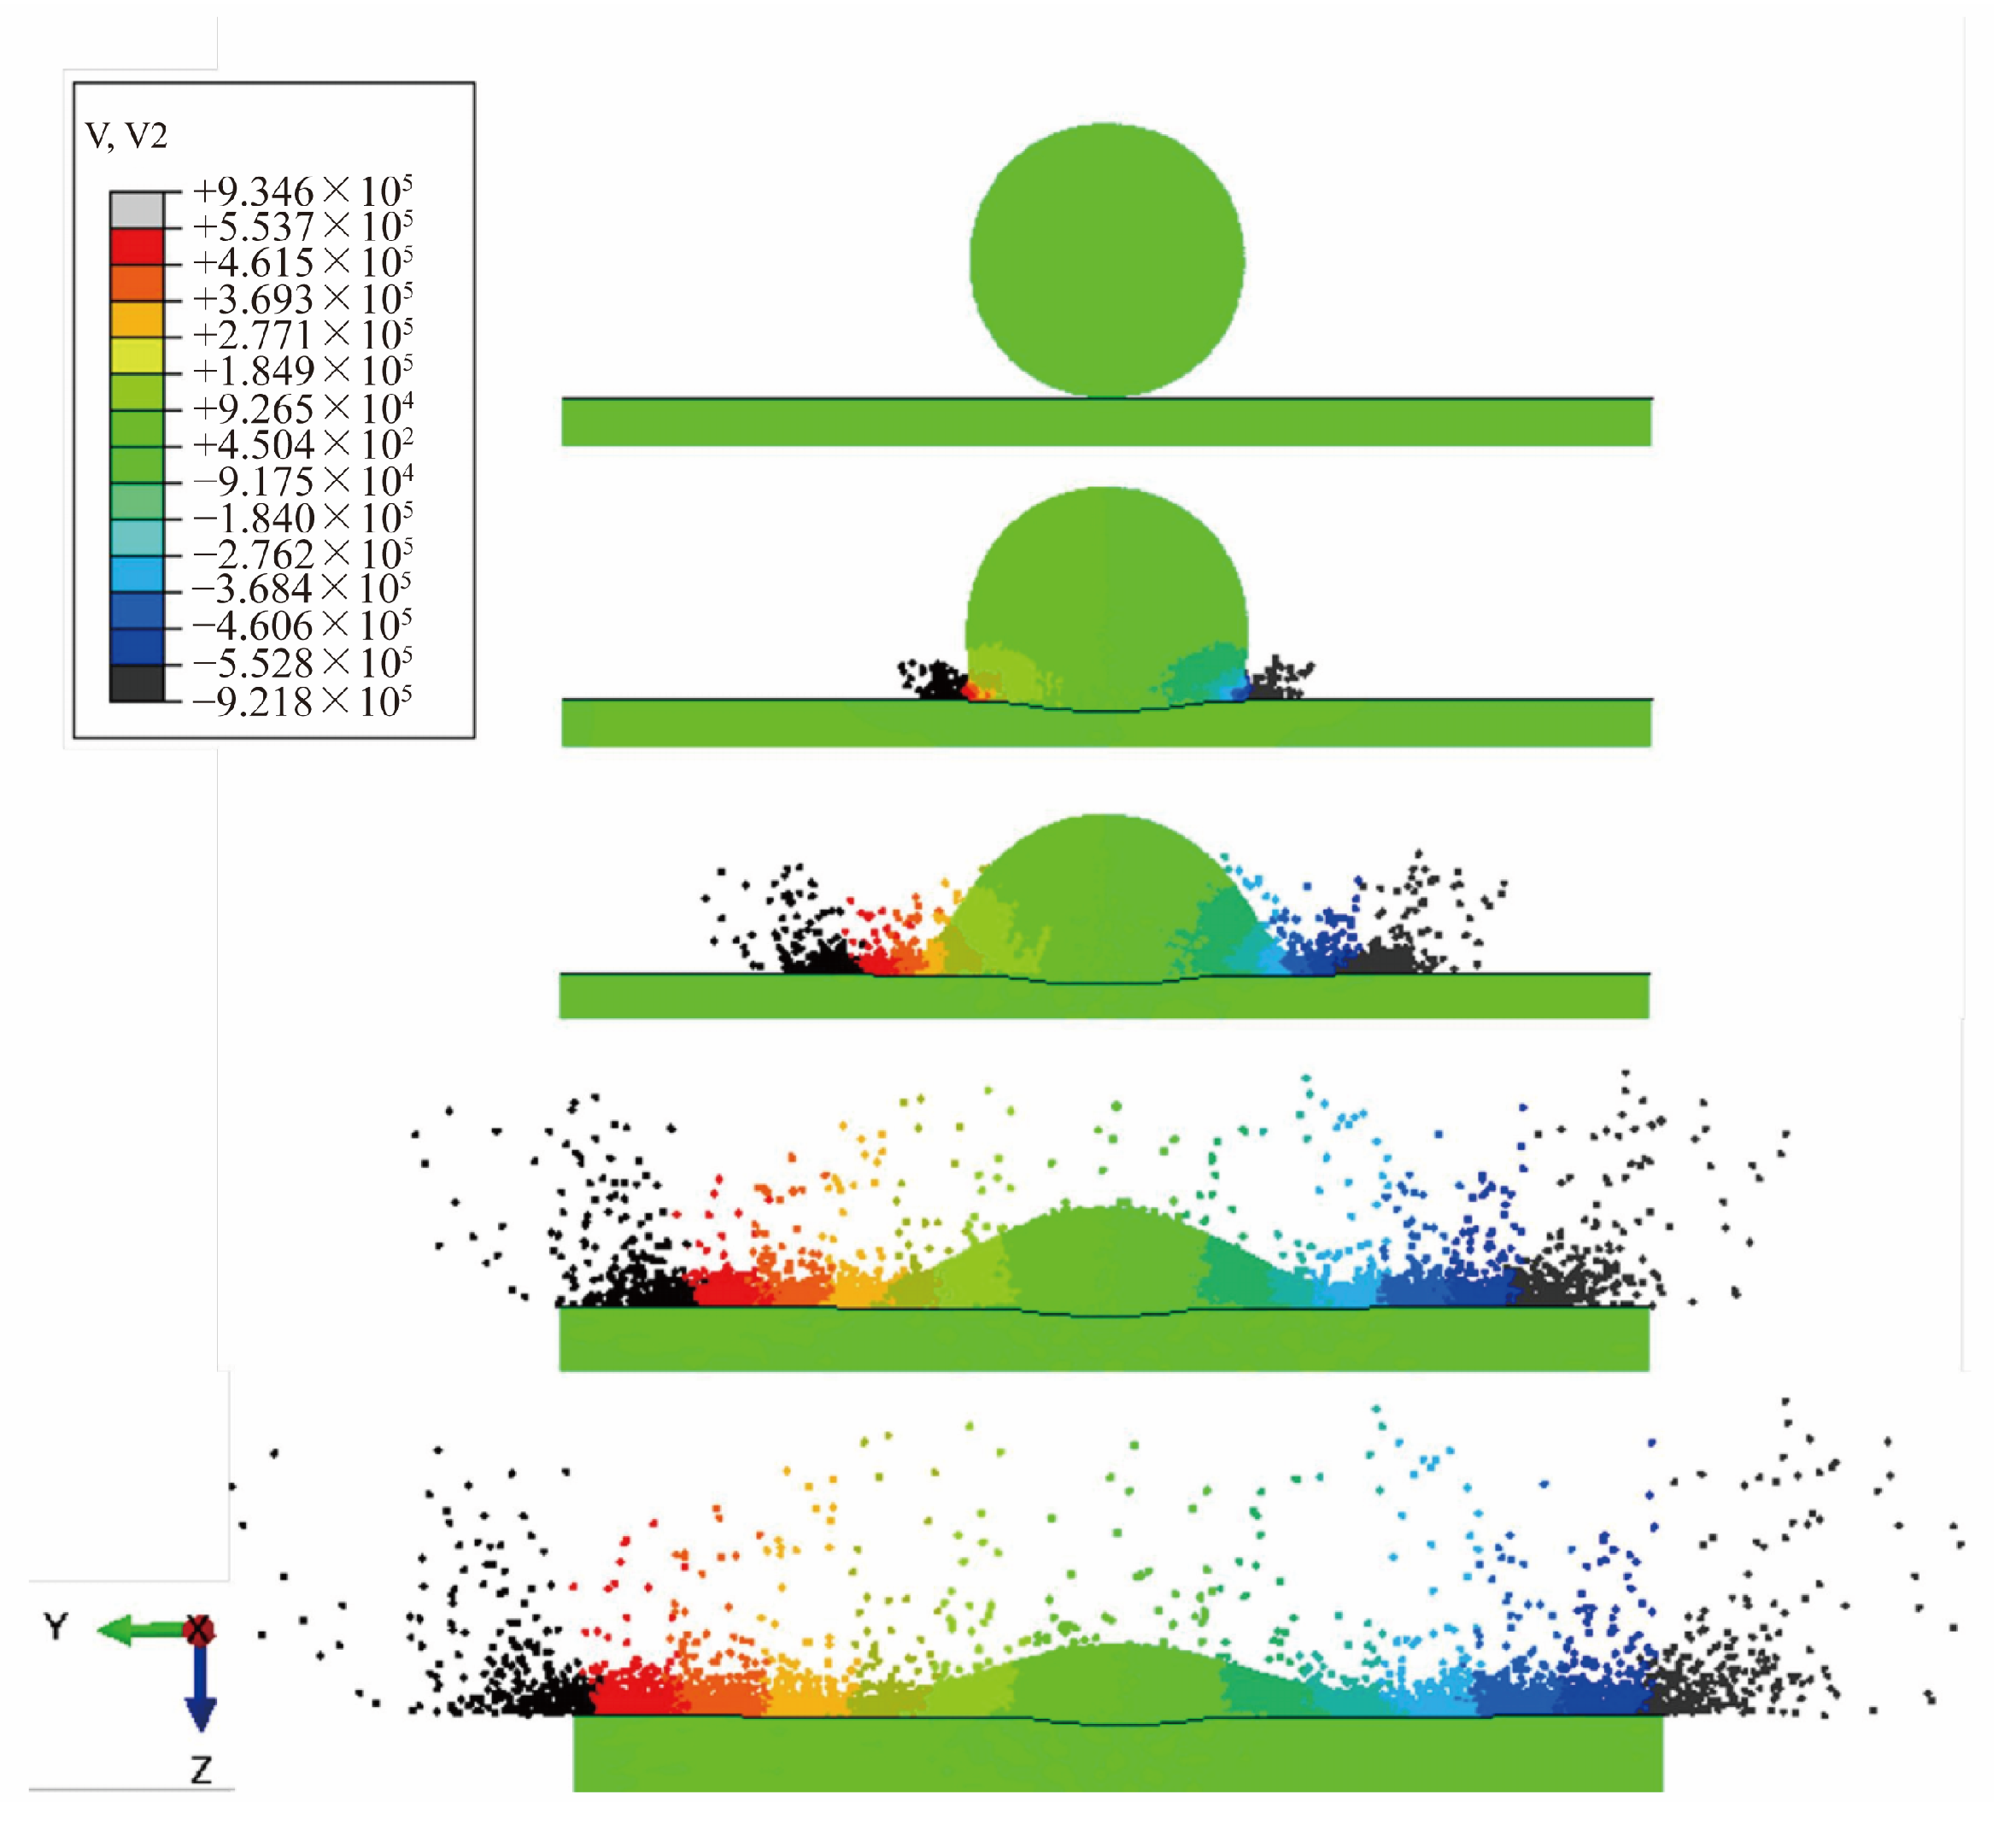
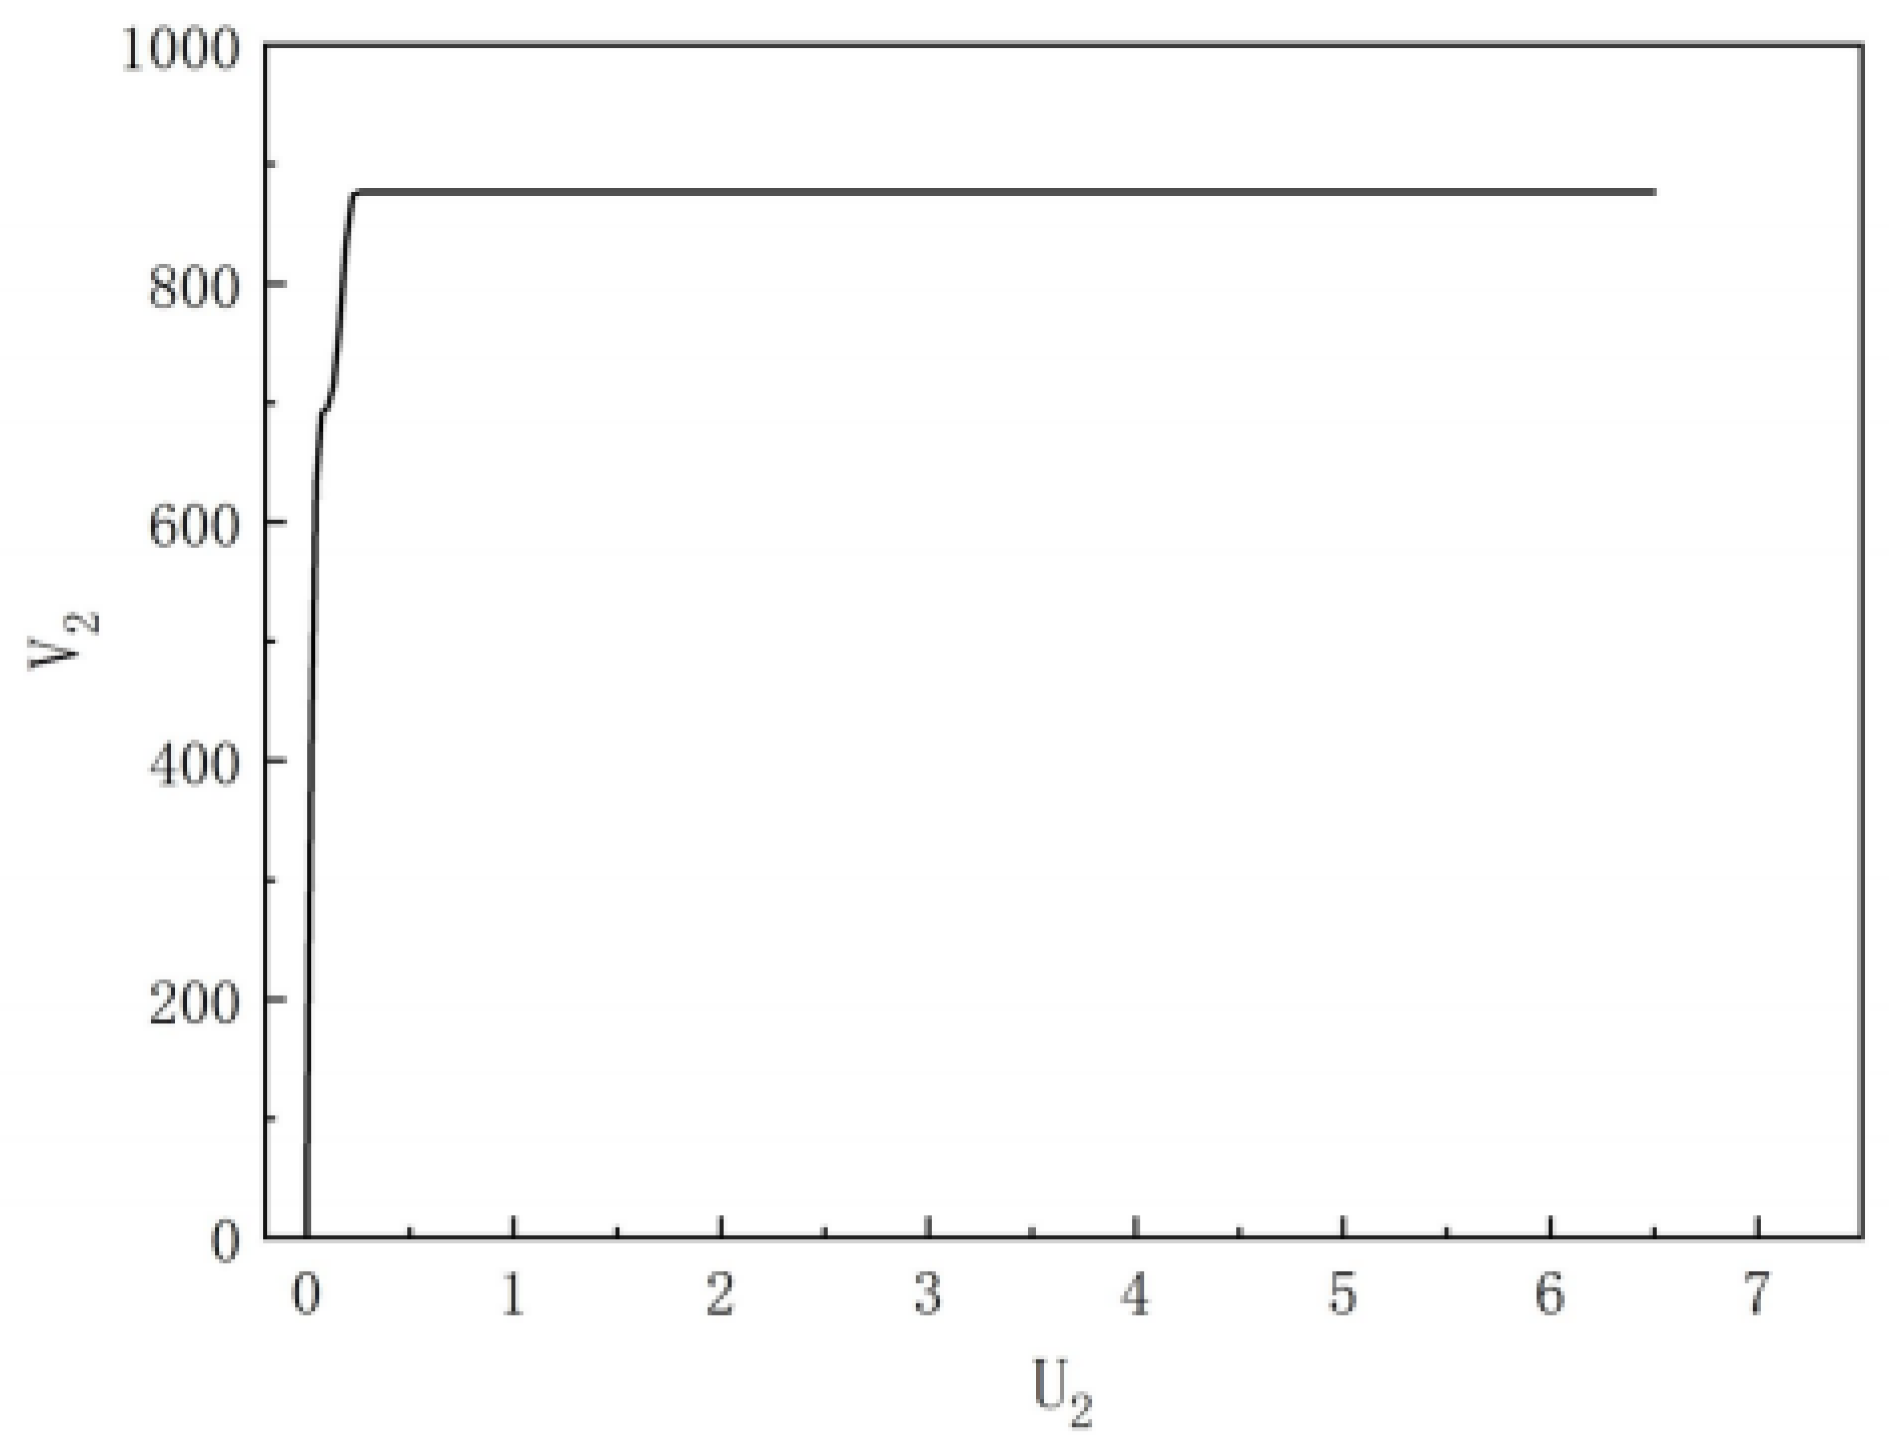
To provide a simplified simulation of the high-speed lateral jet, based on ABAQUS, a finite element model of droplet impact on a flat plate was established. Using the Smoothed Particle Hydrodynamics (SPH) method, the impact of a 2 mm diameter droplet at an initial velocity of 300 m/s on the plate was simulated. The velocity contour of SPH particles during the impact process is shown in Figure 17. It can be seen from the figure that the impact between the droplet and the plate generates a lateral jet with a very high velocity. The displacement-velocity curve of particles in the Y direction was extracted from the simulation results, as shown in Figure 18. The curve indicates that the lateral jet velocity can reach 890 m/s, which is approximately three times the impact velocity.
Liquid water-hammer pressure-induced stresses exceeding the yield strength of the material lead to the formation of indentations on the material surface. These indentations enlarge with further impacts, and surface micro-asperities are generated due to repeated lateral outflow jetting. The high-speed lateral jet interacts with the surface micro-asperities, resulting in further crack initiation and damage. As the number of impacts increases, the micro-asperities further open up, leaving a large cavity on the surface. The depth of this cavity continues to increase with the number of impacts [28].
Based on the above analysis, under the jet impact velocity of v = 335 m/s, when the number of impacts does not exceed 10, the specimen damage is in the incubation stage, and the damage morphology exhibits a pattern of “a central undamaged region surrounded by annular crazing damage”. At this stage, no significant material spallation occurs. The formation of this damage morphology can be attributed to the following: the centre of the impacted position undergoes slight indentation under water-hammer pressure; due to Rayleigh waves, crazing damage occurs in the material surrounding the impact centre. This crazing is a type of subsurface cracking [19]. Meanwhile, the friction between the high-speed lateral jet and the specimen surface increases the surface roughness, forming micro-asperities. When the number of impacts N exceeds 10, the area of crazing damage expands continuously. These subsurface microcracks begin to grow and coalesce, and the cracks initiated by surface micro-asperities interconnect with the subsurface cracks, forming loose material fragments. The high-speed lateral jet can then intrude, lifting the material along the cracks and causing large-area material spallation. At this point, significant mass loss (volume loss) occurs, marking the end of the incubation stage and the onset of the acceleration stage. As continuous impact proceeds, repeated water-hammer pressure causes indentation at the centre of the impacted position, while lateral outflow jetting causes extensive material spallation around the impact centre, ultimately resulting in the cross-sectional profile with a central elevation and depressions on both sides, as shown in Figure 14b.

3.3. Continuous Twin Pulsed Jet Coupled Impact Tests

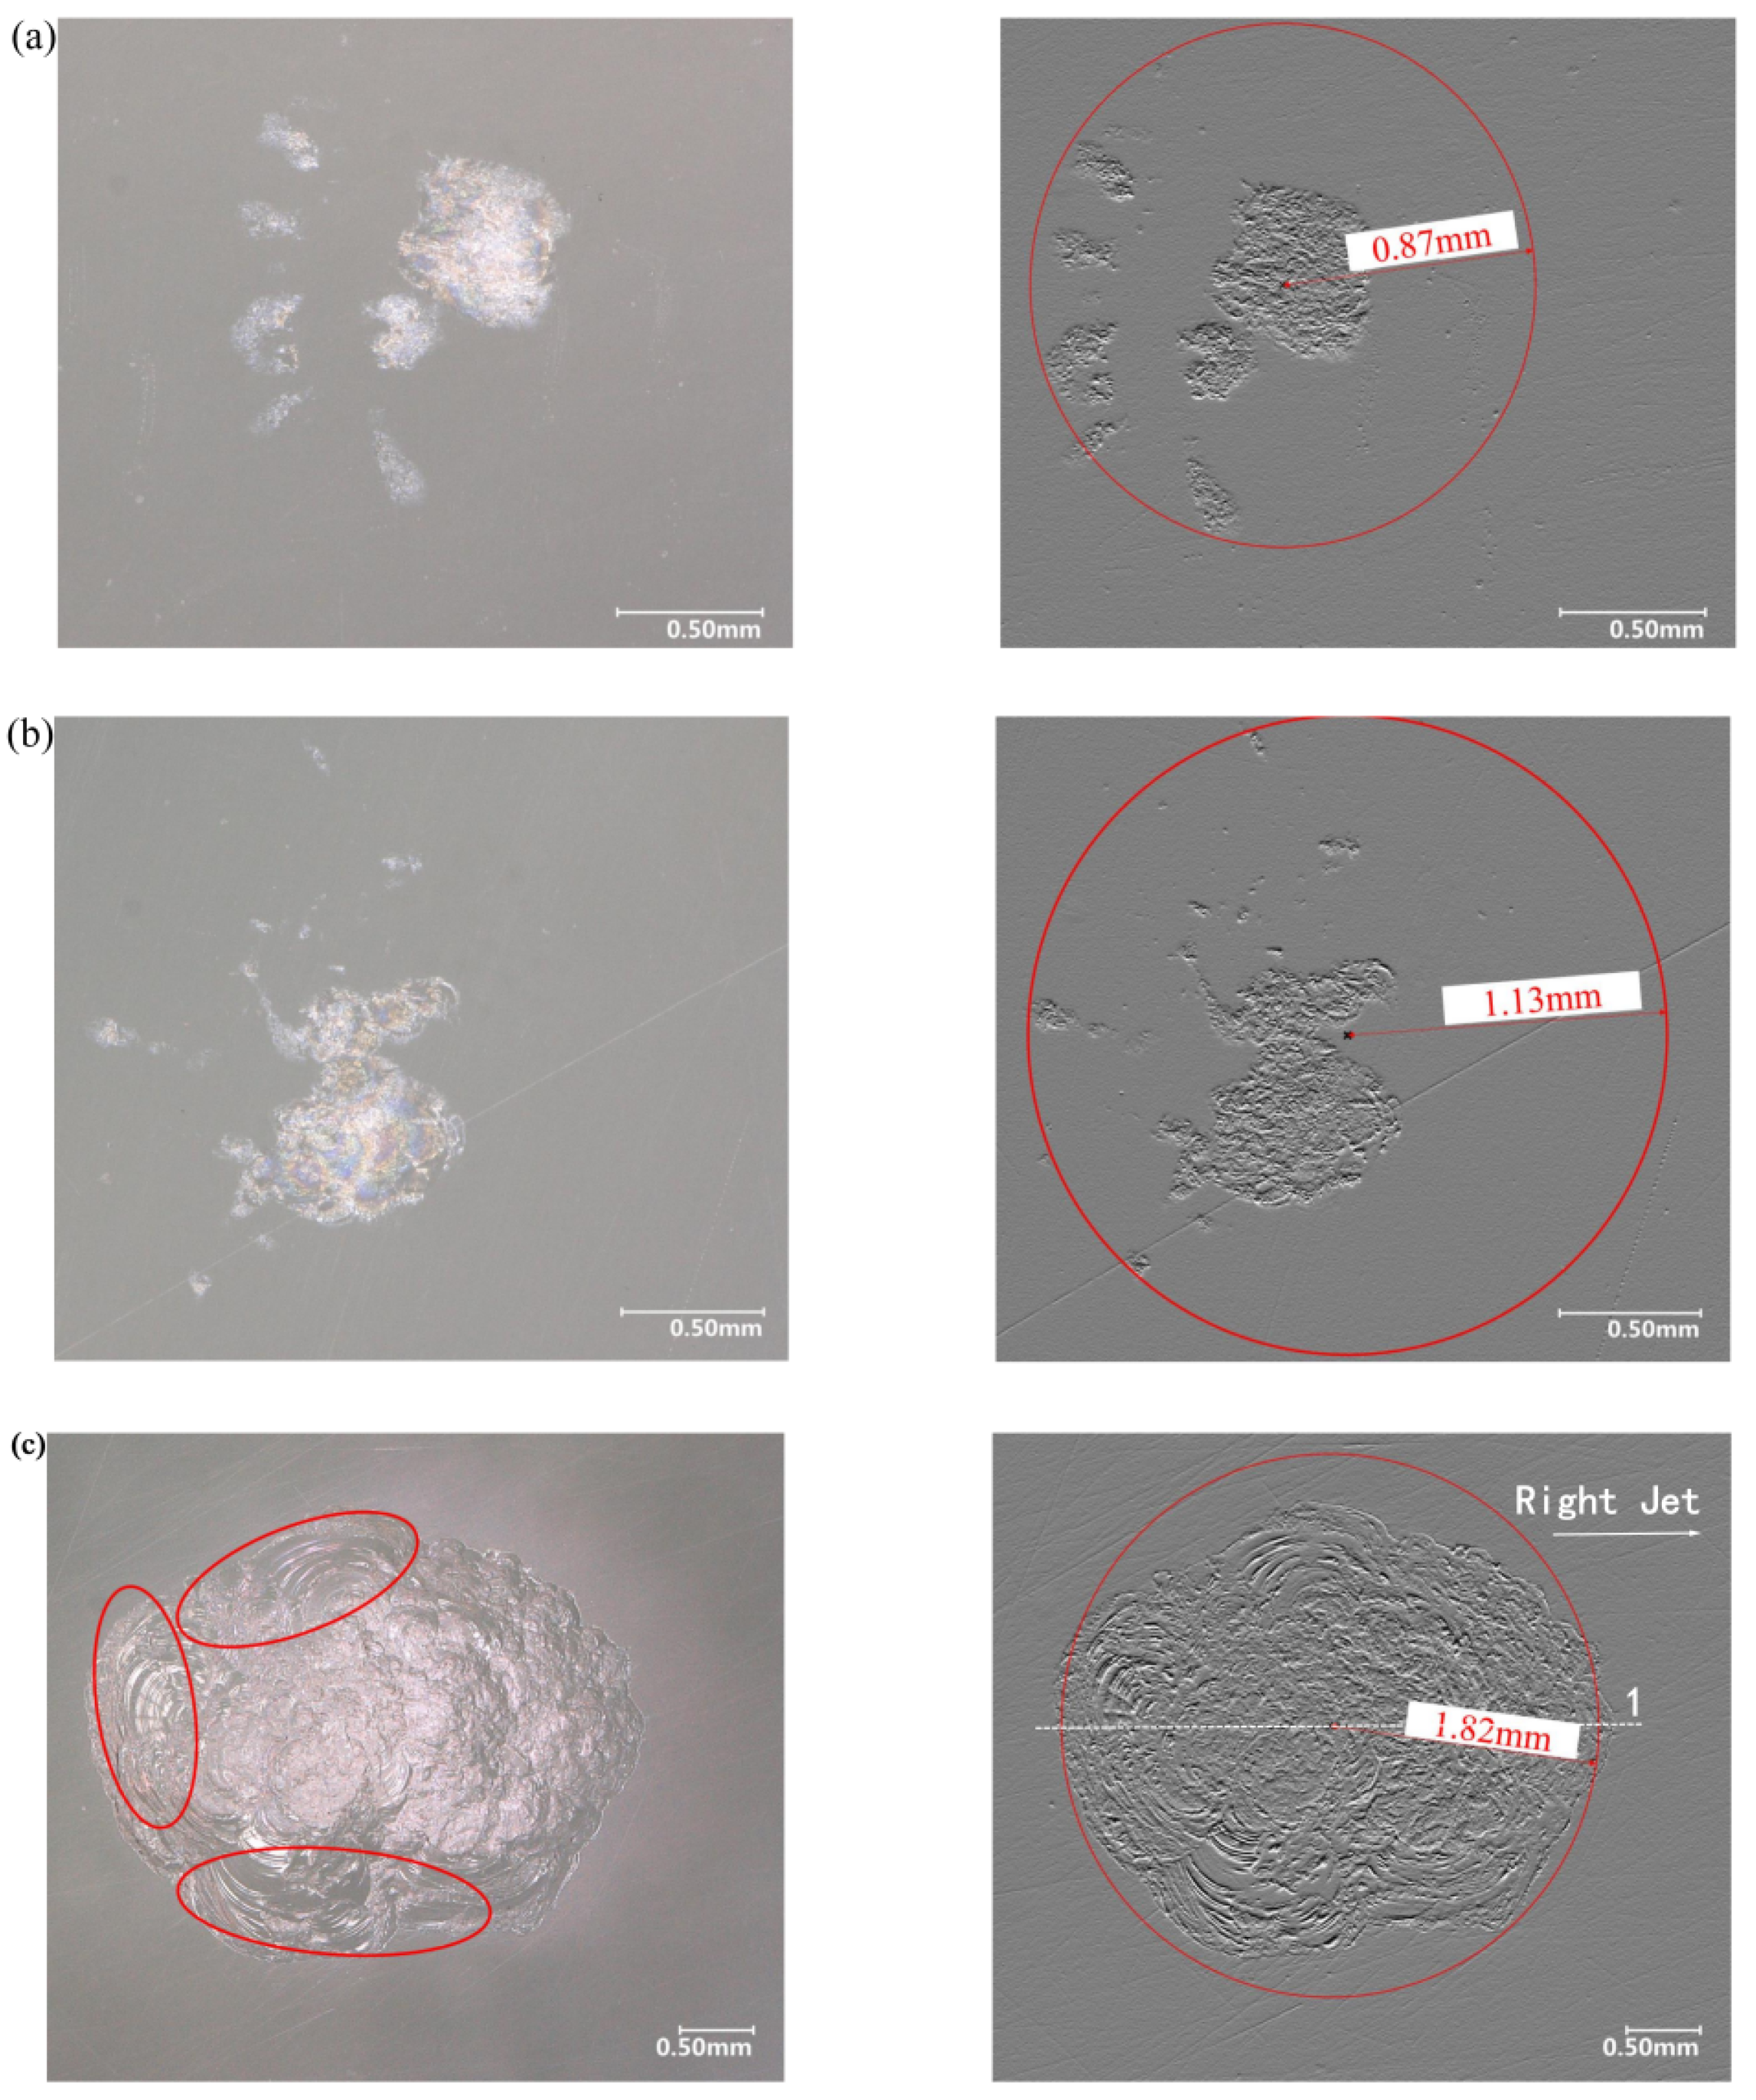
Using the two-orifice nozzle, continuous twin pulsed jet coupled impact tests were conducted on oriented PMMA specimens with the continuous jet rain erosion test system to investigate the damage characteristics and evolution under different numbers of pulsed jet impacts. In the tests, the nozzle outlet diameter was 0.8 mm, the resulting jet diameter was approximately 4.9 mm, and the impact velocity was 330 m/s. Since the damage morphology caused by the twin pulsed jet impact is basically symmetric, the erosion crater produced by the left-side jet in the twin pulsed jet configuration was selected for analysis and discussion in this paper. Micrographs of the left-side erosion crater on the specimen caused by the continuous twin pulsed jet coupled impact are shown in Figure 19, where N is the number of impacts. The left image shows the damage morphology micrograph, and the right image presents the quantification of the circumscribed circle radius of the erosion damage region.
From Figure 19, it can be seen that when the number of impacts reaches 5, visible damage appears on the oriented PMMA. The damage is mainly concentrated at the central position of the impact point. On the left semicircle of the central damage zone, radially extending damage is also present. The radius of the overall damaged region is approximately 0.87 mm. As the number of impacts increases, the central damage zone expands and the diameter of the overall damaged region also increases. When the number of impacts reaches 200, the erosion crater gradually evolves into an elliptical shape. Notably, obvious ring cracks appear only on the left semicircular edge of the erosion crater, which is in sharp contrast to the single pulsed jet impact case shown in Figure 13d, where ring cracks are present around the entire periphery of the erosion crater.
The cross-sectional profile of the specimen after continuous twin pulsed jet coupled impacts was plotted along line 1 in Figure 19c (the projection of the line connecting the two nozzle outlet centers onto the specimen surface), as shown in Figure 20. It can be seen from Figure 20 that the magnitude of erosion depth increases with the number of impacts. The cross-sectional shapes at different numbers of impacts share a common feature: the erosion depth on the right side of the impact centre is larger, and the inlet diameter of the erosion crater is smaller than the jet diameter. This is in sharp contrast to the “two valleys and one peak” morphology observed in the cross-sectional profiles of the damage caused by continuous single pulsed jet impact, as shown in Figure 15.
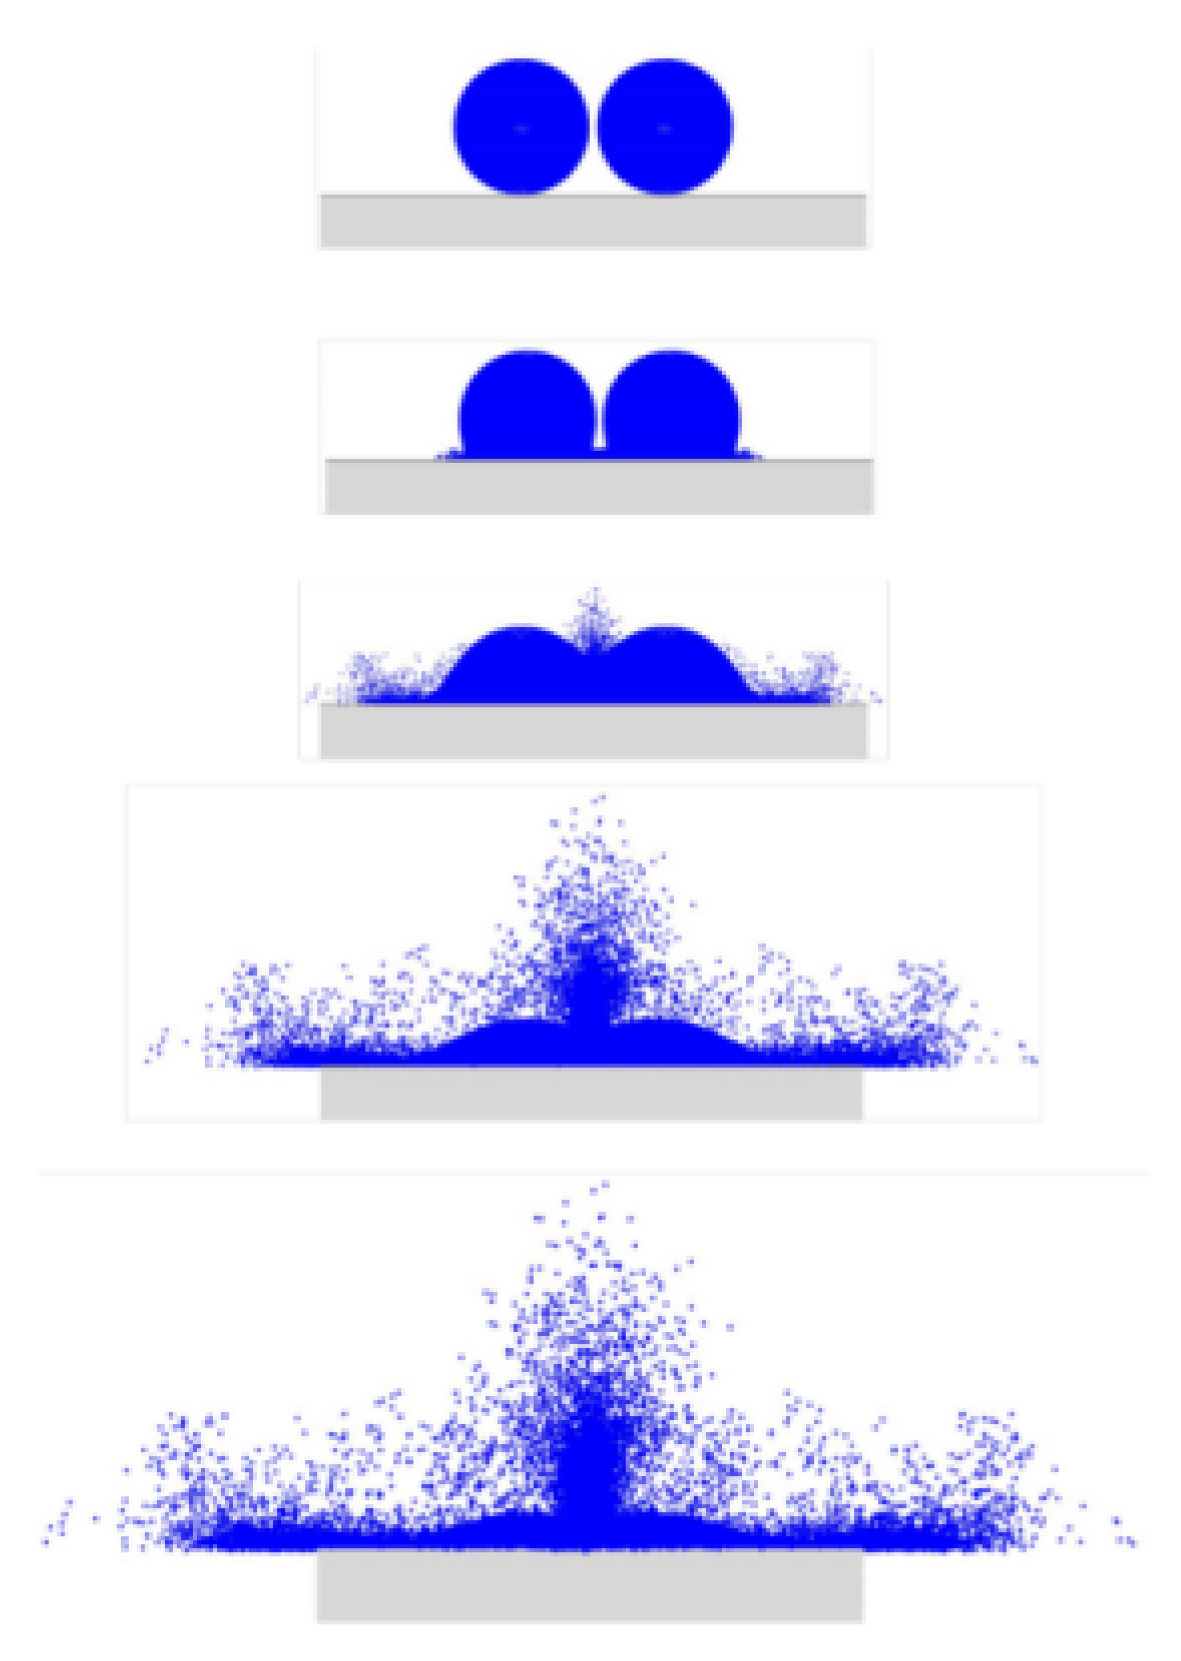
To provide a simplified verification of the mutual interference between the two jets, a finite element model of twin droplet coupled impact on a flat plate was also established based on ABAQUS. The morphological evolution of droplets during twin droplets coupled impact is shown in Figure 21. When the lateral outflow jets of the two droplets form simultaneously, opposing flows occur on their adjacent sides, creating mutual obstruction that potentially hinders the erosion expansion on the right semicircle of the left erosion crater and on the left semicircle of the right erosion crater. This is evidenced in Figure 19c, where the left damage micrograph shows that relatively distinct circumferential cracks appear only on the left semicircle of the left impact crater. This indicates that the lateral jet generated by the left droplet was interfered with by the lateral jet of the droplet on its right side during impact, whereas the lateral jet on the left half of the left droplet remained undisturbed and continued to exert scouring and shearing action on the material surface, leading to the formation of circumferential cracks on the left semicircle. In addition, the double-droplet impact might cause superposition of stress waves propagating within the specimen, resulting in stress concentration in the region between the two impact points. The repeatedly applied stress concentration exceeding the material’s yield limit induces subsurface damage at a position biased to the right of the left impact point, thus giving rise to the “single-peak” profile curve shown in Figure 20.
It should be noted that the observed asymmetric crater morphology does not necessarily prove that lateral-flow obstruction or stress-wave superposition caused the damage. Other possible factors include unequal performance between the two nozzle outlets, arrival-time mismatch between the two jets, specimen orientation, or fixture asymmetry. In the absence of high-speed images capturing the actual twin pulsed jet impact and lateral-flow collision, or a validated numerical model showing the stress field evolution, the above interpretations are proposed only as plausible mechanisms and require further investigation for confirmation.

4. Conclusions

Based on the continuous jet rain erosion test system, this paper conducted three types of tests—single pulsed jet impact, continuous single pulsed jet impact and continuous twin pulsed jet coupled impact—on aviation-oriented PMMA. By employing high-speed photography, optical microscopy, optical profilometer and CT, the damage morphology evolution, volume loss, damage area, and erosion crater profile characteristics of oriented PMMA were systematically investigated. The following main conclusions are drawn:
(1)
The single pulsed jet impact tests show that with increasing impact velocity (210 m/s → 335 m/s), the surface damage of oriented PMMA gradually evolves from slight annular crazing to a typical morphology of “central undamaged region surrounded by extensive annular crazing”. At a velocity of 335 m/s, the central region experiences slight indentation under water-hammer pressure, while Rayleigh wave propagation induces subsurface crazing in the peripheral zone.
(2)
Continuous single pulsed jet impact tests yielded erosion curves of oriented PMMA at different impact velocities (239 m/s and 335 m/s). Higher impact velocity leads to a shorter incubation period and faster growth in volume loss and damage area. At 335 m/s, significant material spallation initiates after only 10 impacts, whereas at 239 m/s it requires approximately 25 impacts. The erosion crater profile exhibits a “two valleys and one peak” morphology: the central protrusion results from repeated compression by water-hammer pressure, while the depressions on both sides are caused by scouring from high-speed lateral outflow jetting (which, according to simulation, can reach approximately three times the impact velocity).
(3)
The continuous twin pulsed jet coupled impact tests reveal damage patterns distinctly different from those of single pulsed jet impacts. Under the action of two synchronised jets generated by the two-orifice nozzle, the left-side erosion crater exhibits obvious circumferential cracks only on its left semicircle, while the right semicircle shows less damage due to mutual hindrance of lateral jets from the adjacent impact. The left-side erosion crater cross-section displays an asymmetric “single-peak” morphology, with greater erosion depth on the right side. This might be attributed to the mutual interference of lateral jets on the adjacent sides during twin pulsed jet impact, combined with stress wave superposition within the specimen, which induces stress concentration in the region between the two impact points. These results validate the feasibility of the twin pulsed jet coupled impact test method established in this study and provide an experimental basis for subsequent research on multi-jet coupled impact. Furthermore, laboratory simulation of continuous twin pulsed jet coupled impact has been successfully achieved, providing a new experimental approach for studying material damage under multi-jet interactions.

Author Contributions

Conceptualization, Y.F.; methodology, Q.D.; software, Y.F. and Z.S.; investigation, Y.F. and Z.S.; resources, Q.D. and T.S.; data curation, Y.F. and G.L.; writing—original draft preparation, Y.F.; writing—review and editing, Q.D.; project administration, T.S. All authors have read and agreed to the published version of the manuscript.

Funding

This research was funded by the National Natural Science Foundation of China, grant number [12272307].

Data Availability Statement

The original contributions presented in the study are included in the article; further inquiries can be directed to the corresponding author.

Conflicts of Interest

The authors declare no conflicts of interest.

Abbreviations

The following abbreviations are used in this manuscript:
PMMApolymethyl methacrylate
CTcomputed tomography
SIJAsingle impact jet apparatus
PJETpulsating jet erosion test
MIJAmulti-impact jet apparatus
HSJEThigh-speed waterjet erosion test
CFRPcarbon fibre reinforced polymer
SPHSmoothed Particle Hydrodynamics

References

  1. Burson-Thomas, C.B.; Wellman, R.; Harvey, T.J.; Wood, R.J.K. Water droplet erosion of aeroengine fan blades: The importance of form. Wear 2019, 426–427, 507–517. [Google Scholar] [CrossRef] [Scilit]
  2. Adler, W.F. Rain impact retrospective and vision for the future. Wear 1999, 233, 25–38. [Google Scholar] [CrossRef] [Scilit]
  3. Sha, M.; Sun, Y.; Li, Y.; Liu, Y.; Li, Y. Dynamic Experimental Study on Damage Behaviors of Aircraft Envelope Coating Under the Impact of High-Speed Raindrops. Explos. Shock Waves 2023, 43, 92–105. [Google Scholar] [CrossRef]
  4. Schmitt, G.F. Flight Test-Whirling Arm Correlation of Rain Erosion Resistance of Materials; Technical Report AFML-TR-68-138; Air Force Materials Laboratory, Wright-Patterson AFB: Dayton, OH, USA, 1968. [Google Scholar]
  5. Minto, D. The Holloman High Speed Test Track Hypersonic Upgrade Program. In Proceedings of the 22nd AIAA Aerodynamic Measurement Technology and Ground Testing Conference, St. Louis, MO, USA, 24–26 June 2002. [Google Scholar] [CrossRef] [Scilit]
  6. Minto, D. Recent increases in hypersonic test capabilities at the Holloman High Speed Test Track. In Proceedings of the 38th Aerospace Sciences Meeting and Exhibit, Reno, NV, USA, 10–13 January 2000. [Google Scholar] [CrossRef] [Scilit]
  7. Robertson, R.M.; Lobisser, R.J.; Stein, R.E. High Speed Rain Abrasion of Glass Cloth Laminates. Ind. Eng. Chem. 1946, 38, 590–591. [Google Scholar] [CrossRef] [Scilit]
  8. Anderson, K.; Karimi, S.; Shirazi, S. Development of Droplet Erosion Testing Facility. In Proceedings of the ASME 2022 Fluids Engineering Division Summer Meeting, Toronto, ON, Canada, 15–17 August 2022. [Google Scholar] [CrossRef] [Scilit]
  9. Hand, R.J.; Field, J.E.; Townsend, D. The use of liquid jets to simulate angled drop impact. J. Appl. Phys. 1991, 70, 7111–7118. [Google Scholar] [CrossRef] [Scilit]
  10. Obara, T.; Bourne, N.K.; Field, J.E. Liquid-jet impact on liquid and solid surfaces. Wear 1995, 186, 388–394. [Google Scholar] [CrossRef] [Scilit]
  11. Field, J.E.; Lesser, M.B. On the mechanics of high speed liquid jets. Proc. R. Soc. Lond. A Math. Phys. Sci. 1977, 357, 143–162. [Google Scholar] [CrossRef] [Scilit]
  12. Field, J.E.; Seward, C.R.; Pickles, C.S.J.; Coad, E.J. Studies of Rain Erosion Mechanisms in a Range of IR Transmitting Ceramics—Including Coated Samples; Technical Report; Cavendish Laboratory, University of Cambridge: Cambridge, UK, 1994. [Google Scholar]
  13. Bowden, F.P.; Brunton, J.H. The deformation of solids by liquid impact at supersonic speeds. Proc. R. Soc. Lond. Ser. A Math. Phys. Sci. 1961, 263, 433–450. [Google Scholar] [CrossRef] [Scilit]
  14. Brunton, J.H.; Field, J.E. The physics of Impact and Deformation: Single impact. Philos. Trans. R. Soc. Lond. Ser. A Math. Phys. Sci. 1966, 260, 79–85. [Google Scholar] [CrossRef] [Scilit]
  15. Tobin, E.F.; Young, T.M.; Raps, D.; Rohr, O. Comparison of liquid impingement results from whirling arm and water-jet rain erosion test facilities. Wear 2011, 271, 2625–2631. [Google Scholar] [CrossRef] [Scilit]
  16. Seward, C.R.; Pickles, C.S.J.; Field, J.E. Single and multiple impact jet apparatus and results. In Window and Dome Technologies and Materials II; SPIE: San Diego, CA, USA, 1990; Volume 1326, pp. 280–290. [Google Scholar] [CrossRef] [Scilit]
  17. Kumar, A.; Hou, X.; Choi, K.-S. A novel high-speed waterjet erosion test rig: Development, characterization, and calibration with industry standard. Wear 2026, 597, 206736. [Google Scholar] [CrossRef] [Scilit]
  18. Gui, Y.Q. Rain Erosion of Polyurethane Coatings for Wind Turbine Blades. Master’s Thesis, Wuhan University of Technology, Wuhan, China, 2019. [Google Scholar]
  19. Wang, X.; Xu, J.; Hou, N.; Li, Y. Damage behavior of aeronautical perspex (PMMA) under high-velocity water jet impact. Acta Aeronaut. Astronaut. Sin. 2022, 43, 226067. [Google Scholar] [CrossRef]
  20. Gohardani, O.; Williamson, D.M.; Hammond, D.W. Multiple liquid impacts on polymeric matrix composites reinforced with carbon nanotubes. Wear 2012, 294–295, 336–346. [Google Scholar] [CrossRef] [Scilit]
  21. Jackson, M.J.; Field, J.E. Liquid impact erosion of single-crystal magnesium oxide. Wear 1999, 233, 39–50. [Google Scholar] [CrossRef] [Scilit]
  22. Coto, B.; Hallander, P.; Mendizabal, L.; Pagano, F.; Kling, H.; Ortiz, R. Particle and rain erosion mechanisms on Ti/TiN multilayer PVD coatings for carbon fibre reinforced polymer substrates protection. Wear 2021, 466–467, 203562. [Google Scholar] [CrossRef] [Scilit]
  23. Hou, N.D.; Wang, X.; Li, Y.L. High-speed raindrop impingement damage of composites based on single waterjet impact tests. Explos. Shock Waves 2021, 41, 66–78. [Google Scholar] [CrossRef]
  24. Sha, M.; Hui, Z.; Li, Y.; Sun, Y.; Li, M.; Wei, Z.; Arseny, B.; Gregory, F.; Aleksei, M.; Aleksandr, T.; et al. Evaluation and Mechanism of Highly Dynamic Rain Corrosion Damage to Aircraft Windward Side Skin Coatings. Surf. Technol. 2026, 55, 1–14. [Google Scholar] [CrossRef]
  25. Valentin, C.A.; Sista, H.; Kumar, A.; Samad, A.; Hu, H.; Hu, H. An Experimental Study on the Rain-Erosion Characteristics of Anti-Icing Coatings Used for UAV Inflight Icing Mitigation. In Proceedings of the AIAA SCITECH 2025 Forum, Orlando, FL, USA, 6–10 January 2025. [Google Scholar] [CrossRef] [Scilit]
  26. Zhang, Z.L. Design Theory and Application for Transparency of Aircraft Canopy. Ph.D. Thesis, Nanjing University of Aeronautics and Astronautics, Nanjing, China, 2005. [Google Scholar]
  27. ASTM G73-10; Standard Test Method for Liquid Impingement Erosion Using Rotating Apparatus. ASTM International: West Conshohocken, PA, USA, 2010.
  28. Gujba, A.K.; Hackel, L.; Kevorkov, D.; Medraj, M. Water droplet erosion behaviour of Ti-6Al-4V and mechanisms of material damage at the early and advanced stages. Wear 2016, 358–359, 109–122. [Google Scholar] [CrossRef] [Scilit]
  29. Guo, W.G.; Li, Y.L.; Suo, T. A Concise Course on Fundamentals of Stress Waves; Northwestern Polytechnical University Press: Xi’an, China, 2007. [Google Scholar]
Figure 1. Schematic diagram of the principle of jet generation.
Aerospace 13 00756 g001
Figure 2. Structural diagram of the two-orifice nozzle.
Aerospace 13 00756 g002
Figure 3. Schematic diagram of the reciprocating mechanism: (a) isometric view of the reciprocating mechanism; (b) side view of the reciprocating mechanism.
Aerospace 13 00756 g003
Figure 4. Continuous jet rain erosion test system: (a) schematic diagram (position ① is shown in Figure 5); (b) photograph of the actual system.
Aerospace 13 00756 g004
Figure 5. Enlarged view of position ① of the test system.
Aerospace 13 00756 g005
Figure 6. Photograph of the oriented PMMA specimen.
Aerospace 13 00756 g006
Figure 7. Morphological evolution of a single jet (captured by a high-speed camera at sequential moments ①–⑥).
Aerospace 13 00756 g007
Figure 8. Morphological evolution of multiple jets (captured by a high-speed camera at sequential moments ①–⑥).
Aerospace 13 00756 g008
Figure 9. Damage micrographs of a single impact by the continuous jet rain erosion test system (①: central undamaged region; ②: annular crazing damage): (a) v = 210 m/s; (b) v = 316 m/s; (c) v = 335 m/s.
Aerospace 13 00756 g009
Figure 10. Damage micrograph of a single impact by the single impact jet apparatus (SIJA) (①: central undamaged region; ②: annular crazing damage) [19].
Aerospace 13 00756 g010
Figure 11. Erosion curves of the specimen under continuous impact at 239 m/s: (a) volume loss curve; (b) damage area curve.
Aerospace 13 00756 g011
Figure 12. Erosion curves of the specimen under continuous impact at 335 m/s: (a) volume loss curve; (b) damage area curve.
Aerospace 13 00756 g012
Figure 13. Micrographs of damage to specimens subjected to multiple impacts by the continuous jet rain erosion test system (v = 335 m/s): (a) N = 1; (b) N = 2; (c) N = 5; (d) N = 10 (The red ovals indicate the locations where ring cracks appear).
Aerospace 13 00756 g013
Figure 14. CT scanning results of the erosion crater at v = 335 m/s and N = 40: (a) three-dimensional morphological reconstruction of the erosion crater; (b) cross-sectional profile of the erosion crater. (Line 1 indicates the location where the cross-sectional profile was extracted.).
Aerospace 13 00756 g014
Figure 15. Cross-sectional profile curves of the erosion craters (continuous single pulsed jet impact, v = 335 m/s).
Aerospace 13 00756 g015
Figure 16. Schematic diagram of the liquid-solid impact process: (a) initial compression stage; (b) release stage.
Aerospace 13 00756 g016
Figure 17. Velocity contour of lateral jet spreading during pulsed jet impact: V (mm/s) and V2 (mm/s) are the particle velocities in the X and Y directions, respectively.
Aerospace 13 00756 g017
Figure 18. Displacement-velocity curves of lateral jet particles: U2 (mm) is the particle displacement in the Y direction, and V2 (mm/s) is the particle velocity in the Y direction.
Aerospace 13 00756 g018
Figure 19. Micrographs of continuous twin pulsed jet coupled impact (left-damage morphology micrograph; right-quantification of the circumscribed circle radius of the erosion damage region): (a) N = 5; (b) N = 20; (c) N = 200 (The red ovals indicate the locations where ring cracks appear; Line 1 indicates the location where the cross-sectional profile was extracted.).
Aerospace 13 00756 g019
Figure 20. Cross-sectional profile of the erosion crater (twin pulsed jet impact, v = 330 m/s).
Aerospace 13 00756 g020
Figure 21. Schematic diagram of the twin droplet coupled impact process.
Aerospace 13 00756 g021
Table 1. Macroscopic mechanical and surface properties of oriented PMMA.
Property CategoryPropertyValue
Macroscopic mechanicalTensile strength, MPa90
Elastic modulus, GPa3.17
Unnotched impact strength, kJ/mm229.8
Fracture toughness, MN/m3/23.37
SurfaceIndentation modulus, GPa4.347 ± 0.03
Indentation hardness, GPa0.222 ± 0.002
Recovery rate, %44.81 ± 0.14
Scratch depth, nm434.89 ± 0.81
Average surface roughness, nm1.09–3.36
Table 2. Parameter table of the two jets at L = 10.1 mm.
Jet PositionJet Velocity (m/s)Jet Diameter (mm)
Left351.54.72
Right359.84.72
Table 3. Complete experimental matrix.
Test TypeVelocity (m/s)Diameter (mm)Number of ImpactsFrequency (Hz)Replicates *
Single pulsed jet impact test2104.741-3
3164.741-3
3354.741-3
Continuous single pulsed jet impact test2394.741, 2, 5, 10, 25, 50, 70, 80, 100, 130, 200, 4501/63
3354.741, 2, 5, 10, 25, 40, 50, 130, 200, 2501/63
Continuous twin pulsed jet coupled impact test3304.95, 20, 40, 100, 200, 2501/63
* Replicates indicate the number of repeated tests performed at each specified number of impacts.
Disclaimer/Publisher’s Note: The statements, opinions and data contained in all publications are solely those of the individual author(s) and contributor(s) and not of MDPI and/or the editor(s). MDPI and/or the editor(s) disclaim responsibility for any injury to people or property resulting from any ideas, methods, instructions or products referred to in the content.