Article

Development of a Filter Selection System for a Four-Band SWIR Optical Payload for an Earth Remote Sensing Nanosatellite


by
Ainur Zhetpisbayeva
1,2,
Samal Kaliyeva
1,*,
Berik Zhumazhanov
2,
Almira Mukhamejanova
3,
Ainur Satpayeva
1 and
Adil Olzhabayev
2
1
Department of Radio Engineering, Electronics and Telecommunications, Institute of Physical and Technical Sciences, L.N. Gumilyov Eurasian National University, Satpayev St. 2, Astana 010000, Kazakhstan
2
Ghalam LLP, Astana 010000, Kazakhstan
3
Department of Telecommunication Engineering, Almaty University of Power Engineering and Telecommunications Named After Gumarbek Daukeyev, Almaty 050013, Kazakhstan
*
Author to whom correspondence should be addressed.
Aerospace 2026, 13(8), 665; https://doi.org/10.3390/aerospace13080665
Submission received: 24 May 2026 / Revised: 2 July 2026 / Accepted: 23 July 2026 / Published: 24 July 2026
(This article belongs to the Special Issue Spacecraft Close-Proximity Operations)

Abstract

Short-Wave Infrared (SWIR) remote sensing plays a significant role in environmental monitoring, agricultural analysis, and nanosatellite-based Earth observation applications. Existing remote sensing frameworks suffer from limitations such as inefficient spectral band selection, high computational complexity, and lack of intelligent optimization techniques for compact nanosatellite payload systems. This study aims to develop an intelligent filter selection system for a four-band SWIR optical payload using multispectral satellite imagery and deep learning (DL)-based optimization techniques. The proposed framework focuses on improving spectral feature extraction, environmental condition classification, and nanosatellite payload efficiency. A multispectral field image dataset was utilized for experimental analysis, where preprocessing techniques, including atmospheric correction and Z-score normalization, were applied. Mutual Information (MI)-based optimal band selection and SWIR filter mapping were performed to identify the significant spectral bands B05, B08, B11, and B12. Feature extraction was conducted using raw SWIR band values and spectral band ratios. A Vision Transformer (ViT) model was employed for environmental condition classification while the Whale Optimization Algorithm (WOA) was integrated to optimize model parameters and improve convergence performance. The proposed ViT–WOA framework achieved superior classification performance with 96.93% accuracy, 97.19% precision, 96.93% recall, 96.92% F1-score. and a Kappa coefficient of 0.9540. The framework effectively classified cloudy, rainy, and sunny environmental conditions with reduced classification loss and improved spectral feature learning efficiency. The proposed system demonstrated reliable SWIR spectral analysis and intelligent payload optimization for nanosatellite remote sensing applications. The integration of transformer-based learning and metaheuristic optimization provided an effective solution for efficient Earth observation and environmental monitoring systems.

1. Introduction

Earth observation systems are now indispensable for use in environmental monitoring, agricultural management, disaster assessment, and climate analysis, etc. [1]. High quality, compact, efficient, and low-power remote sensing payloads for spectral information collection are becoming more and more necessary due to the ongoing development of satellite imaging technologies [2]. SWIR imaging has emerged in recent years as a critical and important technique among various spectral imaging systems, owing to its sensitivity to detecting material composition, moisture content, vegetation health, and land surface characteristics that are superior to that of conventional visible imaging systems [3]. There is also better penetration of the clouds and better spectral discrimination in SWIR imaging [4]. These features make SWIR technology well suited for Earth observation nanosatellite missions [5].
Nanosatellites and CubeSats have recently gained recognition as more affordable solutions compared to traditional big satellite systems in remote sensing applications [6]. Since nanosatellites have relatively low weight, cost, and deployment time, they are widely employed for real-time observation and multispectral imaging applications [7]. One of the most difficult problems associated with using nanosatellites is integrating multispectral payload systems due to the high size, power, computing, and memory constraints [8]. Multispectral imaging systems produce huge volumes of spectral data, requiring the choice of a limited number of spectral bands in order to optimize the image production process [9]. This implies that the design of compact and efficient SWIR payload systems has become an important field of study in contemporary satellite imagery [10].
Various traditional Machine Learning (ML) techniques like Logistic Regression (LR), K-Nearest Neighbor (KNN), XGBoost, Random Forest (RF), and Support Vector Machine (SVM) can be considered for the application of multispectral image classification. The LR technique is fast and straightforward but unable to deal with non-linear spectral information [11]. The KNN technique is quite straightforward to apply but not computationally cost-effective for big datasets [12]. The XGBoost technique ensures higher accuracy and feature handling but demands sophisticated tuning [13]. The RF technique is robust and avoids overfitting, but it generates redundant decision trees [14]. The SVM algorithm is effective on small training datasets and high-dimensional features but less effective with larger datasets [15]. These methods are effective but have limitations in capturing complex spectral dependencies for nanosatellite SWIR payload optimization.
The proposed framework develops an intelligent four-band SWIR optical payload selection system for Earth remote sensing nanosatellites using multispectral field images. Preprocessing techniques such as atmospheric correction and Z-score normalization are applied to improve image quality. Region of Interest (ROI) selection and spectral signature analysis is then performed to identify important field regions. Mutual Information (MI)-based feature selection is utilized to determine the most informative spectral bands for optimal payload design. Spectral band matching and Relative Spectral Response (RSR) analysis are employed for SWIR filter mapping. Feature extraction is performed using selected SWIR band values and spectral band ratios. A ViT model is used for multispectral image classification, while the WOA optimizes model parameters. Classification performance is evaluated using accuracy, precision, recall, F1-score, and Kappa coefficient metrics. The scope of this study is limited to data-driven spectral band selection, SWIR filter mapping, and environmental condition classification using multispectral imagery. The proposed framework does not address complete system-level optical payload engineering aspects, such as optical design, detector selection, signal-to-noise ratio, or radiometric calibration. Accordingly, the present work should be regarded as a task-oriented spectral band selection and classification framework that informs the SWIR filter selection process for a four-band nanosatellite payload, rather than a comprehensive optical payload development methodology.
Objectives
  • Develop an intelligent four-band SWIR optical payload filter selection system for Earth remote sensing nanosatellites with improved spectral efficiency and classification performance.
  • Utilize multispectral field images obtained from the Kaggle multispectral field images dataset for spectral analysis, band selection, and land classification tasks.
  • Apply MI-based optimal band selection and SWIR filter mapping techniques for identifying the most informative spectral bands and reducing redundant spectral information.
  • Implement a ViT-based classification model with WOA-based optimization for accurate multispectral image classification and enhanced nanosatellite payload performance.
Section 1 presents the introduction, objectives, and significance of the proposed four-band SWIR optical payload system. Section 2 discusses the literature survey related to multispectral imaging, spectral band selection, and remote sensing techniques. Section 3 explains the proposed methodology, including preprocessing, ROI selection, MI-based band selection, SWIR filter mapping, ViT classification, and WOA optimization. Section 4 presents the experimental results, performance evaluation, and comparative analysis. Section 5 concludes the research and discusses future enhancements of the proposed framework.

2. Literature Survey

In 2024, Colodro-Conde [16] developed a medium-resolution Earth observation sensor framework for nanosatellite applications using sensor simulation and imaging estimation techniques. The study achieved improved imaging quality and reliable Earth observation performance. Intelligent SWIR spectral band selection was not incorporated. In 2025, Fevgas et al. [17] introduced a remote sensing and propulsion framework for Earth observation nanosatellites using propulsion integration and communication techniques. The framework improved mission flexibility and operational efficiency. Multispectral SWIR payload optimization was not addressed. In 2024, Najafabadi and Kazemi [18] introduced a very-high-resolution optical payload design framework using payload modeling and optimization techniques. The study achieved enhanced imaging resolution and payload efficiency. The framework increased computational complexity for nanosatellite systems. In 2025, Abdizhalilova et al. [19] developed a nanosatellite mission evaluation framework using statistical payload analysis and mission assessment methods. The framework achieved reliable mission comparison performance. Intelligent spectral image analysis methods were not included.
In 2024, Rodríguez-Molina et al. [20] developed a low-cost multispectral CubeSat framework for marine monitoring using CubeSat payload integration techniques. The framework achieved cost-effective multispectral observation performance. Advanced SWIR spectral optimization was not implemented. In 2024, Ustin and Middleton [21] analyzed Earth observation satellites and imaging payload systems for environmental monitoring applications. The framework provided comprehensive analysis of satellite sensor technologies and applications. Intelligent nanosatellite SWIR payload optimization was not proposed. In 2024, Meoni et al. [22] suggested an onboard AI framework for multispectral Earth observation imagery using DL-based processing techniques. The framework improved onboard image processing efficiency and reduced transmission requirements. High computational requirements limited nanosatellite implementation. In 2024, Chanoui et al. [23] developed an optimization framework for nanosatellite Earth observation missions using orbital optimization and cloud detection preprocessing techniques. The framework achieved enhanced global observation coverage and mission planning performance. Multispectral SWIR payload analysis was not addressed.
In 2024, Wu et al. (2024) [24] introduced a satellite position and attitude estimation framework using infrared Earth sensing techniques. The framework achieved accurate satellite positioning and attitude estimation performance. Multispectral image classification and spectral optimization methods were not included. In 2023, Pavlović et al. [25] developed a SWIR imaging-based object tracking framework using correlation and Kalman filtering techniques. The framework achieved robust and stable object tracking performance in SWIR environments. Spectral band selection and nanosatellite payload optimization were not addressed. In 2025, Bessonov et al. [26] introduced an all-weather drone vision framework using passive SWIR imaging techniques. The framework achieved improved visibility and object detection performance under fog and rain conditions. The system was not designed for nanosatellite multispectral payload optimization. In 2025, Rao et al. [27] developed a radar imaging framework for Earth resource monitoring using a C-band synthetic aperture radar system. The study achieved efficient large-scale Earth observation and environmental monitoring performance. SWIR spectral band optimization for nanosatellite payload systems was not addressed. In 2024, Muir et al. [28] analyzed VedgeSat, an automated toolkit for coastal change monitoring using satellite-derived vegetation edge analysis. The framework achieved accurate coastal vegetation monitoring and environmental assessment performance. Multispectral SWIR payload optimization techniques were not incorporated. Sun and Du [29] presented a comprehensive review of hyperspectral band selection techniques, categorizing existing approaches into ranking-based, search-based, clustering-based, sparsity-based, embedding learning-based, and hybrid methods. The review provided valuable insights into band selection strategies but did not address SWIR payload-specific filter mapping or nanosatellite implementation constraints. Table 1 shows a comparison of the existing methods.

Problem Statement

The existing frameworks in earth observation and remote sensing nanosatellites have some shortcomings that limit the efficiency of multispectral SWIR payload systems. Most of the frameworks do not optimize the SWIR bands [16], multispectral payload [17], and spectral image classification. Some frameworks are also computationally complex [18] and have high on-board processing requirements [22], which makes them incompatible with lightweight nanosatellite payloads [26]. The current framework does not consider spectral classification, transformer feature learning, and payload optimization for remote sensing purposes [25,30]. The lack of intelligent SWIR spectral classification and payload optimization mechanisms further reduces the efficiency of the classification process. To address such challenges, the proposed framework employs a four-band SWIR optical payload selection mechanism based on MI-based band selection, ViT classification, and WOA optimization. The proposed approach is intended as a spectral band selection and classification framework that supports SWIR filter selection decisions, rather than a full payload hardware development methodology.

3. Proposed Methodology

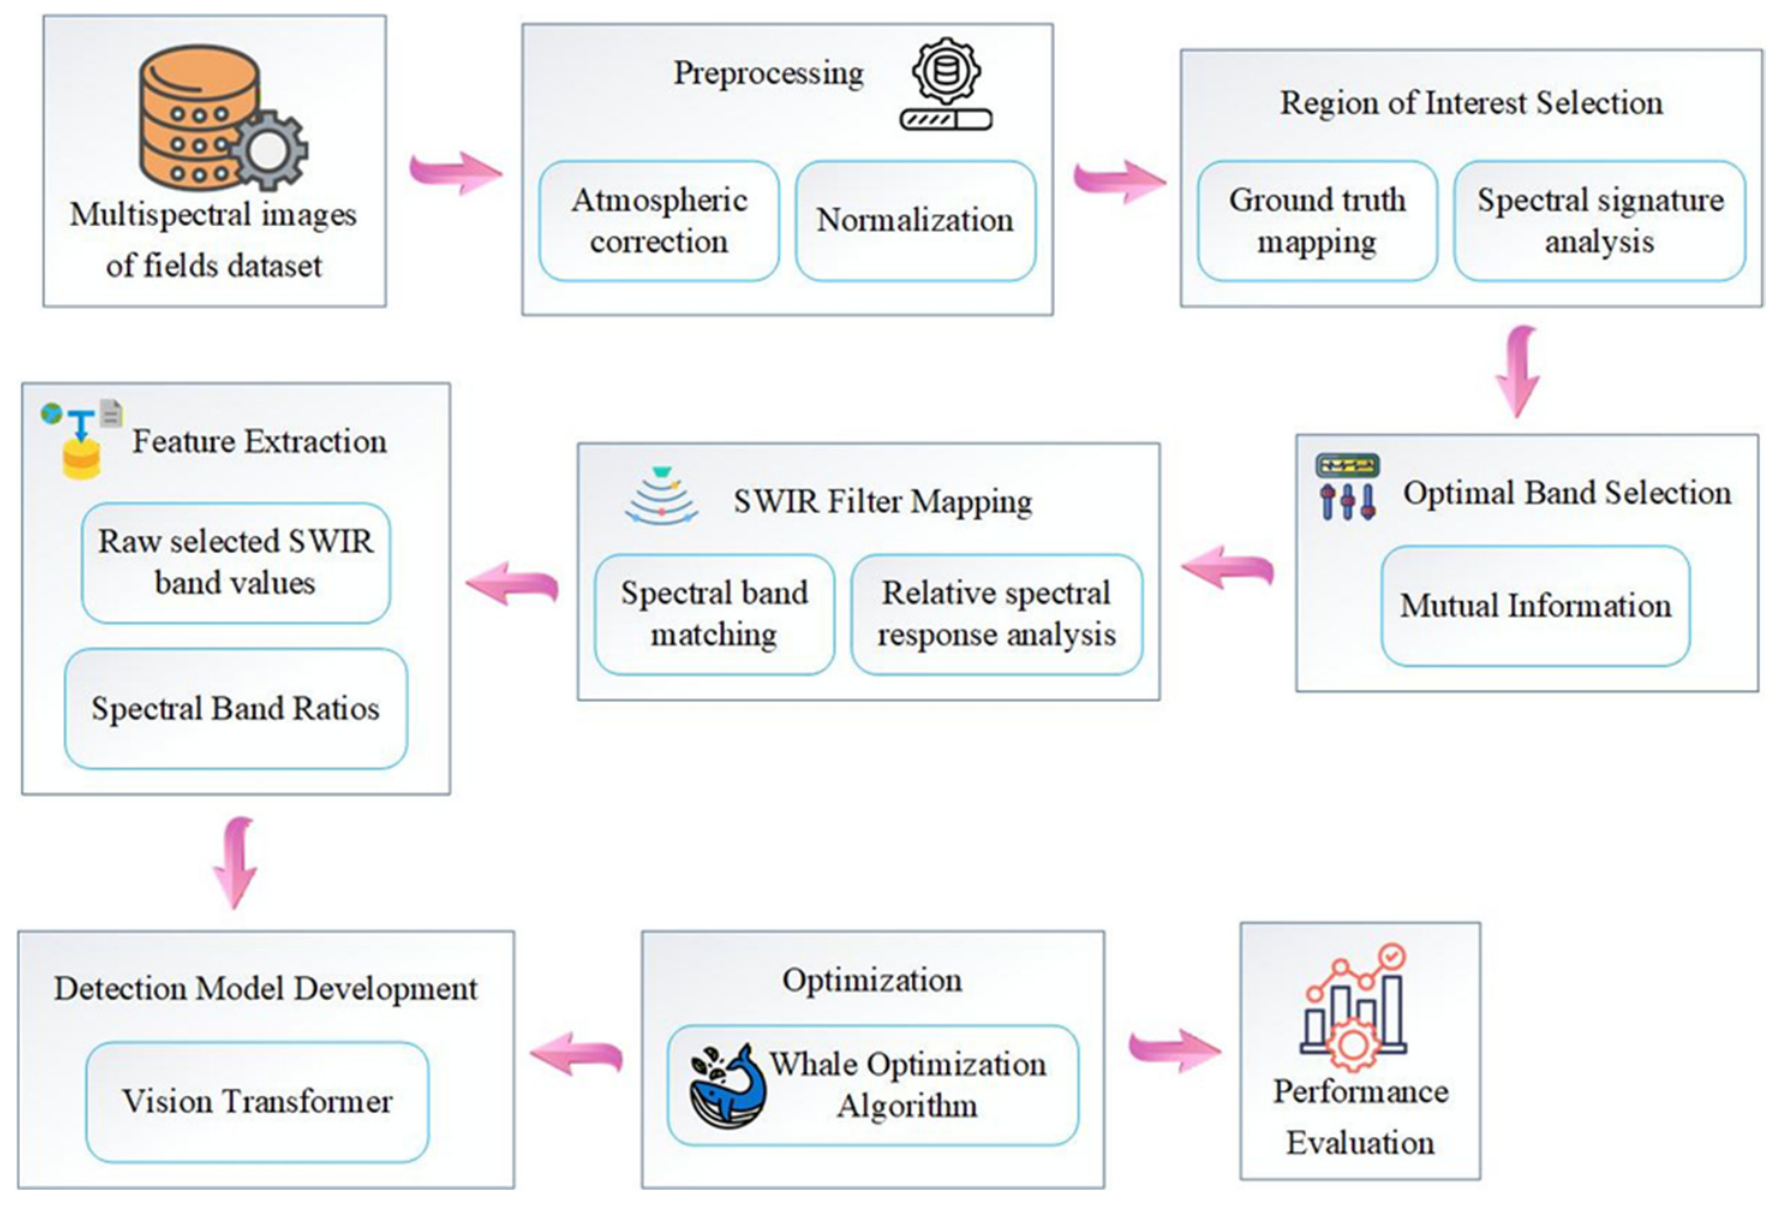
The proposed methodology emphasizes computational spectral band selection and classification for supporting SWIR payload configuration. The optical payload is represented through the selection of informative spectral bands and corresponding filter mapping, while detailed optical hardware implementation remains outside the scope of this study. The four-band SWIR optical payload is started by taking a multispectral field image dataset for Earth remote sensing analysis. Atmospheric correction and normalization processes are implemented to improve the quality of the images and eliminate inconsistencies among them. Following the ROI extraction process based on ground truth mapping and signature analysis, the MI-based optimal band selection is executed to find the most representative SWIR bands. Spectral band filtering is achieved by implementing SWIR filter mapping using spectral band matching and RSR analysis. The features are extracted using SWIR band values and the ratios. ViT-based classification, WOA-based optimization, and performance evaluation are carried out. Figure 1 shows the overall proposed methodology.

3.1. Dataset Description

The presented approach employs the Multispectral Images of Fields Dataset [31] obtained from the Satellite imagery of the Sentinel-2 L2A mission, which is intended to conduct Earth remote sensing. It involves multiple images in JSON format with 13 spectral bands that include visible light, as well as NIR and SWIR bands, namely B11 and B12. The presented images have spectral data that relate to vegetation, soil, moisture, and other attributes of the land. The Multispectral Images of Fields Dataset includes geographic coordinates, weather conditions, and cloud coverage. For the presented approach, B05, B08, B11, and B12 bands are used for four-band SWIR payload design and land classification purposes. The dataset is separated into the training and testing subsets in an 80:20 ratio. The complete dataset comprises 2700 multispectral field image samples derived from Sentinel-2 L2A imagery and contains 13 spectral bands per sample. Of these, four bands (B05, B08, B11, and B12) were retained for the proposed four-band SWIR payload configuration. The dataset was divided using an 80:20 stratified split, yielding 2160 training samples and 540 testing samples across the three environmental classes (cloudy, rainy, and sunny), consistent with the class-wise distribution shown in Table 2. A fixed random seed of 42 was used throughout to ensure reproducibility of the split and subsequent experiments.
The four selected spectral bands used in the proposed SWIR nanosatellite framework are shown in Table 3. B05 (Red Edge, ~705 nm) is mainly used for vegetation health analysis, while B08 (NIR, ~842 nm) supports crop and land monitoring. The SWIR bands B11 (~1610 nm) and B12 (~2190 nm) are utilized for moisture analysis, soil monitoring, mineral identification, and vegetation stress detection. These bands provide important spectral information for effective environmental condition classification and optimal payload design.
Validation in the present study was performed using Sentinel-2 L2A multispectral reflectance imagery as a simulation proxy for a real nanosatellite SWIR payload, rather than flight-validated sensor data. This represents a constraint of the current work, which was performed using Sentinel-2 L2A multispectral reflectance imagery as a simulation proxy for a real nanosatellite SWIR payload, since no flight-validated CubeSat-class SWIR dataset currently exists for the selected B05, B08, B11, and B12 configuration. Notable differences exist between Sentinel-2 and an actual SWaP-constrained nanosatellite sensor: coarser spatial resolution; lower SNR from compact InGaAs detectors versus Sentinel-2’s large-aperture; calibrated optics; wider and less precise spectral passbands versus Sentinel-2’s narrow RSR curves; and reduced atmospheric correction fidelity compared to Sentinel-2’s Sen2Cor-processed L2A product. A direct empirical comparison was not feasible due to the absence of real onboard data; therefore, the reported accuracy should be regarded as an upper-bound estimate. Future work will incorporate sensor-noise-injected simulations and correlation analysis against ground-based or airborne SWIR sensor measurements to quantify the expected real-world performance gap.

3.2. Data Preprocessing

Preprocessing helps in enhancing the quality of multispectral images before the spectral analysis and classification. Atmospheric correction and Z-score normalizations have been carried out in the proposed scheme so as to minimize noise and atmospheric disturbances in the spectral bands. Preprocessing was applied consistently across the full sample set through two stages: atmospheric correction to remove scattering, absorption, and illumination artifacts, and Z-score normalization to standardize pixel values. To prevent information leakage between partitions, normalization parameters were estimated exclusively from the training samples and subsequently applied to the testing samples, rather than being computed across the combined dataset.

3.2.1. Atmospheric Correction

Atmospheric correction can be used to remove any atmospheric interferences, including scattering, absorption, and illumination effects, present in multispectral satellite images. Atmospheric correction results in transformed reflectance values that are called surface reflectance values. Atmospheric correction helps in enhancing the quality of images as well as consistency in spectra, and further minimizes the effect of environmental noise. The implementation of atmospheric correction also assists in improving the feature extraction and classification capabilities of the proposed nanosatellite payload system. Atmospheric correction represents Equation (1):
R c = R r R a T
where R c indicates the corrected reflectance, R r indicates the raw reflectance value, R a indicates the atmospheric reflectance, and T indicates the atmospheric transmission factor.

3.2.2. Z-Score Normalization

Z-score normalization is conducted in order to standardize multispectral pixel value numbers to be within a certain numerical range that can be used for training a good model. This normalization involves converting the pixel value by subtracting its mean and dividing by its standard deviation in order to achieve normalized pixel values with zero mean and unity variance. The process helps to address the issue of scaling between features, speed up convergence, and enhance accuracy in classification. Z-score normalization also supports efficient multispectral feature learning and improves the robustness of the ViT classification model. Z-score normalization represents Equation (2):
Z = X μ σ
where Z indicates the normalized value, X indicates the original spectral value, μ indicates the mean of spectral values, and σ indicates the standard deviation.

3.3. Region of Interest Selection

The selection of the ROI plays an essential role in extracting significant regions from the multispectral image fields so that spectral processing can be conducted effectively. ROI selection facilitates extracting meaningful regions from the field such as vegetation, soil, moisture, and agricultural land while other unnecessary regions are ignored. Ground truth mapping is employed to classify and validate the selected regions by using the actual field condition. After the completion of ROI selection and labeling, spectral signature analysis is applied to each selected region to examine the reflectance of each region according to different spectral bands. This process improves feature extraction efficiency, enhances spectral discrimination, and increases classification accuracy in the proposed SWIR payload framework.

3.3.1. Ground Truth Mapping

Ground truth mapping is carried out to map significant land areas by using multispectral field images for remote sensing studies. Ground truthing involves linking pixels in an image to corresponding classes, such as vegetation, soils, and agricultural land, among others, using reference data. Ground truth mapping enhances the robustness of ROI selection and enables the correct classification of images using multispectral methods. It also enables the proposed framework to learn spectral features that define significant field areas and facilitate SWIR payload analysis. Ground truth mapping is calculated using Equation (3):
G T ( x , y ) = C i
where G T x , y indicates the ground truth label at the pixel location and C i   indicates the assigned class label.

3.3.2. Spectral Signature Analysis

The spectral signature analysis technique is used for analyzing the reflectance properties of various land areas within several spectral bands. Different materials like vegetation, soils, and water bodies show distinct spectral signatures that differentiate between land cover types. The spectral signature analysis technique assists in achieving better band optimization and increases the effectiveness of SWIR filter mapping in the suggested framework. The spectral signature analysis technique plays a significant role in facilitating feature extraction and classification. The spectral signature is calculated using Equation (4):
S ( λ ) = R ( λ ) I ( λ )
where S ( λ ) indicates the spectral signature, R ( λ ) indicates the reflected energy, I ( λ ) indicates the incident energy, and   λ indicates the wavelength band.

3.4. Optimal Band Selection Using Mutual Information

The selection of optimal bands is carried out to choose the best spectral bands from the multispectral satellite images for the efficient SWIR payload design. The MI technique is adopted as the feature selection strategy in the suggested approach to calculate the relationship between the spectral bands and the target classes, such as cloudy, rainy, and sunny environments. The spectral bands with higher Mutual Information scores hold greater relevance in the spectra and are thus included in the four-band SWIR payload setup. This process reduces redundant spectral features, decreases computational complexity, and improves classification accuracy in the ViT-based remote sensing framework. MI feature selection is calculated using Equation (5):
M I ( X ; Y ) = x X   y Y   p ( x , y ) l o g p ( x , y ) p ( x ) p ( y )
where M I X ; Y   indicates the MI between feature and class, p x , y   indicates the joint probability distribution, p x   a n d   p y   indicate marginal probability distributions, X indicates the spectral band feature, and Y indicates the target class label. The M I technique was selected for the proposed four-band SWIR payload design due to its model-independent, non-parametric nature, which suits the constrained onboard resources of nanosatellite systems, even though advanced strategies such as ranking-based, search-based, clustering-based, sparsity-based, embedding learning-based, and hybrid methods exist. Unlike search-based and embedding learning-based methods requiring iterative training, the M I technique directly quantifies statistical dependency between each band and the target class without assuming linearity, keeping it computationally lightweight for payload design. It also naturally fits the discrete four-band constraint by ranking bands individually, avoiding a subset search or clustering overhead, both of which are unsuitable for nanosatellite hardware limits.

3.5. SWIR Filter Mapping

The mapping of the SWIR filter is carried out to map the selected spectral bands to an appropriate SWIR wavelength range in order to design the nanosatellite payload. In the proposed approach, spectral band matching and RSR are utilized to select appropriate SWIR filters for maximizing the spectral information useful for categorizing environmental conditions. Spectral band matching involves matching the selected Sentinel-2 bands with appropriate SWIR wavelength ranges, whereas RSR measures the sensitivity of the response of each spectral filter. This process improves spectral discrimination capability, enhances payload efficiency, and supports accurate multispectral classification for cloudy, rainy, and sunny environmental conditions.

3.5.1. Spectral Band Matching

The band matching algorithm helps find the best spectral bands in the SWIR range by using multispectral satellite images due to wavelength similarity and spectral properties. The suggested approach involves selecting certain Sentinel-2 bands, such as B05, B08, B11, and B12, which are then compared to reference SWIR wavelength bands in order to define the best configuration of filters in the design of the nanosatellite payload. This ensures spectral conformity, improves feature discriminability, and facilitates environmental condition classification for cloudy, rainy, and sunny environments. Spectral band matching is calculated using Equation (6):
M b = a r g   m i n λ λ s λ r
where M b indicates the matched spectral band, λ s indicates the selected spectral wavelength, and λ r indicates the reference SWIR wavelength.

3.5.2. Relative Spectral Response Analysis

RSR analysis is carried out to examine the sensitivity of the spectral filter at various wavelengths in the SWIR spectral region. RSR analysis examines the efficiency at which the selected spectral bands respond to reflected radiation from environmental conditions. In the proposed technique, RSR analysis plays a vital role in examining the efficiency of the selected four-band SWIR payload design and increases spectral feature extraction efficiency. This analysis also enhances classification accuracy and supports optimized nanosatellite payload development. The RSR analysis is calculated using Equation (7):
R S R ( λ ) = S ( λ ) S m a x
where R S R ( λ ) indicates the Relative Spectral Response, S ( λ ) indicates the spectral sensitivity at wavelength λ , and S m a x     indicates the maximum spectral sensitivity value.

3.6. Feature Extraction

Feature extraction is carried out in order to derive spectral characteristics from the chosen SWIR bands to ensure proper classification of environmental conditions. Feature extraction is conducted using raw data from the four best bands, which are B05, B08, B11, and B12. The extracted features are used to obtain important information regarding spectral intensity, moisture differences, and reflectance of environmental conditions. Feature extraction helps to improve the learning capabilities of the ViT model to classify cloudy, rainy, and sunny environmental conditions.

3.6.1. Raw Selected SWIR Band Values

The raw values of the selected SWIR band refer to the original spectral reflectance data obtained directly from the selected spectral bands. This kind of value holds valuable information that is necessary for performing environmental condition analysis and multispectral classification. Through the raw spectral features, differences in reflectance patterns among different weather conditions improve the SWIR payload analysis performance. The raw spectral features are calculated using Equation (8):
F r = [ B 05 , B 08 , B 11 , B 12 ]
where F r   indicates the raw spectral feature vector and B 05 , B 08 , B 11   a n d   B 12 indicate the selected spectral band values.

3.6.2. Spectral Band Ratios

The ratio between spectral bands is computed in order to establish the relationship between the chosen spectral bands. It helps in eliminating variations in the intensity of light and emphasizing the crucial environmental factors like moisture and changes in the atmosphere. The spectral band ratio provides greater classification strength and efficient representation of multispectral features. The spectral band ratio is calculated using Equation (9):
B R = B i B j
where B R indicates the spectral band ratio and B i   and B j   indicates the selected spectral band values.

3.7. Detection Model Development and Optimization Using Proposed ViT-WOA

The suggested methodology involves the use of the ViT model combined with the WOA, and aims at the efficient classification of multispectral SWIR imagery for nanosatellite remote sensing tasks. The chosen DL model based on ViT is employed for extracting global spatial and spectral relations through self-attention for four chosen SWIR bands (B05, B08, B11, and B12), leading to better classification accuracy under cloudy, rainy, and sunny weather conditions. Successful operation of the ViT model requires optimal hyperparameters to be determined, which is what makes the WOA indispensable. The WOA finds the optimal values of learning rate, attention weights, and feature selection boundaries through mimicking the humpback whale hunting process. This hybrid ViT + WOA approach reduces classification error, improves convergence speed, and enhances robustness in multispectral remote sensing analysis for SWIR optical payload systems.
The performance improvement achieved by integrating the Vision Transformer (ViT) model with the Whale Optimization Algorithm (WOA) can be explained from a theoretical optimization perspective. The ViT model possesses a powerful self-attention mechanism capable of modeling long-range spatial and spectral dependencies; however, its classification performance is highly sensitive to hyperparameter selection, including learning rate and attention weight initialization. Inappropriate parameter settings may lead to slow convergence, unstable optimization, or suboptimal local minima. The WOA addresses this limitation by performing population-based global optimization that iteratively searches the hyperparameter space through exploration and exploitation mechanisms inspired by humpback whale hunting behavior. Consequently, the WOA identifies parameter configurations that improve feature representation, stabilize the optimization trajectory, accelerate convergence, and reduce classification loss. The complementary strengths of the ViT model in feature learning and the WOA in global hyperparameter optimization provide a theoretical basis for the observed improvements in classification accuracy, robustness, and generalization performance over the standalone ViT model.
The integration of the Vision Transformer (ViT) model with the Whale Optimization Algorithm (WOA) combines the strengths of deep learning and metaheuristic optimization for multispectral SWIR image classification. The ViT model effectively captures long-range spatial and spectral dependencies through its self-attention mechanism; however, its performance depends on appropriate hyperparameter selection. The WOA enhances the ViT model by automatically optimizing critical hyperparameters, including the learning rate (0.0001) and attention weights (0.15–0.92), using a population size of 20 whales over 30 iterations. This optimization improves convergence stability, reduces classification loss, and enhances classification performance. As demonstrated in the ablation study, the proposed ViT–WOA framework improved the classification accuracy from 91.81% (ViT only) to 96.93%, while increasing the Kappa coefficient from 0.864 to 0.954. Therefore, the hybrid ViT–WOA framework provides more robust feature learning and efficient parameter optimization for accurate environmental condition classification in SWIR nanosatellite applications.

3.7.1. Vision Transformer

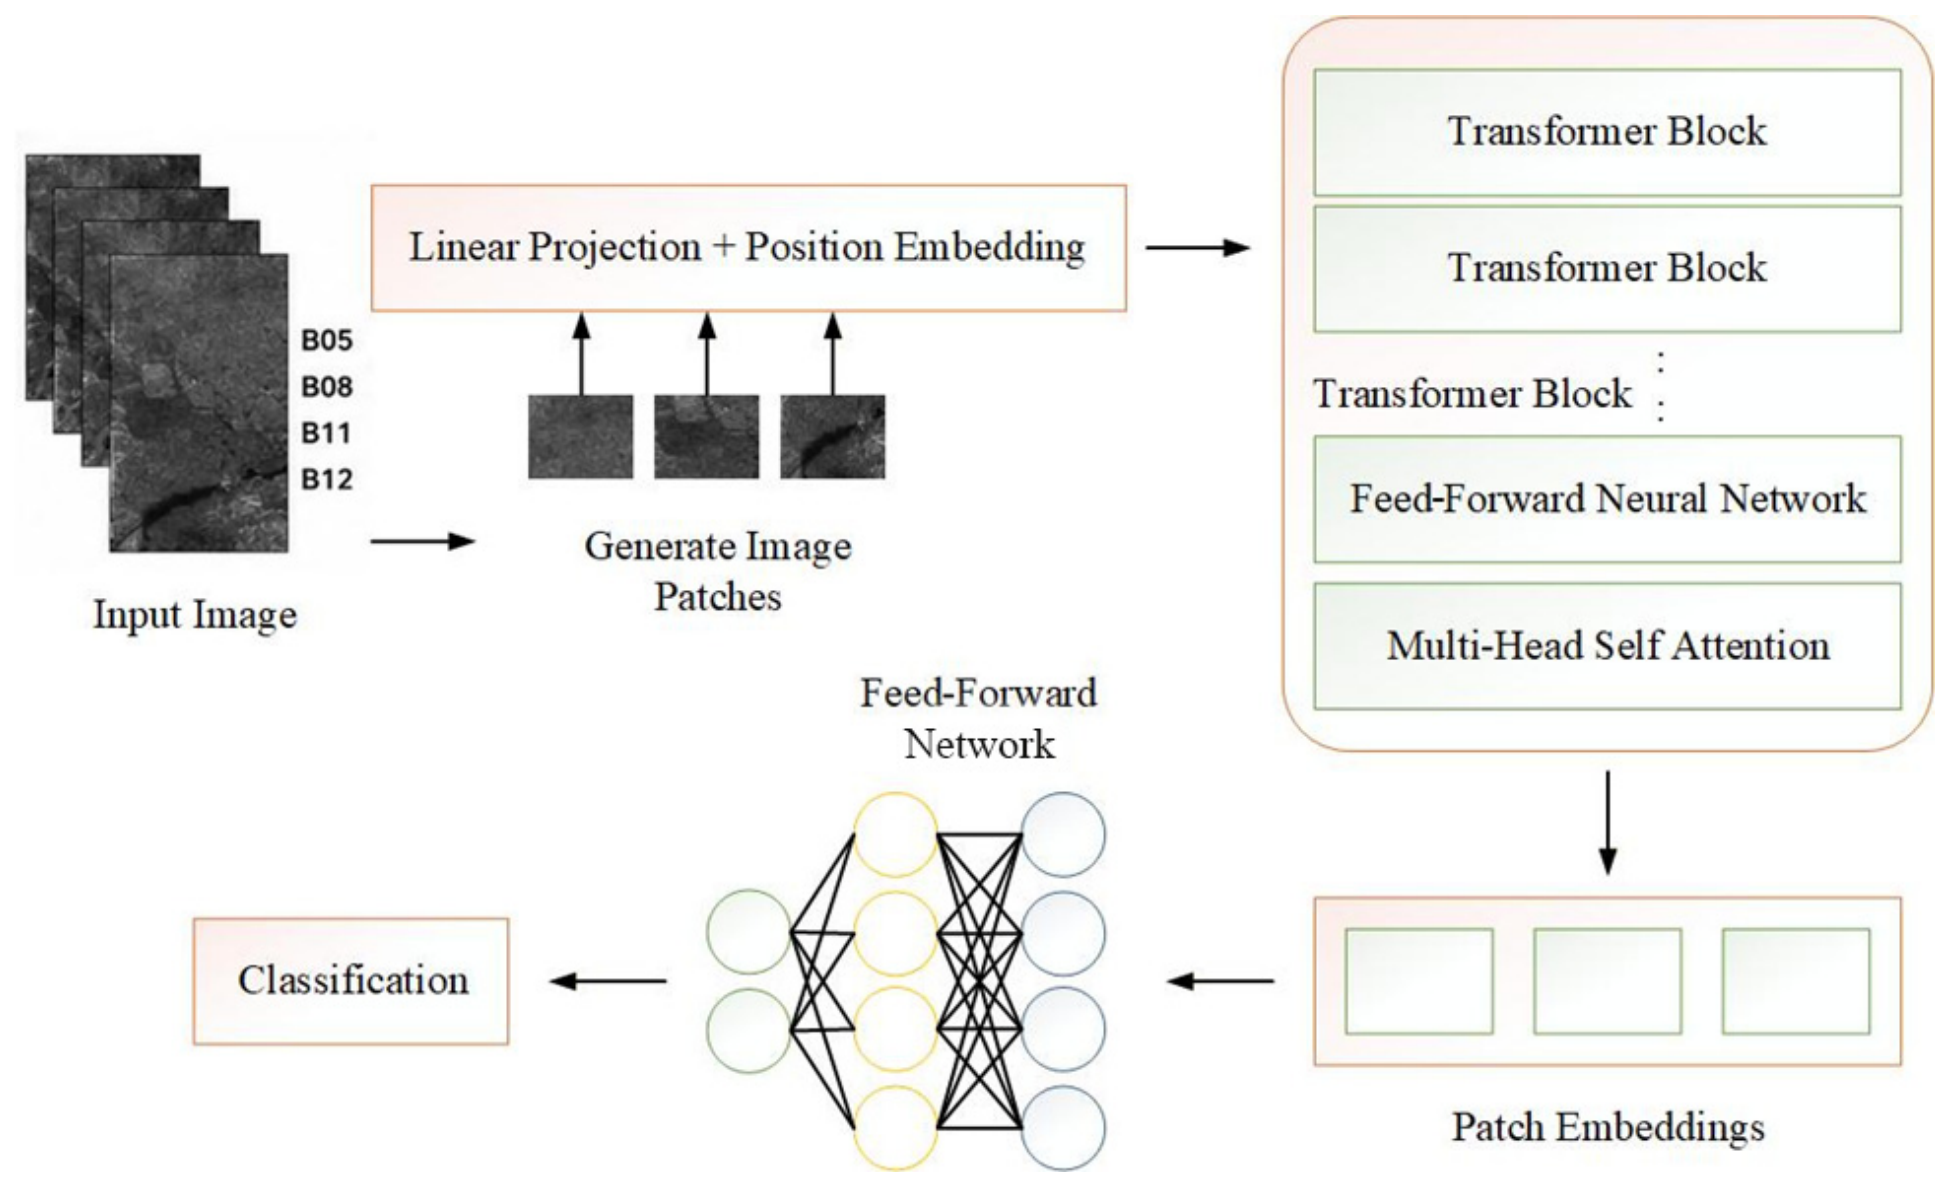
The ViT technique is adopted in the suggested framework for multispectral classification of environmental conditions through selected SWIR bands. The ViT model uses patches from images and applies transformer-based self-attention to learn the dependencies from long distances, both spatially and spectrally. In the proposed framework, the selected four bands B05, B08, B11, and B12 are fed into the ViT model as input to classify the cloudy, rainy, and sunny environmental conditions. The transformer architecture improves feature representation capability and enhances classification performance for nanosatellite remote sensing applications. Figure 2 shows the ViT architecture diagram.
Image Patch Generation
The multispectral image is segmented into smaller patches before being processed through the ViT architecture. The patches are then encoded into vectors that include positional details in order to maintain the spatial correlation between the spectral bands. Patch embedding is calculated using Equation (10):
X p = F   l a t t e n   P i E + E p o s  
where X p   indicates the patch embedding vector, P i indicates the image patch, E indicates the learnable embedding matrix, and E p o s   indicates positional embedding.
Multi-Head Self-Attention
Multi-head self-attention is capable of learning the interactions between various image patches and spectral patches. This enables the model to pay more attention to the significant SWIR patches. Self-Attention is calculated using Equation (11):
A t t e n t i o n ( Q , K , V ) = S o f t m a x Q K T d k V
where Q indicates the query matrix, K indicates the key matrix, V indicates the value matrix, T in K T represents the transpose operation, and d k   indicates the dimension of key vectors.
Transformer Encoder Layer
The transformer encoder performs extraction of the features of embedded patches using self-attention and normalization. It captures the high-level spectral and spatial features of the selected SWIR bands to classify accurately. Encoder Representation is calculated using Equation (12):
Z l = M S A L N Z l 1 + Z l 1
where Z l   indicates the encoder output, M S A indicates multi-head self-attention, and L N indicates layer normalization.
Classification Layer
The extracted transformer features are fed into the classification layer to classify cloudy, rainy, and sunny environments. The classification model increases the accuracy of the classification of multispectral images through learned SWIR feature representations. The classification layer is calculated using Equation (13):
Y = S o f t m a x ( W Z + b )
where Y indicates the predicted class probability, W indicates the weight matrix, Z indicates the extracted feature representation, and b indicates the bias term.

3.7.2. Whale Optimization Algorithm

The WOA has been employed in the proposed architecture for parameter optimization of the ViT model and better classification accuracy. The WOA is an intelligent algorithm designed for optimizing real-life problems inspired by the hunting behavior of humpback whales. This algorithm seeks optimal parameter values by imitating the process of encircling, bubble-net attacking, and randomly searching for prey. With the application of the WOA algorithm in the proposed framework, the convergence rate and classification accuracy are improved.
Integration of ViT and WOA
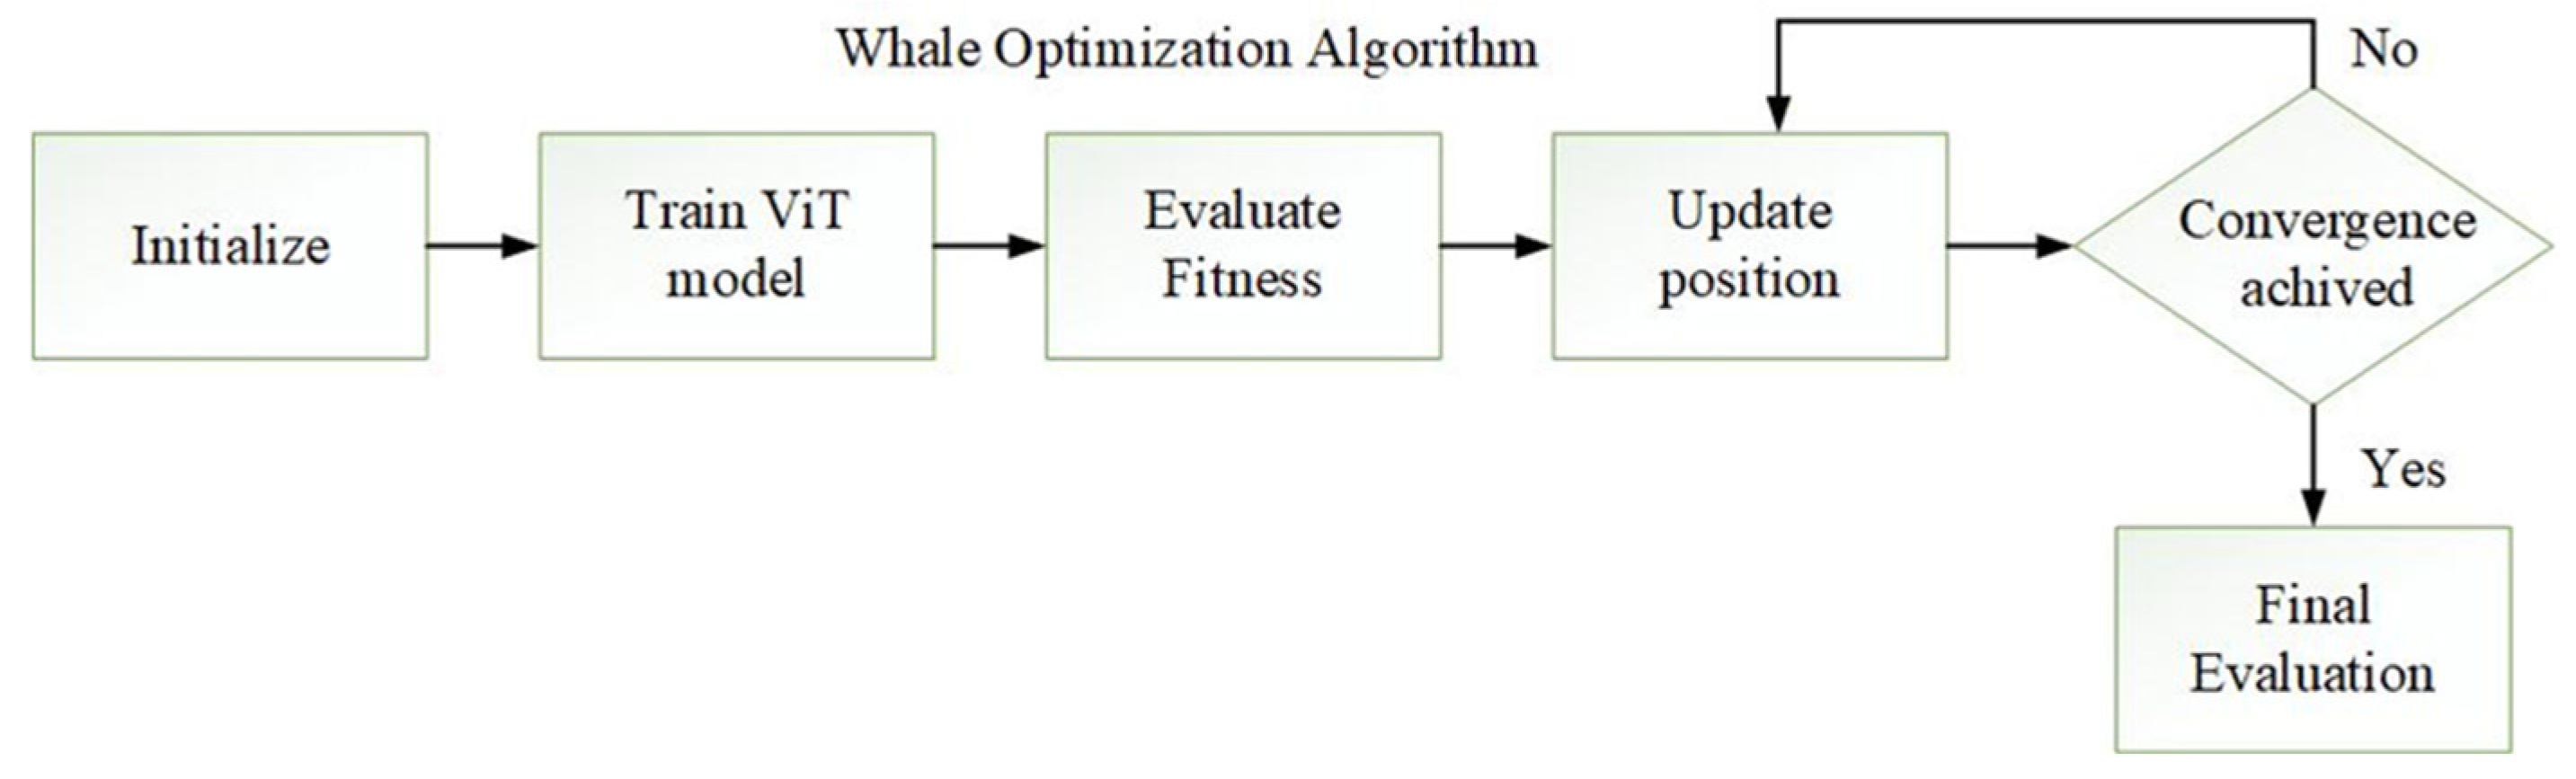
The combination of the ViT model and the WOA is applied in optimizing the model parameters to enhance the classification accuracy of SWIR. The ViT model is initially designed with random weights and trained by utilizing some selected SWIR bands (B05, B08, B11, and B12). Loss computation is carried out through the model and the fitness function of the WOA measures the computed loss. Through the WOA fitness evaluation, optimization of the model parameters is conducted repeatedly until convergence is attained. The best-optimized ViT model is chosen for accurate environmental classification (cloudy, rainy, and sunny).
Initialization and Training
The ViT model parameters are initialized randomly and trained using multispectral SWIR inputs. Forward prediction is calculated using Equation (14):
Y ^ = f V i T X S W I R , θ
where X S W I R   indicates the input SWIR bands (B05, B08, B11, and B12), θ indicates the model parameters, and Y ^ indicates the predicted output.
Loss Function Computation
The classification performance is measured using loss function (cross-entropy loss). The loss function is calculated by Equation (15):
L =   Y l o g ( Y ^ )
where L indicates the classification loss, Y indicates the true label, and Y ^ indicates the predicted probability.
WOA Fitness Evaluation
The WOA uses the loss value as the fitness function to evaluate the ViT model performance. The fitness function is calculated using Equation (16):
Fitness   = 1 1 + L
where L indicates the lower loss–higher fitness value, and a higher fitness value indicates a better ViT model.
Encircling and Position Update (WOA Optimization)
The WOA updates the ViT model parameters by moving toward the best solution. Distance is calculated using Equation (17):
D = C X * ( t ) X ( t )
The Position Update is calculated using Equation (18):
X ( t + 1 ) = X * ( t ) A D
where X * ( t ) indicates the best ViT parameter set, X ( t ) indicates the current parameter set, A ,   C indicate coefficient vectors, and D indicates distance.
Spiral Update Mechanism
The WOA also performs local searches using spiral movement. The spiral update mechanism is calculated using Equation (19):
X ( t + 1 ) = D e b l c o s ( 2 π l ) + X * ( t )
where b indicates the spiral constant; l indicates a random number.
Convergence Condition
The training loop continues until convergence is reached. The convergence condition is calculated using Equation (20):
L t + 1 L t < ϵ
where L t   indicates loss at iteration t and ϵ indicates the threshold value.
The final optimized ViT model produces the environmental condition classification output using the best-optimized parameters obtained from the WOA. The final outcome is calculated using Equation (21):
Y f i n a l   = f V V T X S W I R , θ b e s t  
where Y f i n a l     indicates the final predicted environmental class, f V i T   indicates the optimized ViT model, X S W I R     indicates the input SWIR bands (B05, B08, B11, and B12), and θ b e s t   indicates the best-optimized parameters obtained using the WOA. Figure 3 shows a flowchart of the WOA.
The incorporation of the ViT model and the WOA brings many benefits to multispectral SWIR remote sensing. The ViT model is able to model long-term dependencies in space and spectral dimensions by means of the self-attention mechanism, whereas the WOA tunes the model parameters to achieve better convergence and lower classification error rate. The proposed approach improves classification performance, minimizes computation waste, and increases feature extraction effectiveness in nanosatellite payload platforms. This integrated approach supports intelligent SWIR filter selection and robust environmental condition classification using multispectral satellite imagery. Algorithm 1 and Algorithm 2 show the training procedure of the proposed ViT–WOA model and environmental condition prediction using the trained ViT–WOA model.
Algorithm 1: Training Procedure of the Proposed ViT–WOA Model
Input: Multispectral SWIR Dataset D; selected bands B05, B08, B11, B12; ViT parameters θ; whale population size N; maximum iterations T
Output: Optimized ViT-WOA Model
Procedure:
Step 1: Initialize multispectral dataset D.
Step 2: Perform preprocessing:
      a. Apply atmospheric correction.
      b. Apply Z-score normalization.
Step 3: Select ROI regions from SWIR images.
Step 4: Apply MI-based optimal band selection.
Step 5: Select optimal SWIR bands:
      B05, B08, B11, B12.
Step 6: Perform feature extraction:
      a. Extract raw SWIR band values.
      b. Compute spectral band ratios.
Step 7: Initialize the Vision Transformer (ViT) model with random parameters.
Step 8: Divide SWIR images into patches and generate embeddings.
Step 9: Train the ViT model using the self-attention mechanism.
Step 10: Compute prediction output and classification loss.
Step 11: Initialize the Whale Optimization Algorithm (WOA) population.
Step 12: Evaluate the fitness of ViT parameters using classification loss.
Step 13: For each iteration:
      a. Compute whale distance from the best solution.
      b. Update whale position.
      c. Apply spiral search mechanism.
      d. Update ViT parameters.
Step 14: Repeat optimization until the convergence condition is satisfied.
Step 15: Select the best-optimized ViT model.
Step 16: Return the optimized ViT–WOA model.
Algorithm 2: Environmental Condition Prediction using Trained ViT–WOA Model
Input: Test SWIR sample X; trained ViT–WOA model
Output: Predicted Environmental Class (Cloudy/Rainy/Sunny)
Procedure:
Step 1: Apply preprocessing:
      a. Atmospheric correction.
      b. Z-score normalization.
Step 2: Select optimal SWIR bands:
      B05, B08, B11, B12.
Step 3: Extract spectral features and spectral band ratios.
Step 4: Divide image into ViT patches and generate embeddings.
Step 5: Compute prediction score using the trained ViT–WOA model.
Step 6: If predicted probability corresponds to:
      Class 1 → Return Cloudy
      Class 2 → Return Rainy
      Class 3 → Return Sunny
Step 7: End.

4. Results and Discussion

Based on the experiment results, it can be observed that the proposed ViT-WOA architecture can be used to classify SWIR-based environmental conditions using multispectral satellite images. In the experiment, the dataset was split as 80% training set and 20% testing set. The selected SWIR bands B05, B08, B11, and B12 were used to analyze the multispectral satellite images and classify the conditions. The ViT model could extract the spatial and spectral features from the multispectral images. The WOA helped optimize the model parameters for convergence and minimize the loss during classification. The architecture succeeded in classifying the environmental conditions such as cloudy, rainy, and sunny. The preprocessing and feature extraction process helped improve the spectral consistency while minimizing the noise impact. MI band selection helped identify the useful bands for nanosatellite payload configuration. The proposed framework provided reliable SWIR spectral analysis for remote sensing applications.

4.1. Performance Evaluation

The evaluation of performance is applied to assess the efficiency of the suggested ViT–WOA architecture for cloud, rain, and sun environment classification based on multispectral SWIR satellite imagery. These metrics include accuracy, precision, recall, F1-score, and Kappa coefficient to determine the correctness, consistency, and efficiency of the algorithm for nanosatellite remote sensing applications. The performance evaluation is calculated using Equations (22)–(26).
Accuracy: Accuracy measures the overall percentage of correctly classified samples among the total predictions.
A c c u r a c y = T P + T N T P + T N + F P + F N
Precision: Precision measures the proportion of correctly predicted positive samples among all predicted positive samples.
P r e c i s i o n = T P T P + F P
Recall: Recall measures the proportion of correctly identified positive samples among all actual positive samples.
  R e c a l l = T P T P + F N
F1-Score: F1-score represents the harmonic mean of precision and recall.
F 1 = 2 × P r e c i s i o n   × R e c a l l     P r e c i s i o n + R e c a l l  
Kappa Coefficient: The Kappa coefficient measures the agreement between predicted and actual classifications while considering random agreement:
K a p p a   = P o P e 1 P e
where T P indicates True Positive, T N indicates True Negative, T P indicates False Positive, F N indicates False Negative, P o   indicates the observed agreement, and P e   indicates the expected agreement by chance.

4.2. System Configuration

The proposed SWIR optical payload framework was developed and executed on a desktop system named DESKTOP-SEPKRID equipped with an Intel Core i5-14400F processor operating at 2.50 GHz. The system contained 8 GB RAM with 7.80 GB usable memory that supported multispectral image preprocessing, Vision Transformer training, and WOA processes. The platform utilized a 64-bit Windows 11 Pro operating system (Version 21H2) with OS build 22000.2538 and Windows Feature Experience Pack 1000.22001.1000.0. The x64-based processor architecture provided stable computational performance for SWIR feature extraction and environmental condition classification. The system did not include pen or touch input support as the framework was fully implemented using desktop-based computational processing.

4.3. Hyperparameter Values

The proposed ViT-WOA framework utilized optimized hyperparameters to improve multispectral SWIR environmental condition classification performance. The ViT model was configured with a learning rate of 0.0001, a batch size of 32, a dropout rate of 0.3, an embedding dimension of 768, a patch size of 16 × 16, and eight multi-head self-attention heads. The transformer architecture employed 12 encoder layers with the Adam optimizer and was trained for 60 epochs. During optimization, the WOA used a population size of 20 whales and 30 maximum iterations to optimize the learning rate, attention weights, and feature selection boundaries. The optimized attention weight values ranged between 0.15 and 0.92 during convergence. The dataset was divided into 80% training and 20% testing subsets with five-fold cross-validation and a random state of 42 for reproducibility. These optimized hyperparameter settings improved convergence speed, minimized classification loss, and enhanced SWIR-based environmental condition classification accuracy.

Validation Strategy and Overfitting Prevention

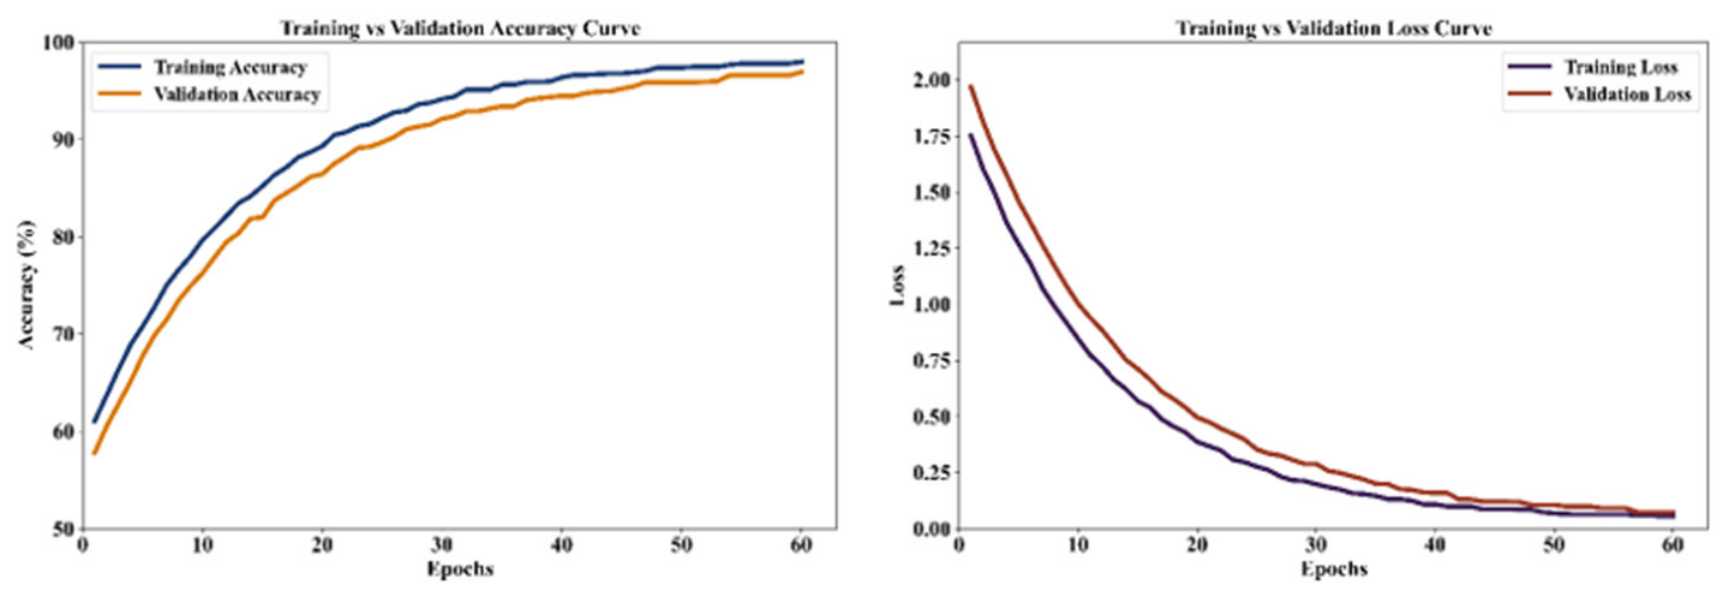
To mitigate overfitting given the dataset size of 2700 samples, five-fold cross-validation was performed on the training set using a fixed random state of 42, ensuring that reported performance was not dependent on a single train–validation split. A dropout rate of 0.3 was applied within the ViT encoder layers to reduce reliance on any single attention pathway during training. In addition, feature extraction was restricted to the four selected SWIR-relevant bands (B05, B08, B11, and B12) and their spectral ratios rather than the full 13-band set, reducing input dimensionality and the associated risk of overfitting on a comparatively small sample size. As shown in Figure 4, training and validation accuracy and loss curves remained closely aligned across all 60 epochs (98% vs. 97% accuracy; 0.05 vs. 0.06 loss), indicating that the model generalized well to unseen data rather than overfitting the training set.
To validate the proposed ViT–WOA framework, five-fold cross-validation was performed using the training dataset. The model achieved a mean accuracy of 96.93% ± 0.17, precision of 97.19% ± 0.14, recall of 96.93% ± 0.17, F1-score of 97.04% ± 0.16, and a Kappa coefficient of 0.954 ± 0.002. The small standard deviations across the five folds indicate that the proposed framework exhibits stable learning behavior and consistent classification performance without significant performance variation across different data partitions. Table 4 shows the five-fold cross-validation results of the proposed ViT–WOA framework.

4.4. Training vs. Validation Accuracy and Loss Curve Analysis

The training accuracy increased from nearly 60% to 98% while the validation accuracy improved from 58% to 97% across 60 epochs, as shown in Figure 4. The training loss decreased from 1.8 to 0.05 and the validation loss reduced from 2.0 to 0.06. The close convergence of accuracy and loss curves indicates stable learning and effective optimization of the proposed ViT + WOA framework.

4.5. Confusion Matrix Analysis

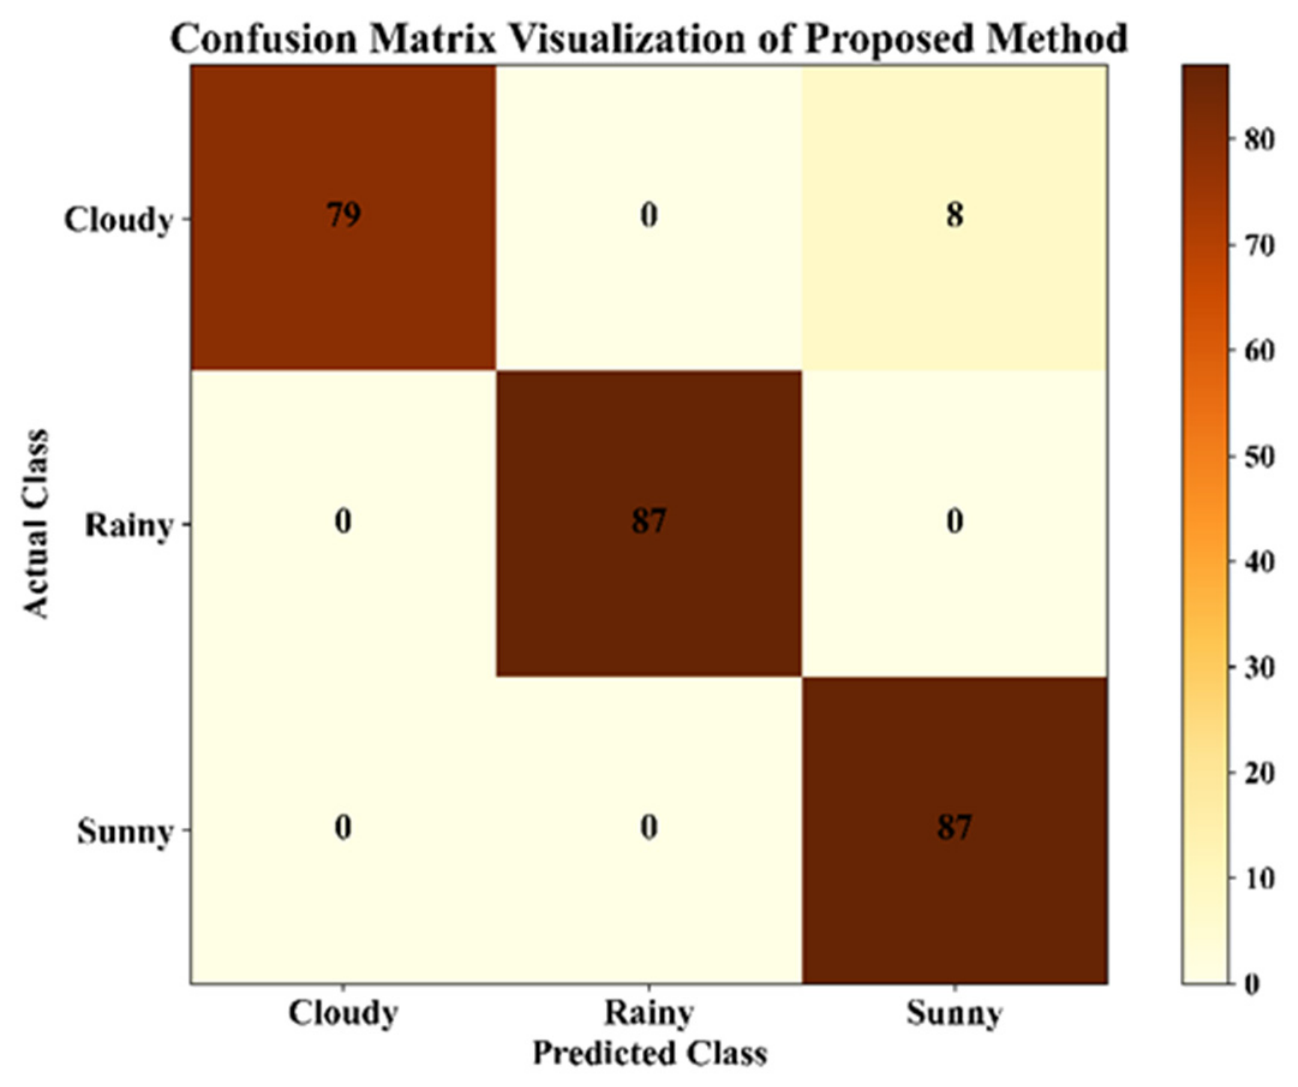
The confusion matrix of the proposed ViT + WOA model correctly classified 79 cloudy, 87 rainy, and 87 sunny samples, as shown in Figure 5. Only eight cloudy samples were misclassified as sunny, while the rainy and sunny samples were correctly classified. The results demonstrate the high accuracy and reliability of the proposed SWIR classification framework.

4.6. ROI Selection Visualization Analysis

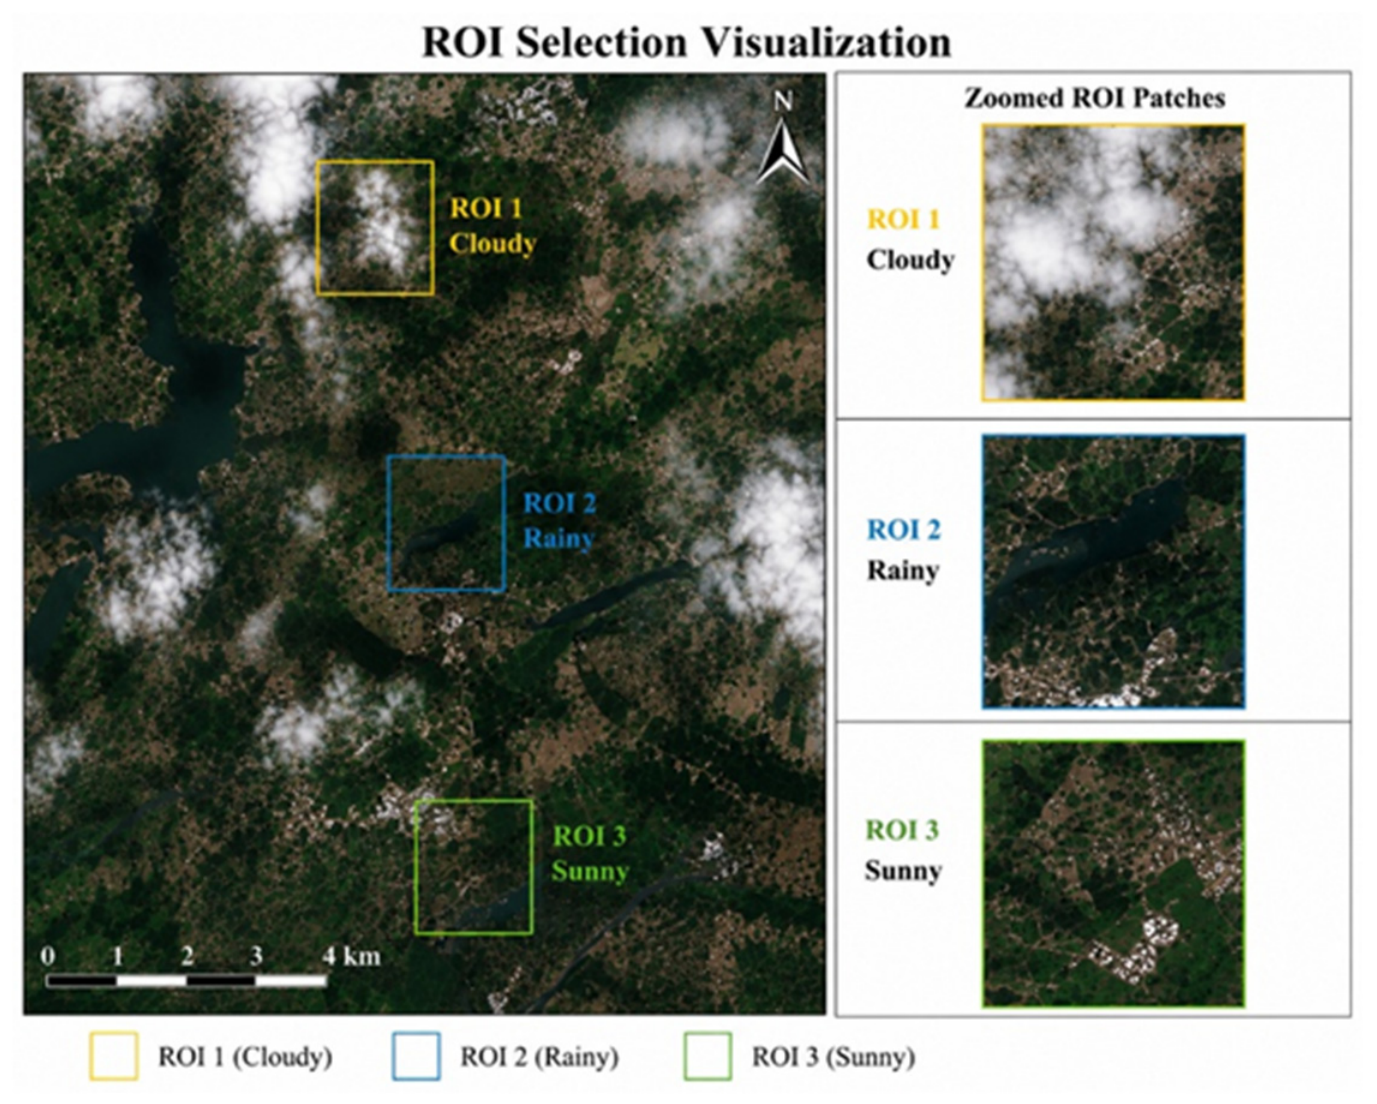
The ROI extraction process performed on the multispectral SWIR satellite images is shown in Figure 6. Important land regions including vegetation, soil, and moisture-affected areas are highlighted for spectral analysis. ROI selection improves feature extraction efficiency and enables accurate environmental condition classification.

4.7. ViT Attention Map Analysis

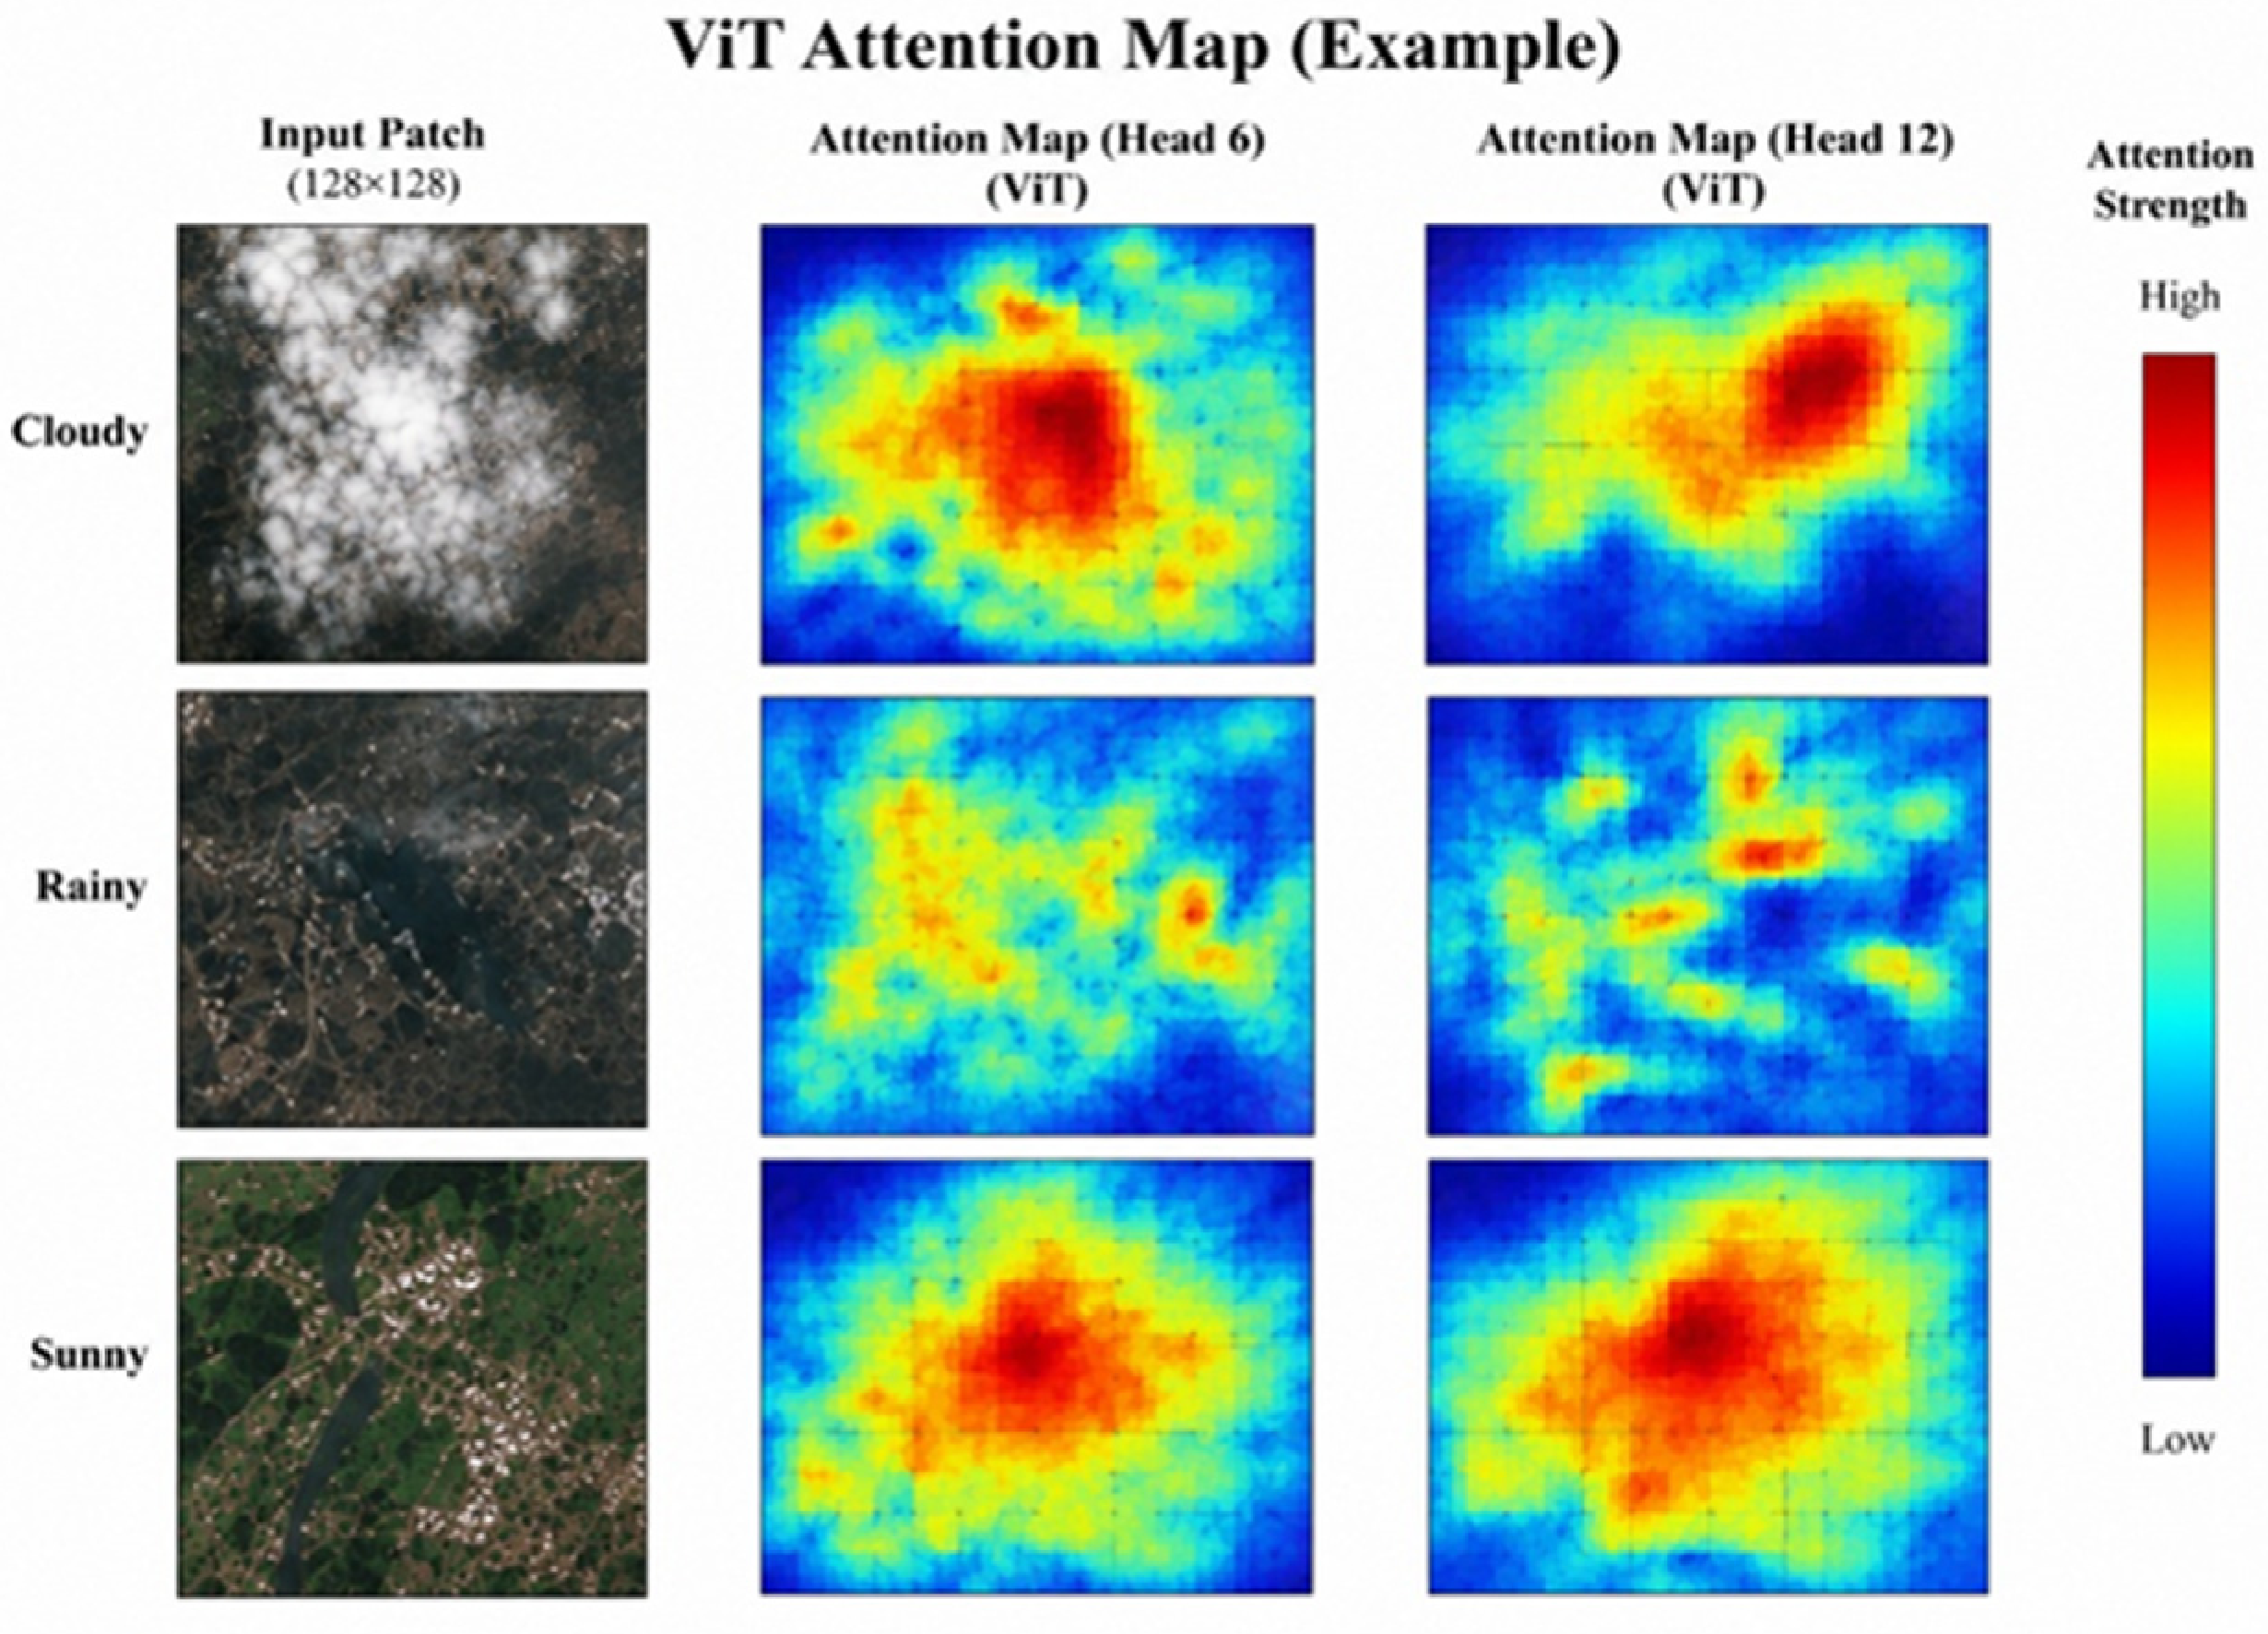
The attention regions identified by the ViT model during environmental condition classification are shown is Figure 7. The attention maps highlight important spectral regions, contributing to accurate classification. The proposed ViT model effectively learns spatial and spectral dependencies from selected SWIR bands.

4.8. Optimal Four-Band Selection for Importance Distribution Analysis

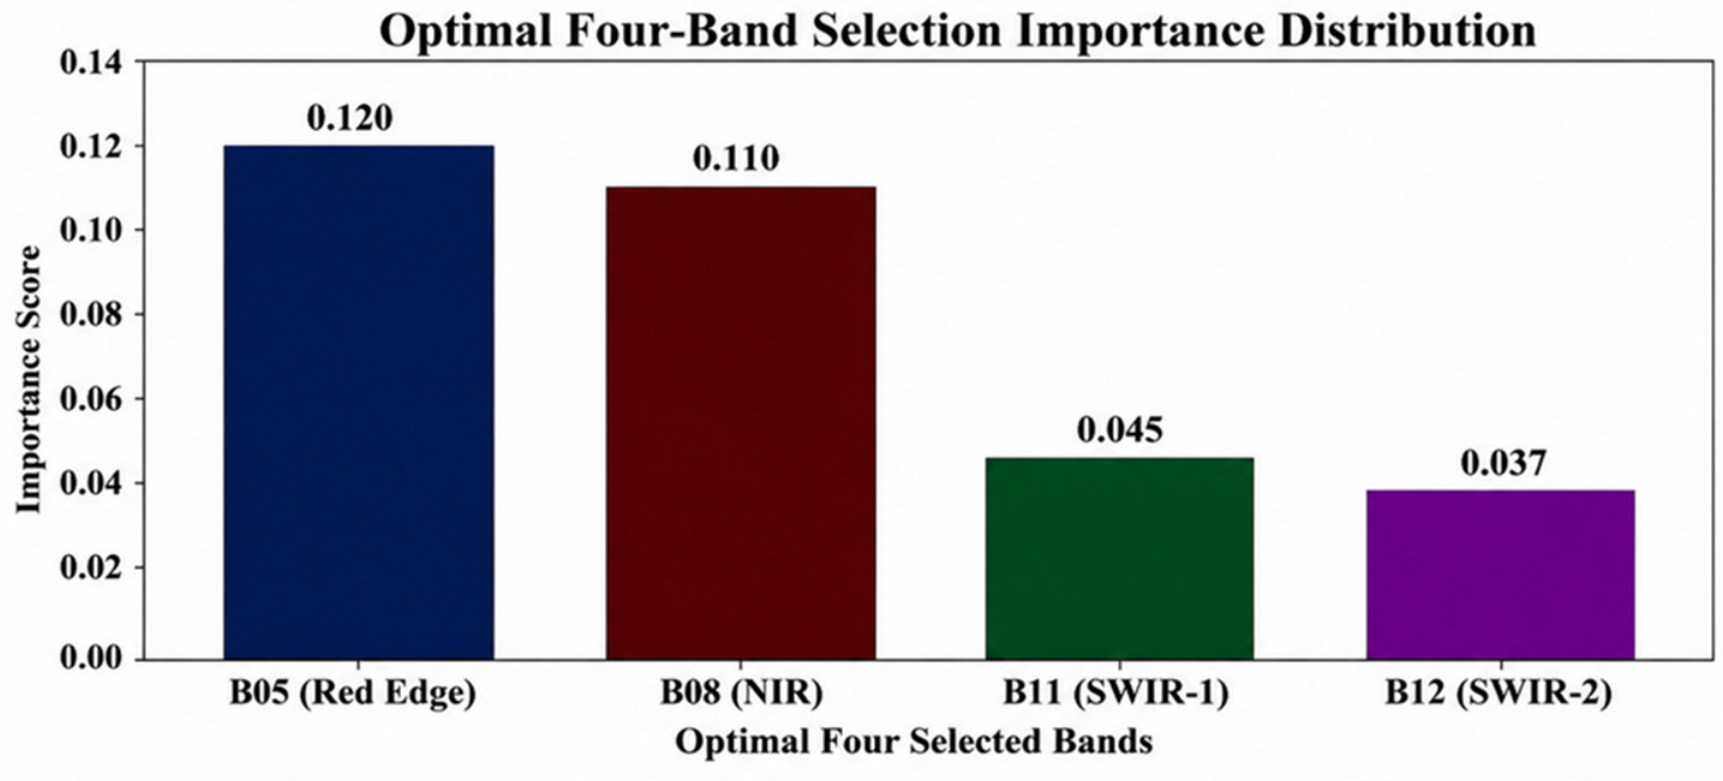
The importance scores of the four selected spectral bands in the proposed framework are shown in Figure 8. B05 (Red Edge) achieved the highest score of 0.120, followed by B08 (NIR) with 0.110. B11 (SWIR-1) and B12 (SWIR-2) obtained scores of 0.045 and 0.037. The results indicate that B05 and B08 contributed more effectively to environmental condition classification.
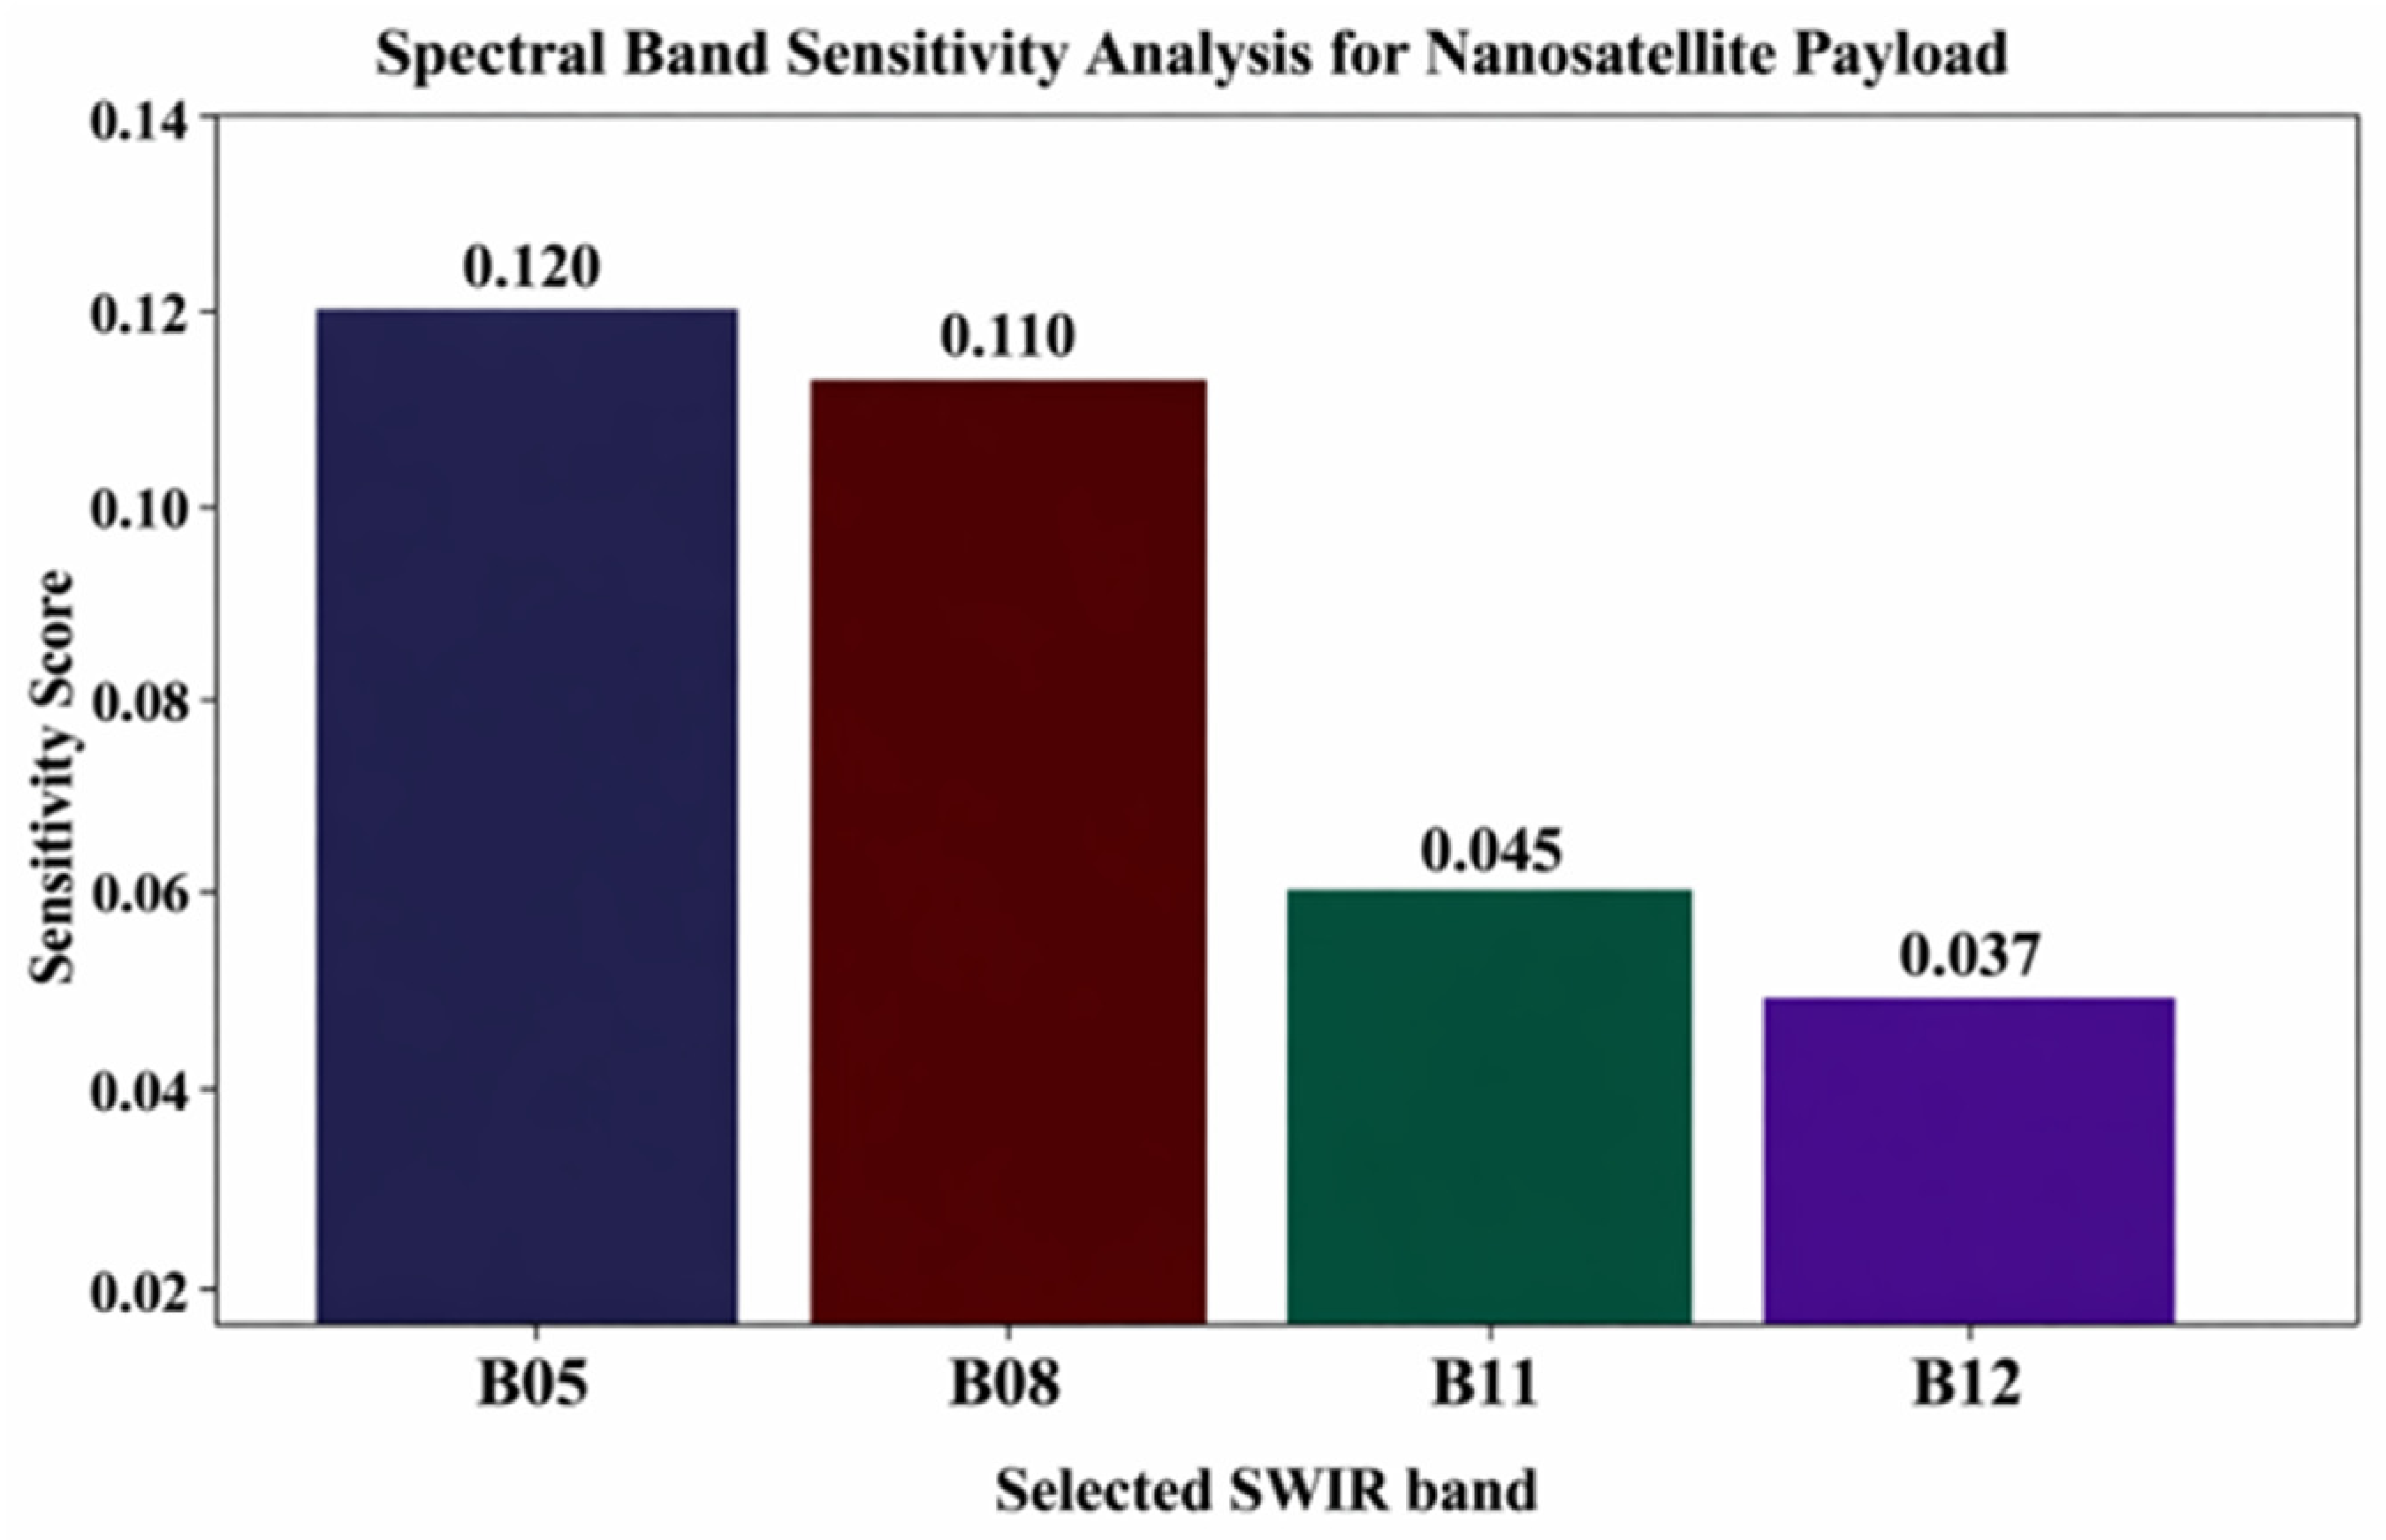
The sensitivity scores of the selected SWIR bands for the nanosatellite payload are shown in Figure 9. B05 achieved the highest score of 0.120, followed by B08 with 0.110, while B11 and B12 obtained 0.045 and 0.037. The results indicate that B05 and B08 contribute more effectively to spectral feature analysis and classification performance.
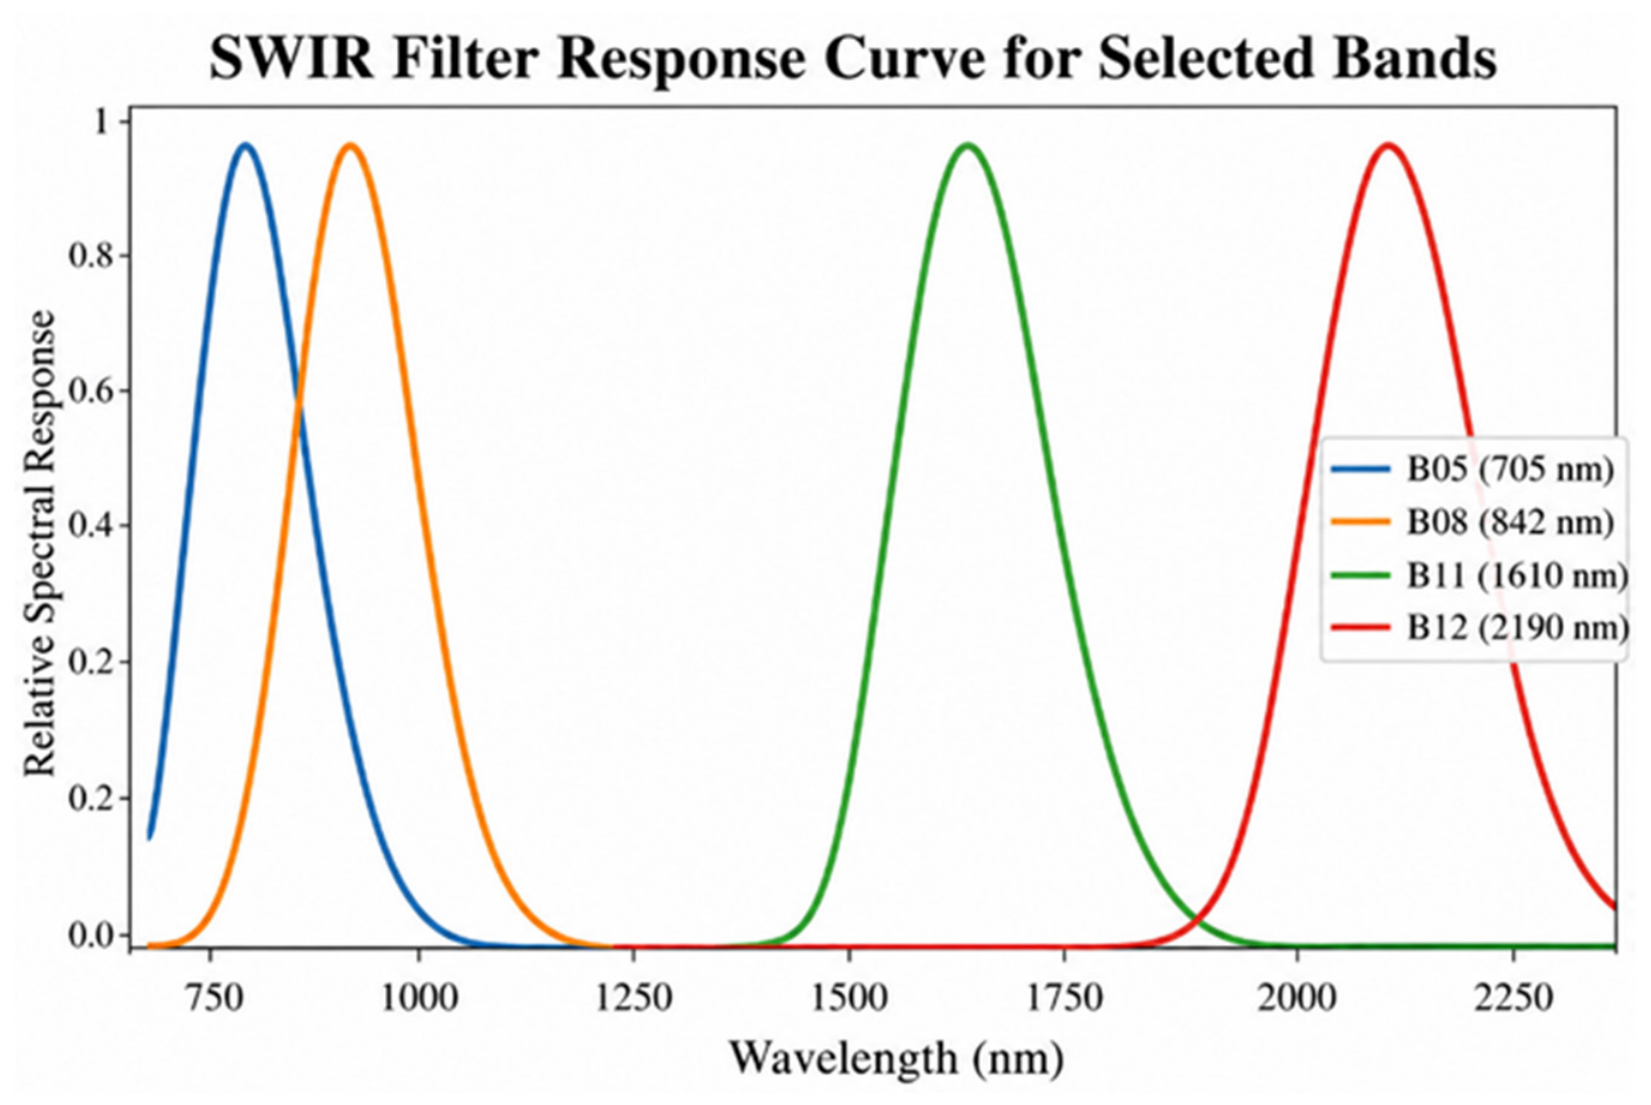
The SWIR filter response curves of the selected spectral bands B05, B08, B11, and B12 across different wavelength ranges are shown in Figure 10. B05 and B08 respond in the Red Edge and NIR regions, while B11 and B12 operate in the SWIR region. The distinct spectral peaks indicate effective band separation for environmental monitoring and accurate spectral feature extraction.

4.9. Feature Reduction on Classification Performance Analysis

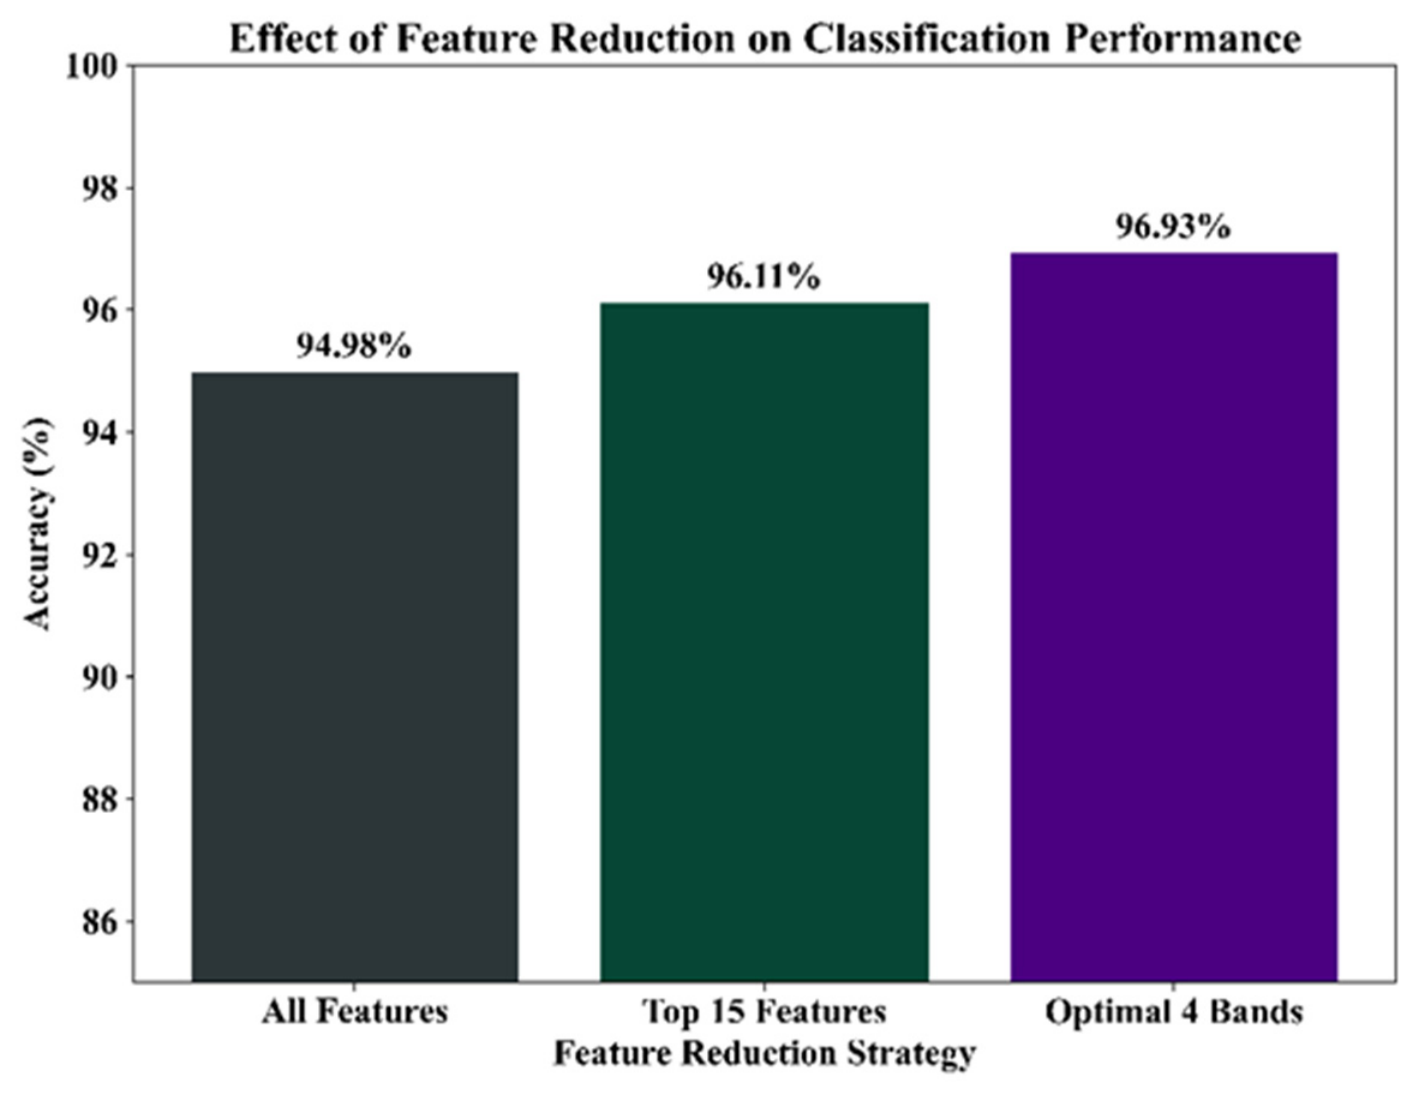
Feature reduction improves classification accuracy, as shown in Figure 11. Using all features achieved 94.98% accuracy, while selecting the top 15 features increased it to 96.11%. The optimal four-band configuration achieved the highest accuracy of 96.93%, demonstrating that selecting informative SWIR bands enhances performance and reduces redundant data.

4.10. Comparison of Selected vs. Non-Selected SWIR Band Analysis

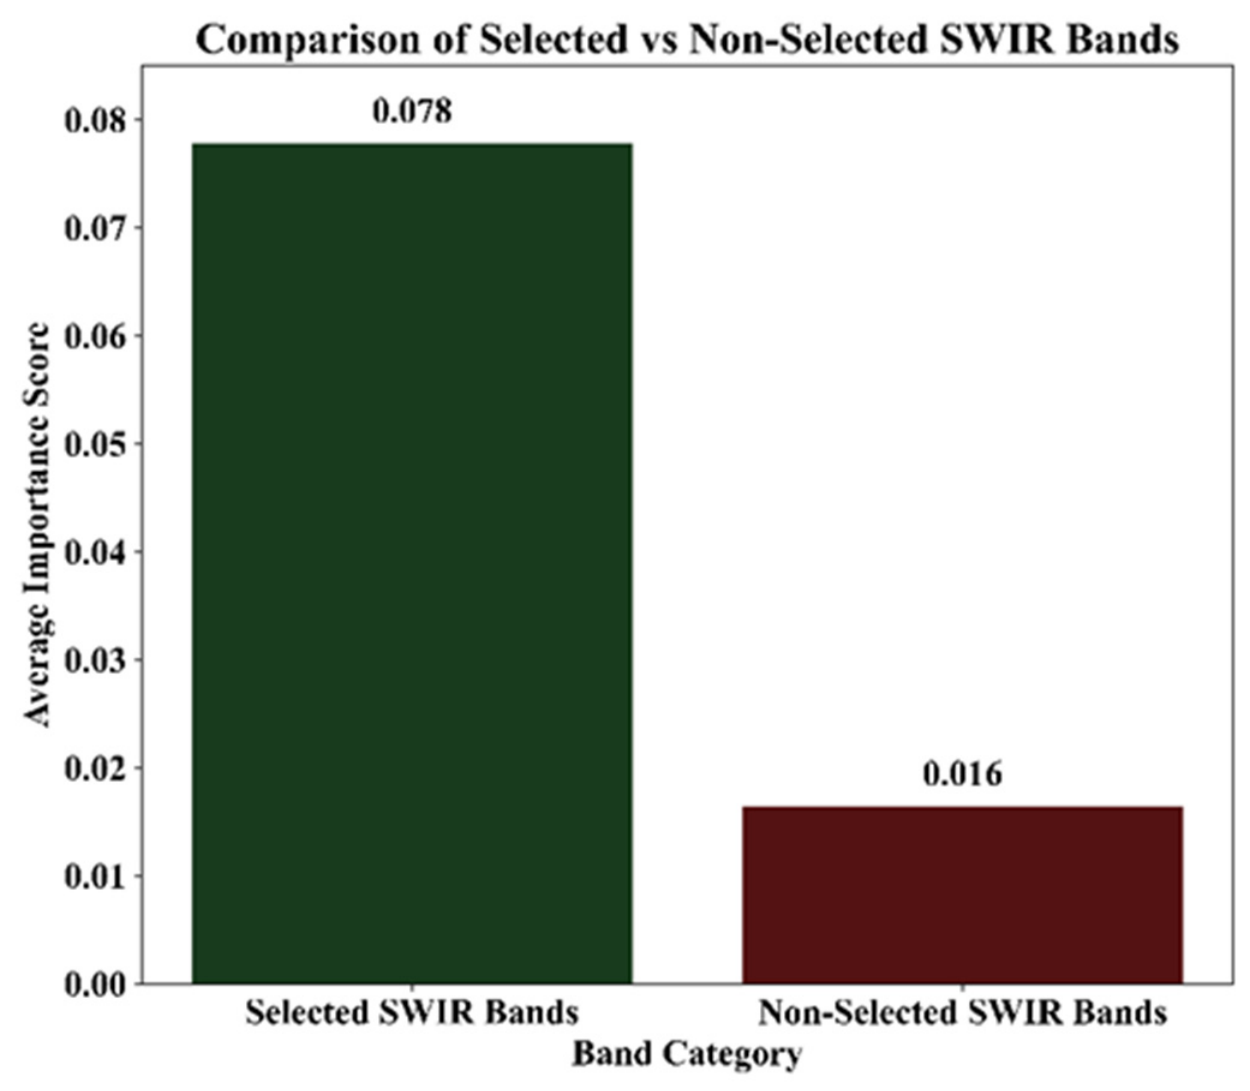
The selected SWIR bands have a much higher importance score (0.078) than the non-selected bands (0.016), proving that the selected bands contain more useful information for accurate classification, as shown in Figure 12.

4.11. ROC Curve Analysis

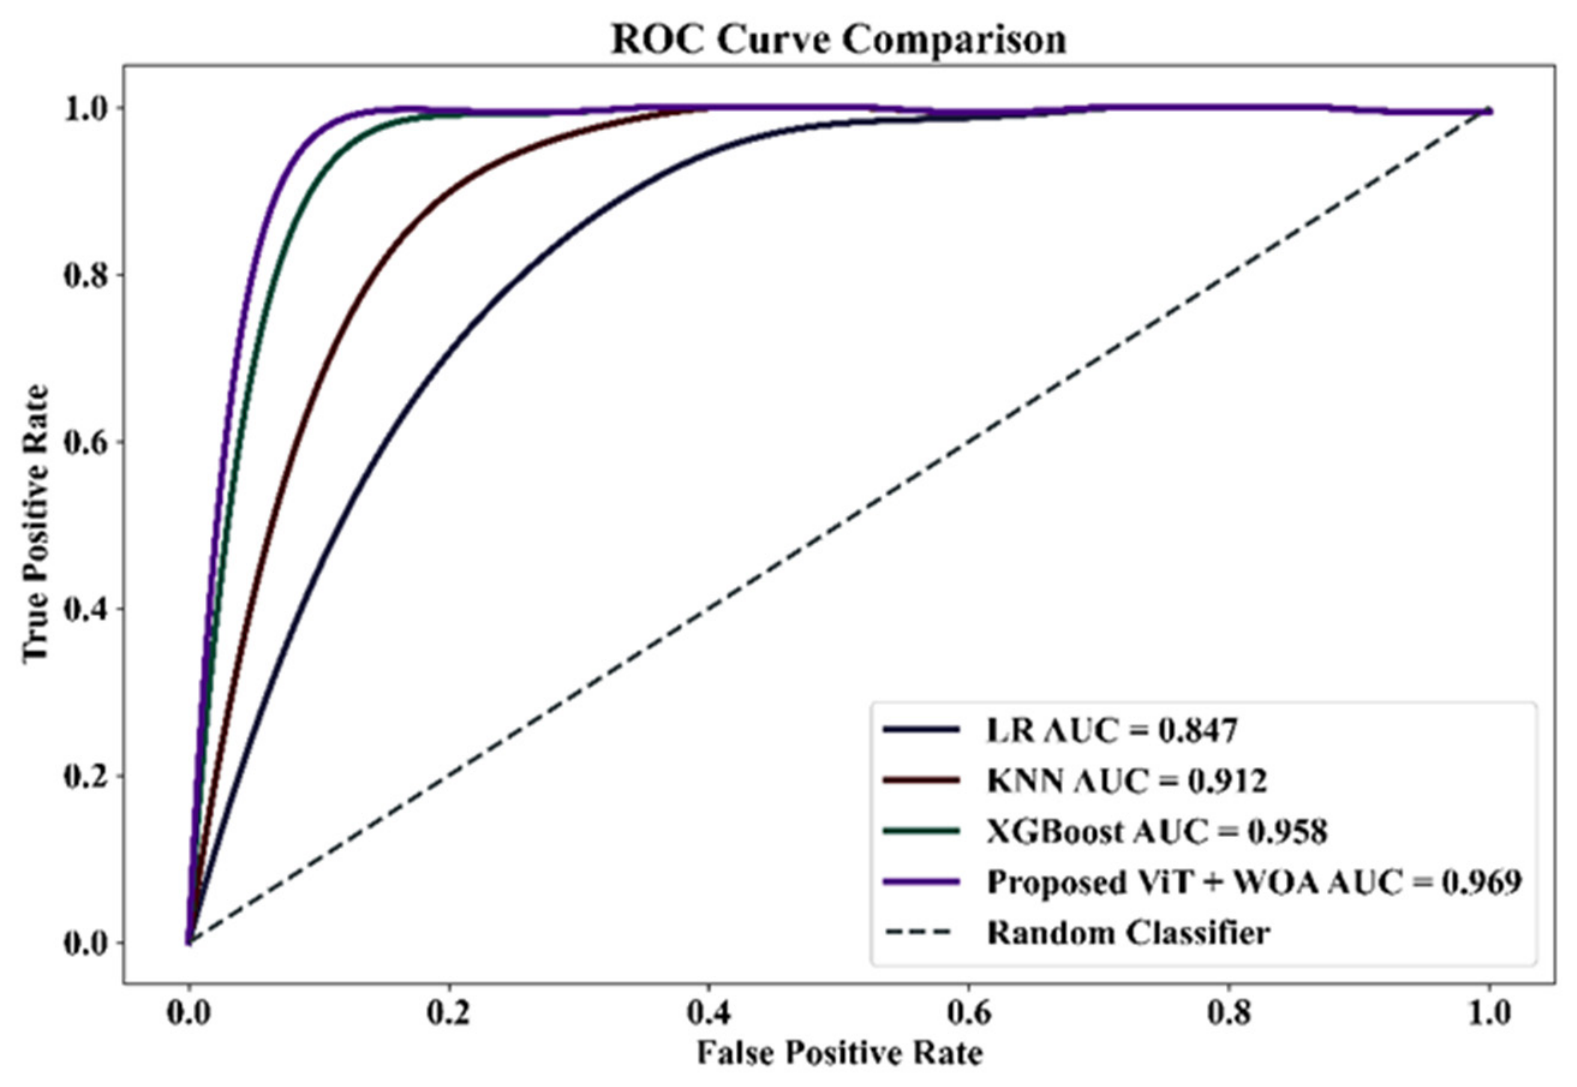
The ROC curve comparison of the proposed ViT + WOA model achieved the highest classification performance with an AUC of 0.969, outperforming LR 0.847, KNN 0.912, and XGBoost 0.958, as shown in Figure 13. The curve closer to the top-left corner indicates better True Positive detection with lower False Positives, demonstrating the superior effectiveness of the proposed method for SWIR-based land classification.

4.12. WOA Optimization Convergence Analysis

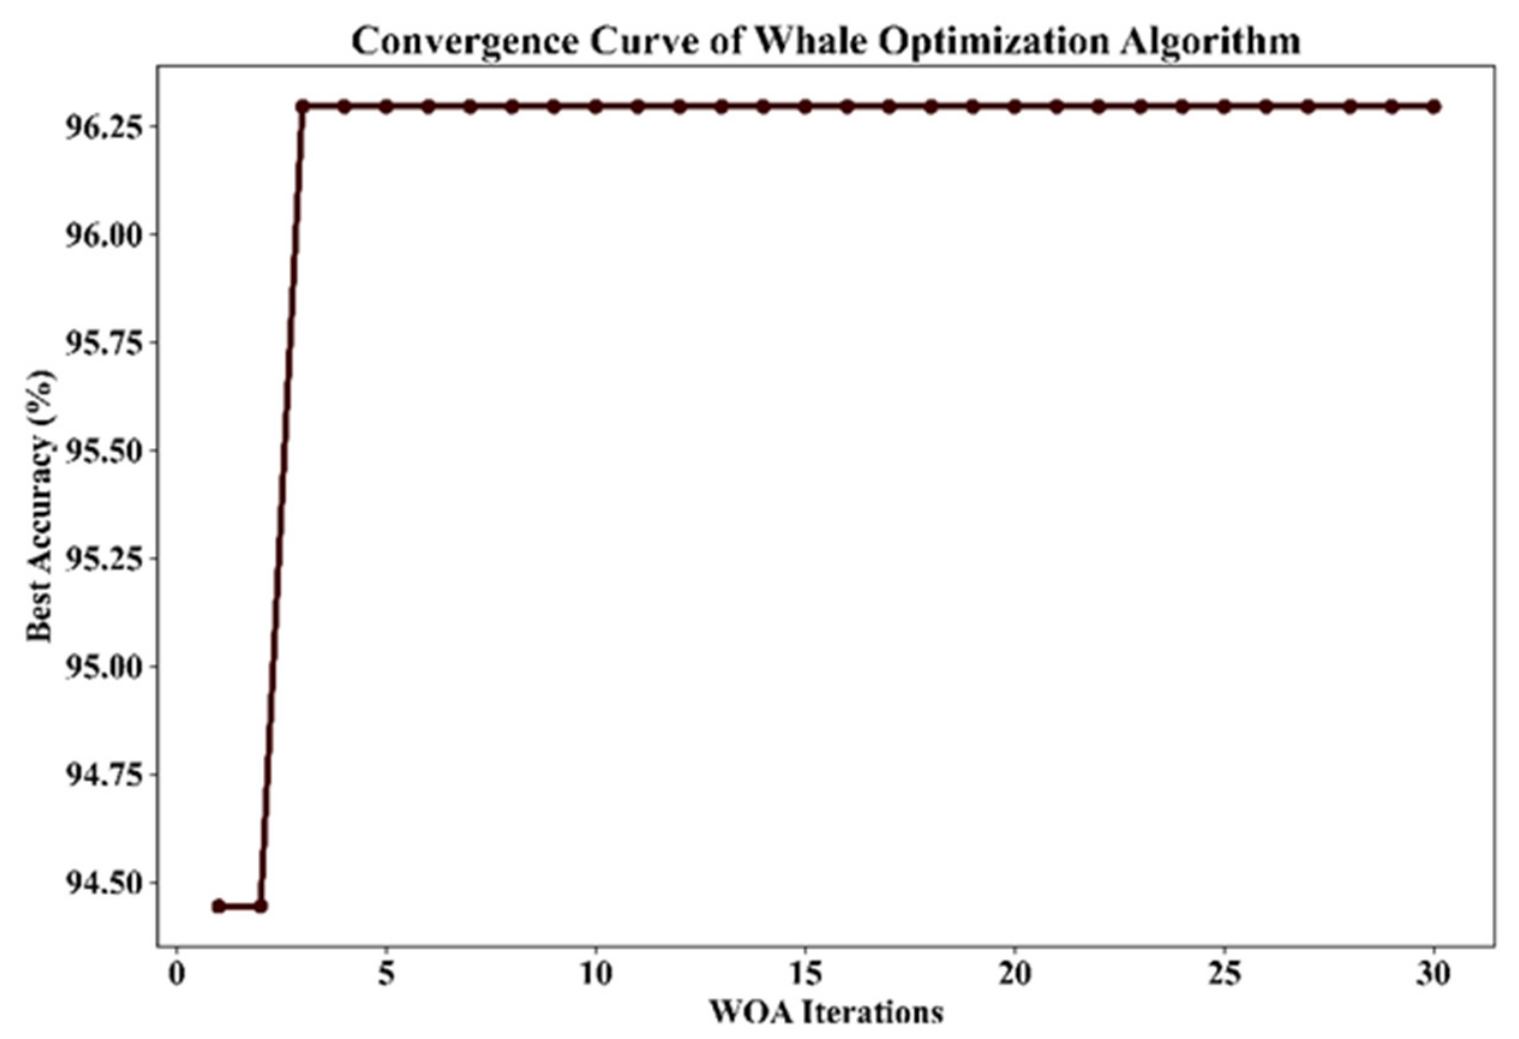
The convergence performance of the WOA is shown in Figure 14. The accuracy rapidly increases from about 94.4% to 96.3% within the first few iterations and then remains stable for the remaining iterations. This indicates that the WOA achieves fast convergence and effectively finds an optimal solution for the proposed ViT-based SWIR classification model.

4.13. Performance Comparison Analysis

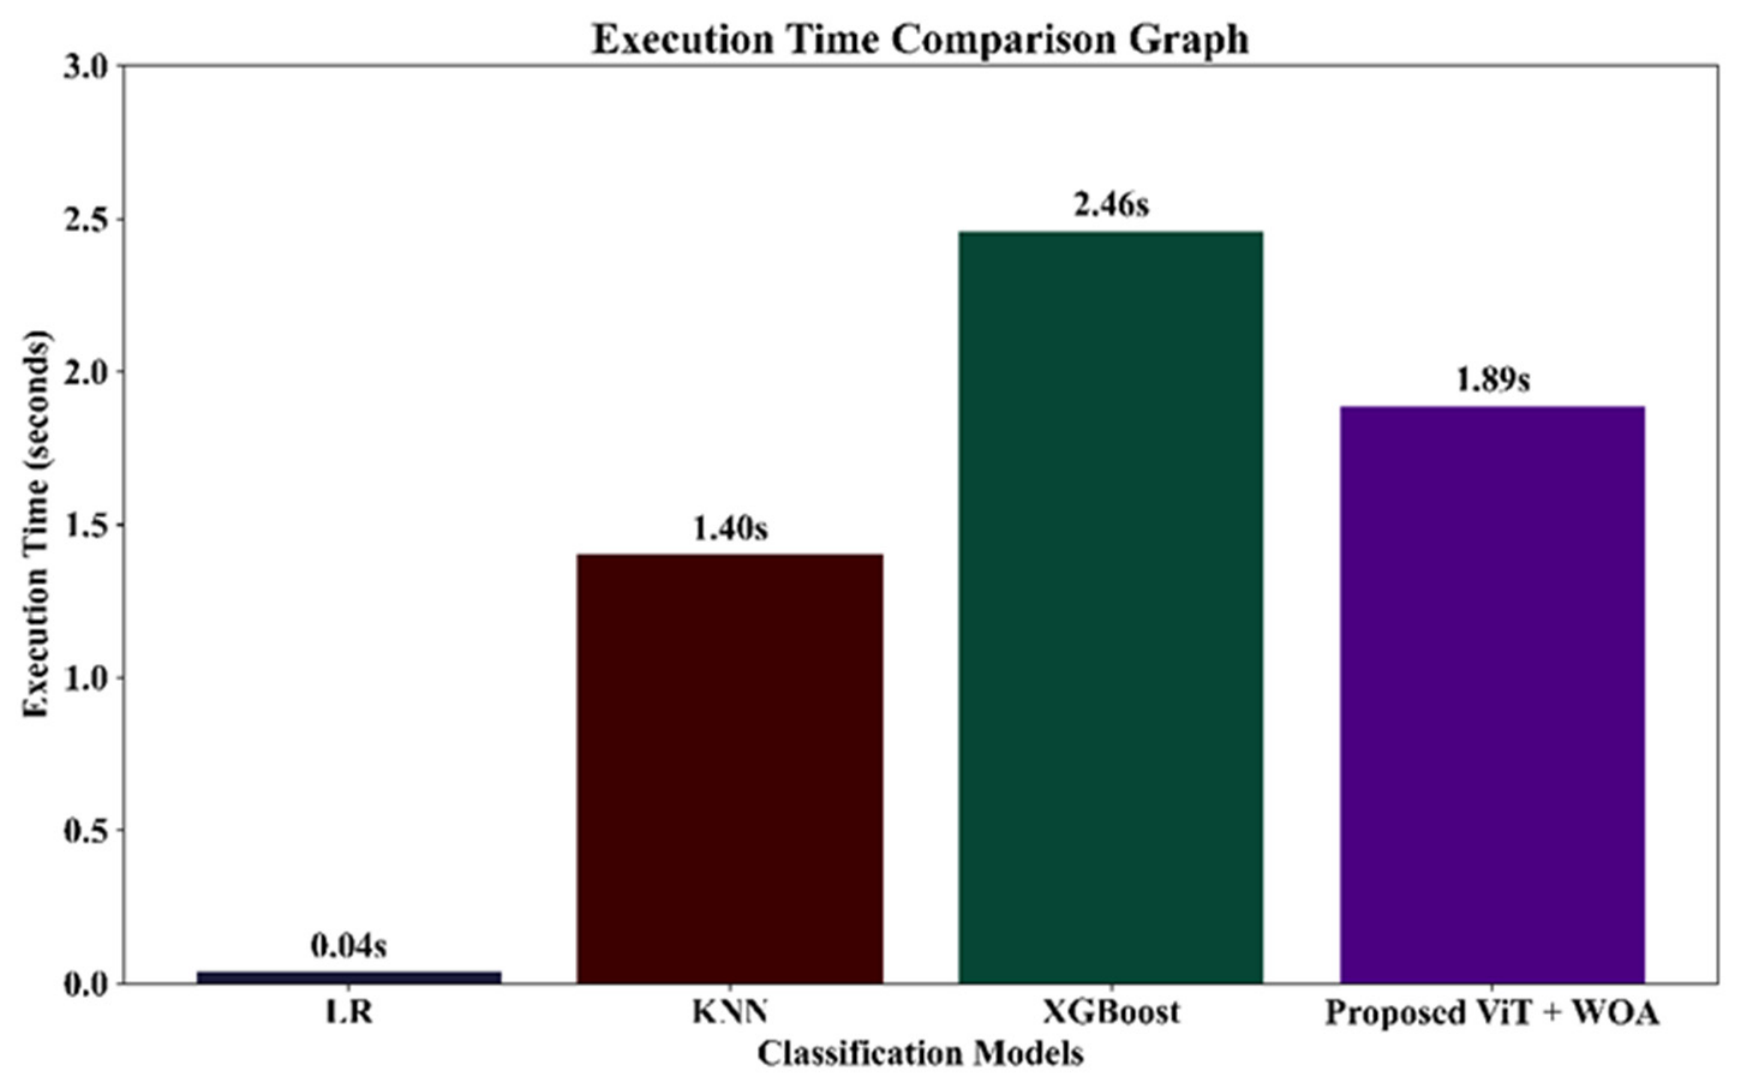
The execution times of different classification models are shown in Figure 15. LR achieved the lowest execution time, 0.04 s, while XGBoost required the highest time, 2.46 s. The proposed ViT + WOA model took 1.89 s, showing a balanced trade-off between computational time and classification performance.
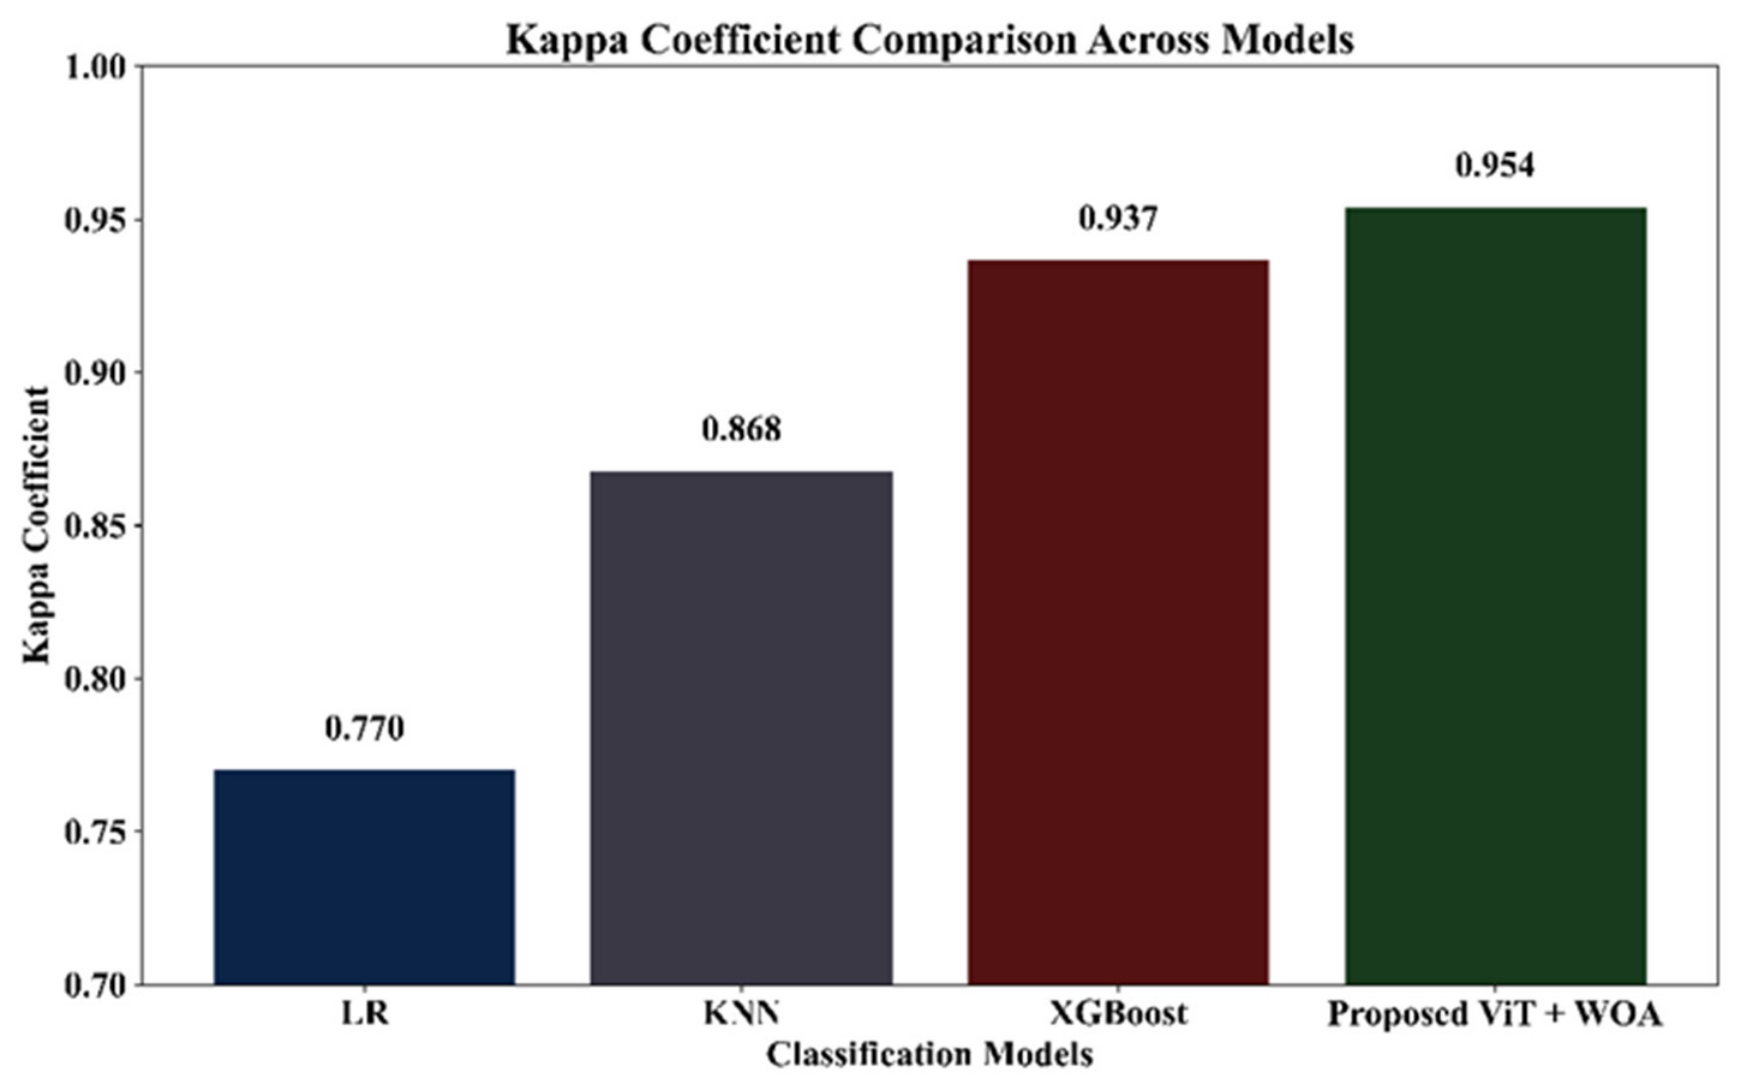
The Kappa coefficients of different models are shown in Figure 16. The proposed ViT + WOA model achieved the highest Kappa value of 0.954, outperforming LR, KNN, and XGBoost, which indicates better classification accuracy and reliability.
The proposed ViT + WOA framework achieved the best performance with 96.93% accuracy, 97.19% precision, 96.93% recall, 96.92% F1-score, and 0.9540 Kappa coefficient, as shown in Table 5. The model also achieved an efficient execution time of 1.88 s, demonstrating improved SWIR-based environmental condition classification performance for nanosatellite remote sensing applications.
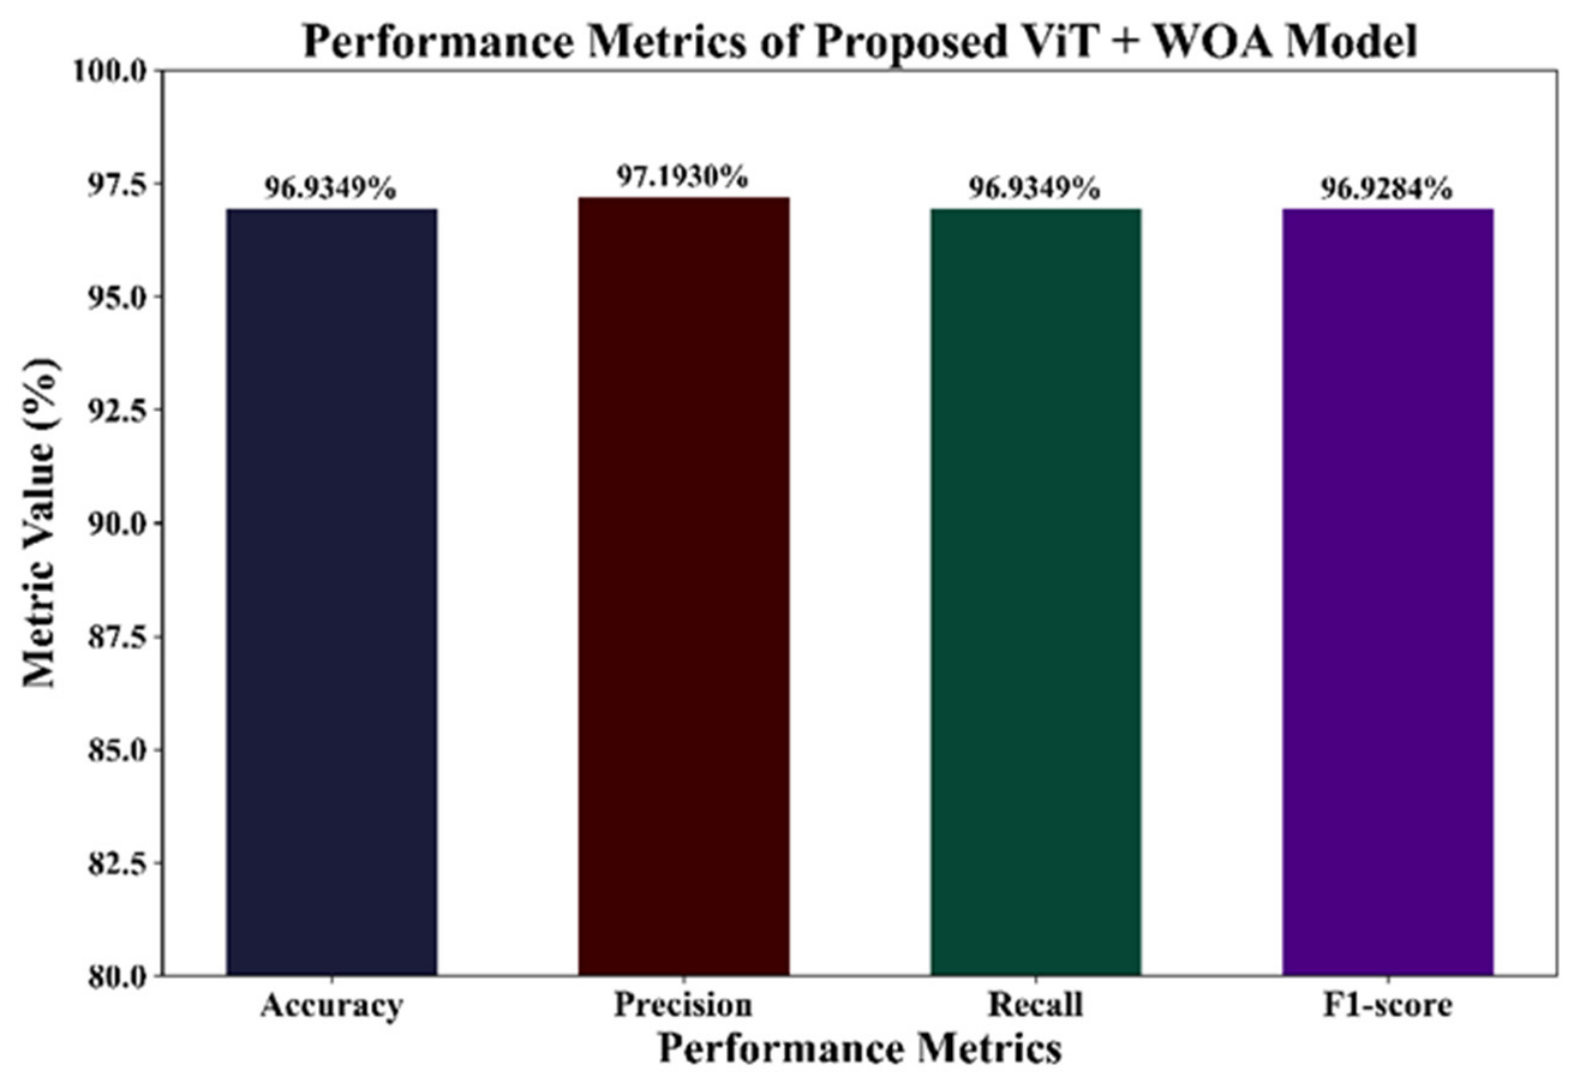
The performance of the proposed ViT + WOA model using accuracy, precision, recall and F1-score metrics is shown in Figure 17. The model achieves high results in all metrics, with precision being the highest at 97.1930%, indicating strong and reliable classification performance.
Table 6 compares the proposed ViT–WOA framework with representative deep learning models. The proposed framework achieved the highest classification accuracy (96.93%), precision (97.19%), recall (96.93%), F1-score (96.92%), and Kappa coefficient (0.954). Compared with the baseline ViT, the WOA-optimized model improved classification performance, demonstrating the effectiveness of WOA-based hyperparameter optimization.
As shown in Table 6, the ViT–WOA framework achieved the highest classification accuracy of 96.93%, surpassing conventional CNN-based models, recurrent neural networks, hybrid CNN-LSTM architecture, modern convolutional networks including ResNet18, DenseNet121, EfficientNet-B0, and transformer-based models such as Swin Transformer and the baseline Vision Transformer. Although the proposed framework requires slightly longer training time than the baseline ViT model due to the optimization process, it provides superior classification accuracy, F1-score, and Kappa coefficient without increasing the model complexity, demonstrating the effectiveness of WOA-guided hyperparameter optimization.
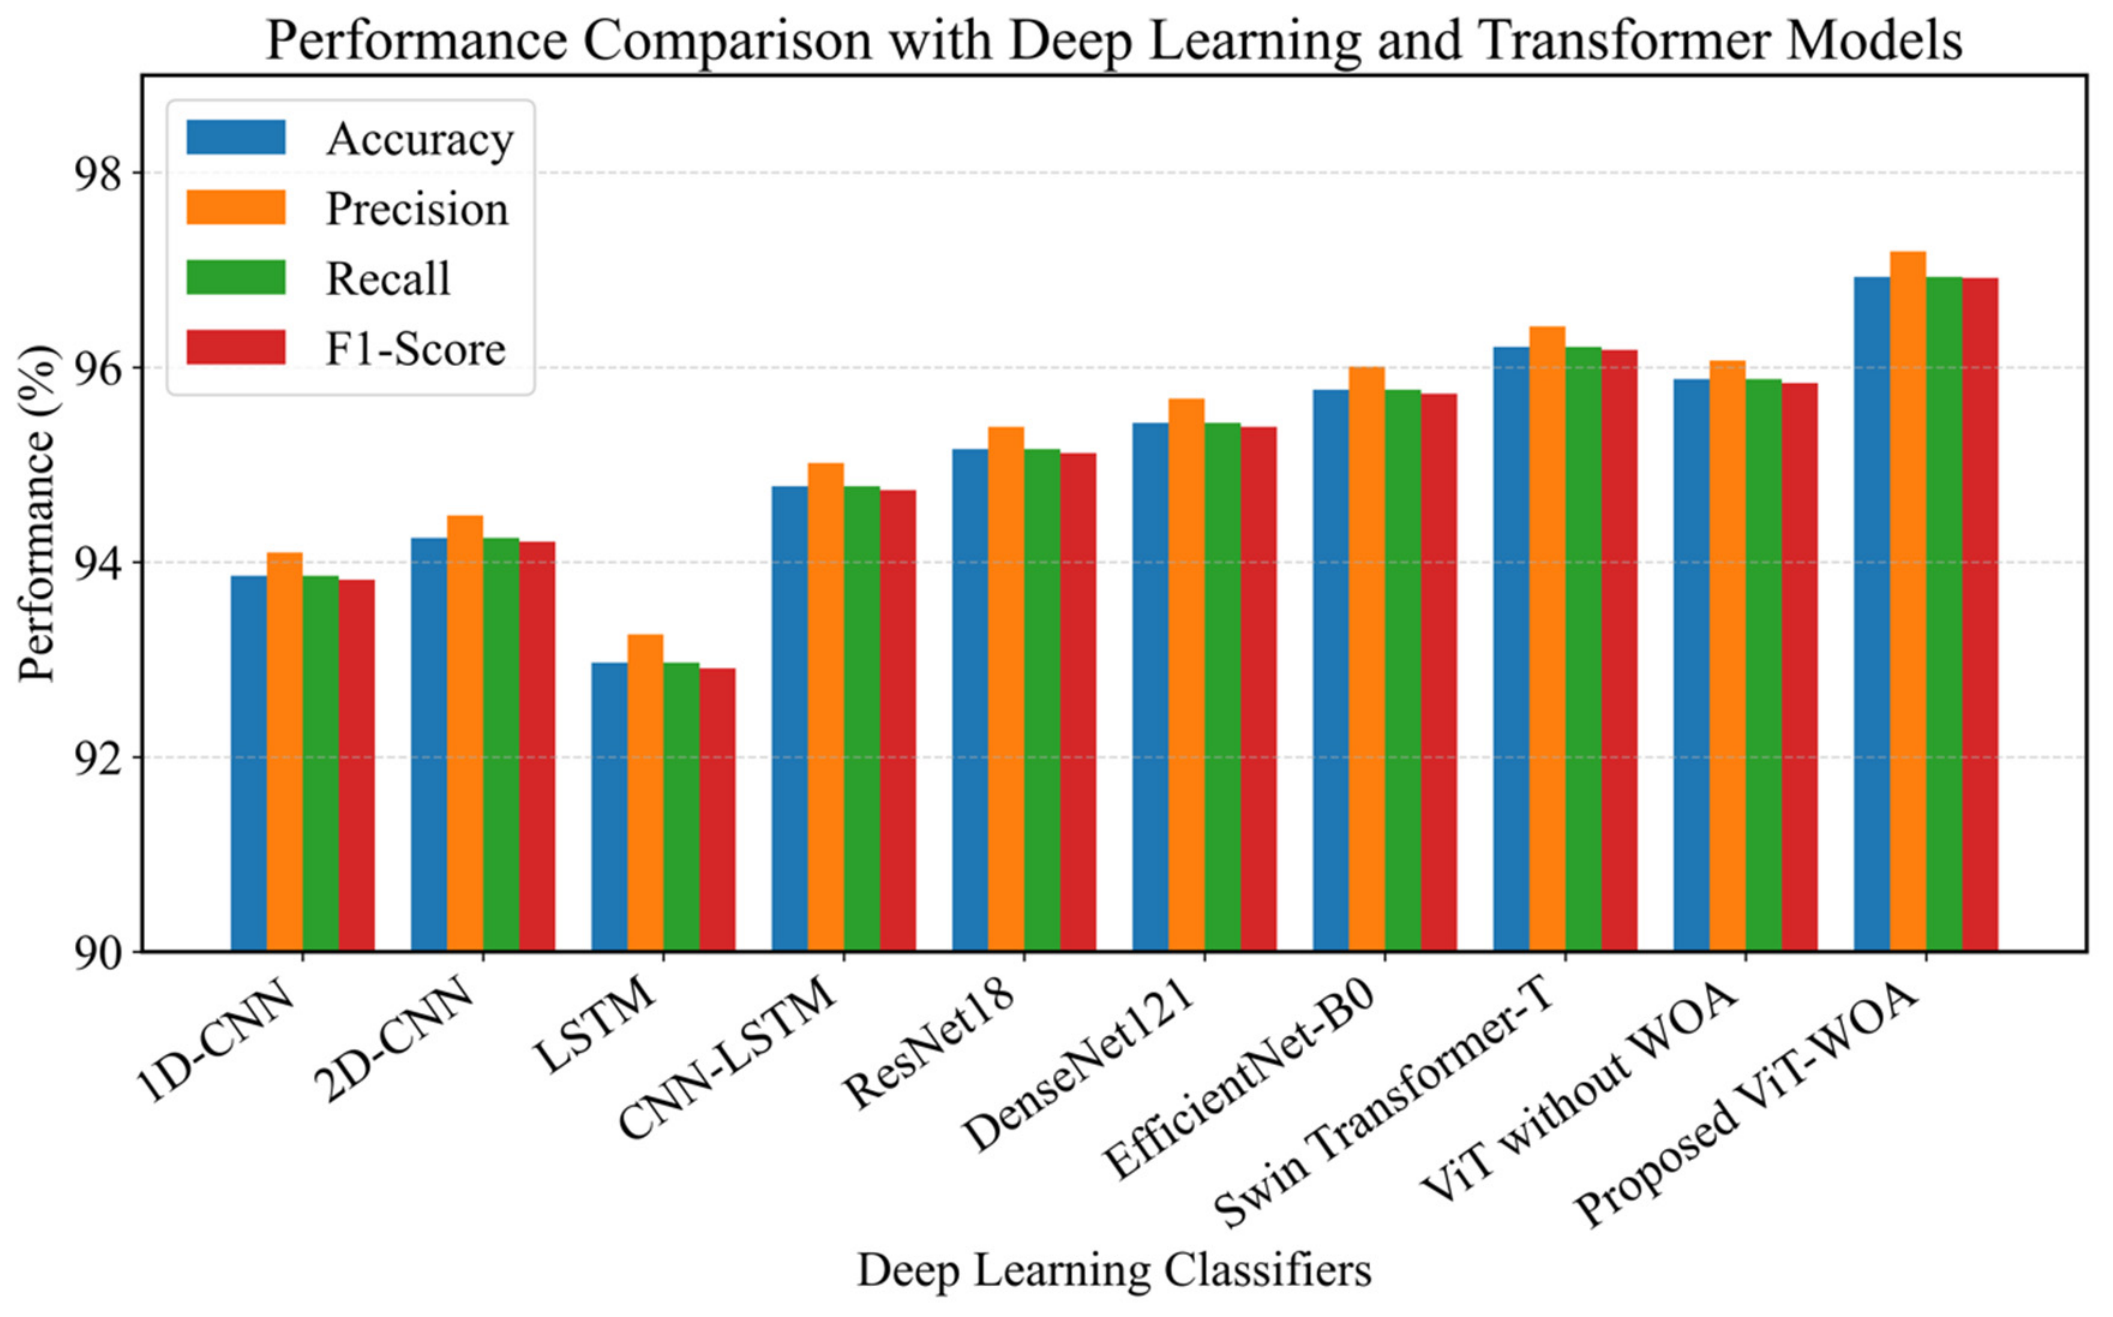
Figure 18 illustrates the comparative performance of the proposed ViT–WOA framework against representative deep learning and transformer models. The proposed framework consistently achieved the highest accuracy, precision, recall, and F1-score, demonstrating the effectiveness of WOA-based optimization in enhancing the classification capability of the Vision Transformer model.
Table 7 demonstrates that the proposed WOA-based optimization consistently outperformed conventional hyperparameter optimization strategies. Compared with Grid Search and Random Search, the WOA achieved substantially higher classification accuracy while requiring fewer convergence epochs. Although Bayesian Optimization, PSO, and GWO produced competitive results, the WOA attained the lowest validation loss (0.06), the highest classification accuracy (96.93%), the highest Kappa coefficient (0.954), and converged within only 36 epochs, while also requiring the shortest overall optimization time among all evaluated methods. These findings indicate that the WOA provides a better balance between optimization efficiency, computational cost, convergence speed, and classification robustness for the proposed ViT framework.
To test the robustness of the proposed ViT–WOA framework, experiments were conducted under different perturbation conditions, including Gaussian noise, missing spectral values, and brightness variations. As shown in Table 8, the proposed model consistently maintained high classification performance, achieving accuracy above 95% and Kappa values above 0.92 across all test conditions. These results demonstrate the robustness and reliability of the proposed framework for multispectral SWIR environmental condition classification.
Table 9 compares the proposed MI + SWIR filter mapping method with representative state-of-the-art band selection techniques. The proposed method achieved the highest accuracy (96.93%), precision (97.19%), recall (96.93%), F1-score (96.92%), and Kappa coefficient (0.954), while requiring only 7.8 s for band selection. These results demonstrate its superior classification performance and computational efficiency compared with existing band selection methods.

4.14. Ablation Study

The ablation study shows that model performance improved with feature selection and WOA optimization in Table 10. The ViT-only model achieved 91.81% accuracy, while the ViT model with feature selection reached 93.69%. The ViT + WOA model achieved 95.25% accuracy, and the proposed ViT + WOA framework obtained the highest accuracy of 96.93% with a Kappa coefficient of 0.9540, demonstrating improved SWIR classification performance.

4.15. Discussion

The results and discussion demonstrate that the proposed ViT-WOA framework achieved effective SWIR-based environmental condition classification using multispectral satellite images. The proposed model obtained 96.93% accuracy, 97.19% precision, 96.93% recall, and 96.92% F1-score, indicating reliable classification performance for cloudy, rainy, and sunny conditions. The selected spectral bands B05 (Red Edge), B08 (NIR), B11 (SWIR-1), and B12 (SWIR-2) contributed to effective spectral feature extraction and optimal nanosatellite payload configuration. Compared with existing remote sensing and ML approaches, the proposed framework provided improved spectral feature learning, optimized band selection, and reduced classification error. The ViT model effectively captured spatial and spectral relationships, while the WOA enhanced parameter optimization and convergence performance. The framework was validated using a limited multispectral dataset and simulated SWIR mapping rather than real onboard SWIR nanosatellite sensors.

5. Conclusions and Future Scope

In conclusion, the suggested ViT-WOA framework successfully generated a filter selection system for four-band optical payloads in nanosatellite-based remote sensing systems using multispectral images. The filters selected by applying MI-based band selection and SWIR filter mapping were B05, B08, B11, and B12. The ViT model could efficiently extract both spatial and spectral features of images while the WOA improved parameter tuning. As per the results, the proposed model was highly accurate with a classification rate of 96.93%, providing reliable classification of cloudy, rainy, and sunny conditions. There is a reduction in classification loss and improvement in spectral feature learning efficiency compared to traditional systems. The use of SWIR spectra analysis, optimal band selection, transformation learning, and optimization algorithms has contributed towards improving the design and performance of nanosatellites and their payloads. The proposed ViT–WOA framework provides an effective and intelligent solution for SWIR remote sensing nanosatellite applications. Future research could involve the incorporation of actual nanosatellite sensors onboard with SWIR capability as well as hyperspectral remote sensing data to enhance the robustness and efficiency of the proposed method. There is an opportunity to explore further development in terms of using advanced transformer models, adaptive optimization, and edge-AI approaches for space-based applications. A limitation of the present study is that validation was performed using simulated Sentinel-2 multispectral data rather than data acquired from an operational nanosatellite SWIR sensor, since real CubeSat SWIR flight data is difficult to obtain prior to mission deployment. Further work will focus on establishing a correlation analysis between the simulator-derived spectral bands and ground-based or airborne SWIR sensor measurements, as well as validating the proposed ViT-WOA framework using calibrated SWIR data from an actual CubeSat payload once available. Future work will also consider the integration of system-level optical payload parameters, including detector selection, signal-to-noise ratio, and radiometric calibration, to extend the present spectral band selection and classification framework toward a complete payload development methodology.

Author Contributions

Conceptualization, B.Z. and A.Z.; Methodology A.Z. and B.Z.; software, A.O.; validation, B.Z. and A.Z.; formal analysis, A.O., B.Z., and A.Z.; investigation S.K., A.S., B.Z., and A.O.; resources, B.Z., A.O., and A.Z.; data curation, A.M., A.S., and B.Z.; writing—original draft preparation, A.Z.; writing—review and editing, A.Z. and B.Z.; visualization, A.Z. and A.M.; supervision, S.K. and B.Z.; project administration, B.Z.; funding acquisition, A.Z. All authors have read and agreed to the published version of the manuscript.

Funding

This research was funded by the Science Committee of the Ministry of Science and Higher Education of the Republic of Kazakhstan, Research Identification Registration Number (IRN) BR27198365.

Institutional Review Board Statement

Not applicable.

Informed Consent Statement

Not applicable.

Data Availability Statement

The data presented in this study are available upon request from the corresponding authors.

Conflicts of Interest

All authors were employed by the company Ghalam LLP. The remaining authors declare that the research was conducted in the absence of any commercial or financial relationships that could be construed as a potential conflicts of interest.

References

  1. Borges, D.E.; Ramage, S.; Green, D.; Justice, C.; Nakalembe, C.; Whitcraft, A.; Barker, B.; Becker-Reshef, I.; Balagizi, C.; Salvi, S.; et al. Earth observations into action: The systemic integration of earth observation applications into national risk reduction decision structures. Disaster Prev. Manag. 2023, 32, 163–185. [Google Scholar] [CrossRef]
  2. Lewis, M.D.; Jarreau, B.; Jolliff, J.; Ladner, S.; Lawson, T.A.; McCarthy, S.; Martinolich, P.; Montes, M. Assessing Planet Nanosatellite Sensors for Ocean Color Usage. Remote Sens. 2023, 15, 5359. [Google Scholar] [CrossRef]
  3. Song, Y.; Lu, L.; Cheng, B.; Li, Z.; Tang, G.; Li, Q.; Liu, S.; Li, C.; Zhao, B.; Qi, H.; et al. Thermal design and on-orbit performance of remote sensing cameras on commercial microsatellites. Appl. Therm. Eng. 2025, 281, 128505. [Google Scholar] [CrossRef]
  4. Sivaprakasam, V.; Lin, D.; Yetzbacher, M.K.; Gemar, H.E.; Portier, J.M.; Watnik, A.T. Multi-spectral SWIR lidar for imaging and spectral discrimination through partial obscurations. Opt. Express 2023, 31, 5443–5457. [Google Scholar] [CrossRef] [PubMed]
  5. Kerrouche, K.D.E.; Wang, L.; Seddjar, A.; Rastinasab, V.; Oukil, S.; Ghaffour, Y.M.; Nouar, L. Applications of Nanosatellites in Constellation: Overview and Feasibility Study for a Space Mission Based on Internet of Space Things Applications Used for AIS and Fire Detection. Sensors 2023, 23, 6232. [Google Scholar] [CrossRef] [PubMed]
  6. Bathiany, S.; Bastiaansen, R.; Bastos, A.; Blaschke, L.; Lever, J.; Loriani, S.; De Keersmaecker, W.; Dorigo, W.; Milenković, M.; Senf, C.; et al. Ecosystem Resilience Monitoring and Early Warning Using Earth Observation Data: Challenges and Outlook. Surv. Geophys. 2025, 46, 265–301. [Google Scholar] [CrossRef]
  7. Naumann, P.; Sands, T. Micro-Satellite Systems Design, Integration, and Flight. Micromachines 2024, 15, 455. [Google Scholar] [CrossRef] [PubMed]
  8. Mateo-Garcia, G.; Veitch-Michaelis, J.; Purcell, C.; Longepe, N.; Reid, S.; Anlind, A.; Bruhn, F.; Parr, J.; Mathieu, P.P. In-orbit demonstration of a re-trainable machine learning payload for processing optical imagery. Sci. Rep. 2023, 13, 10391. [Google Scholar] [CrossRef] [PubMed]
  9. Mayorova, V.; Morozov, A.; Golyak, I.; Golyak, I.; Lazarev, N.; Melnikova, V.; Rachkin, D.; Svirin, V.; Tenenbaum, S.; Vintaykin, I.; et al. Determination of Greenhouse Gas Concentrations from the 16U CubeSat Spacecraft Using Fourier Transform Infrared Spectroscopy. Sensors 2023, 23, 6794. [Google Scholar] [CrossRef] [PubMed]
  10. Westover, T.; Westhoff, Z.; Poff, S.; Morrill, N.; Miller, D.; Chiang, S.-H.W.; Vanfleet, R.; Davis, R.C. Miniaturized short-wavelength infrared spectrometer for diffuse light applications. Adv. Photonics Nexus 2023, 2, 066003. [Google Scholar] [CrossRef]
  11. Estacio, I.; Sianipar, C.P.M.; Onitsuka, K.; Basu, M.; Hoshino, S. A statistical model of land use/cover change integrating logistic and linear models: An application to agricultural abandonment. Int. J. Appl. Earth Obs. Geoinf. 2023, 120, 103339. [Google Scholar] [CrossRef]
  12. Zhang, H.; He, J.; Chen, S.; Zhan, Y.; Bai, Y.; Qin, Y. Comparing Three Methods of Selecting Training Samples in Supervised Classification of Multispectral Remote Sensing Images. Sensors 2023, 23, 8530. [Google Scholar] [CrossRef] [PubMed]
  13. Zhao, F.; Yang, T.; Wang, W.; Han, W.; Wang, G.; Qiao, J.; Kong, X.; Liu, L.; Si, A.; Wang, F.; et al. High-Throughput Evaluation of Cotton Drought Tolerance Using UAV Multispectral Imagery and XGBoost-Based Machine Learning. Agronomy 2026, 16, 526. [Google Scholar] [CrossRef]
  14. Kathirvelu, K.; Yesudhas, A.V.P.; Ramanathan, S. Spectral unmixing based random forest classifier for detecting surface water changes in multitemporal pansharpened Landsat image. Expert Syst. Appl. 2023, 224, 120072. [Google Scholar] [CrossRef]
  15. Sugumar, R.; Suganya, D. A multi-spectral image-based high-level classification based on a modified SVM with enhanced PCA and hybrid metaheuristic algorithm. Remote Sens. Appl. Soc. Environ. 2023, 31, 100984. [Google Scholar] [CrossRef]
  16. Colodro-Conde, C. Performance Estimation of a Medium-Resolution Earth Observation Sensor Using Nanosatellite Replica. Sensors 2024, 24, 3160. [Google Scholar] [CrossRef] [PubMed]
  17. Fevgas, G.; Lagkas, T.; Sarigiannidis, P.; Argyriou, V. Advances in Remote Sensing and Propulsion Systems for Earth Observation Nanosatellites. Future Internet 2025, 17, 16. [Google Scholar] [CrossRef]
  18. Najafabadi, M.A.; Kazemi, I. Systemic design of the very-high-resolution imaging payload of an optical remote sensing satellite for launch into the VLEO using an small launch vehicle. Heliyon 2024, 10, e27404. [Google Scholar] [CrossRef] [PubMed]
  19. Abdizhalilova, L.; Temirbayev, A.A.; Li, P.; Uzbekov, N.; Orynbassar, S.; Beisen, A.; Geroyeva, Z.; Tokmyrzaev, D.; Meirambekuly, N. The Evaluation of Nanosatellite Missions: Statistical Analysis of Missions for Payloads. IEEE Access 2025, 13, 160536–160548. [Google Scholar] [CrossRef]
  20. Rodríguez-Molina, A.; Santana, A.; Machado, F.; Barrios, Y.; Hernández-Suárez, E.; Pérez-García, Á.; Díaz, M.; Santana, R.; Sánchez, A.J.; López, J.F. Bentayga-I: Development of a Low-Cost and Open-Source Multispectral CubeSat for Marine Environment Monitoring and Prevention. Sensors 2024, 24, 7648. [Google Scholar] [CrossRef] [PubMed]
  21. Ustin, S.L.; Middleton, E.M. Current and Near-Term Earth-Observing Environmental Satellites, Their Missions, Characteristics, Instruments, and Applications. Sensors 2024, 24, 3488. [Google Scholar] [CrossRef] [PubMed]
  22. Meoni, G.; Prete, R.D.; Serva, F.; De Beusscher, A.; Colin, O.; Longépé, N. Unlocking the Use of Raw Multispectral Earth Observation Imagery for Onboard Artificial Intelligence. IEEE J. Sel. Top. Appl. Earth Obs. Remote Sens. 2024, 17, 12521–12537. [Google Scholar] [CrossRef]
  23. Chanoui, M.A.; El Wafi, I.; Khalil, I.; Sbihi, M.; Alaoui Ismaili, Z.E.A.; Guennoun, Z. Optimizing nanosatellites Earth observation missions: Orbit design for global coverage and pre-launch cloud detection dataset preparation. Results Eng. 2024, 24, 103324. [Google Scholar] [CrossRef]
  24. Wu, W.; Jin, Z.; Wang, C. Satellite position and attitude estimation using an infrared earth sensor. Infrared Phys. Technol. 2024, 141, 105381. [Google Scholar] [CrossRef]
  25. Pavlović, M.; Banjac, Z.; Kovačević, B. Object Tracking in SWIR Imaging Based on Both Correlation and Robust Kalman Filters. IEEE Access 2023, 11, 63834–63851. [Google Scholar] [CrossRef]
  26. Bessonov, A.; Rozanov, A.; White, R.; Suwito, G.; Medina-Salazar, I.; Lutfullin, M.; Gusev, D.; Shikov, I. All-Weather Drone Vision: Passive SWIR Imaging in Fog and Rain. Drones 2025, 9, 553. [Google Scholar] [CrossRef]
  27. Rao, C.V.N.; Putrevu, D.; Ramanujam, V.M.; Bhattacharya, B.K.; Patnaik, C.; Pandey, D.K.; Das, A.; P., J.; Chakraborty, A.; Ramakrishnan, R.; et al. Radar Imaging with India’s Earth Observation Satellite-04: Earth resource monitoring using C-band synthetic aperture radar system. IEEE Geosci. Remote Sens. Mag. 2025, 13, 152–181. [Google Scholar] [CrossRef]
  28. Muir, F.M.E.; Hurst, M.D.; Richardson-Foulger, L.; Rennie, A.F.; Naylor, L.A. VedgeSat: An automated, open-source toolkit for coastal change monitoring using satellite-derived vegetation edges. Earth Surf. Process. Landf. 2024, 49, 2405–2423. [Google Scholar] [CrossRef]
  29. Sun, W.; Du, Q. Hyperspectral Band Selection: A Review. IEEE Geosci. Remote Sens. Mag. 2019, 7, 118–139. [Google Scholar] [CrossRef]
  30. Akzhigitov, D.; Zhumazhanov, B.; Kulakayeva, A.; Zhumazhanov, B.; Kapar, A. Evaluation of the Mechanical Stability of Optical Payloads for Remote Sensing Satellites Based on Analysis and Testing Results. Sensors 2025, 25, 6546. [Google Scholar] [CrossRef] [PubMed]
  31. Multispectral Images of Fields. Available online: https://www.kaggle.com/datasets/honeybadger128bit/multespectral-field-images (accessed on 14 May 2026).
Figure 1. Overall proposed methodology.
Aerospace 13 00665 g001
Figure 2. ViT architecture diagram.
Aerospace 13 00665 g002
Figure 3. Flow diagram of the WOA.
Aerospace 13 00665 g003
Figure 4. Training vs. validation accuracy and loss graph.
Aerospace 13 00665 g004
Figure 5. Confusion Matrix.
Aerospace 13 00665 g005
Figure 6. ROI selection visualization.
Aerospace 13 00665 g006
Figure 7. ViT attention map.
Aerospace 13 00665 g007
Figure 8. Optimal four-band selection importance distribution.
Aerospace 13 00665 g008
Figure 9. Spectral band sensitivity analysis for nanosatellite payload.
Aerospace 13 00665 g009
Figure 10. SWIR filter response curve for the selected bands.
Aerospace 13 00665 g010
Figure 11. Feature reduction on classification performance.
Aerospace 13 00665 g011
Figure 12. Comparison of selected vs. non-selected SWIR bands.
Aerospace 13 00665 g012
Figure 13. ROC curve analysis.
Aerospace 13 00665 g013
Figure 14. WOA optimization convergence.
Aerospace 13 00665 g014
Figure 15. Execution time comparison.
Aerospace 13 00665 g015
Figure 16. Kappa coefficient comparison.
Aerospace 13 00665 g016
Figure 17. Performance metrics for the proposed.
Aerospace 13 00665 g017
Figure 18. Performance comparison of the proposed ViT–WOA framework with representative deep learning and transformer models.
Aerospace 13 00665 g018
Table 1. Comparison of the existing methods.
Author FocusTechniques Title 3Title 4
Colodro-Conde [16]Earth observation sensor performance estimationSensor simulation and imaging estimationAdvantagesLimitations
Fevgas et al. [17]Remote sensing nanosatellite systemsPropulsion and satellite integrationImproved imaging qualityNo SWIR band optimization
Najafabadi and Kazemi [18]High-resolution satellite payload designPayload system optimizationEnhanced mission flexibilityNo multispectral payload analysis
Abdizhalilova et al. [19]Nanosatellite mission evaluationStatistical mission analysisImproved imaging resolutionHigh computational complexity
Rodríguez-Molina et al. [20]Multispectral CubeSat monitoringCubeSat multispectral imagingReliable mission assessmentNo intelligent image analysis
Ustin and Middleton [21]Earth observation satellites Satellite sensor analysisCost-effective monitoringLacks SWIR optimization
Meoni et al. [22]Onboard AI for multispectral
imagery
DL-based onboard processingComprehensive environmental monitoring studyNo optimization framework
Chanoui et al. [23]Nanosatellite
mission optimization
Orbit optimization and cloud detectionReduced transmission requirementHigh onboard computation
Wu et al. [24]Satellite attitude estimationInfrared Earth sensingImproved global coverageNo spectral classification
Pavlović et al. [25]SWIR object trackingCorrelation and Kalman filteringAccurate position estimationNo multispectral analysis
Bessonov et al. [26]SWIR drone vision in bad weatherPassive SWIR imagingRobust SWIR trackingNo payload optimization
Rao et al. [27]Radar-based Earth observationC-band SAR imagingImproved fog/rain visibilityNot suitable for nanosatellites
Muir et al. [28]Coastal monitoring using satellite imagesVegetation edge detectionEffective Earth monitoringNo SWIR spectral analysis
Table 2. Dataset class distribution and training–testing data split.
Class LabelDataset ClassTraining Samples (80%)Testing Samples (20%)
C1Sunny Condition800200
C2Cloudy Condition720180
C3Rainy Condition640160
Table 3. Selected Sentinel-2 spectral bands for four-band SWIR optical payload configuration.
BandNameWavelength RangeSpectral RegionMain Application
B05Vegetation Red Edge~705 nmRed EdgeVegetation health analysis
B08Near Infrared (NIR)~842 nmNIRCrop and land monitoring
B11SWIR-1~1610 nmShort-Wave InfraredMoisture and soil analysis
B12SWIR-2~2190 nmShort-Wave InfraredMineral and vegetation stress detection
Table 4. Five-fold cross-validation results of the proposed ViT–WOA framework.
FoldAccuracy (%)Precision (%)Recall (%)F1-Score (%)Kappa
Fold 196.7197.0296.6896.840.951
Fold 297.0897.3197.0597.180.956
Fold 396.8897.1596.9196.990.953
Fold 497.1297.3697.197.220.957
Fold 596.8597.1196.8996.950.953
Mean ± SD96.93 ± 0.1797.19 ± 0.1496.93 ± 0.1797.04 ± 0.160.954 ± 0.002
Table 5. Comparison table for existing and proposed methods.
ModelAccuracy (%)Precision (%)Recall (%)F1-Score (%)KappaExecution Time (s)
LR [11]84.6743384.7603984.6743384.656080.7701150.036172
KNN [12]91.1877491.4583391.1877491.083140.8678161.401454
XGBoost [13]95.7854495.9751895.7854495.778610.9367822.460041
Proposed ViT + WOA96.9348797.1929896.9348796.928370.9540231.887635
Table 6. Performance comparison of the proposed ViT–WOA framework with representative deep learning models.
ModelAccuracy (%)Precision (%)Recall (%)F1-Score (%)KappaParams (M)Training Time (min)
1D-CNN93.8694.193.8693.820.9081.28.4
2D-CNN94.2594.4894.2594.210.9142.811.2
LSTM92.9793.2692.9792.910.8951.610.6
CNN-LSTM94.7895.0294.7894.740.9213.414.7
ResNet1895.1695.3995.1695.120.92711.218.5
DenseNet12195.4395.6895.4395.390.9317.921.3
EfficientNet-B095.7796.0195.7795.730.9365.319.8
Swin Transformer-T96.2196.4296.2196.180.94328.331.4
ViT without WOA95.8896.0795.8895.840.93885.827.6
Proposed ViT-WOA96.9397.1996.9396.920.95485.829.1
Table 7. Comparison of hyperparameter optimization strategies for the Vision Transformer model.
OptimizerAccuracy (%)F1-Score (%)KappaBest Validation LossConvergence EpochOptimization Time (min)
Grid Search + ViT95.3495.290.930.1125244.5
Random Search + ViT95.6195.560.9340.1044936.2
Bayesian Optimization + ViT96.2896.240.9440.0834334.8
GA + ViT96.04960.940.0914632.7
PSO + ViT96.3196.270.9450.084130.5
GWO + ViT96.4296.380.9470.0773930.1
WOA + ViT96.9396.920.9540.063629.1
Table 8. Robustness analysis of the proposed ViT–WOA framework under different data perturbation conditions.
Test ConditionAccuracy (%)F1-Score (%)Kappa
Clean test data96.9396.920.954
Gaussian noise sigma = 0.0196.4196.390.946
Gaussian noise sigma = 0.0395.8295.790.937
Gaussian noise sigma = 0.0595.1695.120.927
10% missing spectral values95.7495.70.936
15% brightness variation95.9395.90.939
Table 9. Performance comparison with representative state-of-the-art band selection methods.
Band Selection MethodSelected BandsAccuracy (%)Precision (%)Recall (%)F1-Score (%)KappaSelection Time (s)
PCA-based Band Selection492.4192.769292.380.898.6
Relief493.1893.429393.150.910.2
mRMR494.0294.39493.980.9111.8
CFS493.6493.879493.590.99.9
Sequential Forward Selection494.8795.019594.840.9218.7
GA-based Band Selection495.1295.349595.090.9324.6
PSO-based Band Selection495.4895.719595.450.9322.4
Proposed MI + SWIR Filter Mapping496.9397.199796.920.957.8
Table 10. Ablation study.
Model Accuracy (%)F1-Score (%)Recall (%)F1-Score (%)Kappa
ViT only91.8148791.9183791.9175291.913870.864023
ViT + Feature Selection93.6948793.7483792.897993.58730.893023
ViT + WOA95.2548795.4083795.7854495.778610.926023
Proposed ViT + WOA96.9348796.9283796.9348796.928370.954023
Disclaimer/Publisher’s Note: The statements, opinions and data contained in all publications are solely those of the individual author(s) and contributor(s) and not of MDPI and/or the editor(s). MDPI and/or the editor(s) disclaim responsibility for any injury to people or property resulting from any ideas, methods, instructions or products referred to in the content.