Article

Unsteady Buzz Characteristics of a Dorsal Supersonic Bump Inlet Based on Wind-Tunnel Tests and Numerical Simulations


1
School of Civil Aviation, Northwestern Polytechnical University, Xi’an 710072, China
2
Chengdu Aeronautic Vocational and Technical University, Chengdu 610100, China
3
High-Speed Aerodynamic Institute, China Aerodynamics Research and Development Center, Mianyang 621000, China
*
Author to whom correspondence should be addressed.
Aerospace 2026, 13(7), 631; https://doi.org/10.3390/aerospace13070631
Submission received: 15 June 2026 / Revised: 9 July 2026 / Accepted: 10 July 2026 / Published: 11 July 2026
(This article belongs to the Section Aeronautics)

Abstract

The unsteady buzz characteristics of a dorsal supersonic bump inlet for a flying-wing configuration are investigated using wind-tunnel tests and three-dimensional unsteady numerical simulations. This study focuses on off-design operation at a freestream Mach number of 1.8, with particular attention to the effects of angle of attack and downstream throttling on shock motion, pressure oscillation, and inlet stability. Wind-tunnel measurements show that the onset and development of buzz are highly sensitive to angle of attack. At high angles of attack, pressure oscillations first appear near the inlet compression surface and subsequently develop into large-amplitude fluctuations at the aerodynamic interface plane. The dominant experimental buzz frequency is approximately 60–70 Hz, and the numerical prediction of 71 Hz agrees well with the measured dominant frequency of 66 Hz. The simulations further reveal a strongly three-dimensional buzz cycle in which asymmetric separation over the bump, spanwise accumulation and discharge of low-energy flow, and alternating inlet blockage and recovery govern the large-amplitude shock excursion. The oscillatory flow field is dominated by shock–system expulsion and ingestion on the spanwise side with stronger back-pressure tolerance, accompanied by the formation of strong and weak shear layers during different stages of the cycle. These results provide insight into the buzz mechanism of dorsal bump inlets and support the assessment of starting performance and stable operating limits for supersonic inlets integrated with flying-wing configurations.

1. Introduction

As the foremost aerodynamic component of supersonic/hypersonic propulsion systems, the supersonic inlet directly affects the total pressure recovery, mass-flow capture, thrust output, and operating stability of the propulsion system [1,2]. Whether the inlet can achieve stable starting is an important prerequisite for the vehicle to maintain normal supersonic flight. When the freestream condition, throttling state, or downstream engine operating condition changes, the inlet may transition from a supercritical or critical state to a subcritical state, accompanied by phenomena such as upstream movement of the terminal shock, enhanced shock/boundary-layer interaction, inlet flow separation, reduced captured mass-flow, and decreased total pressure recovery [3,4].
When the captured mass-flow of an inlet falls below a certain threshold, inlet buzz may be triggered. Supersonic inlet buzz is typically characterized by periodic reciprocating motion of the shock system at the inlet entrance and within the internal duct, accompanied by large-amplitude unsteady fluctuations in pressure, mass-flow, and aerodynamic loads inside the duct. In severe cases, it may lead to thrust degradation of the propulsion system, intensified structural vibration, increased thermal loads, and even engine instability [5,6]. Existing studies generally classify inlet operating conditions into supercritical, critical, and subcritical states, and regard flow instability and shock oscillation under subcritical conditions as important foundations for the formation of buzz [7].
The phenomenon of supersonic inlet buzz can be traced back to the early work of Oswatitsch on pressure recovery and shock diffusion in high-speed diffusers [8]. Subsequently, Ferri and Nucci proposed a buzz-triggering mechanism associated with the interaction among the conical shock, the normal shock expelled from the cowl lip, and the vortex sheet, which is commonly known as the Ferri criterion [9]. Dailey argued that major buzz primarily originates from separation and inlet blockage induced by the interaction between the expelled shock and the boundary layer on the compression surface or center-body cone, namely the Dailey criterion [10]. Fisher et al. further observed two types of unstable oscillations, minor buzz and major buzz, in a variable-ramp inlet, and pointed out that they exhibit significant differences in both oscillation amplitude and flow structure [11].
In subsequent experimental studies, Nagashima et al. controlled the throttling ratio (T.R.) using a movable blockage body and investigated the buzz characteristics of an axisymmetric supersonic inlet at Ma ≈ 2. They found that minor buzz and major buzz exhibited characteristic frequencies of approximately 120 Hz and 360 Hz, respectively [12]. Trapier et al. conducted wind-tunnel experiments on a two-dimensional mixed-compression rectangular inlet, obtaining schlieren images and wall-pressure oscillation data during minor- and major buzz processes. They pointed out that minor buzz is characterized by high frequency and low amplitude, whereas major buzz exhibits low-frequency and high-amplitude characteristics [13]. Subsequently, they employed the DDES method to perform high-fidelity numerical simulations of buzz in this type of inlet, revealing the coupling relationship between the internal flow-field structure and pressure oscillations [14]. Lee et al. compared the flow characteristics of small-scale rectangular and axisymmetric supersonic inlets and indicated that inlet geometric scale and separation disturbances on the compression surface affect the minor buzz frequency and oscillation characteristics [15]. Soltani et al. observed a new buzz mode in an axisymmetric mixed-compression inlet that exhibited features of both minor buzz and major buzz [16].
In recent years, Chen et al. carried out experimental investigations of an external-compression inlet under different throttling conditions and analyzed various oscillation modes, including minor buzz, mixed buzz, and major buzz. They suggested that the form of inlet buzz is closely related to terminal-shock motion, compression-surface separation, inlet blockage, and acoustic feedback within the internal duct [17,18]. In terms of numerical simulation, Newsome was among the first to simulate near-critical and subcritical unsteady inlet flows using the Navier–Stokes equations and proposed an acoustic-feedback expression for estimating the buzz frequency. Lu and Jain further modified the upstream feedback mechanism based on the Dailey inlet model, arguing that the buzz cycle is associated with the coupling between inlet-entry instability and acoustic resonance in the internal duct [19]. Hankey and Shang regarded inlet buzz as a flow-induced self-excited oscillation phenomenon and proposed a relation for estimating the self-excited oscillation frequency [20]. The computational studies by Chima, Hong, Kim, and others also demonstrated that the buzz frequency and pressure-oscillation characteristics of inlets are closely related to internal-duct acoustic resonance, mass-flow-rate hysteresis, and shock motion [21].
In addition to traditional experiments and numerical simulations, mathematical modeling, reduced-order models, and modal decomposition methods have also been employed to interpret and predict inlet buzz. Chang et al. established a mathematical model and a rapid identification method for hypersonic inlet buzz and further proposed a reduced-order dynamic model for buzz in scramjet inlets [22,23]. Yamamoto et al. proposed a prediction model for supersonic inlet buzz onset based on the concept of delayed feedback [24]. Luo et al. used the POD method to investigate the spatiotemporal structures and suppression mechanisms of supersonic inlet buzz, providing a reference for identifying dominant oscillation modes and implementing flow control [25].
To extend the stable operating boundary of inlets, researchers have also investigated various flow-control methods. For example, boundary-layer suction can be used to weaken shock/boundary-layer interaction and delay flow separation [26]. Boundary-layer blowing or jet control can improve the back-pressure tolerance of the isolator and regulate internal pressure propagation [27]. Vortex generators, micro-vortex generators, plasma actuation, and slot/cavity-based methods have also been applied to control shock/boundary-layer interaction and unsteady separated flows [28,29,30]. Although extensive studies have been conducted on supersonic inlet buzz, most previous investigations have focused on axisymmetric or two-dimensional mixed-compression inlets. The unsteady characteristics of three-dimensional dorsal bump inlets, especially the coupling mechanism among spanwise flow redistribution, asymmetric separation evolution, and shock–system oscillation, remain insufficiently understood. Unlike conventional axisymmetric inlets, the asymmetric bump configuration introduces complex three-dimensional flow interactions, which may significantly influence the initiation and development of buzz under off-design conditions.
Therefore, the objective of the present study is to investigate the unsteady buzz characteristics and underlying flow mechanisms of a dorsal supersonic bump inlet integrated with a flying-wing configuration. Wind-tunnel experiments and three-dimensional unsteady numerical simulations are performed to analyze the effects of angle of attack and downstream throttling on shock motion, pressure oscillation, and inlet stability. Particular attention is paid to revealing the roles of spanwise separation development, shock–system ingestion and expulsion, and flow-field recovery during a complete buzz cycle. The results aim to provide deeper insight into the instability mechanism of three-dimensional bump inlets and support the design of stable supersonic propulsion systems.

2. Materials and Methods

2.1. Geometric Model and Boundary Conditions

The research object of this study is a dorsal supersonic bump inlet for a flying-wing configuration. It consists of the upper surface of the flying-wing forebody, the bump compression surface, the cowl, the internal inlet duct, and a downstream throttling cone. The design Mach number is Ma = 1.8. In the wind-tunnel tests, the throttling ratio was adjusted by changing the streamwise position of the downstream throttling cone. In the numerical simulations, the throttling effect was reproduced by imposing equivalent outlet back-pressure conditions, rather than explicitly moving the throttling cone.
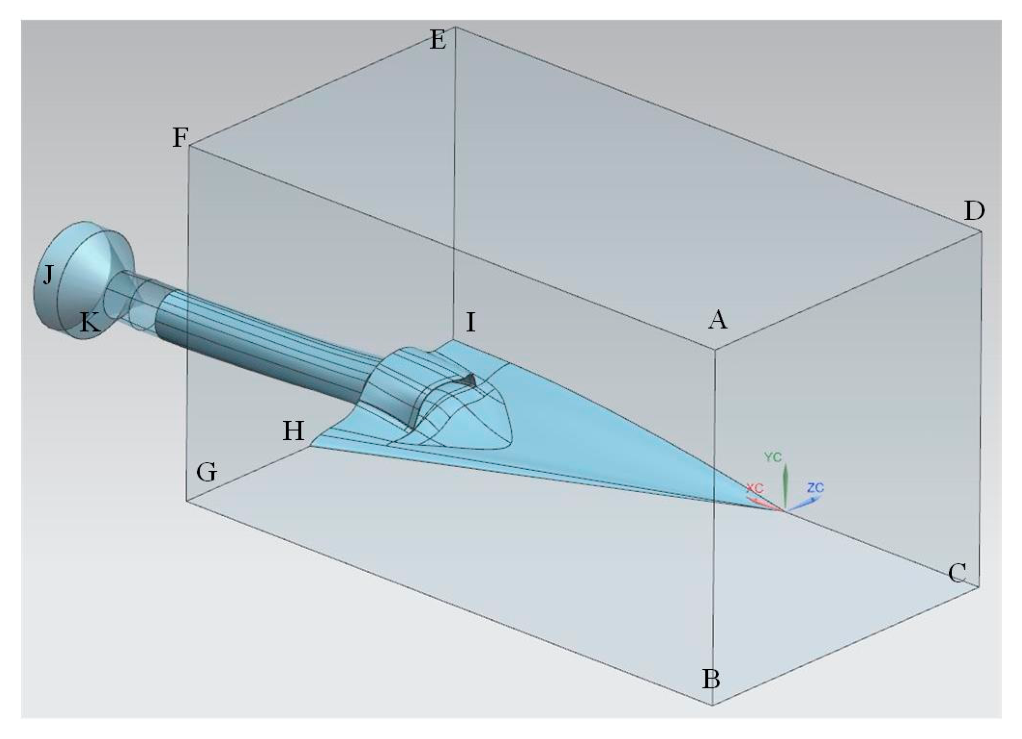
The simplified physical model of the inlet is shown in Figure 1. Boundaries ABCD, ADEF, BCHG, and ABGF are specified as supersonic far-field boundaries; EFGHI is specified as a supersonic far-field outlet; CDEI is specified as a symmetry boundary. The downstream end of the throttling cone is connected to the far field. The lateral surface K of the truncated cone is set as a supersonic far-field boundary, while the cylindrical surface J is specified as a pressure outlet. All other boundaries are treated as adiabatic no-slip walls.

2.2. Numerical Method

2.2.1. Numerical Solver and Software Implementation

The numerical simulations were performed using the PMB3D solver, a computational fluid dynamics code for three-dimensional compressible aerodynamic flows. The solver adopts a finite-volume framework and is suitable for high-speed internal and external flows involving shock waves and shock/boundary-layer interactions. In the present study, the Reynolds- and Favre-averaged compressible URANS equations were solved, with the Spalart–Allmaras one-equation model employed for turbulence closure.
For the unsteady inlet-buzz simulations, a dual-time-stepping strategy was adopted. The physical time-step was used to resolve shock oscillation and pressure fluctuation, while inner pseudo-time iterations were performed at each physical time level to obtain a sufficiently converged solution.
The detailed numerical algorithms, software implementation, and previous validations of the PMB3D solver have been reported in Ref. [31]; therefore, only the main numerical settings relevant to the present inlet-buzz simulations are summarized here.

2.2.2. Governing Equations

The conservative form of the Reynolds- and Favre-averaged compressible URANS equations in a Cartesian coordinate system can be written as follows:
ρ t + ρ u i x i = 0 ρ u j t + x i ρ u j u i + p δ i j τ i j = 0 ρ E t + x i ρ E + p u i + q i u i τ i j = 0
τ i j = μ L + μ T ε i j , ε i j = 2 S i j 2 3 u δ i j S i j = 1 2 u i x j + u j x i ,   E = e + u u 2 e = 1 k 1 p ρ ,   q i = λ T x i = μ L Pr L + μ T Pr T k k 1 x i p ρ
where ρ is the fluid density, u i and u j are the velocity components in the Cartesian coordinate directions, x i and x j denote the spatial coordinates, t is time, p is the static pressure, E is the total energy per unit mass, e is the internal energy, δ i j is the Kronecker delta, τ i j is the viscous stress tensor, q i is the heat flux vector, T is the temperature, k is the effective thermal conductivity, λ is the ratio of specific heats, and μ L and μ T represent the laminar and turbulent dynamic viscosities, respectively.
In Equations (1) and (2), the overbar and Favre-averaged symbols are omitted for simplicity of notation. The flow variables should be understood as Reynolds- or Favre-averaged quantities within the URANS framework. For a generic variable ϕ , the Favre average is defined as ϕ ~ = ρ ϕ / ρ . Since the SA model is a one-equation eddy-viscosity model, no separate transport equation for turbulent kinetic energy is solved. Therefore, turbulent kinetic energy terms do not explicitly appear in the total energy equation. Instead, turbulence effects are introduced through the turbulent eddy viscosity μ T and the turbulent heat flux model.
The standard Spalart–Allmaras model [32] was adopted in the present study without additional compressibility, transition, or rotation/curvature corrections. The turbulence model is the most commonly used one-equation eddy-viscosity turbulence model. This model is derived based on empiricism and dimensional analysis and is suitable for aerodynamic flows. Spalart and Allmaras proposed the complete formulation of this model in 1992 [32]. The Spalart–Allmaras (SA) model solves a transport equation for a modified eddy viscosity and is widely used for external aerodynamic flows because of its robustness and relatively low computational cost. The SA model has low computational cost and good convergence performance and is suitable for simulations of attached flows and mildly separated flows. However, it has limitations in dealing with complex flow characteristics such as vortex separation and turbulence anisotropy. Although the SA model has known limitations in massively separated flows, it was adopted in this preliminary study because the primary objective was to capture the dominant shock-motion frequency and global buzz cycle. The numerical results were validated against wind-tunnel schlieren images and pressure spectra. The modified turbulent-viscosity transport equation is given as:
D v ˜ D t = c b 1 1 f t 2 S ˜ v ˜ + 1 σ . ( v + v ˜ ) v ˜ + c b 2 v ˜ 2 c w 1 f w c b 1 κ 2 f t 2 v ˜ d 2
turbulent eddy viscosity:
v t = v ˜ f v 1
where the remaining functions are:
S ˜ Ω + v ˜ k 2 d 2 f v 2   ,   f v 2 = 1 χ 1 χ f v 1 f w = g 1 + c w 3 6 g 6 + c w 3 6 1 / 6   ,   g = r + c w 2 r 6 r
In Equations (3)–(5), v ~ denotes the modified turbulent kinematic viscosity solved in the SA model, v t is the turbulent eddy viscosity, D / D t is the material derivative, S ~ is the magnitude of the vorticity-related strain-rate term, d is the distance from the nearest wall, Ω is the vorticity magnitude, χ , r , g , f v 1 , f v 2 , and f w are auxiliary functions of the SA model, and c b 1 , c b 2 , c w 1 , c w 2 , c w 3 , σ , and κ are empirical model constants.
The present numerical model is established based on the Reynolds- and Favre-averaged compressible URANS equations with an ideal-gas assumption. Several simplifications should be noted. First, all solid surfaces are treated as adiabatic no-slip walls, which neglects heat transfer between the inlet wall and the airflow. This assumption may influence the prediction of wall temperature and thermal loads; however, its effect on the dominant shock oscillation and overall buzz characteristics is considered limited under the present Mach number condition. Second, real-gas effects and chemical reactions are neglected. Since the freestream Mach number investigated in this study is 1.8, the flow temperature level is insufficient to induce significant high-temperature chemical reactions, and the ideal-gas assumption is therefore appropriate. In addition, although the SA turbulence model provides good robustness and computational efficiency, it has limitations in accurately describing highly separated and strongly anisotropic turbulent structures. Therefore, the present simulations mainly aim to capture the dominant unsteady features of inlet buzz, including shock motion, pressure oscillation, and global flow-field evolution, rather than detailed turbulence characteristics. These limitations should be considered when interpreting the numerical results.

2.2.3. Wind-Tunnel Test and Experimental Model

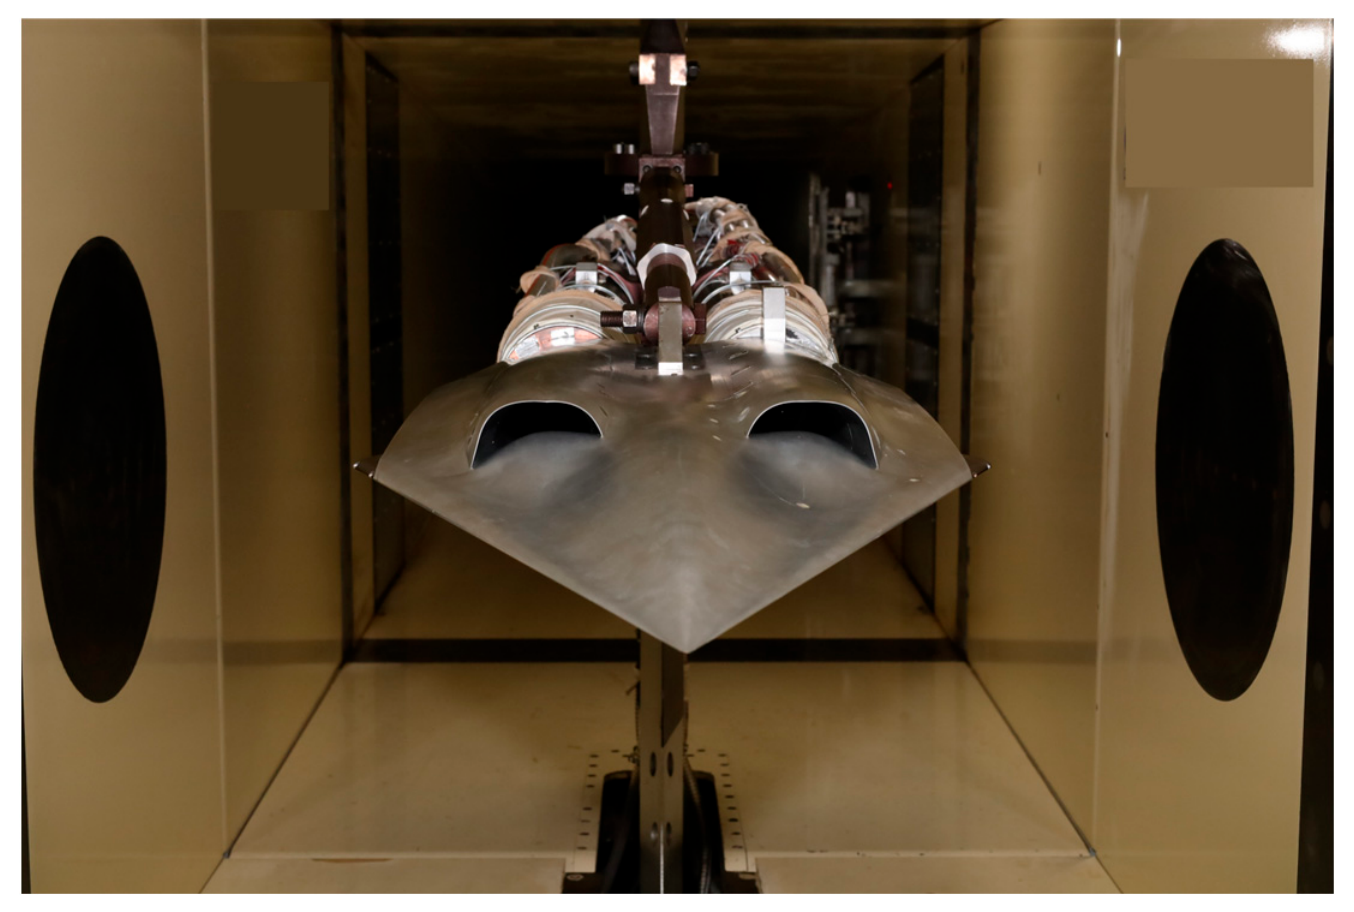
The inlet test model adopts an airframe-integrated design concept and mainly consists of the fuselage and the dorsal inlet. The model scale is 1:12.5, with an overall model length of 830 mm, a measurement-section length of 200 mm, a transition-section length of 200 mm, and an inlet-exit inner diameter of Φ60 mm. Figure 2 shows the installation photo of the inlet model in the 1.2 m transonic wind tunnel test section.
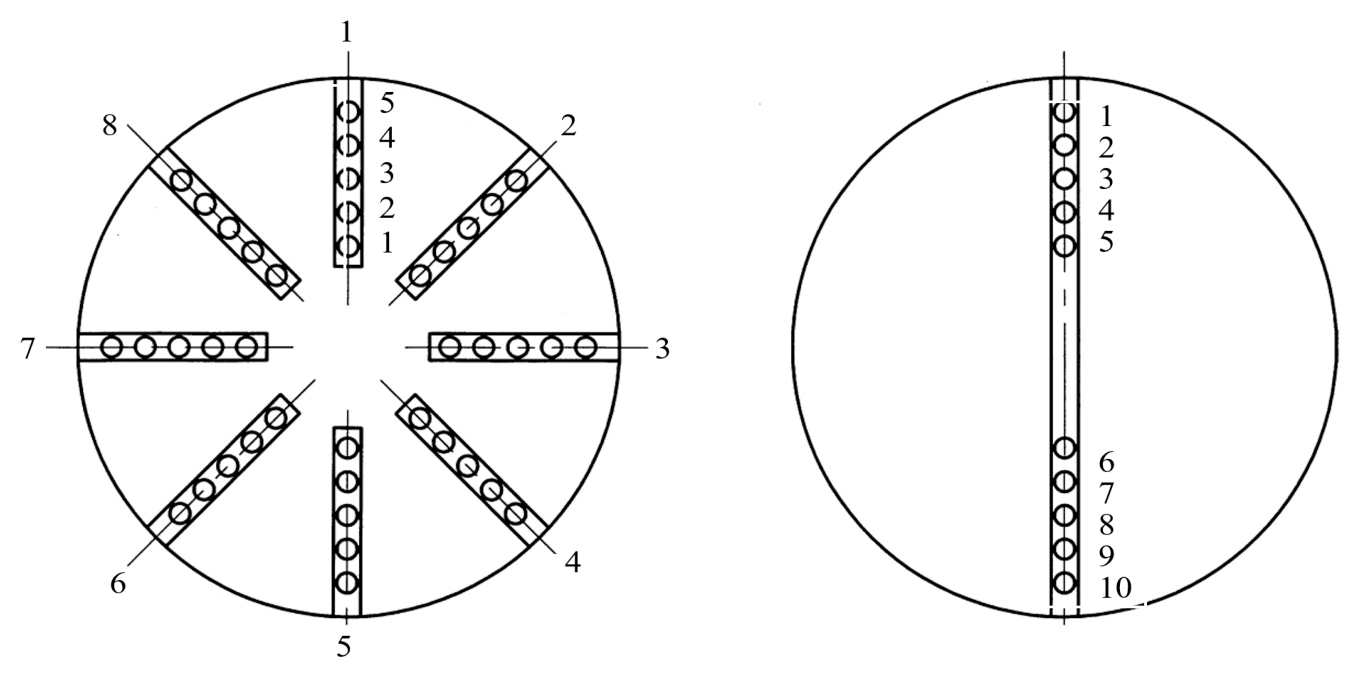
At the outlet sections of the inlets on both sides, namely the engine inlet sections, eight total-pressure rake arms are uniformly distributed in the circumferential direction. Five steady total-pressure measurement points are arranged on each rake arm according to the equal-area method (Figure 3), with one additional point located at the center. Thus, 41 measurement points are arranged on each side, giving a total of 82 points on both sides. In addition, eight steady static-pressure measurement points are uniformly distributed along the circumference on the pipe wall of each section, giving a total of 16 points on both sides. Furthermore, four dynamic total-pressure measurement points are circumferentially arranged inside the duct on each side of the inlet, giving a total of eight points on both sides. Five dynamic wall static-pressure measurement points are arranged along the streamwise direction on each side, giving a total of ten points on both sides. Miniature dynamic pressure sensors with an outer diameter of 1.7 mm are installed at the dynamic total-pressure measurement points. Before the test, each dynamic pressure sensor was dynamically calibrated, and the calibration coefficient of each sensor was obtained.

2.2.4. Validation of the Numerical Method

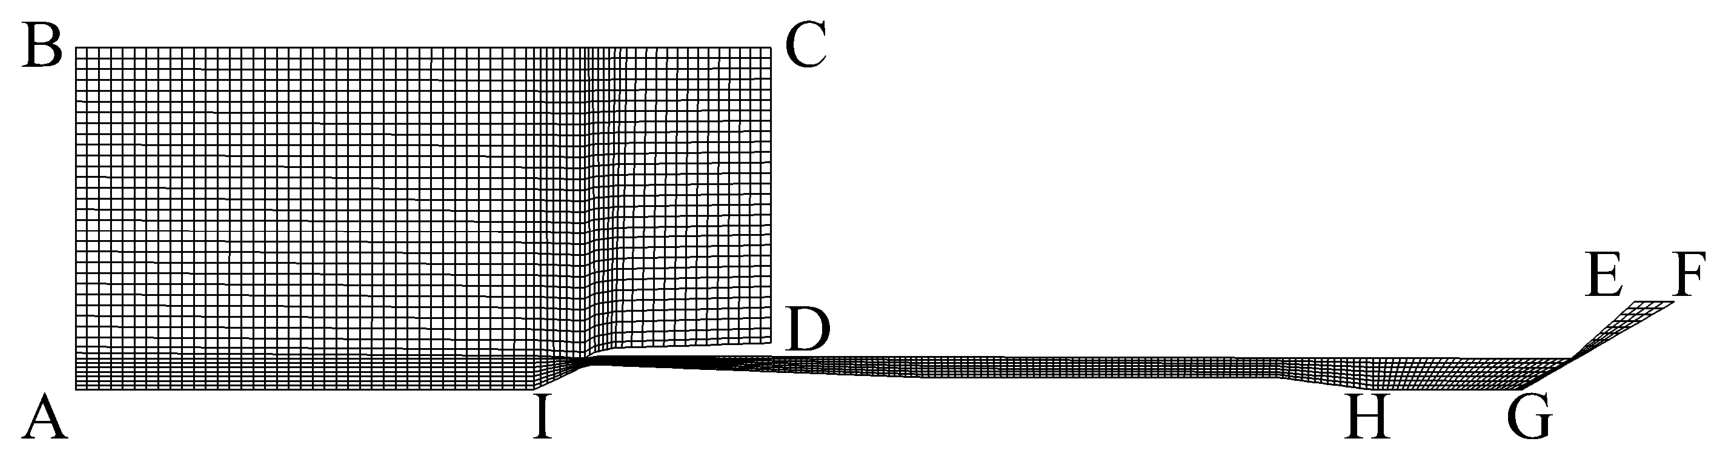
To verify the accuracy of the numerical method adopted in this study, the axisymmetric supersonic inlet from the experiment of Nagashima [12] was selected for validation. Figure 4 shows the computational domain and mesh used in the two-dimensional numerical simulation. The mesh in the computational domain is fully structured, with local refinement applied near the wall and the cowl to ensure that the dimensionless height of the first near-wall grid cell satisfies y+ < 10. In the figure, pressure far-field boundary conditions are imposed on AB and BC, pressure outlet boundary conditions are imposed on CD and EF, and AI and GH are set as symmetry axes. All the remaining boundaries are treated as solid walls with adiabatic no-slip wall boundary conditions.
Unsteady numerical simulations of major buzz and minor buzz are carried out based on the steady flow fields at T.R. = 0.67 and T.R. = 0.97, respectively. The numerical simulation conditions are consistent with those in the experiment [12], as shown in Table 1 and Table 2.
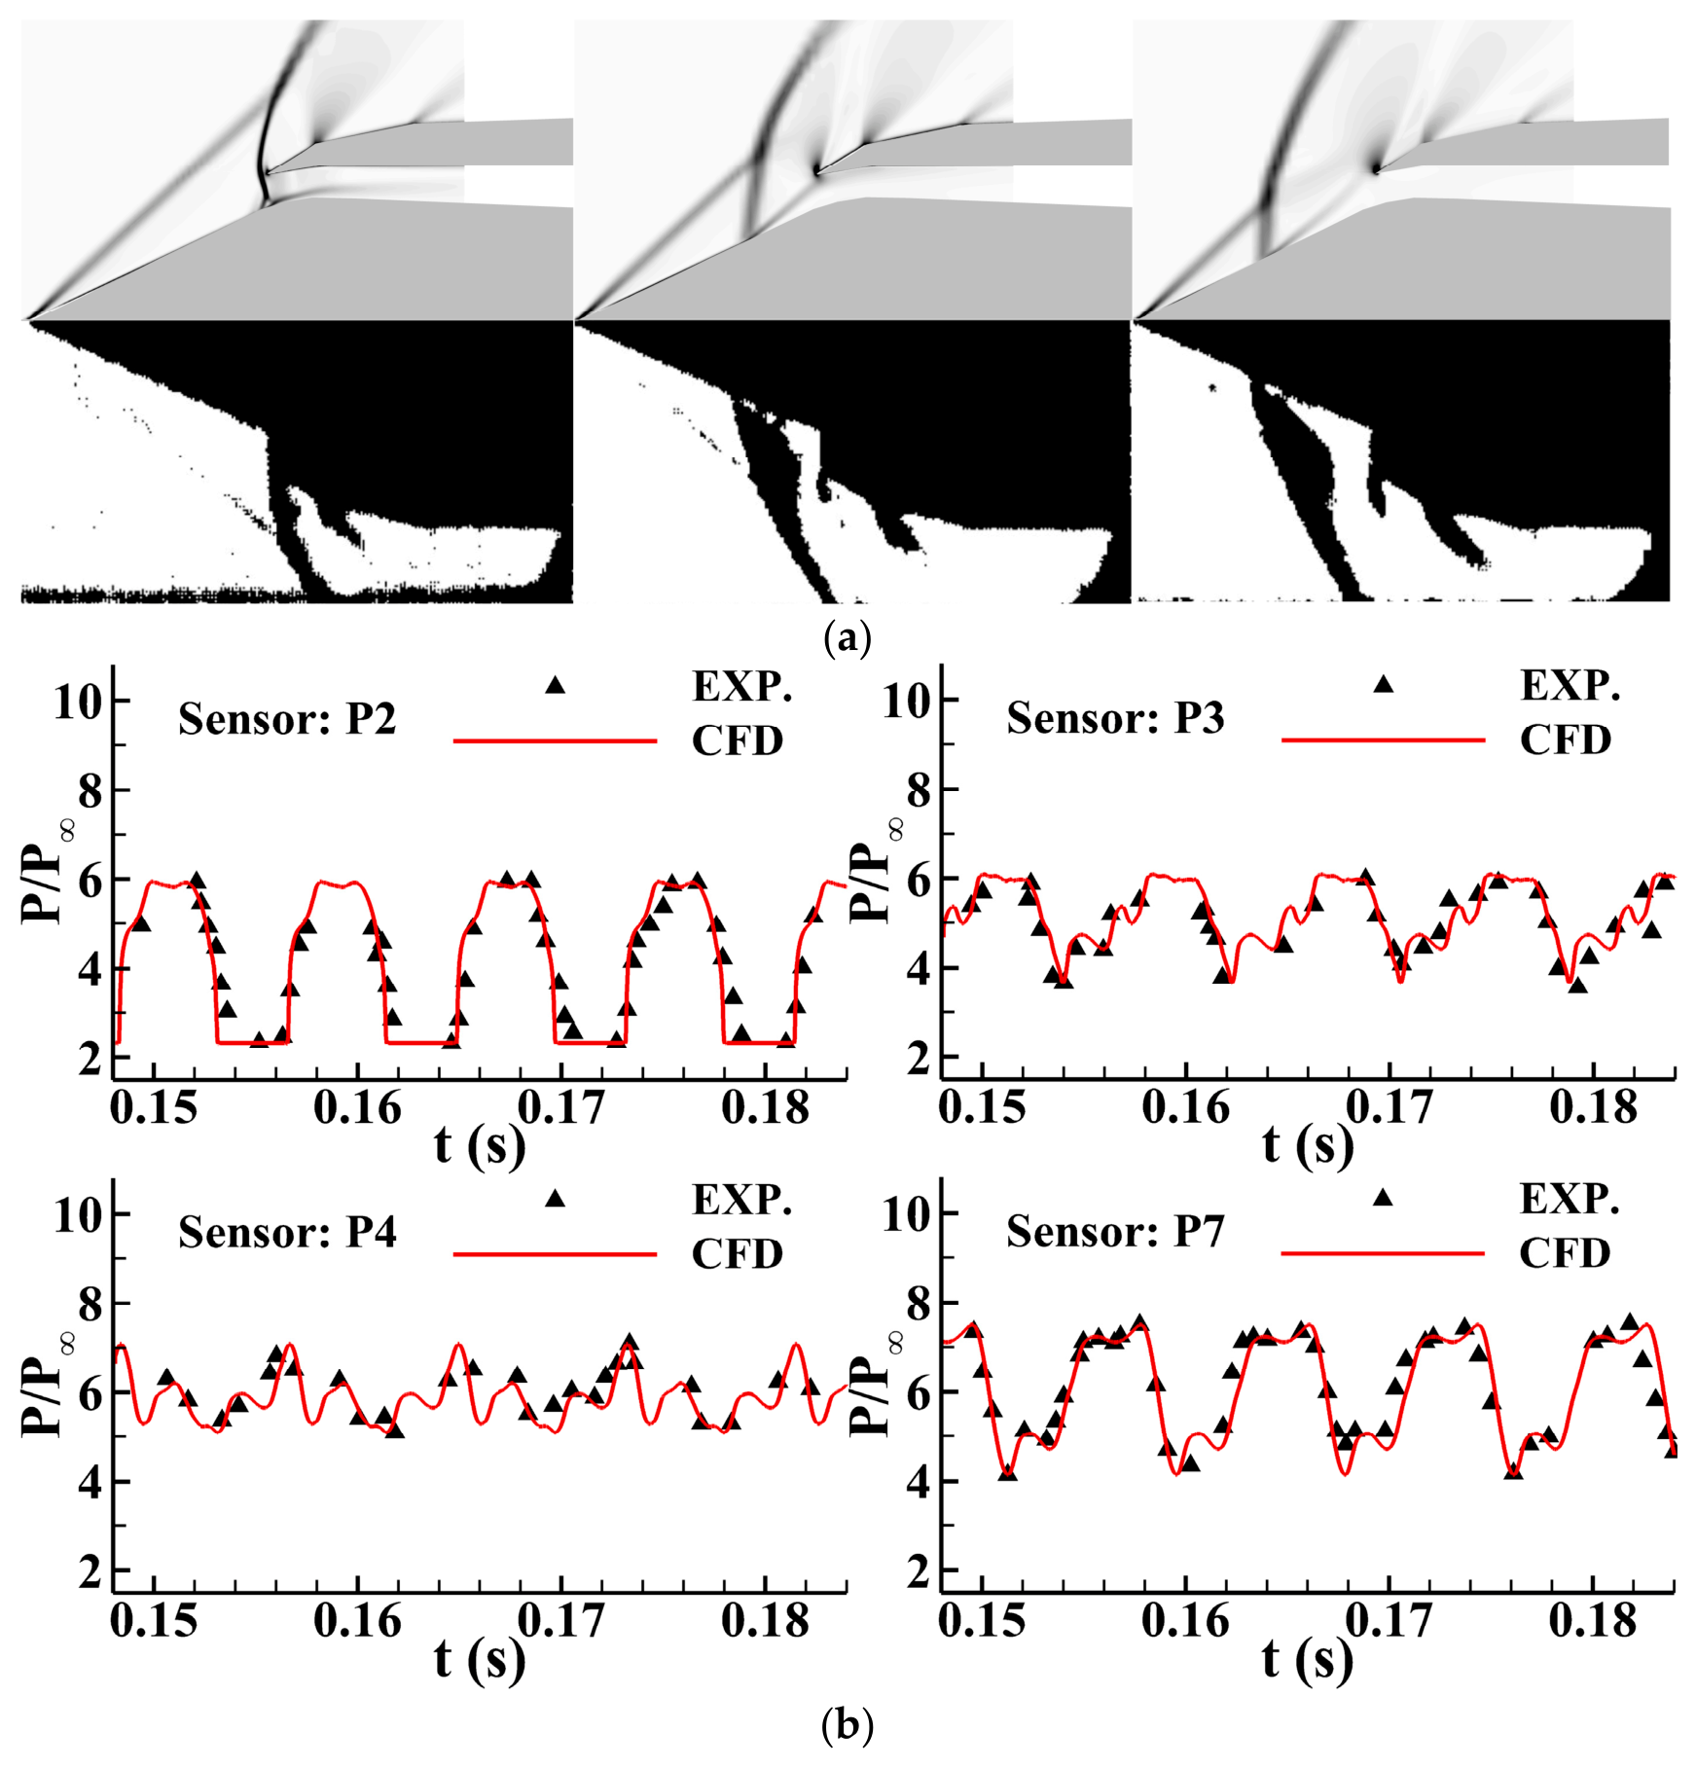
The relative deviations between the simulated and experimental dominant frequencies are 10.09% for minor buzz and 2.78% for major buzz, with a maximum relative deviation of 10.09%. This indicates that the numerical method can reasonably predict the dominant buzz frequency and capture the main unsteady characteristics of inlet buzz.
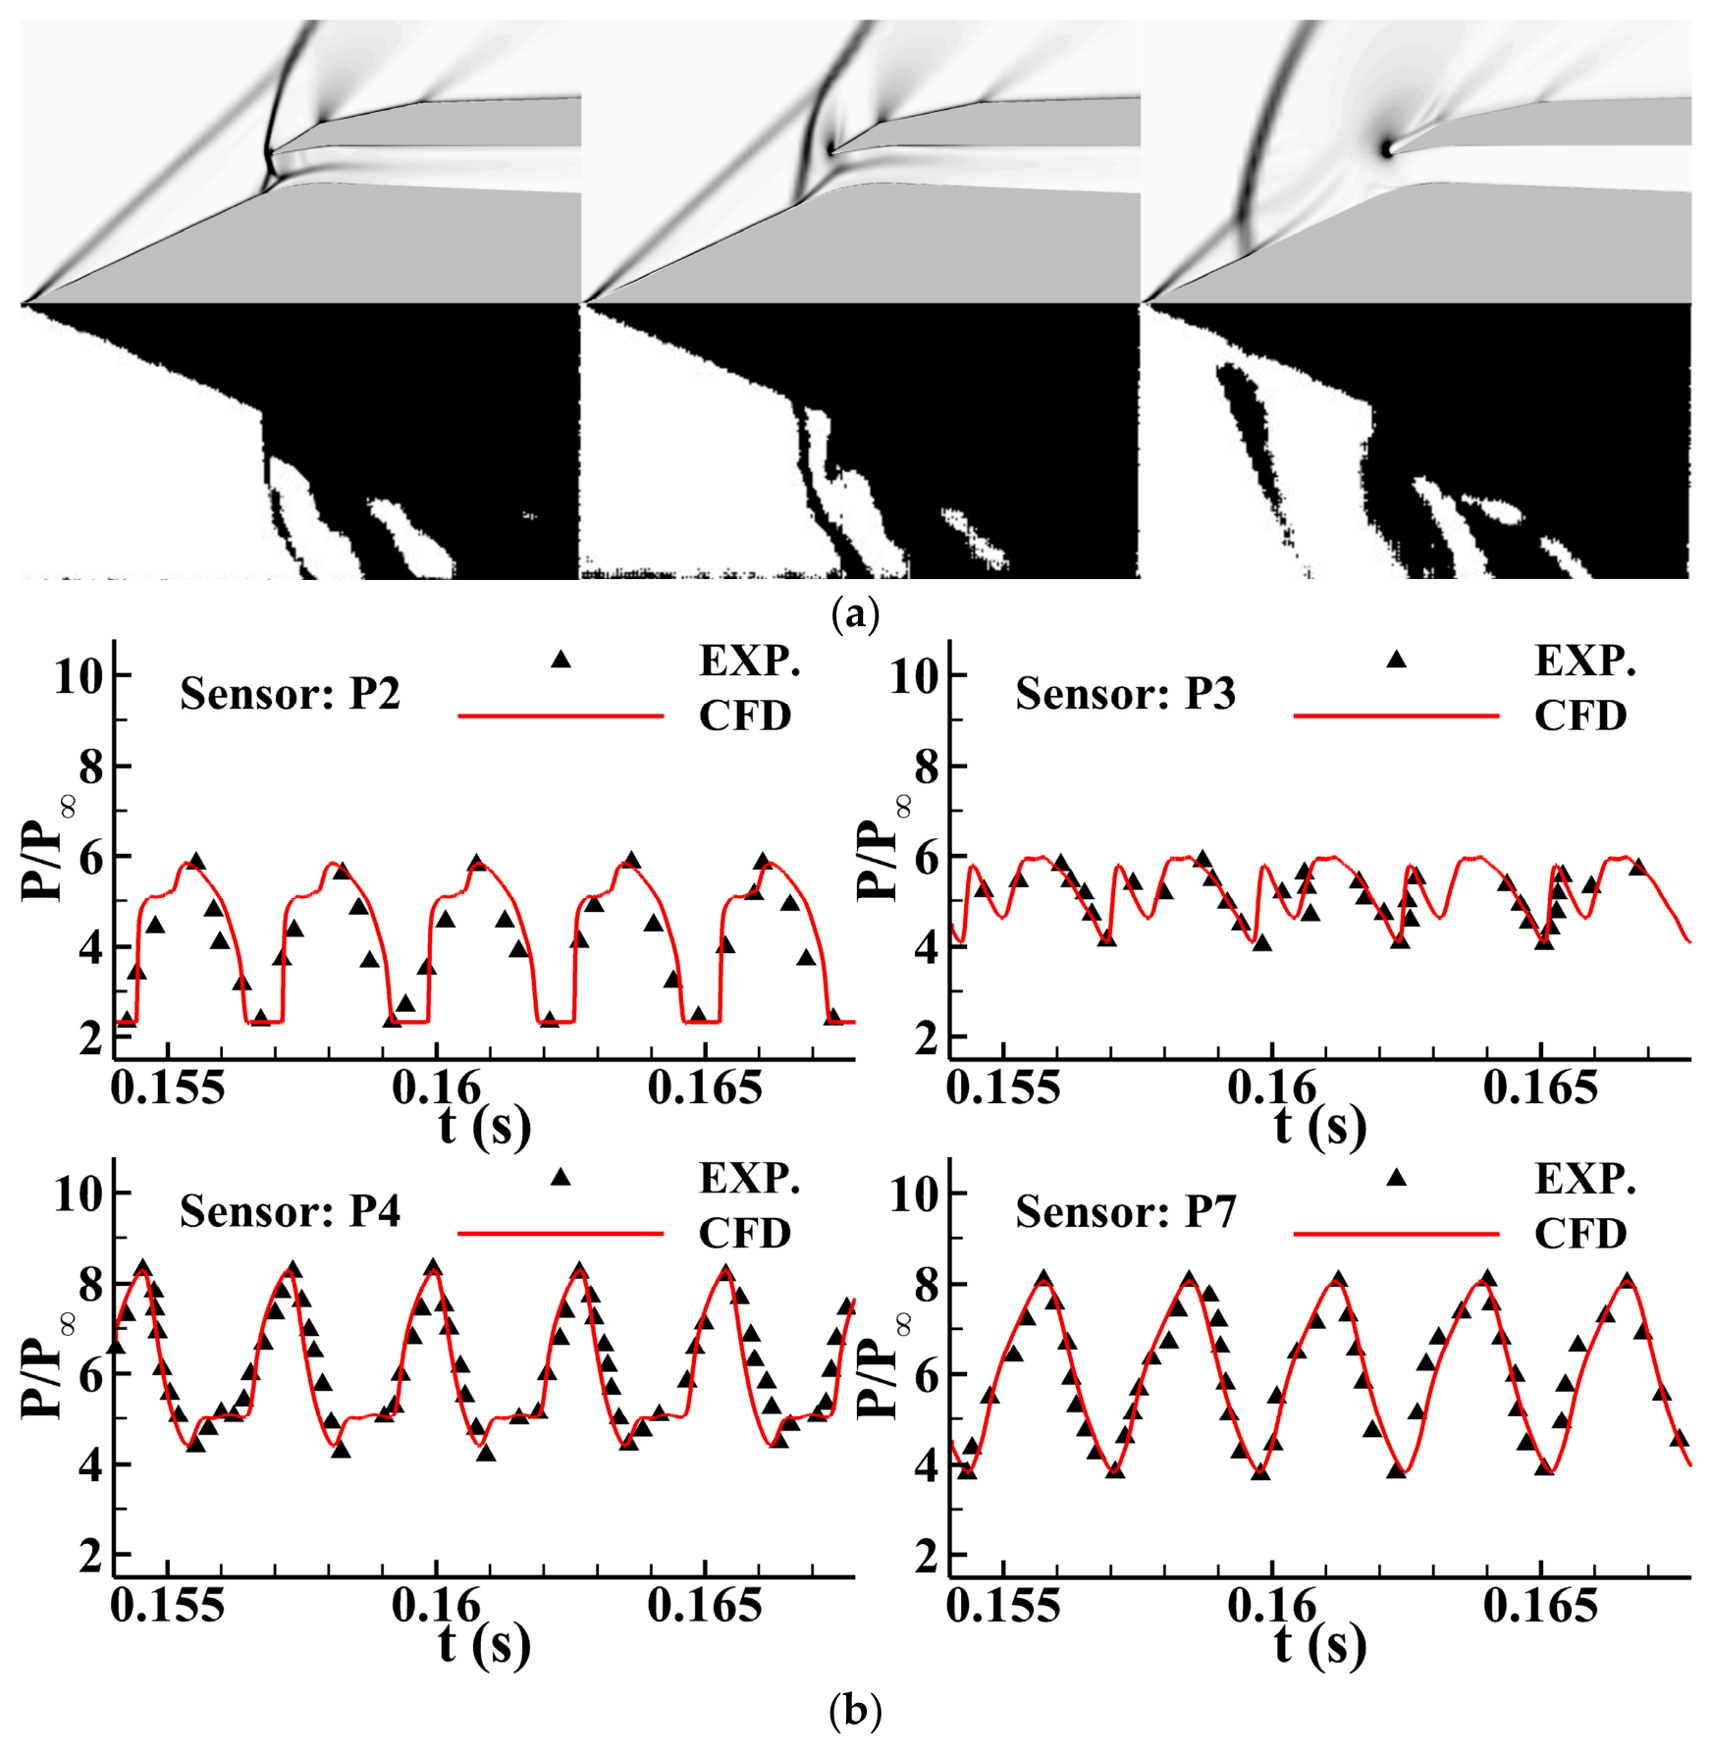
Figure 5a and Figure 6a present comparisons between the numerical schlieren images and experimental schlieren images at different instants under major buzz and minor buzz conditions, respectively. Figure 5b and Figure 6b show comparisons between the pressure oscillations at measurement points P2, P3, P4, and P7 obtained from the experiments and numerical simulations under major buzz and minor buzz conditions, respectively, where the pressure values are nondimensionalized by the far-field static pressure p∞. It can be seen from the figures that the numerical simulation captures the reciprocating motion of the terminal normal shock well, and the pressure-oscillation curves agree well with the experimental data. The comparison results indicate that the numerical method adopted in this study is capable of capturing the dominant features of inlet buzz.

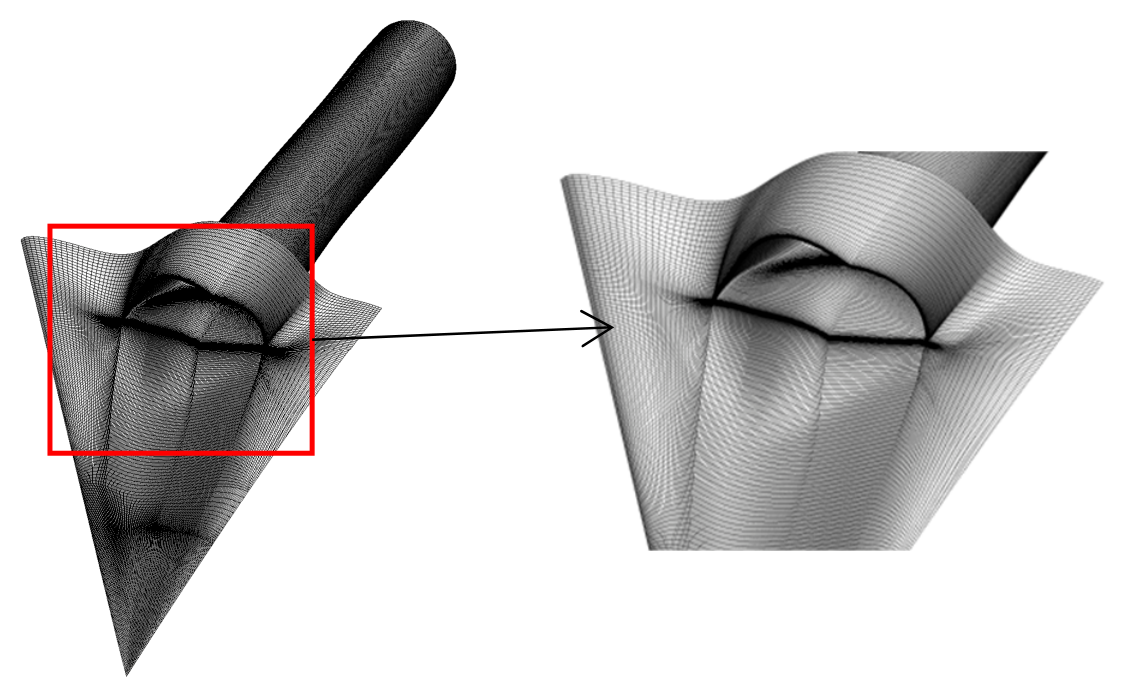
2.2.5. Mesh and Boundary Conditions

A mesh was generated for the above half-model flying-wing bump inlet, as shown in Figure 7. The three-dimensional computational domain was filled with structured grids, and the mesh near the wall was refined to ensure that the dimensionless height of the first near-wall grid cell within the boundary layer was approximately less than 1. The total number of grid cells was approximately 8 million, with only about 0.002% of the cells having a mesh quality lower than 0.3.
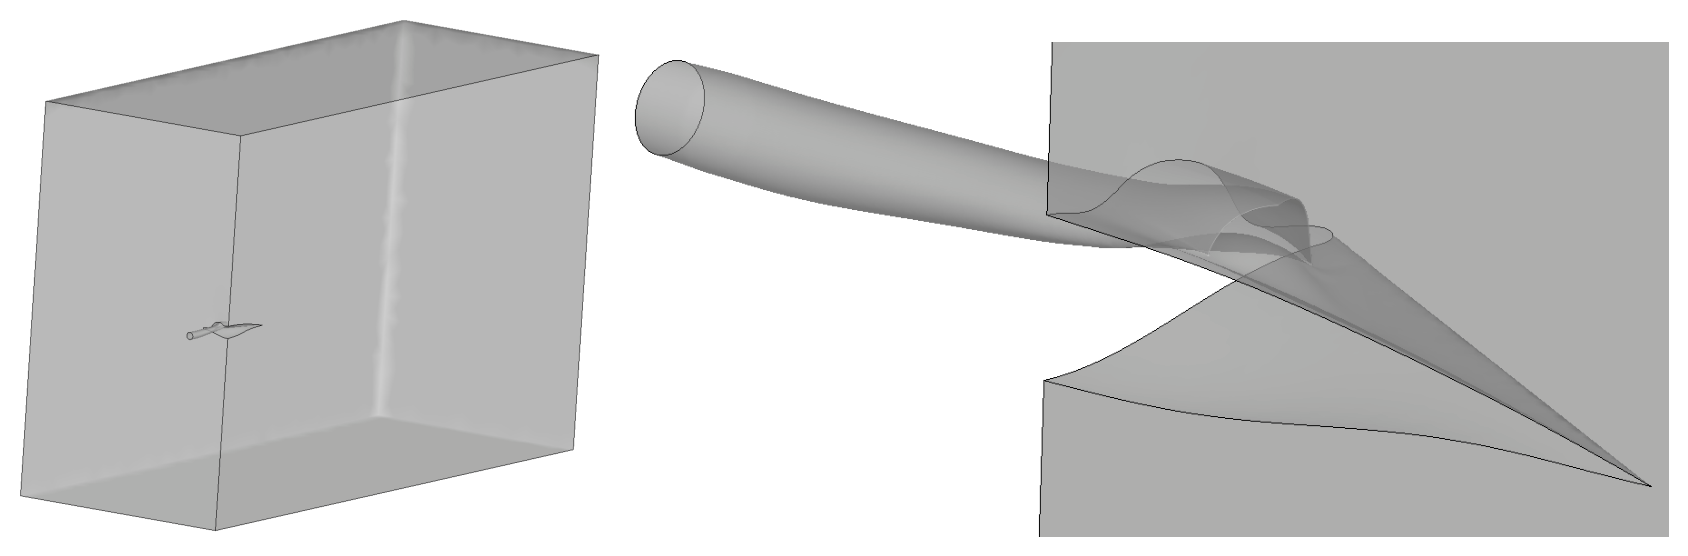
Figure 8 shows the computational domain used in this study. Three types of boundary conditions were mainly adopted. The total pressure and total temperature of the freestream were estimated based on the experimental conditions and specified as pressure far-field boundary conditions. In the wind-tunnel tests, each throttling condition corresponded to a prescribed streamwise position of the downstream throttling cone, whereas in the simulations the same throttling effect was modeled using an equivalent outlet back-pressure condition. The other regions in the computational domain, such as the forebody, bump, and inlet surfaces, were treated as adiabatic no-slip wall boundary conditions.
The compression surface of the bump inlet has large curvature and a complex topological structure, which may pose significant challenges for the generation of the boundary-layer mesh near the wall. If an unstructured mesh is used, matching problems between the mesh and the surface model may occur. Therefore, a structured mesh was adopted in this study to improve the accuracy and fidelity of the computation. Figure 8 shows the mesh distribution of the combined bump inlet and forebody configuration. The mesh consists of 92 blocks, with approximately 8 × 10⁶ nodes.

2.2.6. Unsteady Simulation and Spectral Analysis Settings

After convergence of the steady flow solution, unsteady simulations were carried out to capture the self-excited buzz oscillation of the dorsal bump inlet. The physical time-step was selected in the range of 2.0 × 10⁻⁵–5.0 × 10⁻⁵ s, ensuring that each buzz cycle was resolved by more than 250 physical time-steps. During the unsteady simulation, the CFL number in the main shock-interaction and near-wall regions was maintained below 1.0. At each physical time-step, inner pseudo-time iterations were performed until the residuals decreased by at least three orders of magnitude.
The initial transient stage was discarded before the statistical analysis. Pressure histories were then collected over at least 20 complete buzz cycles at the wall-pressure taps and AIP monitoring locations. The sampling frequency was determined by the physical time-step and the data-output interval. In the present study, the effective sampling frequency was no lower than 20 kHz, which was sufficiently high to resolve the dominant buzz frequency and its harmonics.
The pressure spectra were obtained using fast Fourier transform. The mean value of each pressure signal was removed before spectral analysis, and a Hanning window was applied to reduce spectral leakage. The frequency resolution was determined by the analyzed sampling duration, (Δf = 1/Trec). For the present sampling records, the frequency resolution was better than 3.5 Hz. The resulting power spectral density was used to identify the dominant buzz frequency and to compare the numerical prediction with the experimental pressure spectra.

2.2.7. Grid-Independence Verification

To verify grid independence, three meshes with different resolutions were used in this study. The total numbers of nodes for the coarse, medium, and fine meshes were 6 × 10⁶, 8 × 10⁶, and 1.6 × 10⁷, respectively. For these three meshes, the entire computational domain was refined except for the wall boundary-layer region. The fine mesh was used as the reference simulation result to evaluate the convergence of the calculation. The convergence of each calculation was determined based on the solution residuals. In this study, the solution was considered converged when the L2 norm of the maximum residual reached 10−4. For all meshes, the y+ value of the first grid point off the wall was less than 1. The total pressure distribution is important for evaluating the performance of the bump inlet, because total pressure loss reduces engine performance and may significantly shorten the service life of the aircraft. The grid-independence assessment was performed at (Ma = 0.8), (AOA = 0°), and (pAIP/p = 1.2). This condition was selected because a stable flow field and corresponding experimental AIP performance data were available, allowing the influence of spatial grid resolution on the integral inlet-performance prediction to be evaluated without interference from the large-amplitude periodic fluctuations associated with buzz. Therefore, the purpose of this grid assessment was to examine the convergence of the basic spatial discretization and the AIP total-pressure recovery rather than to directly establish grid independence of the detailed unsteady shock motion at (Ma = 1.8).
As shown in Table 3, the predicted AIP total-pressure recovery varies only slightly among the three grids, and the medium-grid result is close to both the fine-grid result and the experimental value. These results indicate that the medium grid provides sufficient spatial resolution for predicting the integral inlet-performance parameter considered in the present grid assessment. The medium grid was therefore adopted for the subsequent simulations as a compromise between computational cost and spatial resolution. It should be noted that the present (Ma = 0.8) grid assessment alone does not constitute a dedicated grid-convergence study of all unsteady separated-flow structures under the (Ma = 1.8) buzz condition. Nevertheless, because the same grid topology and near-wall resolution strategy were adopted for the Ma = 1.8 unsteady simulations, and the dominant buzz frequency was further validated against wind-tunnel measurements, the adopted mesh is considered adequate for the present purpose. The reliability of the unsteady prediction is further assessed through comparison with the wind-tunnel results, including the principal shock–system characteristics and the dominant buzz frequency.

3. Results

3.1. Numerical Simulation of Throttling Characteristics of the Dorsal Inlet

The throttling characteristic curves of the inlet were obtained through simulations under the boundary conditions of freestream Mach number and back-pressure ratio listed in Table 4.
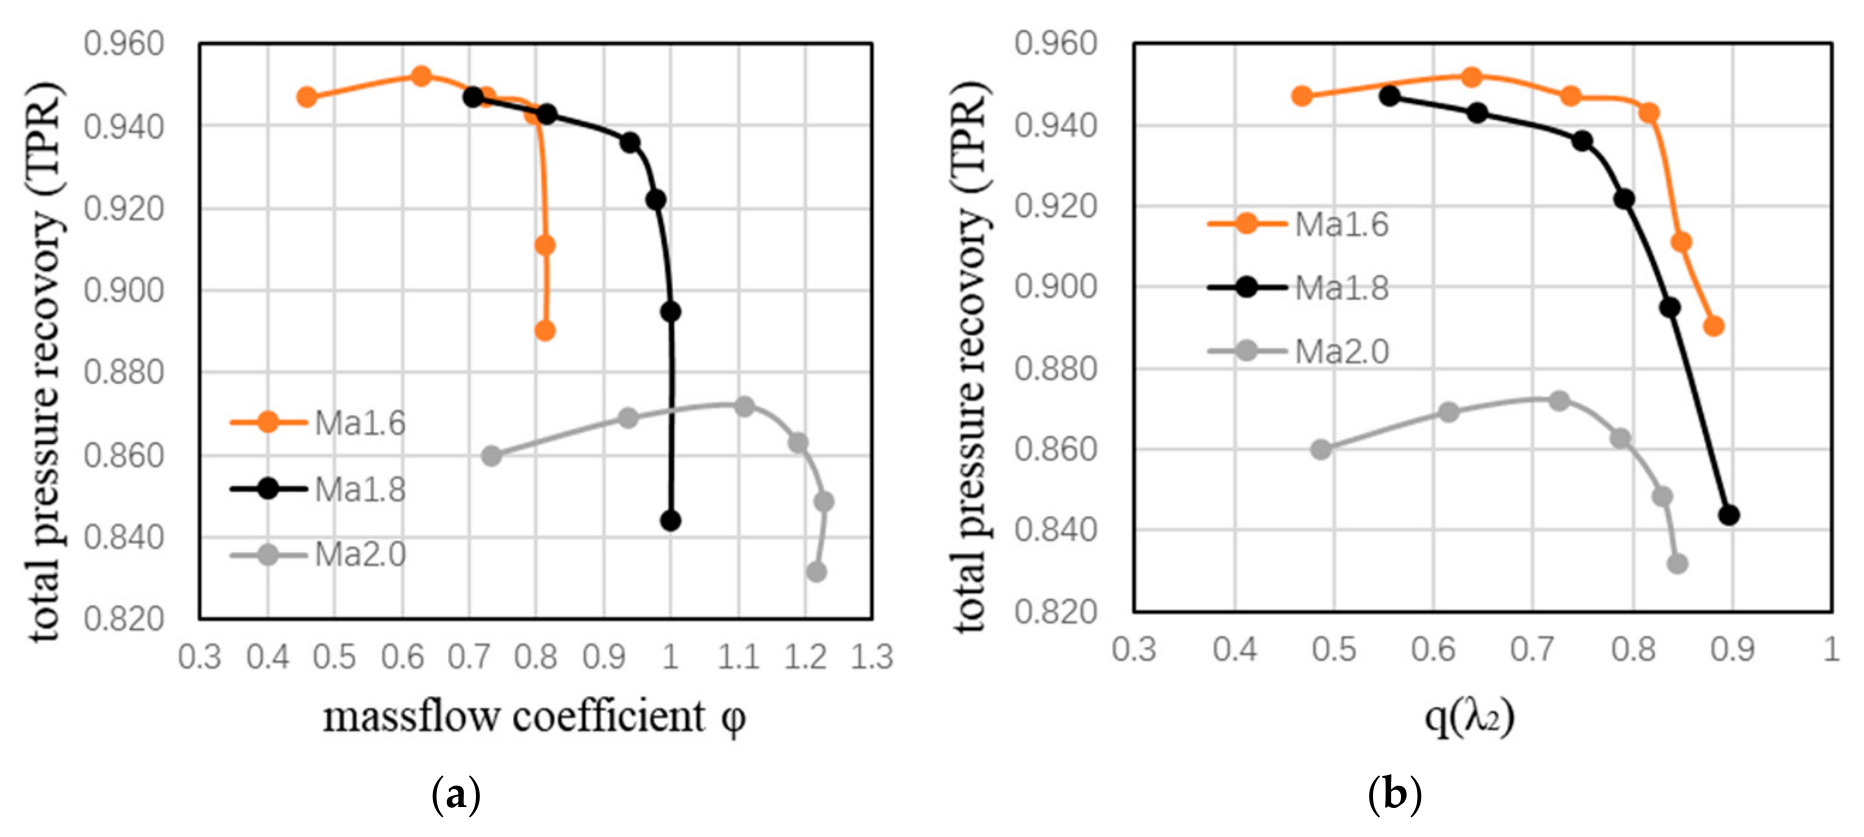
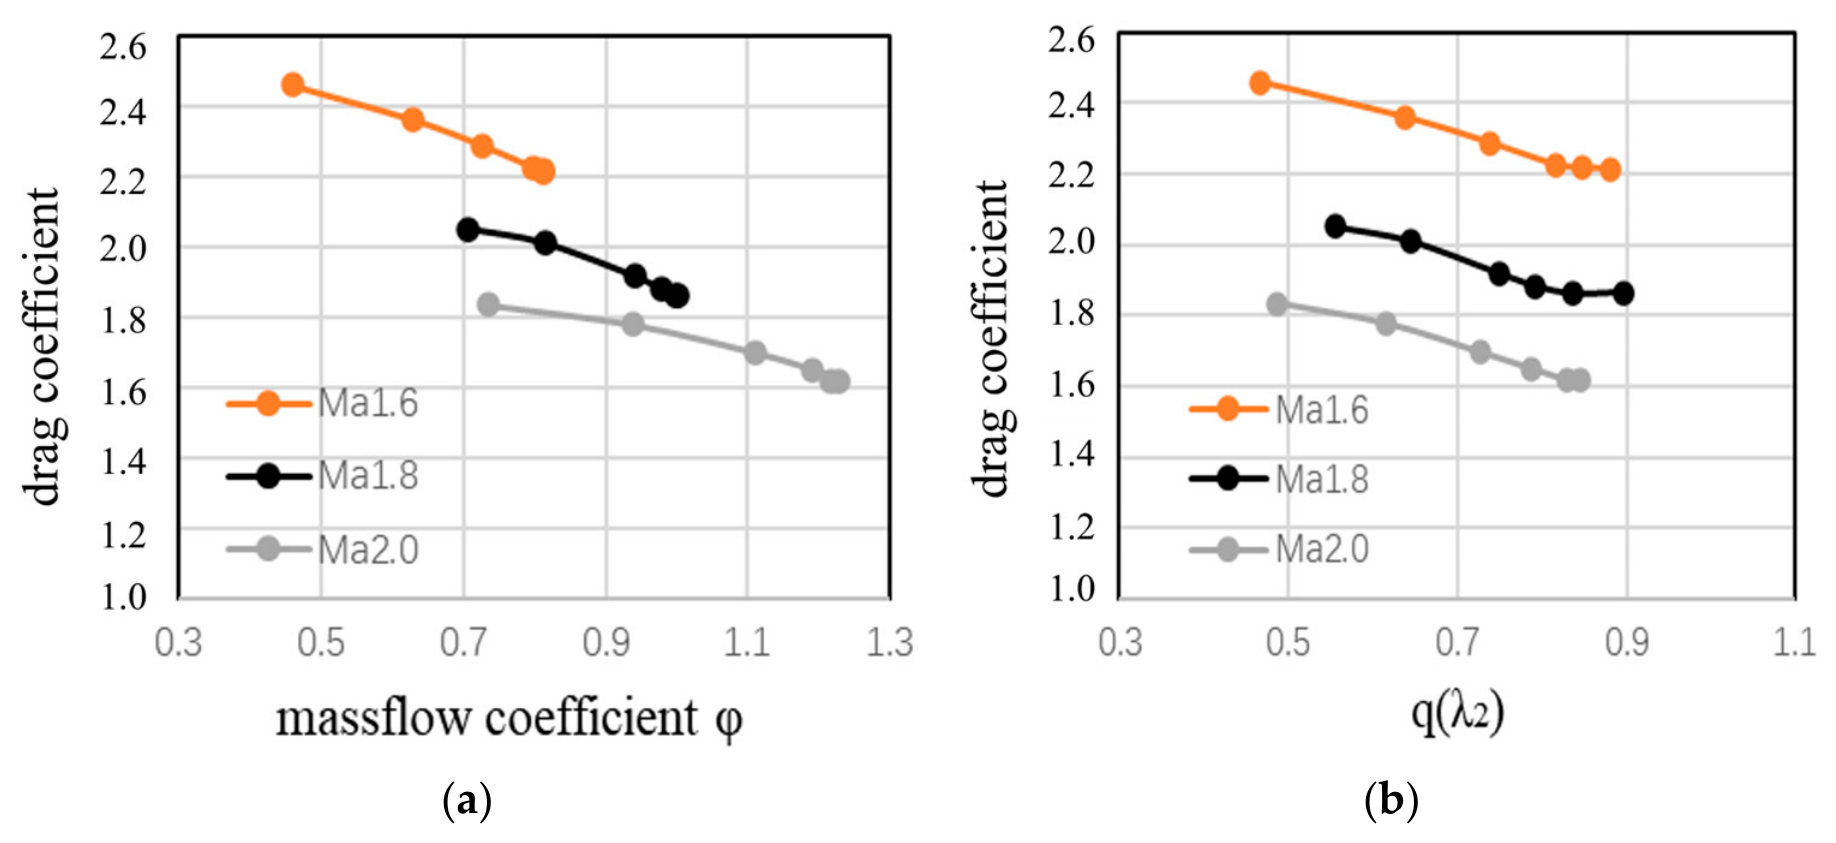
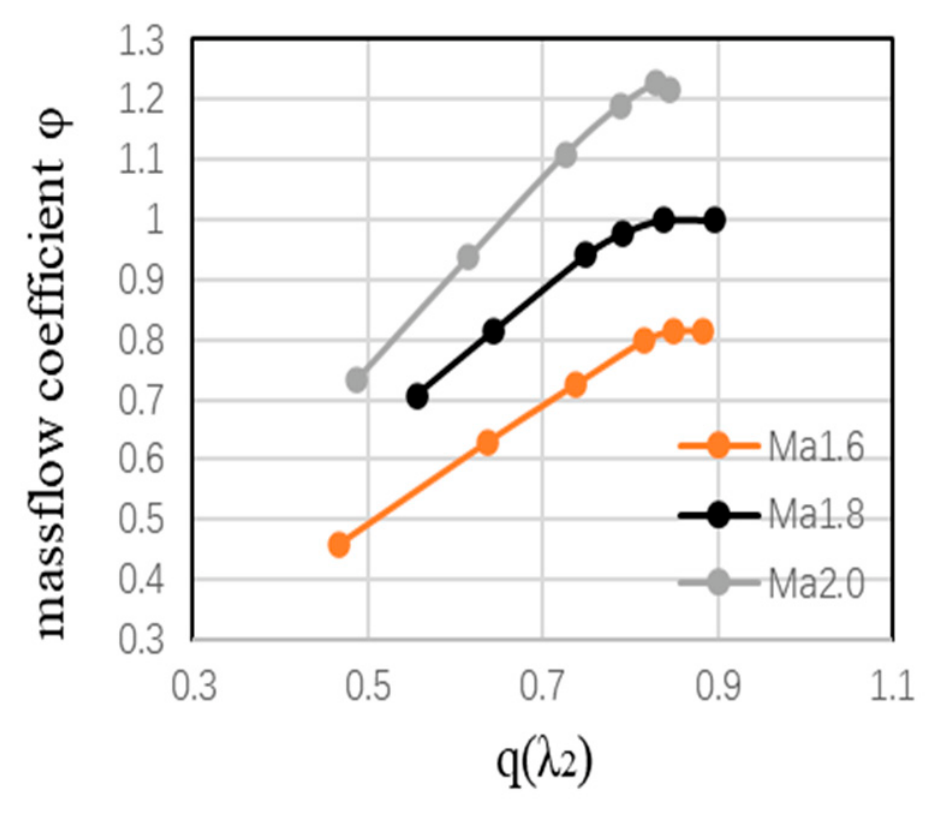
The calculated characteristic curves of the inlet total pressure recovery and drag coefficient are shown in Figure 9 and Figure 10, respectively. It can be seen that the bump inlet exhibits relatively high total pressure recovery at the design Mach number and at flight conditions below the design Mach number, whereas the total pressure recovery decreases considerably under conditions above the design Mach number. In addition, the curve in the subcritical condition exhibits a relatively large positive slope, indicating that the inlet system has limited recovery capability when affected by downstream engine disturbances. As the mass-flow coefficient decreases, the spillage flow increases, resulting in an increase in inlet drag. When the shock is initially expelled from the cowl lip, the inlet experiences both supersonic additive drag and subsonic additive drag. As the mass-flow coefficient decreases further, only subsonic additive drag remains, and, therefore, the rate of drag increase becomes less pronounced. Figure 11 shows the relationship between the outlet mass-flow function and the inlet flow coefficient.

3.2. Analysis of Wind-Tunnel Test Results for Buzz Characteristics

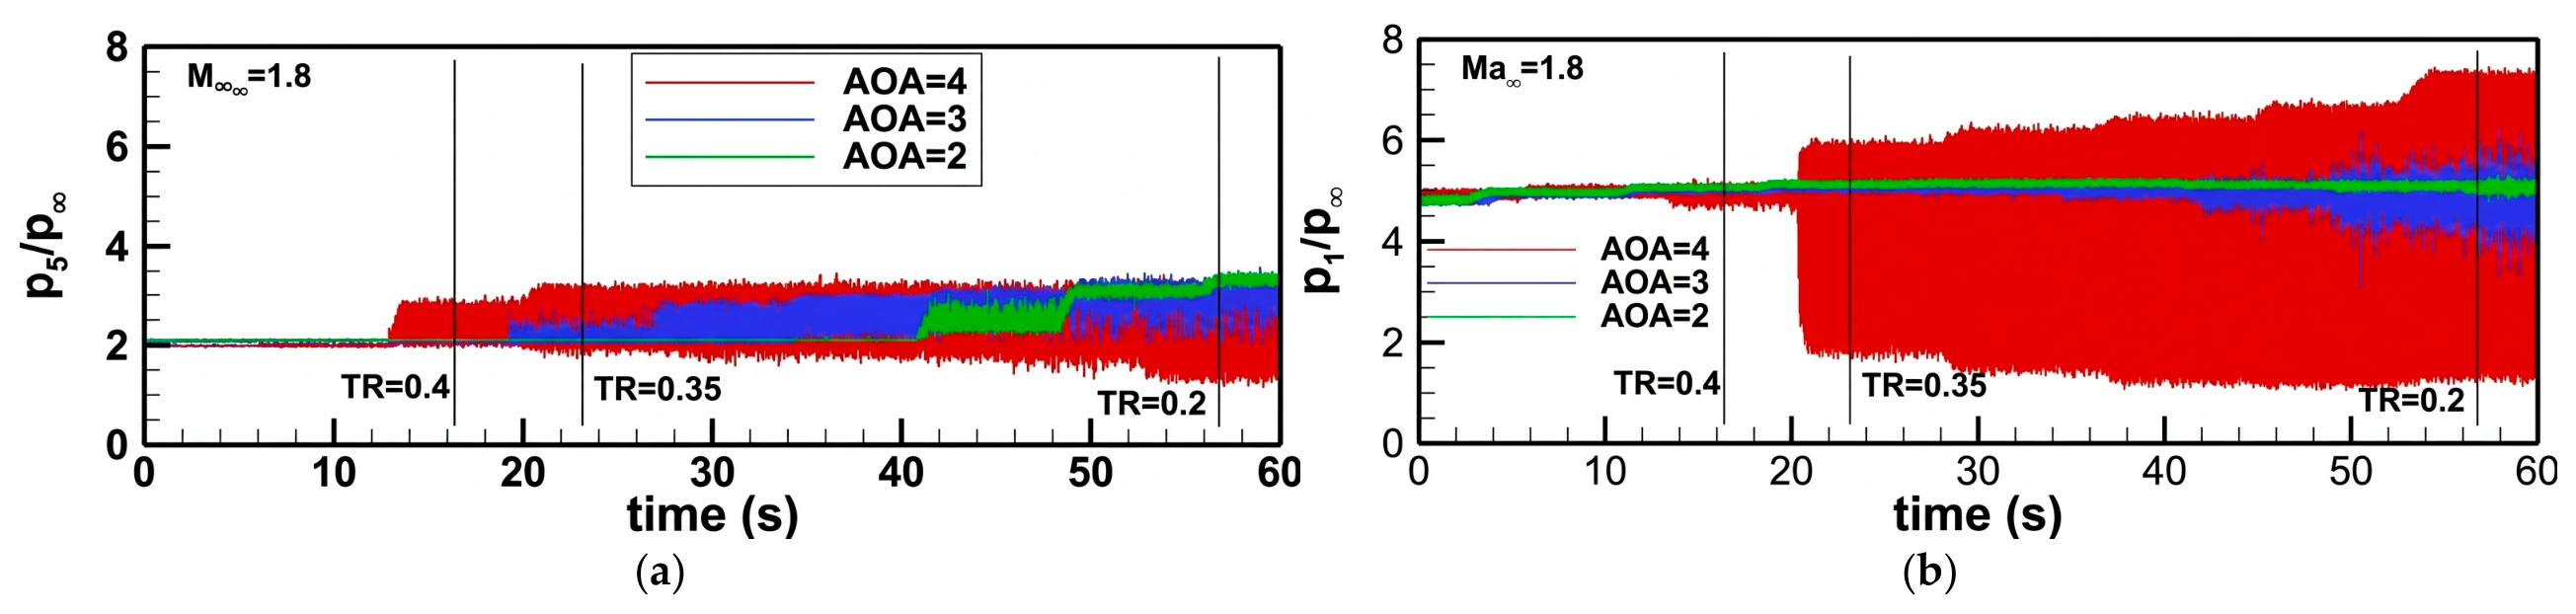
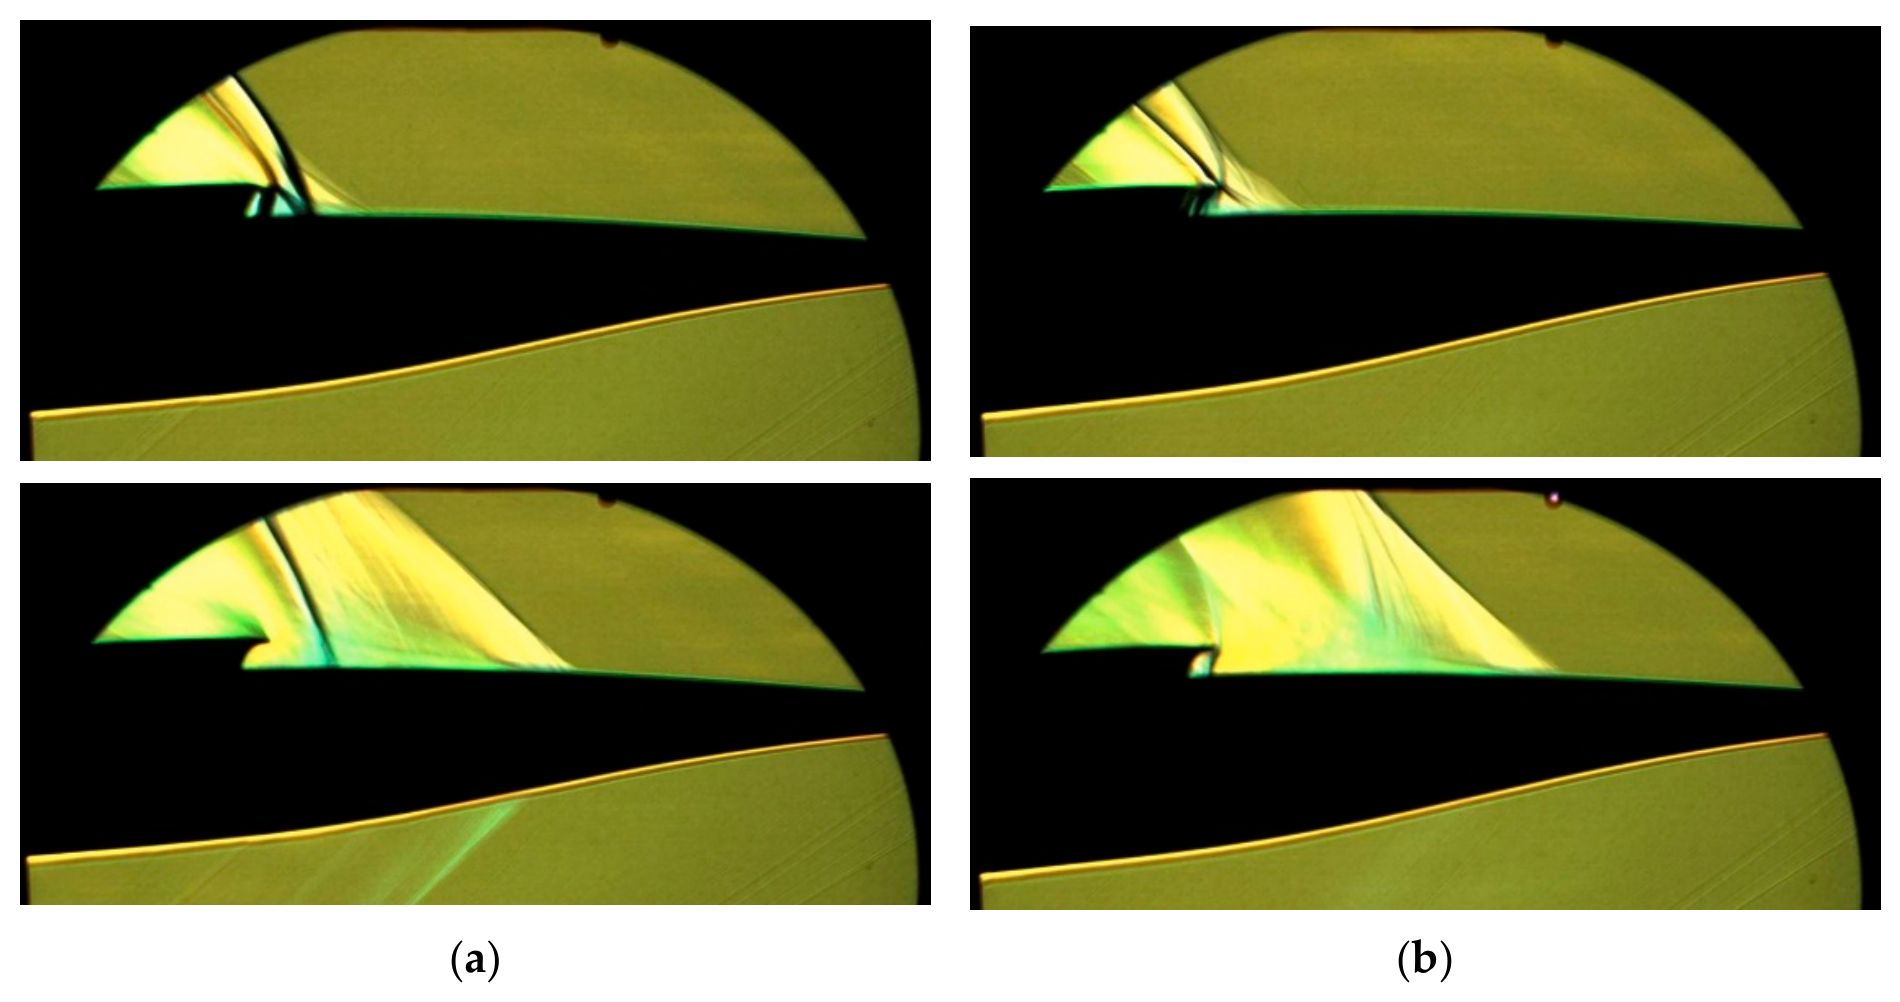
Figure 12 presents the fluctuating-pressure monitoring results of the inlet at a Mach number of 1.8 and angles of attack of 2°, 3°, and 4°. It is observed that at an angle of attack of 4° and a throttling ratio of 0.4, significant pressure oscillations appear at the inlet, whereas no obvious oscillations are detected at the outlet. As the throttling level increases, severe pressure oscillations develop at the outlet. At an angle of attack of 3° and a throttling ratio of 0.35, pressure oscillations begin to appear at the inlet. During the subsequent throttling process over a wide range, the inlet continues to exhibit oscillations, while no significant oscillation is observed at the outlet except for a relatively large amplitude at T.R. = 0.2. Figure 13 shows schlieren images obtained at the maximum throttling condition for angles of attack of 3° and 4° at Ma = 1.8. It can be seen that under the maximum throttling condition, large shock oscillations near the inlet entrance are clearly captured in both cases. These results indicate that the buzz margin is highly sensitive to variations in angle of attack. Pressure oscillations occur earlier at the inlet than at the outlet, whereas the oscillation amplitude at the outlet is considerably larger than that at the inlet.
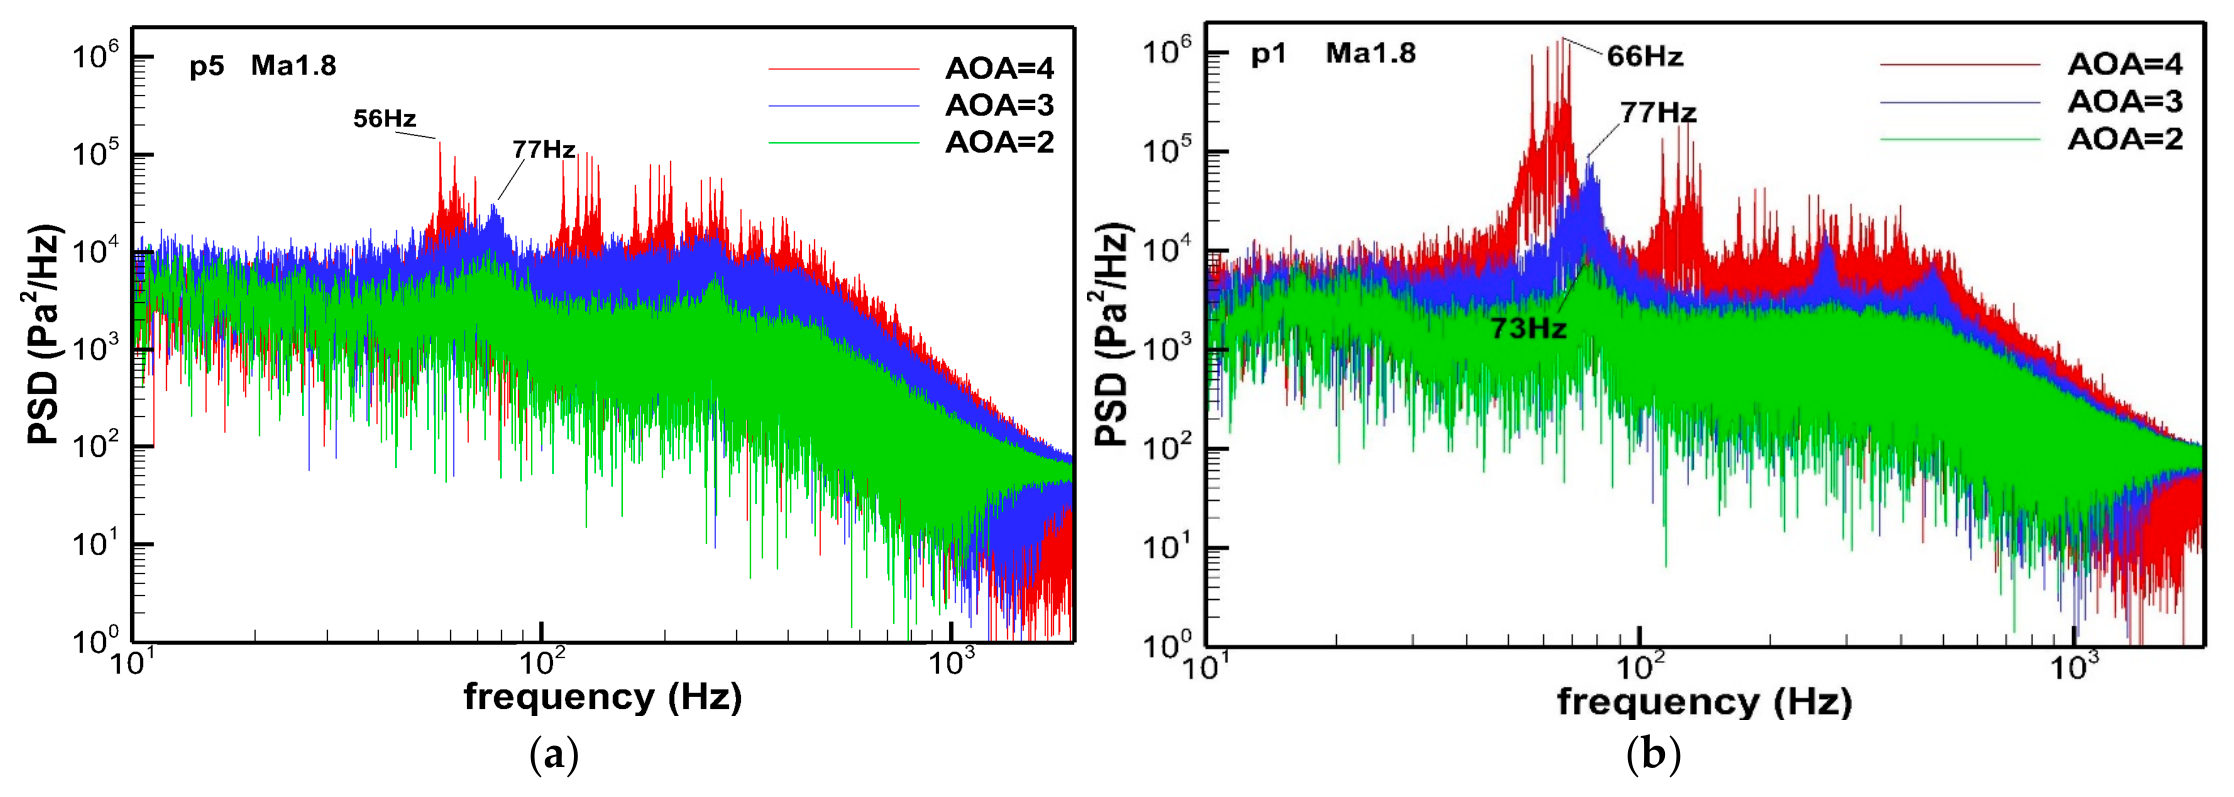
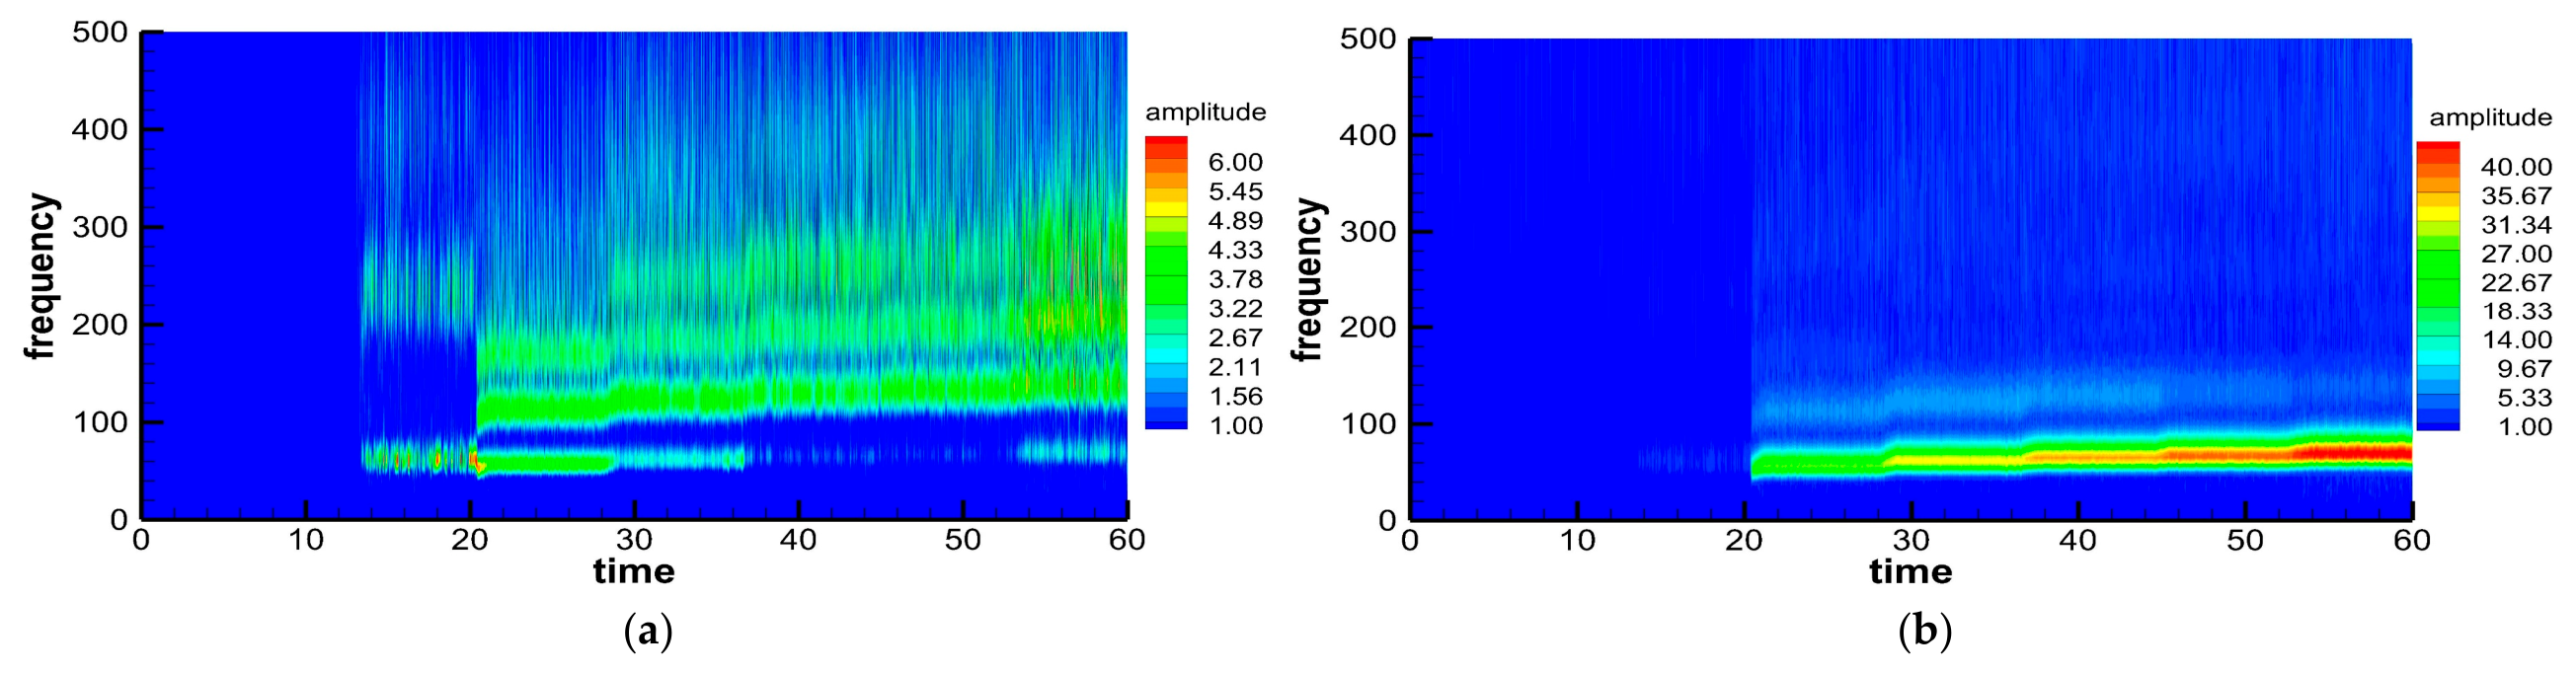
The outlet AIP pressure signal was used as the reference signal for identifying the dominant buzz frequency. Figure 14 and Figure 15 present the PSD of the pressure signals measured at the inlet monitoring points under different angles of attack and the frequency spectra at different throttling stages for the 4° angle-of-attack case, respectively. The results show that the fundamental frequency of the buzz flow field is approximately 60–70 Hz. In addition, multiple harmonic bands are observed at the inlet, whereas the outlet spectrum is primarily dominated by the fundamental frequency. This indicates that the frequency components and underlying flow mechanisms at the inlet are more complex, while the oscillation mode at the outlet is relatively simple.

3.3. Analysis of Buzz Characteristic Simulation Results

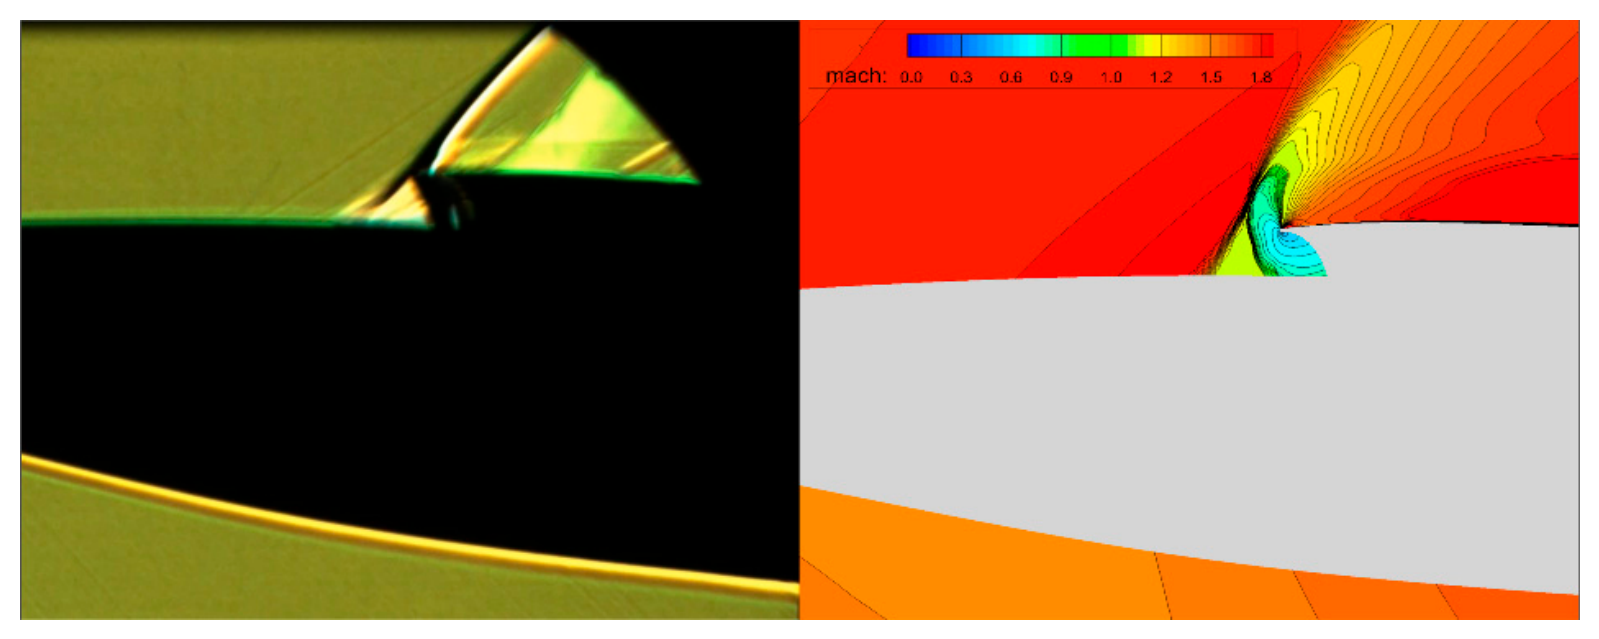
A typical buzz state of the dorsal bump inlet was observed at a freestream Mach number of 1.8 and an angle of attack of 4°. Figure 16 presents a qualitative comparison between experimental schlieren images and numerical flow fields. The predicted dominant frequency of 71 Hz is close to the measured value of 66 Hz, indicating that the present numerical method reasonably captures the dominant unsteady buzz behavior of the inlet.
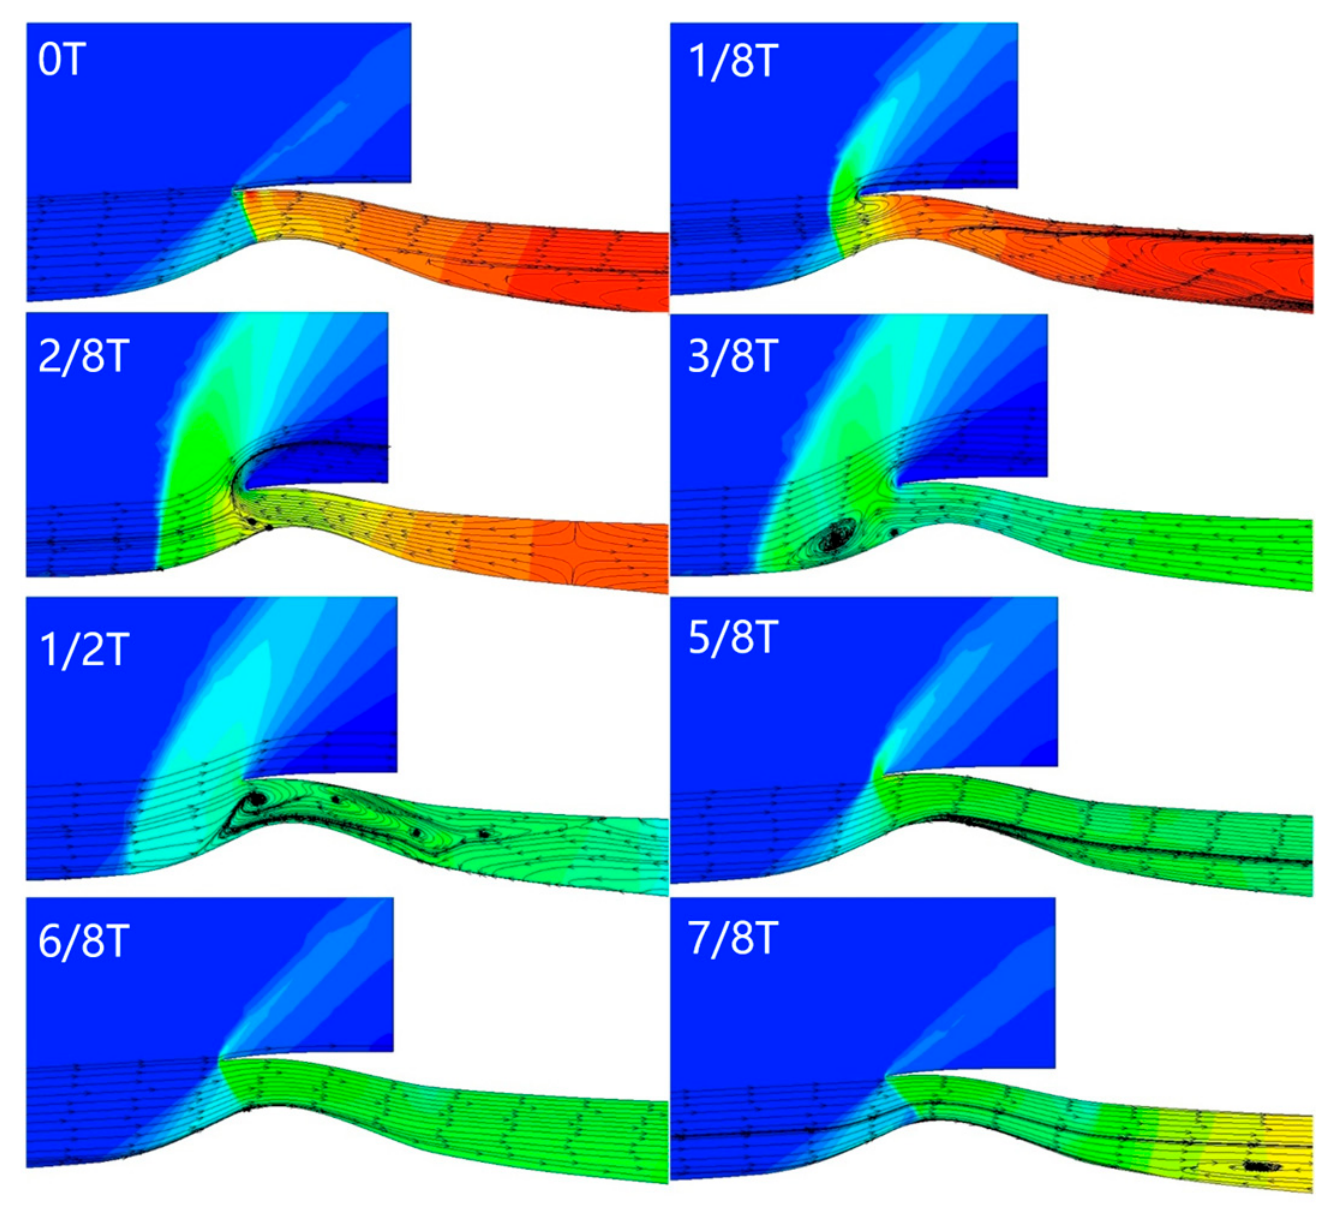
A further analysis was conducted on the buzz state at a 4° angle of attack. Figure 17 presents the travel distance of the shock wave during one buzz cycle of the inlet. As shown in the figure, the shock wave exhibits a significant travel distance during the flow field oscillation process. When the shock wave moves away from the lip, a substantial reverse flow appears at the entrance to release the high pressure accumulated downstream. At this moment, air is expelled outward from both the inlet entrance and exit, which consequently reduces the back-pressure at the rear of the internal duct to a relatively low trough. The shock wave then retreats to a supercritical state, and the duct re-pressurizes, entering the next oscillation cycle.
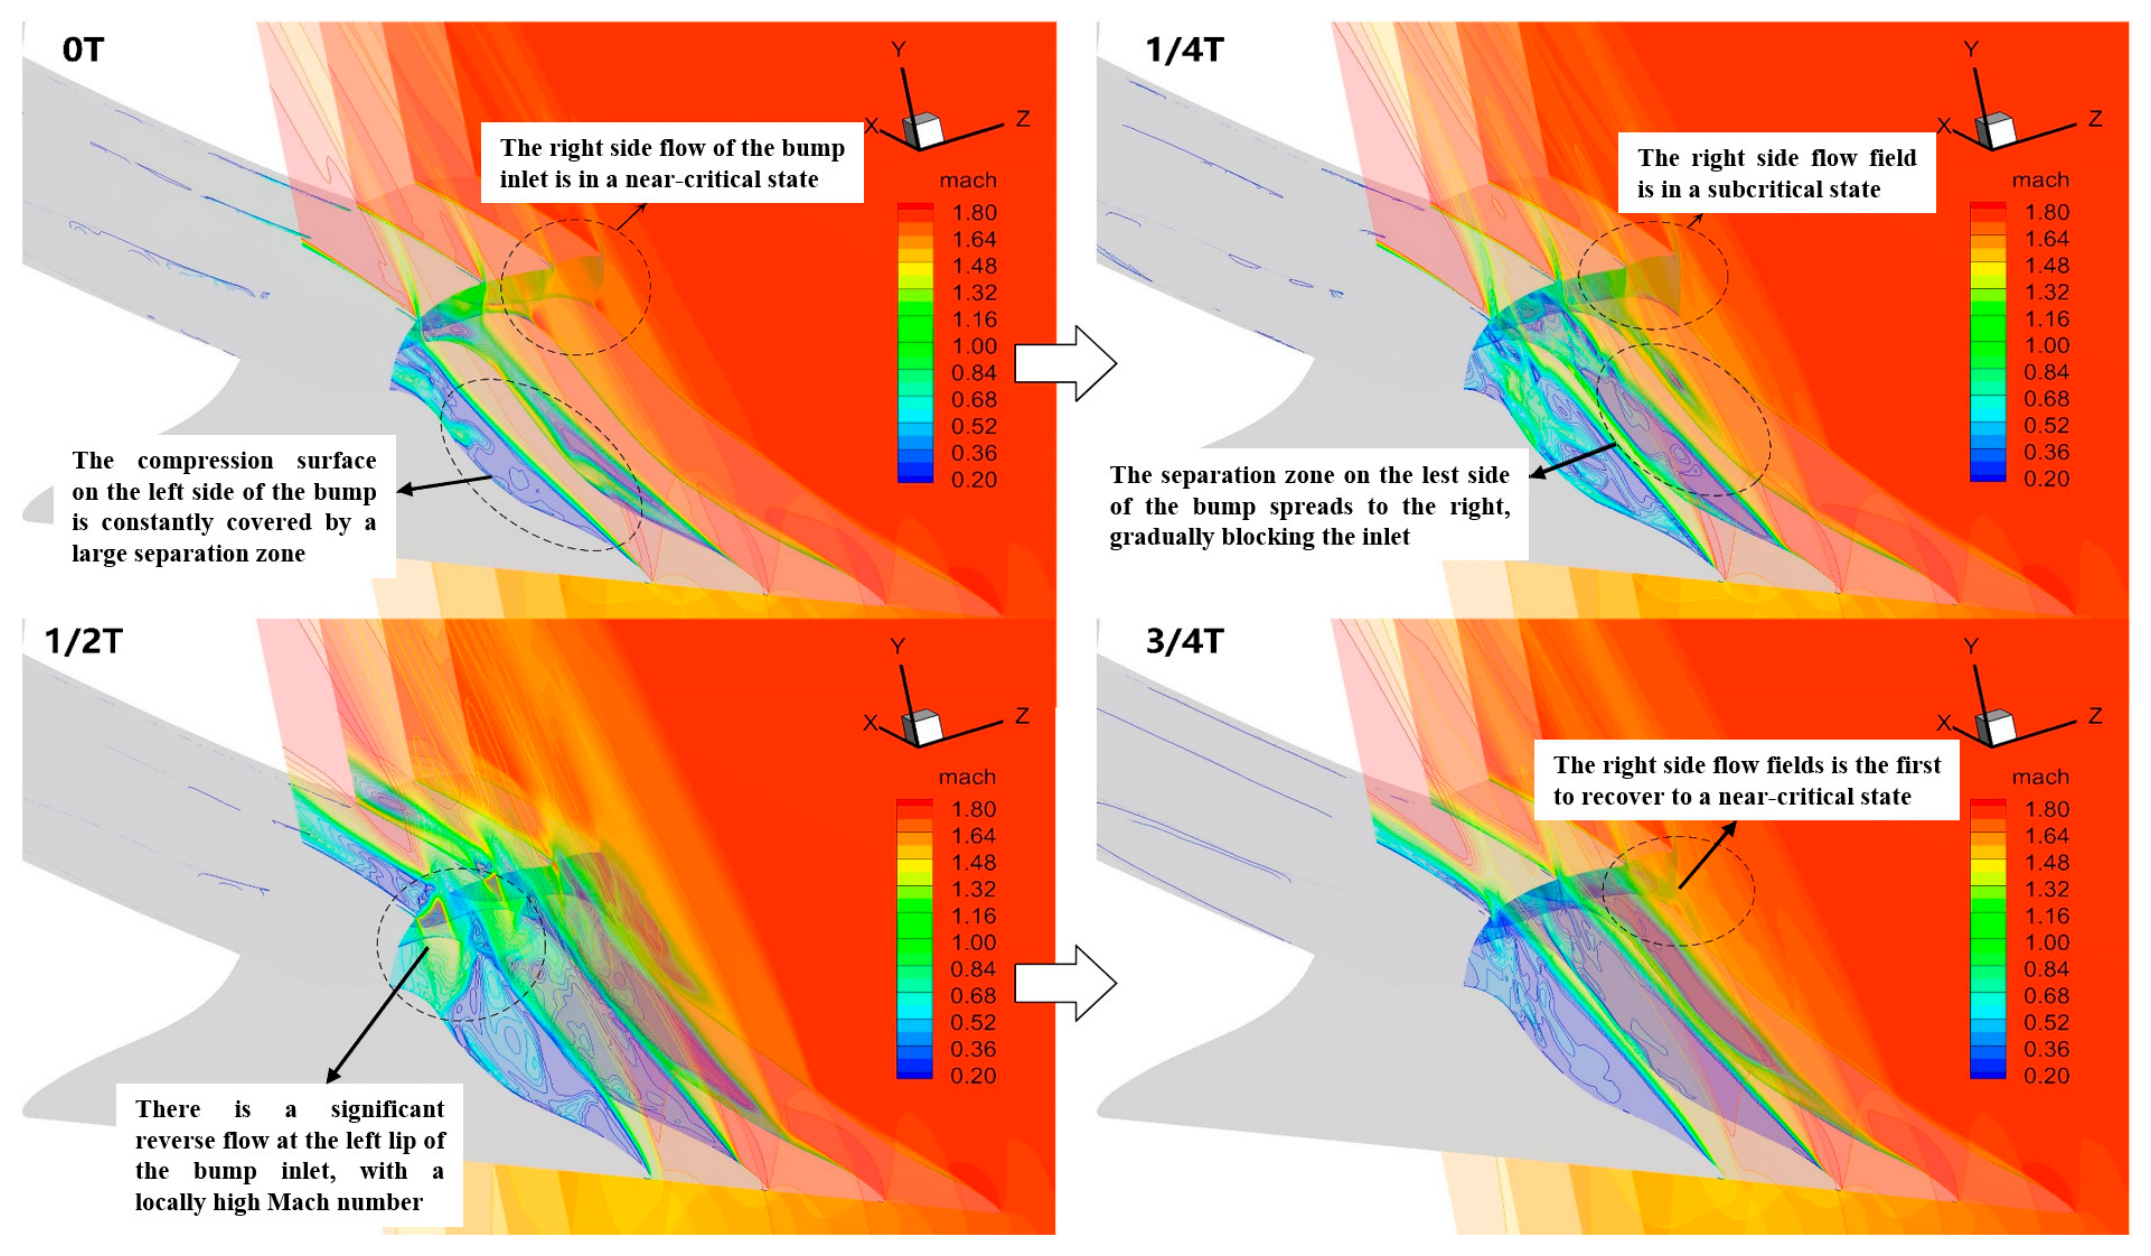
Figure 18 presents the spanwise slices of the inlet buzz flow field. Due to the asymmetric configuration of the bump, significant differences are observed in the flow fields across different spanwise slices. On the lower side of the asymmetric bump inlet in the spanwise direction, owing to the accumulation of low-energy flow and weaker local back-pressure tolerance, a large separation zone or reverse flow persistently exists on the bump surface of the lower side throughout a buzz cycle. Consequently, the flow field oscillation is primarily dominated by the periodic ingestion and expulsion of the shock system on the spanwise side with stronger back-pressure tolerance. At time 0T, the flow field slice on the right side of the bump indicates that the local flow is in a near-critical state. At 1/4T, the separation zone on the lower side of the bump spreads toward the right side, gradually blocking the entrance, and the right-side flow field enters a subcritical state. At 1/2T, a substantial reverse flow exists at the left cowl lip of the bump inlet, with a relatively high local Mach number. At 3/4T, the right-side flow field is the first to recover to a near-critical state.
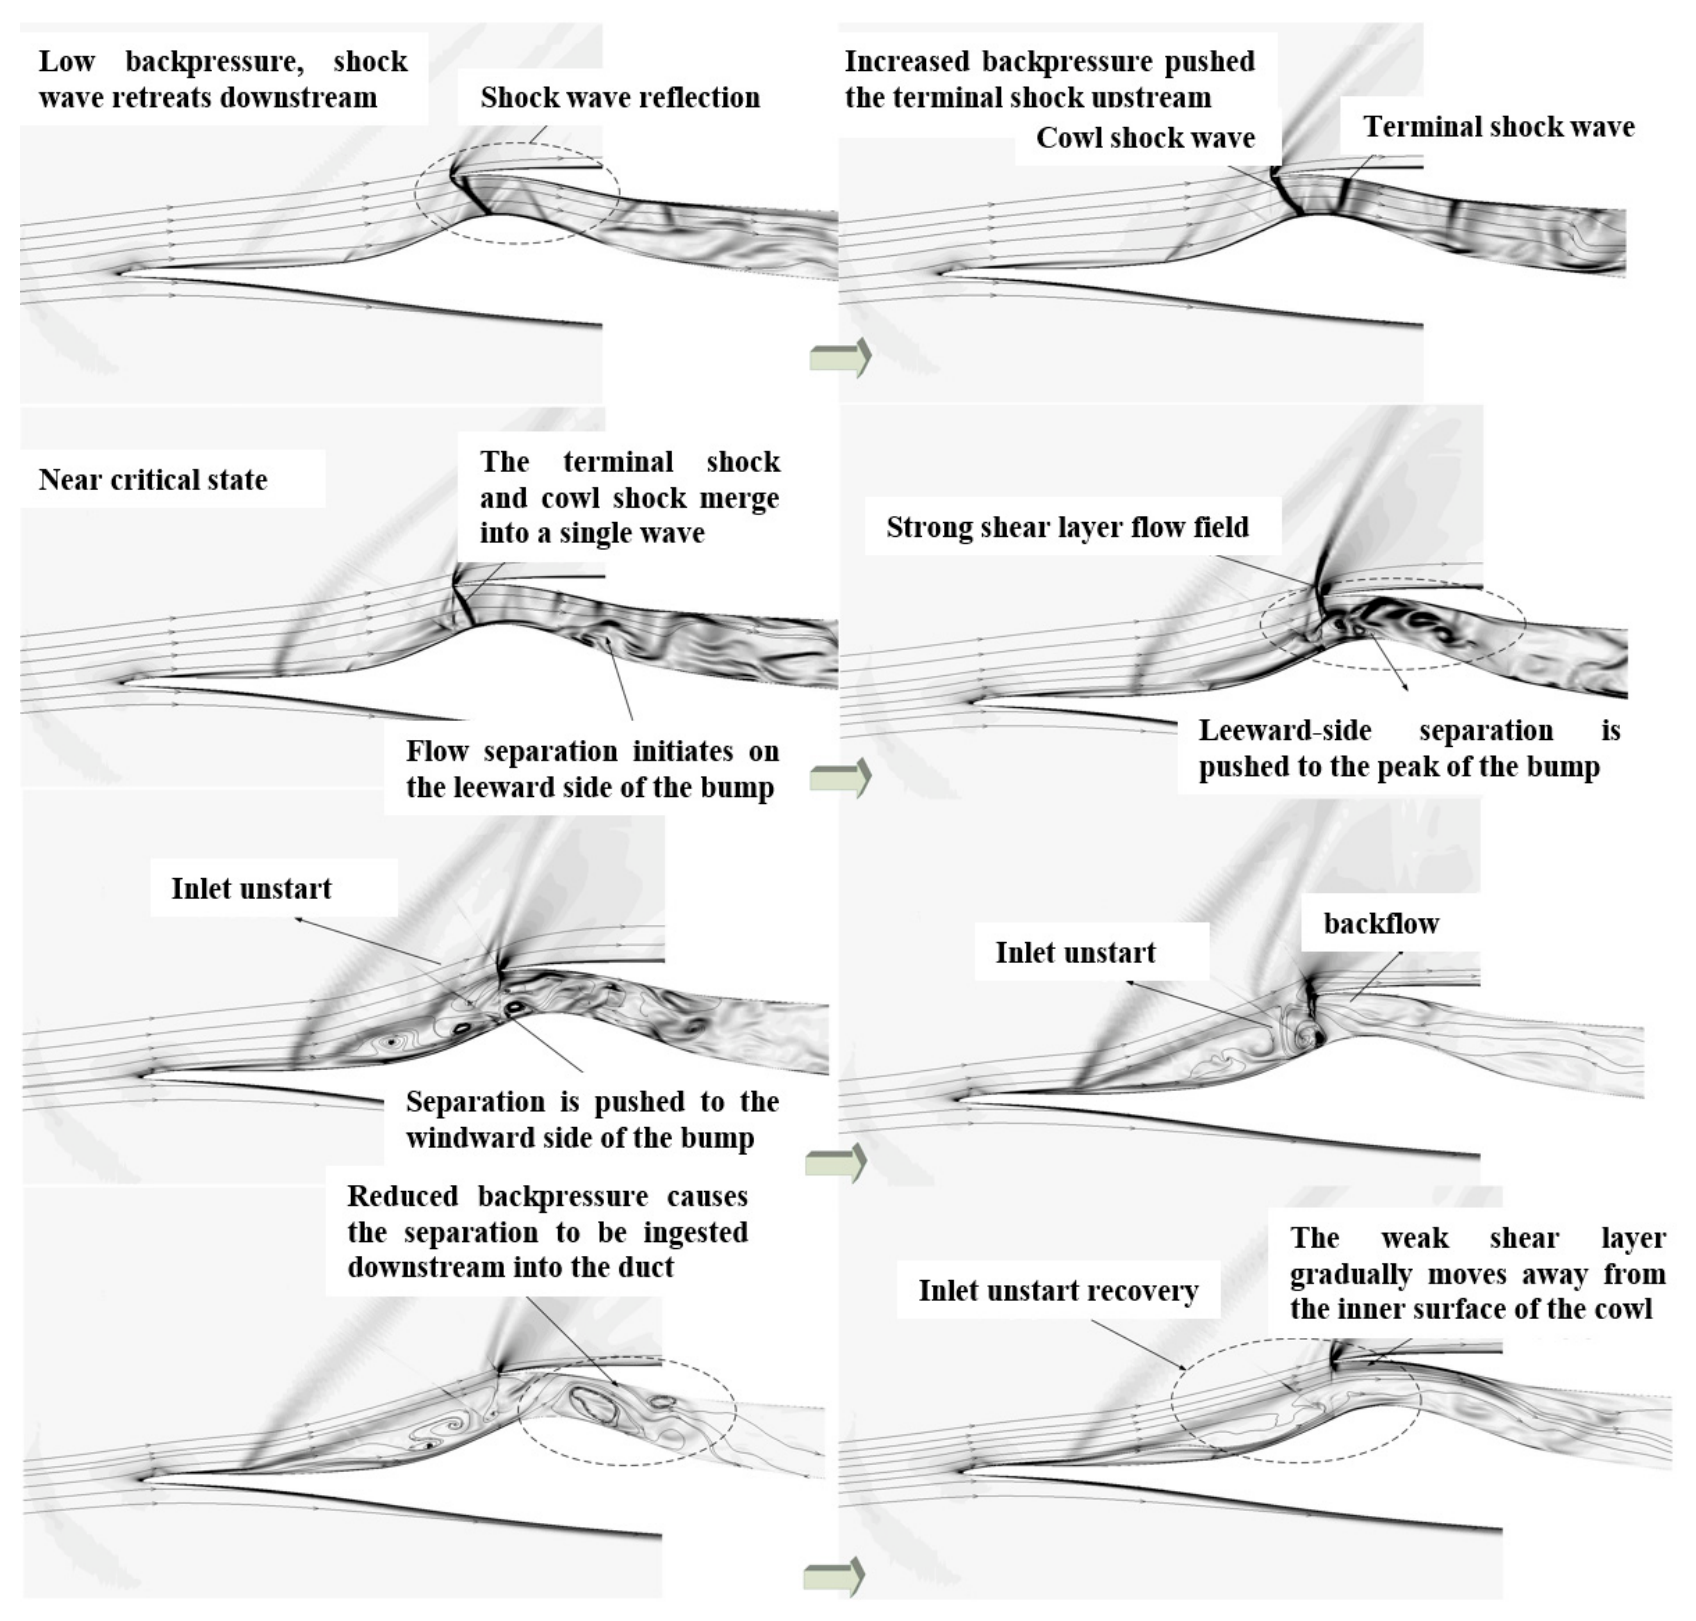
Since the shock–system ingestion and expulsion on the higher side dominates the buzz flow field, the second flow field slice from the right in the spanwise direction is extracted. Based on the more refined numerical schlieren flow field structures, an analysis of the buzz mechanism of the bump inlet is conducted. As shown in Figure 19, the buzz cycle begins with the pressurization process within the duct. When the back-pressure is relatively low, the cowl lip reflected shock wave is distinct, and shock wave reflection phenomena are also observed inside the duct. As the downstream back-pressure increases, the terminal shock wave is pushed upstream and gradually merges with the cowl lip shock wave into a single shock wave. Separation begins to appear on the leeward side of the bump, and the inlet is in a near-critical state at this stage. When the back-pressure continues to rise, the separation zone on the leeward side and that spreading in the spanwise direction are pushed to the bump crest. Simultaneously, a strong shear layer is generated, rolling up into complex vortex structures. The gradual accumulation and elevation of the separation zone lead to inlet blockage. When the downstream pressure accumulates to a peak value, the excessive mass-flow within the duct is released upstream, manifested as a large reverse flow that pushes open the separation zone on the lower surface and spills over from the inner wall of the upper cowl lip. As the inlet is blocked by the separation zone, the pressure within the duct decreases due to the slow discharge of mass-flow from the exit, until the pressure inside the duct falls below the pressure at the upstream inlet and gradually reaches a pressure trough. Thereafter, the separation zone is swallowed downstream into the duct, and the weak shear layer begins to descend from a position close to the inner wall of the cowl lip and gradually moves away from the lip. The inlet is no longer blocked, and a new round of pressurization begins at the exit. In the aforementioned process, the establishment of the buzz cycle is closely related to the spanwise spreading, accumulation, and scavenging of the bump separation zone. The processes of inlet blockage and recovery are accompanied by the appearance of strong and weak shear layers.

4. Conclusions

Three-dimensional unsteady simulations and wind-tunnel tests were conducted to investigate the buzz evolution of a dorsal supersonic bump inlet for a flying-wing configuration. The main conclusions are summarized as follows:
(1)
The dorsal bump inlet exhibits relatively high total pressure recovery at the design Mach number and under flight conditions below the design Mach number, whereas the total pressure recovery decreases considerably under conditions exceeding the design Mach number. Moreover, the curve in the subcritical state displays a significant positive slope, indicating that the recovery capability of the inlet system is limited when subjected to downstream engine disturbances. The dorsal bump inlet possesses a relatively wide buzz margin at a 0° angle of attack; even under a considerable degree of downstream throttling, the shock wave can remain stabilized on the bump surface, and the disturbance exhibits an amplitude attenuation trend;
(2)
The buzz margin of the dorsal bump inlet decreases significantly at high angles of attack. The flow field exhibits pronounced three-dimensional characteristics, and the oscillatory flow field is dominated by the periodic shock–system ingestion and expulsion on the side with higher spanwise back-pressure tolerance. The establishment of the buzz cycle is closely related to the spanwise spreading, accumulation, and scavenging of the bump separation zone. The processes of inlet blockage and recovery are accompanied by the appearance of strong and weak shear layers. The dominant buzz frequency predicted by the simulation is 71 Hz, which agrees well with the experimentally measured dominant frequency of 66 Hz, demonstrating that the present numerical method can capture the dominant unsteady oscillation of the dorsal bump inlet.
The present findings have practical implications for the design and stability assessment of supersonic inlet systems integrated with flying-wing configurations. The revealed relationship among angle of attack, downstream throttling, shock–system motion, and pressure oscillation can provide guidance for identifying safe operating boundaries and avoiding buzz-induced inlet instability. In particular, the understanding of spanwise separation development and shock–system ingestion/expulsion may be useful for the design of three-dimensional bump inlets with improved back-pressure tolerance. The results can also support the development of passive or active flow-control strategies, such as boundary-layer bleed, local blowing, or geometric optimization of the bump and cowl lip, to suppress large-amplitude buzz oscillations.
Future work will focus on extending the present study to a wider range of Mach numbers, angles of attack, and throttling conditions, as well as considering more realistic inlet–engine coupling effects. Higher-fidelity turbulence-resolving simulations and additional wind-tunnel measurements will also be carried out to further clarify the detailed three-dimensional separated-flow structures during buzz. In addition, optimization and control methods will be investigated to improve the stable operating margin of dorsal bump inlets under off-design conditions.

Author Contributions

Conceptualization, D.L. and Y.T.; methodology, M.C.; software, C.Z. and H.W.; validation, J.C. All authors have read and agreed to the published version of the manuscript.

Funding

This research received no external funding.

Data Availability Statement

Data are available on request due to restrictions.

Conflicts of Interest

The authors declare no conflicts of interest. The funders had no role in the design of the study; in the collection, analyses, or interpretation of data; in the writing of the manuscript; or in the decision to publish the results.

Abbreviations

The following abbreviations are used in this manuscript:
PSDPower Spectral Density
NSNavier–Stokes
DDESDelayed Detached Eddy Simulation
PODProper Orthogonal Decomposition
AIPAerodynamic Interface Plane
T.R.Throttling Ratio
SASpalart–Allmaras
URANSUnsteady Reynolds-Averaged Navier–Stokes

References

  1. Liu, X.; Yu, S.; Li, C. Propulsion Systems for Cruise Missiles: Volume I; Astronautics Press: Beijing, China, 1992. [Google Scholar]
  2. Chang, J.; Li, N.; Xu, K.; Bao, W.; Yu, D. Recent research progress on unstart mechanism, detection and control of hypersonic inlet. Prog. Aerosp. Sci. 2017, 89, 1–22. [Google Scholar] [CrossRef] [Scilit]
  3. McClinton, C.R.; Hunt, J.L.; Ricketts, R.H.; Reukauf, P.J.; Peddie, C.L. Airbreathing hypersonic technology vision vehicles and development dreams. In Proceedings of the 9th International Space Planes and Hypersonic Systems and Technologies Conference, Norfolk, VA, USA, 1–5 November 1999. [Google Scholar]
  4. Tan, H.J.; Guo, R.W. Experimental study of the unstable-unstarted condition of a hypersonic inlet at Mach 6. J. Propuls. Power 2007, 23, 783–788. [Google Scholar] [CrossRef] [Scilit]
  5. Chen, H.; Tan, H.J.; Zhang, Q.F.; Zhang, Y. Buzz flows in an external-compression inlet with partially isentropic compression. AIAA J. 2017, 55, 4288–4295. [Google Scholar] [CrossRef] [Scilit]
  6. Chima, R.V. Analysis of Buzz in a Supersonic Inlet; NASA Technical Memorandum No. NASA/TM-2012-217612; National Aeronautics and Space Administration: Washington, DC, USA, 2012. [Google Scholar]
  7. Newsome, R.W. Numerical simulation of near-critical and unsteady, subcritical inlet flow. AIAA J. 1984, 22, 1375–1379. [Google Scholar] [CrossRef] [Scilit]
  8. Oswatitsch, K. Pressure Recovery for Missiles with Reaction Propulsion at High Supersonic Speeds: The Efficiency of Shock Diffusers; NACA Technical Memorandum No. 1140; National Advisory Committee for Aeronautics: Washington, DC, USA, 1947. [Google Scholar]
  9. Ferri, A.; Nucci, L.M. The Origin of Aerodynamic Instability of Supersonic Inlets at Subcritical Conditions; NACA Research Memorandum No. L50K30; National Advisory Committee for Aeronautics: Washington, DC, USA, 1951. [Google Scholar]
  10. Dailey, C.L. Supersonic diffuser instability. J. Aeronaut. Sci. 1955, 22, 733–749. [Google Scholar] [CrossRef] [Scilit]
  11. Fisher, S.A.; Neale, M.C.; Brooks, A.J. On the Sub-Critical Stability of Variable Ramp Intakes at Mach Numbers Around 2; ARC Reports and Memoranda No. 3711; Aeronautical Research Council: London, UK, 1972. [Google Scholar]
  12. Nagashima, T.; Obokata, T.; Asanuma, T. Experiment of Supersonic Air Intake Buzz. In Institute of Space and Aeronautical Science; Report No. 481; University of Tokyo: Tokyo, Japan, 1972. [Google Scholar]
  13. Trapier, S.; Duveau, P.; Deck, S. Experimental study of supersonic inlet buzz. AIAA J. 2006, 44, 2354–2365. [Google Scholar] [CrossRef] [Scilit]
  14. Trapier, S.; Deck, S.; Duveau, P. Delayed detached-eddy simulation and analysis of supersonic inlet buzz. AIAA J. 2008, 46, 118–131. [Google Scholar] [CrossRef] [Scilit]
  15. Lee, H.J.; Lee, B.J.; Kim, S.D.; Jeung, I.S. Flow characteristics of small-sized supersonic inlets. J. Propuls. Power 2011, 27, 306–318. [Google Scholar] [CrossRef] [Scilit]
  16. Soltani, M.R.; Sepahi-Younsi, J. Buzz cycle description in an axisymmetric mixed-compression air intake. AIAA J. 2016, 54, 1040–1053. [Google Scholar] [CrossRef] [Scilit]
  17. Chen, H.; Tan, H.J.; Zhang, Q.F.; Zhang, Y. Throttling process and buzz mechanism of a supersonic inlet at overspeed mode. AIAA J. 2018, 56, 1953–1964. [Google Scholar] [CrossRef] [Scilit]
  18. Chen, H.; Tan, H.J. Buzz flow diversity in a supersonic inlet ingesting strong shear layers. Aerosp. Sci. Technol. 2019, 95, 105471. [Google Scholar] [CrossRef] [Scilit]
  19. Lu, P.J.; Jain, L.T. Numerical investigation of inlet buzz flow. J. Propuls. Power 1998, 14, 90–100. [Google Scholar] [CrossRef] [Scilit]
  20. Hankey, W.L.; Shang, J.S. Analysis of self-excited oscillations in fluid flows. In Proceedings of the 13th Fluid & Plasma Dynamics Conference, Snowmass, CO, USA, 14–16 July 1980. [Google Scholar]
  21. Hong, W.; Kim, C. Computational study on hysteretic inlet buzz characteristics under varying mass flow conditions. AIAA J. 2014, 52, 1357–1373. [Google Scholar] [CrossRef] [Scilit]
  22. Chang, J.; Yu, D.; Bao, W.; Wang, C.; Chen, T. Mathematical modeling and rapid recognition of hypersonic inlet buzz. Aerosp. Sci. Technol. 2012, 23, 172–178. [Google Scholar] [CrossRef] [Scilit]
  23. Chang, J.; Wang, L.; Bao, W. Mathematical modeling and characteristic analysis of scramjet buzz. Proc. Inst. Mech. Eng. Part G J. Aerosp. Eng. 2014, 228, 2542–2552. [Google Scholar] [CrossRef] [Scilit]
  24. Yamamoto, J.; Kojima, Y.; Kameda, M.; Watanabe, Y.; Hashimoto, A.; Aoyama, T. Prediction of the onset of supersonic inlet buzz. Aerosp. Sci. Technol. 2020, 96, 105523. [Google Scholar] [CrossRef] [Scilit]
  25. Luo, W.G.; Wei, Y.Q.; Dai, K.; Zhu, J.F.; You, Y.C. Spatiotemporal characterization and suppression mechanism of supersonic inlet buzz with proper orthogonal decomposition method. Energies 2020, 13, 217. [Google Scholar] [CrossRef] [Scilit]
  26. Sepahi-Younsi, J.; Forouzi Feshalami, B.; Maadi, S.R.; Soltani, M.R. Boundary layer suction for high-speed air intakes: A review. Proc. Inst. Mech. Eng. Part G J. Aerosp. Eng. 2019, 233, 3459–3481. [Google Scholar]
  27. He, Y.; Huang, H.; Yu, D. Investigation of boundary-layer ejecting for resistance to back pressure in an isolator. Aerosp. Sci. Technol. 2016, 56, 1–13. [Google Scholar] [CrossRef] [Scilit]
  28. Titchener, N.; Babinsky, H. Shock wave/boundary-layer interaction control using a combination of vortex generators and bleed. AIAA J. 2013, 51, 1221–1233. [Google Scholar] [CrossRef] [Scilit]
  29. Panaras, A.G.; Lu, F.K. Micro-vortex generators for shock wave/boundary layer interactions. Prog. Aerosp. Sci. 2015, 74, 16–47. [Google Scholar] [CrossRef] [Scilit]
  30. Lapushkina, T.A.; Erofeev, A.V. Supersonic flow control via plasma, electric, and magnetic impacts. Aerosp. Sci. Technol. 2017, 69, 313–320. [Google Scholar] [CrossRef] [Scilit]
  31. Wang, H.; Wu, J.; Peng, X.; Liu, D.; Xiong, N.; Wu, J.; Zhang, C.; Wang, H.; Wang, X.; Zhang, Y.; et al. Research on Reynolds number effects and influencing factors of the wide-body transport aircraft standard model CHN-T2. Aerosp. Sci. Technol. 2025, 167, 110649. [Google Scholar] [CrossRef] [Scilit]
  32. Spalart, P.R.; Allmaras, S.R. A one-equation turbulence model for aerodynamic flows. In Proceedings of the 30th Aerospace Sciences Meeting and Exhibit, Reno, NV, USA, 6–9 January 1992. AIAA Paper 92–0439. [Google Scholar]
Figure 1. Simplified physical model of the dorsal inlet.
Aerospace 13 00631 g001
Figure 2. Photograph of the inlet model installed in the test section of the 1.2 m transonic wind tunnel.
Aerospace 13 00631 g002
Figure 3. Pressure measurement points and numbering on one side of the inlet in the streamwise direction.
Aerospace 13 00631 g003
Figure 4. Computational domain and computational mesh.
Aerospace 13 00631 g004
Figure 5. Comparison between numerical simulation results and experimental results for major buzz [12]; (a) comparison between numerical schlieren images (upper half) and experimental schlieren images (lower half); (b) comparison between pressure oscillations obtained from numerical simulation and experiment.
Aerospace 13 00631 g005
Figure 6. Comparison between numerical simulation results and experimental results for minor buzz [12]; (a) comparison between numerical schlieren images (upper half) and experimental schlieren images (lower half); (b) comparison between pressure oscillations obtained from numerical simulation and experiment.
Aerospace 13 00631 g006
Figure 7. Surface mesh of the dorsal bump inlet.
Aerospace 13 00631 g007
Figure 8. Computational domain used in the simulation.
Aerospace 13 00631 g008
Figure 9. Inlet total pressure recovery versus inlet mass-flow coefficient (a) and outlet flow function (b).
Aerospace 13 00631 g009
Figure 10. Inlet drag coefficient versus inlet mass-flow coefficient (a) and outlet flow function (b).
Aerospace 13 00631 g010
Figure 11. Outlet flow function versus inlet mass-flow coefficient.
Aerospace 13 00631 g011
Figure 12. Monitoring of pressure oscillations (M = 1.8, α = 2°~4°): (a) pressure signal at measurement point P5 on the inlet bump compression surface; (b) pressure signal at measurement point P1 at the outlet AIP.
Aerospace 13 00631 g012
Figure 13. Experimental schlieren images at different angles of attack for Ma = 1.8: (a) maximum throttling condition at an angle of attack of 3°; (b) maximum throttling condition at an angle of attack of 4°.
Aerospace 13 00631 g013
Figure 14. Power spectral density: (a) measurement point P5 on the inlet bump compression surface; (b) measurement point P1 at the outlet AIP plane.
Aerospace 13 00631 g014
Figure 15. Frequency spectra at different throttling stages under a 4° angle of attack: (a) inlet pressure tap p5; (b) outlet pressure tap p1.
Aerospace 13 00631 g015
Figure 16. Comparison of experimental schlieren images and numerical flow fields at the inlet entrance under a 4° angle of attack.
Aerospace 13 00631 g016
Figure 17. Time-resolved evolution of the shock–system excursion during one complete buzz cycle of the inlet. The eight snapshots correspond to t / T = 0 , 1 / 8 , 2 / 8 , 3 / 8 , 1 / 2 , 5 / 8 , 6 / 8 , and 7 / 8 , respectively, where T is the buzz period. The snapshots are arranged in chronological order from top to bottom and from left to right.
Aerospace 13 00631 g017
Figure 18. Spanwise slices of the inlet buzz flow field.
Aerospace 13 00631 g018
Figure 19. Numerical schlieren images of flow field slices during one buzz cycle.
Aerospace 13 00631 g019
Table 1. Numerical simulation parameters.
ParametersValue
Freestream Mach number Ma2
Reynolds number Re107
Characteristic length L, m0.06
Stagnation speed of sound C0, m/s330.2
Table 2. Validation of simulated and experimental frequencies under typical buzz conditions (Hz).
T.R.CFDEXPRelative Deviation
Minor Buzz0.9712010910.09%
Major Buzz0.673503602.78%
Table 3. Inlet performance obtained at Ma = 0.8, AOA = 0 , p A I P / p = 1.2 with different grids.
Data Source σ A I P Error of σ A I P
Experiment0.968
Coarse grid0.9653366512.663 × 10−3
Medium grid0.9654057722.594 × 10−3
Fine grid 0.9656993242.301 × 10−3
Table 4. Freestream and back-pressure conditions for the simulation of inlet throttling characteristics.
Freestream MachBack Pressure Ratio
SupercriticalNear-CriticalSubcritical
1.62.83.03.23.43.63.8
1.83.54.04.34.54.85.0
2.05.05.25.55.86.16.3
Disclaimer/Publisher’s Note: The statements, opinions and data contained in all publications are solely those of the individual author(s) and contributor(s) and not of MDPI and/or the editor(s). MDPI and/or the editor(s) disclaim responsibility for any injury to people or property resulting from any ideas, methods, instructions or products referred to in the content.