Article

Transient Dynamics of Multi-Port Lateral Jet Interactions on a Hypersonic Vehicle

1
Shanghai Aerospace Control Technology Institute, Shanghai 201109, China
2
Shanghai Key Laboratory of Aerospace Intelligent Control Technology, Shanghai 201109, China
*
Author to whom correspondence should be addressed.
Aerospace 2026, 13(7), 608; https://doi.org/10.3390/aerospace13070608
Submission received: 30 April 2026 / Revised: 17 June 2026 / Accepted: 22 June 2026 / Published: 1 July 2026
(This article belongs to the Section Aeronautics)

Abstract

This study presents an unsteady numerical investigation of multi-port lateral jet interaction phenomena on a hypersonic vehicle configuration. An unsteady RANS approach with Menter’s SST k-ω model is implemented to investigate the transient interference mechanisms among single-, triple-, and quintuple-port arrangements, focusing on jet initiation and termination transients. Upstream jets establish bow shocks and a separation zone that progressively degrade the effective pressure ratio for downstream ports. This aerodynamic shielding manifests as nonlinear escalation in coupling intensity, with the quintuple-port configuration exhibiting complex multi-level shock systems distinct from simple superposition of single-port effects. Flow field development completes within approximately 0.5 ms, yet jet-induced vortical structures exhibit pronounced temporal hysteresis during the decay phase, with the high-pressure zone dissipating progressively from upstream to downstream regions. Under steady-state conditions, the quintuple-port arrangement attains a normal force amplification coefficient of 1.044 alongside a pitching moment amplification coefficient of 4.387, illustrating substantial moment augmentation potential inherent to multi-port interference effects. These findings furnish theoretical foundations for Reaction Control System (RCS) port layout optimization and control strategy development in hypersonic flight vehicles.

1. Introduction

For hypersonic vehicles operating at high altitudes where aerodynamic control surfaces become ineffective, lateral jet Reaction Control Systems (RCSs) provide an alternative attitude modulation mechanism through high-velocity gas injection. While offering millisecond-scale response capabilities essential for terminal guidance correction and high-angle-of-attack stabilization, these systems introduce complex shock–vortex interactions that substantially alter vehicle aerodynamics. When multiple ports operate simultaneously to meet demanding control authority requirements, the resulting interference flow fields exhibit pronounced unsteady characteristics during jet initiation and termination—phenomena that remain inadequately characterized in the existing literature [1,2,3].
Under supersonic and hypersonic freestream conditions, lateral jet injection into the crossflow generates intricate shock–vortex interaction flow field structures—bow shocks, separation shocks, lambda shocks, barrel shocks, and Mach disks—alongside complex vortical systems including horseshoe vortices, shear layer vortices, and wake vortices [4,5,6]. These jet interaction effects substantially alter the pressure distribution over the missile surface, inducing supplementary aerodynamic forces and moments—a phenomenon designated the jet interaction effect [7,8]. Amplification or attenuation of control effectiveness may result, directly influencing RCS design efficiency and precision [9,10,11].
Complex coupling phenomena emerge when multiple ports operate concurrently. The bow shocks and separation zones from upstream ports significantly modify the approach flow conditions for downstream ports, directly affecting their control efficiency. Superposition and amalgamation of inter-port vortical structures further exacerbate flow field complexity. The aggregate control effectiveness of multi-port systems does not constitute a simple linear superposition of individual port contributions; pronounced nonlinear coupling characteristics emerge instead [12,13,14]. Flow field establishment and decay exhibit significant temporal hysteresis effects, which are challenges for rapid-response control system design [15,16,17]. Systematic investigations of multi-port unsteady interference characteristics remain relatively limited, particularly concerning flow field evolution mechanisms and aerodynamic property variations during jet initiation and termination transients [18,19,20].
The present work conducts a systematic unsteady numerical investigation of multi-port lateral jet interaction on a hypersonic vehicle configuration. Flow field structural evolution, vortical system development, and dynamic aerodynamic response characteristics throughout jet establishment and decay processes for single-, triple-, and quintuple-port arrangements receive particular emphasis. The investigation aims to elucidate the influence mechanisms of multi-port layouts on control efficiency and amplification characteristics, furnishing theoretical foundations and technical references for Reaction Control System port layout optimization and control strategy formulation in hypersonic flight vehicles.

2. Numerical Methodology and Model Validation

2.1. Governing Equations and Numerical Scheme

The basic equation used in the numerical simulation was the three-dimensional (3D) unsteady compressible Reynolds-averaged N-S equation, which can be written as
∂/∂tΩ W dΩ + ∮Ω (FcFv) · n dS = 0
W denotes the vector of conserved variables; Fc and Fv represent convective and viscous flux vectors, respectively; Ω indicates the control volume; ∂Ω represents the control volume boundary; and n is the outward unit normal vector.
The Ansys Fluent solver is used for the simulations. All flow fields are solved via three-dimensional unsteady URANS equations closed by k-ω Shear Stress Transport (SST) [21]. The second-order implicit temporal discretization scheme is selected for unsteady physical time. A uniform global physical time step of 5 × 10⁻⁶ s is imposed in the time-stepping strategy. The dynamic viscosity of air is calculated using the Sutherland law to capture temperature-dependent viscosity variations in the flow field. Equipped with automatic wall treatment, the SST model automatically switches between low-Re near-wall formulation and high-Re wall function for each computational cell according to its local Reynolds number. Superior performance for adverse pressure gradient flows and separated flows renders the SST model particularly suitable for complex flows involving strong pressure gradients and flow separation, such as jet interaction phenomena [22]. Quantitative convergence criteria: for each physical time step, the residuals of continuity, momentum, k and ω equations are required to drop below 10−6.

2.2. Geometric Configuration and Computational Mesh

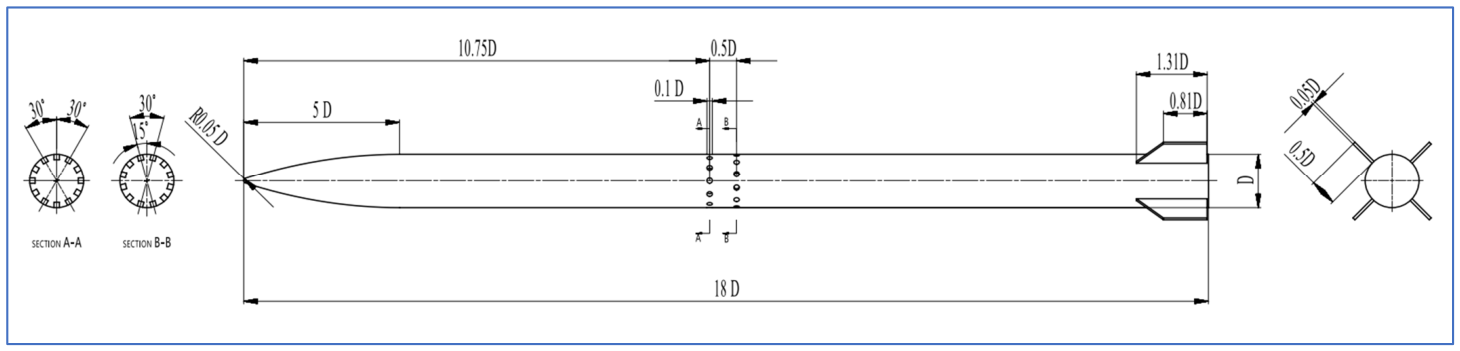
The physical model investigated comprises a hypersonic missile configuration with lateral jet ports (Figure 1). A tangent-ogive nose combined with a cylindrical afterbody constitutes the missile geometry. Body diameter is designated as D; overall length is 18 D. Two circumferential rows of jet ports are arranged along the body. The first row is positioned 10.75 D from the nose apex; inter-row spacing is 0.5 D. Each row contains 12 uniformly distributed circular ports with 15° circumferential staggering between rows. Port diameter is 0.1 D; detailed dimensions appear in Figure 1. The coordinate system origin is located on the missile axis at the midpoint between the two port rows. The x-axis aligns with the missile axis (positive direction from base to nose); y and z axes form a right-handed coordinate system.
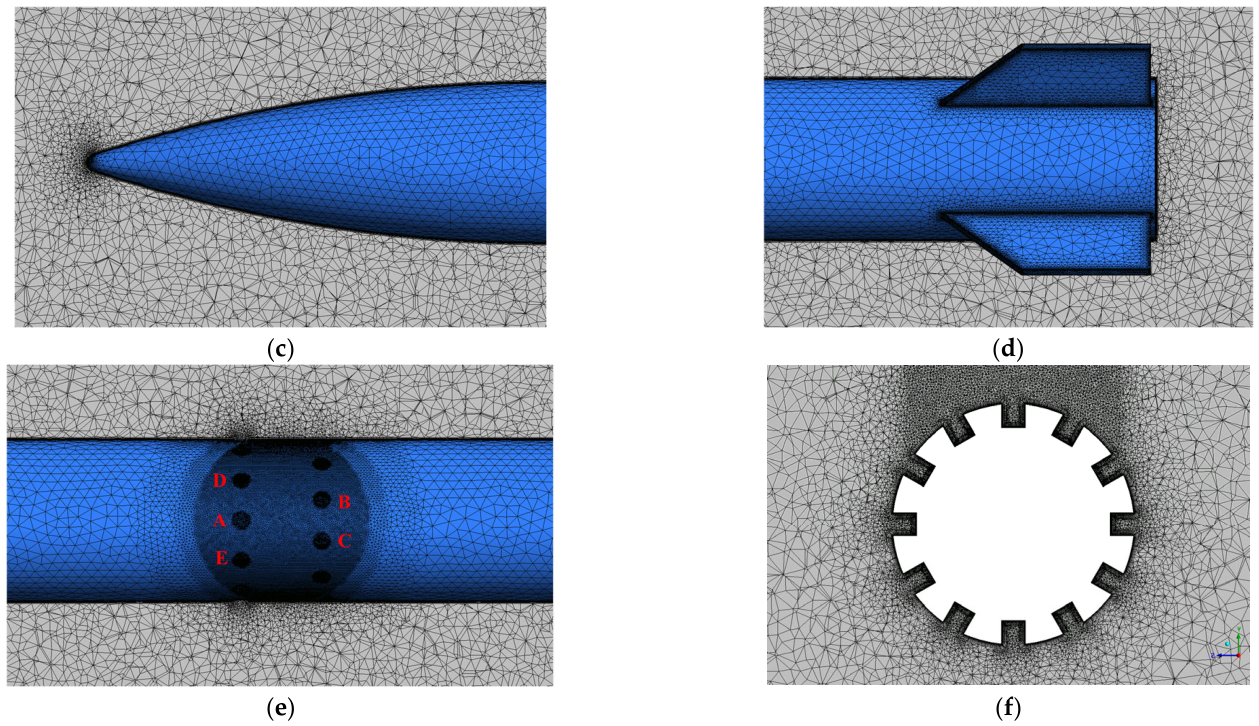
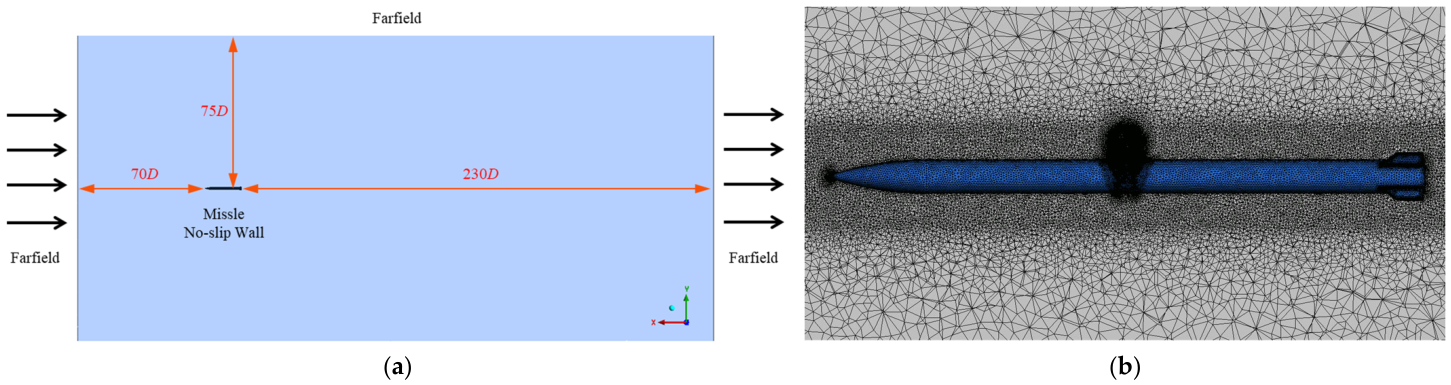
The computational domain comprises a cylindrical region with radius 75 D, extending 70 D upstream of the nose and 230 D downstream of the base (Figure 2). Grid generation is implemented via ICEM CFD. Boundary-fitted prismatic layers are extruded sequentially outward from the missile surface mesh. The height of the first near-wall layer is prescribed as 1 × 10⁻⁵ m to guarantee a dimensionless wall distance Y+ < 1, with a stretching ratio of 1.2 and a total of 20 prismatic layers. Ultra-fine mesh refinement is applied in the jet plume region, where the local characteristic cell size is constrained to 0.5 mm. For the missile geometry, the baseline surface cell size is set to 4 mm, while a refined cell size of 0.5 mm is adopted at the nose tip. A volume mesh stretching ratio of 1.2 is enforced throughout the far-field computational domain.
Port selection for maneuvering in the y-direction is typically made from the five ports (A, B, C, D, E) on the y-side missile surface (Figure 2e). Three port activation schemes are examined: single-port configuration (port A only); triple-port configuration (ports A, B, C); and quintuple-port configuration (five ports, A, B, C, D, E).

2.3. Boundary Conditions and Simulation Parameters

The boundary conditions employed are as follows:
(1)
Far-field boundary: Freestream conditions—Mach number Ma = 5, static pressure P = 1197 Pa, static temperature T = 226.5 K.
(2)
Wall boundary: No-slip adiabatic wall conditions on the missile surface; zero wall velocity; zero normal temperature gradient.
(3)
Jet boundary: Mass flow rate inlet conditions with mass flow rate, static pressure, and static temperature specified; the injected gas is treated as an ideal perfect gas.
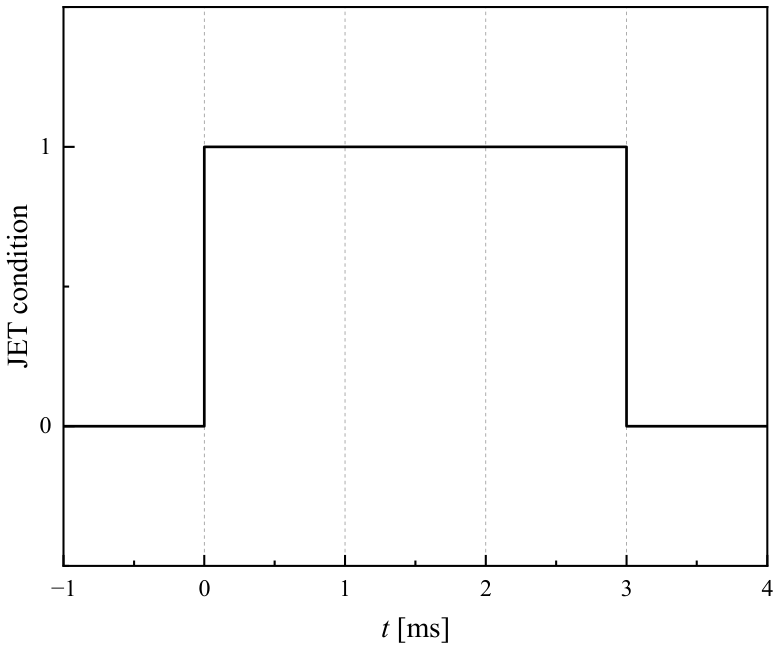
A simplified jet initiation and termination procedure is adopted (Figure 3). At t = 0, the ports are instantaneously opened and stabilized—the port establishment process from initiation to steady state is neglected. Port closure is similarly assumed to occur instantaneously. In Figure 3, 1 indicates an open port; 0 indicates a closed port. When ports are open, the jet parameters specified in Table 1 are applied at the port boundaries. The complete unsteady simulation spans t = −1 ms to t = 4 ms; no-jet state from t = −1 to 0 ms; port instantaneous opening at t = 0 ms with sustained operation for 3 ms; instantaneous closure at t = 3 ms; and decay period from t = 3~4 ms. Total unsteady process duration: 4.0 ms.

2.4. Numerical Method Validation

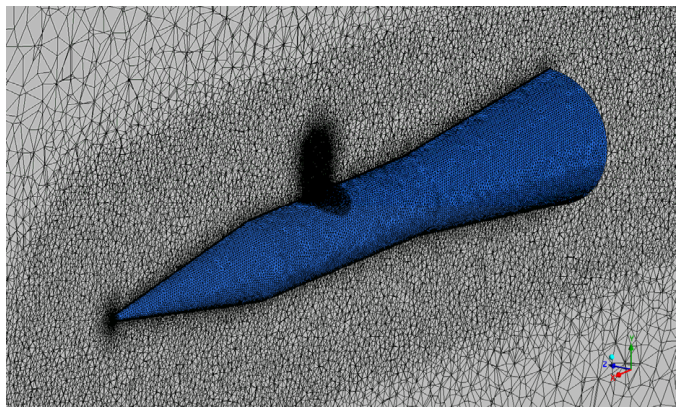
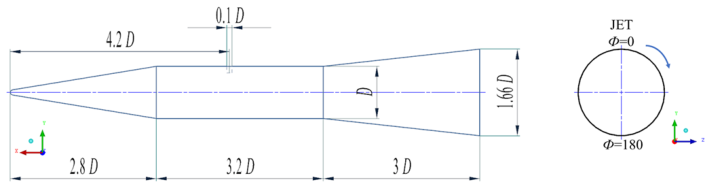
The configuration from Ref. [5] is selected for numerical verification. This configuration comprises an axisymmetric missile with a lateral jet port—a conical nose and cylindrical afterbody with a single mid-body lateral port. The port diameter is 0.1D; geometric parameters appear in Figure 4. The computational mesh appears in Figure 5, with local refinement around the jet port and near-wall regions. Total mesh count is approximately 6 million; the first wall-normal spacing satisfies y+ ≈ 1. Table 2 lists all computational conditions for the validation case, consistent with the experimental setup given in Ref. [5].
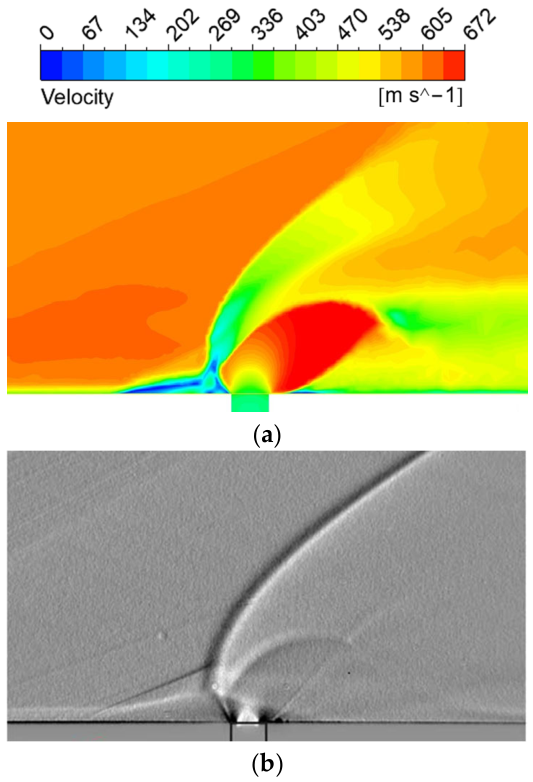
Figure 6 presents the velocity contour comparison between the present simulation and Ref. [5] experimental results. The simulation accurately captures the primary flow field structures: upstream bow shock, separation zone, and downstream low-pressure region. Both the upstream high-pressure zone extent and jet penetration height demonstrate good agreement with the reference data.
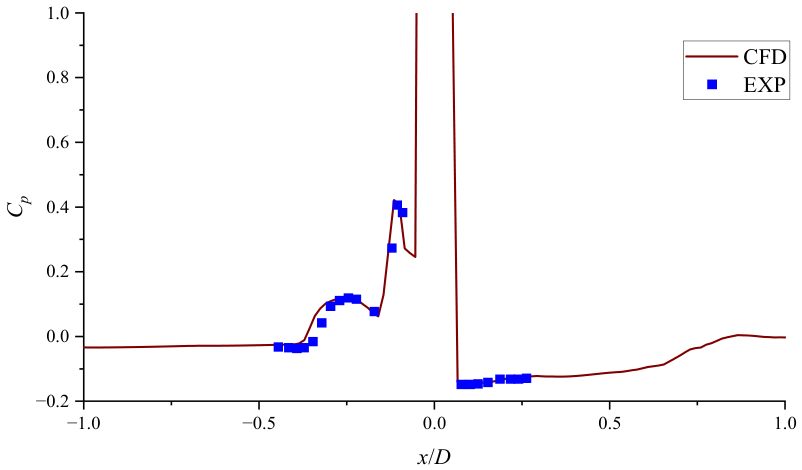
Figure 7 presents the quantitative comparison of pressure coefficient distribution along the port-side meridian; the EXP data is from Ref. [5]. The pressure coefficient is defined as Cp = (PP)/(0.5ρV2), where P is local static pressure; P, ρ, and V are freestream static pressure, density, and velocity, respectively. Good agreement with Ref. [5] results along the entire meridian is demonstrated, with accurate prediction of upstream pressure peak, plateau region pressure, and downstream pressure recovery. This validates the reliability of the numerical methodology.

2.5. Grid Independence Validation

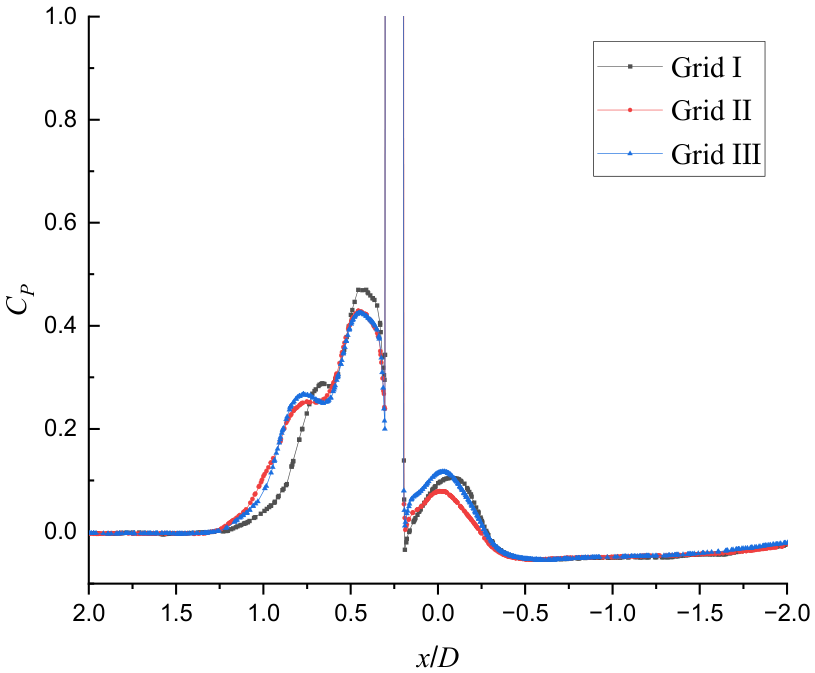
Comparative simulations are performed on the five-jet open model using three meshes (Grid I, II, III) consisting of 5,135,750, 11,723,857 and 34,434,037 cells, respectively. The freestream parameters are fixed at Ma =5, α = 0° and a far-field static pressure of 1197 Pa, and each jet is assigned a mass-flow inlet boundary with parameters given in Table 2. Aerodynamic coefficients from the three meshes are listed in Table 3, while the surface CP profiles along the jet-side symmetry line are plotted in Figure 8. To strike a reasonable trade-off between calculation precision and computational resource consumption, Grid II with 11,723,857 cells is adopted for all follow-up computations.

3. Results and Discussion

3.1. Steady-State Flowfield Structures

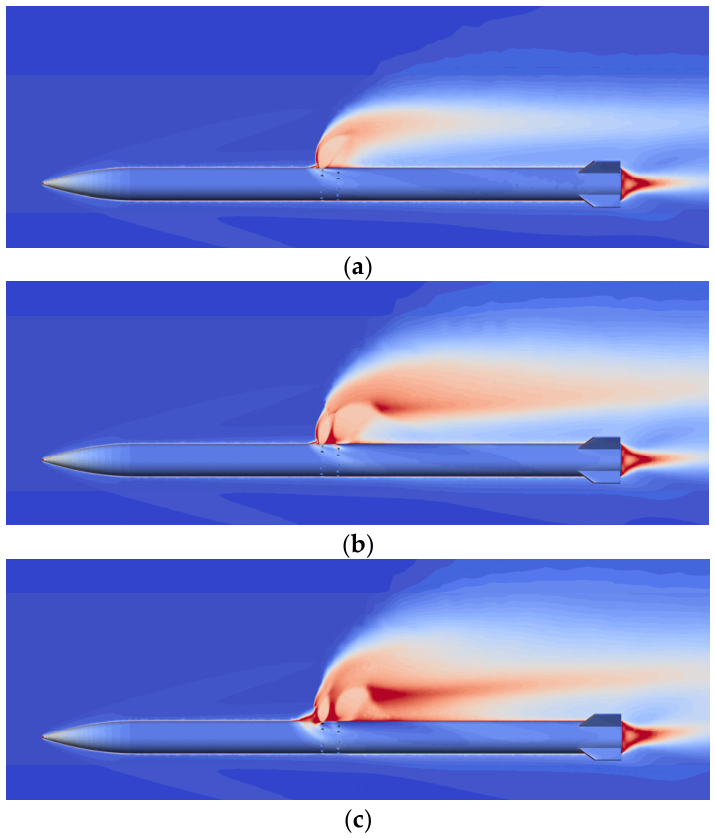
The steady-state simulation results for the three port configurations at Ma = 5 and 0° AOA (angle of attack) appear in Figure 9. The missile surface shows pressure contours; the surrounding flow field displays velocity contours.
For the single-port scheme, typical jet-crossflow interference features, including bow shock, lambda shock, barrel shock, Mach disk and wake vortices, are observed (Figure 9). Jet-crossflow interaction generates classic interference flow structures. Jet blockage ahead of the port creates a bow shock, and shock–boundary-layer interaction induces boundary layer separation and a separation shock, which together form a lambda shock structure. The underexpanded jet expands outward near the port and is compressed by crossflow to form a barrel shock ending with a Mach disk. Complex vortical structures are formed downstream due to the mixing of jet wake and freestream.
When multiple ports work simultaneously, strong inter-port flow coupling occurs. With the increase in the number of ports, shock interactions become more intensive, jet wakes fully merge, and the surface high-pressure zone expands continuously with prominent pressure superposition, eventually forming a widespread high-pressure plateau on the missile surface.
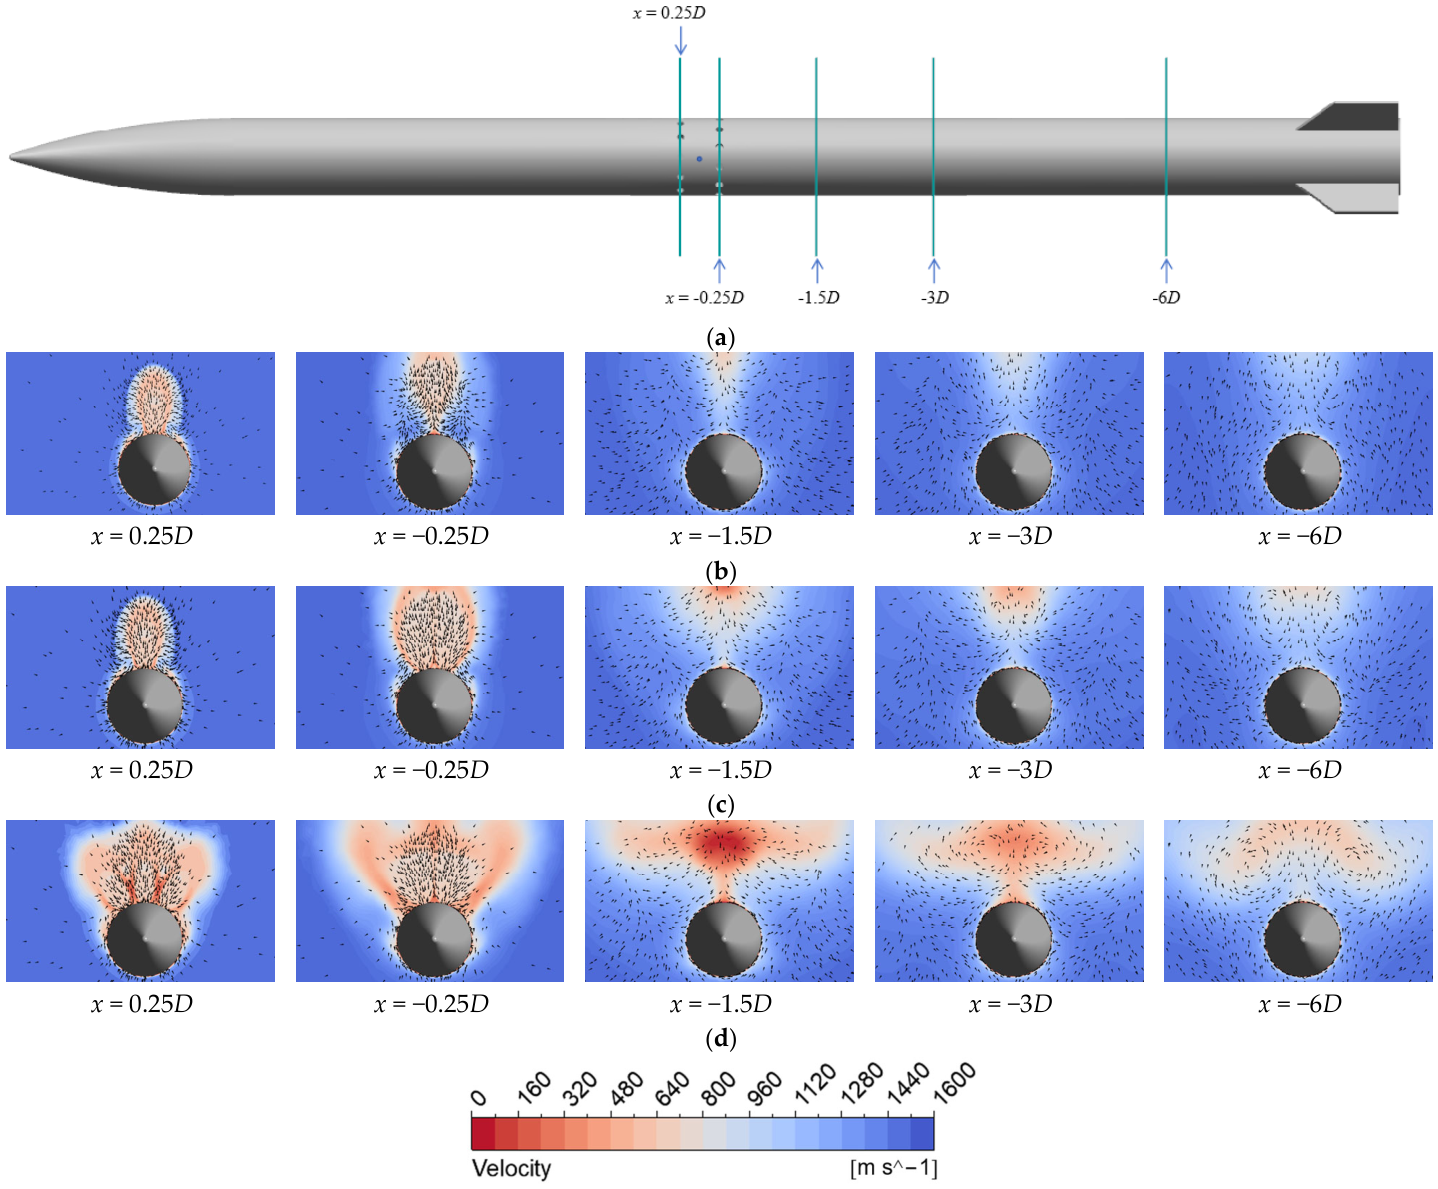
Figure 10 shows velocity contours at five typical cross-sections along the flow direction at x = 0.25D, −0.25D, −1.5D, −3D, −6D (from upstream to downstream). The contours clearly demonstrate the streamwise evolution of jet-induced three-dimensional wrap-around flow. In the vicinity of the ports (x = −0.25D, 0.25D), jet blockage generates extensive low-velocity regions around the missile body, where high-speed jet cores can be clearly identified. Owing to the superposition of disturbances from multiple jets, multi-port configurations possess a significantly wider flow disturbance area compared with the single-port layout. Pressure waves transmit the jet-induced pressure effect to a far-reaching region, and this phenomenon is further intensified with an increasing number of ports.

3.2. Unsteady Flowfield Characteristics

Unsteady numerical simulations were performed to investigate unsteady characteristics during jet initiation and termination. Ports open instantaneously at t = 0 and operate for 3.0 ms before instantaneous closure.
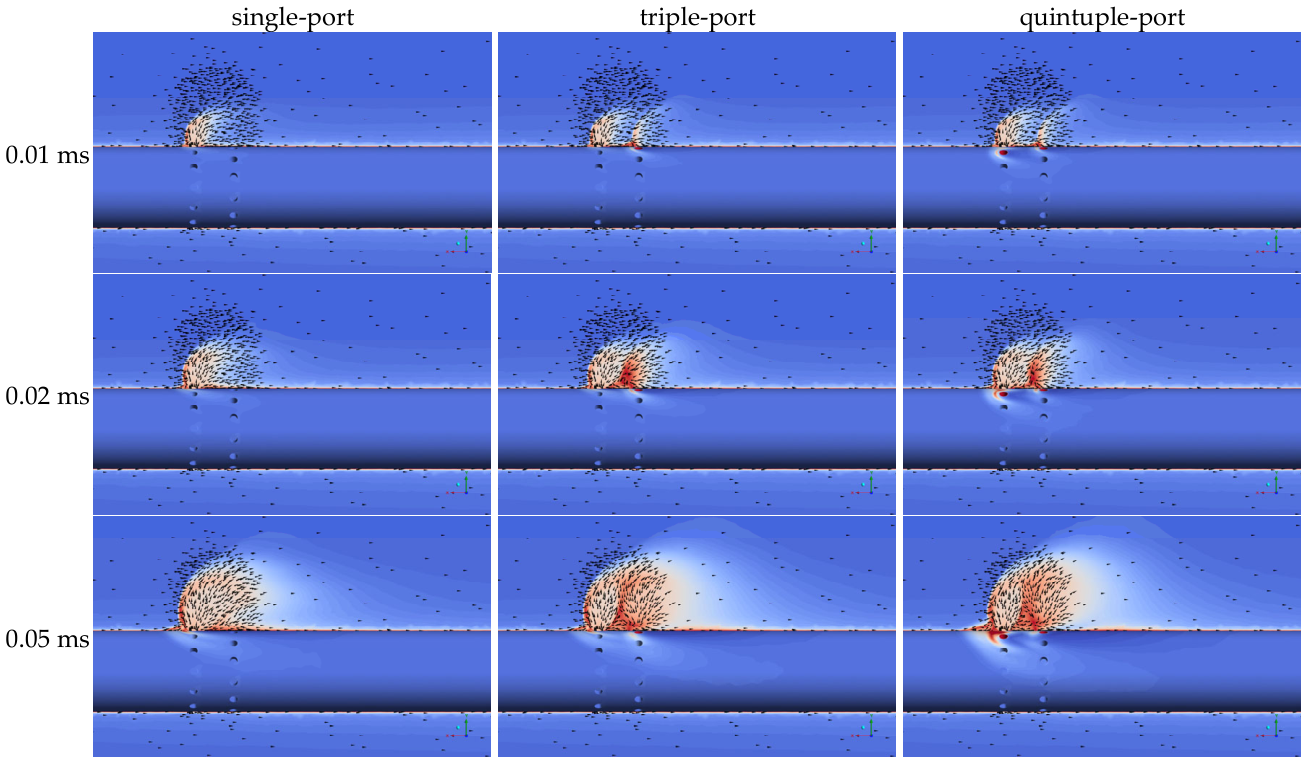
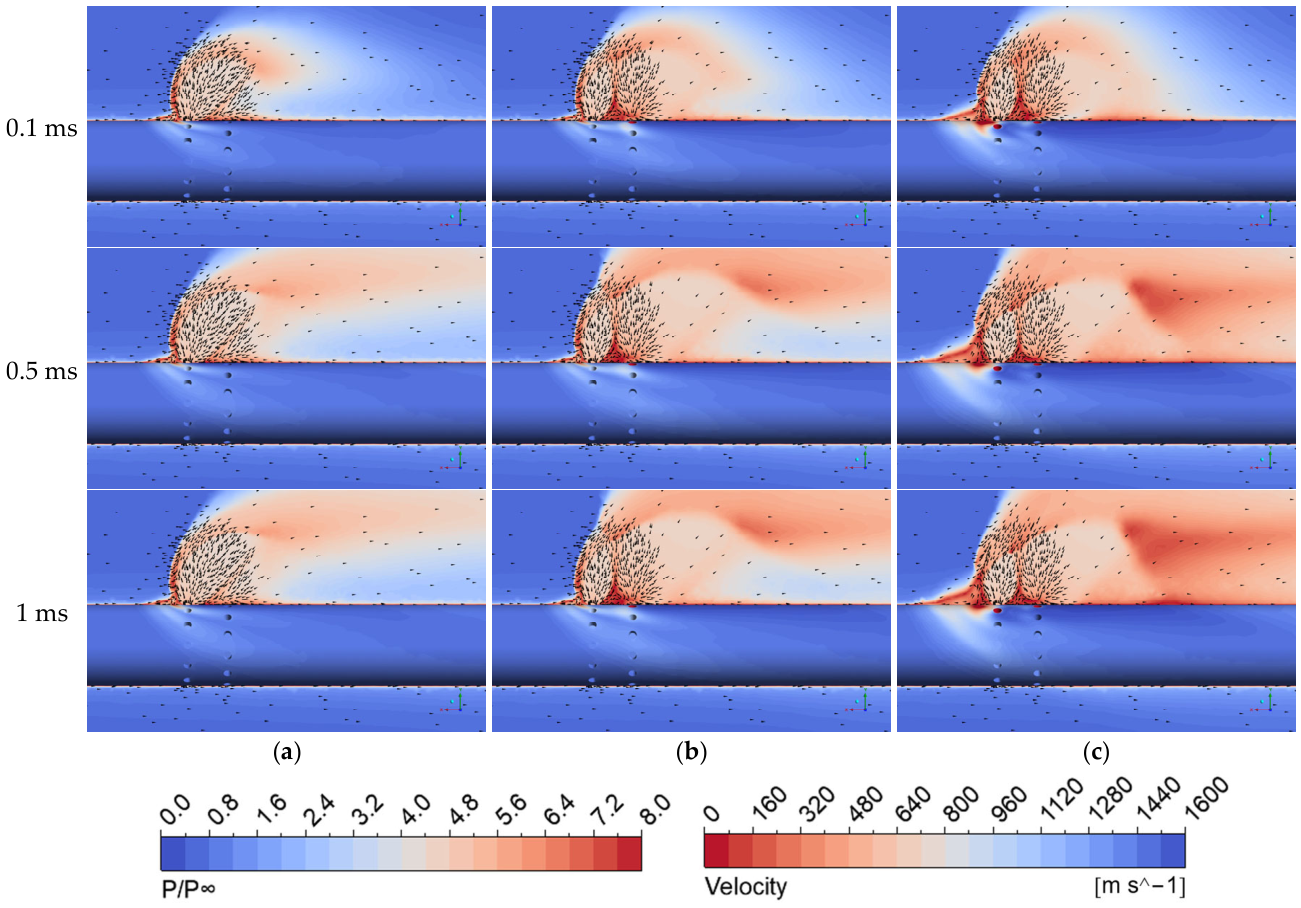
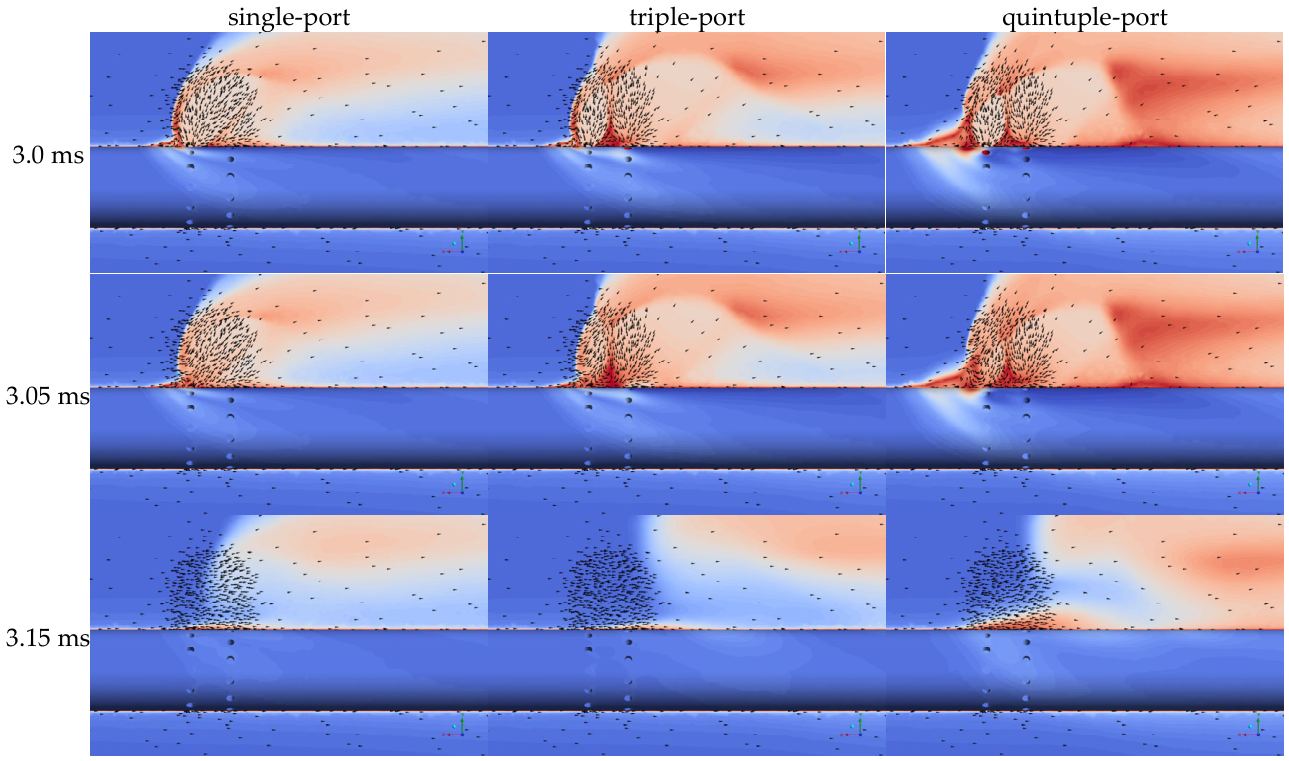
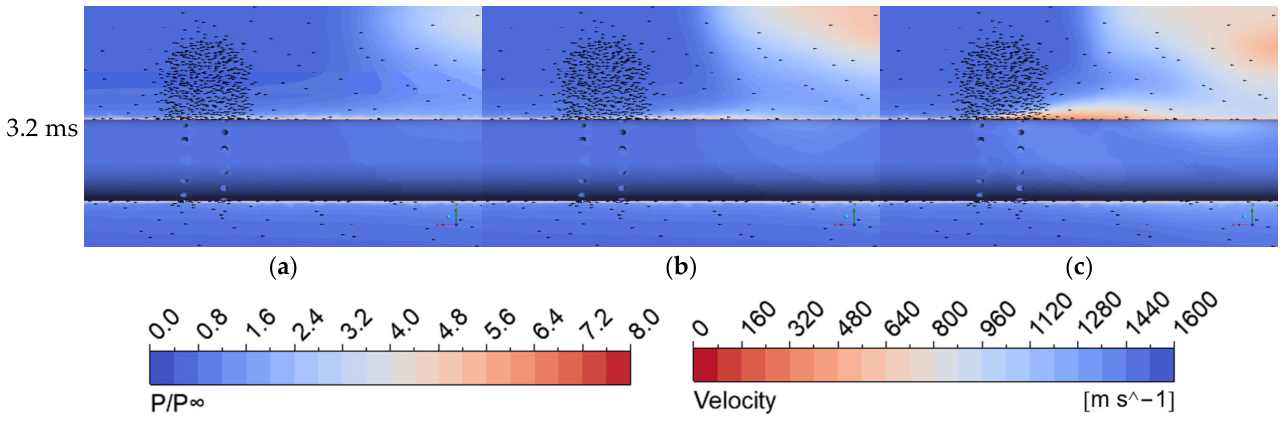
Figure 11 and Figure 12 present velocity contours at various time instants for single-, triple-, and quintuple-port configurations, illustrating the establishment and decay processes of jet interference flow fields.
Figure 11 compares the flow evolution of the single-port, triple-port and quintuple-port configurations at successive moments after jet startup. At t = 0.01 ms right after instantaneous port opening, the jet is underdeveloped. Only initial compression waves emerge near the ports, while bow shocks and separation shocks are just formed, showing strong unsteady flow characteristics. From 0.01 ms to 0.5 ms, the jets develop rapidly in all three cases. Bow shocks and separation shocks become distinct, and barrel shocks together with Mach disks start to appear. During 0.5 ms to 1.0 ms, the flowfields gradually reach a stable state, with major shock structures and vortical distributions fully established.
The comparison reveals that inter-port flow coupling becomes stronger as the number of ports increases. Due to mutual jet interference, multi-port configurations present different shock patterns and jet development characteristics from the single-port case, and the flow complexity increases accordingly.
Figure 12 demonstrates the flowfield decay of the three configurations at different moments after all ports are closed simultaneously at t = 3.0 ms. In the early shutdown stage (3.0 ms~3.05 ms), jet wakes dissipate gradually, and the intensity of bow shocks and separation shocks decreases continuously. Free from additional flow interference, the single-port flowfield decays fastest with a decay time of approximately 0.2 ms, and the flow basically returns to the jet-off state accompanied by obvious wake persistence. For the triple-port configuration, residual flows from adjacent ports interact with one another on account of small port spacing. The residual flow upstream produces a blockage effect on downstream regions, slowing down the decay process and extending the total decay time by about 0.3 ms. The quintuple-port configuration has the most intensive inter-port coupling, which leads to the slowest flow decay and the most prominent wake persistence.
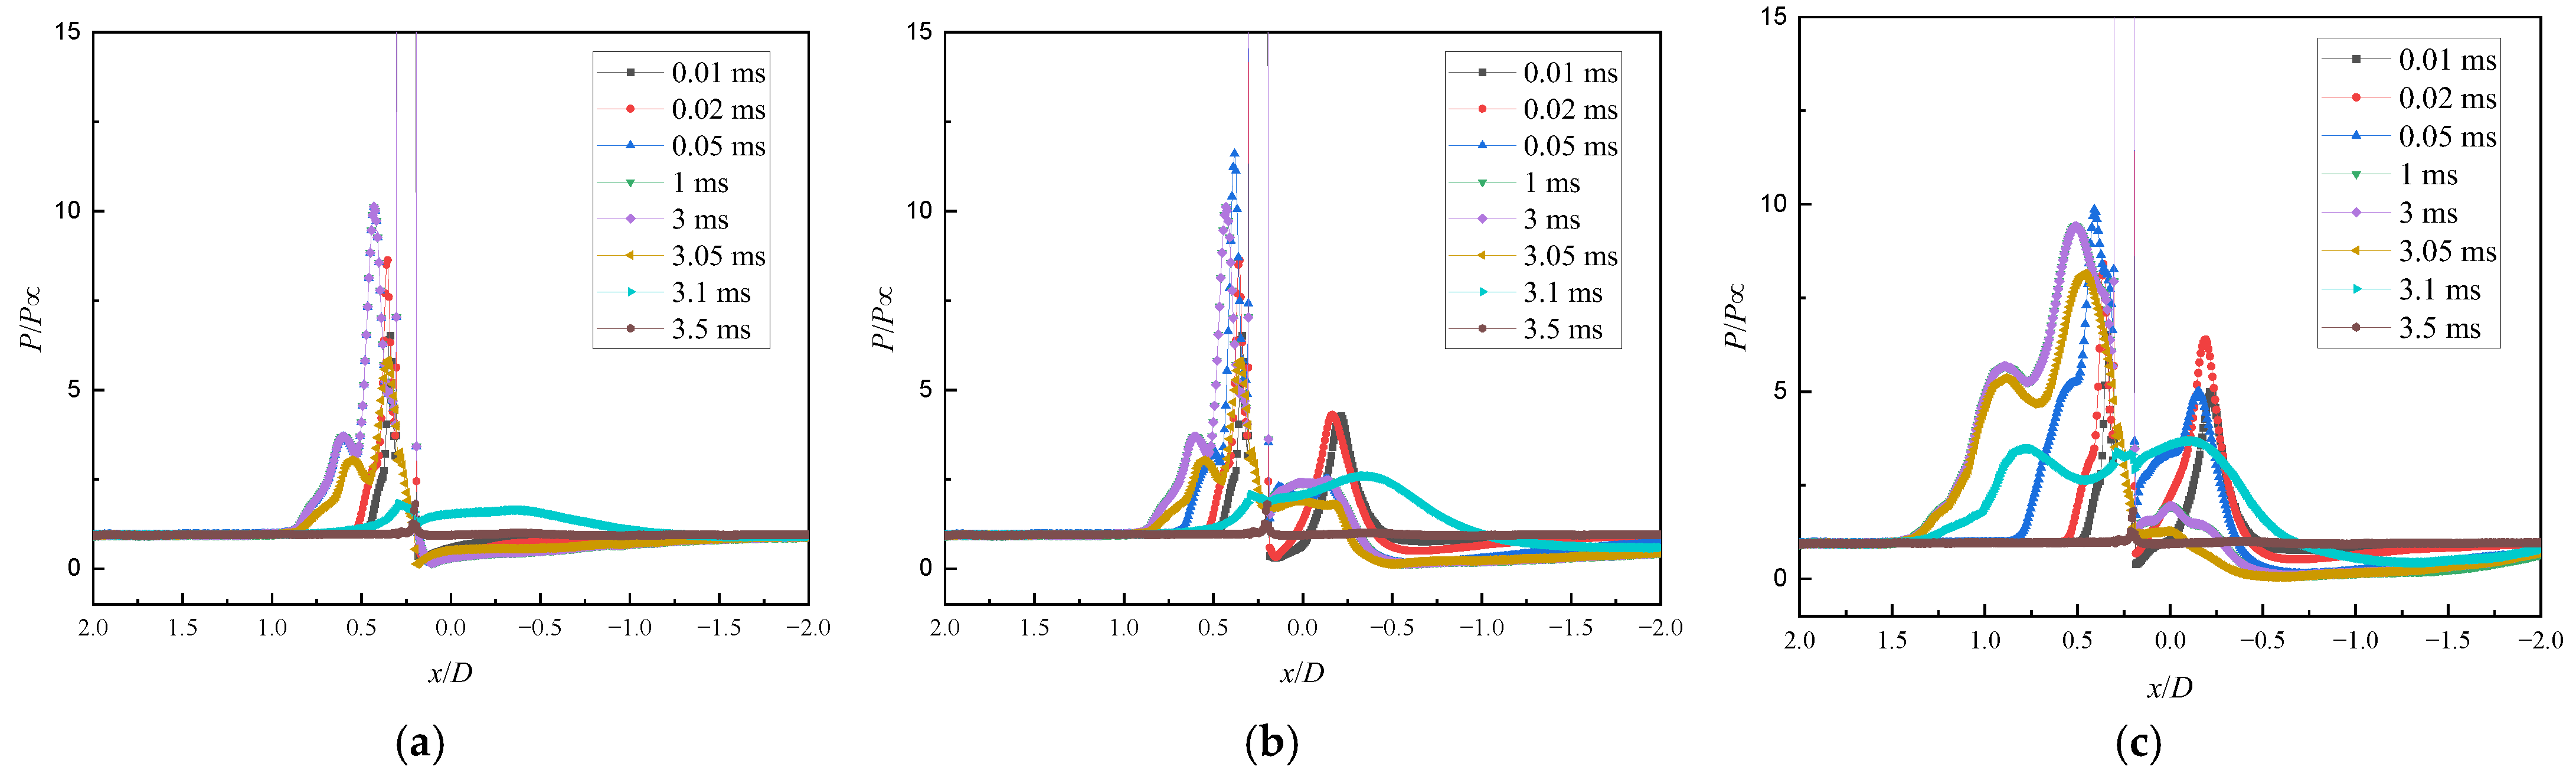
The temporal evolution of pressure coefficient along the port-side meridian for the three port configurations appears in Figure 13. During the jet establishment stage (t = 0~1 ms), pressure coefficients rise rapidly; upstream high-pressure zones form quickly. During steady operation (t = 1–3.0 ms), pressure coefficients remain essentially stable. After port closure (t = 3.0–3.5 ms), pressure coefficients gradually decrease, eventually returning to the no-jet state.
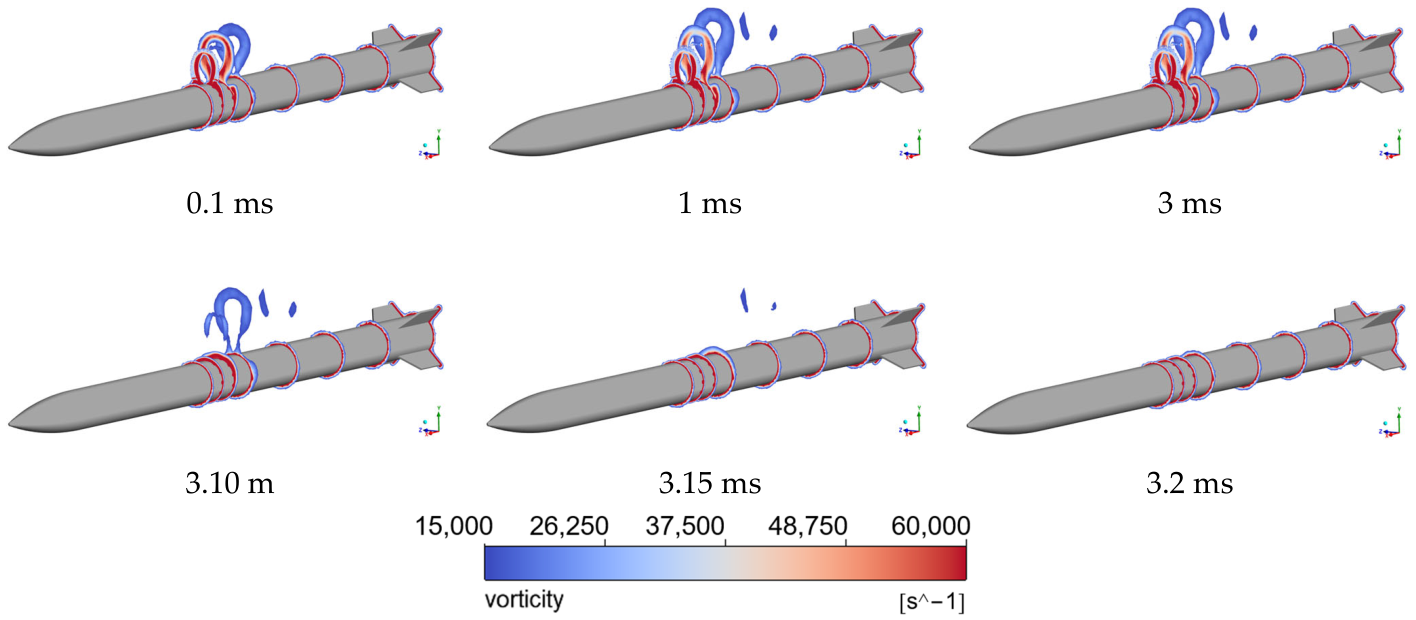
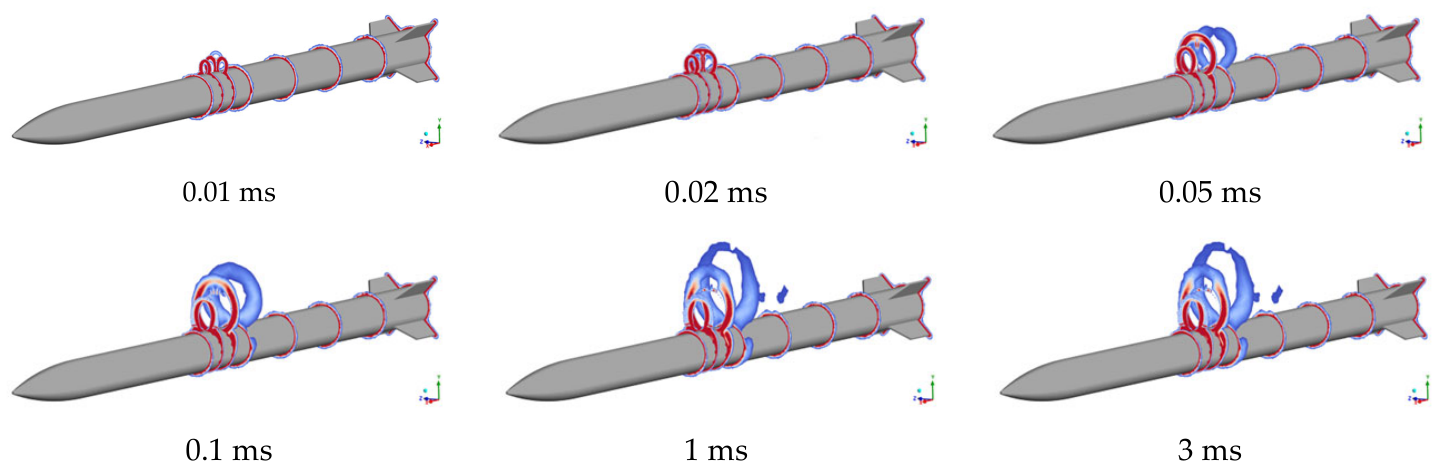
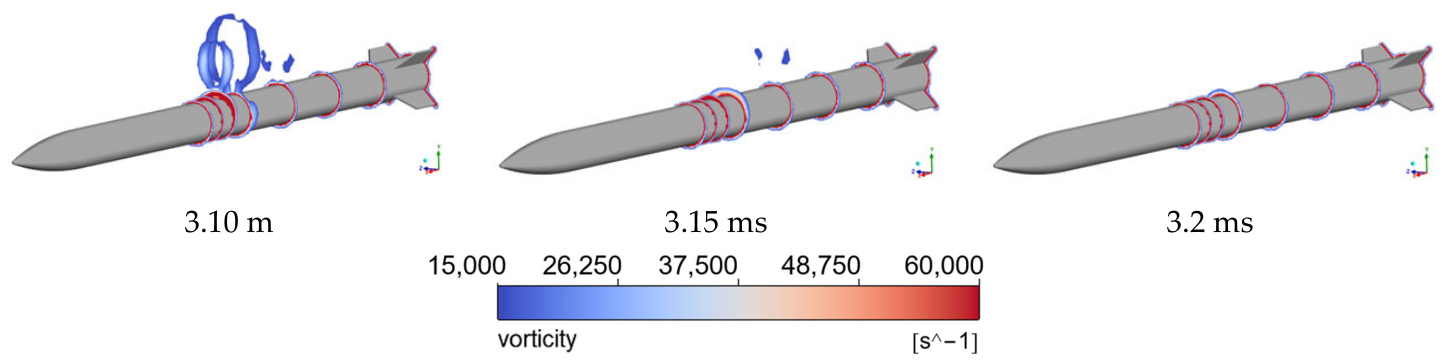
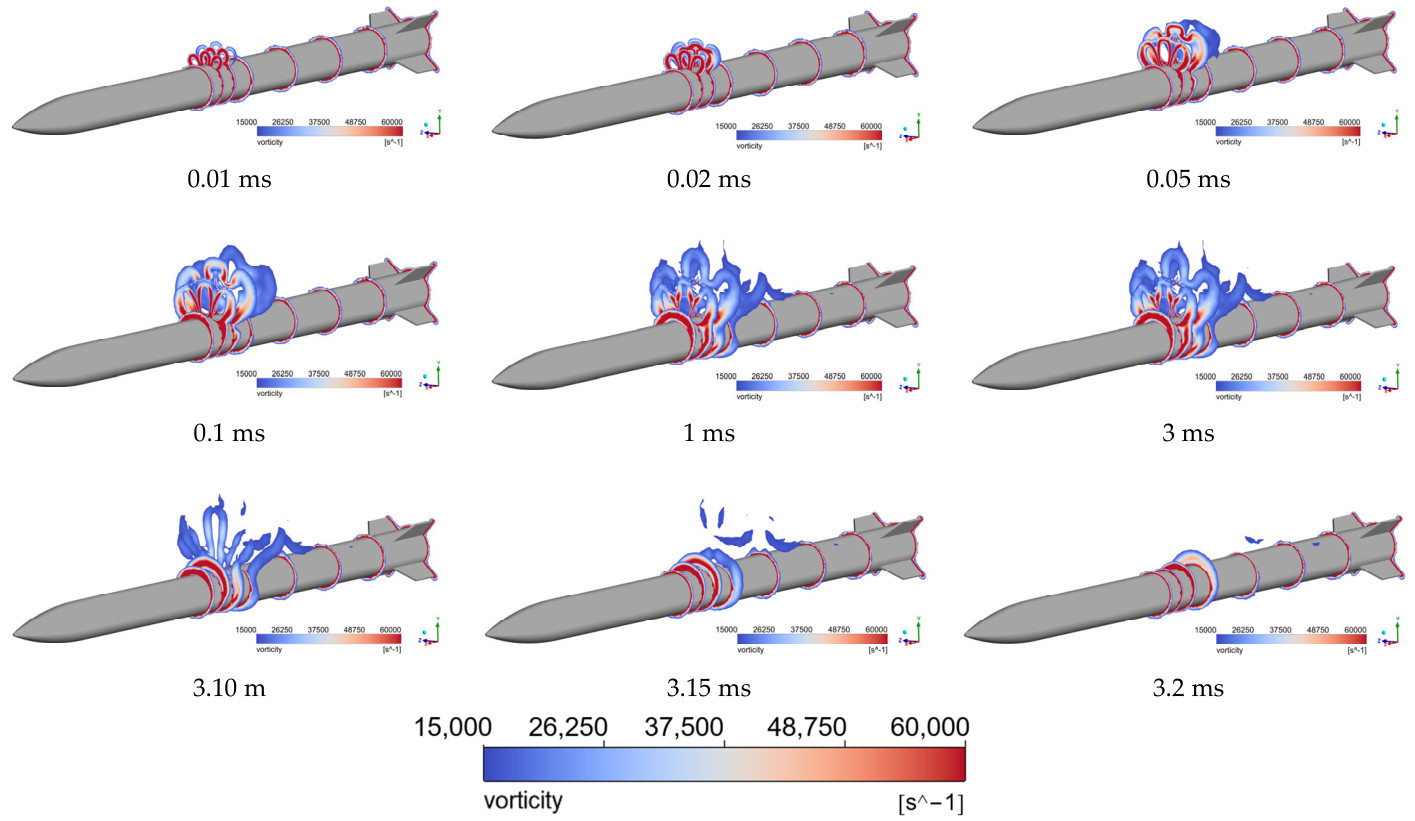
Vorticity contours at various time instants for the three port configurations appear in Figure 14, Figure 15 and Figure 16, illustrating vortical structure evolution in the jet interference flow fields. Vorticity is defined as the magnitude of velocity curl, reflecting vortical structure intensity and distribution.
For the single-port configuration (Figure 14), during early jet establishment (t = 0.01~0.1 ms), jet shear layer instability develops with initial vortex formation. The upstream boundary layer begins separating under an adverse pressure gradient; an initial horseshoe vortex appears. As the flow field develops (t = 0.1~1.0 ms), horseshoe vortex intensity increases; shear layer vortical structures become distinct; a counter-rotating vortex pair forms in the wake region. During steady state (t = 1.0~3.0 ms), the vortical system reaches equilibrium with stable horseshoe vortex and wake vortex pair structures. After jet closure (t = 3.0~3.2 ms), the vortical system begins dissipating, the horseshoe vortex intensity diminishes, and the wake–vortex pair gradually breaks down.
For the triple-port configuration (Figure 15), each port forms independent vortical systems that begin superposing and merging as the flow field develops. Vorticity intensity is significantly higher than the single-port configuration, indicating that multi-port interference enhances vortical structure intensity.
For the quintuple-port configuration (Figure 16), at t = 0.01~0.1 ms, vortical structures from five ports form a large-scale vortical zone across the entire port arrangement region. Due to the large port count, vortical structures from each port superpose and interfere, forming extremely complex vortical distributions with fully merged horseshoe vortex structures. Vorticity intensity is significantly higher than in single- and triple-port configurations. At t = 1.0~3.0 ms, the vortical system reaches a steady state; fully merged vortical systems from five ports form a large-scale high-vorticity band extending along the missile body. The vorticity distribution exhibits pronounced non-uniform characteristics: higher intensity in upstream regions gradually decreases downstream. At t = 3.0–3.2 ms after jet closure, the vortical system begins dissipating, with a relatively slow dissipation process and pronounced vorticity persistence phenomena.

3.3. Aerodynamic Characteristics Analysis

Variations in the normal force coefficient and pitching moment coefficient are analyzed to quantitatively assess jet interaction effects on missile aerodynamic characteristics. Amplification coefficients are defined to characterize jet control efficiency.
The normal force coefficient is defined as
Cy = Fy/(0.5ρV2S)
The pitching moment coefficient is defined as
Cmz = Mz/(0.5ρV2SL)
Fy is normal force; Mz is pitching moment; S is reference area (missile cross-sectional area); and L is reference length (vehicle length).
Amplification coefficients are defined as the ratio of additional aerodynamic force (or moment) generated by jet interaction to jet vacuum thrust, characterizing jet control efficiency. Normal force and pitching moment amplification coefficients are
Ky = 1+ (FyJ≠0FyJ=0)/FT
Kmz = 1 + (MzJ≠0MzJ=0)/(FT·xJ)
FyJ ≠ 0 and MzJ ≠ 0 ≠ 0 are normal force and pitching moment with a jet; FyJ = 0 and MzJ = 0 are normal force and pitching moment without a jet; FT is jet thrust; and xJ is port distance from center of mass (coordinate origin in this investigation). Jet thrust FT is calculated as
FT = (ρJVJ2 + PSJP)SJ
ρJ is gas density; VJ is velocity; and PSJ is static pressure.
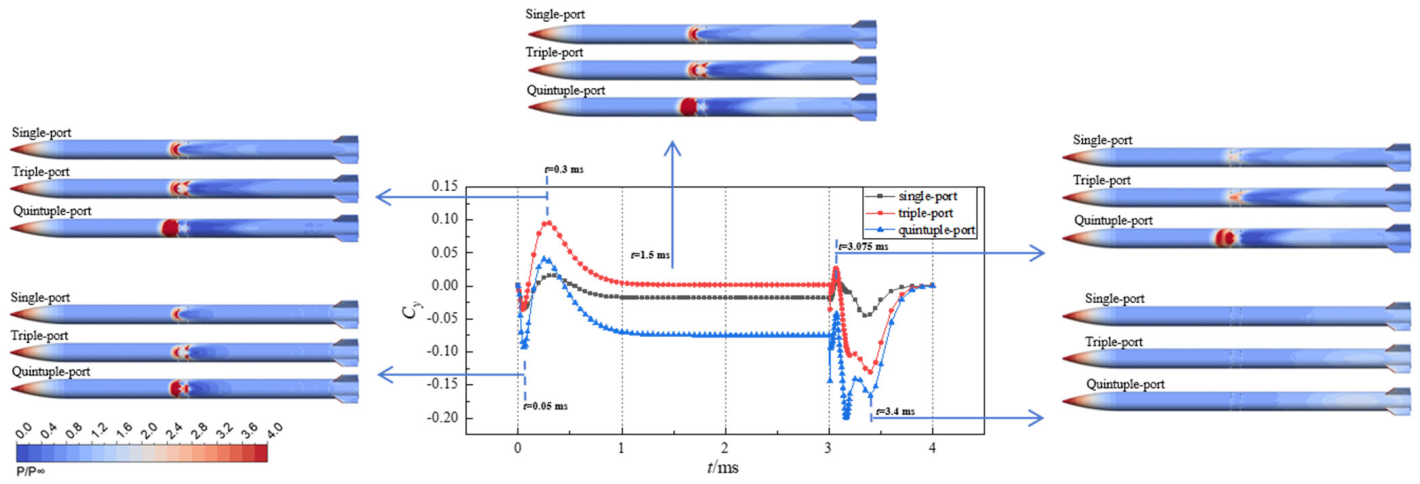
Figure 17 shows the time history of the normal force coefficient for three port layouts. In the time range of t = 0 ms~1 ms, the normal force coefficient decreases first, then rises, and finally gradually levels off. After the ports are fully closed at t = 3 ms, the coefficient fluctuates slightly before reaching a steady state. Negative normal force coefficients are observed for single-port and quintuple-port models, following the jet thrust direction and leading to positive interference amplification for control effectiveness. The triple-port configuration produces a positive normal force coefficient against the jet thrust, which causes negative amplification and deteriorates the control effect. This distinctive phenomenon can be explained by the layout of multiple ports. In the triple-port scheme, ports B and C are arranged downstream of port A. Such a layout greatly enlarges the low-pressure zone behind the jet ports and reduces the pressure on the model upper surface, forming a positive pressure difference between the upper and lower surfaces. As a result, a positive normal force coefficient is generated. In the quintuple-port configuration, extensive high-pressure areas appear upstream of ports A, D and E, which leads to a negative upper–lower pressure difference and thus a negative normal force coefficient.
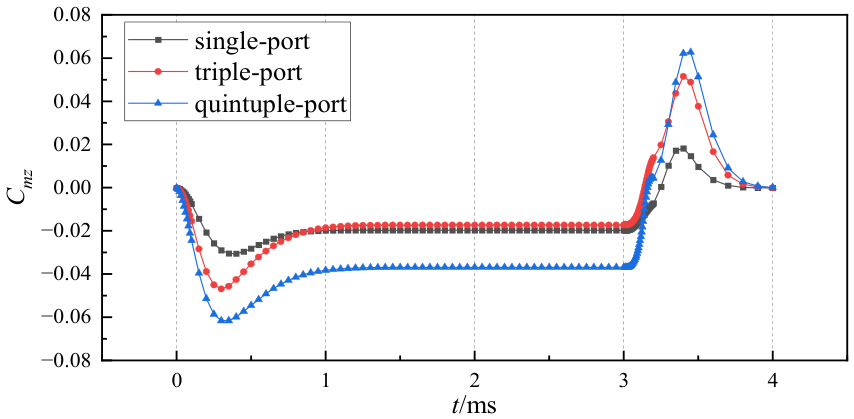
The temporal evolution of pitching moment coefficient for the three port configurations appears in Figure 18. All three configurations exhibit similar trends: initial decrease, subsequent increase, then stabilization; after port closure, initial increase, first peak, then decrease to stabilization.
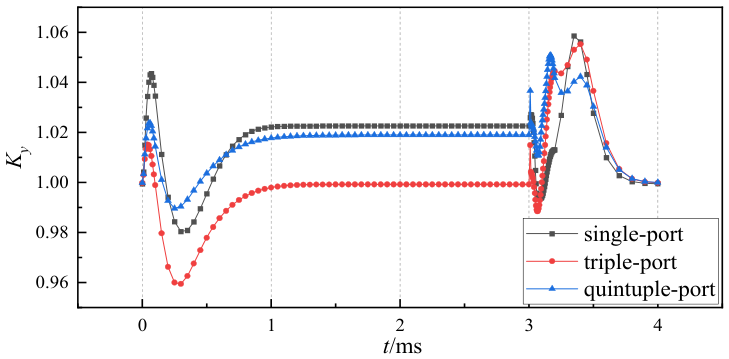
The temporal evolution of normal force amplification coefficient for the three port configurations appears in Figure 19. During steady operation, the single-port configuration exhibits a normal force amplification coefficient of approximately 1.022, indicating slight amplification from jet interaction; the triple-port configuration exhibits a coefficient of approximately 0.999, indicating a minimal jet interaction effect on jet thrust; the quintuple-port configuration exhibits a coefficient of approximately 1.019, producing slight amplification. Interference aerodynamic forces represent a minimal proportion; inter-port interference coupling effects have limited impact on overall jet control force.
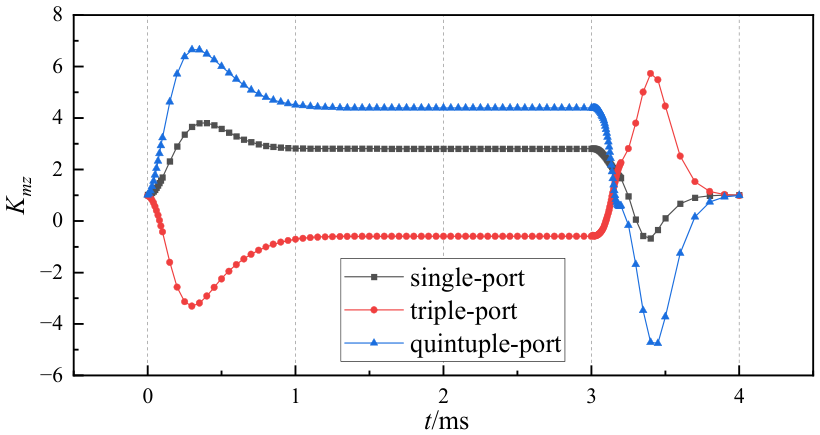
The temporal evolution of pitching moment amplification coefficient for the three port configurations appears in Figure 20. During steady operation, the single-port configuration exhibits a pitching moment amplification coefficient of approximately 2.811, with an interference moment approximately 1.8 times the moment generated by the jet itself; the triple-port configuration exhibits a coefficient of approximately −0.59, with an interference moment opposite to the jet moment direction, producing negative amplification; and the quintuple-port configuration exhibits a coefficient of approximately 4.387, with an interference moment approximately 3.387 times the moment generated by the jet itself. Substantial variation in pitching moment amplification coefficients demonstrates that multi-port interference affects the control moment much more significantly than the normal force—a key consideration for RCS design.
Comprehensive analysis indicates that multi-port configurations can provide larger total control forces. However, inter-port interference coupling effects create more complex interference flow fields around the vehicle. The quintuple-port pitching moment amplification coefficient of 4.387 means the actual control moment produced is 4.4 times the moment generated by the jet itself. The negative amplification phenomenon in the triple-port configuration also indicates that port count and layout selection require careful consideration; improper configuration can lead to severe control efficiency degradation.

4. Conclusions

Numerical simulations of multi-port lateral jet interaction on a hypersonic vehicle are presented in this investigation. Flow field structure characteristics and aerodynamic property variations under steady and unsteady conditions for single-, triple-, and quintuple-port configurations are analyzed. The primary conclusions are as follows:
(1)
In multi-port configurations, bow shocks and separation zones generated by upstream ports impose substantial shielding effects on downstream ports. Inter-port interference coupling intensity increases nonlinearly with port count. Transient flow field development completes within approximately 0.5 ms, whereas the decay phase extends over 0.5~1.0 ms and exhibits pronounced temporal hysteresis.
(2)
Vortical structure generation, evolution, and dissipation govern dynamic aerodynamic response characteristics. In multi-port configurations, horseshoe vortices and shear layer vortices from individual ports superpose and merge, forming large-scale high-vorticity regions with significantly higher vorticity intensity than single-port configurations. Pronounced vorticity persistence phenomena exist after jet closure.
(3)
Aerodynamic interference effects on pitching moment are particularly significant. The quintuple-port pitching moment amplification coefficient of 4.387 demonstrates substantial moment amplification potential of multi-port interference effects—an important consideration for RCS pulse control strategy design.
These findings provide theoretical foundations for RCS port layout optimization and control strategy formulation in hypersonic flight vehicles. Future investigations may further consider real gas effects, jet medium properties, pulsed jet control, and port layout optimization design effects on multi-port interference characteristics.

Author Contributions

Conceptualization, Z.S. and P.C.; methodology, Z.S.; software, Z.S.; validation, Z.S., P.C. and G.C.; formal analysis, Z.S.; investigation, Z.S.; resources, P.C. and G.C.; data curation, Z.S.; writing—original draft preparation, Z.S.; writing—review and editing, Z.S., P.C. and G.C.; visualization, Z.S.; supervision, P.C. and G.C.; project administration, G.C.; funding acquisition, G.C. All authors have read and agreed to the published version of the manuscript.

Funding

This research received no external funding.

Data Availability Statement

The data supporting the results of this study are available from the corresponding author upon reasonable request.

Acknowledgments

The authors thank the Shanghai Aerospace Control Technology Institute for providing the computational resources and technical support for this work. We also express our gratitude to the anonymous reviewers for their constructive comments.

Conflicts of Interest

The authors declare no conflicts of interest.

Abbreviations

The following abbreviations are used in this manuscript:
CFDComputational Fluid Dynamics
RCSReaction Control System
RANSReynolds-Averaged Navier–Stokes
SSTShear Stress Transport

References

  1. Brandeis, J.; Gill, J. Experimental Investigation of Super- and Hypersonic Jet Interaction on Missile Configurations. J. Spacecr. Rocket. 2012, 35, 296–302. [Google Scholar] [CrossRef]
  2. Srivastava, B. Computational Analysis and Validation for Lateral Jet Controlled Missiles. J. Spacecr. Rocket. 1997, 34, 584–592. [Google Scholar] [CrossRef] [PubMed]
  3. Chamberlain, R.; McClure, D.; Dang, A. CFD Analysis of Lateral Jet Interaction Phenomena for the THAAD Interceptor. In Proceedings of the AIAA Aerospace Sciences Meeting, Reno, NV, USA, 10–13 January 2000. [Google Scholar] [CrossRef]
  4. Graham, M.J.; Weinacht, P. Numerical Investigation of Supersonic Jet Interaction for Axisymmetric Bodies. J. Spacecr. Rocket. 2000, 37, 675–683. [Google Scholar] [CrossRef] [PubMed]
  5. Gnemmi, P.; Schäfer, H.J. Experimental and Numerical Investigations of a Transverse Jet Interaction on a Missile Body. In Proceedings of the AIAA Aerospace Sciences Meeting, Reno, NV, USA, 10–13 January 2005. [Google Scholar] [CrossRef]
  6. Stahl, B.; Emunds, H.; Gülhan, A. Experimental Investigation of Hot and Cold Side Jet Interaction with a Supersonic Cross-Flow. Aerosp. Sci. Technol. 2009, 13, 488–496. [Google Scholar] [CrossRef]
  7. Zhao, J.L.; Zhou, J.; Yao, Y.H. Review on the Anti-saturation Control of Hypersonic Flight vehicles. Flight Control Detect 2022, 5, 102. (In Chinese) [Google Scholar] [CrossRef]
  8. Xu, Y.H.; Zhang, X.; Liu, B.Y.; Gong, B.C. Attitude control of hypersonic vehicles based on hybrid reinforcement learning. Flight Control Detect 2025. online first (In Chinese) [Google Scholar]
  9. Robinson, M. Application of CFD to BMDO JI Risk Mitigation—External Burning. In Proceedings of the AIAA Aerospace Sciences Meeting, Reno, NV, USA, 11–14 January 1999. [Google Scholar] [CrossRef]
  10. Erdem, E.; Kontis, K. Numerical and Experimental Investigation of Transverse Injection Flows. Shock Waves 2010, 20, 103–118. [Google Scholar] [CrossRef]
  11. Tang, W.; Zhang, Y.; Li, W.; Zhang, L. Investigation on Engineering Estimation Model of Lateral Jet Interaction. Exp. Meas. Fluid Mech. 2003, 17, 88–92. (In Chinese) [Google Scholar]
  12. Viti, V.; Wallis, S.; Schetz, J.A.; Neel, R.; Bowersox, R.D.W. Jet Interaction with a Primary Jet and an Array of Smaller Jets. AIAA J. 2004, 42, 1358–1368. [Google Scholar] [CrossRef]
  13. Finseth, J.; Hopkins, D.; Harvey, D. Multiple Jet Effects in Jet Interaction—Flow Field Phenomena and Evaluation Methodology. In Proceedings of the AIAA Aerospace Sciences Meeting, Reno, NV, USA, 8–11 January 1988. [Google Scholar] [CrossRef]
  14. Chen, J.; Zhang, Y.; Jiang, D.; Mao, M. Numerical Simulation of Complex Flow in Lateral Multi-Port Interaction. Chin. J. Theor. Appl. Mech. 2008, 40, 769–777. (In Chinese) [Google Scholar] [CrossRef]
  15. Liu, Y.; Bo, J. Numerical Simulation of Establishment and Decay Processes of Lateral Jet Interaction Flowfield. J. Astronaut. 2015, 36, 877–884. (In Chinese) [Google Scholar] [CrossRef]
  16. Lai, J.; Zhao, Z.; Wang, X.; Li, H.; Li, Q. Numerical Investigation of Pitch Motion Induced Unsteady Effects on Transverse Jet Interaction. Aerosp. Sci. Technol. 2020, 105, 106005. [Google Scholar] [CrossRef]
  17. Yang, Y.; Liu, J. Investigation on Unsteady Characteristics of Transverse Jet Interaction in Hypersonic Mainstream. Acta Aerodyn. Sin. 2004, 22, 326–333. (In Chinese) [Google Scholar] [CrossRef]
  18. Huh, J.; Lee, S. Numerical Study on Lateral Jet Interaction in Supersonic Crossflows. Aerosp. Sci. Technol. 2018, 80, 315–328. [Google Scholar] [CrossRef]
  19. Ma, M.; Deng, Y.; Zheng, M.; Wu, X. Numerical Simulation of Supersonic Lateral Multi-Jet Interference Characteristics. Acta Aerodyn. Sin. 2007, 25, 468–473. Available online: https://kqdlxxb.xml-journal.net/article/id/9992 (accessed on 20 April 2026). (In Chinese)
  20. Chen, T.; Huang, H.; Chen, Y.; Wang, C. Effects and mechanisms of multiple lateral jets on aerodynamic characteristics of a hypersonic vehicle. Phys. Scr. 2025, 100, 125228. [Google Scholar] [CrossRef]
  21. Menter, F.R. Two-Equation Eddy-Viscosity Turbulence Models for Engineering Applications. AIAA J. 1994, 32, 1598–1605. [Google Scholar] [CrossRef] [PubMed]
  22. Spalart, P.R.; Deck, S.; Shur, M.L.; Squires, K.D.; Strelets, M.K.; Travin, A. A New Version of Detached-Eddy Simulation, Resistant to Ambiguous Grid Densities. Theor. Comput. Fluid Dyn. 2006, 20, 181–195. [Google Scholar] [CrossRef]
Figure 1. Simulation physical model.
Aerospace 13 00608 g001
Figure 2. Computational domain and mesh. (a) Computational domain; (b) whole mesh around the vehicle; (c) mesh around the vehicle nose; (d) mesh around the tail; (e) mesh around the ports; (f) Mesh on the cross-section of the port.
Aerospace 13 00608 g002aAerospace 13 00608 g002b
Figure 3. Jet initiation and termination temporal history.
Aerospace 13 00608 g003
Figure 4. Validation case geometry (from Ref. [5]).
Aerospace 13 00608 g004
Figure 5. The mesh for the validation case.
Aerospace 13 00608 g005
Figure 6. Comparison of flow field between (a) CFD (current) and (b) EXP [5].
Aerospace 13 00608 g006
Figure 7. Comparison of pressure coefficient distribution along the port-side meridian.
Aerospace 13 00608 g007
Figure 8. Cp comparison with different grid density along the port-side meridian.
Aerospace 13 00608 g008
Figure 9. Steady-state pressure and velocity contours for multi-port configurations at freestream Mach number Ma = 5 and angle of attack AOA = 0°. (a) Single port; (b) triple port; (c) quintuple port.
Aerospace 13 00608 g009aAerospace 13 00608 g009b
Figure 10. Velocity contours at x = −0.25D, 0.25D, 1.5D, 3D, and 6D cross-sections. Black triangles represent velocity vectors. (a) Cut view location; (b) single port; (c) triple port; (d) quintuple port.
Aerospace 13 00608 g010
Figure 11. Unsteady velocity contours at different times during jet activation (t = 0.01~1 ms). Black triangles represent velocity vectors. (a) Single port; (b) triple port; (c) quintuple port.
Aerospace 13 00608 g011aAerospace 13 00608 g011b
Figure 12. Unsteady velocity contours at different times during jet shutdown (t = 3.0~3.2 ms). Black triangles represent velocity vectors. (a) Single port; (b) triple port; (c) quintuple port.
Aerospace 13 00608 g012aAerospace 13 00608 g012b
Figure 13. Temporal evolution of port-side meridian pressure coefficient for three port configurations. (a) single port; (b) triple port; (c) quintuple port.
Aerospace 13 00608 g013
Figure 14. Unsteady vorticity contours for single-port lateral jet.
Aerospace 13 00608 g014aAerospace 13 00608 g014b
Figure 15. Unsteady vorticity contours for a triple-port lateral jet.
Aerospace 13 00608 g015aAerospace 13 00608 g015b
Figure 16. Unsteady vorticity contours for quintuple-port lateral jet.
Aerospace 13 00608 g016
Figure 17. Temporal evolution of normal force coefficient Cy for three port configurations.
Aerospace 13 00608 g017
Figure 18. Temporal evolution of pitching moment coefficient Cmz for three port configurations.
Aerospace 13 00608 g018
Figure 19. Temporal evolution of normal force amplification coefficient Ky for three port configurations.
Aerospace 13 00608 g019
Figure 20. Temporal evolution of pitching moment amplification coefficient Kmz for three port configurations.
Aerospace 13 00608 g020
Table 1. Simulation parameters.
ParametersValue
Farfield Mach number Ma5
Farfield Static pressure P/Pa1197
Farfield Static temperature T/K226.5
Mach number of jet MaJ2.33
Total pressure of jet P0J/MPa2.402
Static pressure of jet PJ/kPa119.7
Static temperature of jet TJ/K292.15
Mass Flow Rate of jet kg/s0.033
Angle of attack α/(°)0
Pressure ratio P0J/P2006.68
Table 2. Computational conditions of validation.
ParametersValue
Farfield Mach number Ma3
Farfield Static pressure P/Pa19490
Farfield Static temperature T/K103.2
Mach number of jet MaJ1
Static temperature of jet TJ/K223
Angle of attack α/(°)0
Pressure ratio P0J/P50
Table 3. Comparison of results of three kinds of cells.
ParametersNumber of CellsCYCmz
Grid I5,135,758−0.07056−0.03873
Grid II11,723,857−0.07825−0.03309
Grid III34,434,037−0.07919−0.03211
Disclaimer/Publisher’s Note: The statements, opinions and data contained in all publications are solely those of the individual author(s) and contributor(s) and not of MDPI and/or the editor(s). MDPI and/or the editor(s) disclaim responsibility for any injury to people or property resulting from any ideas, methods, instructions or products referred to in the content.