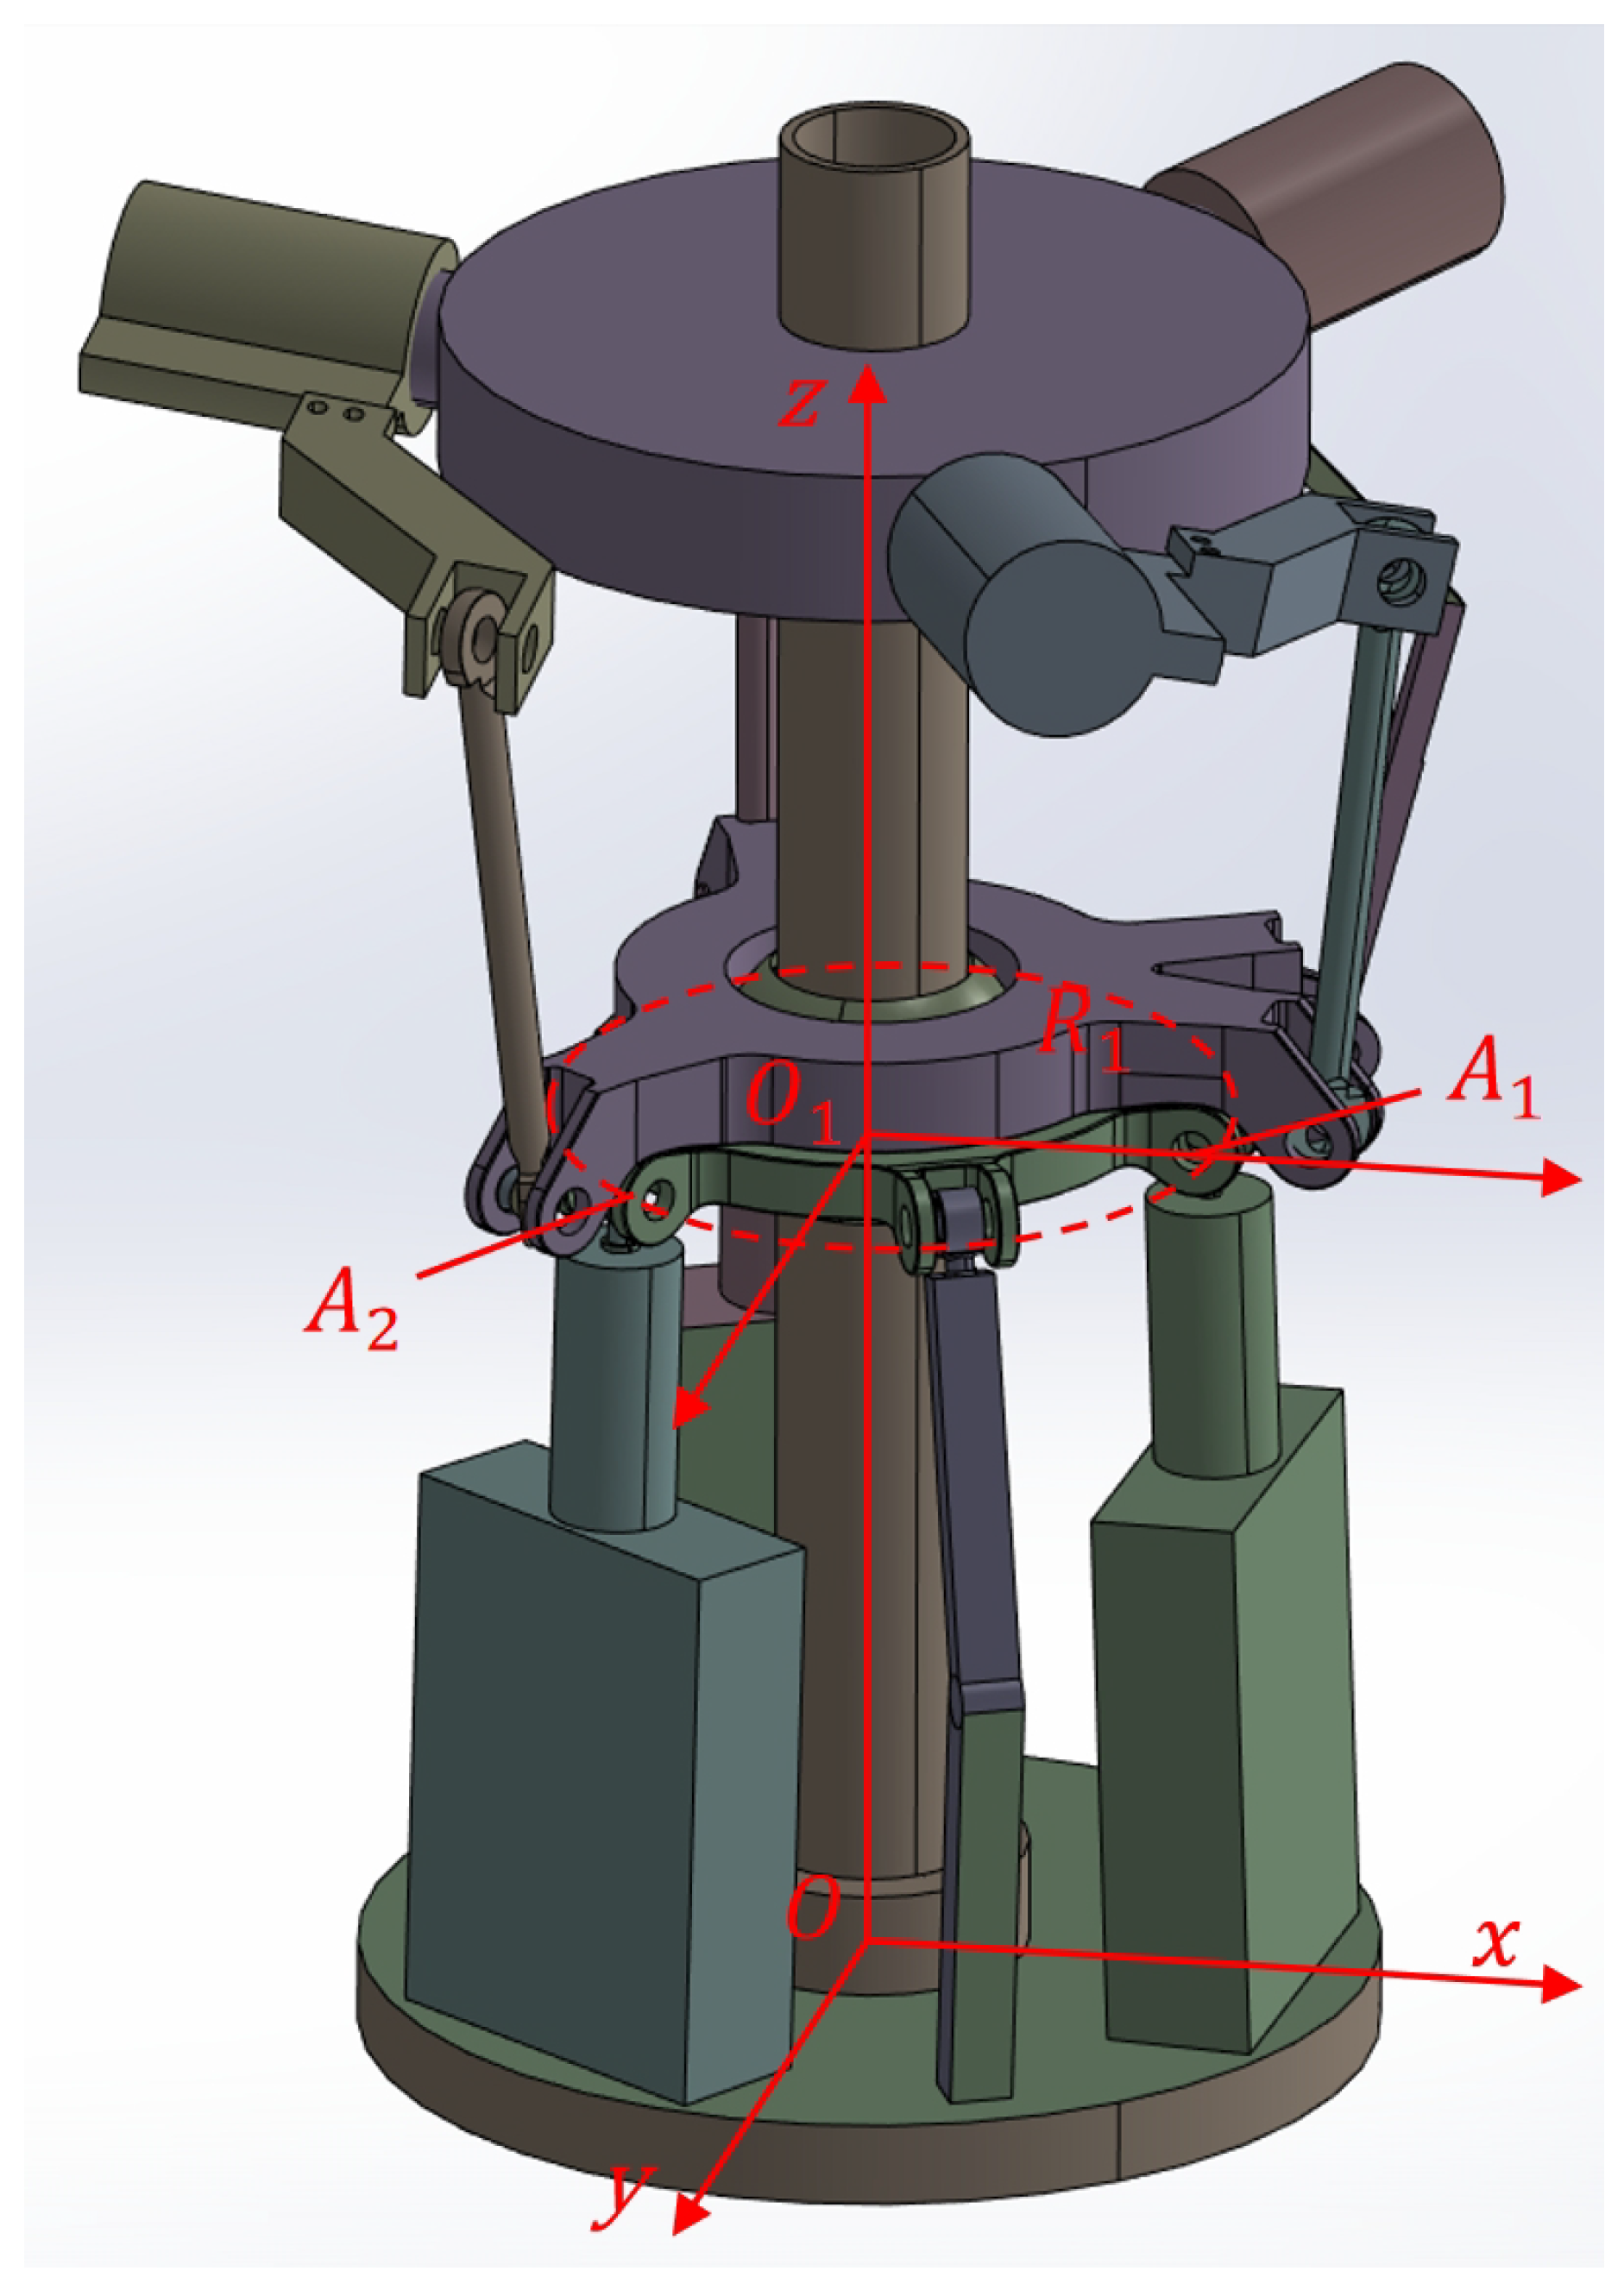
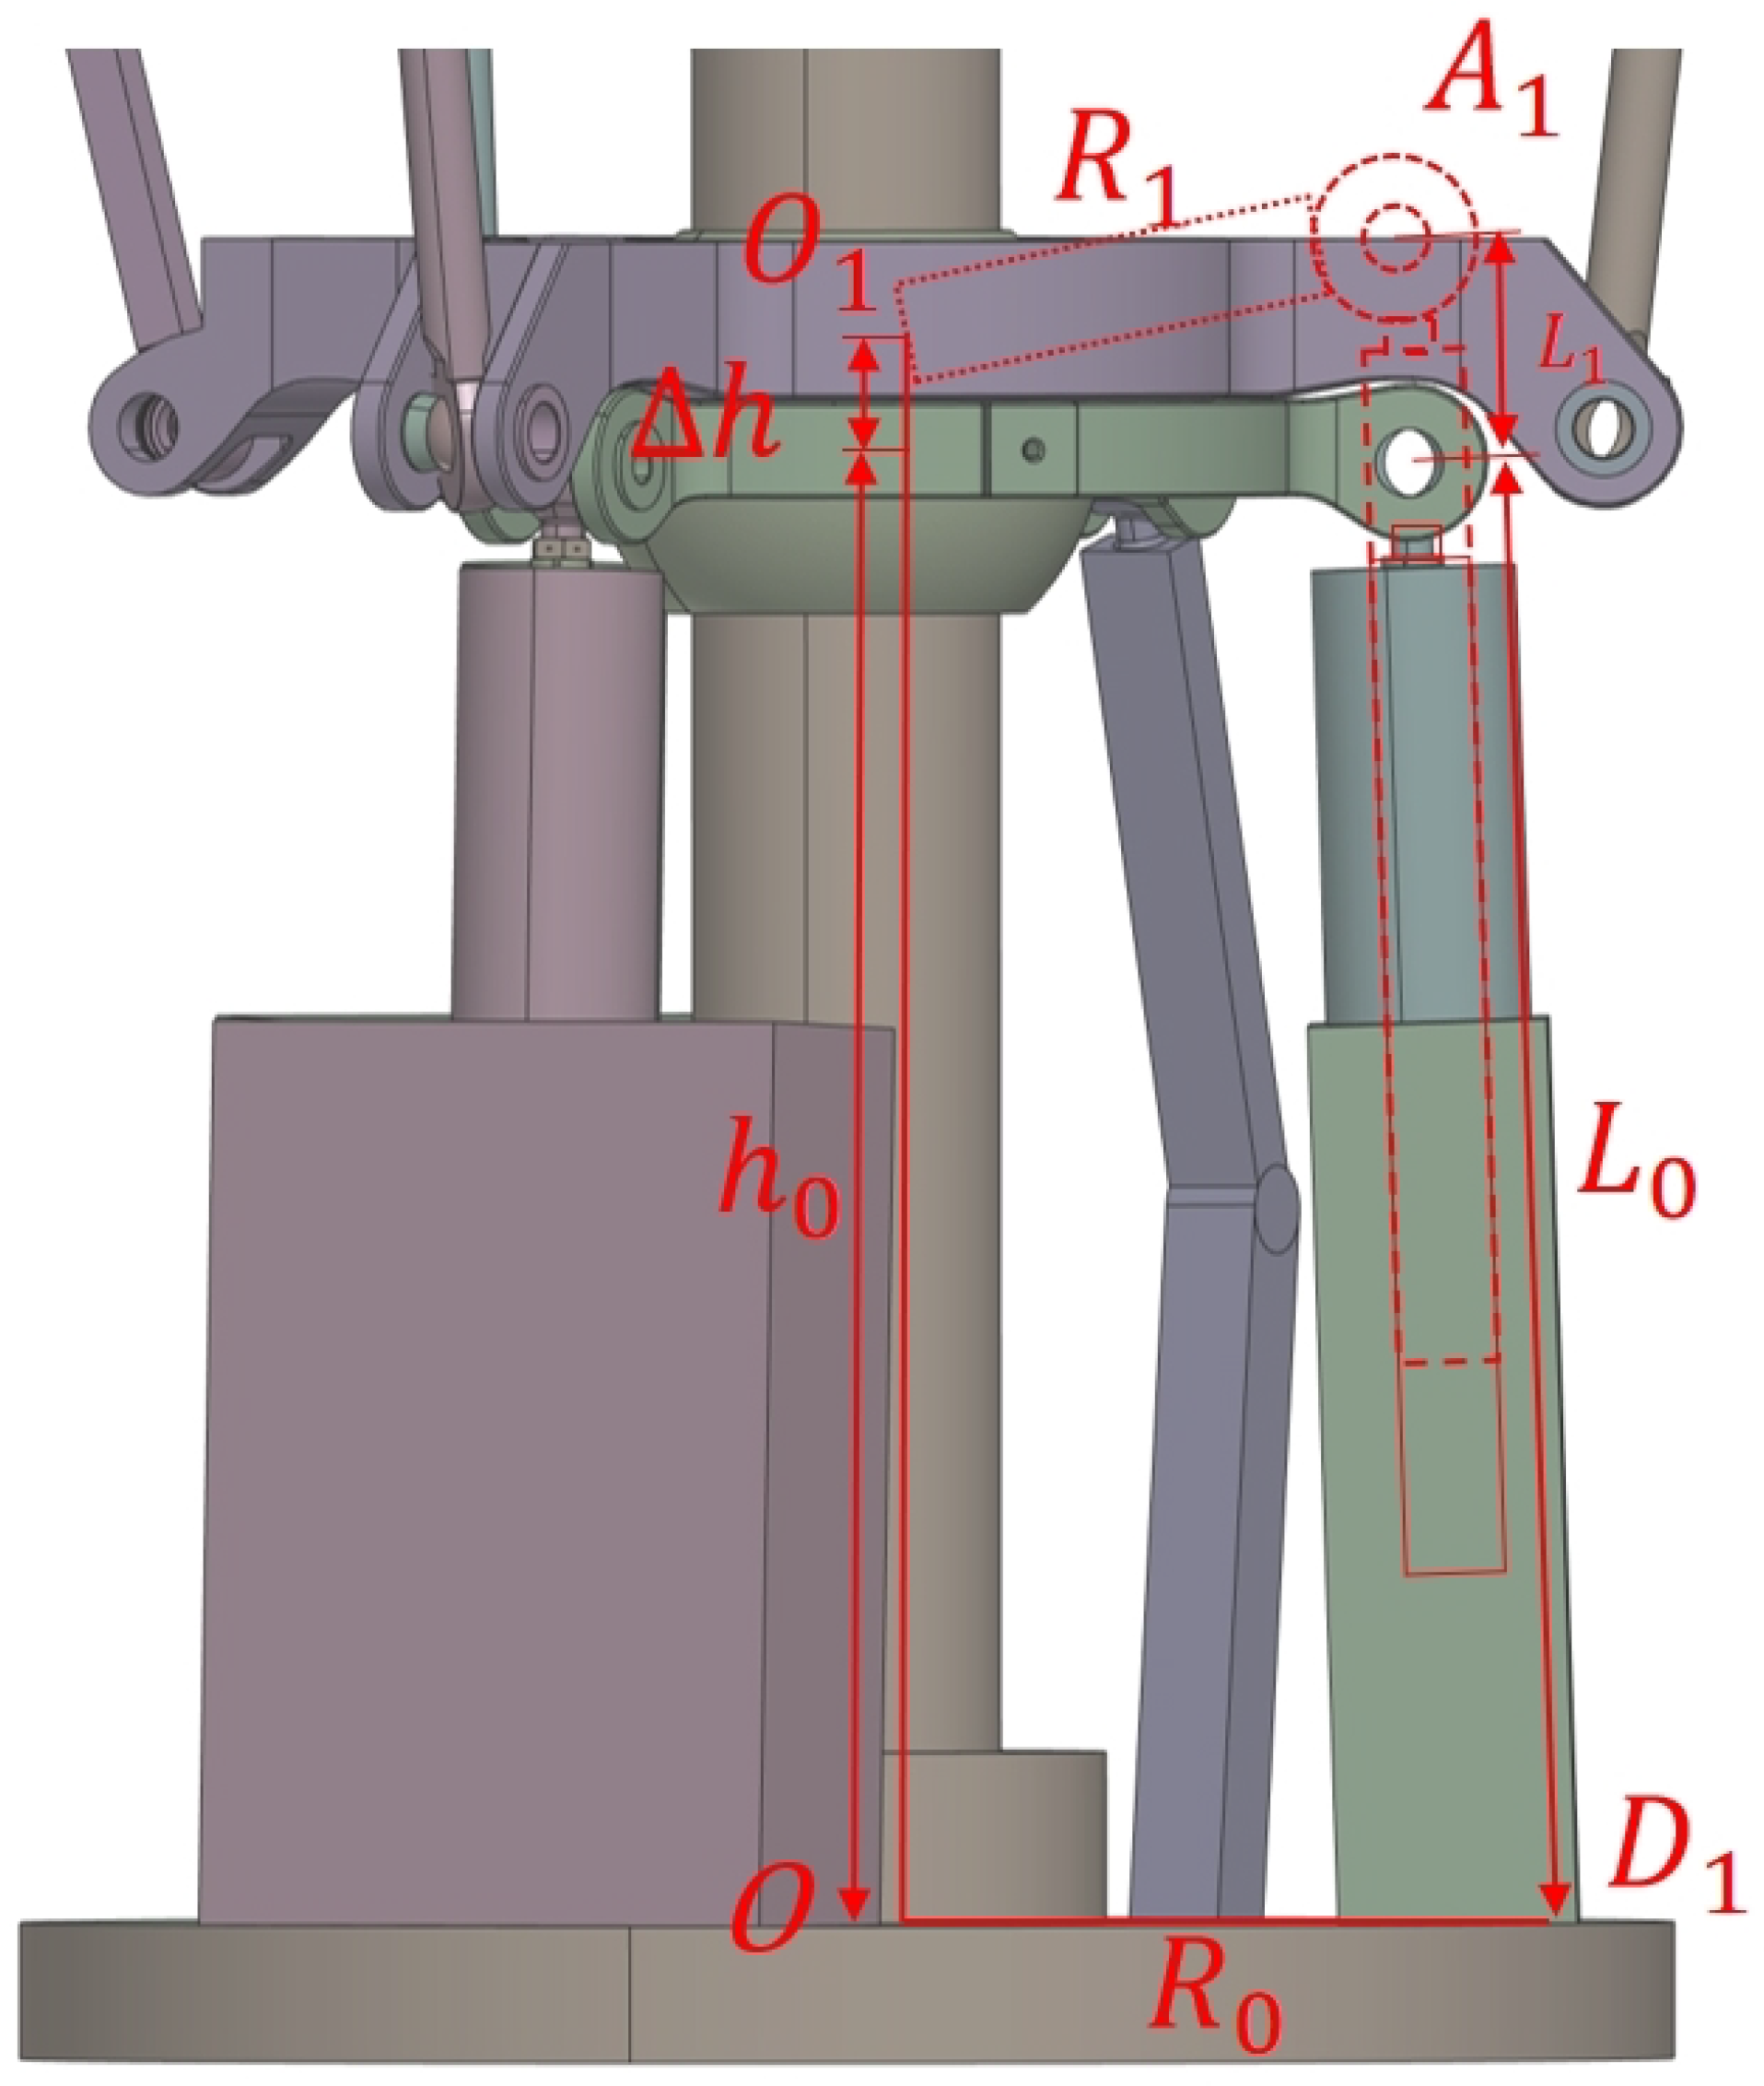
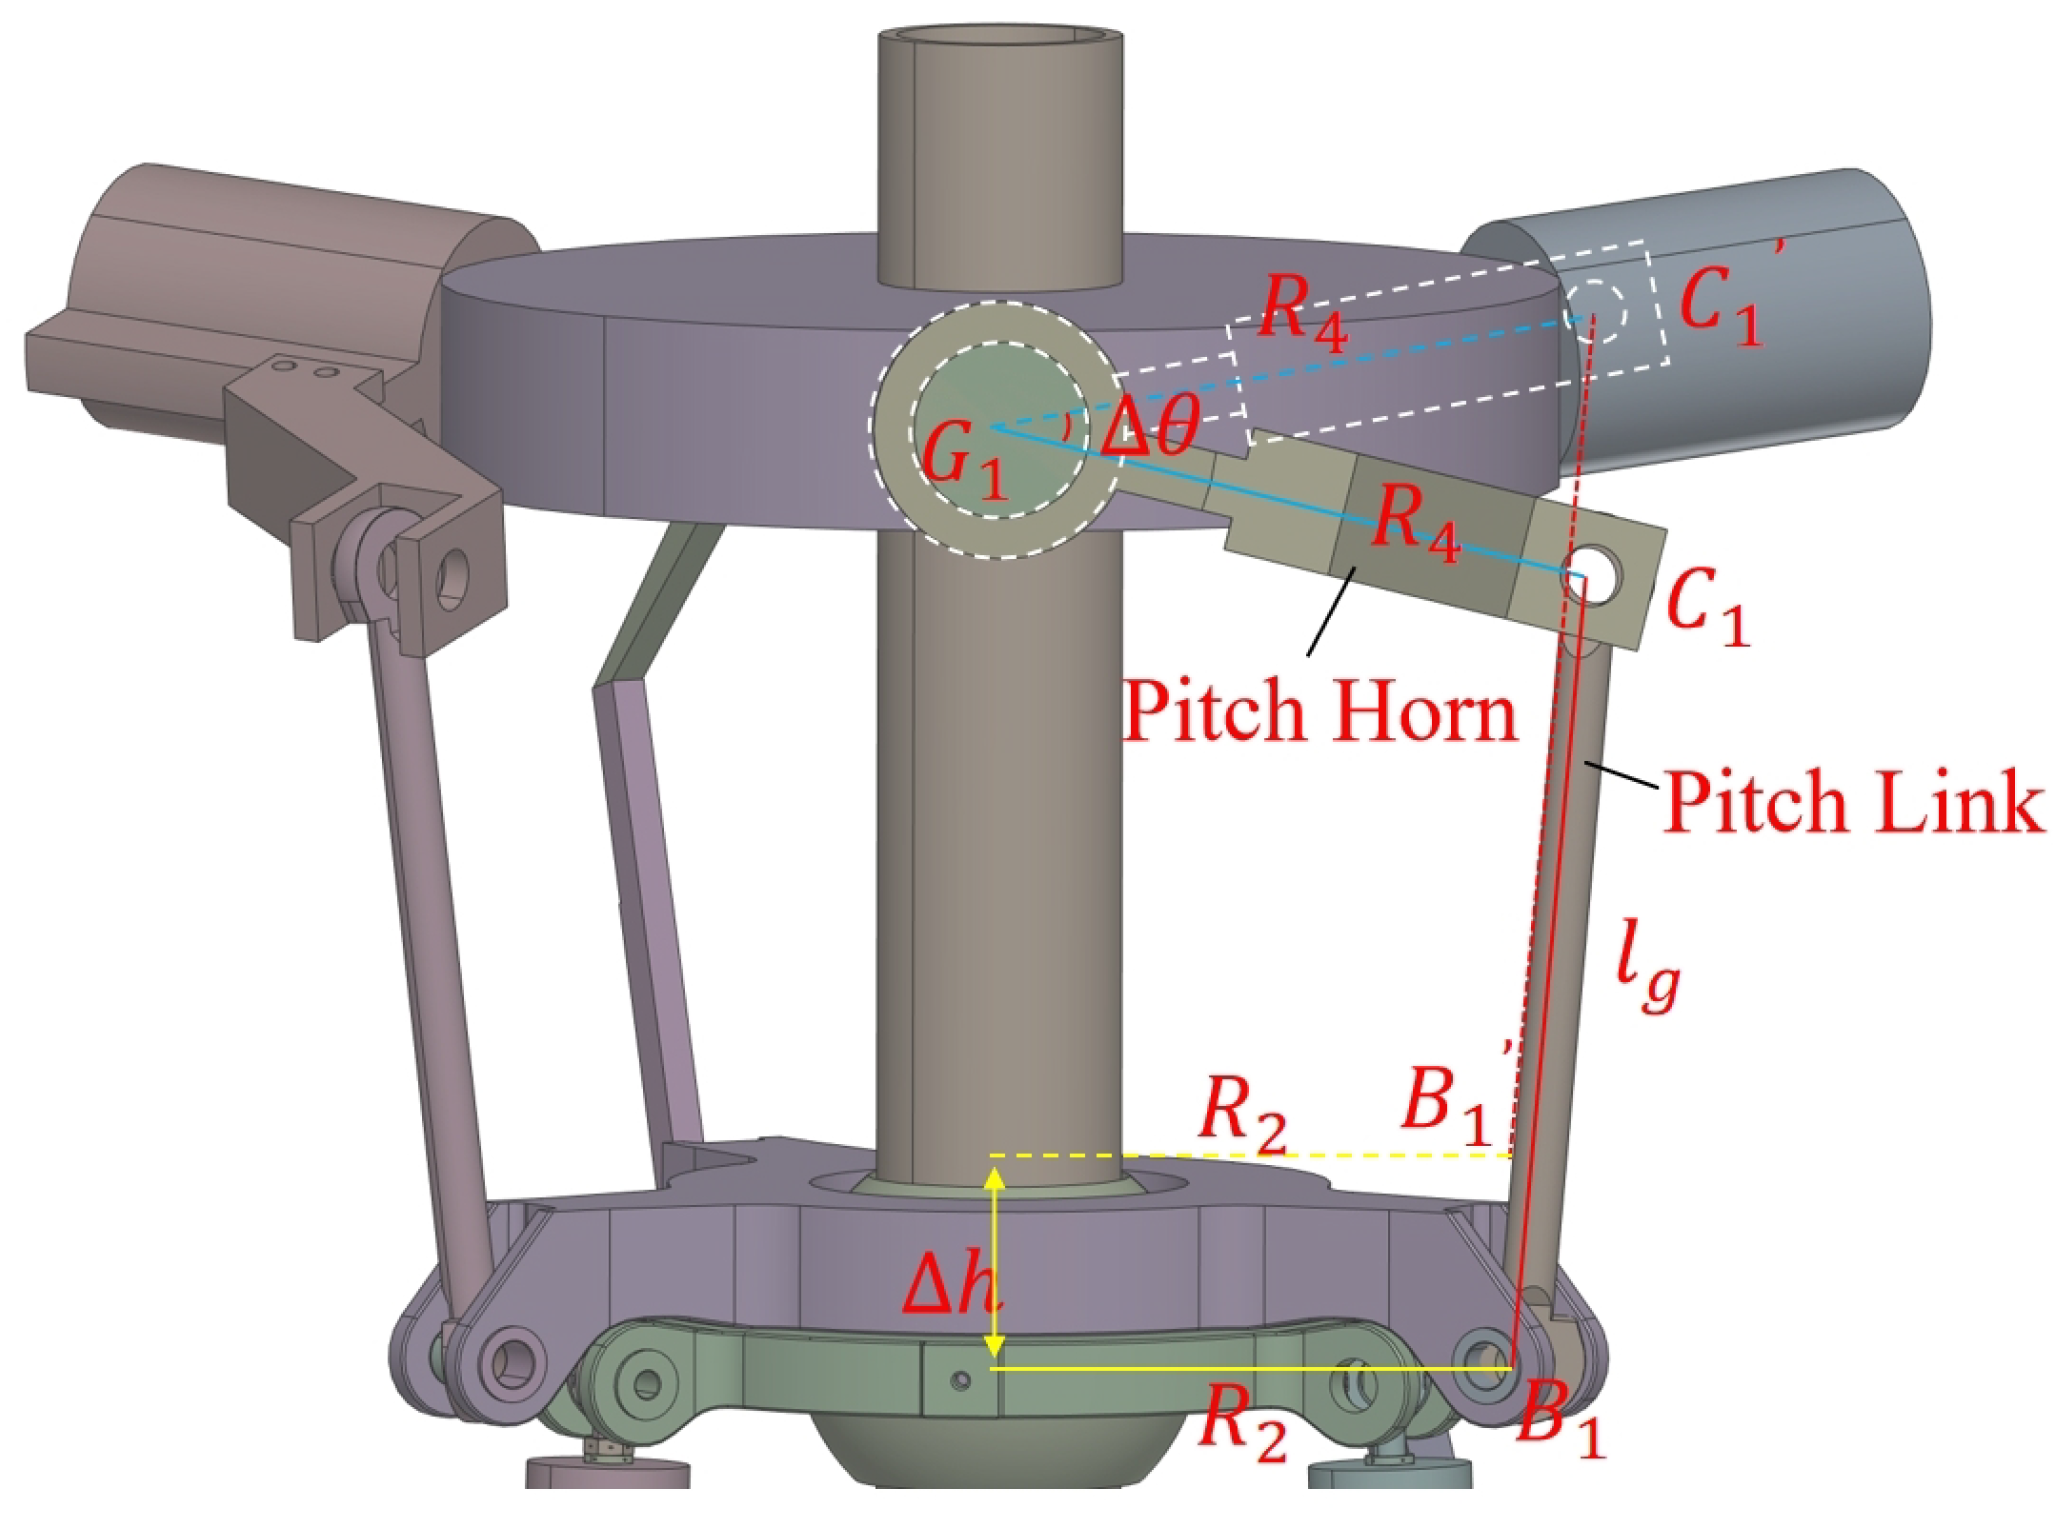
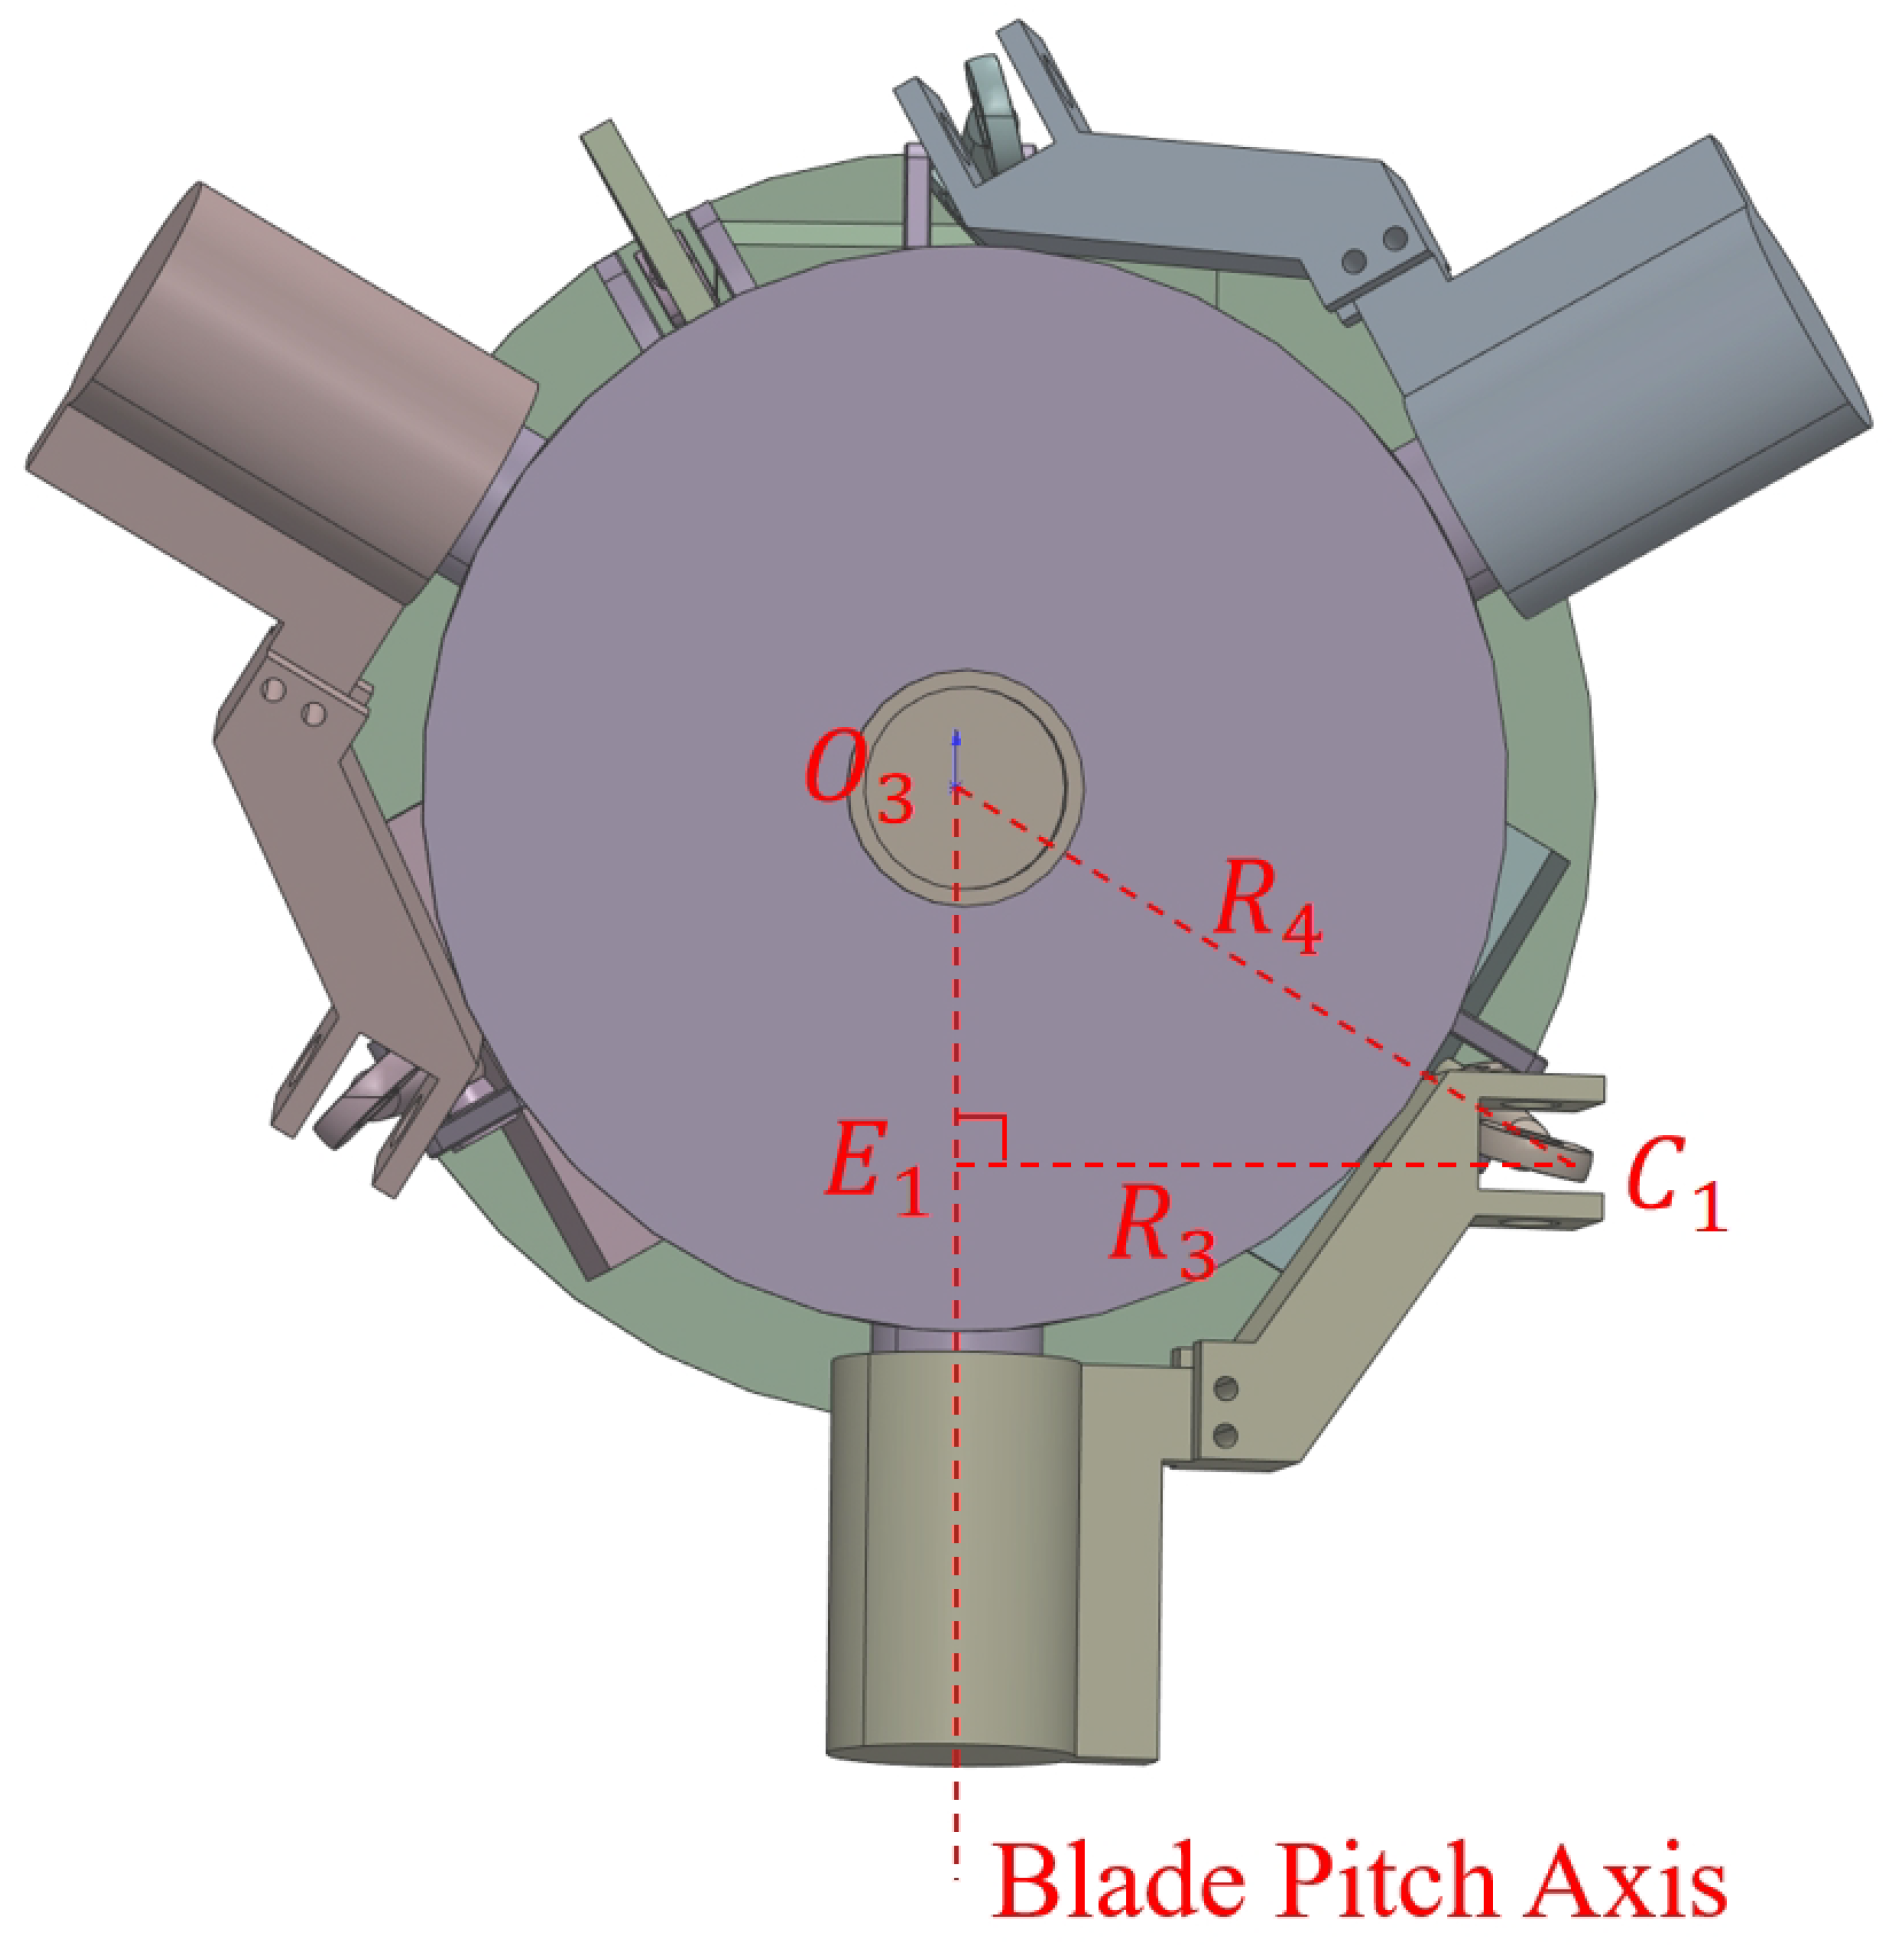
1. Introduction
Tiltrotor aircraft, with their unique capabilities for vertical takeoff and landing (VTOL) and high-speed cruising, are increasingly valuable in both modern military and civilian applications [
1,
2]. During a routine flight, the rotational speed of the rotor blades of a tiltrotor aircraft is maintained constant, and the aircraft’s maneuverability is achieved through blade pitch control [
3]. Although pitch control errors generally do not directly cause the aircraft to become unstable, they can significantly affect critical flight phases, such as takeoff, transition, and landing. Due to aerodynamic interference, the pitch control in high-axial-flow conditions is sensitive to power fluctuations [
4]. An inaccurate pitch can prevent the aircraft from generating sufficient lift, affecting the precision of flight trajectories and potentially leading to safety incidents under extreme conditions. Therefore, precise pitch control is crucial for tiltrotor aircraft, as accurate pitch control can improve the flight efficiency and enhance the flight stability [
5].
The pitch control system of a tiltrotor aircraft is characterized by three control parameters: collective pitch, longitudinal cyclic pitch, and lateral cyclic pitch [
6,
7]. Since directly measuring these parameters on the rotor is complex, the system uses an open-loop control strategy that estimates changes in control angles from the actuator stroke [
8,
9]. However, the relationship between the actuator stroke and rotor control angles is complex and not readily apparent, highlighting the need for a transformation equation that accurately relates these variables [
10]. A potential solution involves deriving a transformation formula through spatial geometric calculations based on the dimensions of the model. However, due to inevitable gaps and errors that occur during the manufacturing, assembly, and operation of the model, the precision of theoretical calculations is often unsatisfactory. Consequently, a measurement-based approach is typically employed to obtain the transformation formula between actuator stroke and rotor control angles.
An extensive analysis of measurement techniques from the existing literature was conducted. As shown in
Table 1, which evaluates five typical methods across four key dimensions, a systematic comparison was performed between photogrammetry [
11], coordinate measurement arms [
12], inertial measurement units (IMUs) [
13,
14], and direct measurement [
15]. This comparison led to the selection of the direct measurement method due to its optimal balance of versatility, efficiency, and low cost. The specific procedure involves prescribing actuator strokes and then recording the corresponding inclinometer sensor readings after rotor model installation, thereby obtaining a data set correlating three pitch angles with actuator strokes, which is subsequently used for data fitting to derive the transformation relationship.
Regarding the fitting model selection, prior research by Li Xinmin et al. for conventional helicopters concluded a linear relationship between the automatic tilting angle variation and the rotor control angles [
16], leading to the common adoption of a simplified linear polynomial fitting method [
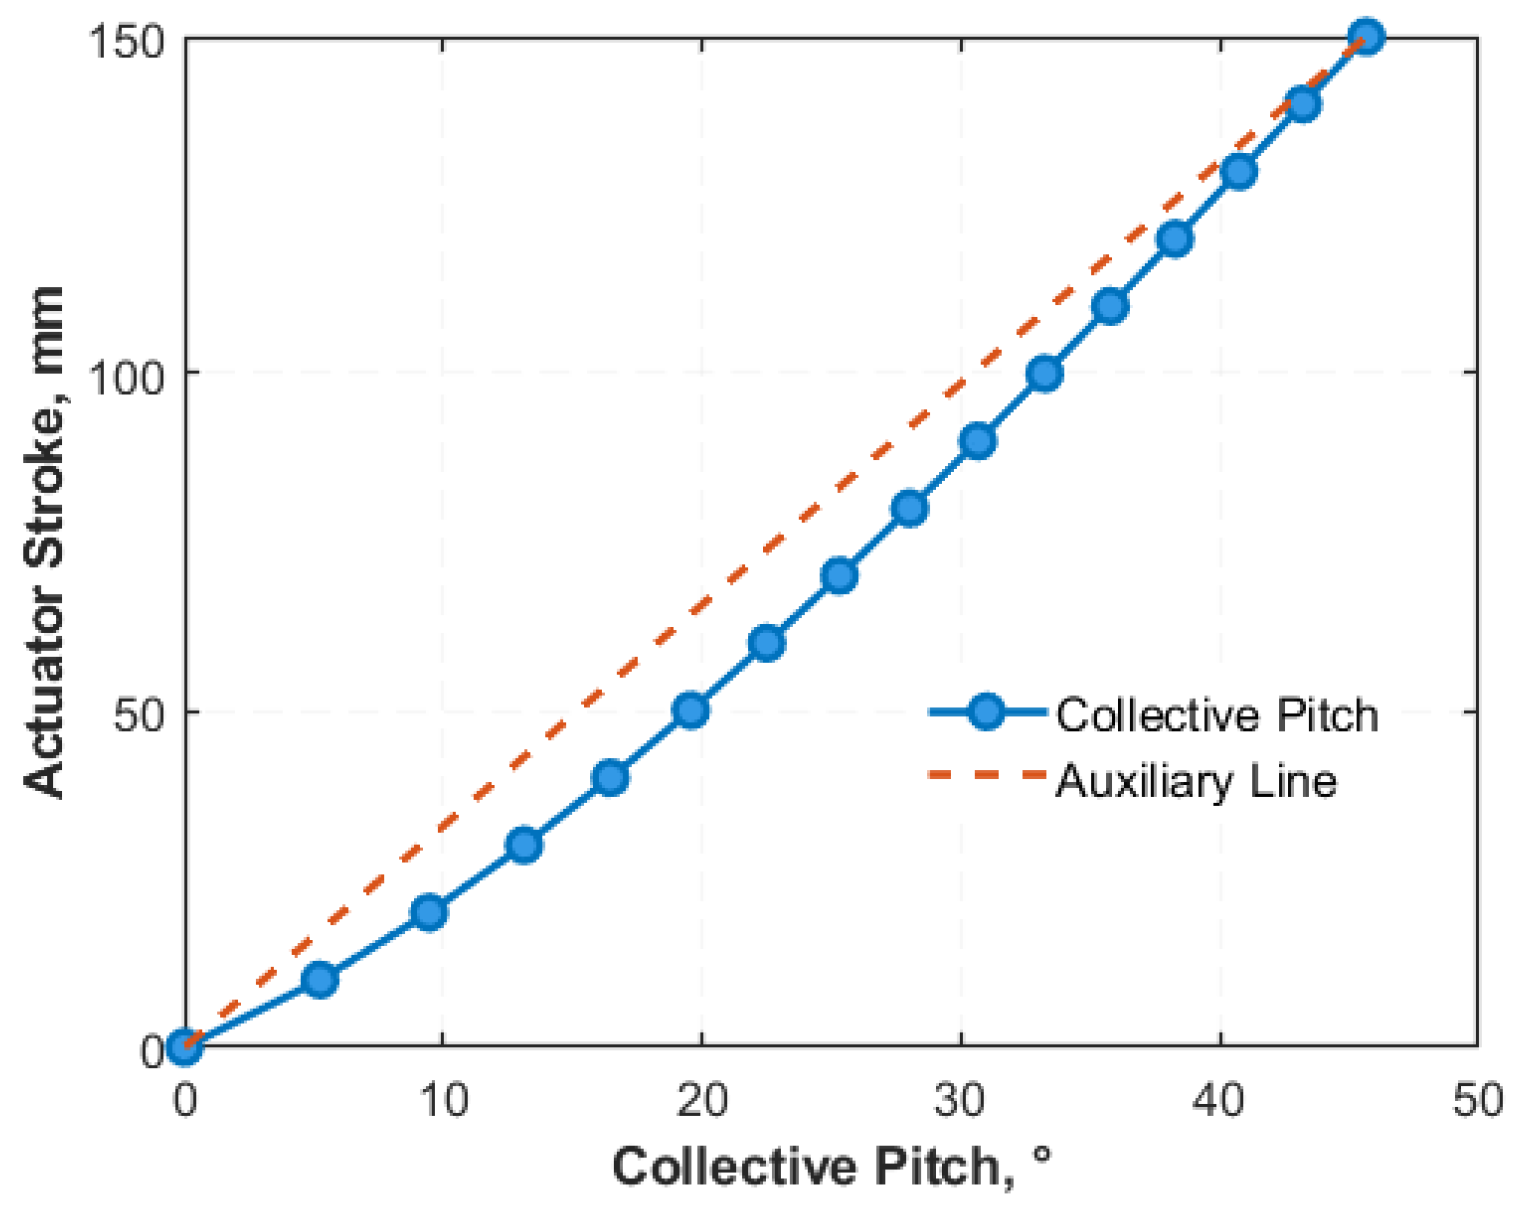
17]. However, this linear approach may introduce significant deviations when applied to tiltrotor aircraft, failing to meet high-performance control requirements. The key reason is that although tiltrotor aircraft share pitch control similarities with conventional helicopters, their operational range of the collective pitch is substantially increased, reaching up to
during transition and fixed-wing modes compared with the typical
in conventional helicopters. Linear approximation only holds when the motion range is small, and the geometric nonlinearity of the pitch control mechanism will become prominent with a
large stroke, making linear fitting unable to match the actual mapping relationship. This large-stroke operation necessitates further exploration of the transformation relationship, as the linear model becomes insufficient.
Beyond the increased stroke, tiltrotor aircraft present unique calibration challenges that are absent in conventional helicopters. The transition phase between helicopter and airplane modes introduces complex, time-varying dynamics where the rotor disc is partially tilted [
18]. This tilt significantly alters the kinematic chain and the aerodynamic loads on the pitch control linkages, further exacerbating nonlinear effects [
19]. Furthermore, the need for simultaneous and precise control of collective, longitudinal cyclic, and lateral cyclic pitches to manage coupled flight dynamics (e.g., wing–rotor interactions) places exceptionally high demands on the calibration accuracy [
20,
21].
To address the aforementioned challenges, this study begins with an in-depth analysis of the model structure using spatial analytic geometry. Taking a specific rotor model as a case study, we elucidate the complex nonlinear relationship between the three pitch control angles and the actuator strokes in a tiltrotor aircraft. Considering the unique characteristics of the total tilt range, a novel multivariate cubic matrix regression algorithm is proposed. Additionally, a new validation and calibration method, along with its corresponding procedure, has been developed. The effectiveness of the proposed method has been rigorously verified through experimental studies. By comparing conventional helicopter fitting methods with the tiltrotor-specific approach presented here, our results demonstrate the clear superiority of the latter. This work effectively addresses key implementation challenges in tiltrotor control systems and provides a solid theoretical and practical foundation for achieving precise control of a tiltrotor aircraft.
3. Polynomial Fitting-Based Pitch Calibration Algorithm
The calibration process is illustrated in
Figure 8.
The specific process of pitch calibration using the fitting method is as follows: On-site measurements are conducted to obtain the relationships between the pitch angles of the rotor blades at various azimuth angles and the actuator strokes. These pitch angles are then converted into pitch control angles. The resulting data are substituted into a fitting expression to form an overdetermined system of equations. This system is subsequently solved using the least squares method to derive the conversion formula.
3.1. Parameters to Be Measured Before Calibration
- 1.
Initial installation angle
The initial installation angle of a rotor blade is defined as the angle between the blade and the rotational plane at the time of installation. It is typically determined as the angular difference between a point at (where R is the rotor radius) and the measurement point at the blade root. This angle is a fixed value.
- 2.
Aerodynamic lead angle
To mitigate the coupling effects of the lateral cyclic pitch, blade pitch control must be advanced. This control angle is referred to as the aerodynamic lead angle [
23]. It is based on the fundamental natural frequency of blade flapping and is typically determined through aerodynamic experiments [
24,
25].
- 3.
Bias angle of rotor shaft
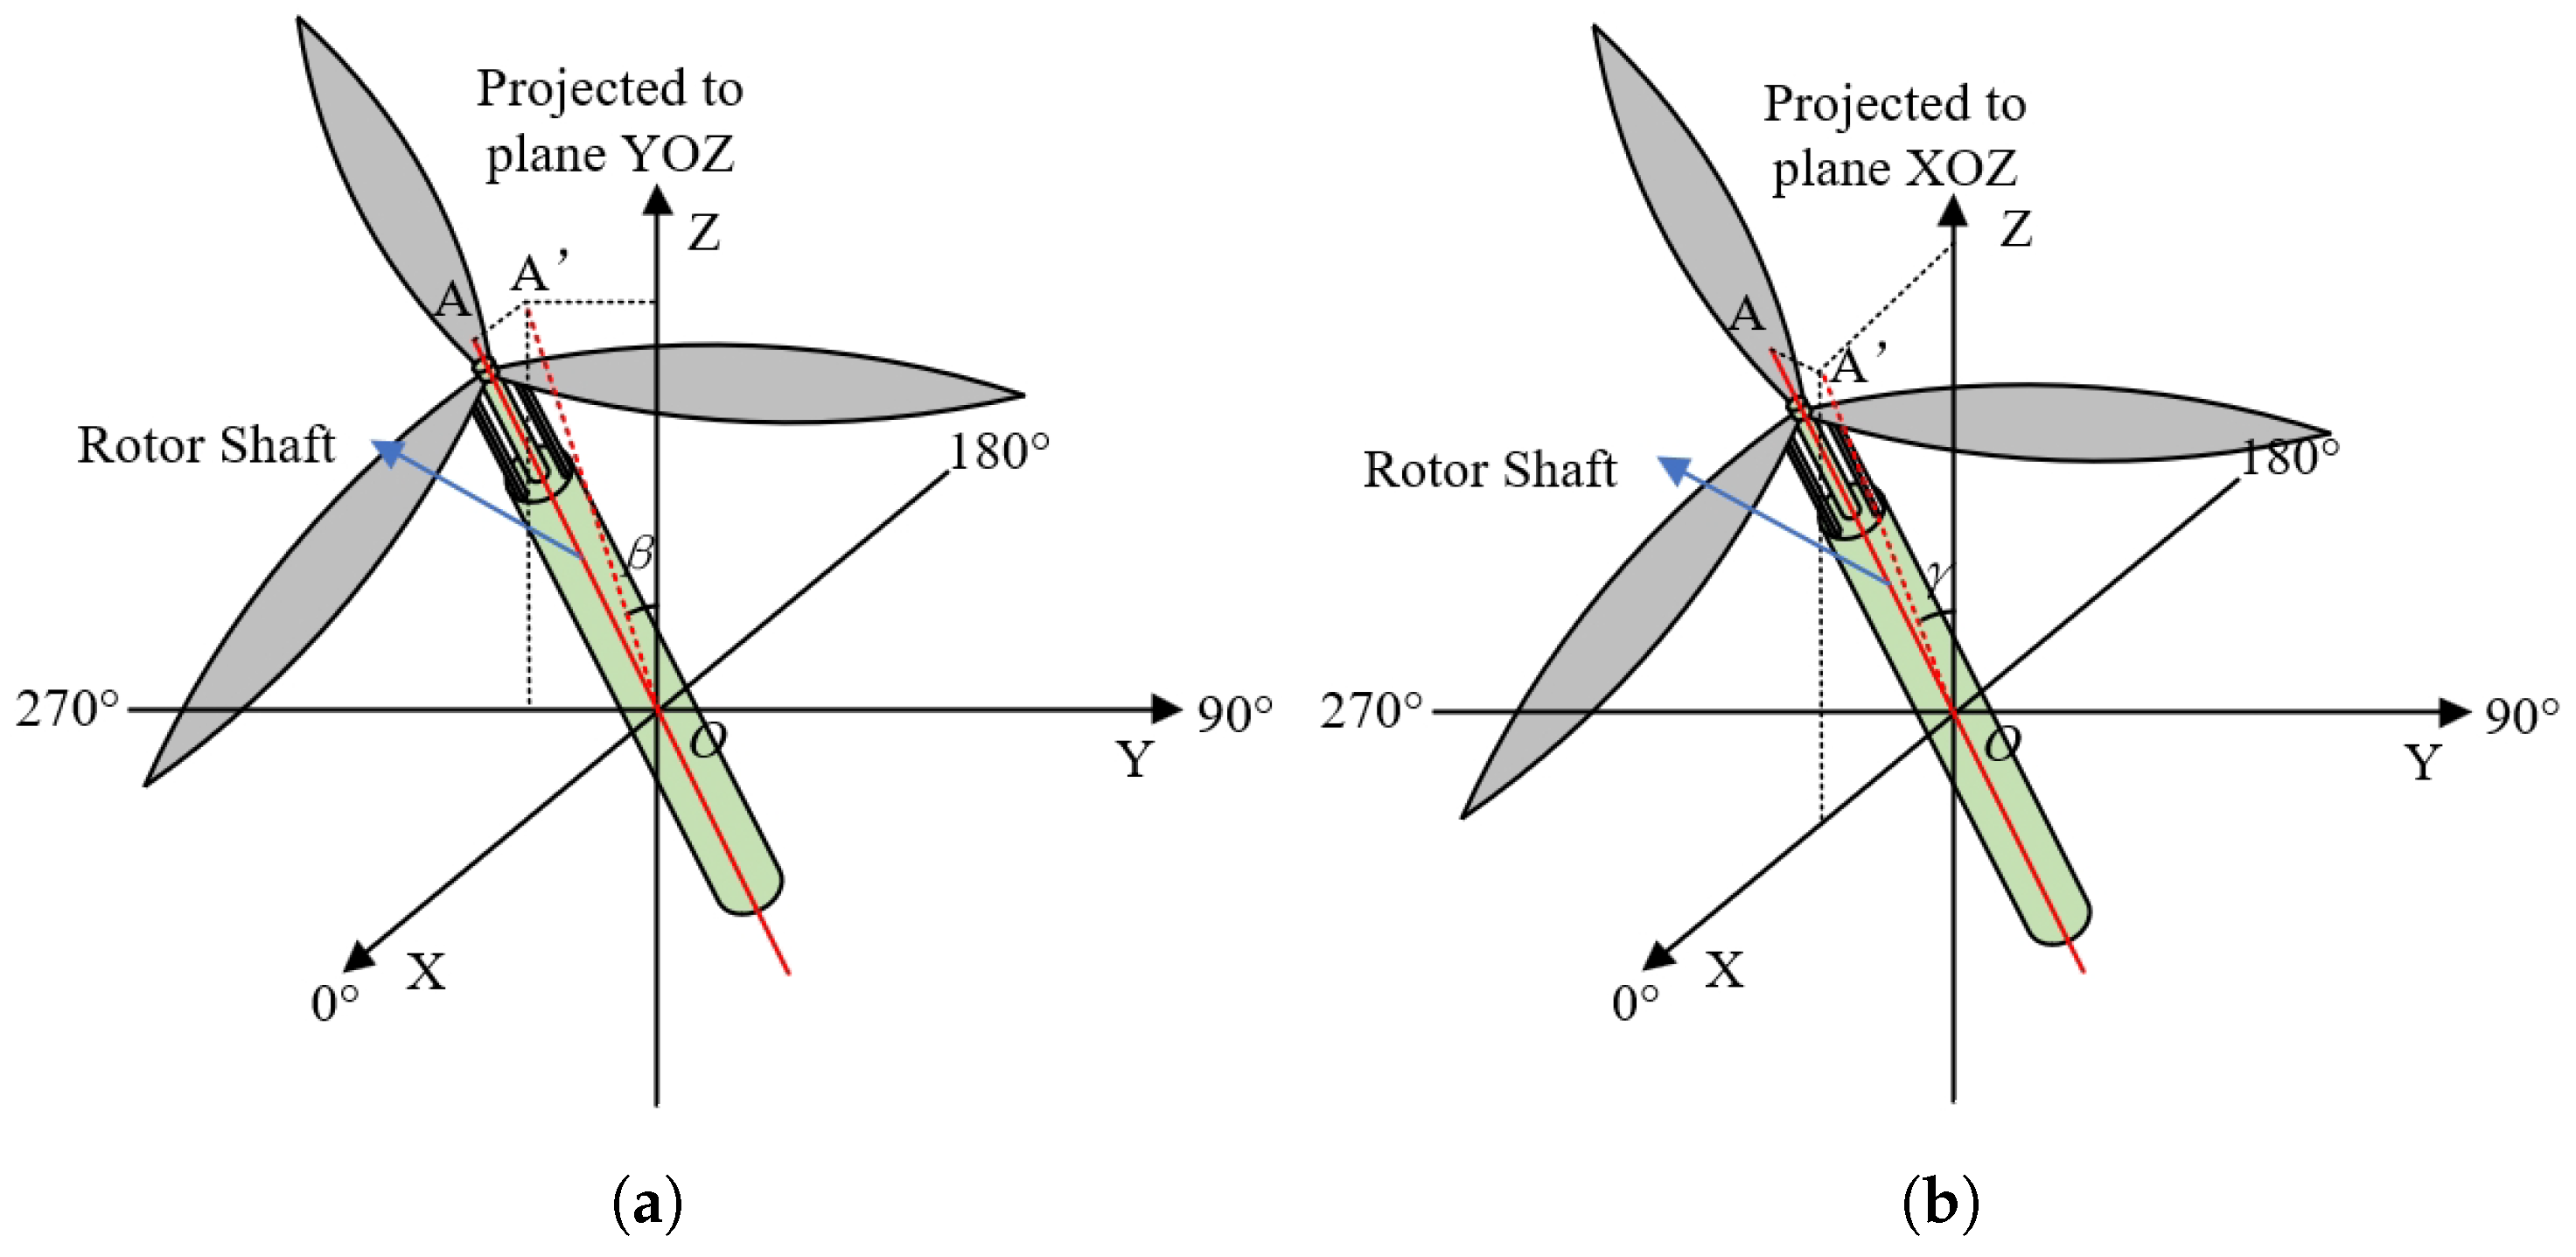
As shown in
Figure 9,
is the angle between the rotor shaft and the
plane, while
is the angle between the rotor shaft and the YOZ plane.
3.2. Measurement and Processing of Pitch Angle Data
Control angles cannot be directly measured and must be converted from pitch angles. During the calibration process, the stroke values of three actuators are initially specified. Following this, when the actuators adjust their strokes accordingly, an angular measurement device is employed to record the horizontal pitch angles at the root of the rotor blades across multiple azimuth angles. To minimize the measurement errors, data are typically collected at four representative azimuth angles: , , , and . This results in the corresponding angles , , , and .
The pitch angles at the four specified azimuth angles are calculated using the initial installation angle
, the lateral misalignment angle of the rotor shaft
, and the longitudinal misalignment angle
according to the following formulas:
3.3. Calculation of Pitch Control Angles
Substitute the pitch angle data into Equation (
9):
These equations can be represented in matrix form as follows:
where
Given that
,
,
, and
are known quantities, the unknown variables
,
, and
in the equation can be calculated using the following formula:
In the above expression, refers to the Moore–Penrose pseudoinverse matrix of T.
According to this methodology, specifying a set of stroke values for the three actuators allows for the determination of the corresponding pitch control angles , , and .
3.4. Modeling the Relationship Between Actuator Stroke and Control Angles
When the range of the collective pitch is limited to less than , the linearity improves significantly. Consequently, the linear fitting method is commonly employed during the pitch calibration process for conventional helicopters, owing to its simplicity and effectiveness.
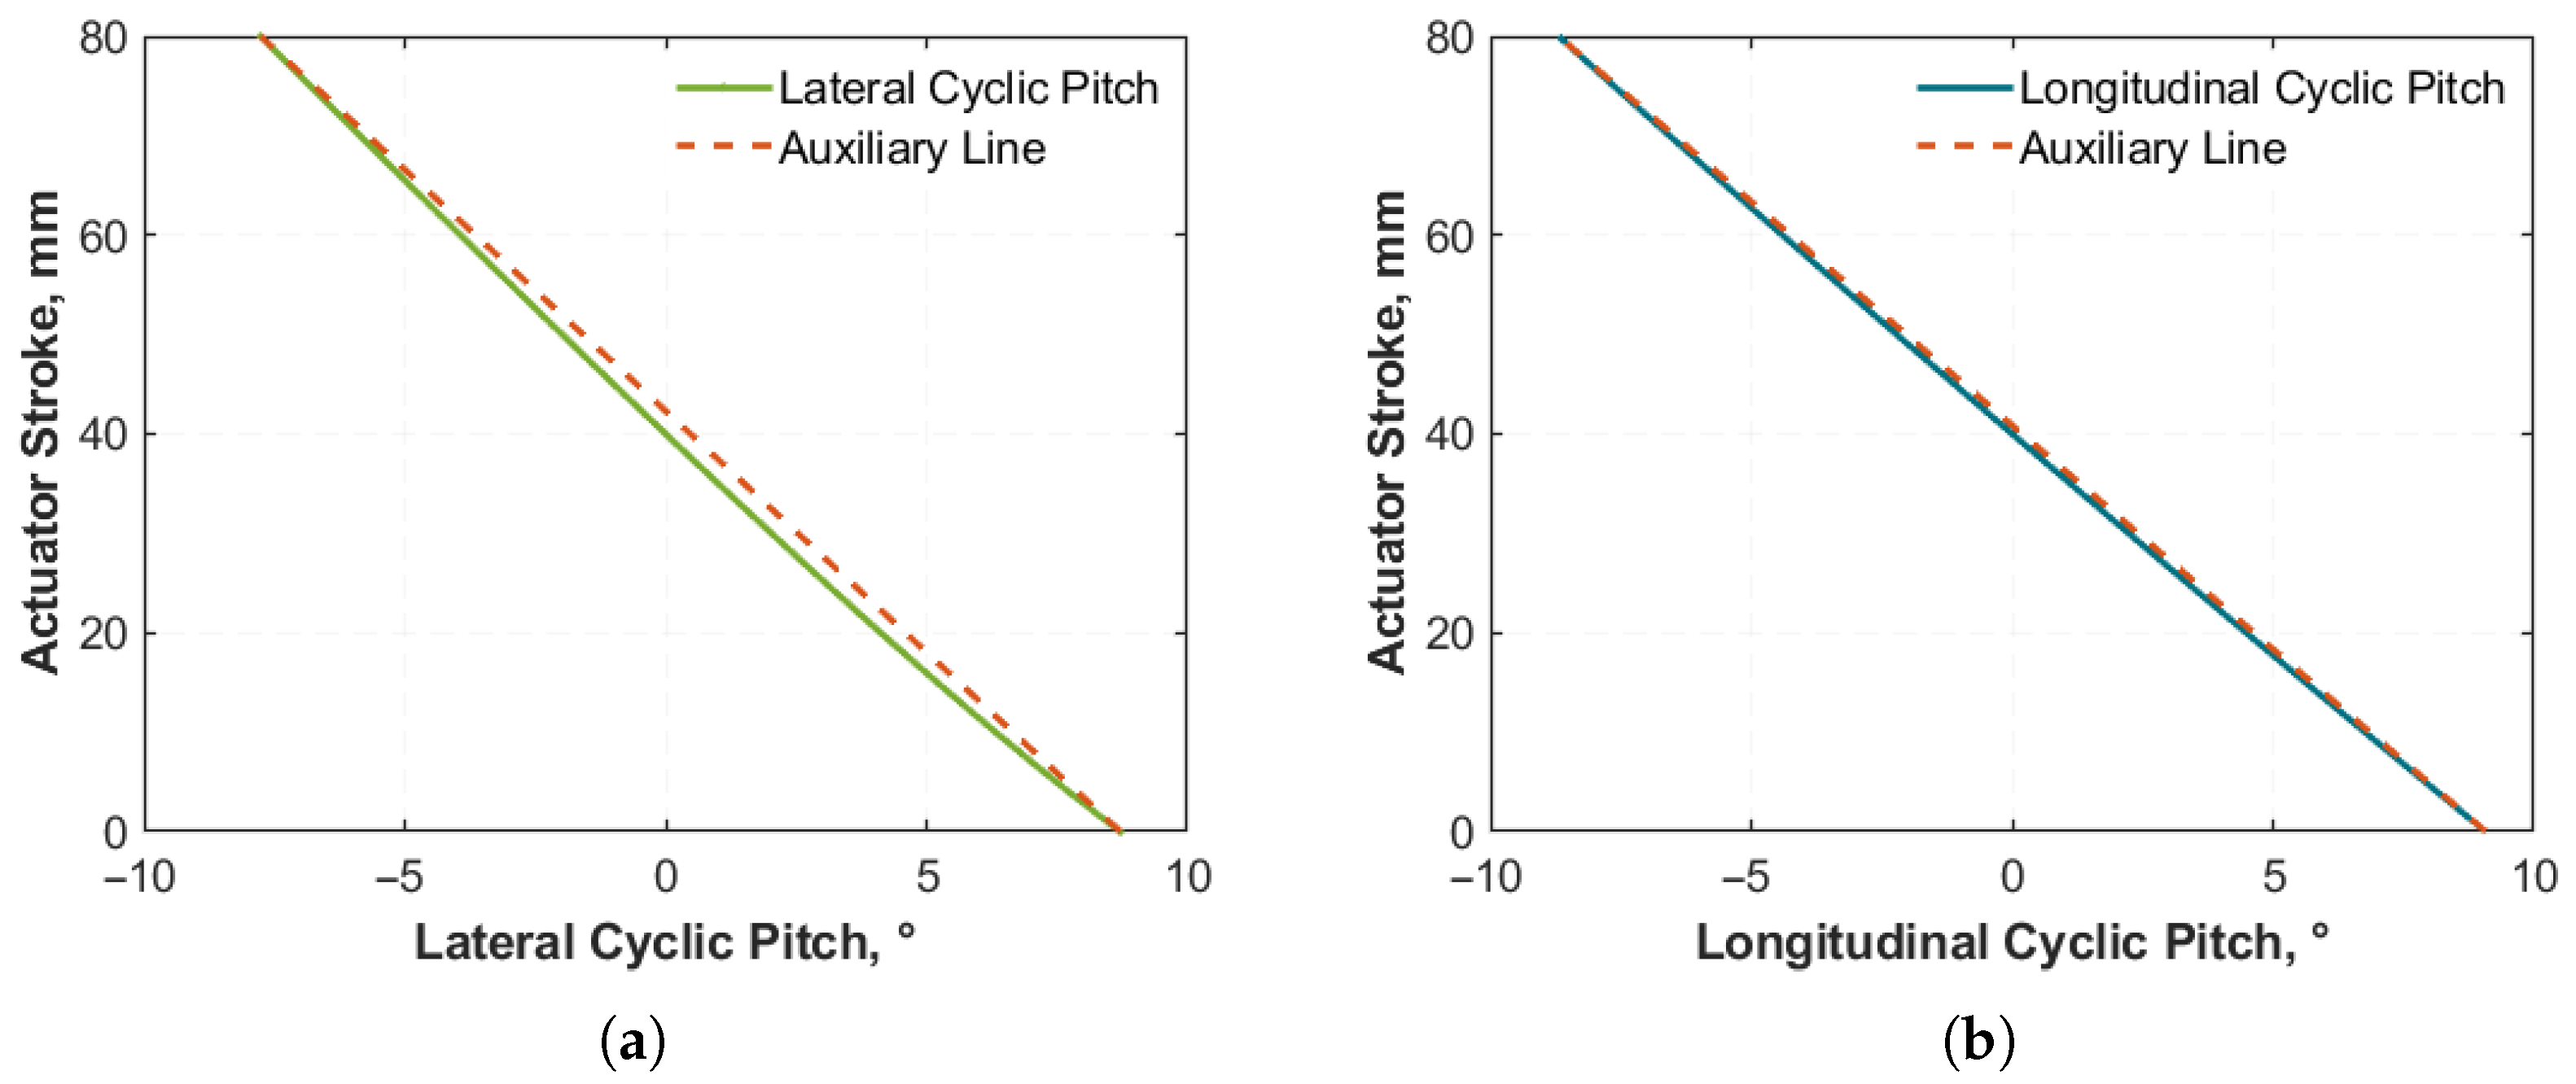
However, based on the derivations and calculations presented in this paper, it is evident that when the collective pitch variation exceeds , a distinct nonlinear relationship exists between the actuator stroke and the three control angles. If a linear fitting approach is still employed, although the errors in the lateral cyclic pitch and longitudinal cyclic pitch, which are two of the control angles, are relatively small, the error in the collective pitch is significantly larger. Consequently, for tiltrotor aircraft, it is advisable to use a polynomial to describe the corresponding relationship between the pitch angles and the actuator strokes.
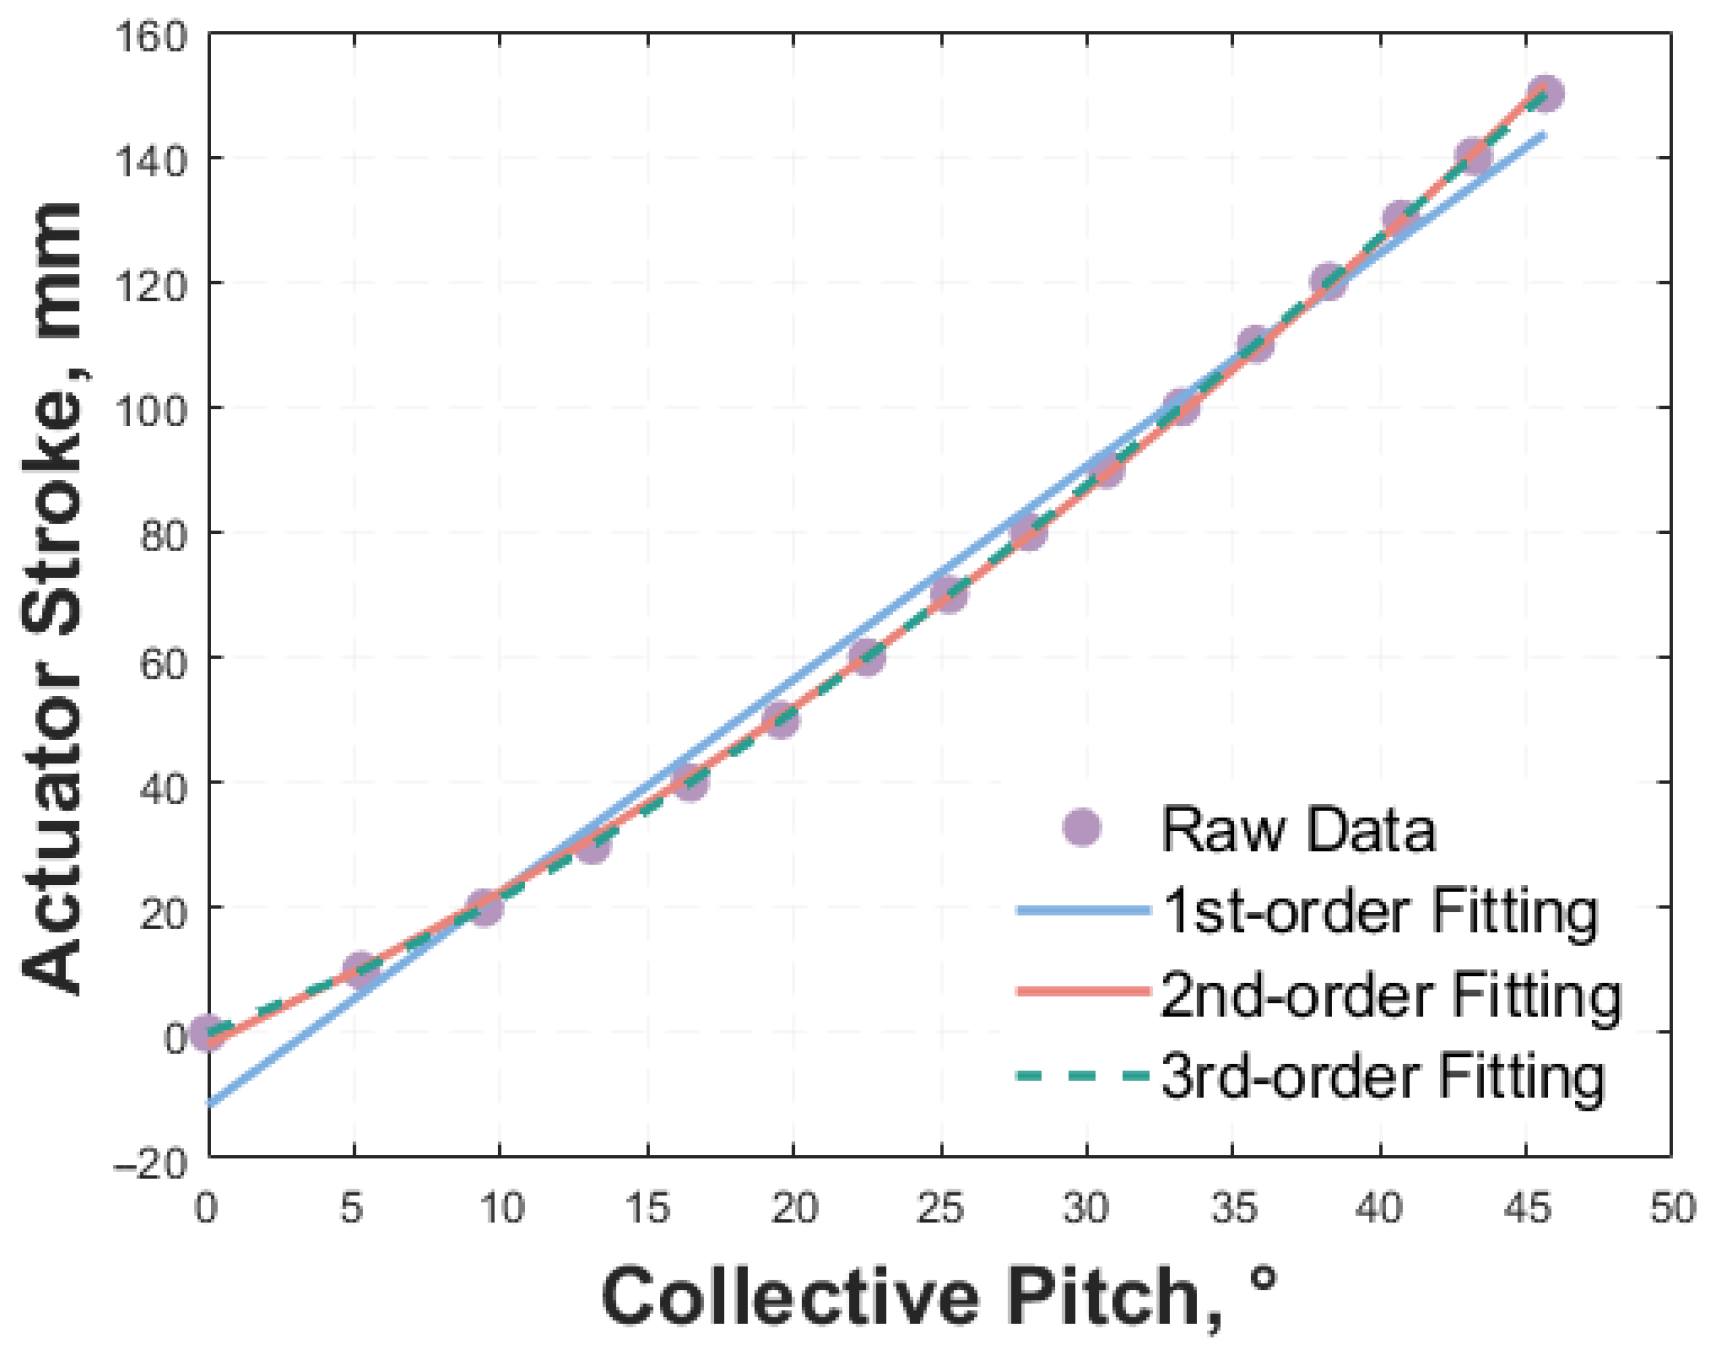
Selecting an appropriate polynomial order is critical in the polynomial fitting of the relationship between the actuator stroke and pitch control angles. To identify the suitable polynomial order for the relationship, polynomial fittings of orders 1, 2, and 3 were conducted.
As shown in
Figure 10 and
Table 3, the cubic polynomial fit achieves a mean squared error (MSE) of approximately 0.00017791 and a Coefficient of Determination (
) of 1.00000, indicating exceptional precision. Importantly, the cubic polynomial is the lowest-order fit that satisfies the MSE requirement of less than 0.5, and its residual error is far smaller than the resolution of the sensors used in this study; this objective hardware limitation means any further reduction in the MSE from higher-order polynomials is undetectable and offers no practical benefit. Moreover, higher-order polynomials are prone to overfitting, which impairs the model’s generalization ability and may lead to unpredictable behavior in real-time control applications. Increasing the polynomial order beyond three would therefore lead to unnecessary computational complexity without a significant improvement in the accuracy or practical performance. Thus, the cubic polynomial provides the optimal balance between accuracy and computational efficiency for this application.
The relationship between the actuator stroke and control angles can be described in matrix form as follows:
where
The coefficient matrices
A,
B,
C, and
D in Equation (
14) encapsulate the physical characteristics of the pitch control linkage system:
The cubic coefficient matrix A primarily characterizes the strong geometric nonlinearity arising from extreme ranges of motion of the pitch links and swash plate tilt.
The quadratic coefficient matrix B captures moderate nonlinear effects.
The linear coefficient matrix C represents the first-order kinematic relationship between the actuator displacement and pitch angle change, which dominates under small-stroke conditions and is consistent with the linear model used for conventional helicopters.
The constant vector D denotes the initial offset of each actuator, corresponding to the actuator strokes required to achieve the zero position of all pitch control angles.
Expanding Equation (
14) results in the following three equations:
Each set of stroke and pitch control angle data produces three equations. To solve for the 30 unknowns in matrices
A,
B,
C, and
D outlined in Equation (
14), a minimum of 10 sets of measurement data are required.
Suppose
n sets of measurement data are collected. Each data set includes a triplet of control angles
and the corresponding measured strokes
for the three actuators, where
indexes the data set. Given
sets of such data, a total of
equations can be formulated and divided into three groups:
Using the system of Equation (
16) as an example, this overdetermined system can be expressed in the standard matrix equation form
:
By employing the formula
, the least squares solution for
X can be obtained. The other systems of equations can be solved using the same method, thereby facilitating the determination of the coefficient matrices
A,
B,
C, and
D in Equation (
14).
Although non-polynomial methods such as neural networks could theoretically capture complex nonlinearities, they were not selected due to their higher computational complexity, substantial data requirements, and lack of interpretability. The data collection process for our calibration method is time-consuming and must be conducted under strict environmental controls; polynomial fitting offers a favorable balance between accuracy, computational efficiency, and ease of implementation.
4. Verification Experiment
To verify the superiority of the newly proposed calibration algorithm over traditional methods in the pitch calibration of a tiltrotor aircraft, an experimental validation was designed in this study.
4.1. Experimental Procedure
The verification test process is illustrated in
Figure 11.
A detailed description of the operational steps for the verification experiment is provided below:
Step 1: A calibration sequence was developed to cover the full range of pitch angles used in practical applications. The sequence includes 60 actuator stroke value sets (which were estimated based on practical experience) to ensure comprehensive coverage. Specifically, the collective pitch angle is set to range from to , while the longitudinal and lateral cyclic pitch angles are set to range from to . These ranges are designed to encompass the angles likely to be utilized in real-world scenarios, including extreme conditions. Subsequently, a standard pitch calibration process is performed, during which the corresponding pitch control angles for each set of stroke values are determined.
Step 2: Employ both linear and cubic fitting methods to compute the required coefficient matrices for each. Select 10 sets of typical operating conditions and calculate the corresponding coefficient matrices. Subsequently, utilize the linear fitting formula to derive inspection sequence I and the cubic fitting formula to derive inspection sequence II.
Step 3: After obtaining the two inspection sequences, apply the operations from Step 1 to both sequences to determine the pitch control angles corresponding to each set of stroke values. This step is essential for verifying the accuracy of the calibration algorithm.
Step 4: Compare the two sets of pitch control angles obtained from the methods described in Step 3 with the typical control angles from Step 2. Analyze the differences in error magnitude and distribution to evaluate the applicability and accuracy of the two fitting methods in pitch calibration.
4.2. Experimental Platform
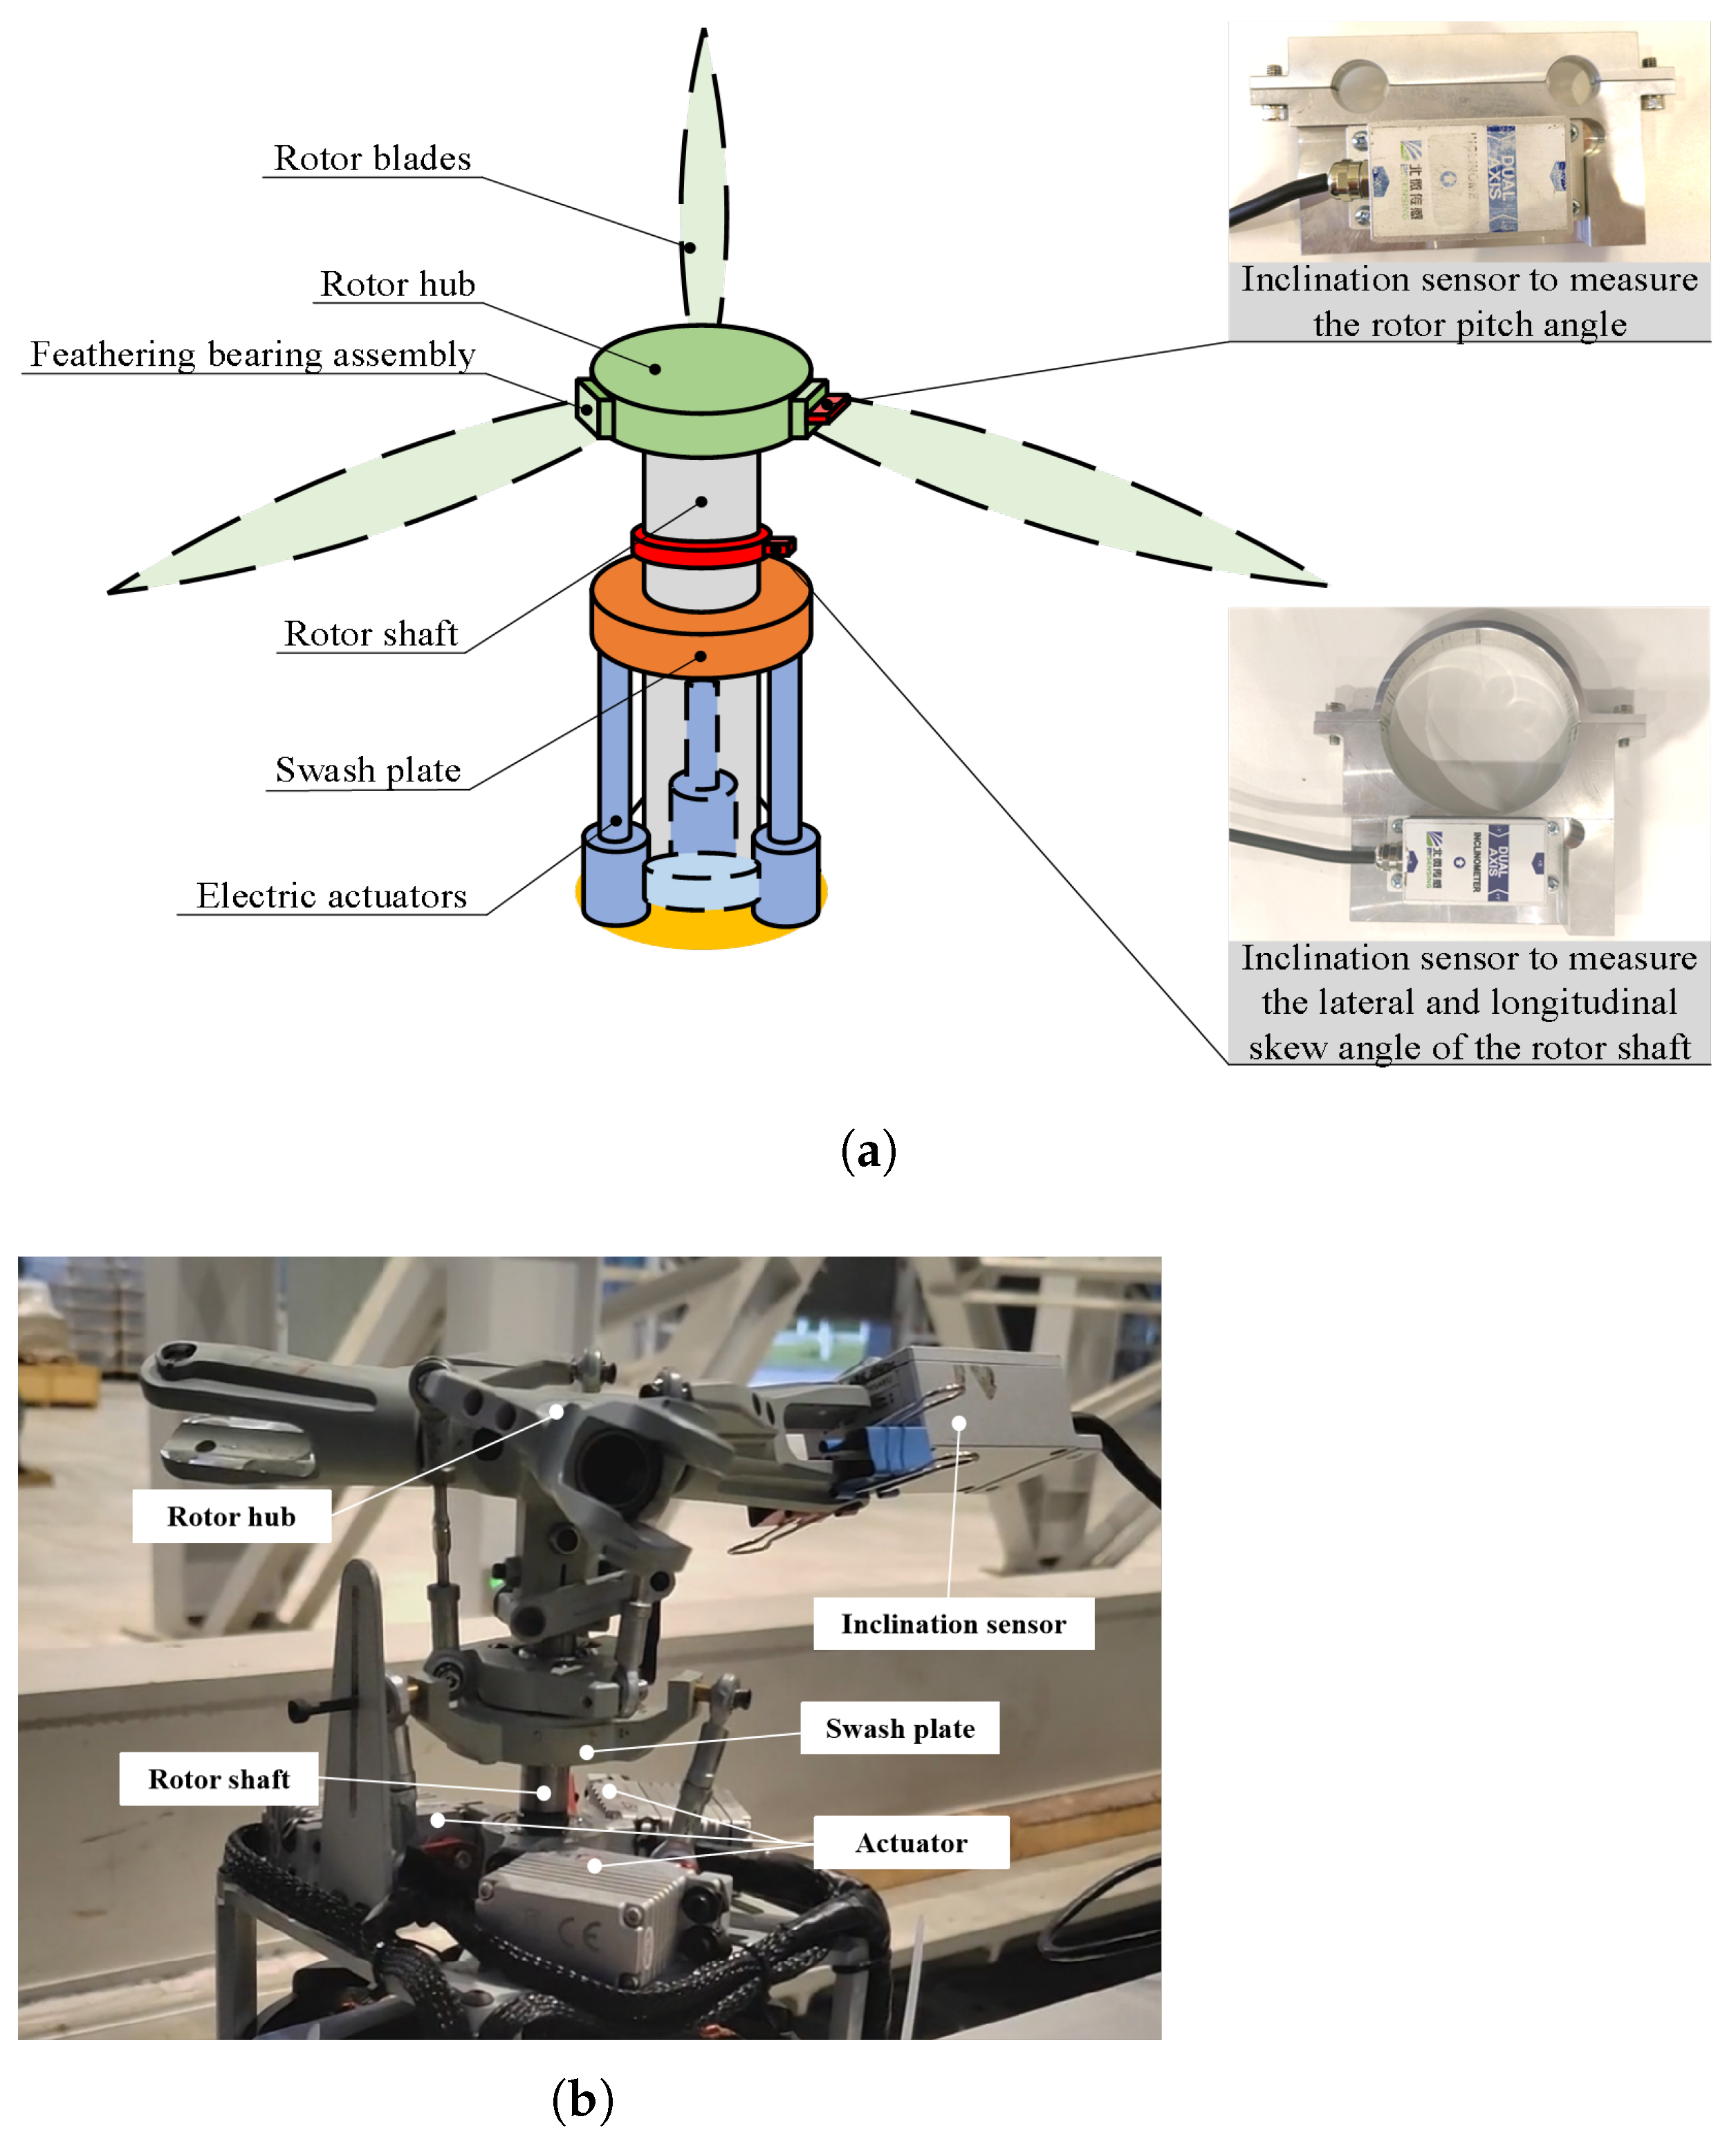
The experimental setup, as illustrated in
Figure 12, comprises a tiltrotor prototype equipped with three electromechanical actuators and BWN425 dual-axis inclination sensors mounted at the blade root and rotor hub.
Figure 12a depicts a schematic of the sensor installation on the full-scale prototype, where a sensor is securely attached via custom-designed fixtures to each of the blade root and the rotor hub shaft, ensuring precise alignment and minimal measurement drift.
Figure 12b shows a photograph of a 1:5 scaled prototype during the calibration of a single rotor. Due to size constraints of the scaled model, a simplified mounting method was employed to fix the sensor, which still maintained measurement integrity within the specified tolerance. Data acquisition was automated via a CAN bus system, enabling real-time recording of pitch angles at azimuth positions of
,
,
, and
. While detailed mechanical designs remain commercially confidential, the key experimental parameters are summarized in
Table 4.
4.2.1. Electric Actuators
This study employed electromechanical actuators, which offer advantages such as high displacement accuracy (0.01 mm) and automated control. This accuracy specification, guaranteed by the supplier, was further validated in-house prior to experimentation. Using a high-precision laser displacement sensor (with a resolution of 1 μm), we performed repeated displacement tests under controlled conditions , which confirmed that the displacement deviation remained within , thereby ensuring the reliability of our experimental data.
4.2.2. Inclination Sensors
In our calibration system, an inclination sensor coupled with a fixture is affixed to the feathering bearing assembly to determine the blade pitch angle. Similarly, the measurement of the lateral skew angle and the longitudinal skew angle of the rotor shaft is facilitated by the attachment of the inclination sensor and fixture to the rotor shaft. The employed inclination sensors are BWN425 dual-axis sensors produced by Wuxi Bewis Sensing Technology LLC, Wuxi, Jiangsu, China, boasting an inclination measurement accuracy of up to . The data communication between the inclination sensor and the computer is managed via a CAN bus, enabling the automatic transmission of sensor readings to the computer for automated analysis.
6. Discussion
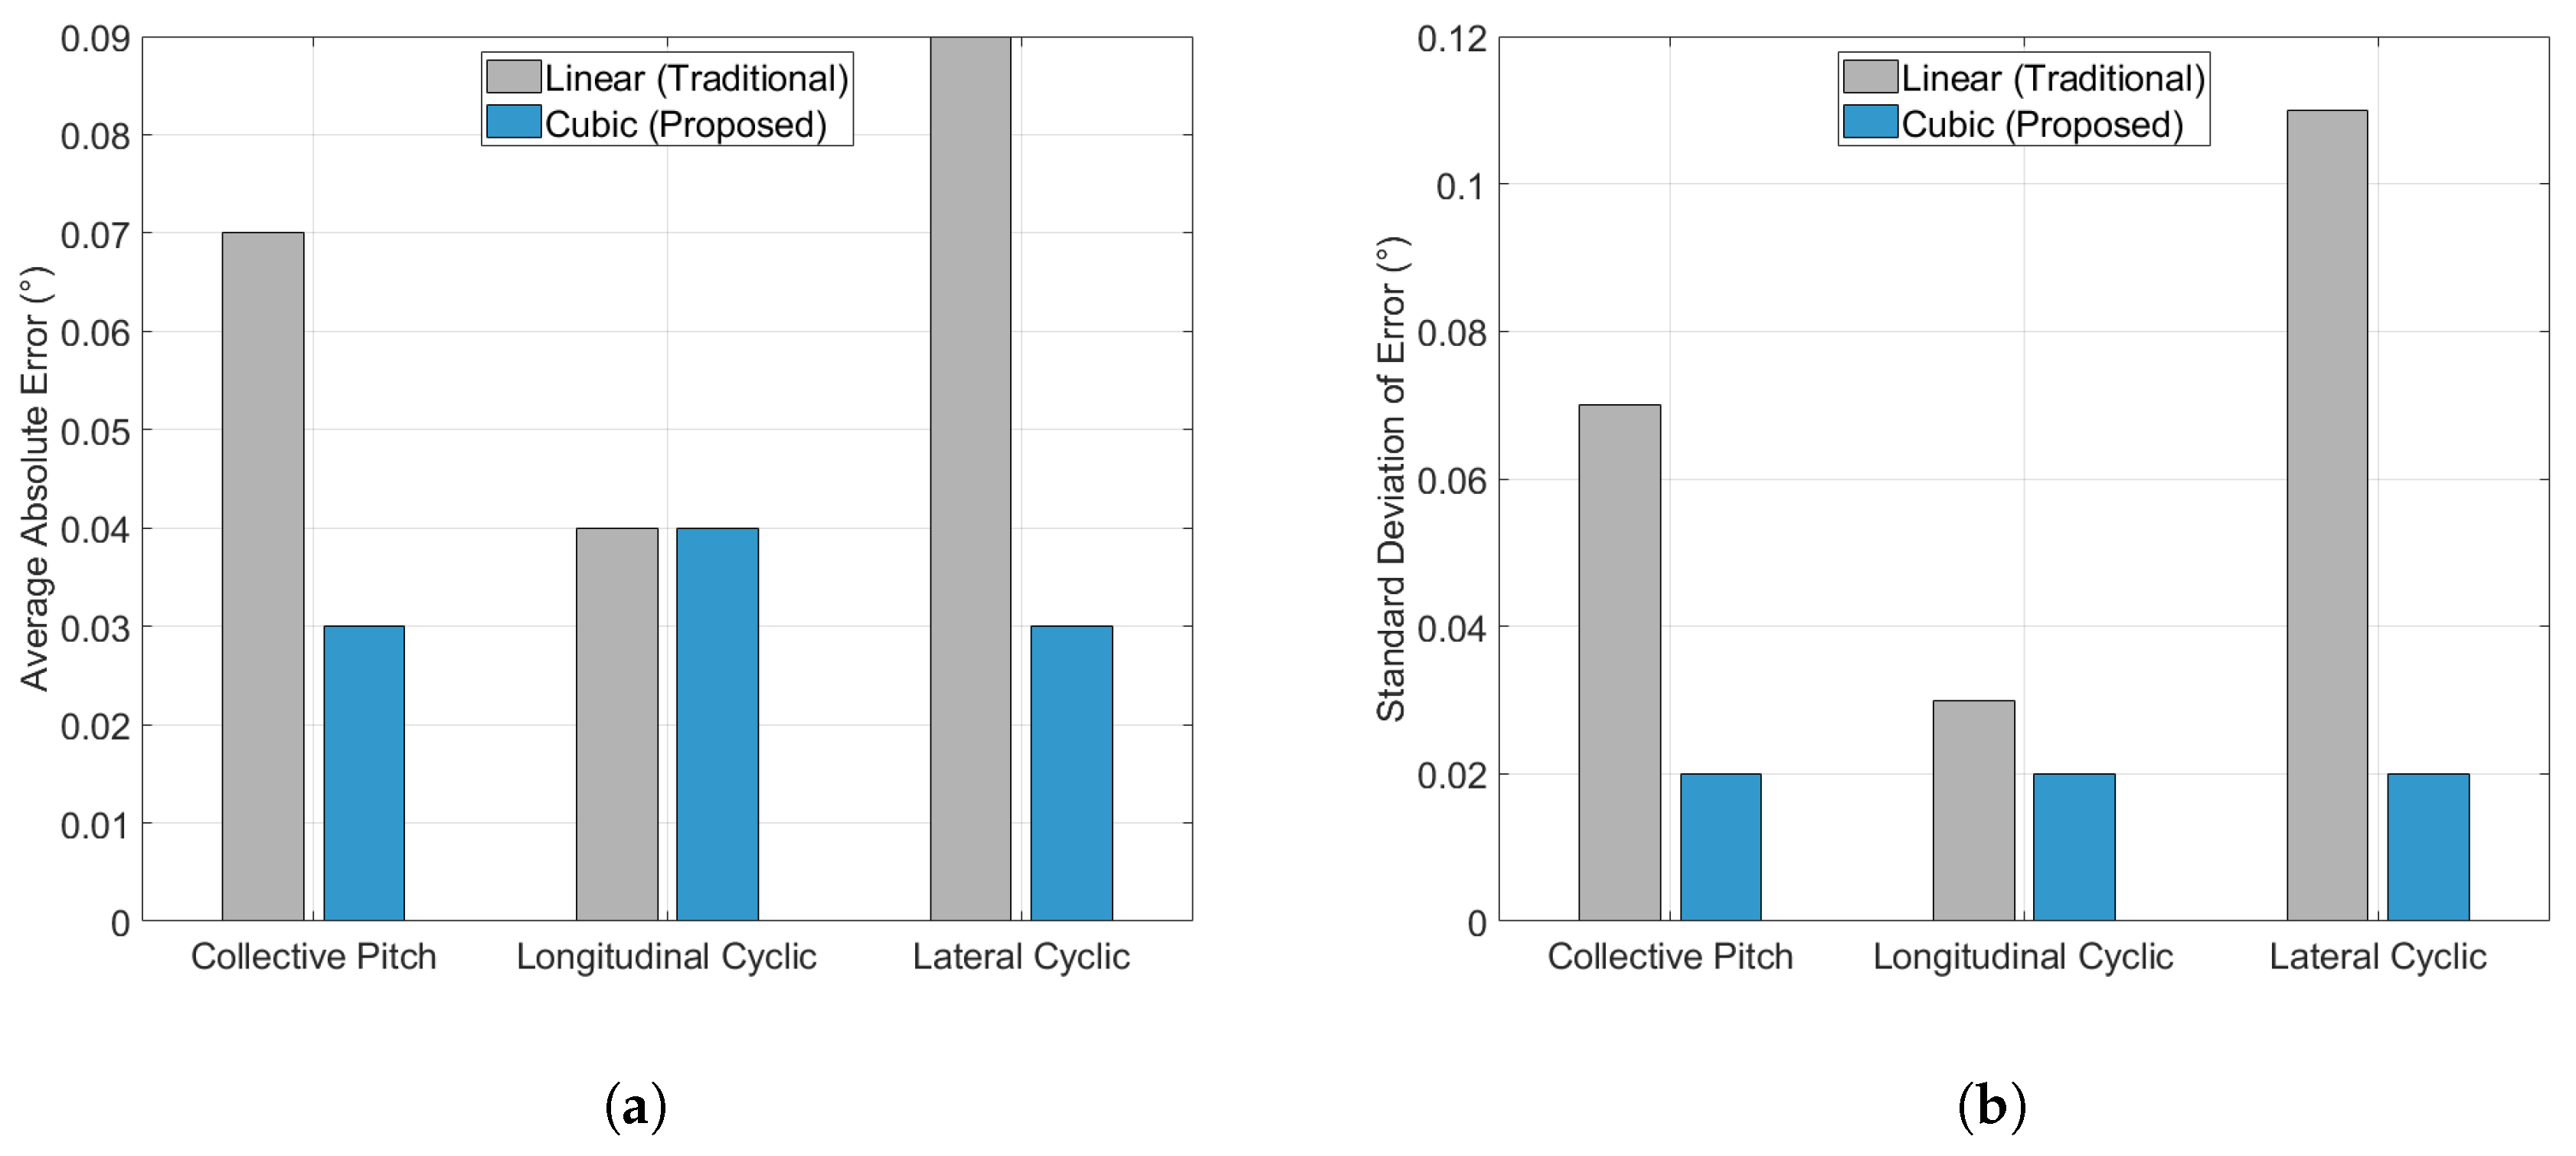
The findings, summarized graphically in
Figure 13, indicate that the improved algorithm consistently demonstrates lower average errors and standard deviations compared with the traditional method, highlighting a significant advancement in precision. Specifically, for the collective pitch, the improved algorithm achieves an average error of
, while the traditional method records an average error of
. Additionally, the standard deviation for the improved algorithm stands at
, which is markedly lower than the
associated with the traditional method.
In the context of a longitudinal cyclic pitch, both fitting methods produce identical average errors and standard deviations. Conversely, a significant difference is observed in lateral cyclic pitch, where the improved algorithm achieves an average error of , outperforming the traditional method’s . Additionally, the improved algorithm’s standard deviation of is superior to the traditional algorithm’s standard deviation of , further emphasizing its enhanced performance.
Overall, the experimental results substantiate that the improved cubic fitting algorithm reduces the error in collective pitch control by approximately 57% and in cyclic pitch control by about 33%. This substantial improvement underscores the algorithm’s effectiveness in minimizing errors and enhancing control precision, thereby significantly surpassing the earlier approaches. As indicated in the preceding sections, the precision of the sensors used in this study is . Given this fundamental limit in sensor accuracy, it is theoretically impossible for any algorithm to achieve an error reduction beyond this threshold. Therefore, the performance of the proposed algorithm represents the optimal achievable improvement within the constraints of the sensor precision.
Limitations and Future Work
While the proposed cubic fitting algorithm demonstrates superior performance under controlled calibration conditions, this study has certain limitations that define the scope of its current validation and point toward necessary future research.
Inherent constraints of sensor accuracy—The calibration accuracy is limited by the measurement resolution of the BWN425 dual-axis inclination sensors used. The error of the proposed cubic fitting algorithm has already approached this physical limit; future work may explore the integration of higher-precision sensors to verify whether further algorithm optimization is necessary and it is feasible to overcome this constraint.
Robustness to real-world variability—This study has not yet been fully adapted to the complex conditions of real operational scenarios: First, the interference of electrical noise and vibration on sensor readings was not considered, and subsequent work needs to introduce digital filtering techniques, such as Kalman filtering, in pitch angle data processing to improve the anti-interference capability. Second, the study assumed ideal behavior of actuators and linkages, without addressing the degradation of the model accuracy caused by actuator backlash or swash plate bearing wear; developing an online or periodic recalibration strategy to compensate for such gradual temporal drift will be a valuable extension of this work.
7. Conclusions
This study successfully addresses the critical calibration challenge for large-stroke pitch control in a tiltrotor aircraft. The main results achieved with our approach are threefold:
- 1.
We developed a novel multivariate cubic matrix regression algorithm that explicitly captures the inherent geometric nonlinearities of the swashplate mechanism under large strokes, which are neglected by traditional linear models used for conventional helicopters.
- 2.
Experimental validation demonstrates that our algorithm delivers a substantial improvement in precision, reducing the collective pitch error by 57% and the lateral cyclic pitch error by 33% compared with the traditional linear fitting method. The achieved accuracy is at the physical limit of our sensor resolution (), representing the optimal performance attainable with the current experimental setup.
- 3.
Beyond the algorithm itself, we have established a complete, efficient, and low-cost calibration framework that integrates precise measurement, data processing, and model solving, which is readily applicable in field settings.
From an engineering application perspective, this method offers notable advantages:
Economy: Compared with traditional high-precision equipment, such as photogrammetric devices and coordinate measuring arms, the system reduces costs by over 80% and minimizes labor through automated CAN bus data transmission.
Efficiency: The automated calibration process shortens the time for a single calibration to less than 30 min. The real-time computation complexity of the deployed fitting formula is , satisfying dynamic response requirements.
Notably, the core value of this method lies in its universality for three-actuator pitch control systems: whether for aerial tiltrotors, conventional helicopters, multirotor UAVs, or propellers of underwater unmanned submersibles, as long as they adopt a three-actuator pitch control structure, high-precision calibration can be achieved through the “measurement–fitting–verification” framework. This method provides a universal solution for the calibration of multi-input, multi-output nonlinear systems across domains.
Future research can focus on optimizing the algorithmic adaptability in dynamic measurement scenarios and exploring environmental factors’ impacts on fitting accuracy to enhance the robustness in complex working conditions.
