Article

Air Traffic Complexity Analysis in Multi-Airport Terminal Areas Based on Route Segment–Flight State Interdependent Network

1
Air Traffic Control and Navigation School, Air Force Engineering University, Xi’an 710051, China
2
Unit 94188 of the PLA, Xi’an 710077, China
*
Author to whom correspondence should be addressed.
Aerospace 2025, 12(9), 839; https://doi.org/10.3390/aerospace12090839
Submission received: 24 June 2025 / Revised: 11 September 2025 / Accepted: 15 September 2025 / Published: 17 September 2025
(This article belongs to the Section Air Traffic and Transportation)

Abstract

An analysis of air traffic complexity in multi-airport terminal areas can assist air traffic controllers in accurately assessing the air traffic situation and collaboratively managing air traffic flows, thereby enhancing the utilization of airspace resources and reducing flight delays. This paper proposes an air traffic complexity analysis method for multi-airport terminal areas based on a route segment–flight state interdependent network. The interdependent network model consists of an upper-layer flight state network, a lower-layer route segment network, and inter-layer coupling edges. The upper-layer network is constructed with aircraft as nodes and flight conflicts between aircraft as edges. The lower-layer network uses route segments as nodes and the connectivity between route segments as edges. The inter-layer coupling edges are determined by evaluating the relationship between aircraft and route segments—if an aircraft is on a specific route segment, a coupling edge exists between the corresponding aircraft node and route segment node. Based on this model, node-level complexity metrics are established to analyze the importance and complexity of individual route segments. Additionally, network-level complexity metrics are introduced to assess the overall air traffic complexity in multi-airport terminal areas. Finally, the method proposed in this paper is validated using flight scenarios in the Guangdong–Hong Kong–Macao Greater Bay Area. By comparing and analyzing the results with the actual situation, it is shown that the proposed method can accurately assess the air traffic complexity in multi-airport terminal areas.

1. Introduction

Multi-airport terminal areas refer to designated controlled airspace regions that encompass multiple airports within a certain geographic area. These regions are characterized by interconnected surrounding airspace and overlapping traffic flows, where flight operations such as departures, arrivals, and related flight activities are organized and managed. The complexity of terminal airspace structures involving multiple airports is marked by high intricacy, large flight volume, and complex conflict situations among aircraft. Analyzing the air traffic complexity in such areas helps to improve airspace resource utilization and reduce flight delays, and it provides a scientific basis for airspace resource allocation, controller strategy formulation, and safety risk management, thereby ensuring the stable operation of high-density flight flows. Consequently, the analysis of air traffic complexity in multi-airport terminal zones has become a key research focus in academia and industry.
Currently, research on air traffic complexity mainly concentrates on three aspects: (1) complexity analysis based on Air Traffic Control (ATC) cognition, (2) analysis from the traffic situation perspective, and (3) complexity analysis using complex network theory. In the field of ATC cognitive complexity, Histon et al. [1] pioneered the concept of cognitive complexity, laying a solid foundation for in-depth structural analysis of control cognition. Subsequently, Cong et al. [2], from the dimensions of structural and operational features, established a multi-dimensional indicator system for sector complexity and employed K-means clustering to analyze the complexity across multiple sectors. However, cognitive complexity assessments are primarily based on controller workload, making them susceptible to human factors. To reduce subjective influence, recent studies have shifted towards analyzing air traffic complexity from the perspective of traffic situation. Zhang et al. [3] focused on disorder and disturbances within two-dimensional airspace traffic flows, evaluating inherent traffic flow complexity to accurately depict air traffic operational conditions. Cao et al. [4] incorporated machine learning models to explore the intrinsic relationship between operational complexity factors and sector complexity, training on multi-indicator datasets to evaluate sector complexity levels. Wen et al. [5] proposed a spatio-temporal hybrid deep learning model that leverages spatial and temporal features related to complexity data for sector complexity prediction.
With advances in machine learning, there are more options for analyzing air traffic complexity. However, the selection of complexity indicators remains largely unchanged, primarily extracting factors from a macroscopic traffic flow perspective. Complex systems, particularly complex network theories, have been increasingly used to describe air traffic complexity in recent years, offering an effective research approach. Complex network modeling abstracts nodes and their relationships within complex systems. Wang et al. [6,7,8] proposed constructing weighted conflict networks with aircraft as nodes and flight connections as edges, using network metrics like node degree and connectivity rate to assess local and overall airspace complexity. Wu et al. [9,10,11] built flight state networks with aircraft as nodes and communication relations via airborne collision avoidance systems (ACASs) as edges, utilizing metrics such as node strength, average clustering coefficient, and betweenness centrality to describe dynamic traffic conditions, as well as employing principal component analysis (PCA), factor analysis, and entropy weighting to monitor airspace trends and identify key nodes—effectively reducing subjective bias and enhancing precision in complexity recognition. Bi et al. [12], building on these studies, optimized flight state networks using velocity obstacle methods to preempt potential conflicts, aiding controllers in early detection of conflicts and area complexity.
However, existing complex network models are primarily limited to single-layer topological analyses and focus on relationships between a single factor. Air traffic complexity is inherently a multi-factor, cross-system issue. Multi-layer networks can better characterize this complexity, and the emergence of interdependent network theory provides new avenues for research. Buldyrev et al. [13] first introduced interdependent network theory, establishing a simple interdependent network model to analyze coupled system relationships. Shao et al. [14] proposed a one-to-many interdependent network model based on inter-layer coupling. Wang et al. [15,16,17] constructed static interdependent air traffic networks with airports, air routes, and control sectors as sub-networks, studying structural vulnerabilities, failure propagation mechanisms, and relationships between network resilience, topology, and traffic flow. Li et al. [18,19] developed coupled interdependent models of control networks and flight state networks, reflecting interactions between controllers and aircraft, and systematically analyzed the characteristics and evolution processes of such networks.
This paper aims to solve the problem of identifying and evaluating the complexity of air traffic in multi-airport terminal areas. To improve the utilization efficiency of airspace resources and reduce flight delays, this paper constructs a route segment–flight state interdependent network model and uses the complexity indicators of nodes in this model to reflect the air traffic situation.
Different from most existing methods based on single-layer network analysis, the interdependent network model constructed in this paper can simultaneously consider the mutual influence between aircraft operating states and route structures, effectively making up for the deficiencies of traditional methods in this regard. Currently, most existing complex network models conduct complexity analysis based on free flight. However, under China’s current air traffic control system, aircraft need to fly along established air routes.
In view of this, this paper takes the aircraft and route segments above the multi-airport terminal area as nodes to construct an interdependent network model that is more suitable for China’s operating environment, thus enabling a more accurate reflection of the air traffic situation.

2. Dependence Network Construction

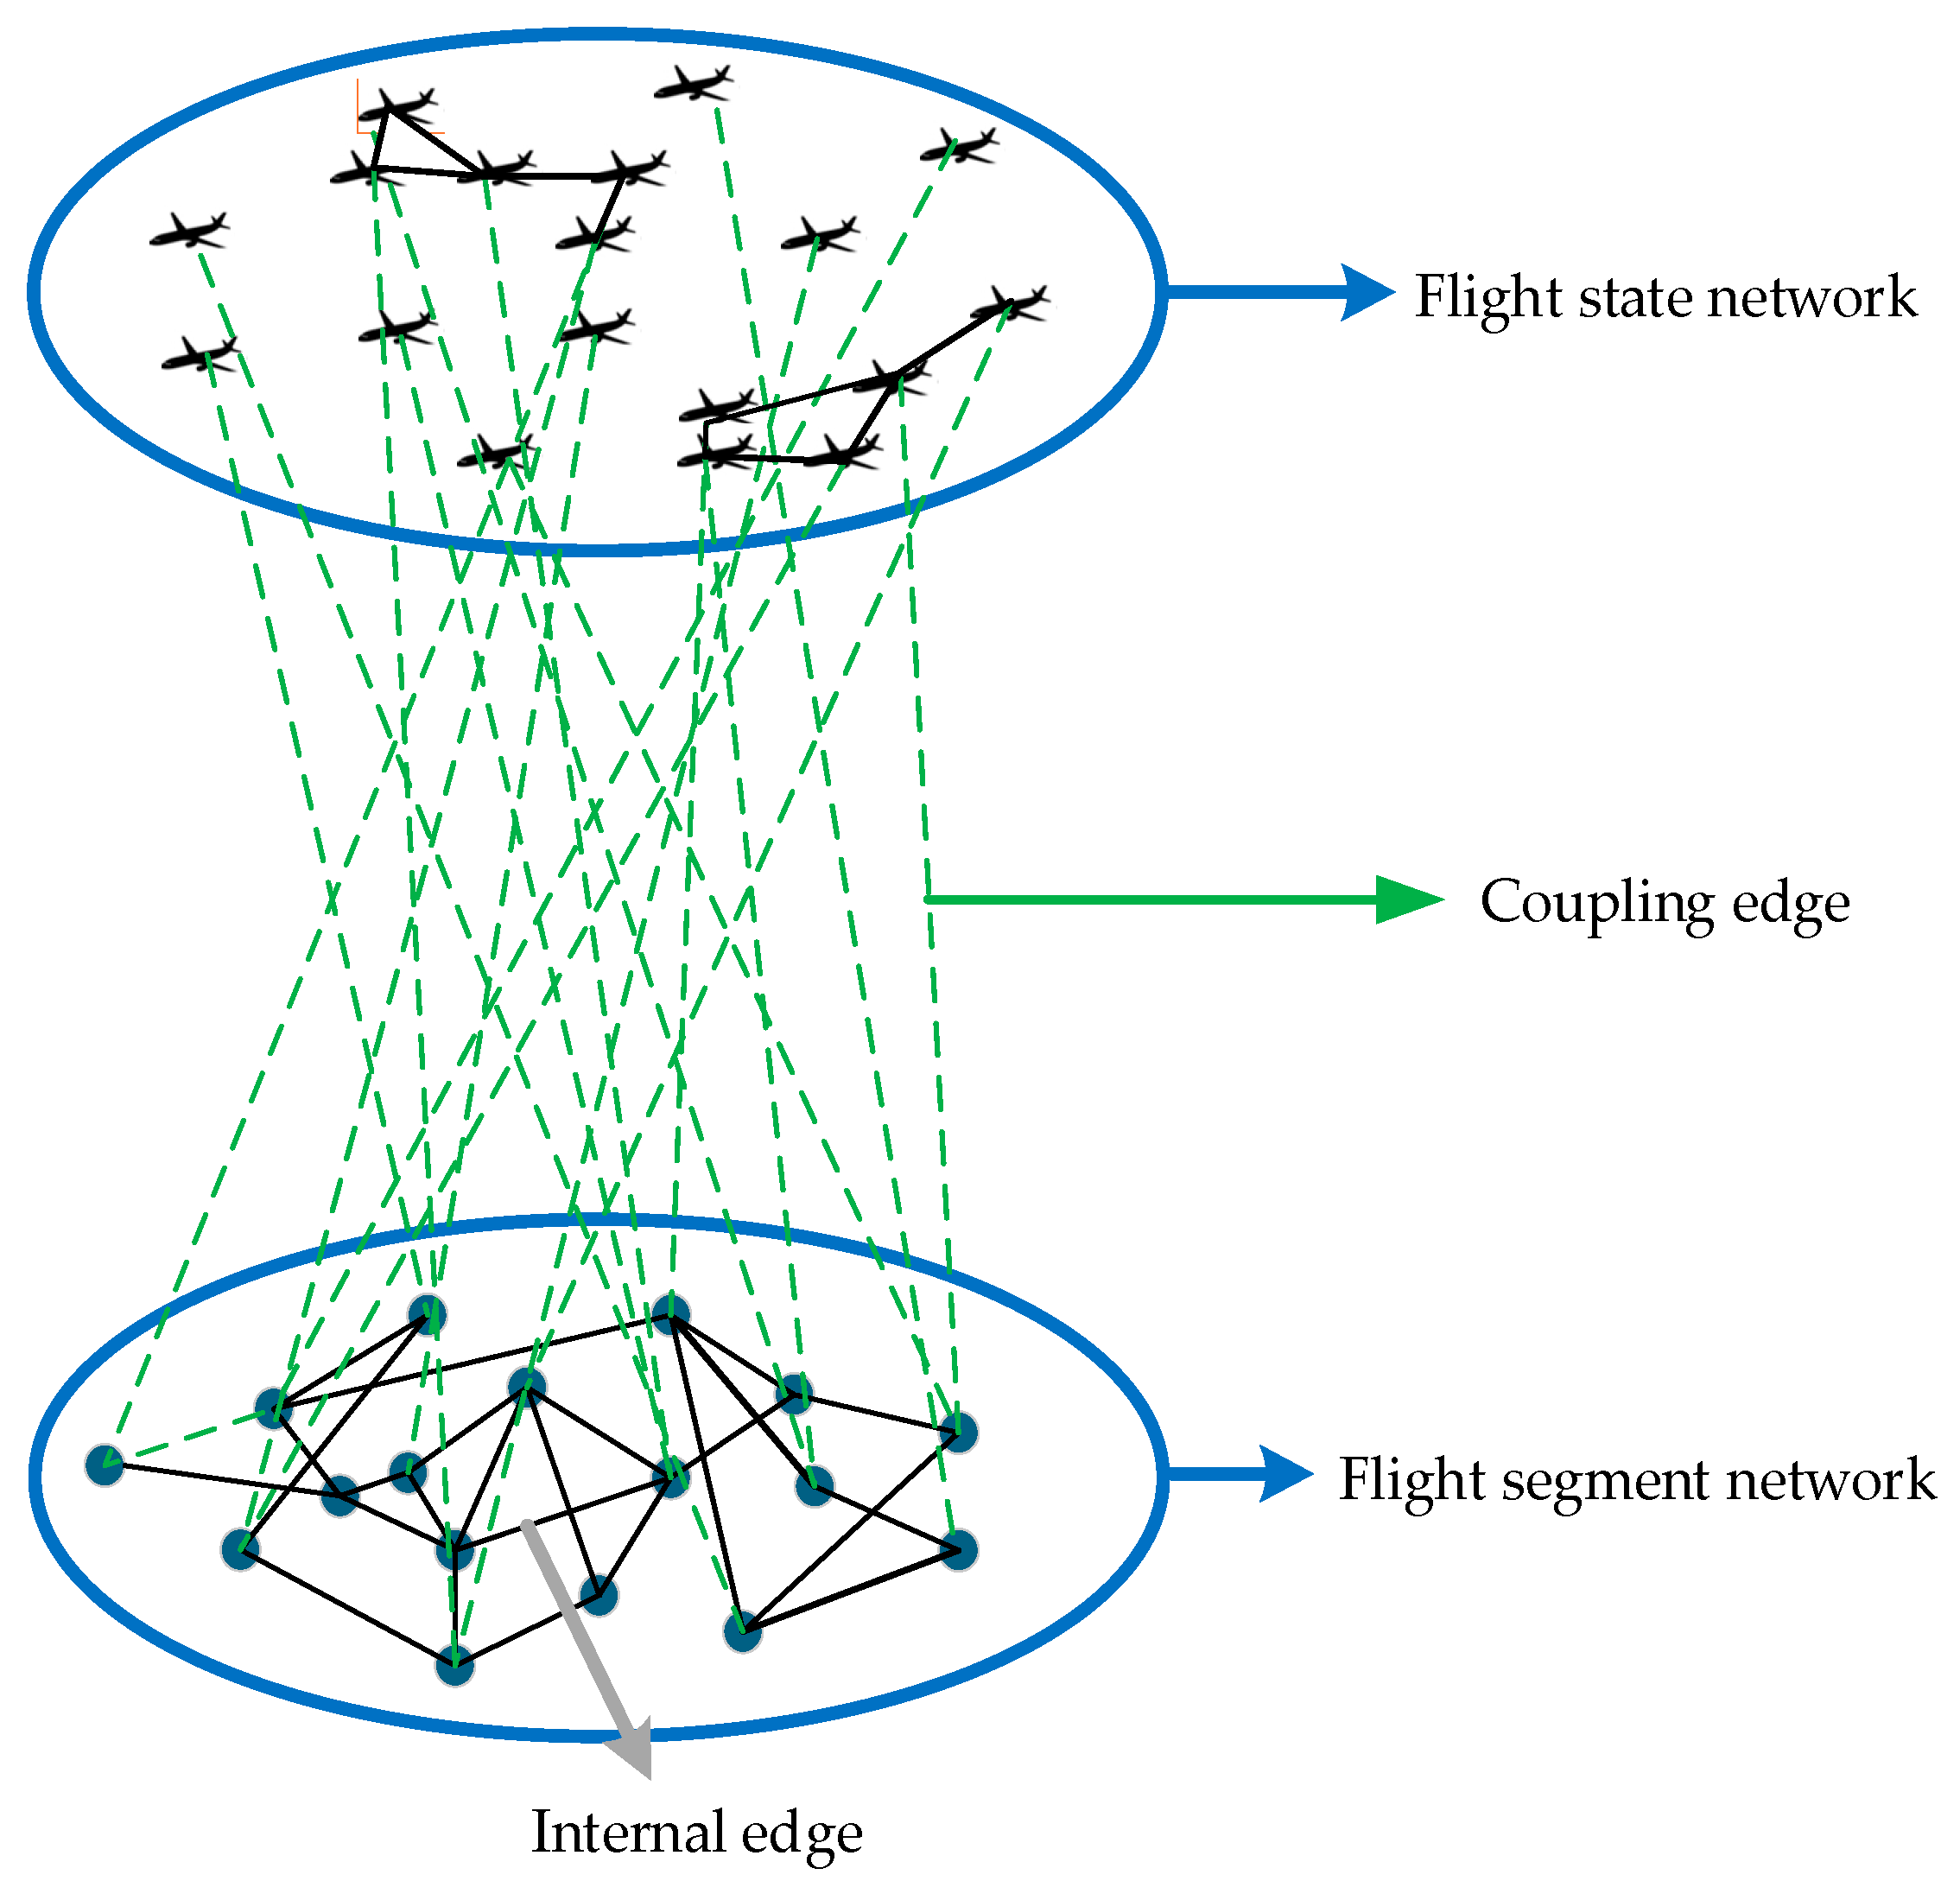
The segment–flight status interdependent network consists of two sub-networks: the upper-layer flight status network and the lower-layer segment network, as shown in Figure 1.
In this study, the upper layer of the interdependent network is constructed by representing aircraft as nodes and conflict relationships between aircraft as edges; the lower layer is built by taking flight segments as nodes and the connectivity between segments as edges. Interlayer coupling edges are used to connect aircraft nodes with flight segment nodes, thereby forming the segment–flight status interdependent network model.

2.1. Flight Status Network

As an upper-level network model in dependency network structures, the Flight Status Network is constructed with aircraft operating along flight segments as network nodes and conflict relationships between aircraft as edges. This network construction method draws on the flight state network theory proposed by Wu et al. [9,10,11]. However, in terms of the conflict determination criteria, the relevant regulations of the Civil Aviation Administration of China are adopted.
An air traffic conflict refers to a situation in which two or more aircraft are flying within the same time and spatial range, and the distance between them is less than the established safety separation. The main causes of air traffic conflicts include limited airspace resources, complex and variable weather conditions, human operational errors, and navigation equipment failures, all of which can affect the normal operation of aircraft and the maintenance of safe separation.
Article 251 of the Civil Aviation Air Traffic Management Rules in the standards of the Civil Aviation Administration of China (CAAC) stipulates that under procedural control conditions, the minimum horizontal separation between aircraft should be 20 km. If the horizontal separation is less than the specified value and the vertical separation is less than 300 m, it is considered that there is a flight conflict between the two aircraft. Therefore, we believe that if the horizontal distance between two aircraft is less than 20 km and the vertical separation is less than 300 m, it indicates that there is a potential flight conflict between them.
In the Flight Status Network, the weight of edges accounts for the urgency of flight conflicts. The closer the distance between two aircraft, the higher the degree of conflict and, thus, the greater the edge weight. To prevent excessively large weights, the weight is normalized within the range [0, 1]. Specifically, as the distance between two aircraft approaches zero, the weight approaches 1; when the distance approaches 20 km, the weight approaches 0; and when the distance is greater than or equal to 20 km, the weight is 0. This weight calculation method refers to the normalization processing method adopted by Zhang et al. [3] in the evaluation of traffic flow complexity. The formula for calculating the edge weight is:
w i j   =   1     e 1     20 D i j 0   <   D i j   <   20 0   D i j     20 .
where i and j represent aircraft nodes i and j, respectively, and the distance between aircraft node i and aircraft node j is denoted as   D i j .

2.2. Flight Segment Network

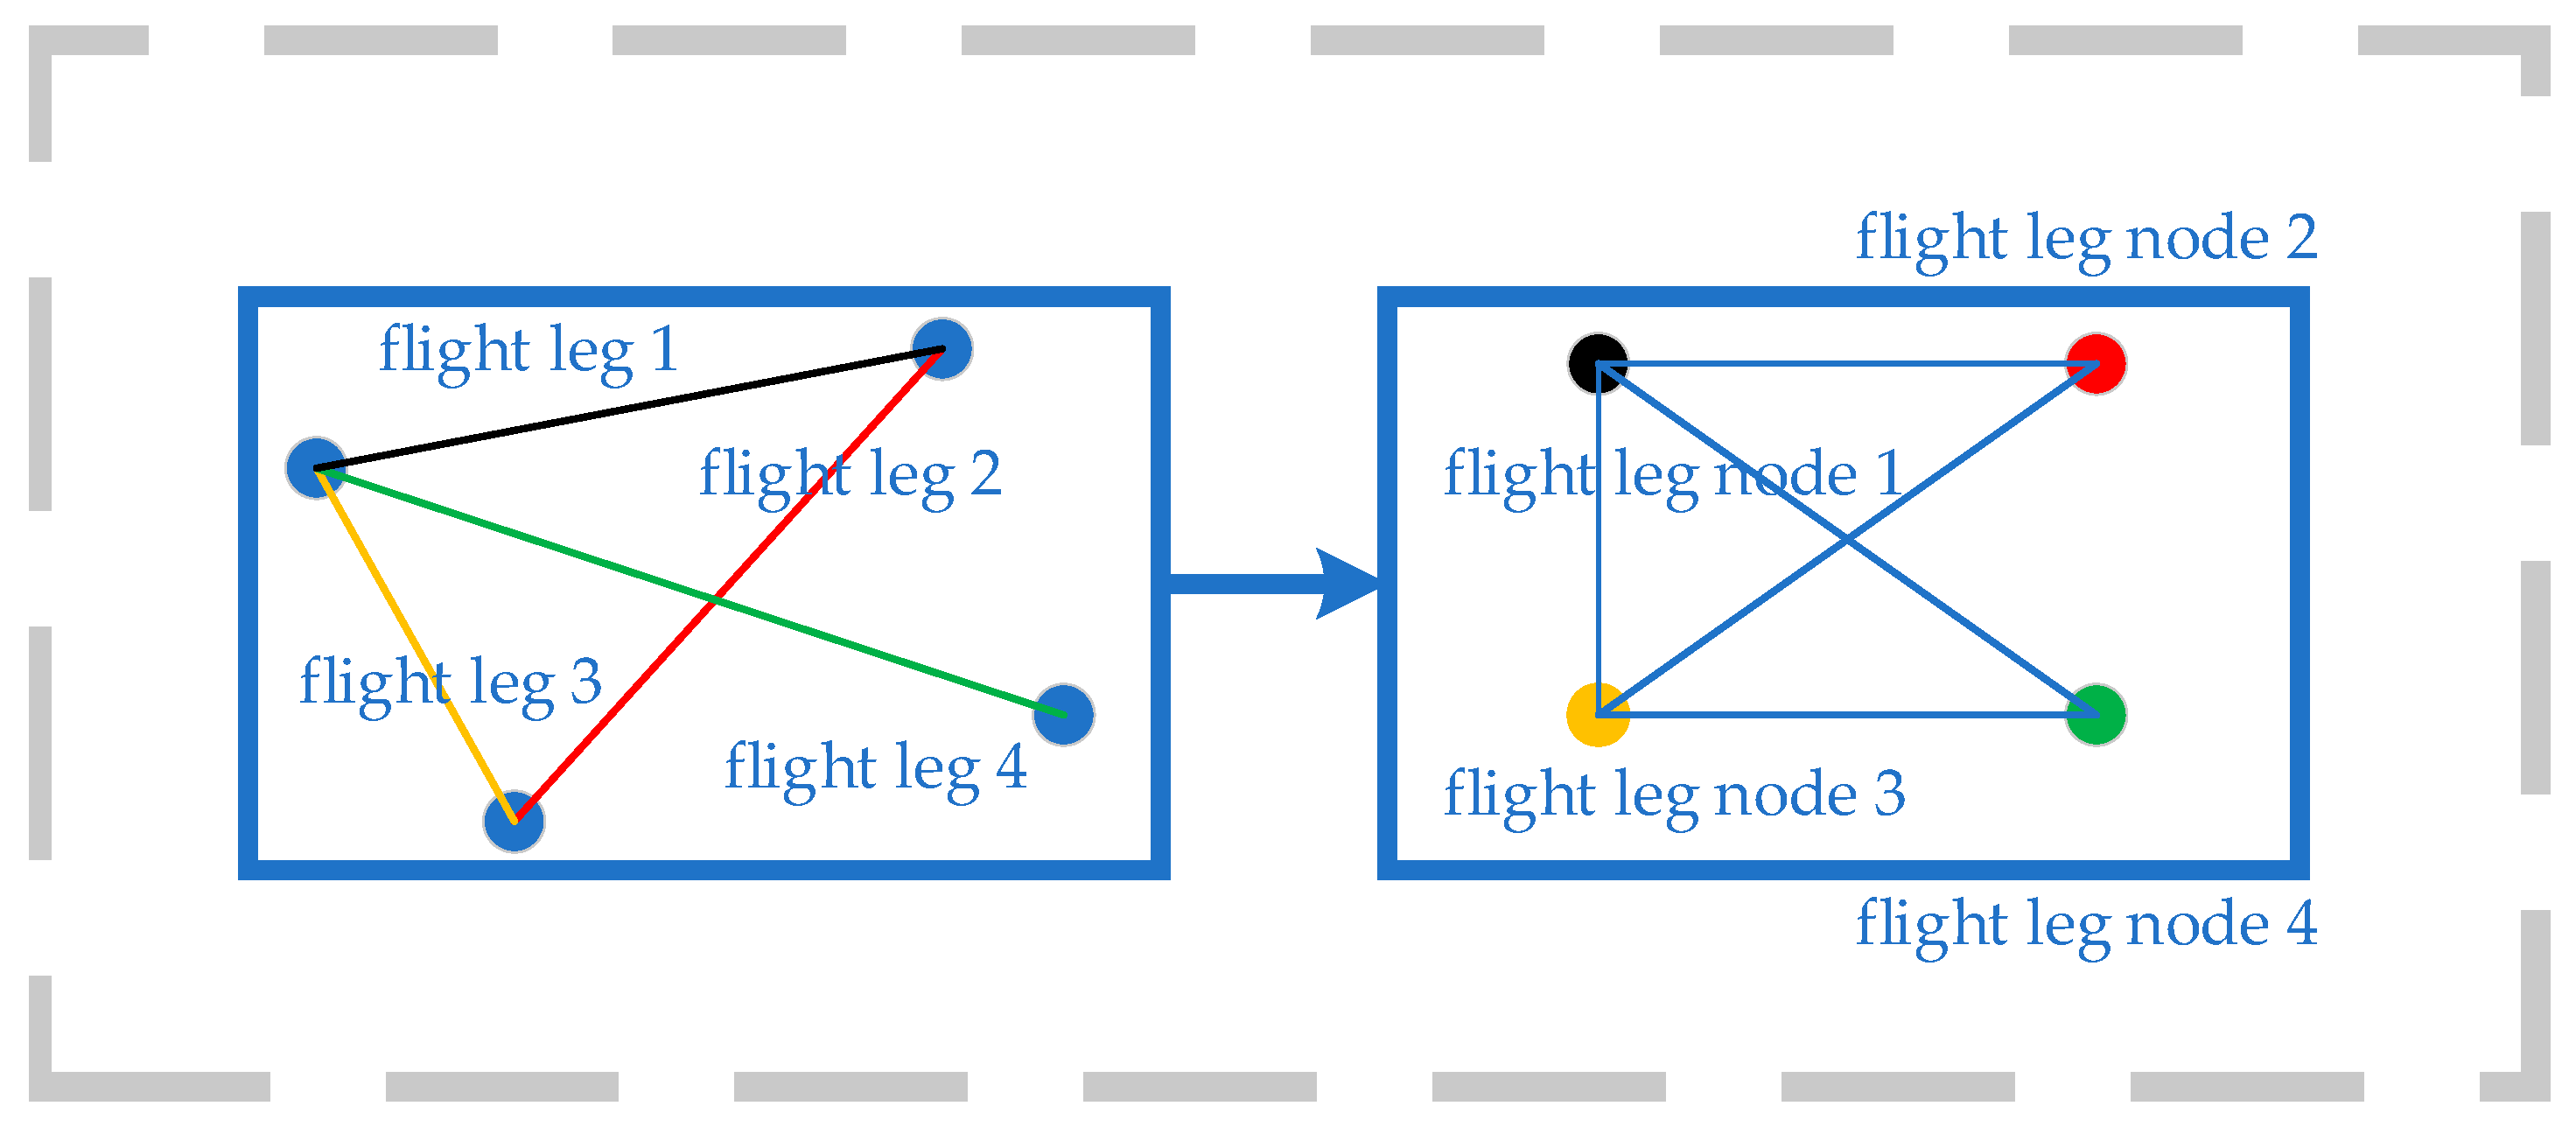
As the lower-level network in the dependency network model, the Flight Segment Network is constructed with flight segments as nodes, and the connections between segments (presence of waypoints between two segments) as edges. Therefore, the Flight Segment Network is an undirected and unweighted network. The schematic diagram of the Flight Segment Network is shown in Figure 2.
The left half of the figure is a schematic diagram of the air segments, and the right half is a schematic diagram of the route network. For example, in the left diagram, Air Segment 1 is connected to Air Segments 2, 3, and 4; consequently, in the right diagram, the route node 1 is connected to route nodes 2, 3, and 4 via edges.

2.3. Interlayer Coupling Edges

If an aircraft is flying on a certain air segment, there is an edge connecting the aircraft node and the air segment node; this edge is called an interlayer coupling edge. The concept of this kind of coupling edge originates from the one-to-many interdependent network model theory proposed by Shao et al. [14]. Interlayer coupling edges connect air segment nodes in the route network with aircraft nodes in the flight status network. The schematic diagram of interlayer coupling edges is shown in Figure 3.
In Figure 3, aircraft numbered 1 to 3 are on air segment 4, while aircraft numbered 4 to 6 are on air segment 2. From this, it follows that there are edges connecting aircraft nodes 1–3 to the flight segment node 4, and edges connecting aircraft nodes 4–6 to the flight segment node 2.
The idea of designing the weight of the coupling edge draws on the relevant methods for node importance evaluation in the complex network theory of Wu et al. [9,10,11]. When setting the weights of the interlayer coupling edges, considerations include the proportion of the distance the aircraft flies over in the segment relative to the total length of that segment. The larger this proportion, the more likely the aircraft will exit the segment, which reduces the aircraft’s influence and importance concerning that segment. Consequently, the weight value of the aircraft on the segment decreases.
Based on this reasoning, the calculation formula for the weights of the interlayer coupling edges is:
w i m = ( D m d i m ) / D m .
Let i represent aircraft node i and m represent air segment node m. dim denotes the flying distance of aircraft i on segment m, and Dm represents the total length of segment m.
Since flight conflicts are critical for air traffic controllers and segment operations, the consideration of interlayer coupling edge weights should account not only for the aircraft’s position progress on the segment but also for potential flight conflicts. Let K be the conflict multiplier (which can be modified based on the scenario). This idea of conflict weighting is also reflected in the research of Wu et al. [9,10,11]. If aircraft node i experiences a flight conflict, then the weight of the edge connecting aircraft node i to segment node m is given by the formula:
w i m = K ( D m d i m ) / D m .
Based on the above analysis, if the aircraft node i flies at segment node m, then there is an edge between the aircraft node i and the segment node m. This edge is referred to as an inter-layer coupling edge. The weight calculation formula for the coupling edge is as follows:
w i m   =   D m     d i m / D m ,             flying   conflict K D m     d i m / D m ,         no   flying   conflict .

3. Construction of an Interdependent Network of Multi-Airport Terminal Areas in Guangdong–Hong Kong–Macao

This paper selects the practical scenarios of multiple airport terminal areas in the Guangdong–Hong Kong–Macao Greater Bay Area to validate and analyze the interdependent network model. The Guangdong–Hong Kong–Macao Greater Bay Area is composed of three core airports—Hong Kong, Guangzhou, and Shenzhen—as well as other important airports such as Macau and Zhuhai. Within the multiple airport terminal areas, flight route density is high, and complex relationships exist.
On normal operation days (without interference from the pandemic or special control measures), the total number of inbound and outbound flights at the core airports in the Guangdong–Hong Kong–Macao Greater Bay Area (Guangzhou Baiyun, Shenzhen Bao’an, Hong Kong International, Zhuhai Jinwan, and Macao International) is approximately 2500–3000 flights per day. Most of these flights experience route intersections and overlapping arrival and departure paths in the terminal area.
The peak hours for route operations are from 08:00 to 11:00 (morning peak) and from 17:00 to 21:00 (evening peak). During these two periods, the density of aircraft on the terminal area routes increases significantly, and the risk of conflicts rises. The average length of the route segments is about 20–40 km, with the shortest being less than 15 km and the longest about 60 km.
In this paper, a “route segment” refers to the section of the route connecting two waypoints, similar to the “jet airways” internationally. All the route segments in this paper are derived from the route charts issued by the Civil Aviation Administration of China and are part of the fixed route system. All civil aviation flights in this airspace operate in accordance with Instrument Flight Rules (IFR).
Taking the actual air traffic data of the case in this paper as an example, during peak hours, the horizontal relative positions of aircraft within the route segments are often less than 20 km, and the vertical separation of some aircraft is less than 300 m. There are numerous potential conflict threats, which are exactly the operating states that the indicators proposed in this paper aim to capture and quantify.
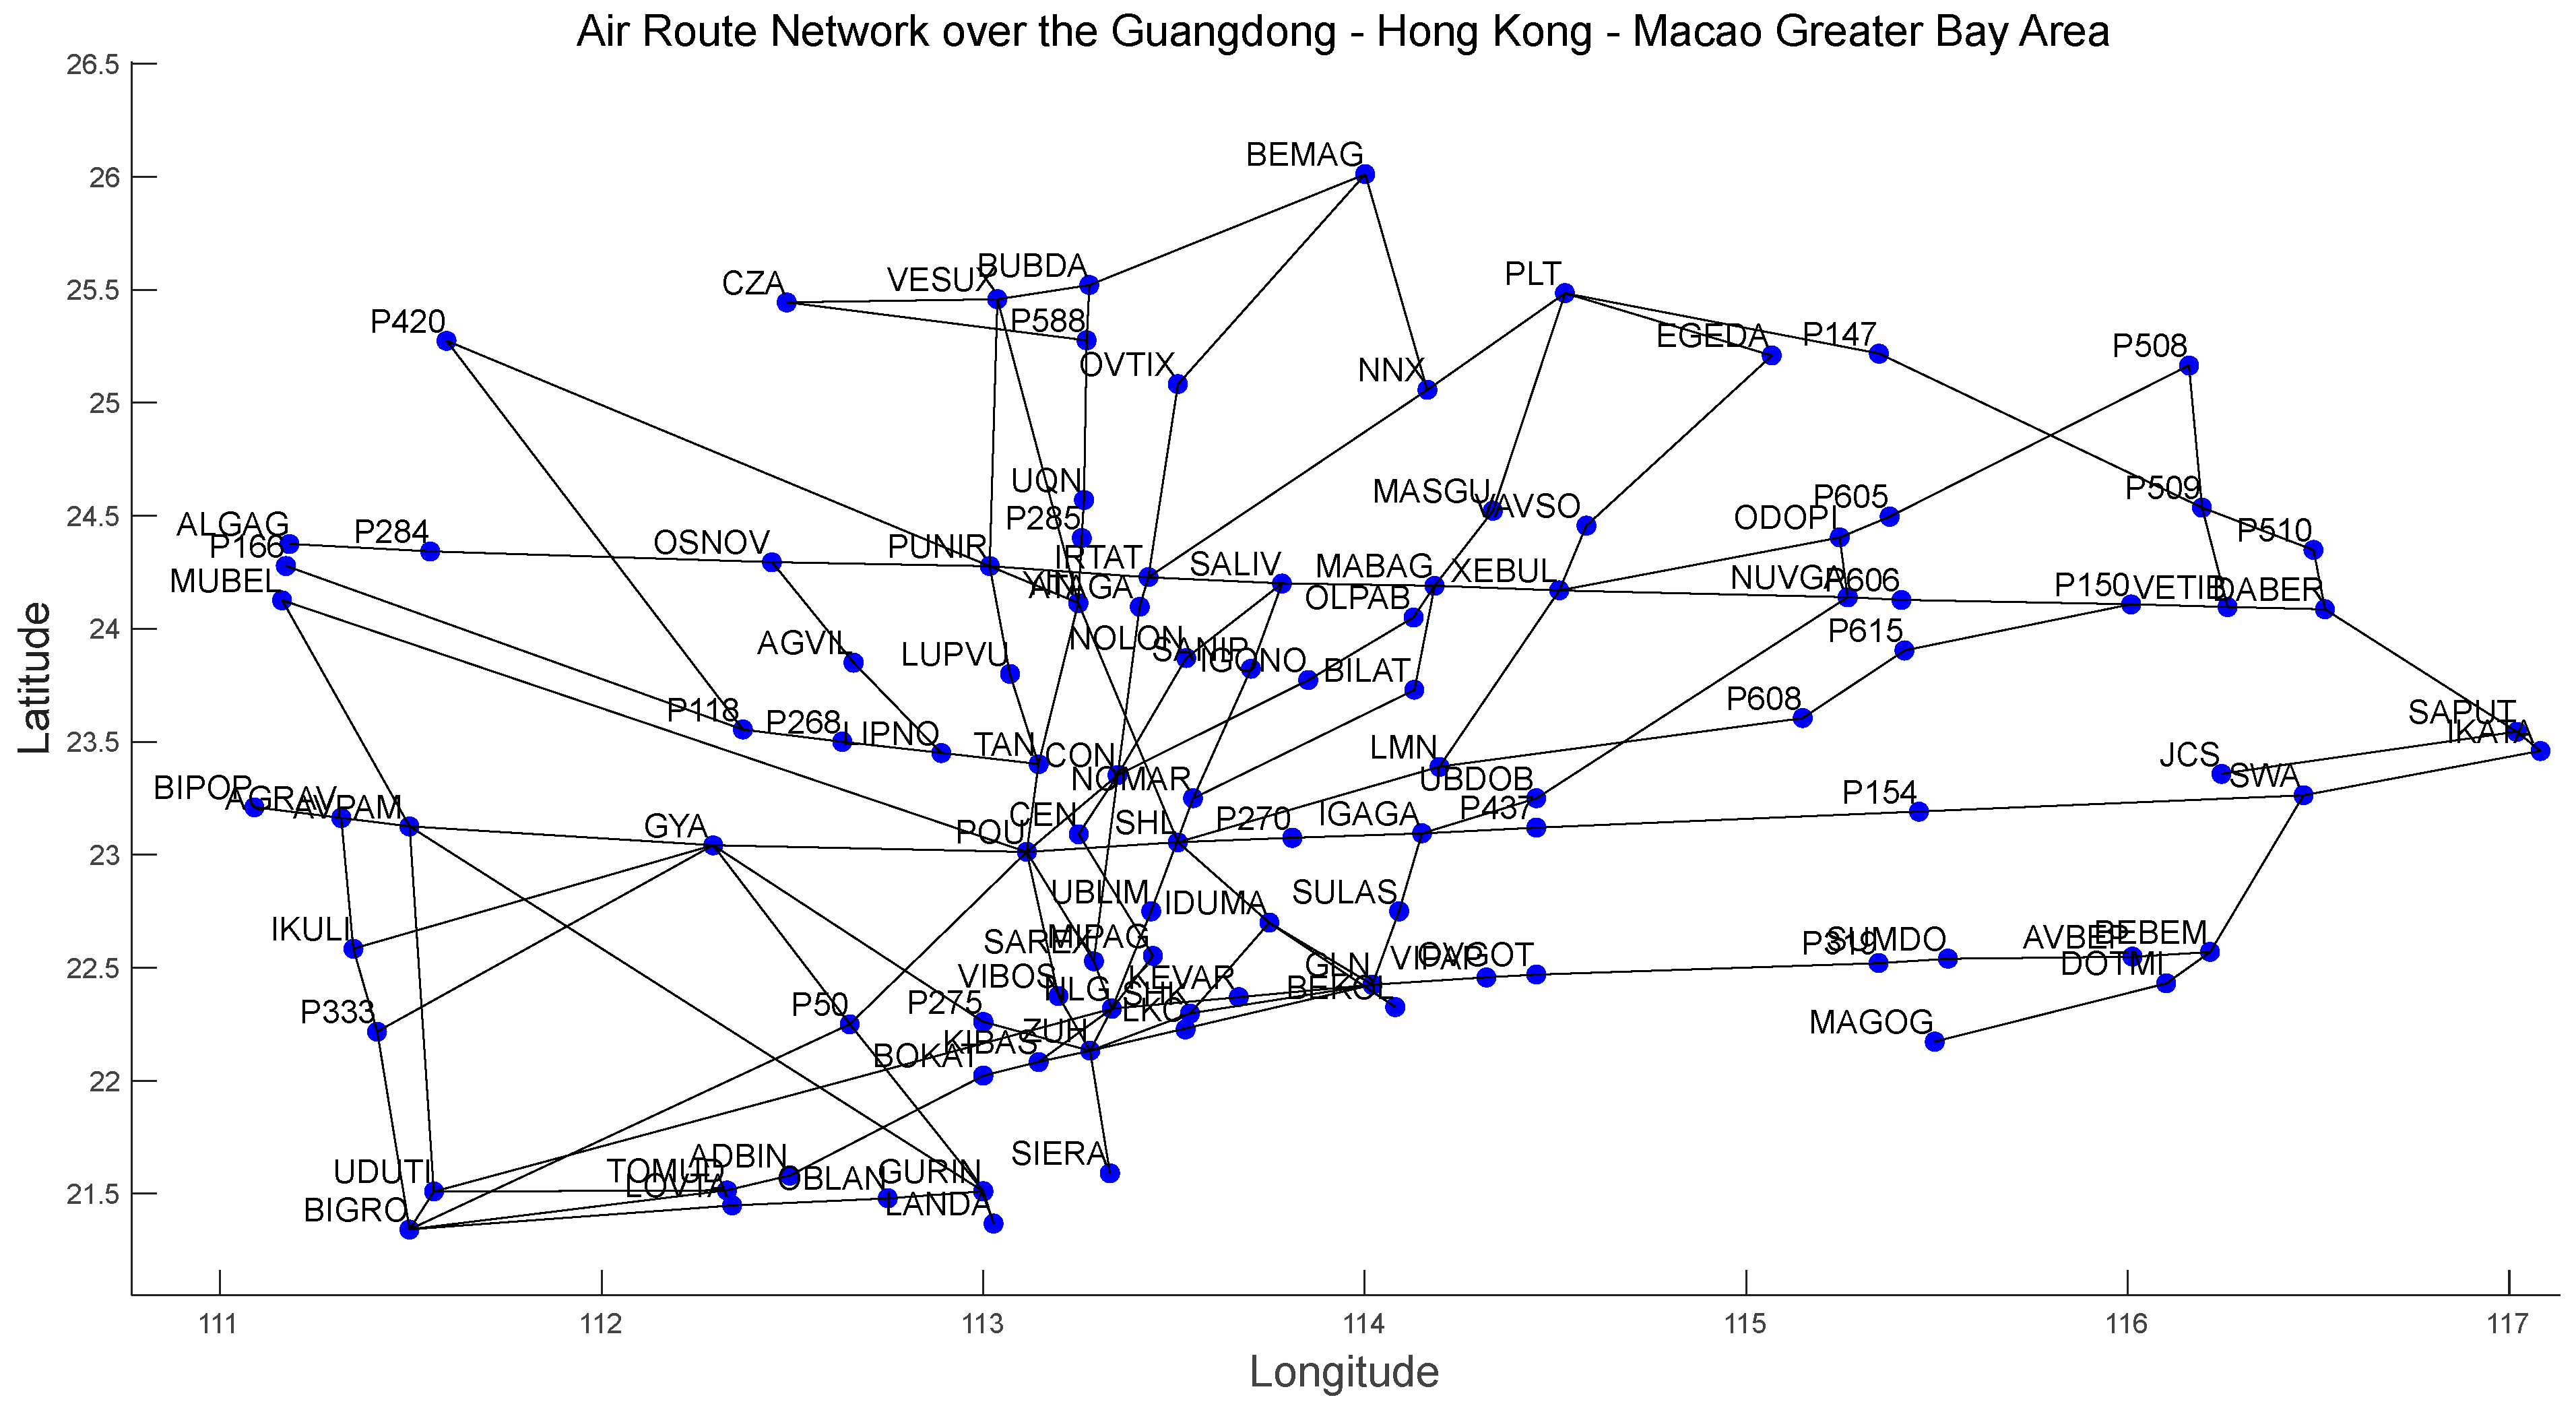
According to the aeronautical charts published by the Civil Aviation Administration of China on 1 August 2023, we identified the navigation points and their longitude and latitude over the airspace of the multiple airport terminal areas in the Greater Bay Area, along with their connectivity relationships. The resulting airway map over the Greater Bay Area is shown in Figure 4, which contains a total of 148 segments. The blue dots represent the navigation points in the airspace of the Greater Bay Area, the black lines denote the flight segments, and the labels are the names of the navigation points.
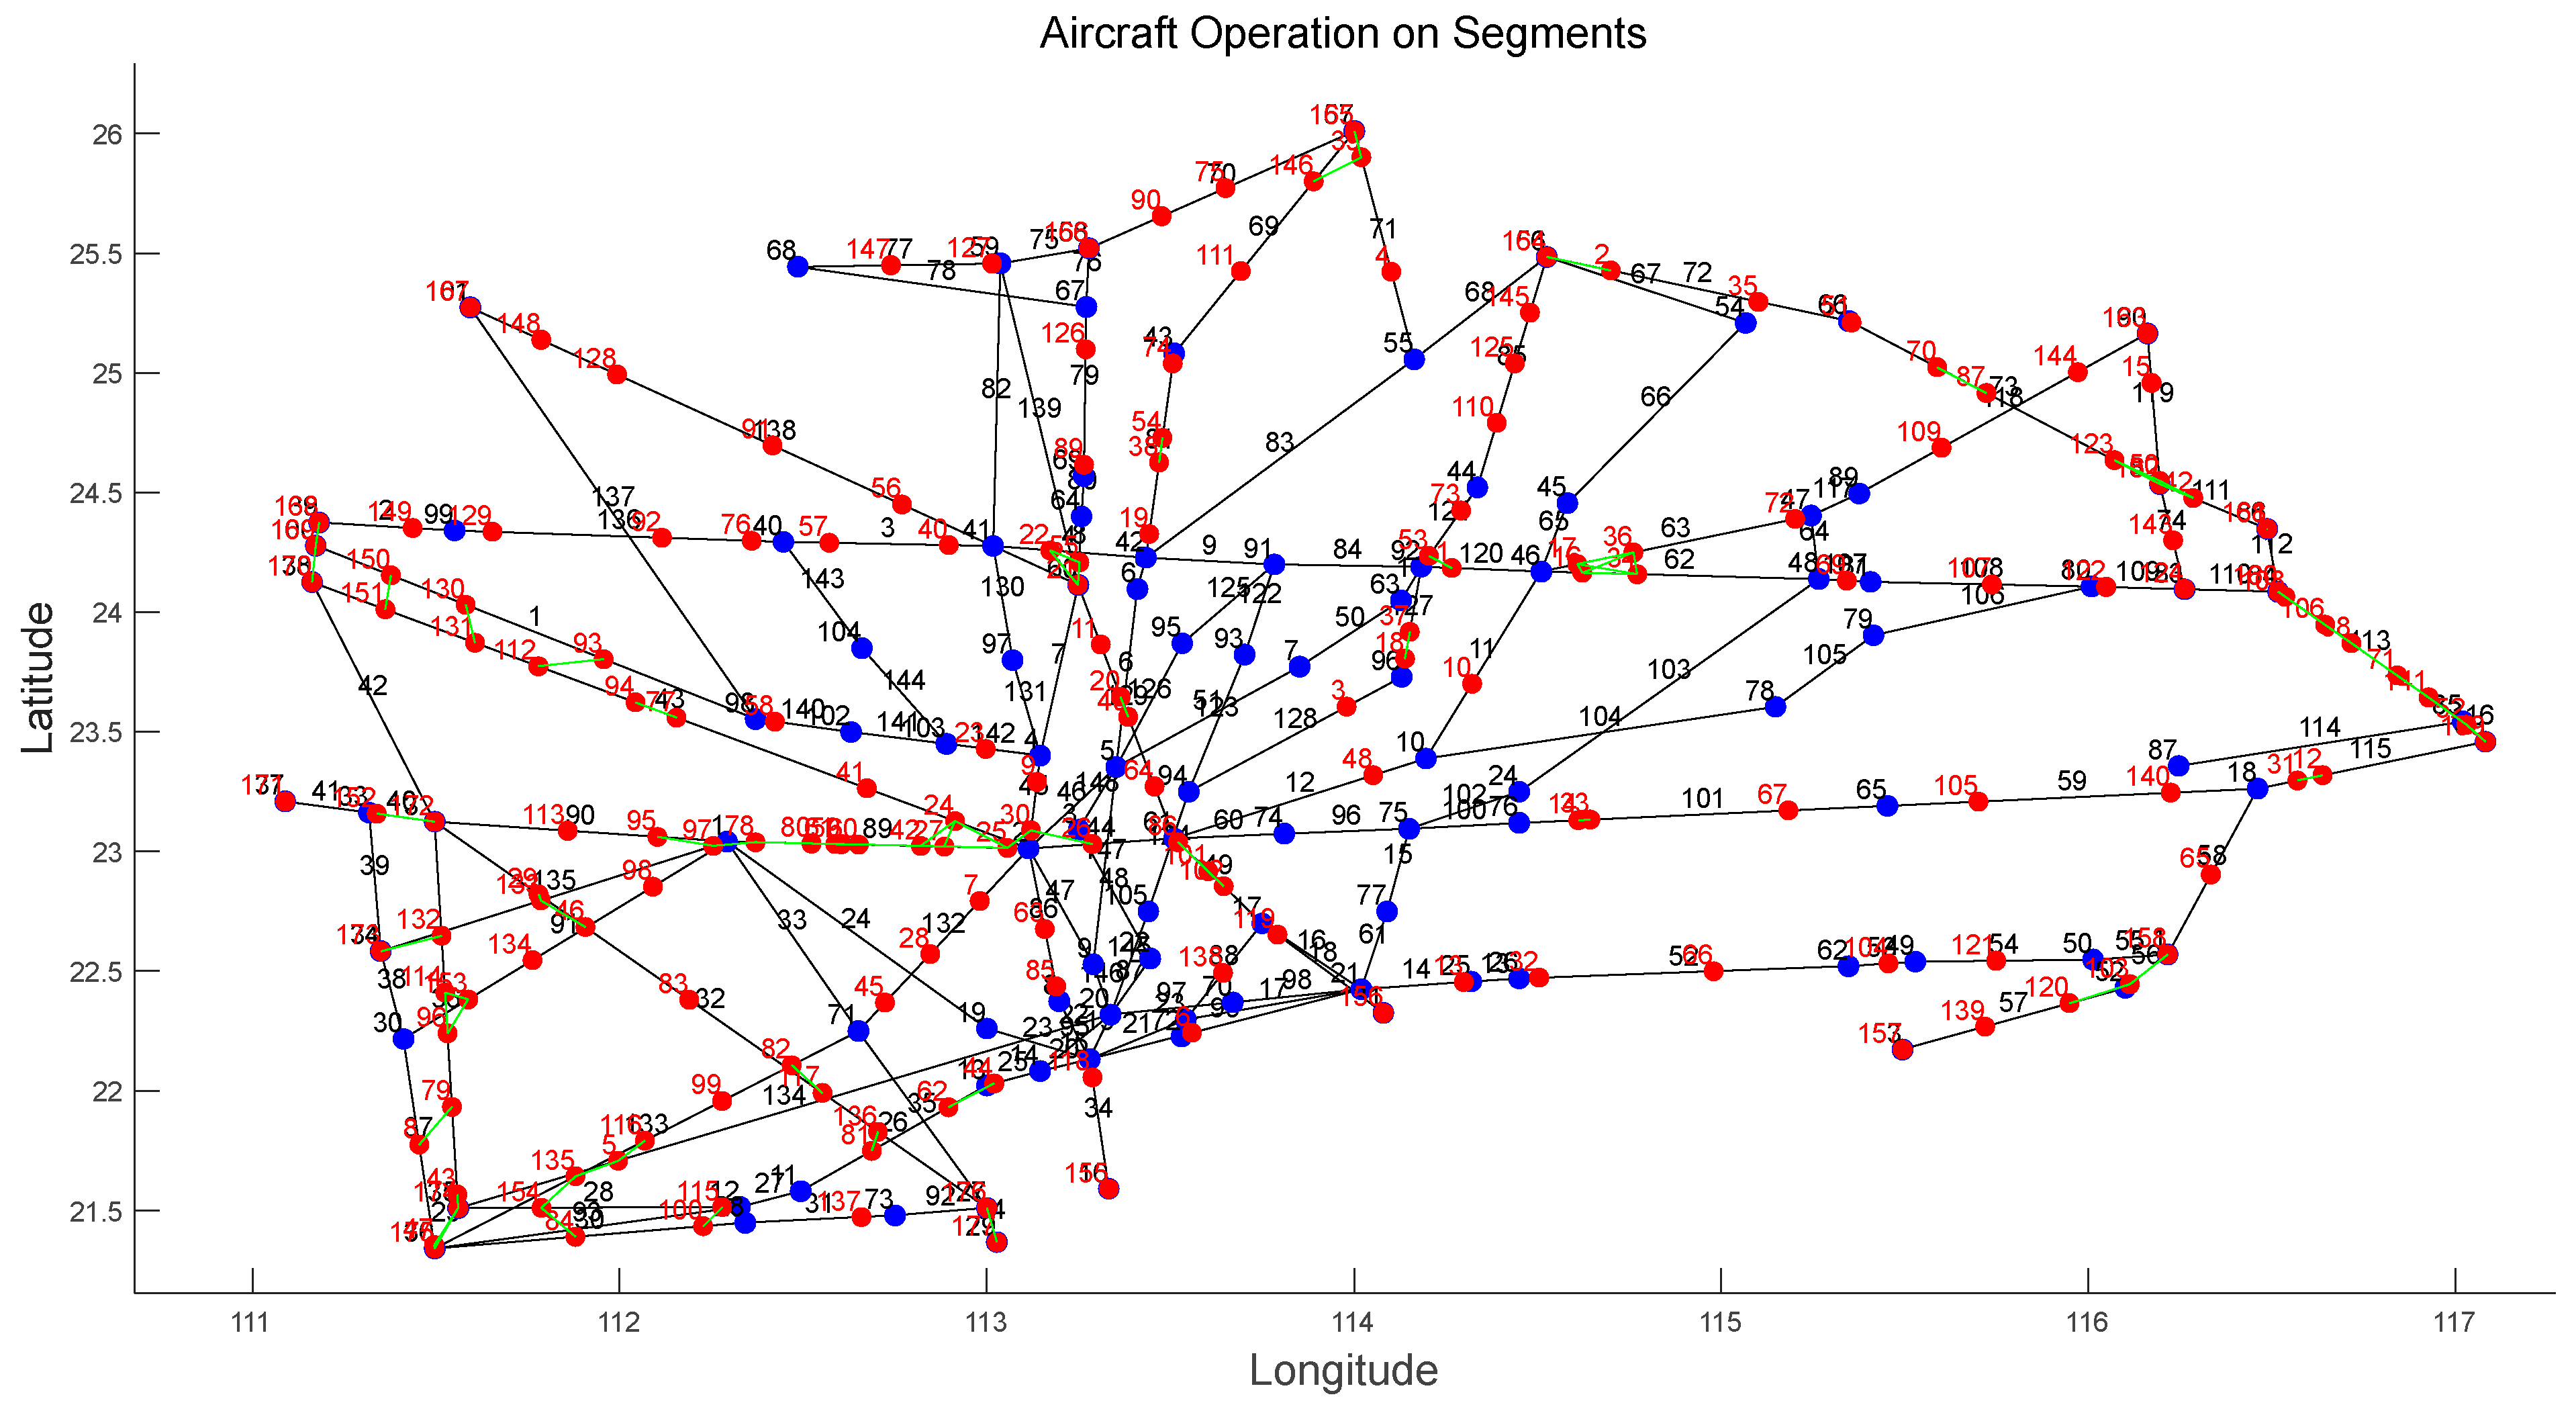
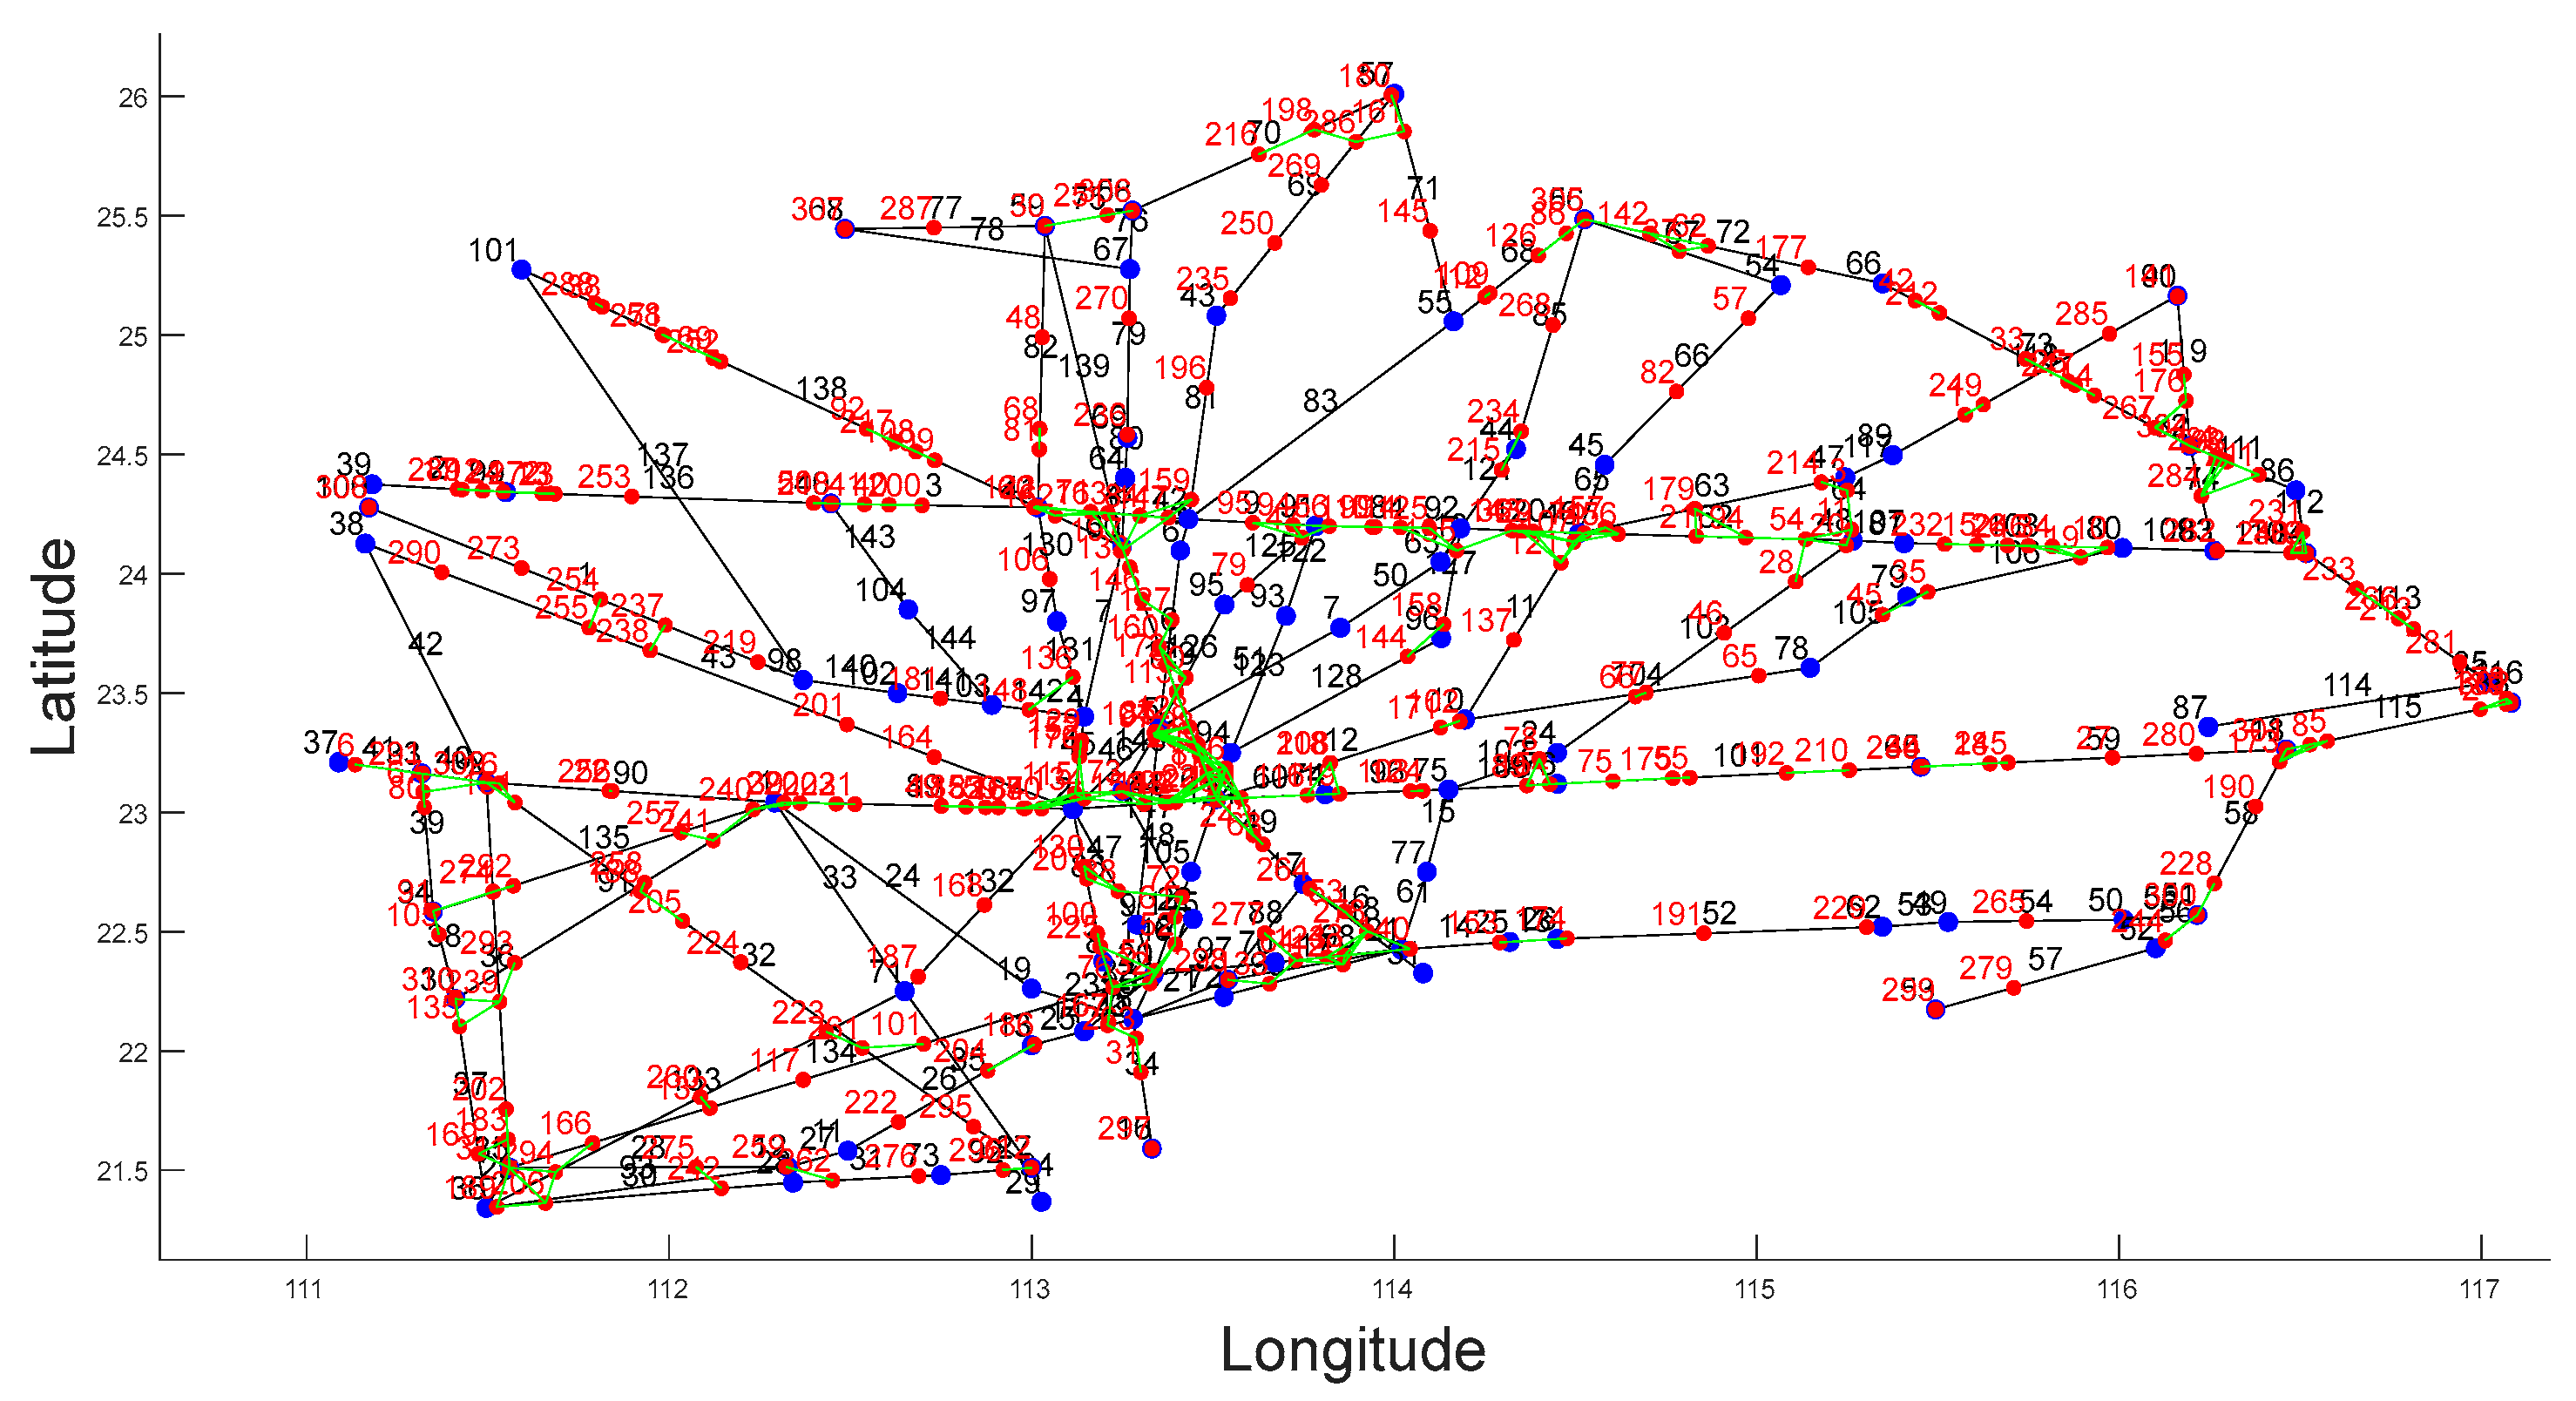
We numbered the flight segments and collected air traffic flow data over the Guangdong–Hong Kong–Macao Greater Bay Area at 14:20 on 18 June 2024. At this timestamp, there is a total of 173 aircraft in the airspace. The traffic situation diagram is shown in Figure 5, where the red points and numbers represent the aircraft in operation and their corresponding IDs. Based on the criteria outlined in Section 2.1 for determining aircraft conflict situations, if two aircraft are found to be in conflict, a green edge is established between their respective aircraft nodes.
In the interdependent network model, the weighted adjacency matrix of the interdependent network can be used to represent the air traffic conditions over the Guangdong–Hong Kong–Macao Greater Bay Area. At this moment, there are 173 aircraft in flight, so the weighted adjacency matrix is a square matrix of size (148 + 173) × (148 + 173). The number 173 represents the total aircraft flying over the airspace of the multiple airport terminal areas at this time.
The matrix can be divided into four parts: The top-left 173 × 173 submatrix records the conflict levels between individual aircraft. The bottom-right 148 × 148 submatrix is an adjacency matrix indicating the connectivity between 148 flight segments; a value of 1 signifies that two segments share a common point, while 0 indicates no shared point. The bottom-left 148 × 173 matrix and the top-right 173 × 148 matrix are transposes of each other; they record the weights of inter-layer coupling edges.
Based on the air situation diagram at the current moment, the weighted adjacency matrix A of the interdependent network model at this moment is calculated, and its expression is as follows:
A   = 0 0 0 6.04 0 0 0 3.24 0 0 0 0 0 0 0.12 0 0 0 0 0 0 0.62 0 0 6.04 0 0 0 0 0 0 2.73 0 0 0 0 0 0 0 0.14 0 0 0.62 0 0 0 1 1 0 0.12 0 0 0 1 0 1 3.24 0 0 2.73 0.14 1 1 0 .
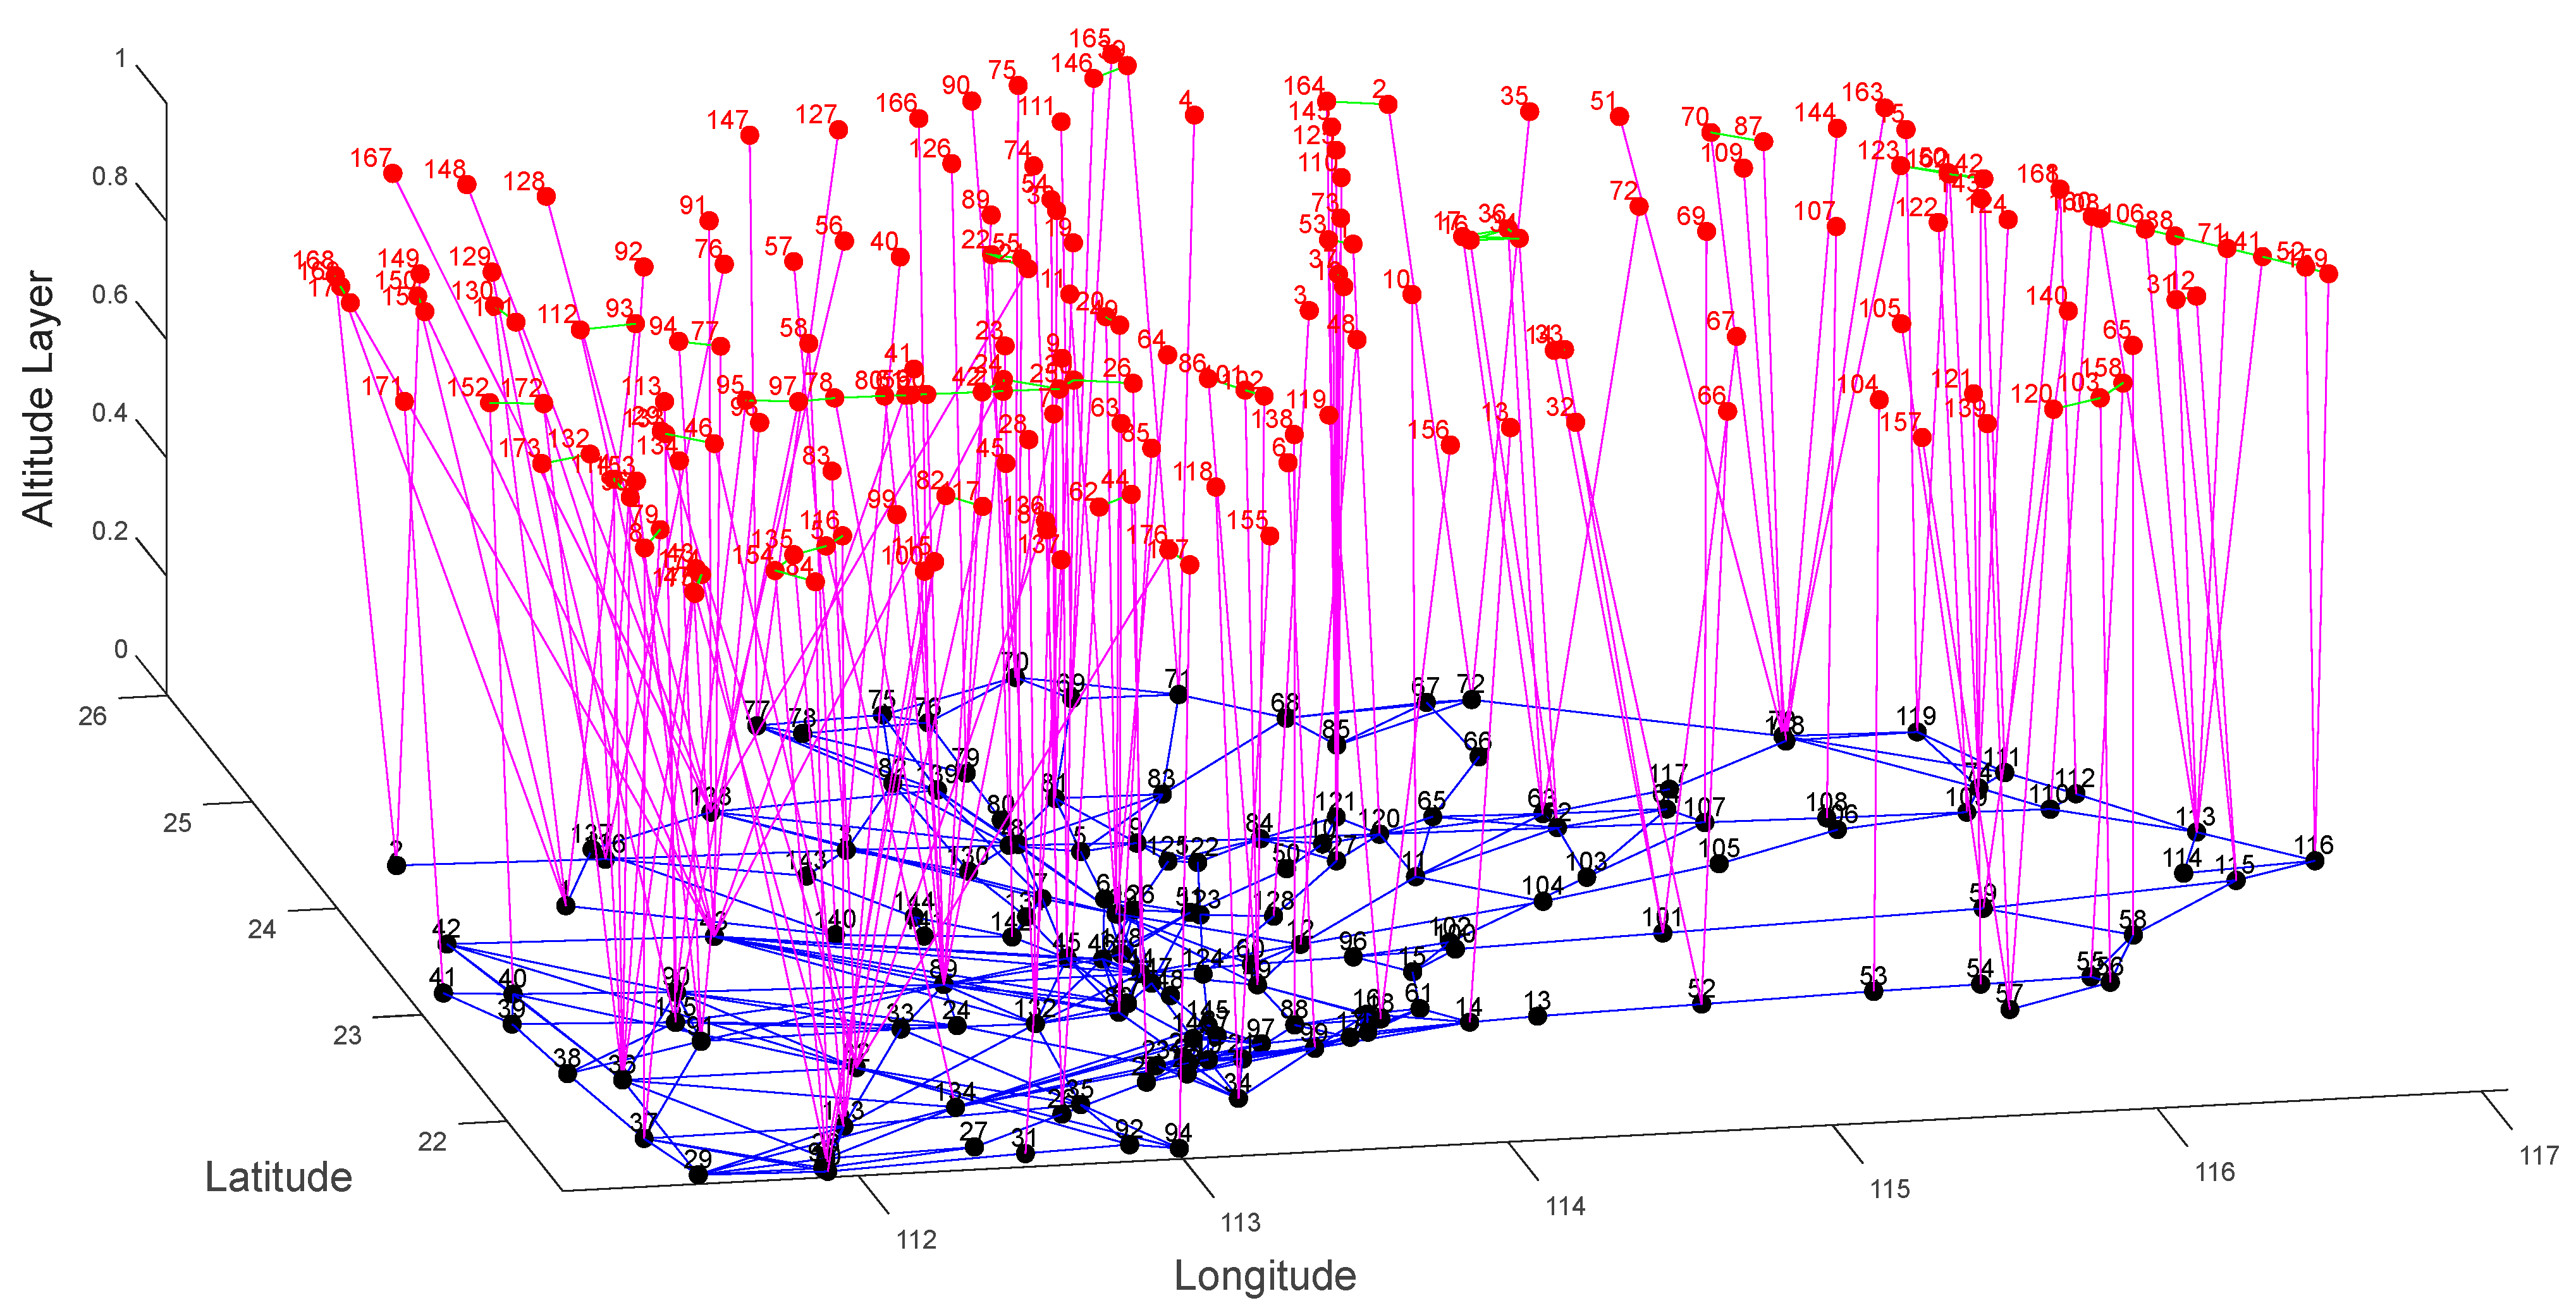
Based on the adjacency matrix, the interdependent network model for the Guangdong–Hong Kong–Macao Greater Bay Area at 14:20 on 18 June 2024, is depicted in Figure 6. In the figure, red nodes represent aircraft nodes, black nodes represent flight segment nodes, green edges denote conflict edges within the flight status network, purple edges indicate inter-layer coupling edges, and blue edges represent connections between flight segments.
Next, based on the route segment–flight state interdependent network model established above, we will establish the complexity indicators for this interdependent network model, and analyze the complexity of each route segment and the overall air traffic situation. The end-users of the complexity indicators established in this paper to reflect the air traffic situation include air traffic controllers, airspace planners, airline operation dispatchers, and the airspace management department of the Civil Aviation Administration, etc.
These indicators are mainly used for real-time operation monitoring and short-term early warning, which are specifically reflected in the following aspects: Firstly, conduct real-time complexity assessment to help controllers identify the current complexity of the airspace and potential risk areas. Secondly, assist in traffic management decision-making, providing a scientific basis for traffic allocation and further optimizing flight schedule arrangements. Thirdly, serve as an early-warning system. When the complexity index exceeds the threshold, it can promptly issue warnings for possible congestion or conflicts. Fourthly, carry out historical trend analysis. By analyzing the complexity change patterns during specific periods, it can provide references for future planning.

4. Analysis of Flight Segment Complexity

In the flight segment–flight status interdependent network model, the characteristics of flight segment nodes can reflect the importance and complexity of each segment. Starting from the degree of flight segment nodes and the node strength, we analyze the complexity of the flight segments in the airspace of the Guangdong–Hong Kong–Macao multi-airport terminal area.

4.1. Analysis of Flight Segment Node Degree

In the air route network, the node degree reflects the number of connected neighboring route nodes for a given route node. It is a key indicator for evaluating route congestion and network connectivity, and plays an important role in the analysis of air traffic complexity. To quantify this metric, we use the following formula:
k i   =   j   =   1 N a i j .
Let N denote the total number of nodes and a i j indicate whether a link exists between node i and node j; if so, a i j = 1 , otherwise a i j = 0 . In the dependency network, due to the presence of two distinct types of edges, the node degree is divided into internal degree and external degree. The degree of a node in the dependency network is defined as the sum of its internal and external degrees. In the route-flight state dependency network, two subnetworks exist; therefore, the degree of a node k i is calculated as:
k i   =   k i 1   + k i 2 .
The internal degree of a node, denoted as k i 1 , represents the number of internal edges connected to that node. The external degree, denoted as k i 2 , indicates the number of coupling edges connected to the node.
The internal degree of route nodes reflects the level of connectivity between that route and other routes. A high internal degree typically signifies that the route node functions as an important hub within the network, effectively linking multiple routes. This connectivity not only influences flight flow but may also lead to increased air traffic density, thereby elevating the potential risk of conflicts. Consequently, the internal degree of a route aids airlines and air traffic management agencies in optimizing flight scheduling, improving punctuality and safety. Since the connectivity of air routes over the Guangdong–Hong Kong–Macao Greater Bay Area remains unchanged, the internal degrees of route nodes in the lower-layer network are constant, and their statistical distribution is shown in Figure 7.
From the figure, it can be seen that route nodes 19, 46, and 89 have the highest internal degree, each with a value of 12. According to the route map of the Guangdong–Hong Kong–Macao Greater Bay Area shown in Figure 4, these three route segments are each connected to 12 other routes. Once these high-internal-degree route nodes encounter issues, they may trigger chain reactions, leading to widespread flight delays or cancellations, which can impact the normal operation of the entire air traffic network. Therefore, in the analysis of air traffic complexity, special attention should be paid to route nodes with higher internal degrees.
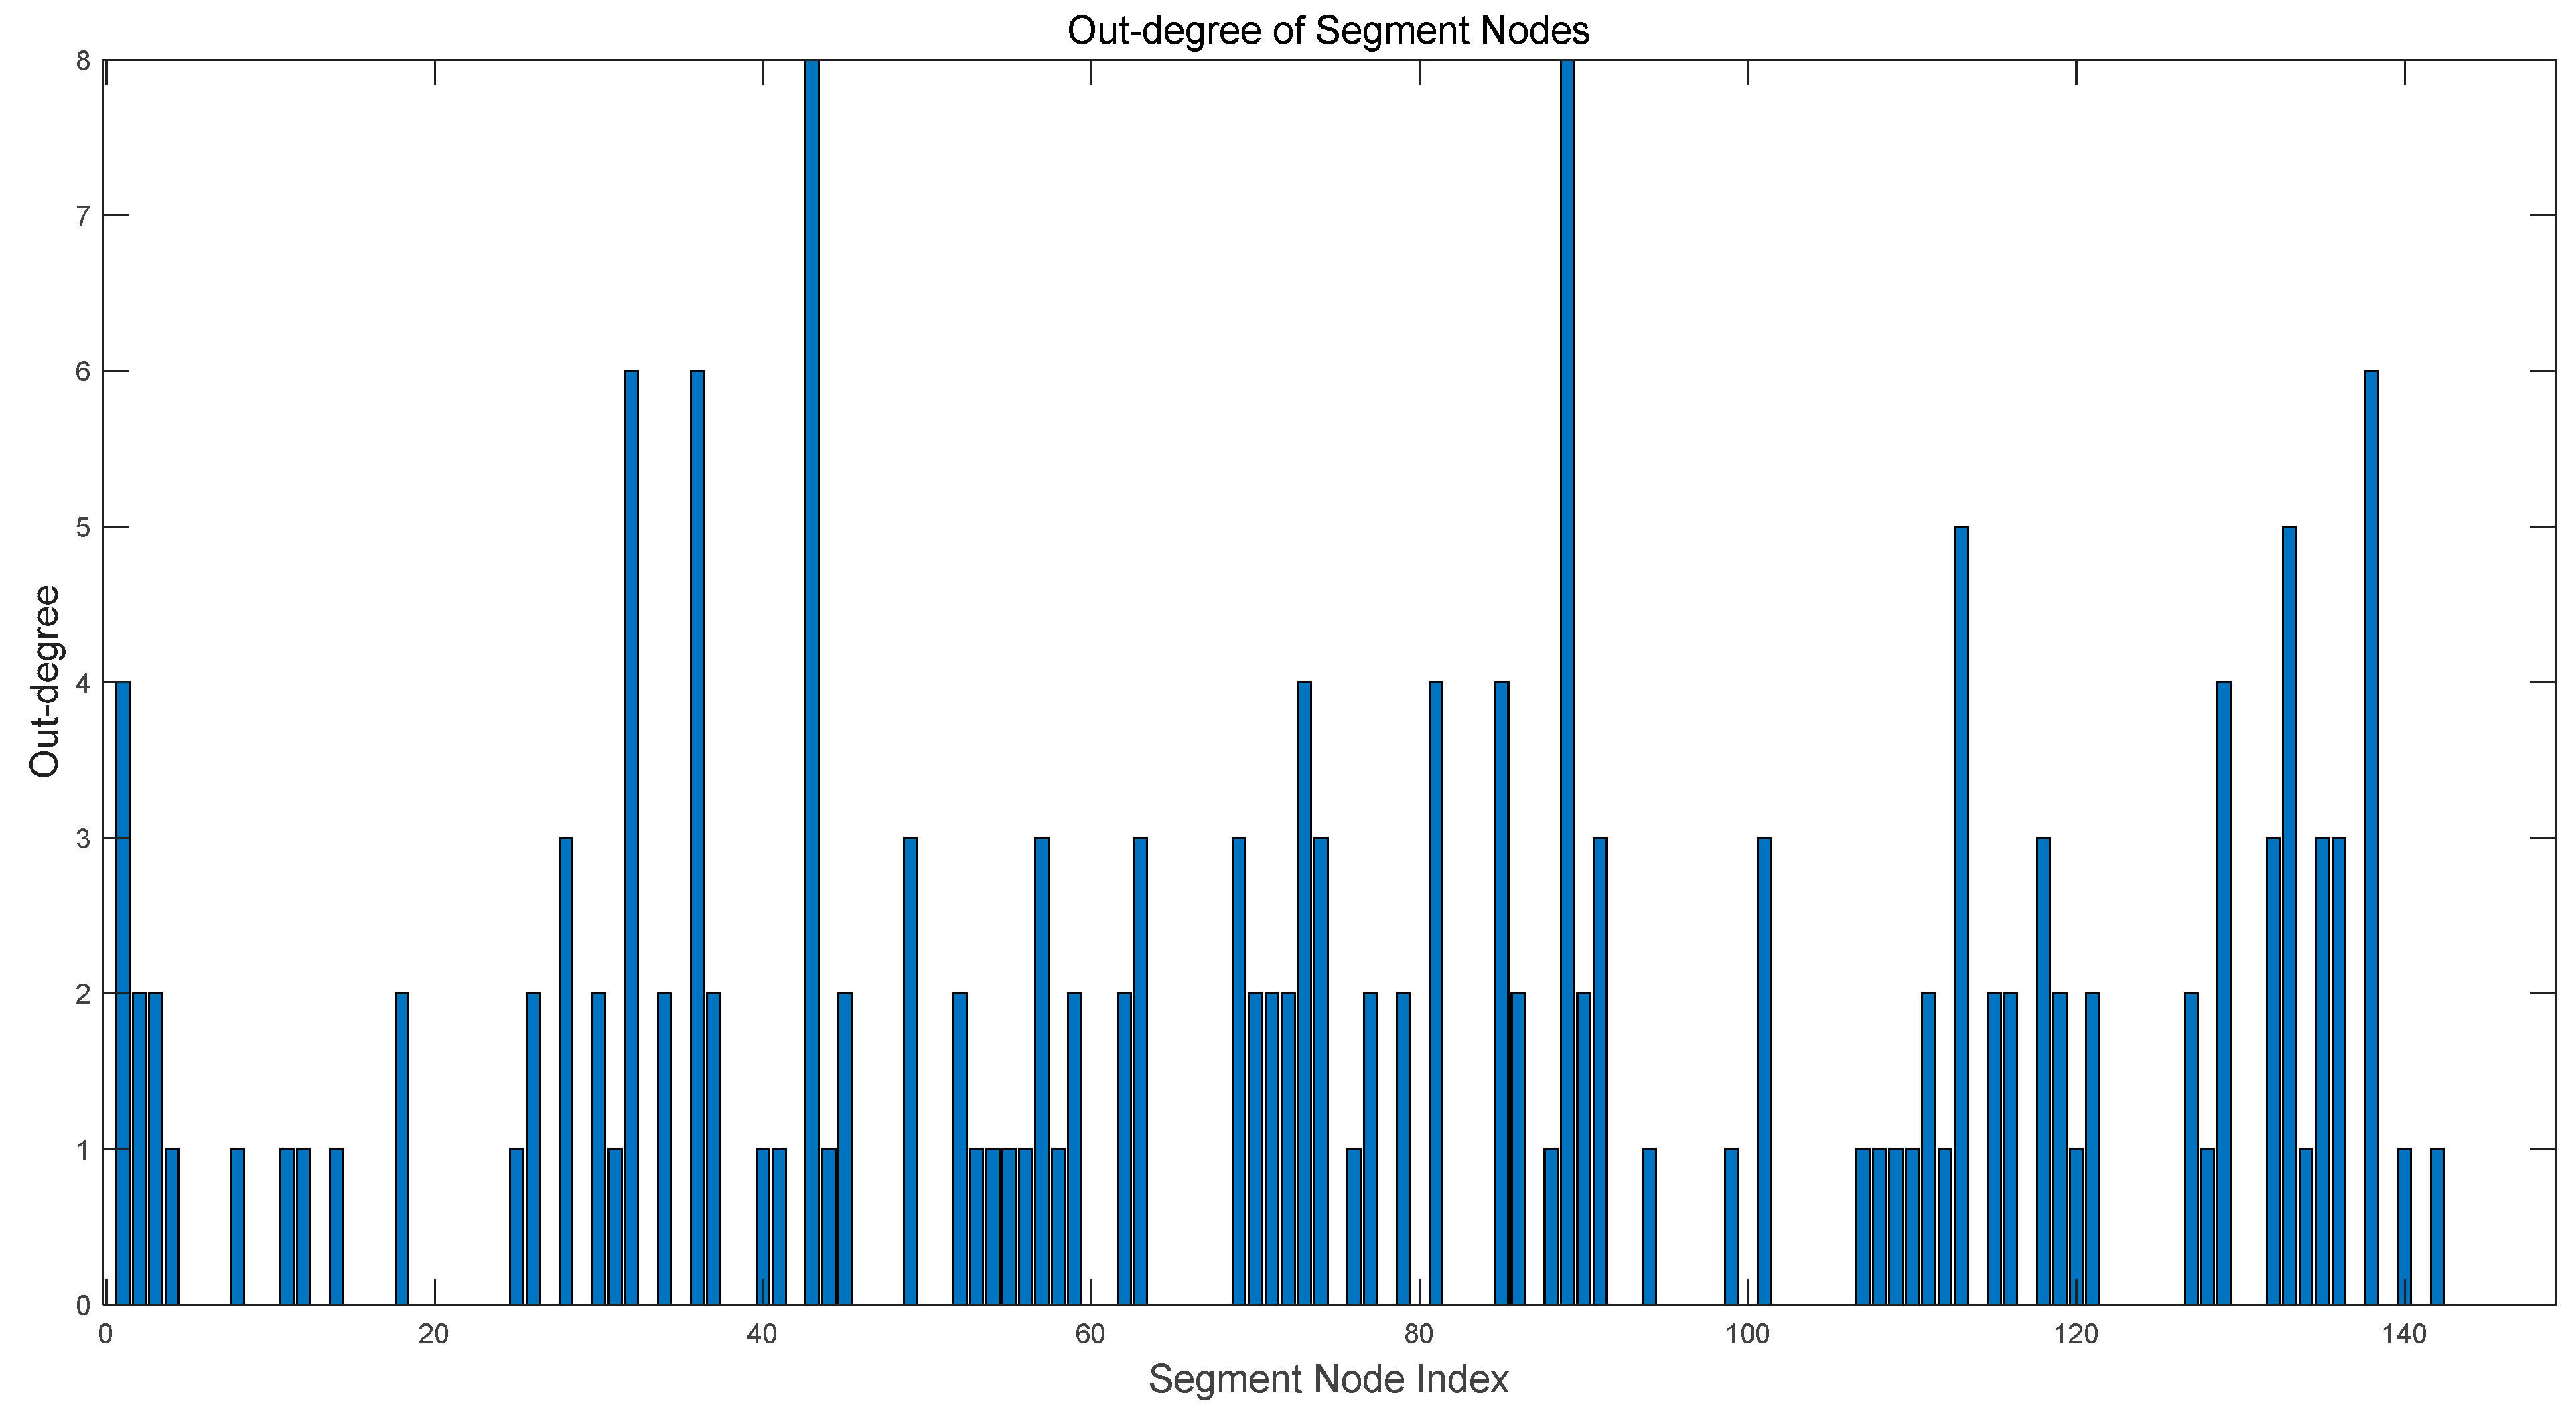
The external degree of a route node indicates the number of aircraft simultaneously operating on that route, reflecting the traffic volume on the route. A high external degree typically signifies a higher number of flights utilizing that route. Additionally, analyzing the external degree assists air traffic management agencies in traffic control, enabling them to regulate and maintain traffic flow within safe limits, thereby reducing congestion risks. This contributes to improving the overall efficiency and safety of air transportation. The distribution of external degrees for route nodes in the dependency network model over the Guangdong–Hong Kong–Macao Greater Bay Area is shown in Figure 8.
According to Figure 9, route nodes 43 and 89 have relatively high external degrees, each with a value of 8. As shown in the air traffic map of the Guangdong–Hong Kong–Macao Greater Bay Area in Figure 5, there are 8 aircraft flying on route segment 43 (AVPAM-GURIN) and route segment 89 (MUBEL-POU). A higher external degree indicates a greater likelihood of conflicts between aircraft on that route segment. Therefore, air traffic management authorities should strengthen monitoring and control over these routes to ensure flight safety. Additionally, some route nodes in Figure 9 have an external degree of 0, indicating that no aircraft are flying on those routes at the current time.

4.2. Strong Point Analysis of Sector Waypoints

In a weighted network, when analyzing nodes, it is also necessary to consider the impact of edge weights on the nodes, namely the node strength. The strength of a node connected to all edges with weights is the sum of the weights of all edges connected to that node, which can be expressed as follows:
s i   =   j   =   1 N a i j w i j .
w i j represent the weight of the edge between node i and node j .
In this dependency network model, edges with weights represent the internal edges between aircraft in the flight state network and the coupling edges between network layers. Since the edges between sector nodes do not have weights, the node strength of a sector node is equal to the sum of the weights of all coupling edges connected to that sector node.
The sector node strength quantifies the number of aircraft passing through that sector as well as the distribution of aircraft within the sector. A higher node strength indicates either a larger number of aircraft concurrently present in the sector or longer aircraft flight times within the sector, suggesting a higher degree of connectivity with other sectors. This provides an intuitive reflection of the busyness level of the sector. The weights of the coupling edges consider the positional information of aircraft within the sector, and the conflict multipliers account for the conflict situations between aircraft. By integrating these factors, the node strength can more accurately reflect the actual operational congestion of the sector.
Based on the node strength values of each sector, we generate a diagram illustrating the busy conditions of each sector in the multi-airport terminal area of the Guangdong–Hong Kong–Macao Greater Bay Area, as shown in Figure 9. In the figure, the color and shading of each sector indicate different levels of busyness, with red, yellow, green, and blue representing increasing degrees of congestion.
As shown in Figure 9, the nodes of Route 89 and Route 43 are colored blue. The node of Route 89 has the highest level of busyness. A higher level of busyness of a route node indicates a larger number of aircraft or more conflicts on that route. According to the air situation map of the Guangdong–Hong Kong–Macao Greater Bay Area in Figure 5, there are 8 aircraft on Route 89, and all of them are involved in flight conflicts. Similarly, there are also 8 aircraft on Route 43, but only 6 of them are involved in flight conflicts. Therefore, the busyness of the node of Route 89 should be greater than that of Route 43. In contrast, there are no aircraft flying on Routes 23, 60, 100, 125, etc. The colors representing the busyness of these routes should be red. This shows that the actual air situation map is consistent with the results of our node complexity analysis.

5. Overall Complexity Analysis of Air Traffic Based on Dependency Networks

Analysis of Segment Node Complexity can reveal the complexity and significance of each flight segment. Additionally, the analysis of the overall dependency network’s complexity provides insights into the air traffic complexity within the entire multi-airport terminal area.
To accurately evaluate the overall characteristics of the air traffic network, we select three indicators that reflect the network’s overall performance: the average node information entropy, the average node weighted clustering coefficient, and the average node strength. These metrics are used to analyze the complexity of air traffic in multi-airport terminal areas. The integration is performed using the Analytic Hierarchy Process (AHP), ultimately deriving a Flight State Network Complexity Index (P) to represent the overall complexity of the air traffic system.
Information entropy measures the diversity and uncertainty of a node’s connection pattern. In the dependency network model, a higher node information entropy indicates greater uncertainty in the node’s state—such as aircraft flight status and segment utilization—making the system more complex and variable. For a node i, its information entropy H(i) can be calculated using the following formula:
H i   =       j N i p i j l o g p i j ,
where N(i) is the set of neighboring nodes of node i. pij is the connection probability between node i and its neighbor node j, which can be obtained by normalizing the edge weights:
p i j   =   w i j k N i w i k ,
where w i j represents the edge weight between node i and node j.
The average node information entropy is the mean value of the information entropy across all nodes in the network. It provides an overall measure of the node information entropy for the entire network. The average node information entropy reflects the overall uncertainty and complexity of the entire air traffic network. A higher average node information entropy indicates that the feature distribution of nodes is relatively dispersed, resulting in a more complex network structure and interaction relationships. Consequently, the overall operation of air traffic becomes more intricate.
The weighted clustering coefficient is a metric used to assess the local connectivity density around a node within a complex network. It reflects the tightness of connections among neighboring nodes and the distribution of edge weights. When multiple aircraft are flying within a specific area and are relatively close to each other—implying potential flight conflicts—the connection weights between these nodes and their neighbors tend to be higher. As a result, the clustering coefficient increases, indicating that the air traffic in that region is more complex and may carry a higher risk of flight conflicts. For a node i, its weighted clustering coefficient C(i) can be calculated using the following formula:
C i   =   1 k i     1 × s i × m , n w i m + w i n 2 × a i m a i n a m n .
The degree of a node is denoted as k i , and the strength of a node is denoted as s i .
The average node weighted clustering coefficient is the mean value of the weighted clustering coefficients over all nodes in the network. The average node-weighted clustering coefficient reflects the local clustering characteristics of the entire network. A higher average weighted clustering coefficient indicates more frequent and tighter interactions among aircrafts and between flight segments.
Node strength is an index used to measure the connection strength between a node and its neighbors, which reflects the importance and activity level of the node in the network. The expression of node strength has been mentioned above.
The average node strength is the mean value of the strengths of all nodes in the network, reflecting the overall activity level and connection intensity of the entire network. A higher average node strength indicates that flights between aircraft within the entire air traffic network tend to have more frequent conflicts and higher conflict intensities, reflecting a higher level of airspace congestion; conversely, a lower average node strength suggests relatively smoother air traffic with fewer conflicts and lower conflict intensity.
Because, during our calculation of the average node strength weight using the Analytic Hierarchy Process (AHP), the difference between the average node strength and the average node information entropy, as well as the average node weighted clustering coefficient, was excessively large, we employed the tanh function to limit the average node strength within the range (0, 2).
The expressions for the average node information entropy, the average node weighted clustering coefficient, and the average node strength are as follows:
X ¯ = 1 N i = 1 N X i , X { H , C , S } .
The network complexity index (P) is obtained by weighted combination of the three aforementioned network complexity indicators using the AHP. AHP is a multi-criteria decision-making method used for decision analysis; it constructs judgment matrices to compare the importance of different factors and computes their weights. The specific steps are as follows:
First, construct the judgment matrix W. In this case, it is a 3 × 3 matrix representing the relative importance among three factors: average node information entropy, average node weighted clustering coefficient, and average node strength. The element Wij indicates the importance of factor i relative to factor j.
Second, calculate the factor weights. To do this, we use the geometric mean method: take the logarithm of each element in each row of the judgment matrix, compute the average, then exponentiate to obtain the geometric mean for each factor. These geometric means are normalized so that their sum equals 1, yielding the weights for each factor.
Third, perform a consistency check. This step is crucial in AHP to ensure the logical consistency of the judgment matrix. The consistency index (I) is calculated using the formula:
I   =   λ m a x     n n     1 .
λ m a x represents the maximum eigenvalue of the judgment matrix. In the Analytic Hierarchy Process (AHP), the judgment matrix is constructed by pairwise comparison of the relative importance of various factors. n is the order of the judgment matrix, that is, the number of rows or columns of the matrix, which represents the number of factors involved in the comparison.
The calculation formula for the Consistency Ratio (R) is as follows:
R   =   I B n .
B is the Random Index, and its value depends on the order n of the judgment matrix.
If R < 0.1, the judgment matrix is considered to have satisfactory consistency; otherwise, adjustments to the judgment matrix are necessary. Based on the experimental result, R = 0.0332, which meets the criteria. Finally, the formula for calculating the complexity index is as follows:
  P   =   W 1 × H + W 2 × C + W 3 ×   1 + t a n h S .
The variables W 1   W 2   W 3 are the indicator weights obtained through the Analytic Hierarchy Process. These weights reflect the relative importance of each indicator in the calculation of the complexity index. According to the experimental results, W 1 = 0.6370 , W 2 =   0.2583 , W 3 =   0.1047 .
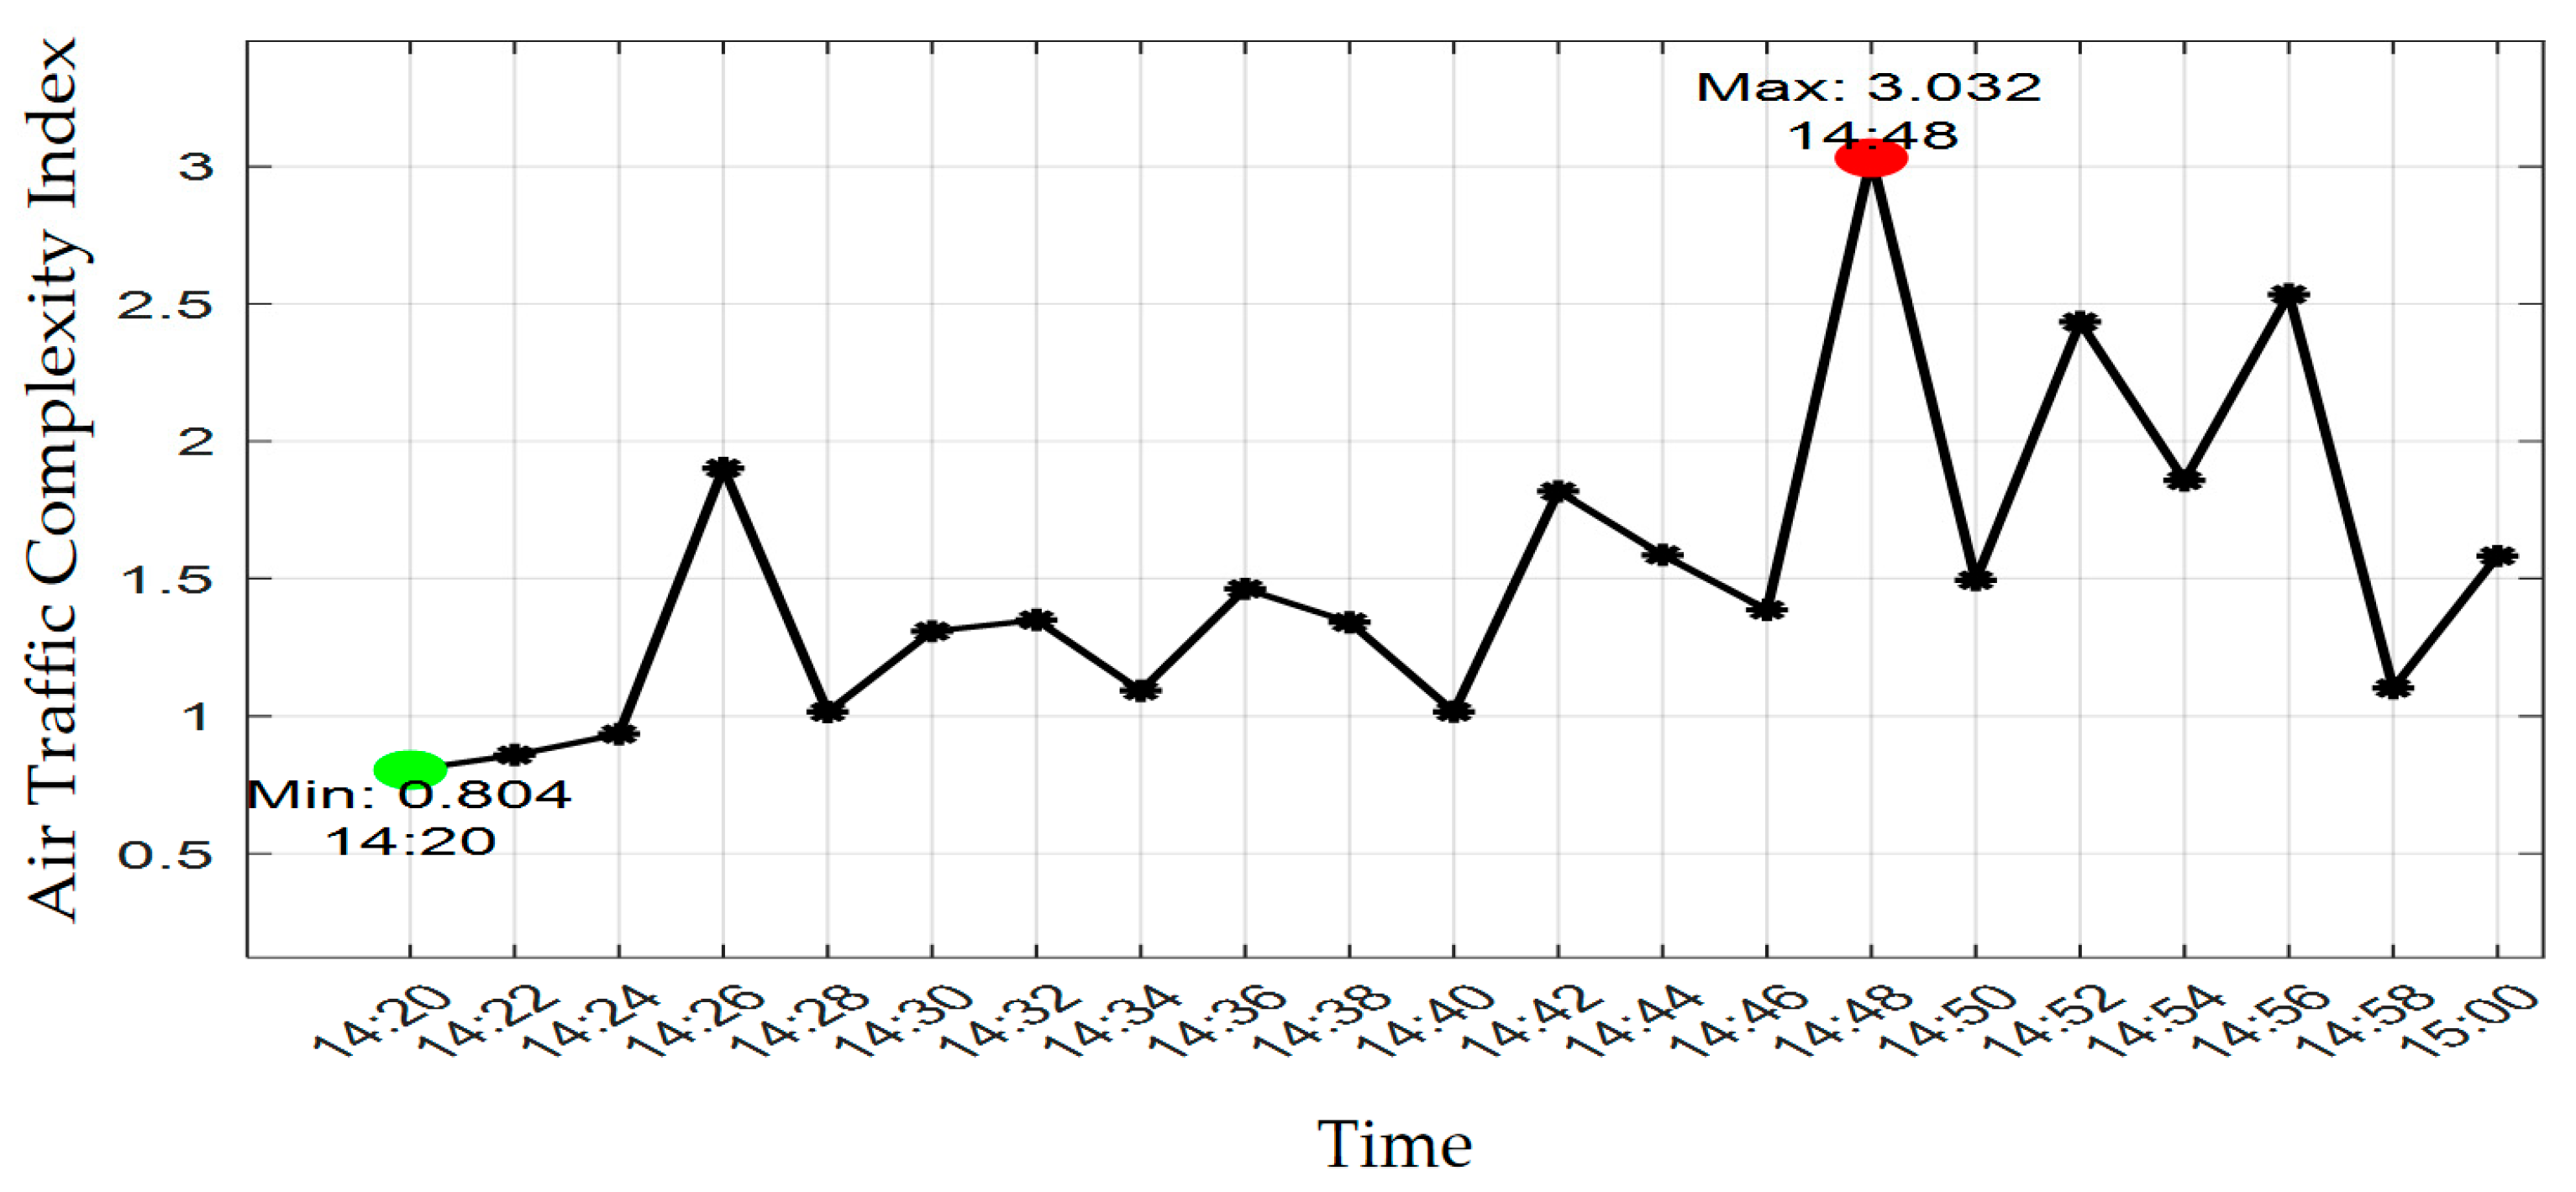
Based on the air situation maps from 14:20 to 15:00 on 18 June 2024, we derived the dependency network models for this time period. Using these dependency network models, the variation of the Guangzhou–Hong Kong–Macau multi-airport terminal area complexity index is shown in Figure 10, with a time step of 2 min.
Based on Figure 10, we can observe that at 14:20 on June 18, 2024, the dependency network complexity index is at its lowest value of 0.8. The air situation map corresponding to this time is shown in Figure 5 above. Conversely, at 14:48 on 18 June 2024, the dependency network complexity index reaches its highest value of 3.0, and the air situation map at this time is depicted in Figure 11.
Based on Figure 5, at 14:20, the number of aircraft flying over the Guangdong–Hong Kong–Macau terminal area is relatively low, with fewer flight conflicts among the three major airports: Hong Kong, Guangzhou, and Shenzhen. According to Figure 11, at 14:48, the number of aircraft operating in the Guangdong–Hong Kong–Macau terminal area increases, and the frequency of flight conflicts among Hong Kong, Guangzhou, and Shenzhen airports also rises. This indicates that the variation of the dependence network complexity index is consistent with the actual air traffic situation in the multi-airport terminal area of Guangdong–Hong Kong–Macau. Therefore, it validates that the segment–flight state dependence network model can effectively reflect the overall complexity of air traffic. This research provides a theoretical basis and practical significance for the analysis of air traffic complexity in multi-airport terminal areas.
6. Conclusions

The analysis of air traffic complexity in multi-airport terminal areas is beneficial for improving airspace resource utilization and reducing flight delays. This paper proposes a method for analyzing the air traffic complexity in multi-airport terminal zones based on a segment–flight state dependence network. The dependence network is constructed by coupling an upper-layer aircraft network with a lower-layer segment network via interlayer connections. In flight scenarios of the Guangdong–Hong Kong–Macao Greater Bay Area, the method proposed in this paper is verified and compared with the actual situation. The results show that this method can accurately assess the air traffic complexity in multi-airport terminal areas.
This thesis provides new ideas for research on air traffic complexity analysis in multi-airport terminal areas.

Author Contributions

Validation, H.X.; Formal analysis, J.Y.; Data curation, L.M. and L.Z.; Writing—original draft, C.Z.; Writing—review and editing, X.W. and M.W. All authors have read and agreed to the published version of the manuscript.

Funding

This research received no external funding.

Data Availability Statement

Data is contained within the article.

Conflicts of Interest

The authors declare no conflicts of interest.

References

  1. Histon, J.M.; Hansman, R.J.; Aigoin, G.; Delahaye, D.; Puechmorel, S. Introducing structural considerations into complexity metrics. Air Traffic Control. Q. 2002, 10, 115–130. [Google Scholar] [CrossRef]
  2. Cong, W.; Hu, M.H.; Xie, H. An evaluation method of sector complexity based on an indicator system. Traffic Transp. Syst. Eng. Inf. 2015, 15, 136–141. [Google Scholar]
  3. Zhang, J.; Hu, M.H.; Zhang, C. Airspace complexity modeling. J. Nanjing Univ. Aeronaut. Astronaut. 2010, 42, 454–460. [Google Scholar]
  4. Cao, X.B.; Zhu, X.; Tian, Z.C.; Chen, J.; Wu, D.; Du, W. A knowledge-transfer-based learning framework for airspace operation complexity evaluation. Transp. Res. Part C Emerg. Technol. 2018, 95, 61–81. [Google Scholar] [CrossRef]
  5. Du, W.; Li, B.; Chen, J.; Lv, Y.; Li, Y. A spatiotemporal hybrid model for airspace complexity prediction. IEEE Intell. Transp. Syst. Mag. 2022, 99, 2–9. [Google Scholar] [CrossRef]
  6. Wang, H.Y.; Zhao, Y.F.; Wen, R.Y. A complexity measurement method for air traffic based on complex networks. Syst. Eng. 2014, 32, 112–118. [Google Scholar]
  7. Wang, H.Y.; Wen, R.Y.; Zhao, Y.F. Analysis of topological characteristics in air traffic situation networks. Proc. Inst. Mech. Eng. Part G J. Aerosp. Eng. 2015, 229, 2497–2505. [Google Scholar]
  8. Wang, H.Y.; Song, Z.Q.; Wen, R.Y.; Zhao, Y. Study on evolution characteristics of air traffic situation complexity based on complex network theory. Aerosp. Sci. Technol. 2016, 58, 518–526. [Google Scholar] [CrossRef]
  9. Jiang, X.R.; Wen, X.X.; Wu, M.G.; Song, M.; Tu, C.L. A complex network analysis approach for identifying air traffic congestion based on independent component analysis. Physica A 2019, 523, 364–381. [Google Scholar] [CrossRef]
  10. Wu, M.G.; Wang, Z.K.; Gan, X.S. Key conflict point identification in air traffic based on complex network theory. J. Northwest. Polytech. Univ. 2020, 38, 279–287. [Google Scholar] [CrossRef]
  11. Wu, M.G.; Ye, Z.L.; Wen, X.X. Air traffic complexity identification method based on complex network theory. J. Beihang Univ. Nat. Sci. Ed. 2020, 46, 839–850. [Google Scholar]
  12. Bi, K.X.; Wu, M.G.; Zhang, W.B. Flight conflict network modeling and analysis based on speed obstacle method. Syst. Eng. Electron. 2021, 43, 2163–2173. [Google Scholar]
  13. Buldyrev, S.V.; Parshani, R.; Paul, G.; Stanley, H.E.; Havlin, S. Catastrophic cascade of failures in interdependent networks. Nature 2010, 464, 1025–1028. [Google Scholar] [CrossRef] [PubMed]
  14. Shao, J.; Buldyrev, S.V.; Havlin, S.; Stanley, H.E. Cascade of failures in coupled network systems with multiple support dependence relations. Phys. Rev. E 2011, 83, 036116. [Google Scholar] [CrossRef] [PubMed]
  15. Wang, X.L.; Pan, W.H.; Zhao, M. Vulnerability analysis of interdependent air traffic networks. Acta Aeronaut. Astronaut. Sin. 2018, 39, 268–277. [Google Scholar]
  16. Wang, X.L.; Pan, W.H.; Zhao, M. Mechanism of failure propagation in aviation interdependent networks. J. Wuhan Univ. Technol. Transp. Sci. Eng. 2018, 40, 41–46. [Google Scholar]
  17. Wang, X.L.; Pan, W.H. Elasticity measurement and analysis of aviation interdependent networks. Comput. Mod. 2019, 36, 41–46. [Google Scholar]
  18. Li, A.; Nie, D.M.; Wen, X.X. Control–flight state dependency network model and characteristic analysis. J. Beihang Univ. Nat. Sci. Ed. 2020, 46, 1204–1213. [Google Scholar]
  19. Li, A.; Nie, D.M.; Wen, X.X. Evolution process of control–flight state dependency network. Acta Aeronaut. Astronaut. Sin. 2021, 42, 481–493. [Google Scholar]
Figure 1. Dependency Network Diagram.
Aerospace 12 00839 g001
Figure 2. Flight Segment Network Diagram.
Aerospace 12 00839 g002
Figure 3. Coupled Edge Illustration Diagram.
Aerospace 12 00839 g003
Figure 4. Air Routes Map Over the Guangdong–Hong Kong–Macao Greater Bay Area.
Aerospace 12 00839 g004
Figure 5. Air Traffic Situation Map of Guangdong–Hong Kong–Macao Terminal Area at 14:20.
Aerospace 12 00839 g005
Figure 6. Flight Segment–Flight Status-Dependent Network Model Diagram.
Aerospace 12 00839 g006
Figure 7. Hop count within the flight segment node.
Aerospace 12 00839 g007
Figure 8. Degree outside the flight segment node.
Aerospace 12 00839 g008
Figure 9. Busy situation of various flight segments in multi-airport terminal areas.
Aerospace 12 00839 g009
Figure 10. Complexity Index Variation Chart.
Aerospace 12 00839 g010
Figure 11. The 14:48 Timestamp of the Guangdong–Hong Kong–Macao Terminal Airspace Situation Map.
Aerospace 12 00839 g011
Disclaimer/Publisher’s Note: The statements, opinions and data contained in all publications are solely those of the individual author(s) and contributor(s) and not of MDPI and/or the editor(s). MDPI and/or the editor(s) disclaim responsibility for any injury to people or property resulting from any ideas, methods, instructions or products referred to in the content.