Abstract
This paper presents the design and implementation of a guidance algorithm for the re-entry vehicle ReFEx (Reusability Flight Experiment). This algorithm aims at correcting for the dispersion in position and velocity after separation from the launcher, by updating the trajectory. The need for this update is driven by the expected divergence from the nominal trajectory at separation, due to the use of an unguided launcher. The transcription of the problem into an optimal control problem is used as a baseline for verification purposes. This algorithm consists of a simplification of the optimal control problem, reducing the profiles of the control variables to a finite set of control parameters. Combining this problem reduction with a function that propagates the trajectory from the initial state, this approach is able to transform the problem into an unconstrained optimization problem. This paper shows that this simplification is able to find solutions of similar quality to the full optimal control approach. The resulting algorithm is proven real-time capable by deploying it into a hardware equivalent of the on-board computer. In addition, a strategy to diverge during flight to an alternative target if the nominal one cannot be reached is appended to the algorithm.
1. Introduction
The increasing demand for cost-effective and reliable access to space has intensified the development of reusable launch systems. Among these, winged re-entry vehicles offer a promising approach, enabling controlled atmospheric descent and precision landing without the need for propulsion during re-entry. The German Aerospace Center (DLR) is pursuing this concept through the Reusability Flight Experiment (ReFEx), a demonstrator designed to validate the autonomous guidance, navigation, and control (GNC) capabilities required for such vehicles [1]. With a vertical takeoff and horizontal landing profile, ReFEx aims to showcase the feasibility of aerodynamic trajectory control across a wide flight envelope, from hypersonic to subsonic speeds.
This article is a revised and expanded version of a paper entitled ‘Design of ReFEx Guidance: Trajectory Correction after Ascent’, which was presented at AIAA SciTech Forum 2023 [2]. It addresses the challenge of ensuring accurate and robust trajectory guidance for a winged re-entry vehicle operating under high uncertainty and strict onboard constraints. After separation from an unguided launcher, large dispersions in position and velocity must be corrected to ensure the vehicle reaches its designated target. This paper presents a guidance algorithm that can handle the later challenge, performing a major update of the trajectory to correct for the error in position and velocity after ReFEx separates from the launcher. The main differences with regard to [2] are the following: (1) a broader literature review, (2) an overview of the design of the GNC system and its guidance role, (3) reorganization of theoretical content for clarity purposes, (4) refinement of the algorithm, (5) update of ascent trajectories (to reflect updated vehicle mass), (6) more extensive Monte Carlo campaigns, and (7) assessment of execution time and performance in the on-board computer.
The design of guidance algorithms for atmospheric re-entry has long been a critical area of research for space missions. With the increasing emphasis on reusable launch vehicles (RLVs), the need for accurate, reliable, and computationally efficient guidance methods has grown significantly. The challenges associated with re-entry guidance stem from a range of factors, including high initial state dispersion, a rapidly changing aerodynamic environment, and stringent path constraints arising from thermal, structural, and controllability limits. Over the decades, a variety of strategies have been developed to address these challenges, each offering unique advantages and limitations depending on mission profiles and onboard resources.
Among them, the algorithm presented in this paper is influenced by (1) energy-managed entry guidance with bank-angle control, (2) predictor–corrector (P-C) methods, and (3) optimal control. Energy-managed entry guidance with bank-angle control decouples longitudinal and lateral trajectory control by exploiting the dual functionality of the bank angle: its magnitude modulates the lift vector in the vertical plane, shaping the downrange trajectory, while its sign determines the direction of lateral lift, enabling crossrange steering and final heading alignment [3,4,5]. P-C methods refer to a class of guidance algorithms that iteratively estimate the trajectory required to meet a desired terminal condition and apply corrections based on the current vehicle state. Typically, a predictor step propagates the vehicle dynamics forward using an initial guess for the control input, while a corrector step adjusts the input to minimize deviation from the target. These methods are particularly attractive for entry guidance due to their modular structure, suitability for onboard implementation, and ability to incorporate real-time updates [6,7]. Optimal control is a mathematical framework for determining control inputs that steer a dynamic system from a given initial state to a desired final state while minimizing (or maximizing) a specified cost function, such as fuel consumption, time of flight, thermal load, or terminal error. The solution must respect the system’s differential equations and any control or state constraints. This formalism is well suited for re-entry guidance, where vehicles operate under tight physical limits and complex non-linear dynamics [8,9,10].
This paper begins by giving an introduction to ReFEx, describing the vehicle and the different phases of the mission in Section 2, as well as the structure of the GNC subsystem and the challenges that the guidance faces. Section 3 describes the problem at hand. First, Section 3.1 describes the solution of the problem using an optimal control approach. Developing a real-time safe version of an optimal control solver is not trivial and solving the optimal control problem can be computationally expensive. Therefore, several strategies to reduce the problem complexity are studied, including parameterizing the control vector in Section 3.2 and using a shooting optimization method in Section 3.3. The control parameters for the concrete problem at hand are defined in Section 4.1, while different approaches to solving the resulting non-linear unconstrained optimization problem are described in Section 4.2. An automatic process to define alternative targets before flight and decide which of these targets to aim at during flight is explained in Section 5. In Section 6, the performance of the different algorithms proposed is studied, including an assessment of the execution time in flight hardware.
2. ReFEx
RLVs represent a central strategy in current efforts to make access to space more sustainable and economically viable. By enabling the recovery and refurbishment of vehicle stages, RLV systems can significantly reduce mission costs, increase reliability, and improve launch cadence. ReFEx, developed by DLR, is a demonstrator for such a mission. Its purpose is to validate the autonomous flight capabilities of a winged re-entry vehicle in the context of a vertical takeoff, horizontal landing (VTHL) architecture. ReFEx specifically focuses on the return phase of a reusable stage, aiming to gather critical data and operational experience on autonomous guidance, navigation, and control during hypersonic and subsonic atmospheric flight [11,12].
2.1. Mission
The re-entry segment of ReFEx has approx. 400 kg of mass and a longitudinal length of 2.7 m. The wingspan is 1.1 m and the diagonal terms of the moment of inertia are approx. 15 kg m2 for the longitudinal axis and 240 kg m2 for the other two axes. The design consists of two fixed wings located at the back of the vehicle, a fin with an attached vertical tail actuator (rudder) and two canards positioned close to the nose of the vehicle. Two sets of actuators are used: (1) RCS (Reaction Control System), with eight thrusters located at the back of the vehicle, and (2) aerodynamic actuators, with the canards and rudder previously mentioned.
Figure 1 shows the sequence of events for the mission with some preliminary details. Several phases can be identified from this figure: (1) launch phase, (2) experimental phase until EI (Entry Interface), (3) experimental phase between EI and EoE (End of Experiment), and (4) experimental phase after EoE.
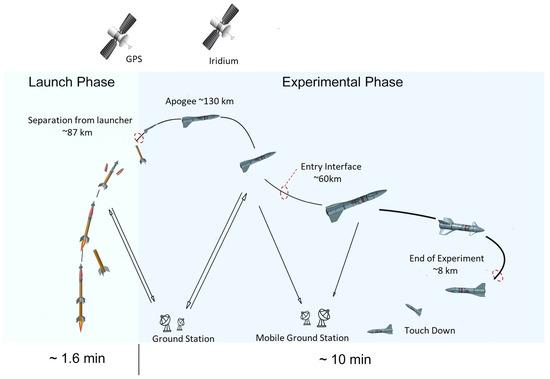
Figure 1.
Mission architecture and flight events [13].
A Brazilian solid propellant two-stage rocket, VSB-30, will be used during the launch phase. This rocket is unguided and only passively stabilized, leading to a considerable state uncertainty at separation. This uncertainty drives the need to perform a major trajectory update to generate a feasible trajectory from the position and velocity at separation to the target ellipsoid. During the launch phase, most of the re-entry segment is covered using a hammerhead fairing to minimize its aerodynamic effect. After the two stages are burned out, the rocket is spun down using a Yo-Yo system and both the fairing and the rocket are separated. The launch site is the Koonibba test range in Australia.
After separation and until EI, the atmosphere is not dense enough to meaningfully affect the motion of the vehicle, leading to a ballistic trajectory. During this ballistic flight, the uncertainty in position and velocity propagates, increasing considerably before reaching EI. The aerodynamic actuators are also not effective and, thus, the RCS is used. The objectives of this phase are (1) to detumble the vehicle after separation, (2) to acquire the location of the sun to improve the attitude information in the navigation solution, and (3) to reach EI with the desired attitude. During this phase, the guidance subsystem performs the major update of the trajectory that is described in this paper.
When EI is reached, the dynamic pressure is already high enough to (1) generate aerodynamic forces able to influence the trajectory and (2) control the attitude of the vehicle using the aerodynamic actuators. During this phase, the objective is to use the aerodynamic forces to correct the trajectory, compensating for the state dispersion at separation as well as other uncertainties and errors. The target point to be reached at EoE is defined in position and velocity. After EoE, the vehicle aims at dissipating as much energy as possible to minimize the ground impact.
2.2. GNC System
The GNC system is divided in two physical on-board computers (OBCs): the HNS (Hybrid Navigation System) and the GCC (Guidance and Control Computer) [14] (see Figure 2).
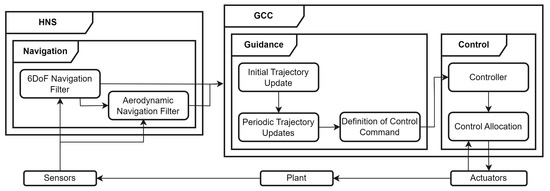
Figure 2.
Simplified functional architecture of GNC algorithms for ReFEx [14].
The HNS runs the navigation algorithms and interfaces with the sensors and with the GCC. The input of the sensors is fused to generate the navigation solution. The fusion is conducted using Extended Kalman Filters, executed at 400 Hz. The navigation message is sent at 80 Hz. For more information on the design of these algorithms, the reader is referred to [15,16].
The GCC runs the guidance and control algorithms. The control algorithms receive the reference command from guidance, the navigation message, and the measurements of the internal sensors of the actuators. The torque needed to follow the commanded attitude is computed as explained in [17]. The controller output (i.e., commanded torque) is then allocated to either thrusters (exo-atmospheric phase) or aerodynamic actuators (endo-atmospheric phase) [18]. Both steps are executed at 40 Hz.
The computation of the nominal trajectory in 3DoF (Three Degrees of Freedom) is explained in [12]. This trajectory propagates solely the translational state. This trajectory is updated by the guidance algorithms in two stages. An initial trajectory update aims at correcting for the dispersion in position and velocity after separation from the launcher by generating an updated trajectory leading from the estimated state to the target. This algorithm was originally introduced in [2], and is further explained in this paper. During the rest of the trajectory, periodic trajectory updates aim at correcting for the accumulating effect of modeling uncertainties and control errors [19]. A filter is added between this algorithm and the controller, ensuring that the angles, angular rates, and angular accelerations are smooth, while allowing discontinuities in the jerk.
The process to prepare these algorithms for integration in the flight software, as well as the investigation of their execution time when deployed in the flight hardware, is explained in [20].
2.3. Guidance-Specific Challenges
Among the main challenges that arose when designing and implementing the guidance algorithm are (1) the huge uncertainty in the state at separation, (2) the particularities of the flight constraints, and (3) the computational power available.
As the rocket used for the launch is unguided, the error (with regard to the nominal trajectory) at the separation point (when ReFEx detaches from the launcher) is potentially huge. Figure 3 shows the dispersion expected at separation in latitude, longitude and altitude. This figure also shows how the error at separation propagates until a dynamic pressure of 1000 Pa is reached. This threshold is selected based in the assumption that no meaningful correction of the trajectory via aerodynamic forces can be conducted at lower dynamic pressures. To gain perspective of the mission objectives, the target ellipsoid is also shown, with concentric circles of radius 5, 10, and 15 km. The high uncertainty regarding the position and velocity of the vehicle when reaching the defined threshold in dynamic pressure indicates that the nominal trajectory will need to be extremely modified in order to be able to reach the target with the desired altitude, velocity, and heading. In the figure, h is the altitude, the latitude, and the longitude.
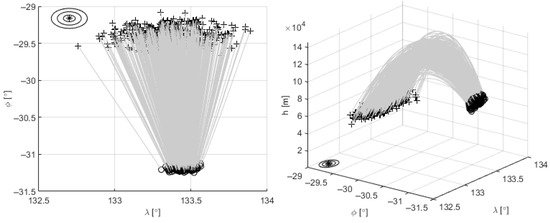
Figure 3.
Trajectory dispersion at separation (o) and reaching 1000 Pa (+). Target (*).
The flight constraints that need to be enforced during the mission can be divided in two main groups: (1) constraints to ensure the physical integrity of the vehicle and (2) constraints to ensure the controllability of the vehicle. The first group includes limitations in variables such as the load, dynamic pressure, heat flux, and heat load. The vehicle is designed such that these constraints are always met (for the envelope of trajectories considered) and, therefore, they do not need to be considered when designing the trajectory update.
The controllability of the vehicle is ensured via three constraints: (1) limitation in the angular rate, (2) limitation in the angular acceleration, and (3) imposition of a flying corridor in Mach (Ma) and angle of attack (). The reason for a flying corridor is that, due to the aerodynamic properties of the vehicle, there are combinations of Ma and where the vehicle is underactuated. A trimability analysis was performed in the Mach- domain for different values of the angle of sideslip (). Trimability is defined as the existence of a set of deflections in the aerodynamic actuators (canards and rudder) that lead to the vehicle being trimmed in all axes. Based on this trimmability analysis (see [2,18]), a flight corridor is defined with the aim of minimizing the time spent in underactuated and potentially unstable regions (see Figure 4).
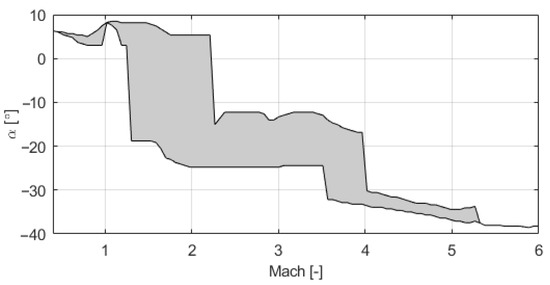
Figure 4.
Path constraints for with regard to Ma.
The nature of the path constraint in Ma and is particularly complicated as Ma is not always decreasing and the translation of this corridor to any other set of variables is defined differently for each trajectory.
The guidance algorithms are executed in the Guidance and Control Computer (GCC) (see Figure 5). The GCC consists of one computer stack, composed of three stackable PCI/104-Express boards from RTD Embedded Technologies, Inc. [20]. The three boards are a processor board, a CAN interface board, and a power supply board. All boards are enclosed within a ruggedized housing. In relation with this paper, the most relevant board is the processor board. This board is a PCI/104-Express single-board computer. with PCIe Type 2 and PCI expansion busses. It features an Intel Atom E3845 1.91 GHz quad-core processor with 4 GB DDR3 SDRAM and an on-board 32 GB SSD. The algorithms need to be optimized in order to comply with the need to execute the trajectory update between the separation from the launcher and the Entry Interface (see Figure 1), with the computing power provided by this processing board.
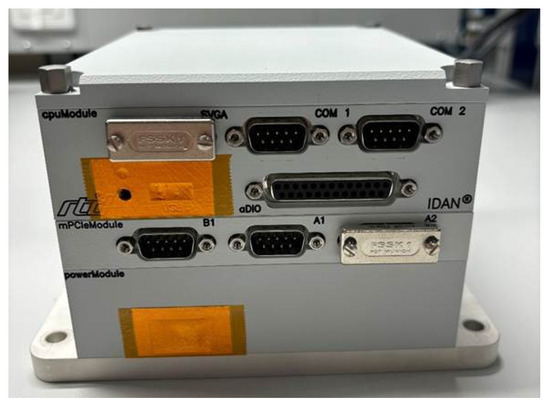
Figure 5.
Guidance and Control Computer (GCC) [20].
3. Problem Definition
As previously mentioned, the objective of the algorithm presented in this paper is to perform a major update of the trajectory to correct for the error in position and velocity after ReFEx separates from the VSB-30 launcher.
The starting point for this update is the nominal trajectory (see [12]). The nominal trajectory contains the evolution of the state, using the equations of motion defined in Appendix A, for the nominal profile of and bank angle (), assuming nominal position and velocity at separation. The update of the trajectory aims at modifying the profiles of and such that the resulting trajectory connects the estimated state at separation with the desired target at EoE. In order to evaluate the evolution of the trajectory for given profiles of and , the dynamics and kinematics of the vehicle are modeled as shown in Appendix A. Finding angular profiles that are able to generate a suitable trajectory presents certain challenges that are explained in Section 2.3.
Throughout this section, this problem is first enunciated as an optimal control problem (see Section 3.1). The computational cost of this approach is too high to consider it for the on-board software, and developing and verifying an optimal control solver to be used on-board is outside the scope of the mission. In order to solve this issue, the problem is reduced using a dual approach. First of all, the control vector is parameterized, transforming the optimization variable from a continuous-time signal to a discrete set of parameters (see Section 3.2). Then, a function that propagates the trajectory based on the value of those parameters is implemented. This function also incorporates the path and control constraints (see Section 3.3). The aggregate of these approaches transforms the problem into a non-linear unconstrained optimization problem with a finite (and small) number of control parameters.
3.1. Optimal Control
Despite its limitations regarding on-board usage, this approach is fundamental in providing a valid benchmark and an upper limit on the optimality of the resulting trajectory. For broader information on the optimal control problem theory and practical approaches on how to define optimal control problems, the author recommends [8,21].
For this optimal control problem, the state vector considered is
where r is the distance to Earth’s center, is the norm of the velocity with regard to the ground, is the flight path angle of the velocity with regard to the ground, and is the heading angle of the velocity with regard to the ground.
The angle of sideslip () is not considered as part of the state, as it is not used for guidance purposes (i.e., its command is always zero). The control vector is
The use of angular accelerations as part of the control vector enables constraints to be imposed in both angular accelerations and rates. It also enforces smoothness in the solution. The time derivative of the state vector is composed of the translational kinematics
and dynamics
where the different components of the force (F) are shown in Appendix A, m is the mass, and is the angular rate. The rotational kinematics
and dynamics
are also considered [22].
The position and velocity are defined by the state at separation, and , , , and are unconstrained. Through the trajectory, limitations in the maximum value of and and of and are imposed according to requirements. Additionally, a path constraint is defined, ensuring that is within the corridor defined in Figure 4 at each collocation point. The final time is an unconstrained variable.
The cost function to be minimized consists of the addition of the following two terms:
where E is the total energy per unit of mass; , , , and are defined based in the required accuracy in each of those state variables; and combines the accuracy requirements on r and v. This ensures that the variables in which accuracy requirements are imposed (r, , , , and ) are optimized.
The general-purpose MATLAB software program GPOPS–II is used to solve this problem. This software employs a Legendre–Gauss–Radau quadrature orthogonal collocation method where the continuous-time optimal control problem is transcribed to a large sparse non-linear programming problem (NLP). An adaptive mesh refinement method is implemented that determines the number of mesh intervals and the degree of the approximating polynomial within each mesh interval to achieve a specified accuracy. More information about this tool can be found in [23].
3.2. Control Vector Parameterization
Even though solving the full optimal control problem can provide valid solutions to the trajectory update, it comes at a high computational cost and development effort. Strategies to define a more time efficient subproblem often involve iterative solving methods, such as successive convexification [24] or iterative linearization [25]. The proposed strategy focuses instead on simplifying the optimal control problem into a ’small’ non-linear unconstrained optimization problem, finding inspiration in bank angle modulation and predictor–corrector approaches. The first step in this direction is to reduce the control vector from a (two-dimensional) continuous-time signal (see (2)) to a discrete set of parameters () such that
where is the state vector. This simplifies the optimization problem, as it reduces the size of the control vector enormously. However, this also reduces the available optimization space, potentially limiting the quality of the solution found. Therefore, the selection of this set of parameters is not trivial and should be conducted taking into account the characteristics of the original optimal control problem, in order to be certain that the resulting solution space is enough to find a solution for the envelope of initial conditions. In this case, the envelope of initial conditions is defined by the uncertainty in position and velocity after the ascent phase, when the vehicle ReFEx separates from the launcher. The selection of control parameters is explained in Section 4.1.
For this transcription of the problem, the state and control vectors are slightly different than those shown in (1) and (2), and are expressed as
The control parameter () contains parameters related to the evolution of both and in the energy domain. The resulting temporal evolution of the control variables ( and ) can be expressed as
where E is the total energy per unit of mass, expressed as
where is Earth’s standard gravitational parameter.
3.3. Trajectory Propagation
After the evolution of the control vector is defined as the set of control parameters , the next step is to implement a function that propagates the trajectory based in the initial state () and the control parameters .
Function F propagates the state vector (see (13)) using the vehicle dynamics described in Appendix A. The propagation uses an adaptive Runge–Kutta method, with methods of order 4 and 5. Therefore, a variable time-step is used to ensure the propagation tolerances are fulfilled at every step while reducing the computational time.
The constraints in the angular rates, angular accelerations, and angle of attack are imposed directly in this function. The path constraint in the angle of attack is imposed by extracting the Ma at each propagation step, computing the maximum and minimum commanded based on that Ma, and imposing those limits in the commanded . The limits on the angular rates and angular accelerations are considered individually for each angle ( and ) and are imposed over the angular acceleration every propagation step as
where is a generic angle and the subindices min and max represent the design constraints.
As the objective of the optimization is limited to the difference between the state at EoE and the target state, function F can be modified to
so that the effect of changes in in the final error can be studied directly. It is not feasible to reach the objective in the same time for all trajectories (see Section 2.3) and it is not part of the mission objectives. Therefore, the final time is not included as an optimization variable. Instead, the constraint defined in (11) is used to determine the end of the propagation, leading to
4. Problem Solution
From Section 3, the theoretical base of the algorithm has been defined, but there are still two open points, linked to the actual implementation: (1) which parameters to use in the control vector and (2) how to solve the resulting optimization problem. This section aims to answer both of these questions.
4.1. Control Vector Parameters
From the nature of the problem (see Section 3.1), it is clear that and are the most relevant control variables. The strategy in this regard is to define parameterized profiles for this variables, performing a trade-off between control vector size and commanding capabilities.
The concrete control parameters selected are based on prior experience and experimental tuning, as well as the influence of bank modulation strategies [5]. In relation to , four intervals are defined in the energy domain (see Figure 6). These four intervals are separated by three energy thresholds, two of which are control parameters. Through each interval, is constant, leading to four constants that are part of the control parameter set . Regarding , an initial profile in the energy domain is provided, based on the nominal trajectory. This profile is divided in five intervals in the energy domain, as shown in Figure 6. In each interval, a constant offset is added to the initial profile. These five offsets are control parameters.
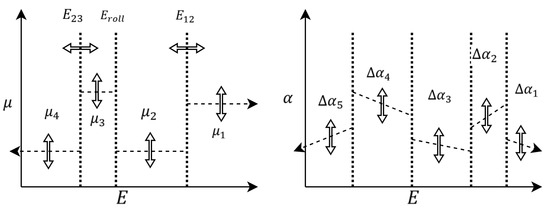
Figure 6.
Schematic representation of the control parameters. These parameters define the and profiles with regard to E.
The energy threshold named is fixed in the energy domain, and defines one of the most critical maneuvers that the vehicle performs during the flight: transitioning from flying ‘belly up’ to flying ‘belly down’. This transition, shown in (22), is driven by the particularities of the aerodynamics of the vehicle. These particularities mean that at hypersonic regimes the vehicle shall fly with negative , and with positive at transonic and subsonic regimes. The conditions in are driven by the desire to produce a lift in the upwards direction.
The resulting parameterized control vector is
Figure 7 contains the nominal profiles, with vertical lines marking the intervals described in Figure 6.
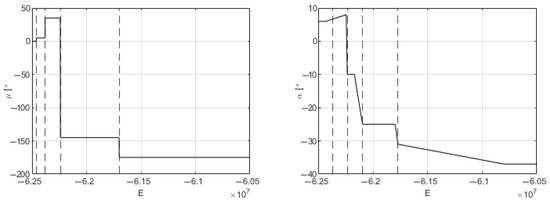
Figure 7.
Nominal profiles of and with regard to E. This is the representation of Figure 6 for the actual mission.
The correlation between the different control parameters was investigated in order to further understand their interdependency, as this can have implications for the structure and conditioning of the optimization problem. The correlation is studied using the Hessian matrix, which was computed numerically in an equivalent manner to the Jacobian (27).
The results are shown in Figure 8 and Figure 9, for the correlation between the control parameters at different iterations of the optimization process (i.e., with different initial guesses). From these figures, two conclusions can be drawn. First of all, there is a high correlation between the different parameters with regard to all objective variables. This can lead to slow converge and sensitivity to initial conditions in methods that do not use the Hessian. Secondly, the correlation can change extremely during the optimization process. This has two implications: (1) potential redundancies between parameters that could be indicated by high constant correlations are not present, and (2) the local curvature of the objective function is highly non-stationary (leading to additional challenges in optimization convergence).

Figure 8.
Correlation between control parameters () for each objective variable (r, , , ). More than 0.4 in white, and less than in black. Computed at iteration 1 of run 1 from Monte Carlo shown in Section 6.2.

Figure 9.
Correlation between control parameters () for each objective variable (r, , , ). More than 0.4 in white, and less than in black. Computed at iteration 26 of run 1 from Monte Carlo shown in Section 6.2.
One strategy that was investigated in order to reduce the effects of this high correlation was to perform a dimensionality reduction in the control space once certain conditions applied. This way, after a threshold in the number of iterations or rejected updates has been reached, the control vector is modified to (24). The implementation is such that the different control parameters can be activated or deactivated at each iteration, opening the door to online selection of active control variables (e.g., based on Jacobian sensitivity). This approach proved successful in improving the convergence of the solution.
4.2. Optimization Problem
With the definition of F shown in (21), different optimization techniques can be used to find an optimal solution for the set of control parameters . The options considered are the following:
- MISO (Multiple Input Single Output) optimization problem.
- MIMO (Multiple Input Multiple Output) 0-search.
Both options rely on a shooting method approach, such as the one described in [8]. For option 1, the cost function is the term in (11). The problem is then solved using the MATLAB optimization function fmincon. This option is developed solely as a benchmark, in order to evaluate the performance of the actual algorithm (see option 2).
The 0-search algorithm is implemented by the author for this specific problem. It is based on the work presented in [8]. This approach is equivalent to expressing the original objective as a hard constraint and solving the resulting feasibility problem. This method aims at finding a such that
This 0-search was initially conducted using Newton’s method such that
where J is the Jacobian, k the iteration, and is a scalar. The quality of the update is evaluated using Equation (11) as a merit function. The Jacobian consists of the partial derivative of with regard to , with both variables scaled to avoid badly conditioned Jacobians.
The partial derivatives are computed numerically using centered differences. Therefore, in order to compute J (necessary at each step of Newton’s method) the trajectory propagation function (see (20)) needs to be executed at twice the size of , i.e., 22 times. As this is computationally expensive, and in order to maximize the use of the information generated when computing J, a line search algorithm was also implemented, modifying parameter . In order to perform a more global search in the first few iterations, the deltas used to compute the partial derivatives are not constant but variable, going lower as the certainty of having converged to a minimum increases. The deltas also define the trust region, limiting the region where the updated solution is allowed to be.
Two additions were made to this algorithm. First of all, in order to reduce the divergence from the nominal trajectory, a term penalizing the cumulative corrections on the control vector () was introduced. This leads to a modified search direction such that
with Q a cost matrix penalizing the different terms of the control vector.
Secondly, the trajectory propagations required for Jacobian computation were identified as the most computationally intensive component of the algorithm. To reduce execution time, these propagations were optimized by limiting them only to the portion of the trajectory that is influenced by a given control parameter and any subsequent segments. For example, since the control parameter only becomes active after event , the computation of is performed by initializing the trajectory at the nominal state at and propagating only the remaining segment. This approach leads to an approximate 30% reduction in execution time.
5. Target Definition
The nominal target is defined by flying the nominal and profiles, while making sure that the limitations in flight corridor and angular rates and accelerations are respected. The nominal initial state is computed as the average of all available ascent trajectories.
The analyses shown in Section 6.2 point to the impossibility of reaching the nominal target for a certain combination of errors in the state at separation. This impossibility is handled by (1) defining offline an envelope from which the main target can be reached, (2) grouping the remaining cases outside that envelope, and (3) defining alternative targets for each of these groups.
In order to study this envelope, a Monte Carlo run with increased uncertainties is executed (see Figure 10a). To mathematically define this envelope in a manner that future updates of ascent trajectories can be easily processed in a repeatable manner, the envelope of convergence is defined automatically using regularized logistic regression [26]. As the objective is to evaluate whether the main target is reachable after conducting (maximum) one trajectory propagation, the idea is to define a function such as
where is the state at separation and is the final state when propagated with nominal . This approach consists of minimizing the cost function
where y is the target vector (reachability of the nominal target, [0, 1]), X is the design matrix (can be any combination of and ), is the regularization factor, is the parameter vector (that defines the resulting envelope), and is the sigmoid function
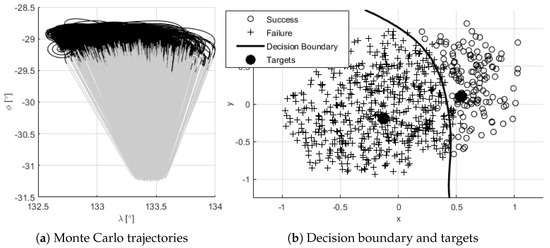
Figure 10.
Definition of convergence envelope for main target.
Figure 10b contains the visualization of the convergence envelope. The results point towards the possibility of defining this convergence envelope based solely on and . To verify this possibility, the design matrix is defined as a polynomial combining the normalized and up to order 5. The parameter vector is obtained using 75% of the datapoints (of a total of 1000 runs) while the other 25% is used to test the accuracy of the resulting envelope. The training accuracy is and the testing accuracy is , which is considered acceptable, taking into account the inflated uncertainty that was considered for this Monte Carlo campaign. The resulting decision boundary is shown in Figure 10b.
For this mission, it is apparent that the points outside the envelope can be grouped in one cluster and, therefore, only one alternative target needs to be defined. This additional target is defined by shifting the nominal target’s latitude and longitude (the remaining variables remain the same) in a direction defined by the relative position of the centroids of successful and unsuccessful cases. Figure 10b shows the position of both nominal and alternative targets. The performance of the algorithm, including the selection of an alternative target, is shown in Section 6.3.
6. Results
This section presents a comparison between the performance of the three formulations explained throughout the paper:
- Opt. Control: Solving the discretized optimal control problem, using the time profiles and as control variables. This leads to a high-dimensional sparse static non-linear constrained optimization problem. This approach is used as a baseline.
- Optimization: Reducing the problem to a low-dimensional dense non-linear unconstrained MISO optimization problem, using the set of control parameters as the control vector. This approach is used as a baseline.
- 0-Search: Reducing the problem to a MIMO 0-search problem, also using set of control parameters as the control vector. This approach is integrated into the flight software.
Each strategy has its own advantages and disadvantages. The first one provides the broadest optimization space, as the complete time profiles of and are used to optimize the trajectory. However, it is computationally more expensive, requiring on average approximately ten times more time to generate a solution compared to the 0-search method. Even though some of this difference might originate from non-optimal algorithm implementations, the author does not expect it to reduce dramatically using alternative implementations. The effort required to develop a real-time safe optimal control solver would also be considerable. The other two methods have a restricted optimization space, defined by the set of control parameters. This set of parameters is chosen with the aim of ensuring that the resulting optimization space is enough to find a valid trajectory from the expected dispersion of the separation state. On the other hand, as a result of this problem reduction, a solution can be found one order of magnitude faster, making these parameters more suitable candidates for on-board software. The differences between the optimization and the 0-search lie in the method used to find the solution.
The analyses included in this section are as follows:
- An example of how a limited number of trajectories is optimized by each strategy.
- Performance evaluation with only a nominal target.
- Performance evaluation including an alternative target.
- An assessment of execution time in a processor.
The assessments in 2, 3, and 4 are based on the same 500-run Monte Carlo campaign.
6.1. Examples
The aim of this section is to explain the qualitative differences in the different methods compared, using the first three runs of the Monte Carlo campaign conducted for the analysis in Section 6.2.
Figure 11 shows the optimized trajectories using each strategy. It can be observed that very different solutions are found, while finding a solution to the problem of similar quality. This indicates that the problem analyzed has a considerable number of valid solutions. Additionally, it can be observed that for the most eastwards of the trajectories, all strategies struggle to find a suitable candidate.
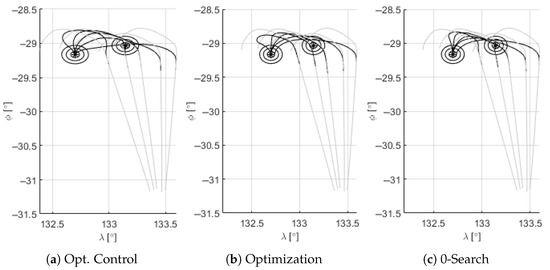
Figure 11.
Example of nominal (gray) and optimized trajectories (black).
Figure 12 shows the evolution of and for the five cases presented in Figure 11. It can be observed that the optimal control approach has more flexibility in the modifications to the nominal profile. The reduction in flexibility in the optimization and 0-search approaches can be seen in the more uniform profiles (e.g., between two energy points, the commanded is constant). This can meaningfully reduce the resulting solution space.
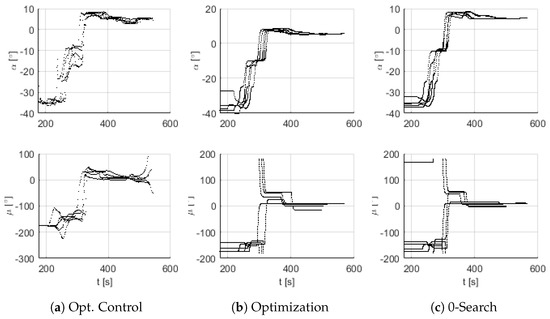
Figure 12.
Example of optimized control profiles.
6.2. Performance with Nominal Target
The performance of the different strategies is compared in two steps. First, the cost function at (11) is extended to also include the velocity component and analyzed at a variable level, as shown in (32). The reference values are based on the accuracy requirements for each variable. If the success condition (s) is not met, the case is considered a failure, reported as such and not considered for the later analyses on the performance.
Figure 13 shows the horizontal state at EoE for each strategy. Table 1 shows the percentage of successful and failed cases. It can be observed that with all strategies there are some cases that are not able to reach the target. These cases were identified as problematic due to the magnitude of state error at separation. In particular, heading errors eastwards seem to be a major problem. The strategy to deal with these cases consists of defining an alternative target and is defined in Section 5.
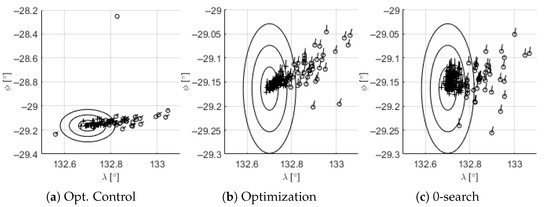
Figure 13.
Horizontal state at EoE. Success (+), failure (o).

Table 1.
Performance with only nominal target.
The overlap in the failed cases is such that around 90% of the failures obtained with the optimization and the 0-search are common. This is to be expected, as they share the same control vector. Around 90% of the failures using the optimal control approach are also failures using the other two. This indicates that there are a number of cases where there is no feasible solution to reach the target, as it is not found by any of the presented methods. However, it is also apparent that every method can be improved, as every method has runs where only it fails. The failures are assumed to be caused by two factors: (1) limited solution space (see Section 4.1), and (2) abundance of local minima.
For the successful cases, the errors at EoE in r, , , v, and are approximated as normal distributions. The resulting distributions are shown in Figure 14. The error requirements for the flight (for understanding the quality of the performance) are the following: : 20,000 m; : 20,000 m; : 1000 m; : 100 m; and : 20 deg. It can be observed that the discretized optimal control problem can achieve extremely accurate solutions in more cases. However, the level of accuracy reached by the 0-search and optimization approaches is well within requirements and determined mainly by exit conditions for the search.

Figure 14.
Performance comparison with only nominal target.
Between the optimization and 0-search approaches, the main difference lies in the number of function evaluations that are necessary to reach the final solution. The optimization strategy requires on average between 4 and 5 times the evaluations that are required for the 0-search to achieve similar performance.
6.3. Performance Including Alternative Target
For this analysis, the strategy for selecting the target explained in Section 5 is used. This results in 11.8% of the cases being redirected to the alternative target, with a direct impact on the success rates of the mission. Similarly, as in Section 6.2, Table 2 contains the success rates of each strategy. It can be seen that the success rate is considerably higher, even though there are still some cases failing. The cause of these failures is assumed not to be due to feasibility but rather to convergence to local minima with high gravitational pull. In the case of the optimal control approach, there are also cases in which the algorithm does not converge to a meaningful solution. It is expected that this would be solvable by further refinement of this strategy (out of the scope as this paper, as this strategy is only used as a baseline). The basis of these assumptions is that there are no failed cases in common between any strategy. For the 0-search, this was confirmed further, as small modifications to the initial guess (e.g., modifying the by 1 degree) led to its success.

Table 2.
Performance including alternative target.
Figure 15 shows the horizontal error at EoE for the three strategies, to help visualize the performance of each case. It can be seen that the feasibility problem with eastward initial states is solved by the addition of the alternative target.
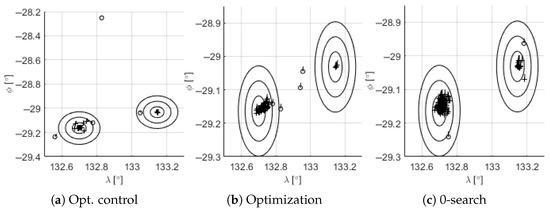
Figure 15.
Horizontal state at EoE. Success (+), failure (o).
Figure 16 contains the performance of each approach, approximated as a normal distribution. In this case, as previously, the optimal control approach delivers the most accurate solution, but all approaches are within requirements.

Figure 16.
Performance comparison including alternative target.
6.4. Assessment of Execution Time in Processor
The same approach as explained in [20] is followed, but including the updates in the code and in the ascent trajectories as well as more extensive testing. For the development and verification process (including the automatic generation of the algorithm code), see [20]. The results shown in this section result from the execution of the automatically generated C++ code for the algorithms in the STHiL platform. The STHiL platform features an engineering model of the GCC, with equivalent hardware. The combination of the test cases for the different trajectories and the functions under test is compiled locally for the open-source Real-Time Operating System RTEMS before deployment. Only the 0-search approach is implemented here, as it is the selected implementation for the flight.
The same Monte Carlo campaign as shown in Section 6.3 is conducted. Figure 17 shows the execution time as a function of the number of iterations required. It can be seen that the execution time has a linear dependency with the number of iterations until approx. 40 iterations. This is because the dimensionality reduction explained in Section 4.1 is activated at this iteration. The time depends mainly on the trajectory propagation time multiplied by the time the trajectory is propagated, and this time is directly linked to the size of the control vector. The requirement for execution time is linked to the duration of the exoatmospheric phase (which ranges between 150 and 200 s). Therefore, it considered that the execution time of this algorithm makes it flight-capable. Nevertheless, additional investigations can be performed to reduced the time. One example is that it was observed that removing the control parameter does not have any negative effect on the performance of the algorithm, potentially reducing 10% of the time.
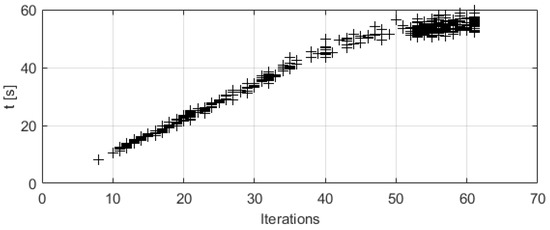
Figure 17.
Execution time in flight processor (0-Search algorithm).
Figure 18 shows the performance of the results obtained. As explained in [20], numerical differences are expected and the verification effort is invested into verifying performance compliance instead of numerical equivalence. The failure cases are the same. It can be seen that the results have similar performance to the results obtained in a MATLAB environment.

Figure 18.
Performance executed in a flight processor (0-search algorithm).
7. Conclusions
The guidance algorithms developed for the demonstrator mission ReFEx aim at two main objectives: (1) to correct for the uncertainty after the ascent phase, and (2) to correct for errors in control, navigation, and modelling during the re-entry. This paper focuses on an algorithm targeting the first of these objectives, which is particularly challenging due to the high uncertainty inherent to the unguided rocket used in the ascent phase. Therefore, this algorithm aims at updating the trajectory after separation, producing a trajectory from the current estimate of position and velocity to the target.
This problem, producing an updated trajectory, is first transcribed as an optimal control problem. While this can be used as a baseline to study the performance of the algorithms developed, it is computationally too expensive to be used on-board and it would require a high development effort. The approach proposed in this paper reduces the size of the problem using a parametrization of the control function, i.e., angle of attack and bank angle profiles. After defining the set of control parameters, which needs to account for the particularities of the mission, a function that propagates the trajectory is defined. This function outputs the state at EoE (End of Experiment) based on the initial state and the control parameters, and it incorporates all the constraints. Several approaches to solve this function are then introduced, including (1) treating the problem as an unconstrained MISO optimization problem and (2) treating the problem as a MIMO 0-search problem.
The results show that the effect of the problem reduction on the quality of the solution trajectory is limited and does not threaten the fulfillment of the requirements, therefore validating the selection of control parameters. When comparing the two approaches used to solved the reduced problem, it is clear that (for the implementations described in this paper) the 0-search approach is superior, as it requires a lower number of iterations and converges to similarly accurate solutions.
The analyses also highlight the possibility of finishing the ascent phase with a combination of position and velocity from which the nominal target is not reachable. The envelope from which the nominal target can be reached is estimated using a regularized logistic regression approach, and the cases outside this envelope are redirected to an alternative target.
The execution of the algorithms in a hardware-equivalent of the on-board computer validate their real-time capability. This analysis was also used to verify the performance of the automatically generated C++ code, executed in the operating system used for the flight.
Author Contributions
Conceptualization, J.L.R.G. and D.S.; Methodology, J.L.R.G.; Software, J.L.R.G.; Validation, J.L.R.G.; Formal Analysis, J.L.R.G.; Investigation, J.L.R.G.; Resources, J.L.R.G.; Data Curation, J.L.R.G.; Writing—Original Draft Preparation, J.L.R.G.; Writing—Review and Editing, J.L.R.G., D.S. and S.T.; Visualization, J.L.R.G.; Supervision, J.L.R.G., D.S. and S.T.; Project Administration, J.L.R.G., D.S. and S.T.; Funding Acquisition, S.T. All authors have read and agreed to the published version of the manuscript.
Funding
This research received no external funding.
Data Availability Statement
Data available on request due to restrictions (because of export control regulations).
Acknowledgments
During the preparation of this manuscript, the authors used ChatGPT 4o for the purposes of reviewing text. The authors have reviewed and edited the output and take full responsibility for the content of this publication.
Conflicts of Interest
The authors declare no conflicts of interest.
Correction Statement
This article has been republished with a minor correction to the Data Availability Statement. This change does not affect the scientific content of the article.
Abbreviations
The following abbreviations are used in this manuscript:
| ReFEx | reusable flight experiment |
| GNC | guidance, navigation, and control |
| RLV | reusable launch vehicle |
| VTHL | vertical takeoff, horizontal landing |
| EoE, EI | end-of-experiment, entry interface |
| OBC | on-board computer |
| HNS | hybrid navigation system |
| GCC | guidance and control computer |
| angle of attack, angle of sideslip, bank angle | |
| dynamic pressure, Mach, density, total energy | |
| lift, drag and aerodynamic coefficients for lift and drag | |
| force, angular rate, mass | |
| altitude, distance to Earth’s center, latitude, longitude | |
| velocity norm, flight path angle, heading angle | |
| time derivate of x, double time derivate of x | |
| control profiles, vector of control parameters |
Appendix A. External Forces—3DoF Model
The two contributions to the external forces that are considered are (1) gravity () and (2) aerodynamic () forces.
The gravity acceleration is obtained based on a model including the J2 term and expressed in ECEF (Earth-Center–Earth-Fixed). The transformation to the NED (North–East–Down) frame can be expressed as
To express this acceleration in relation to v, , and (i.e., in spherical coordinates), the transformation between v, , and and is defined as
and therefore
The aerodynamic acceleration depends on (1) the aerodynamic properties of the vehicle, (2) the atmosphere (i.e., temperature and density), and (3) the velocity with regard to the local atmosphere, i.e., including the wind. The aerodynamic properties of the vehicle were determined by the Institute of Aerodynamics and Flow Technology, also part of DLR, using CFD (Computational Fluid Mechanics) simulations. More information about the generation of this database and its validation can be found in [27,28]. For the atmosphere, the NRLMSISE-00 Atmosphere Model is used. The wind model is obtained based on HWM14 (Horizontal Wind Model 14). The aerodynamic lift L and drag D accelerations can be then expressed, assuming no angle of sideslip and that the vehicle is symmetric with regard to the XZ-plane, as
where is the density, Ma the Mach, and m the mass. The subscript W denotes the local atmosphere including the wind. The aerodynamic acceleration can be expressed with regard to W as
References
- Rickmers, P.; Dumont, E.; Krummen, S.; Redondo Gutierrez, J.L.; Bussler, L.; Kottmeier, S.; Wübbels, G.; Martens, H.; Woicke, S.; Sagliano, M.; et al. The CALLISTO and ReFEx Flight Experiments at DLR—Challenges and Opportunities of a Wholistic Approach. In Proceedings of the Ascension Conference 2023, Dresden, Germany, 12–14 September 2023. [Google Scholar] [CrossRef]
- Redondo Gutierrez, J.L.; Seelbinder, D.; Theil, S. Design of ReFEx Guidance: Trajectory Correction after Ascent. In Proceedings of the AIAA Science and Technology Forum and Exposition, AIAA SciTech Forum 2023, National Harbor, MD, USA, 23–27 January 2023. [Google Scholar] [CrossRef]
- Graves, C.A. Apollo Experience Report: Mission Planning for Apollo Entry; National Aeronautics and Space Administration: Washington, DC, USA, 1972.
- Harpold, J.C.; Gavert, D.E. Space shuttle entry guidance performance results. J. Guid. Control Dyn. 1983, 6, 442–447. [Google Scholar] [CrossRef]
- Lu, P. Entry guidance and trajectory control for reusable launch vehicle. J. Guid. Control Dyn. 1997, 20, 143–149. [Google Scholar] [CrossRef]
- Braun, R.D.; Powell, R.W. Predictor-corrector guidance algorithm for use in high-energy aerobraking system studies. J. Guid. Control Dyn. 1992, 15, 672–678. [Google Scholar] [CrossRef]
- Joshi, A.; Sivan, K.; Amma, S.S. Predictor-corrector reentry guidance algorithm with path constraints for atmospheric entry vehicles. J. Guid. Control Dyn. 2007, 30, 1307–1318. [Google Scholar] [CrossRef]
- Betts, J.T. Practical Methods for Optimal Control and Estimation Using Nonlinear Programming; SIAM: Philadelphia, PA, USA, 2010. [Google Scholar] [CrossRef]
- Wang, Z.; Grant, M.J. Autonomous entry guidance for hypersonic vehicles by convex optimization. J. Spacecr. Rocket. 2018, 55, 993–1006. [Google Scholar] [CrossRef]
- Bae, J.; Lee, S.D.; Kim, Y.W.; Lee, C.H.; Kim, S.Y. Convex optimization-based entry guidance for spaceplane. Int. J. Control Autom. Syst. 2022, 20, 1652–1670. [Google Scholar] [CrossRef]
- Rickmers, P.; Bauer, W.; Stappert, S.; Sippel, M.; Redondo Gutierrez, J.L.; Seelbinder, D.; Bernal Polo, P.; Razgus, B.; Theil, S.; Acquatella, B.P.; et al. The Reusability Flight Experiment–ReFEx: From Design to Flight–Hardware. In Proceedings of the IAC. International Aeronautical Congress 2021, Dubai, United Arab Emirates, 25–29 October 2021. [Google Scholar]
- Bussler, L.; Redondo Gutierrez, J.L.; Rickmers, P. ReFEx: Reusability Flight Experiment—Trajectory Design. In Proceedings of the 10th European Conference for Aeronautics and Space Sciences (EUCASS), Lausanne, Switzerland, 9–13 July 2023. [Google Scholar] [CrossRef]
- Bauer, W.; Rickmers, P.; Kallenbach, A.; Stappert, S.; Wartemann, V.; Merrem, C.H.J.; Schwarz, R.; Sagliano, M.; Grundmann, J.T.; Flock, A.; et al. DLR reusability flight experiment ReFEx. Acta Astronaut. 2020, 168, 57–68. [Google Scholar] [CrossRef]
- Redondo Gutierrez, J.L.; Seelbinder, D.; Theil, S.; Bernal Polo, P.; Gäßler, B.; Robens, J.; Acquatella, B.P. ReFEx: Reusability Flight Experiment - Architecture and Algorithmic Design of the GNC Subsystem. In Proceedings of the Aerospace Europe Conference 2023—10th EUCASS—9th CEAS, Lausanne, Switzerland, 9–13 July 2023. [Google Scholar] [CrossRef]
- Dias Basto da Silva, J.G.; Redondo Gutierrez, J.L.; Bernal Polo, P. ReFEx Navigation Design: Improvements to the Navigation Filter. In Proceedings of the International Astronautical Congress, IAC, Milan, Italy, 14–18 October 2024. [Google Scholar]
- Fachadas Escalda, T.J.G. Design and Implementation of a Navigation Postprocessing Framework for the Reusability Flight Experiment (ReFEx). Master’s Thesis, Instituto Superior Técnico Lisboa, Lisbon, Portugal, 2025. [Google Scholar]
- Robens, J.; Gäßler, B. ReFEx: Reusability Flight Experiment—Design of an Exoatmospheric Control System. In Proceedings of the 10th European Conference for Aeronautics and Space Sciences (EUCASS), Lausanne, Switzerland, 9–13 July 2023. [Google Scholar] [CrossRef]
- Redondo Gutierrez, J.L.; Seelbinder, D.; Robens, J.; Acquatella, P. Design of a Control Allocation Solution for the Winged Reusable Launch Vehicle ReFEx. In Proceedings of the AIAA Scitech 2022 Forum, San Diego, CA, USA, 3–7 January 2022; p. 1842. [Google Scholar] [CrossRef]
- Redondo Gutierrez, J.L.; Seelbinder, D.; Theil, S. Design of ReFEx Guidance: Periodic On-Board Trajectory Updates. In Proceedings of the AIAA SciTech 2024 Forum, Orlando, FL, USA, 8–12 January 2024. [Google Scholar] [CrossRef]
- Redondo Gutierrez, J.L.; Wenzel, A.; Seelbinder, D.; Theil, S. Flight Readiness of ReFEx Guidance: Preparation for Integration Into Flight Software. In Proceedings of the AIAA SciTech 2025 Forum, Orlando, FL, USA, 6–10 January 2025. [Google Scholar] [CrossRef]
- Trélat, E. Optimal control and applications to aerospace: Some results and challenges. J. Optim. Theory Appl. 2012, 154, 713–758. [Google Scholar] [CrossRef]
- Mooij, E. The Motion of a Vehicle in a Planetary Atmosphere; Report LR-768; Delft University of Technology, Faculty of Aerospace Engineering: Delft, The Netherlands, 1994. [Google Scholar]
- Patterson, M.A.; Rao, A.V. GPOPS-II: A MATLAB software for solving multiple-phase optimal control problems using hp-adaptive Gaussian quadrature collocation methods and sparse nonlinear programming. ACM Trans. Math. Softw. (TOMS) 2014, 41, 1–37. [Google Scholar] [CrossRef]
- Mao, Y.; Szmuk, M.; Açıkmeşe, B. Successive convexification of non-convex optimal control problems and its convergence properties. In Proceedings of the 2016 IEEE 55th Conference on Decision and Control (CDC), Las Vegas, NV, USA, 12–14 December 2016; pp. 3636–3641. [Google Scholar] [CrossRef]
- Li, W.; Todorov, E. Iterative linearization methods for approximately optimal control and estimation of non-linear stochastic system. Int. J. Control 2007, 80, 1439–1453. [Google Scholar] [CrossRef]
- Vidaurre, D.; Bielza, C.; Larranaga, P. A survey of L1 regression. Int. Stat. Rev. 2013, 81, 361–387. [Google Scholar] [CrossRef]
- Merrem, C.H.J.; Wartemann, V.; Eggers, T. Aerodynamic Data Set Generation for the Experimental Vehicle ReFEx. In Notes on Numerical Fluid Mechanics and Multidisciplinary Design; Springer: Cham, Switzerland, 2021; pp. 132–140. [Google Scholar] [CrossRef]
- Wartemann, V.; Konosidou, N.; Flock, A.K.; Merrem, C.H.J. Contribution of Numerical and Experimental Flow Simulations to the Aerodynamic Data Base of the DLR Reusable Flight Experiment ReFEx. In Notes on Numerical Fluid Mechanics and Multidisciplinary Design; Springer: Cham, Switzerland, 2021; Volume 151. [Google Scholar] [CrossRef]
Disclaimer/Publisher’s Note: The statements, opinions and data contained in all publications are solely those of the individual author(s) and contributor(s) and not of MDPI and/or the editor(s). MDPI and/or the editor(s) disclaim responsibility for any injury to people or property resulting from any ideas, methods, instructions or products referred to in the content. |
© 2025 by the authors. Licensee MDPI, Basel, Switzerland. This article is an open access article distributed under the terms and conditions of the Creative Commons Attribution (CC BY) license (https://creativecommons.org/licenses/by/4.0/).