Article

Failure Analysis of Composite Curved Beam with Initial Delamination Damage

Laboratory of Civil Aircraft Structures Testing, School of Aeronautics and Astronautics, Shanghai Jiao Tong University, Shanghai 200240, China
*
Author to whom correspondence should be addressed.
Aerospace 2025, 12(9), 832; https://doi.org/10.3390/aerospace12090832
Submission received: 28 September 2024 / Revised: 11 September 2025 / Accepted: 12 September 2025 / Published: 16 September 2025

Abstract

This paper provides a comprehensive analysis of common manufacturing delamination defects in composite curved beams, as well as delamination issues arising from cutting processes in engineering practice. Curved beams, widely used as connecting components in the aviation industry, are susceptible to delamination under out-of-plane loads. This study employs three-dimensional finite element methods and progressive damage failure analysis to examine the impact of delamination damage on the load-bearing capacity of curved beam structures under four-point bending loads. The investigation focuses on three key factors: delamination size, the position of delamination along the thickness direction, and the in-plane position of delamination. The results indicate that for the orthotropic symmetric layup used in this study, the closer the initial delamination is to the midplane of the curved beam, the more significant the reduction in load-bearing capacity. Delamination in the lower part of the beam has a greater impact than in the upper part, and edge delamination poses a greater threat to the structure compared to center-width delamination. These findings can offer valuable technical support for engineering tolerance management.

1. Introduction

Curvature is a prominent geometric feature in composite components, commonly observed in structures such as beams, ribs, stiffeners, and corner joints of aircraft composites. The molding process for curved composite components in an autoclave is significantly more complex compared to that of flat composite structures [1,2,3,4], making them susceptible to various defects that can severely degrade their mechanical properties and service life. In extreme cases, these defects can render the composite components unusable, leading to substantial economic losses. Consequently, the molding process of curved composite components, the types of defects they are prone to, and the underlying mechanisms of these defects have attracted considerable attention from researchers.
During the production process, composite material filet regions frequently encounter challenges such as difficulties in curved surface transition layup, inadequate compaction, poor resin flow, and trapped air bubbles. Existing research has primarily focused on how process conditions and material properties affect the compaction behavior and manufacturing defects of curved components during molding, with numerous numerical analyses and experimental studies conducted [5,6,7,8,9,10,11]. Wang et al. [12] statistically analyzed manufacturing defects in the corner regions of over 4000 curved composite components, encompassing 15 types such as beams, ribs, stringers, and elbow joints. The identified defects included delamination, porosity, voids, resin-rich areas, resin-poor areas, and looseness. In autoclave male mold forming, delamination defects accounted for approximately 60% of all defects. Therefore, investigating the impact of initial delamination on the load-bearing capacity of curved beam structures is particularly important. Subsequently, the influence of manufacturing defects on the mechanical characteristics and stress distribution of composite filet regions will be analyzed using finite element simulation.
Researchers have explored loaded curved structures through both theory and experiments. In the realm of theoretical methods, the Winkler-Bach formula, Timoshenko’s elastic beam theory [13] and Lekhnitskii’s pioneering work on stress distribution in curved beams under bending and end loads [14] are regarded as foundational. Building upon these seminal contributions, Bail [15] and Shenoi [16] further advanced the field by incorporating numerical analysis techniques. Lin et al. [17,18] later derived equations to predict how composite curved beams of varying curvatures deform under axial, shear, radial, and tangential forces. Yet these analytical models fall short in addressing real-world complexities—like how curved structures connect to other components, or how composite layers, flaws, and loads trigger nonlinear mechanical behaviors. Today, scientists mostly rely on finite element analysis (FEA), often paired with other tools, to study how delamination affects curved beam performance. Popular complementary techniques include progressive damage modeling [19], virtual crack closure technique (VCCT) [20], cohesive zone models [21,22], and smeared crack approaches [23].
This study employed the commercial ABAQUS software to develop a three-dimensional finite element model of a composite curved beam structure. The validity of the model was confirmed through experimental methods. By analyzing the finite element results, the study investigated the stress distribution characteristics in the bend region along the radial, circumferential, and width directions, predicted the delamination and failure loads, and examined the impact of manufacturing defects on the stress distribution in the filet region. This research provides a foundation for the design and tolerance treatment of composite filet structures.

2. Numerical Modeling of Curved Beams

2.1. Progressive Damage Model

2.1.1. Damage Initiation

The combined three-dimensional Hashin-type criteria [24], as described by Equations (1)–(6), were employed to predict the damage initiation and failure modes of laminates. Six distinct failure modes are considered: fiber tensile failure, fiber compressive failure, in-plane matrix cracking, in-plane matrix crushing, tensile delamination failure, and out-of-plane matrix crushing. The failure criteria are expressed as follows.
Fiber tensile failure ( ε 1 > 0 ):
e f , t = ε 1 X T / C 11 2 + γ 12 S 12 / C 44 2 + γ 13 S 13 / C 55 2 1
Fiber compressive failure ( ε 1 < 0 ):
e f , c = ε 1 X C / C 11 2 1
Matrix cracking failure ( ε 2 > 0 ):
e m , t = ε 2 Y T / C 22 2 + γ 12 S 12 / C 44 2 + γ 23 S 23 / C 66 2 1
Matrix crushing failure ( ε 2 < 0 ):
e m , c = ε 2 Y C / C 22 2 + γ 12 S 12 / C 44 2 + γ 23 S 23 / C 66 2 1
Tensile delamination failure ( ε 3 > 0 ):
e d , t = ε 3 Z T / C 33 2 + γ 13 S 13 / C 55 2 + γ 23 S 23 / C 66 2 1
Out-of-plane matrix crushing ( ε 3 < 0 ):
e d , c = ε 3 Z c / C 33 2 + γ 13 S 13 / C 55 2 + γ 23 S 23 / C 66 2 1
where e i , j is the failure factor for each failure mode. The element fails when any kinds of the criteria e i , j 1 is satisfied. In the subscripts, f, m, and d denote fiber, matrix, and delamination, respectively; t and c represent tension and compression, respectively. ε i (i = 1, 2, 3) are principal strains, γ i j (i, j = 1, 2, 3;   i j ) are shear strains. C i j ( i , j = 1, 2, 3, 4, 5, 6; i   = j ) are components of the stiffness matrix. X T , Y T , and   Z T represent the tensile strengths of the ply in the longitudinal, transverse, and through-thickness directions, respectively. X C ,   Y C , and   Z C represent the compressive strengths of the ply in the longitudinal, transverse, and through-thickness directions, respectively. S 12 ,   S 13 , and S 23 are the shear strengths of the lamina.

2.1.2. Damage Evolution

When an element sustains damage, its stiffness progressively decreases as follows [25]:
C i j = 1 d k , i C i j 0
where C i j 0 (i, j = 1, 2, 3, 4, 5, 6; i = j) are the initial stiffness components of the elements, and C i j denote the effective components after the damage initiation point. The damage variables d k , i   ( w h e r e   k = f , m , d , i = t , c ) represent the damage status of the element. These variables increase monotonically from 0 (no damage) to 1 (element fully damaged) as functions of stiffness and strain, as described in Equations (8)–(10).
d f , i = 1 e C 11 ε 1 f , i 2 1 e f , i L C G f / e f , i
d m , i = 1 e C 22 ε 2 m , i 2 1 e m , i L C G m / e m , i
d d , i = 1 e C 33 ε 3 d , i 2 1 e d , i L C G m / e d , i
where   d f , i ,   d m , i , a n d   d d , i represent the fiber damage, matrix damage, and delamination damage variables, respectively; i takes values t or c for tension or compression, depending on the material stress; ε 1 f , i , ε 2 m , i , a n d   ε 3 d , i are the ultimate strains corresponding to the longitudinal tensile and compressive strength, transverse tensile and compressive strength, and thickness direction tensile and compressive strength, respectively. L C is the characteristic length of the element, and it is calculated using the expression L C = v o l u m e   o f   e l e m e n t 3 [26]. LC is introduced based on fracture toughness to ensure the gradual continuity of damage reduction and minimize the influence of mesh density on result accuracy. G f and G m are the fracture energy of the fiber or matrix that depending on failure modes.
The degraded stiffness matrix is defined as
C = C 11 C 12 C 13 C 21 C 22 C 23 C 31 C 32 C 33 0       0       0 0       0       0 0       0       0           0       0         0 0       0         0 0       0         0 C 44 0 0 0 C 55 0 0 0 C 66
where
C 11 = 1 d f , i 2 C 11 , C 22 = 1 d m , i 2 C 22 , C 33 = 1 d d , i 2 C 33 , C 44 = 1 d f , i 1 d m , i C 44 , C 55 = 1 d m , i 1 d d , i C 55 , C 66 = 1 d f , i 1 d d , i C 66 , C 12 = 1 d f , i 1 d m , i C 12 , C 13 = 1 d f , i 1 d d , i C 13 , C 23 = 1 d m , i 1 d d , i C 23 , C 21 = C 12 , C 31 = C 13 , C 32 = C 23
The stresses are updated according to Equation (13).
σ = C : ε i f   0 < d k , i 1       C = C i f   d k , i = 0       C = C 0
Differentiating the above equation can result in Jacobian matrix according to Equation (14).
  σ ε = C + C ϵ : ε
To comprehensively account for fiber damage, matrix damage, and delamination phenomena, solid elements were employed in the simulation. The material constitutive model was based on a progressive damage model and implemented via the Abaqus/UMAT (User Material Subroutine) subroutine. The damage variables are saved as the solution-dependent variables (SDV) in the (UMAT) to visualize the damage in the curved specimen.

2.1.3. Numerical Implementation of Hashin Damage Model

The progressive damage analysis method of composite materials was employed, and UMAT flow chart for this analysis is presented in Figure 1. Flowchart of the UMAT subroutine. The progressive damage analysis model comprises three fundamental components: the stress–strain relationship of the composite material constitutive model, the assessment of damage based on material failure criteria, and the stiffness degradation scheme to characterize the material properties post-damage.
At each integration point, the UMAT subroutine first assesses the current damage state and identifies specific damage modes based on the damage state variables inherited from the previous increment. If the material remains undamaged, the subroutine calculates the updated stress state by multiplying the original stiffness matrix with the total strain, which is the sum of the historical strain (STRAN) and the current strain increment (DSTRAN). Upon detecting damage, the program first degrades the material properties according to predefined stiffness reduction schemes, then constructs the corresponding degraded stiffness matrix, and finally determines the updated stress state by multiplying the degraded stiffness matrix with the total strain. Strain updates are exclusively managed by the ABAQUS main program.
After the stress update, the composite failure criterion is reapplied to evaluate the potential initiation of new damage based on the updated stress state. Subsequently, all damage state variables are updated for use in the next increment step. Upon completion of these operations, the UMAT subroutine terminates, and control is returned to the main ABAQUS program. The analysis then advances to the next increment step, with this iterative process continuing until structural failure occurs.

2.2. FE Modeling

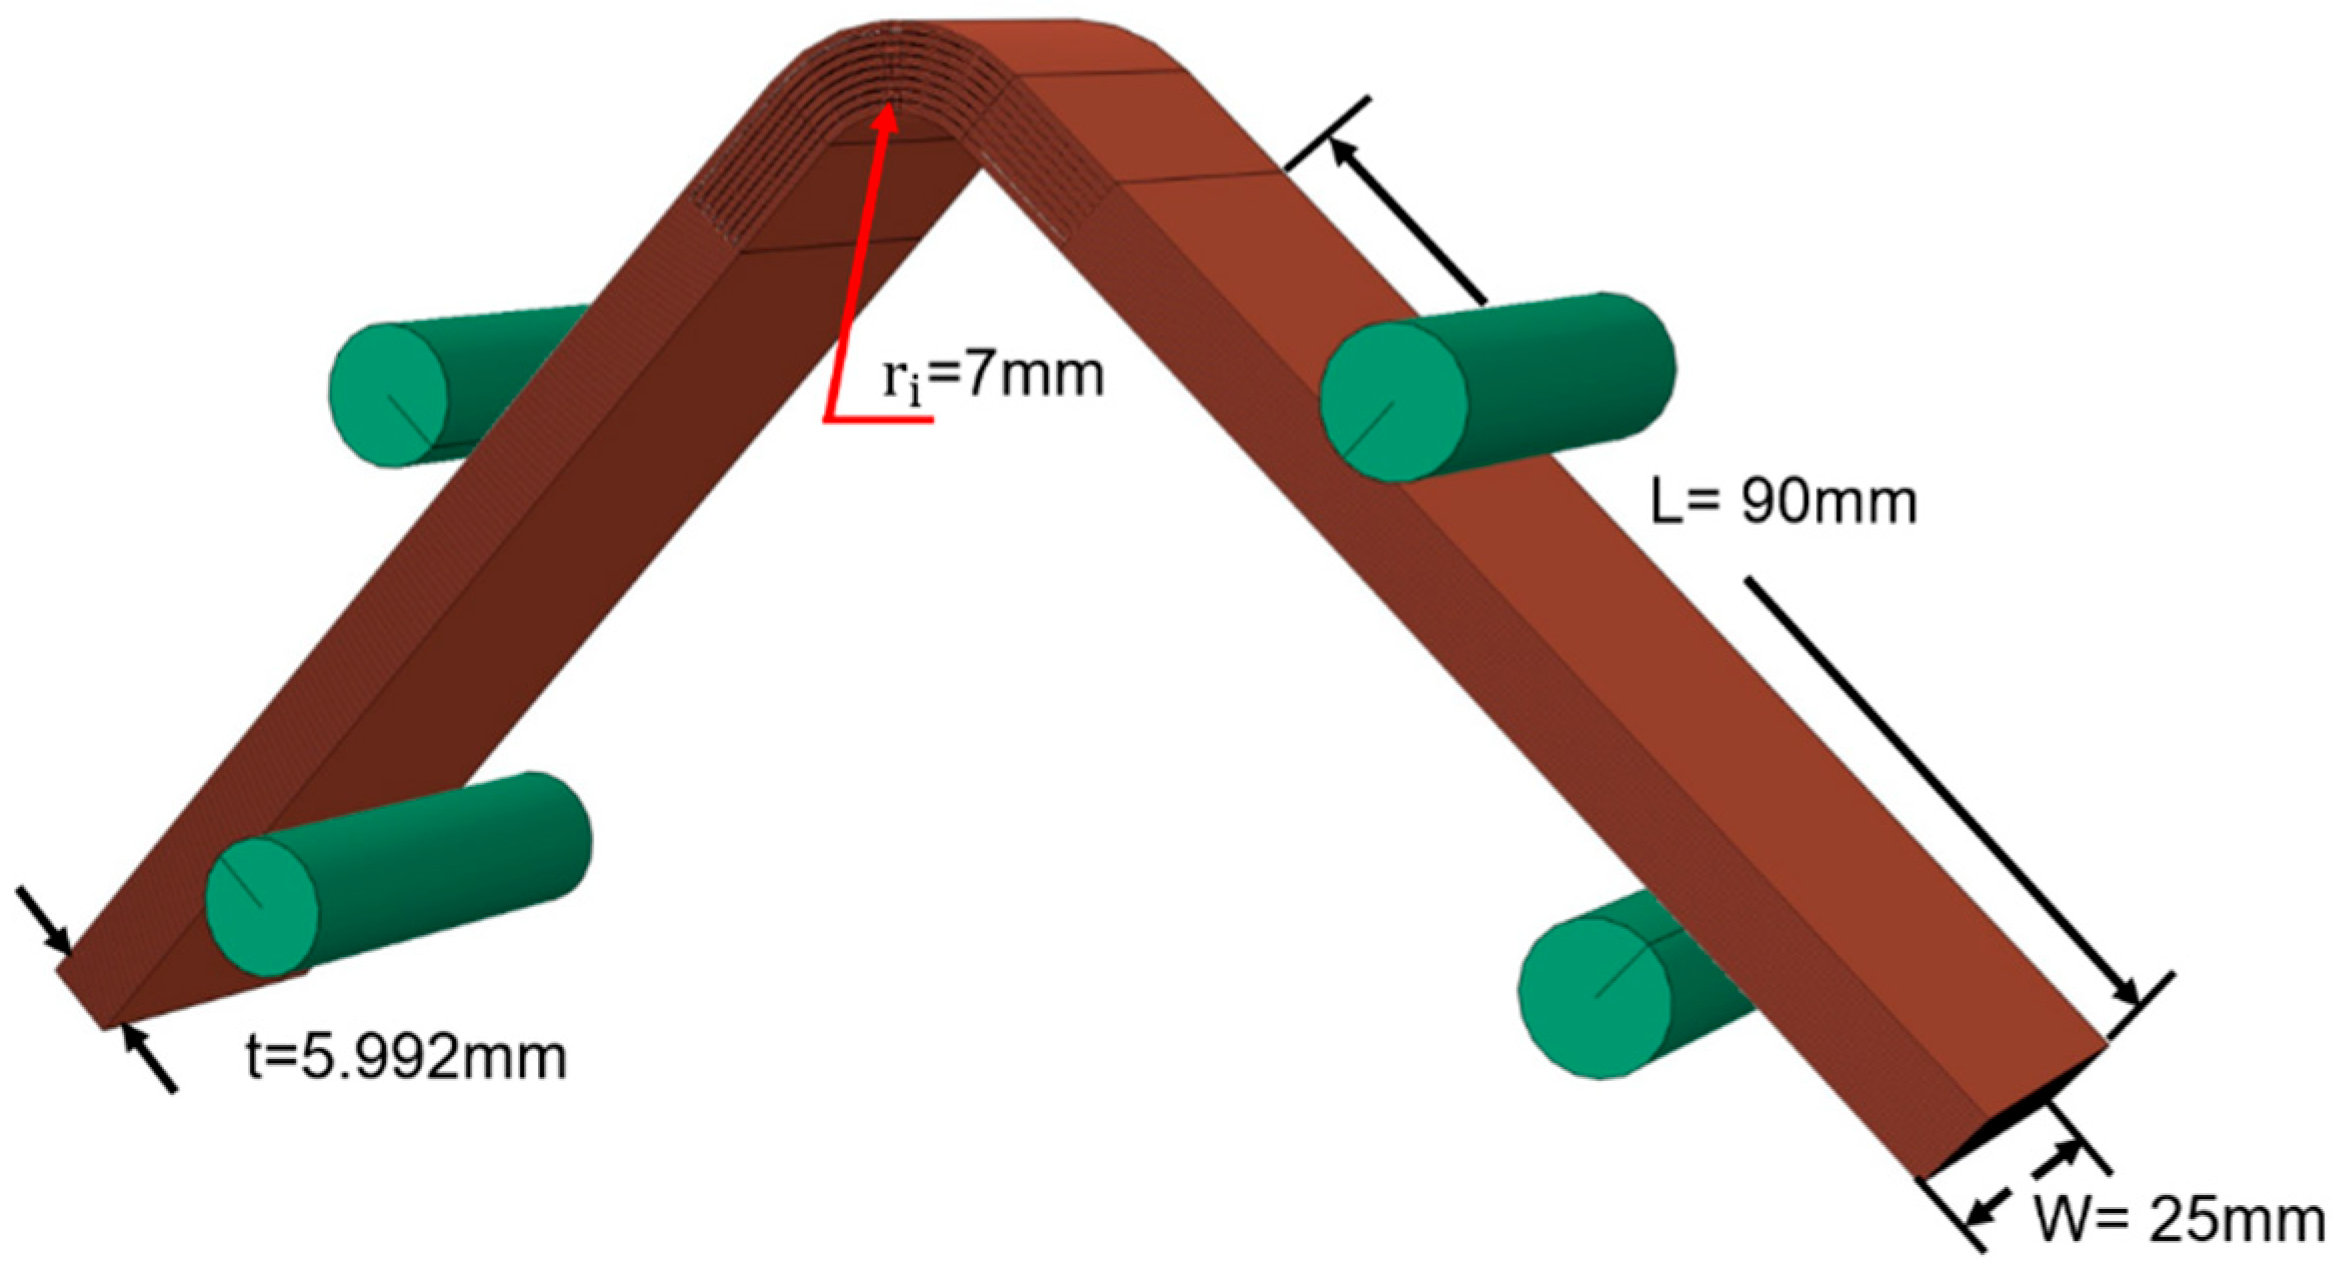
The geometric dimension models used were identical to those in the study by Lin [27], as illustrated in Figure 2, and adhered to the specifications outlined in ASTM D6415 [28] for this type of analysis. The geometric dimensions are shown in Figure 2. Each specimen had a constant thickness of t = 5.992   m m , a width of w = 25   m m , an inner filet radius of r i = 7   m m , and an inner angle of θ i = 90 ° . The length of the loading leg was L = 90   m m . The specimens were fabricated using carbon fiber HTS-134/M21 epoxy prepregs with a symmetric lay-up configuration [ 45 / 0 / 45 / 90 ] 4 s .
Each ply of the laminated composites was modeled through the thickness using the C3D8R solid element with enhanced hourglass control. As shown in Table 1. Properties of UD prepreg carbon-epoxy composite [29,30], the properties of the lamina are available in the open data sheet for M21. To balance the computational efficiency and accuracy, consistent with common practices in the literature [31], the in-plane element size was set to 2.0 mm after comparing the ultimate load with the average value. The through-thickness element size was chosen to be one element per layer. Both the loading pins and supports are modeled as analytical rigid bodies. The supports were fixed with all six degrees of freedom constrained, while the loading pins were permitted to move only through the thickness of the specimen. Ball bearings were incorporated into the experimental setup to ensure that the friction between contact surfaces is negligible. Consequently, the friction coefficients between all contact surfaces were set to zero.
Delamination occurs at the interfaces between composite plies. It can be simplified as the separation between layers within the delamination zone. In finite element models, this is represented by disconnecting nodes between layers elements in the delamination area, thereby preventing the transfer of tensile and shear stresses. Previous studies have often employed the cohesive zone model (CZM), which involves inserting zero-thickness cohesive elements between laminate plies to simulate the adhesive interlayer and deleting these elements to predefine delamination. However, research has shown that the material properties of cohesive elements, such as stiffness and critical fracture energy release rate, significantly influence computational accuracy. These properties are challenging to determine precisely due to experimental limitations. Moreover, cohesive elements are sensitive to mesh density, frequently leading to convergence issues. To address these challenges, this study defines a delamination damage criterion for composite materials using a UMAT subroutine. This approach enables the pre-definition of initial delamination damage by offsetting and deleting ply elements. The specific steps are as follows:
  • Model the composite curved beams using solid elements.
  • Use the “Mesh Editing Tools—Offset Solid Layer” command to create a solid layer with a thickness of 0.01 mm.
  • Remove partial elements to simulate pre-delamination zones.
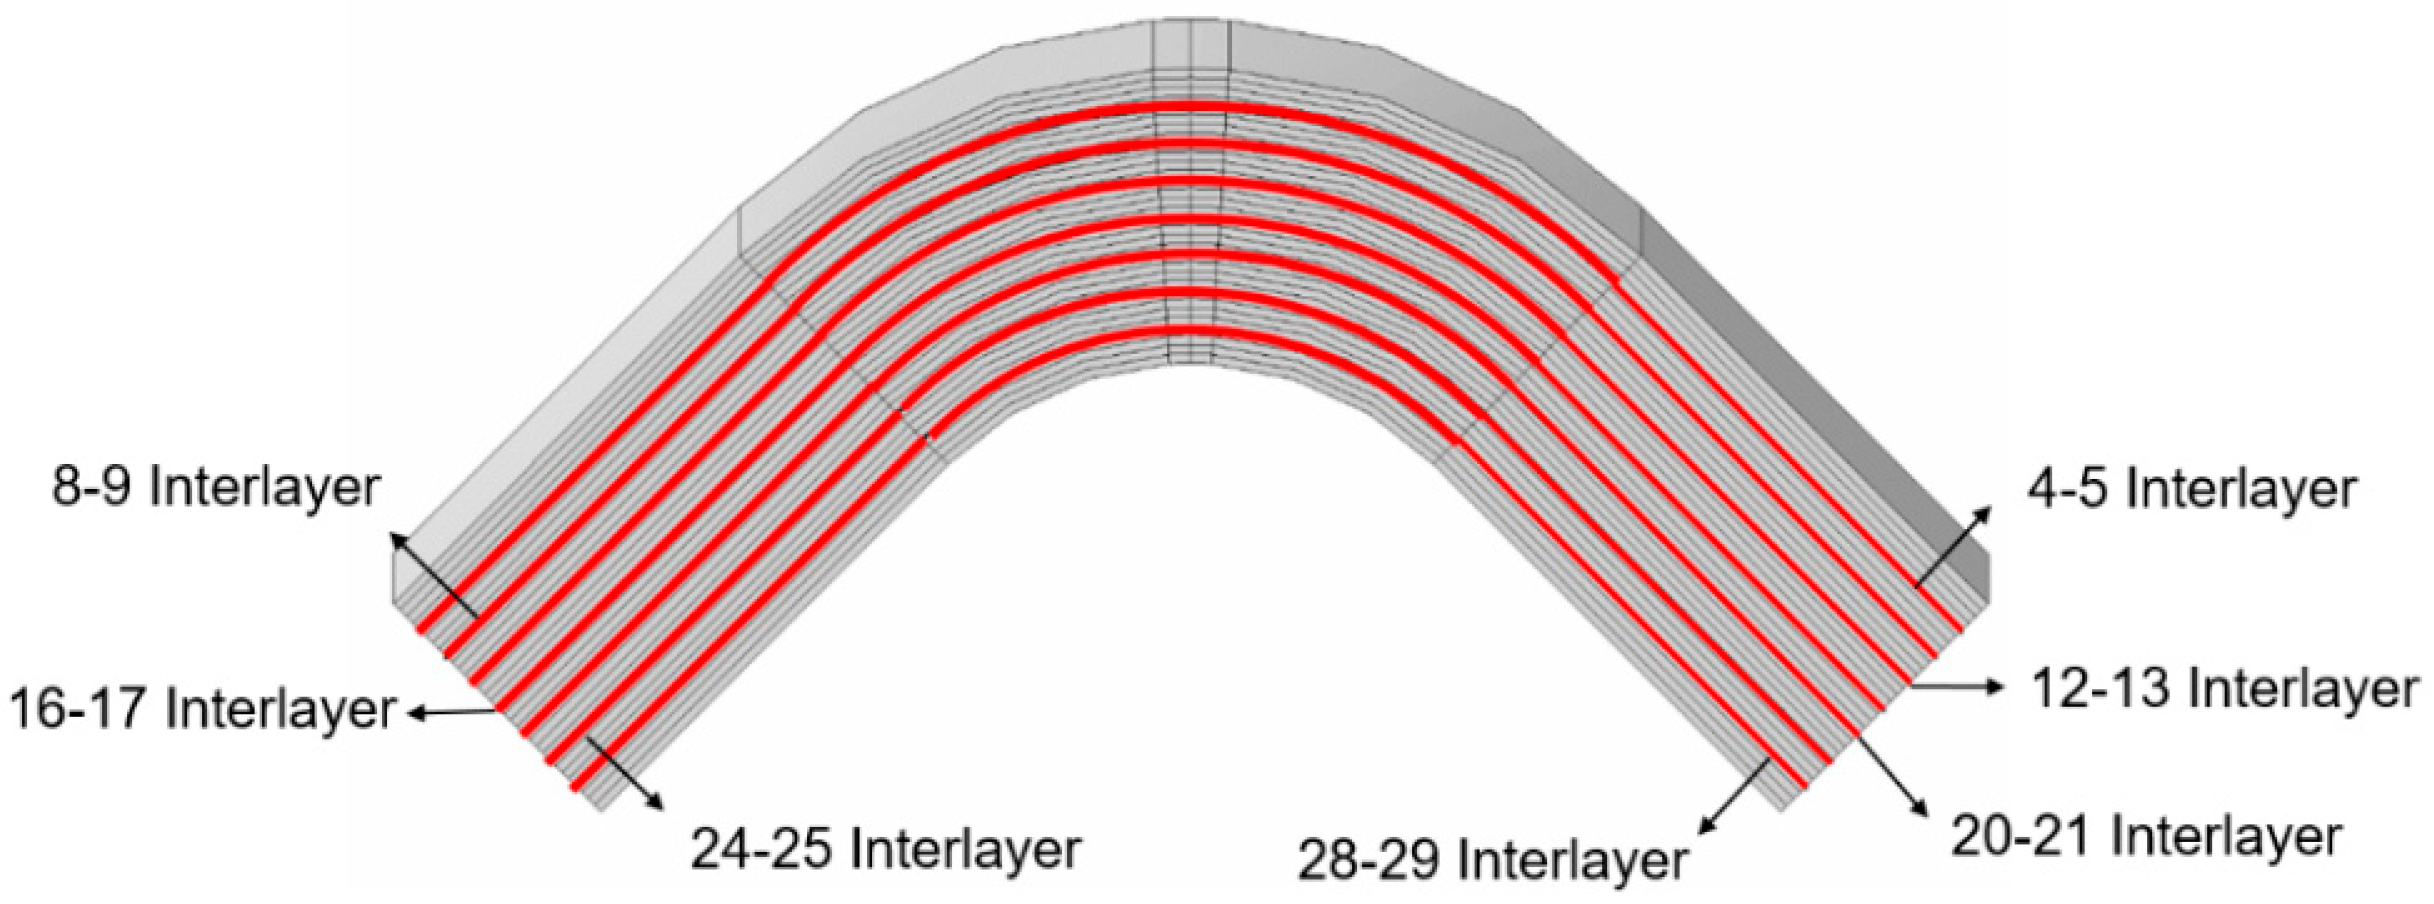
The delamination zones are, respectively, set between layers 4–5, 8–9, 12–13, 16–17, 20–21, 24–25, and 28–29, as indicated by the red solid line in Figure 3. Specifically, the delamination between layers 16–17 is located at the 90/90 ply interface, while the others are at the 90/45 ply interfaces.
This method eliminates the need for cohesive elements to simulate the evolution of interlaminar delamination damage, thereby simplifying the process, reducing finite element computational costs, and avoiding the introduction of additional performance parameters, which offers significant advantages.
By removing different elements from the prefabricated initial delamination areas, various types of initial delamination can be achieved. This study investigates the impact of three parameters of initial delamination on the failure of composite curved beam: the size of the initial delamination, its through-thickness position within the beam, and its in-plane position along the beam.
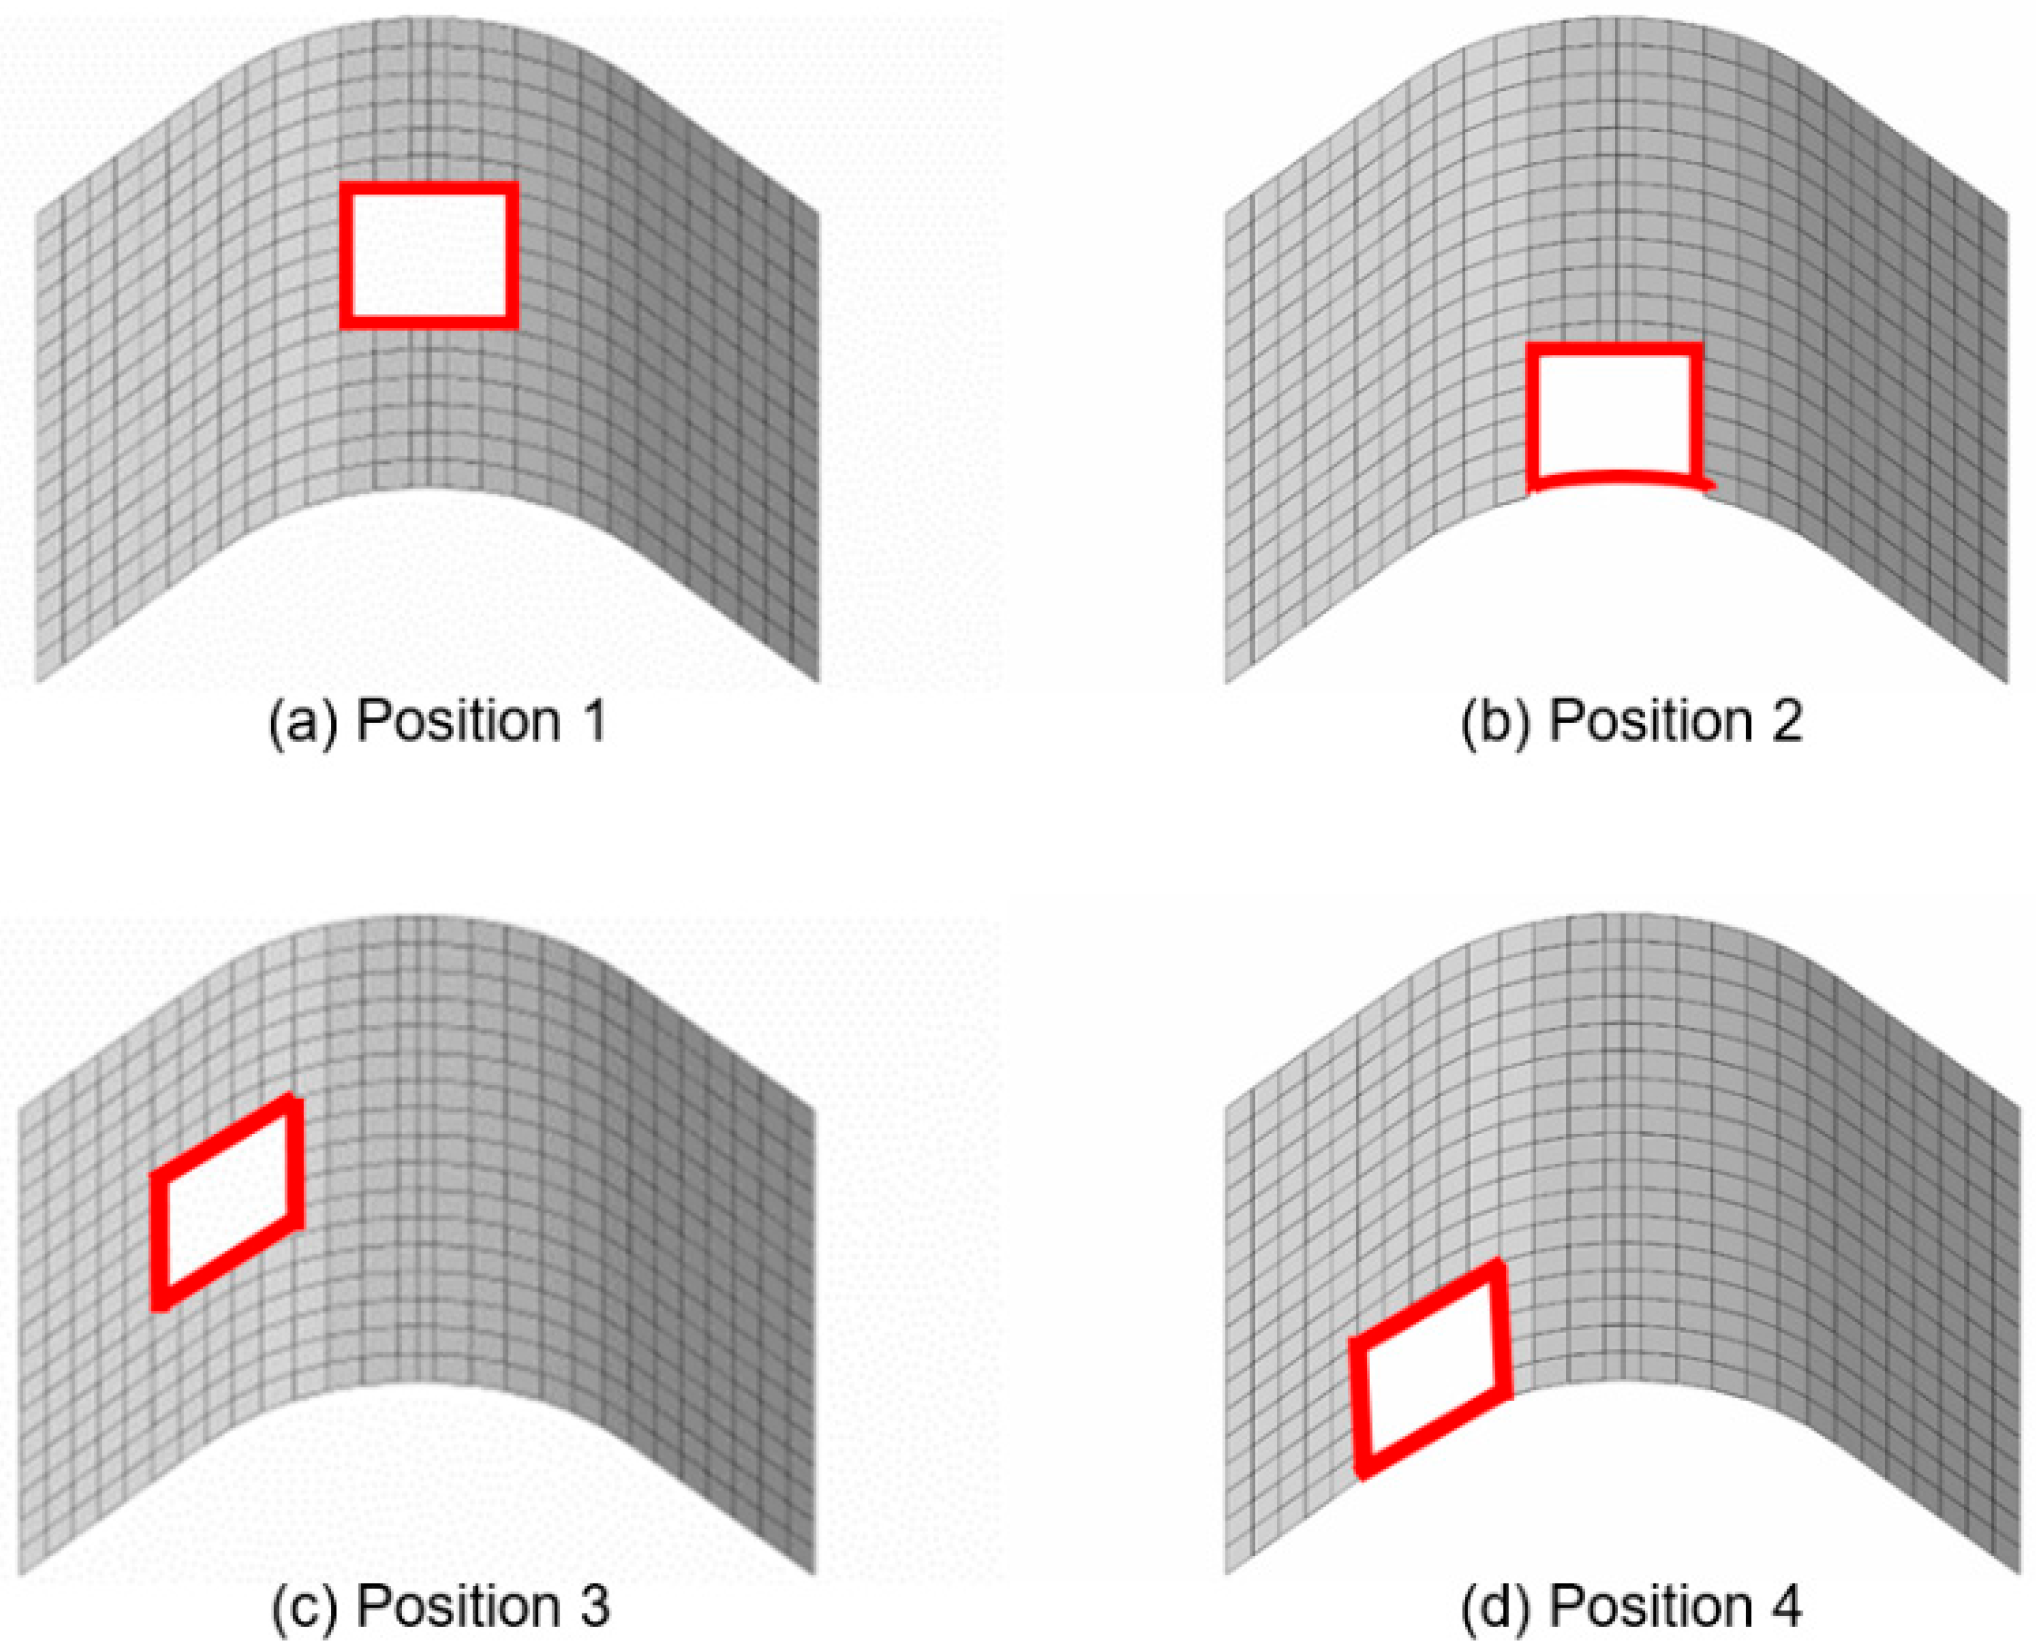
As illustrated in Figure 4, by removing different numbers of elements, three types of initial delamination with areas of 10 mm2, 30 mm2 and 60 mm2 were created. As shown in Figure 3, by removing elements from different interlayers, seven types of initial delamination at various through-thickness positions were obtained. As depicted in Figure 5, by removing elements at different in-plane positions, four types of initial delamination at various in-plane positions were achieved. The control variable method was employed to analyze the influence of these initial delamination parameters on the performance of curved beams.

3. Results and Discussion

3.1. Validation of the FEM Model

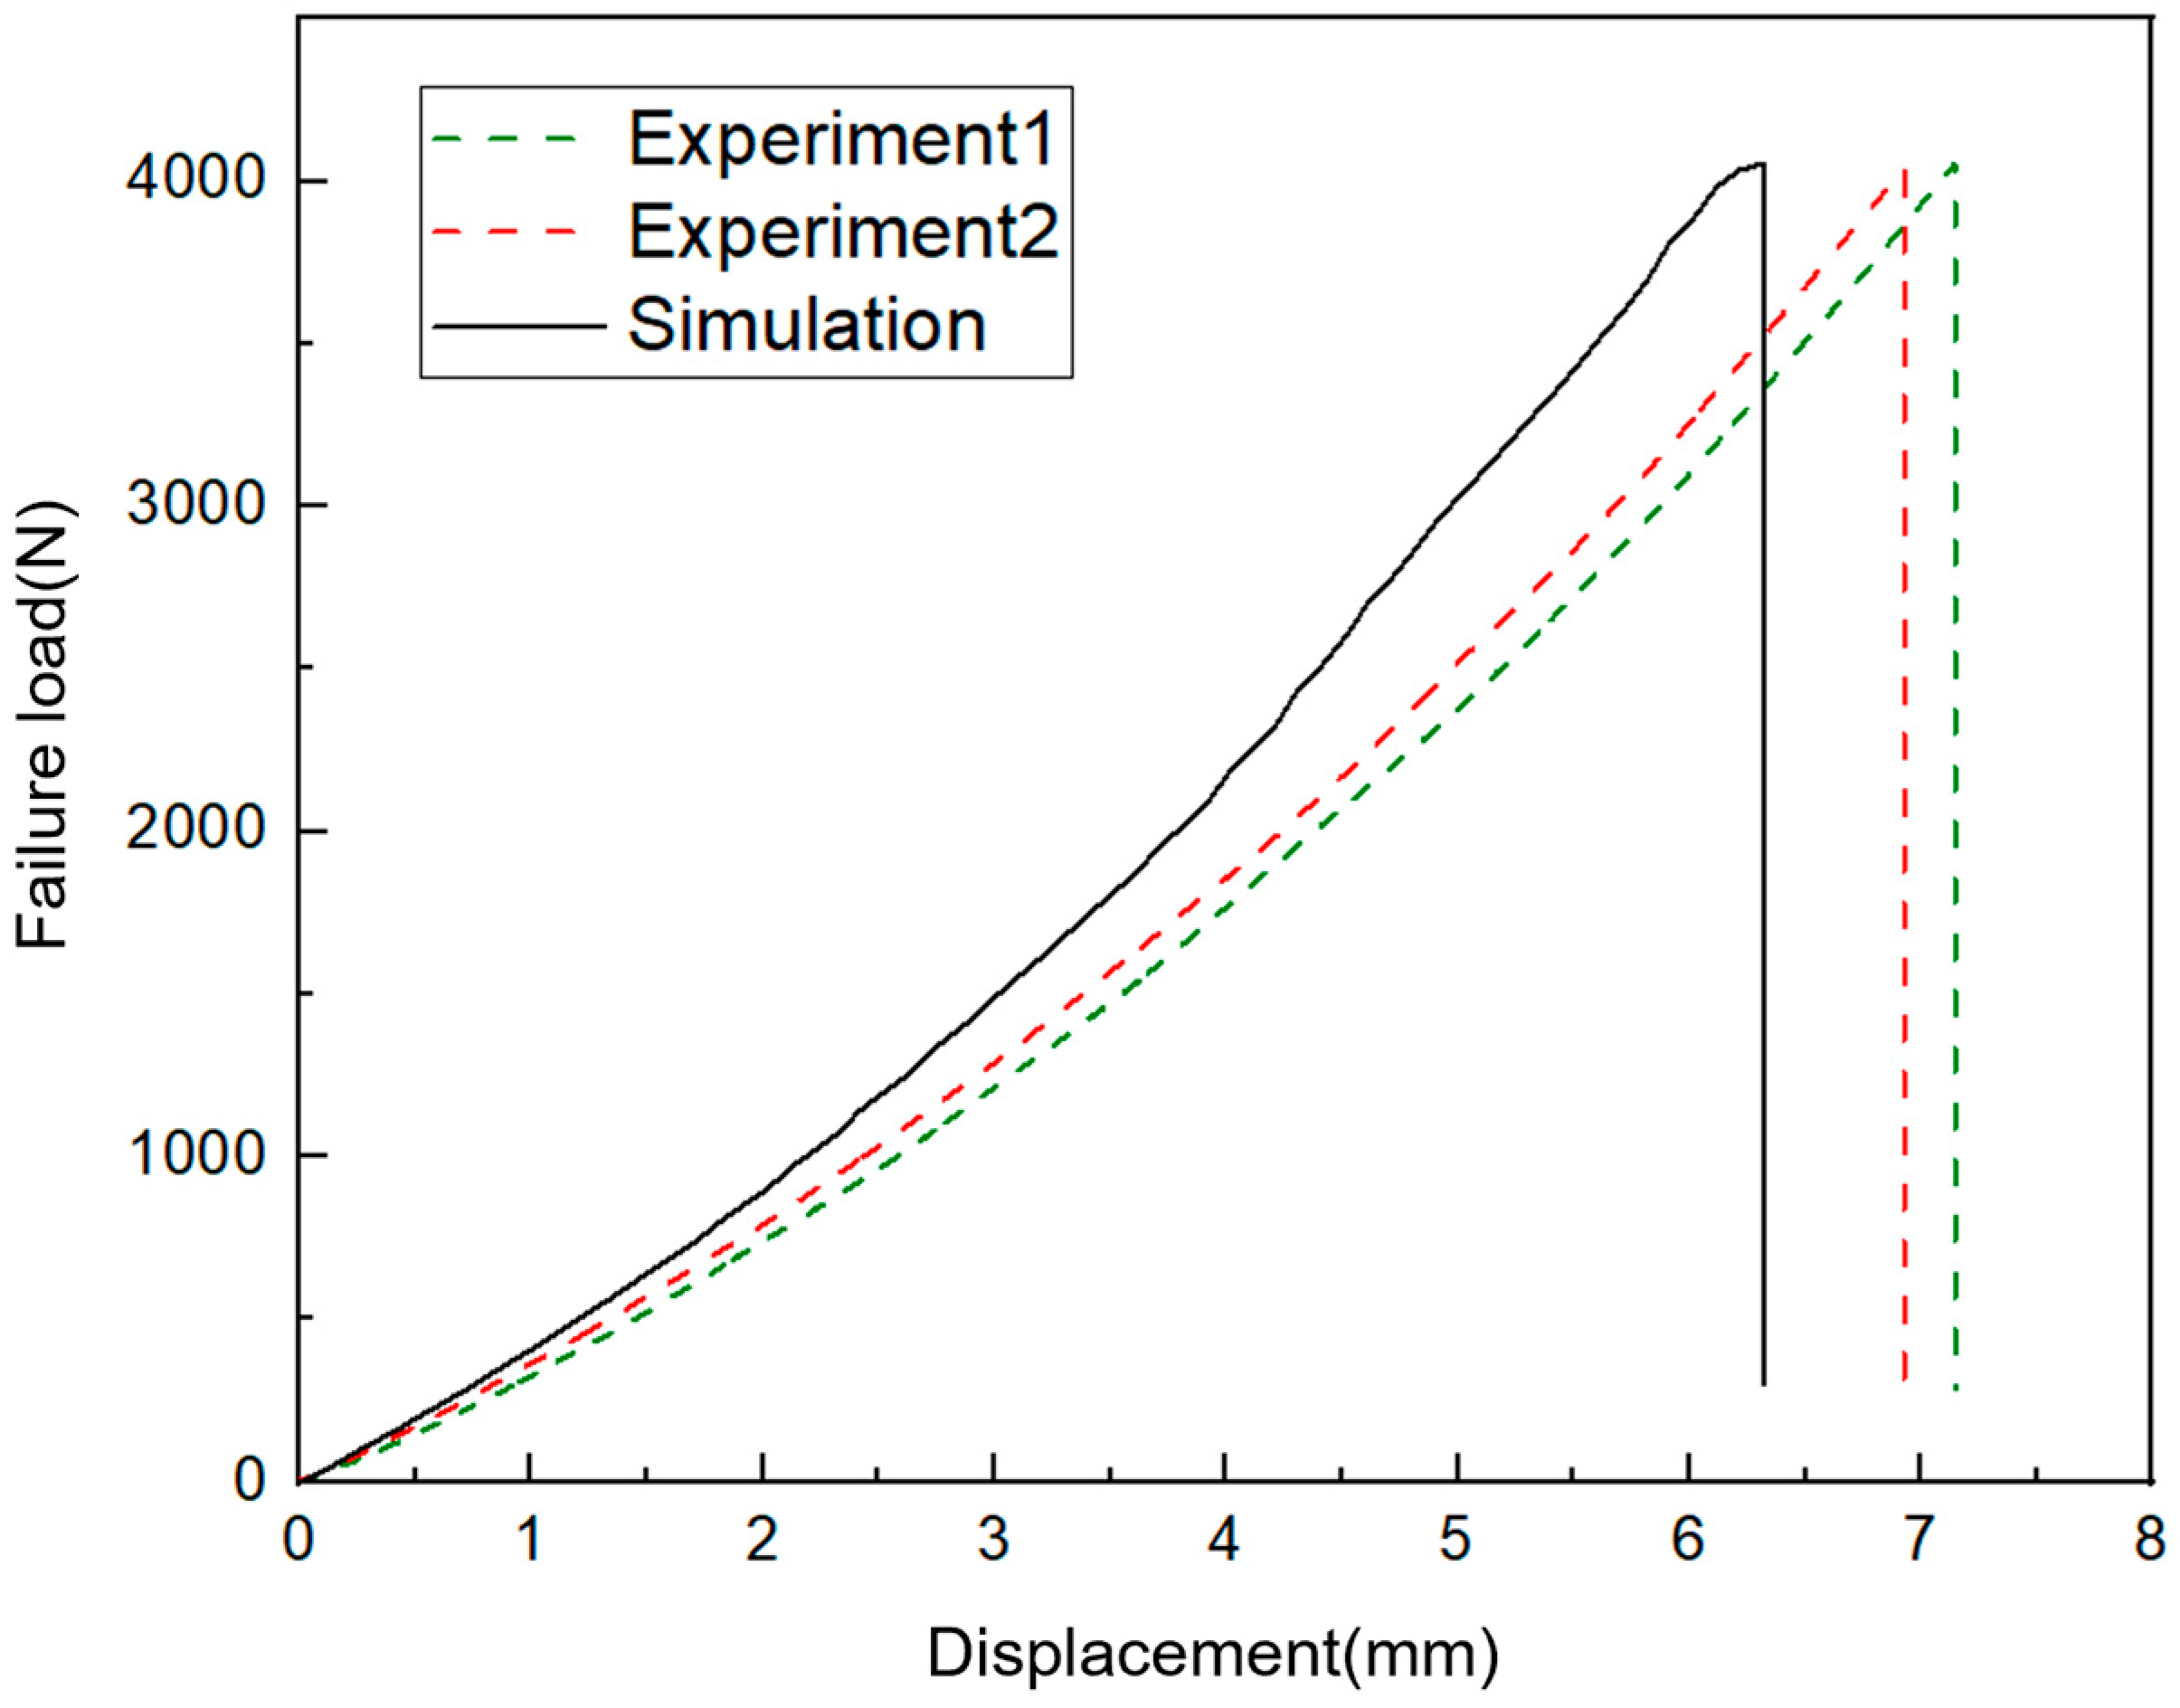
The load–displacement curves obtained from experiments and finite element simulations are presented in Figure 6. The experimental failure load is 4.046 kN, whereas the finite element simulation predicts a failure load of 4.052 kN, with a relative error of 0.13%. At the point of specimen failure, the displacement is 7.04 mm in the experiment and 6.32 mm in the simulation, yielding a relative error of 10%. The differences in stiffness and displacement during loading can likely be attributed to material variability and internal defects introduced by manufacturing processes. Overall, from both stiffness and strength perspectives, the simulated load–displacement curve closely aligns with the experimental results.
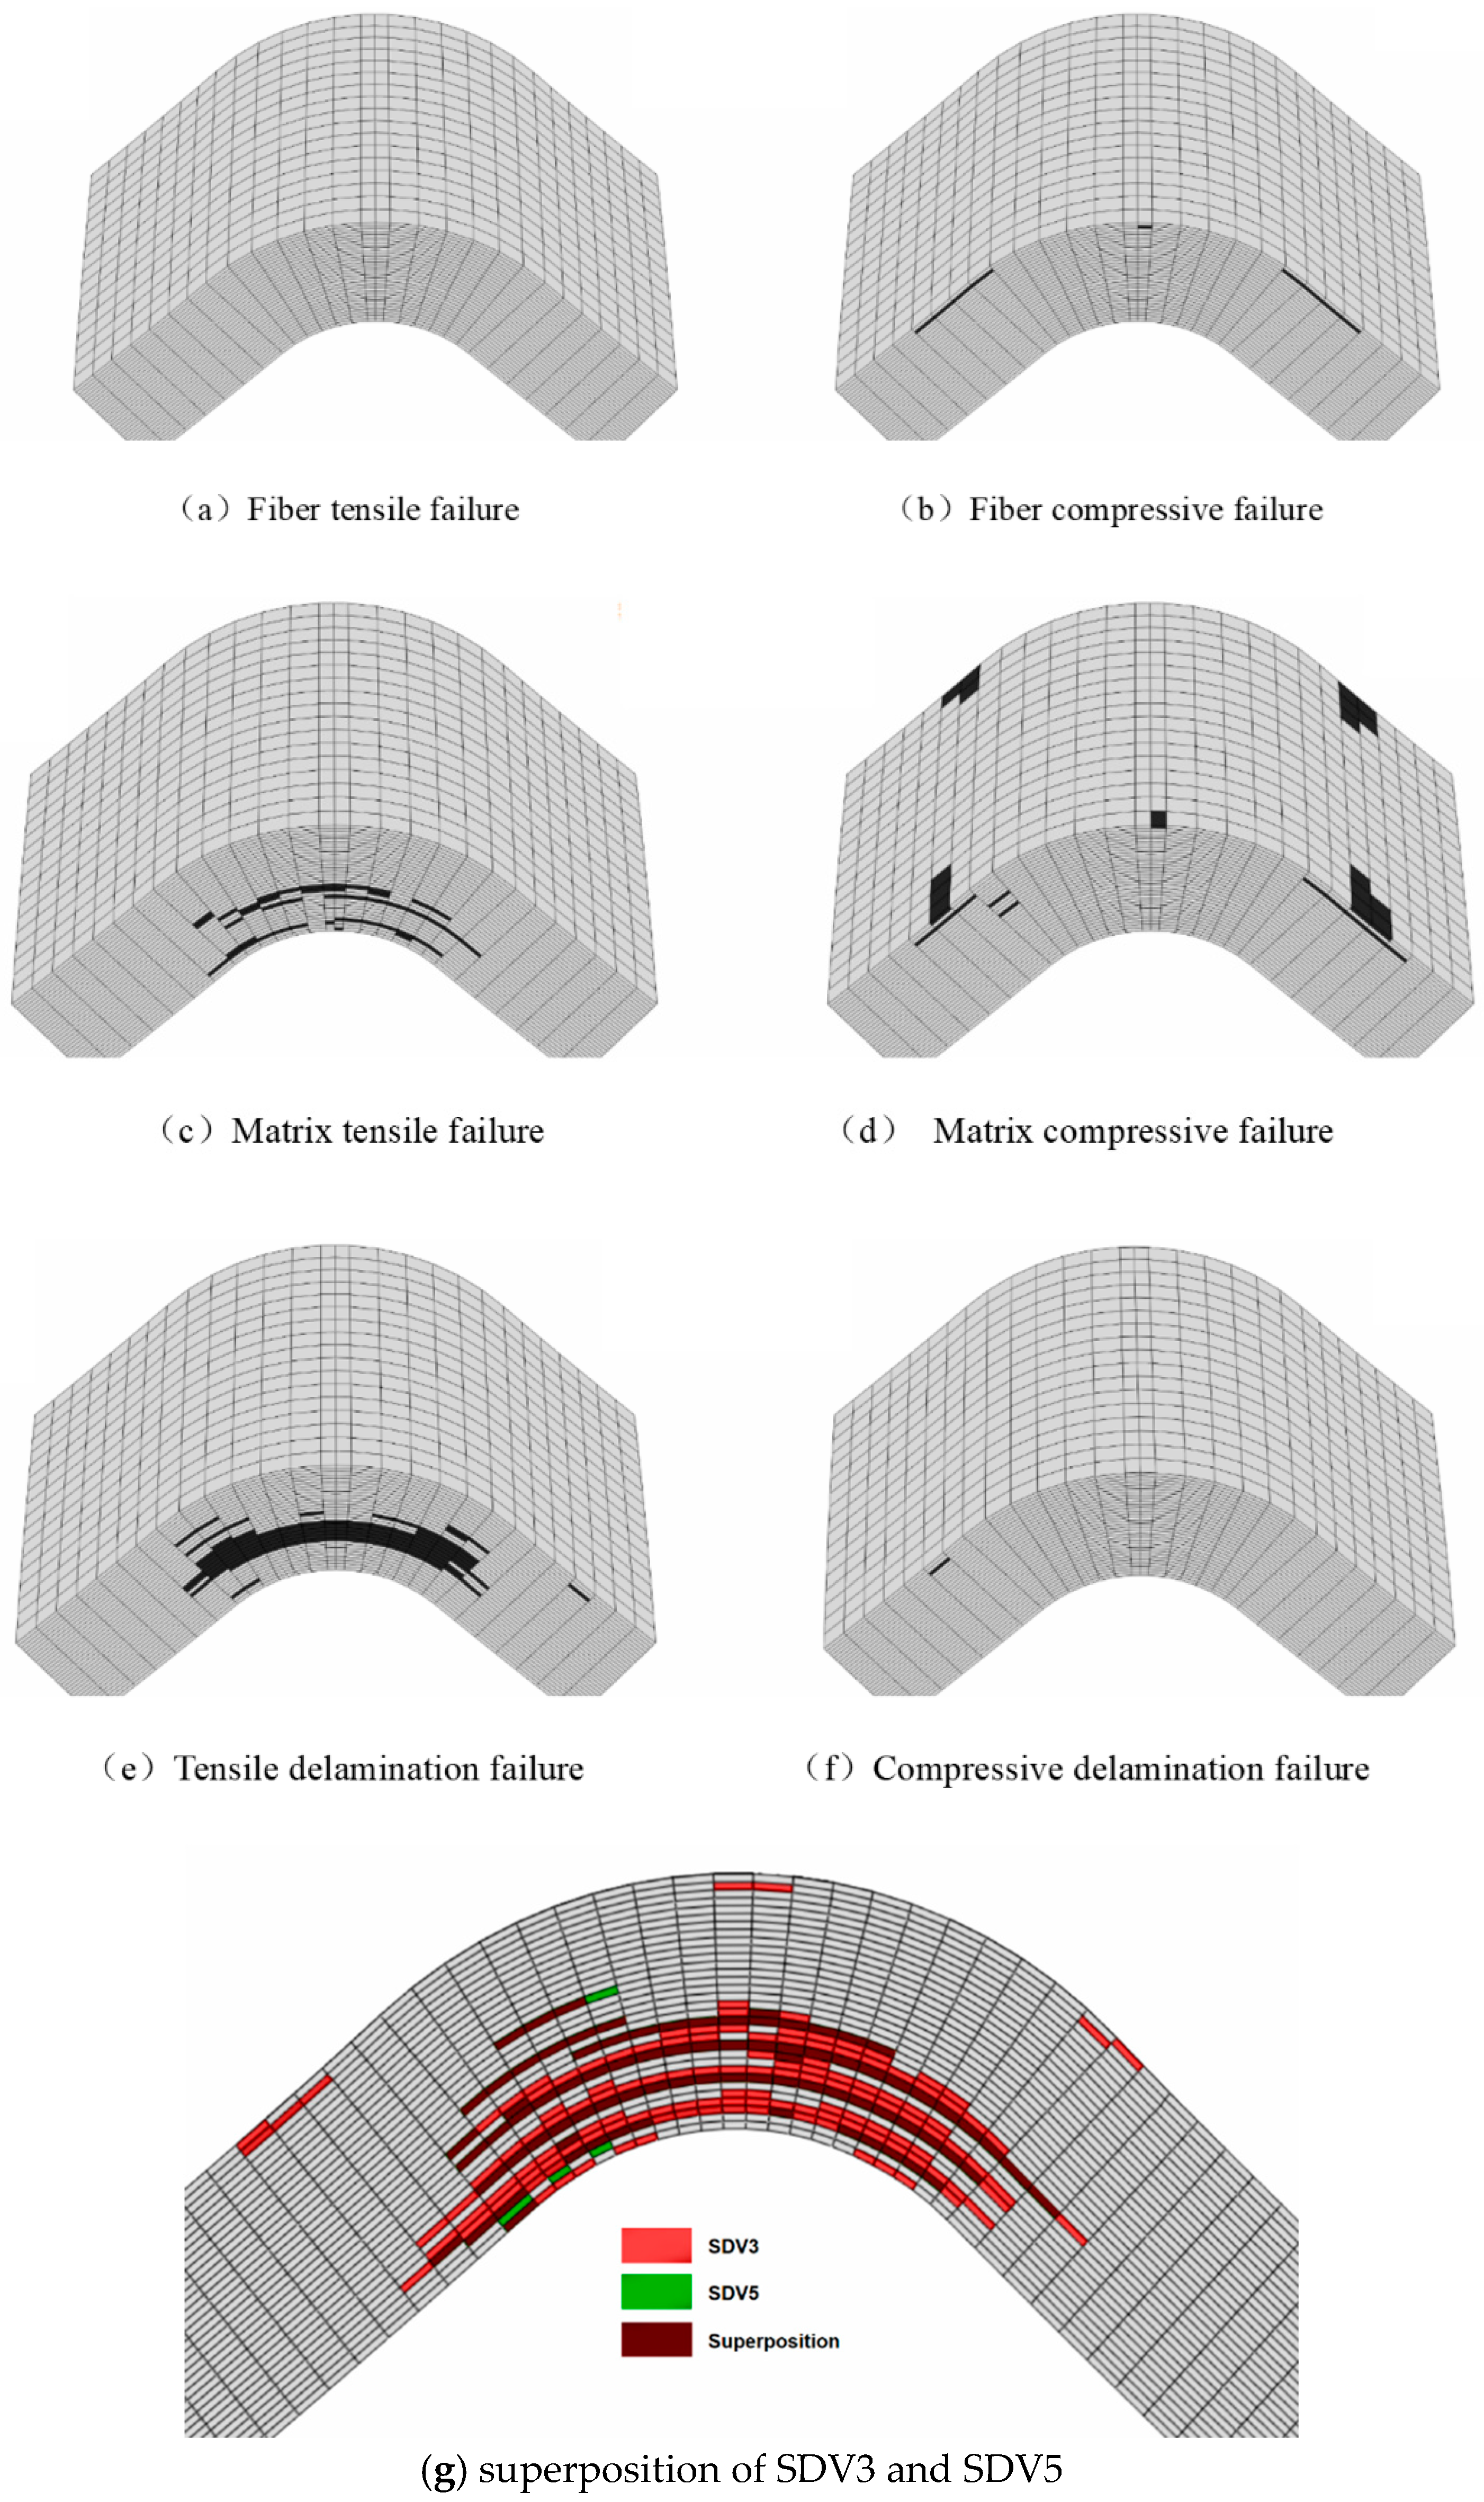
The second observation pertains to the failure scenario. Figure 7 illustrates the expansion of six types of damage when the curved beam is ultimately destroyed. Among these six damage modes, in-plane resin tensile failure (SDV3) and tensile delamination failure (SDV5) are predominant. The other four damage modes only appear near the final stages of sample failure and occur in much smaller quantities. The overall failure pattern resulting from the accumulation of these damages is shown in Figure 7g, with the damaged areas primarily concentrated in the lower–middle region of the sample.
Figure 8 illustrates the sequence of damage appearance in the curved beam. At approximately 60% of the ultimate load, in-plane resin tensile failure initially occurs in the 25th layer, as shown in Figure 8a. As the load increases, this tensile failure extends across the width of the sample, leading to through-thickness delamination, as depicted in Figure 8b. With further loading, new SDV3 damage gradually emerges in different layers, spreading from the lower part of the curved beam toward the middle, thereby increasing the density of the damaged layers.
At approximately 80% of the ultimate load, tensile delamination damage (SDV5) first appears in the 26th layer, as shown in Figure 8c. This damage occurs after SDV3 damage, as evident from the comparison with Figure 8a, consistent with the findings reported in reference [32]. The SDV5 damage initially manifests at the edges and progressively extends toward the center of the sample’s width, eventually forming through-thickness cracks.

3.2. Simulation of Curved Beams with Initial Delamination Damage

3.2.1. Influence of In-Plane Delamination Size

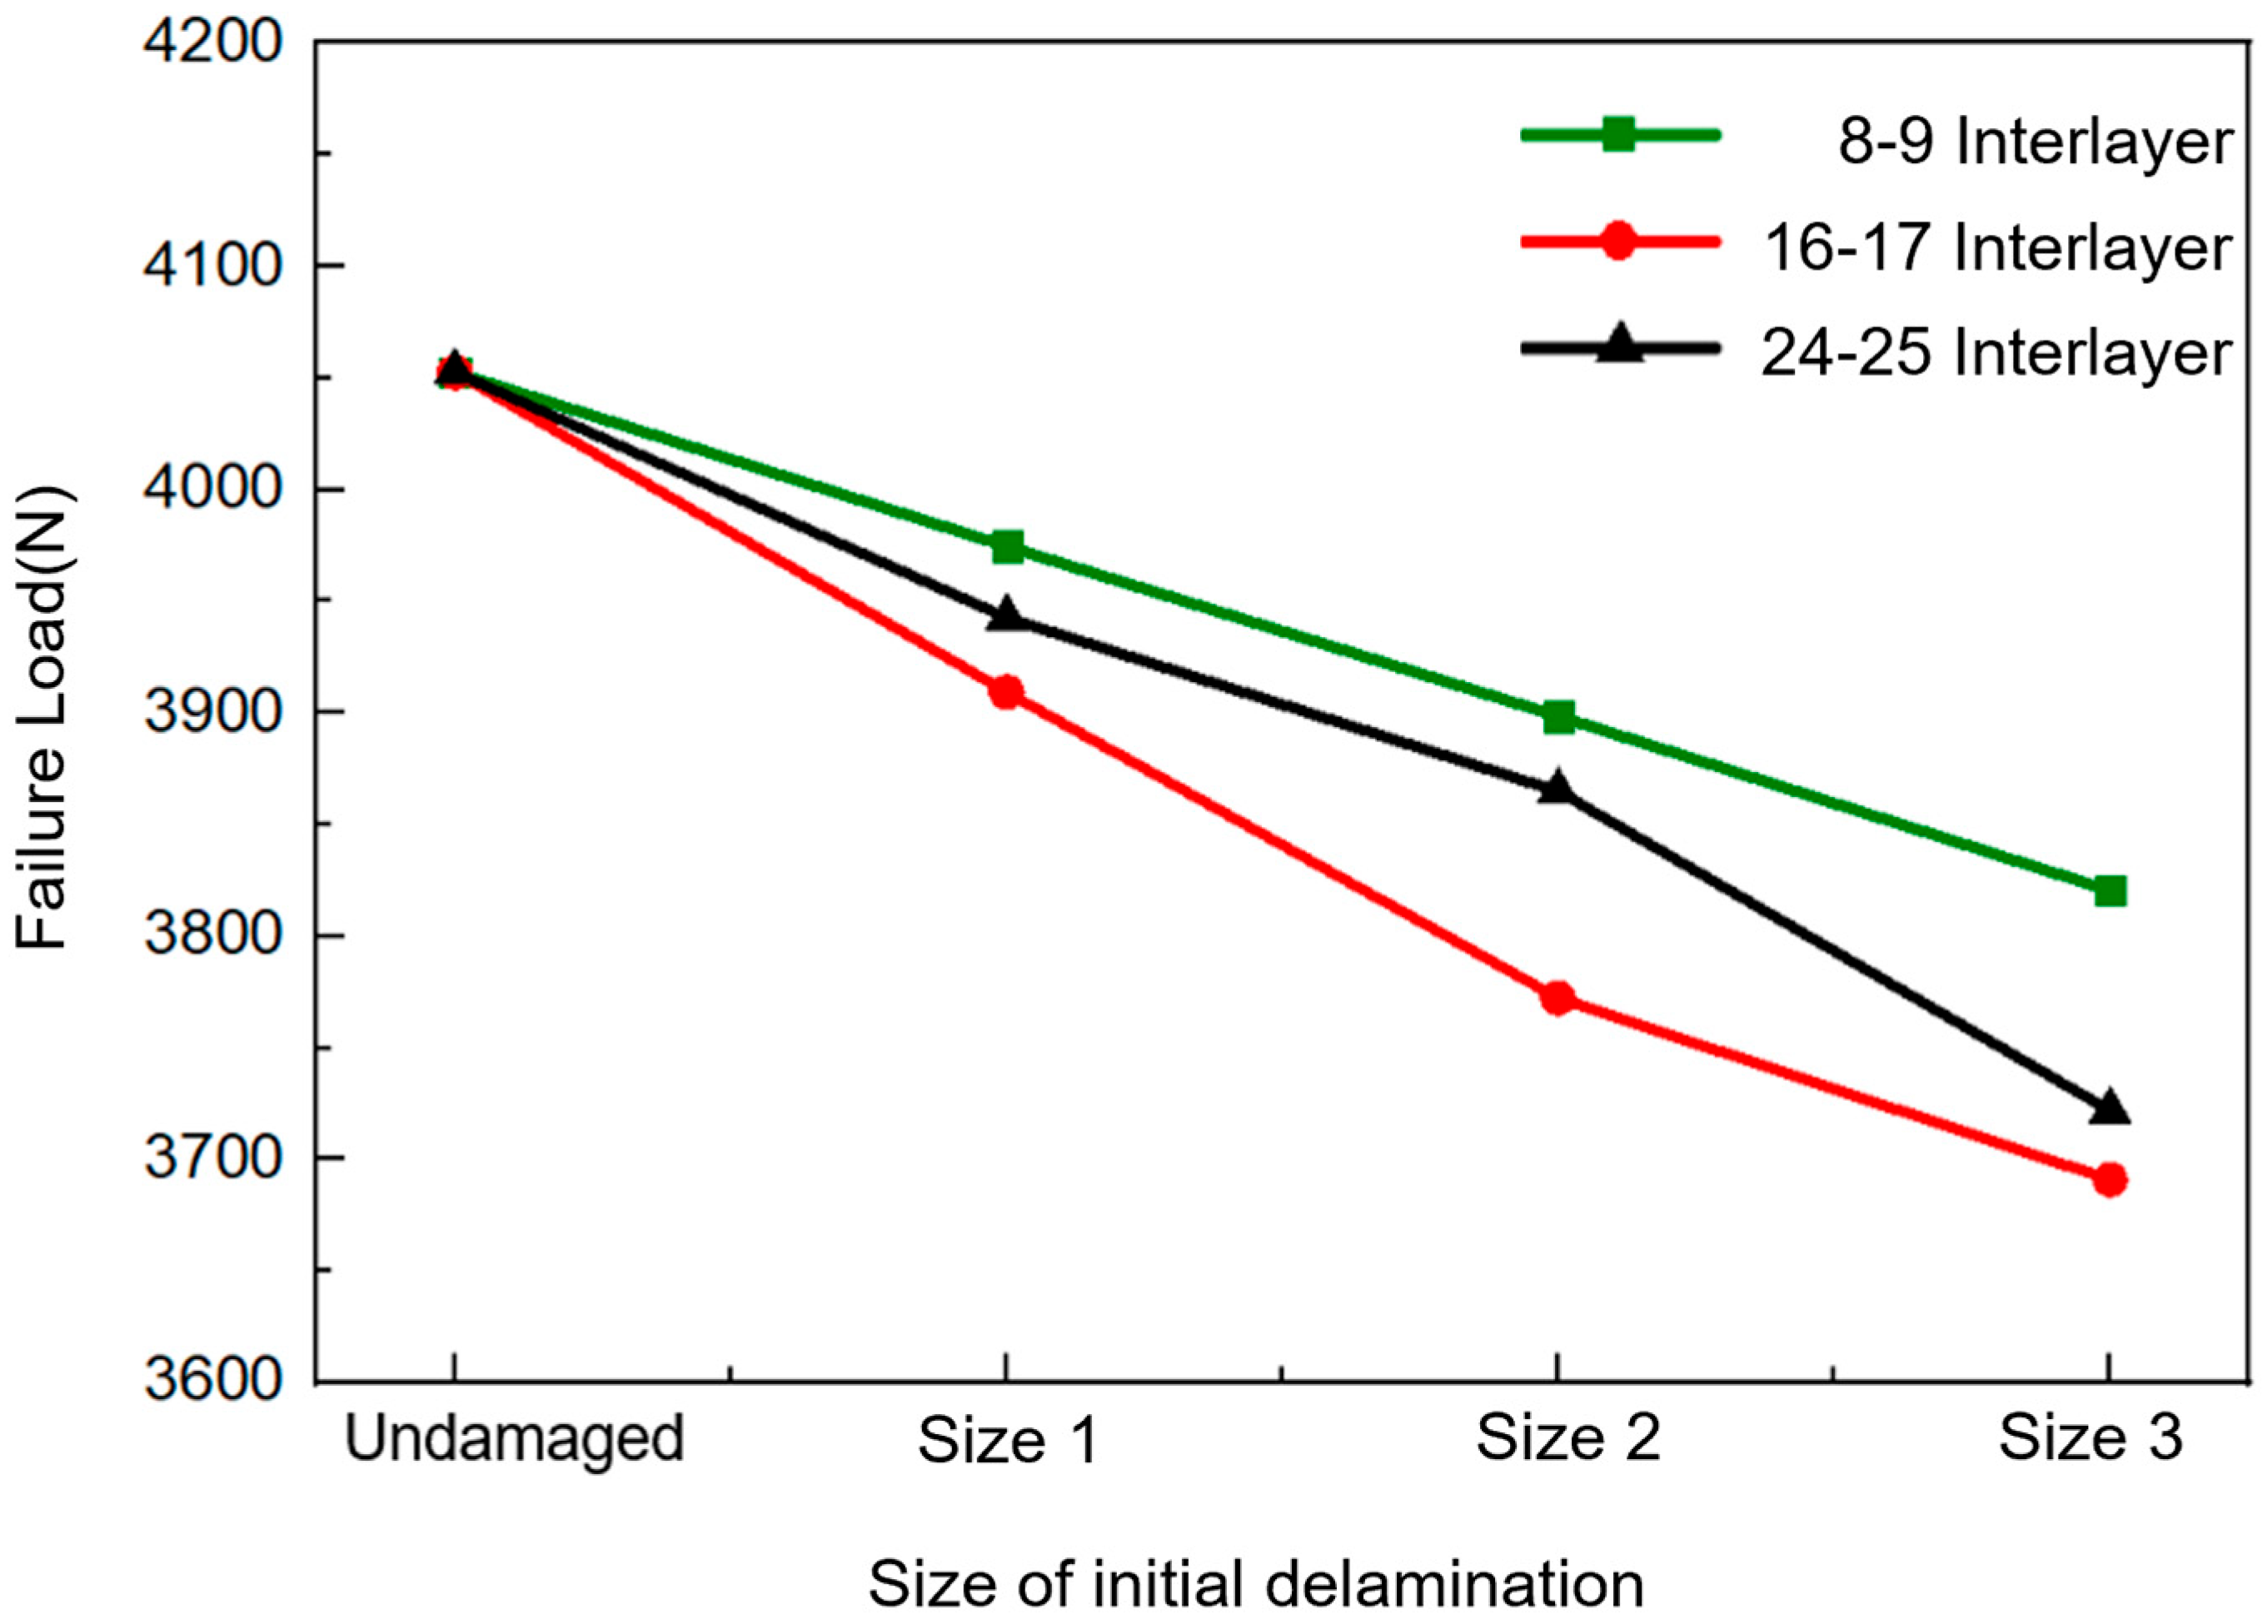
To investigate the impact of initial delamination size on the strength of curved beams, researchers introduced artificial delamination at the center of the specimen’s width (Position 1). Delamination with areas of 10 mm2, 30 mm2, and 60 mm2 were placed between the 8th–9th, 16th–17th, and 24th–25th layers, respectively. Figure 9 illustrates a clear trend: as the delamination size increases, the beam’s failure load consistently decreases, indicating a decline in structural integrity. The most significant reduction in load-bearing capacity is observed when the delamination is located at the laminate’s midplane. Specifically, a 60 mm2 delamination results in an approximate 9% decrease in the beam’s ultimate strength.

3.2.2. Different Through-Thickness Position of the Initial Delamination

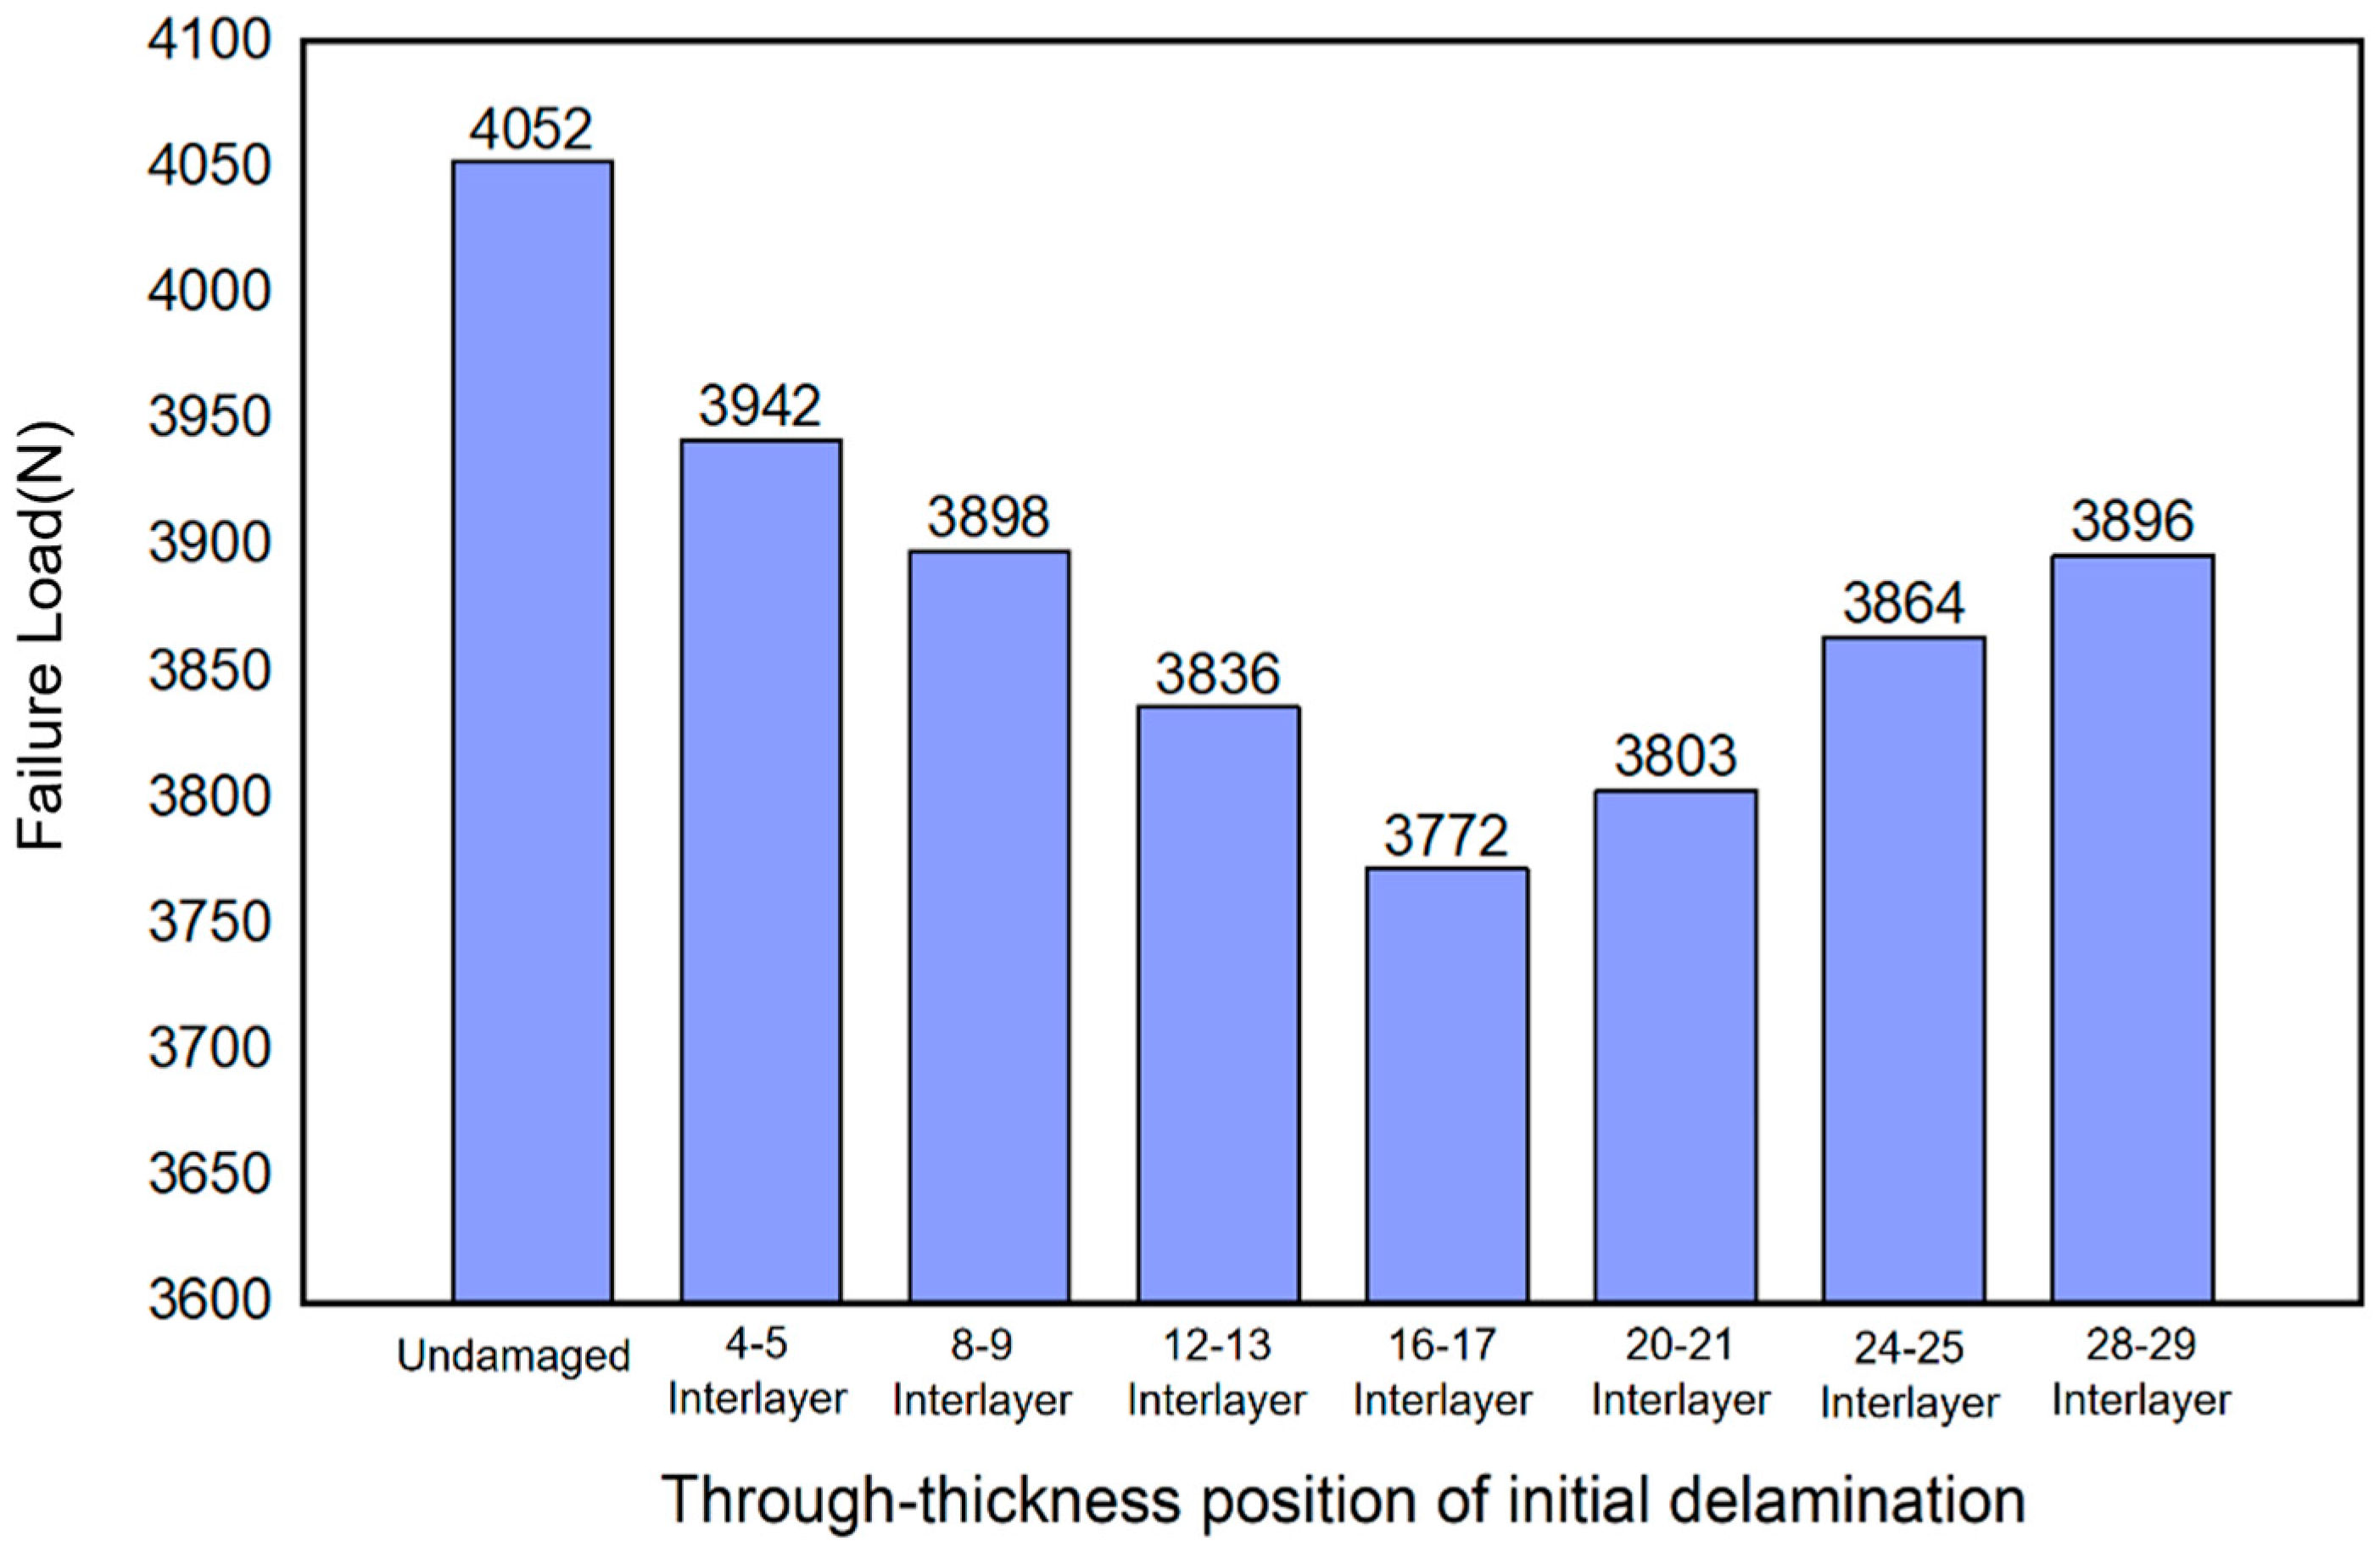
To investigate how the positioning of delamination in the thickness direction affects the strength of curved beams, a 30 mm2 damaged zone at the center of the beam’s width was selected for study. This damage was placed at seven different interlaminar positions along the thickness, as indicated in Figure 3. The results (Figure 10) revealed a clear trend: delamination near the beam’s neutral layer caused a more significant reduction in strength. Additionally, damage in the lower tension region weakened the beam more severely than similar defects in the upper compression zone.

3.2.3. Different In-Plane Position of the Initial Delamination

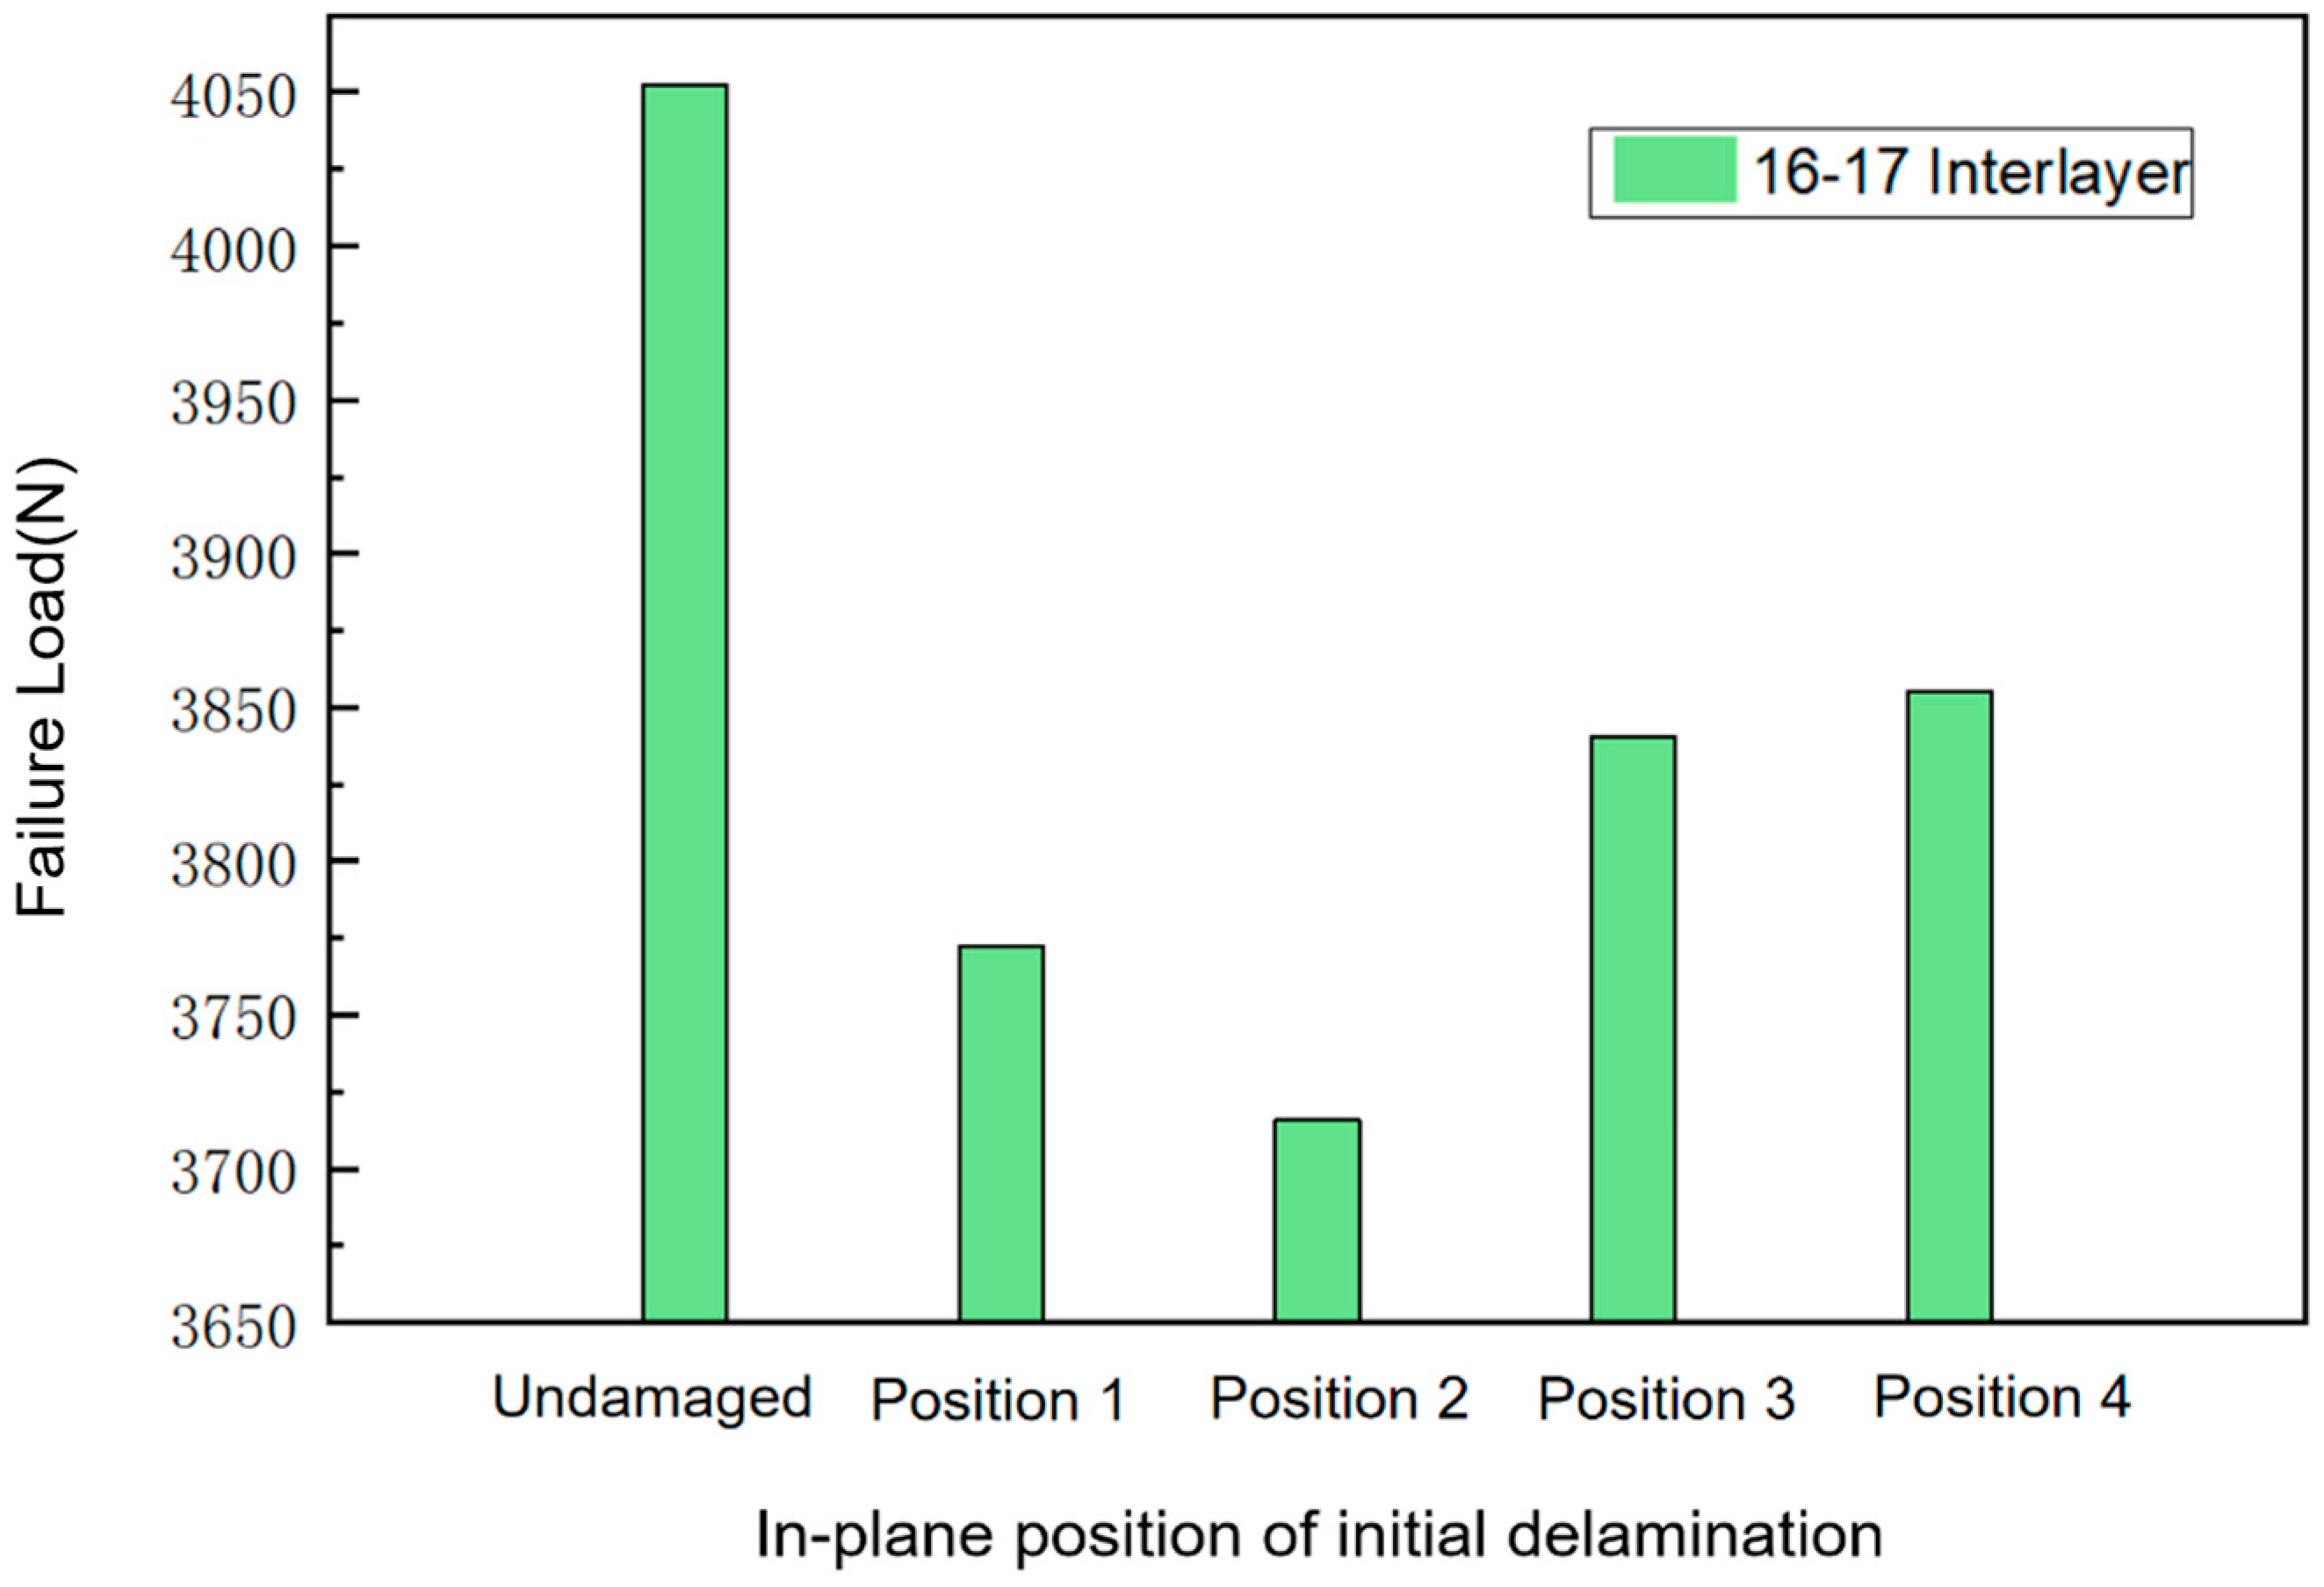
To examine how the position of internal delamination affects the strength of curved beams, artificial delamination (each 30 mm2 in area) was introduced between the 16th and 17th layers, as shown in Figure 5. The results presented in Figure 11 indicate that damage at the side-center of the beam (Position 2) had the most significant impact, reducing the structural strength by 8.3%. The effects at other positions were progressively less severe: Position 1 decreased strength by 6.9%, Position 3 by 5.2%, and Position 4 by only 4.9%.
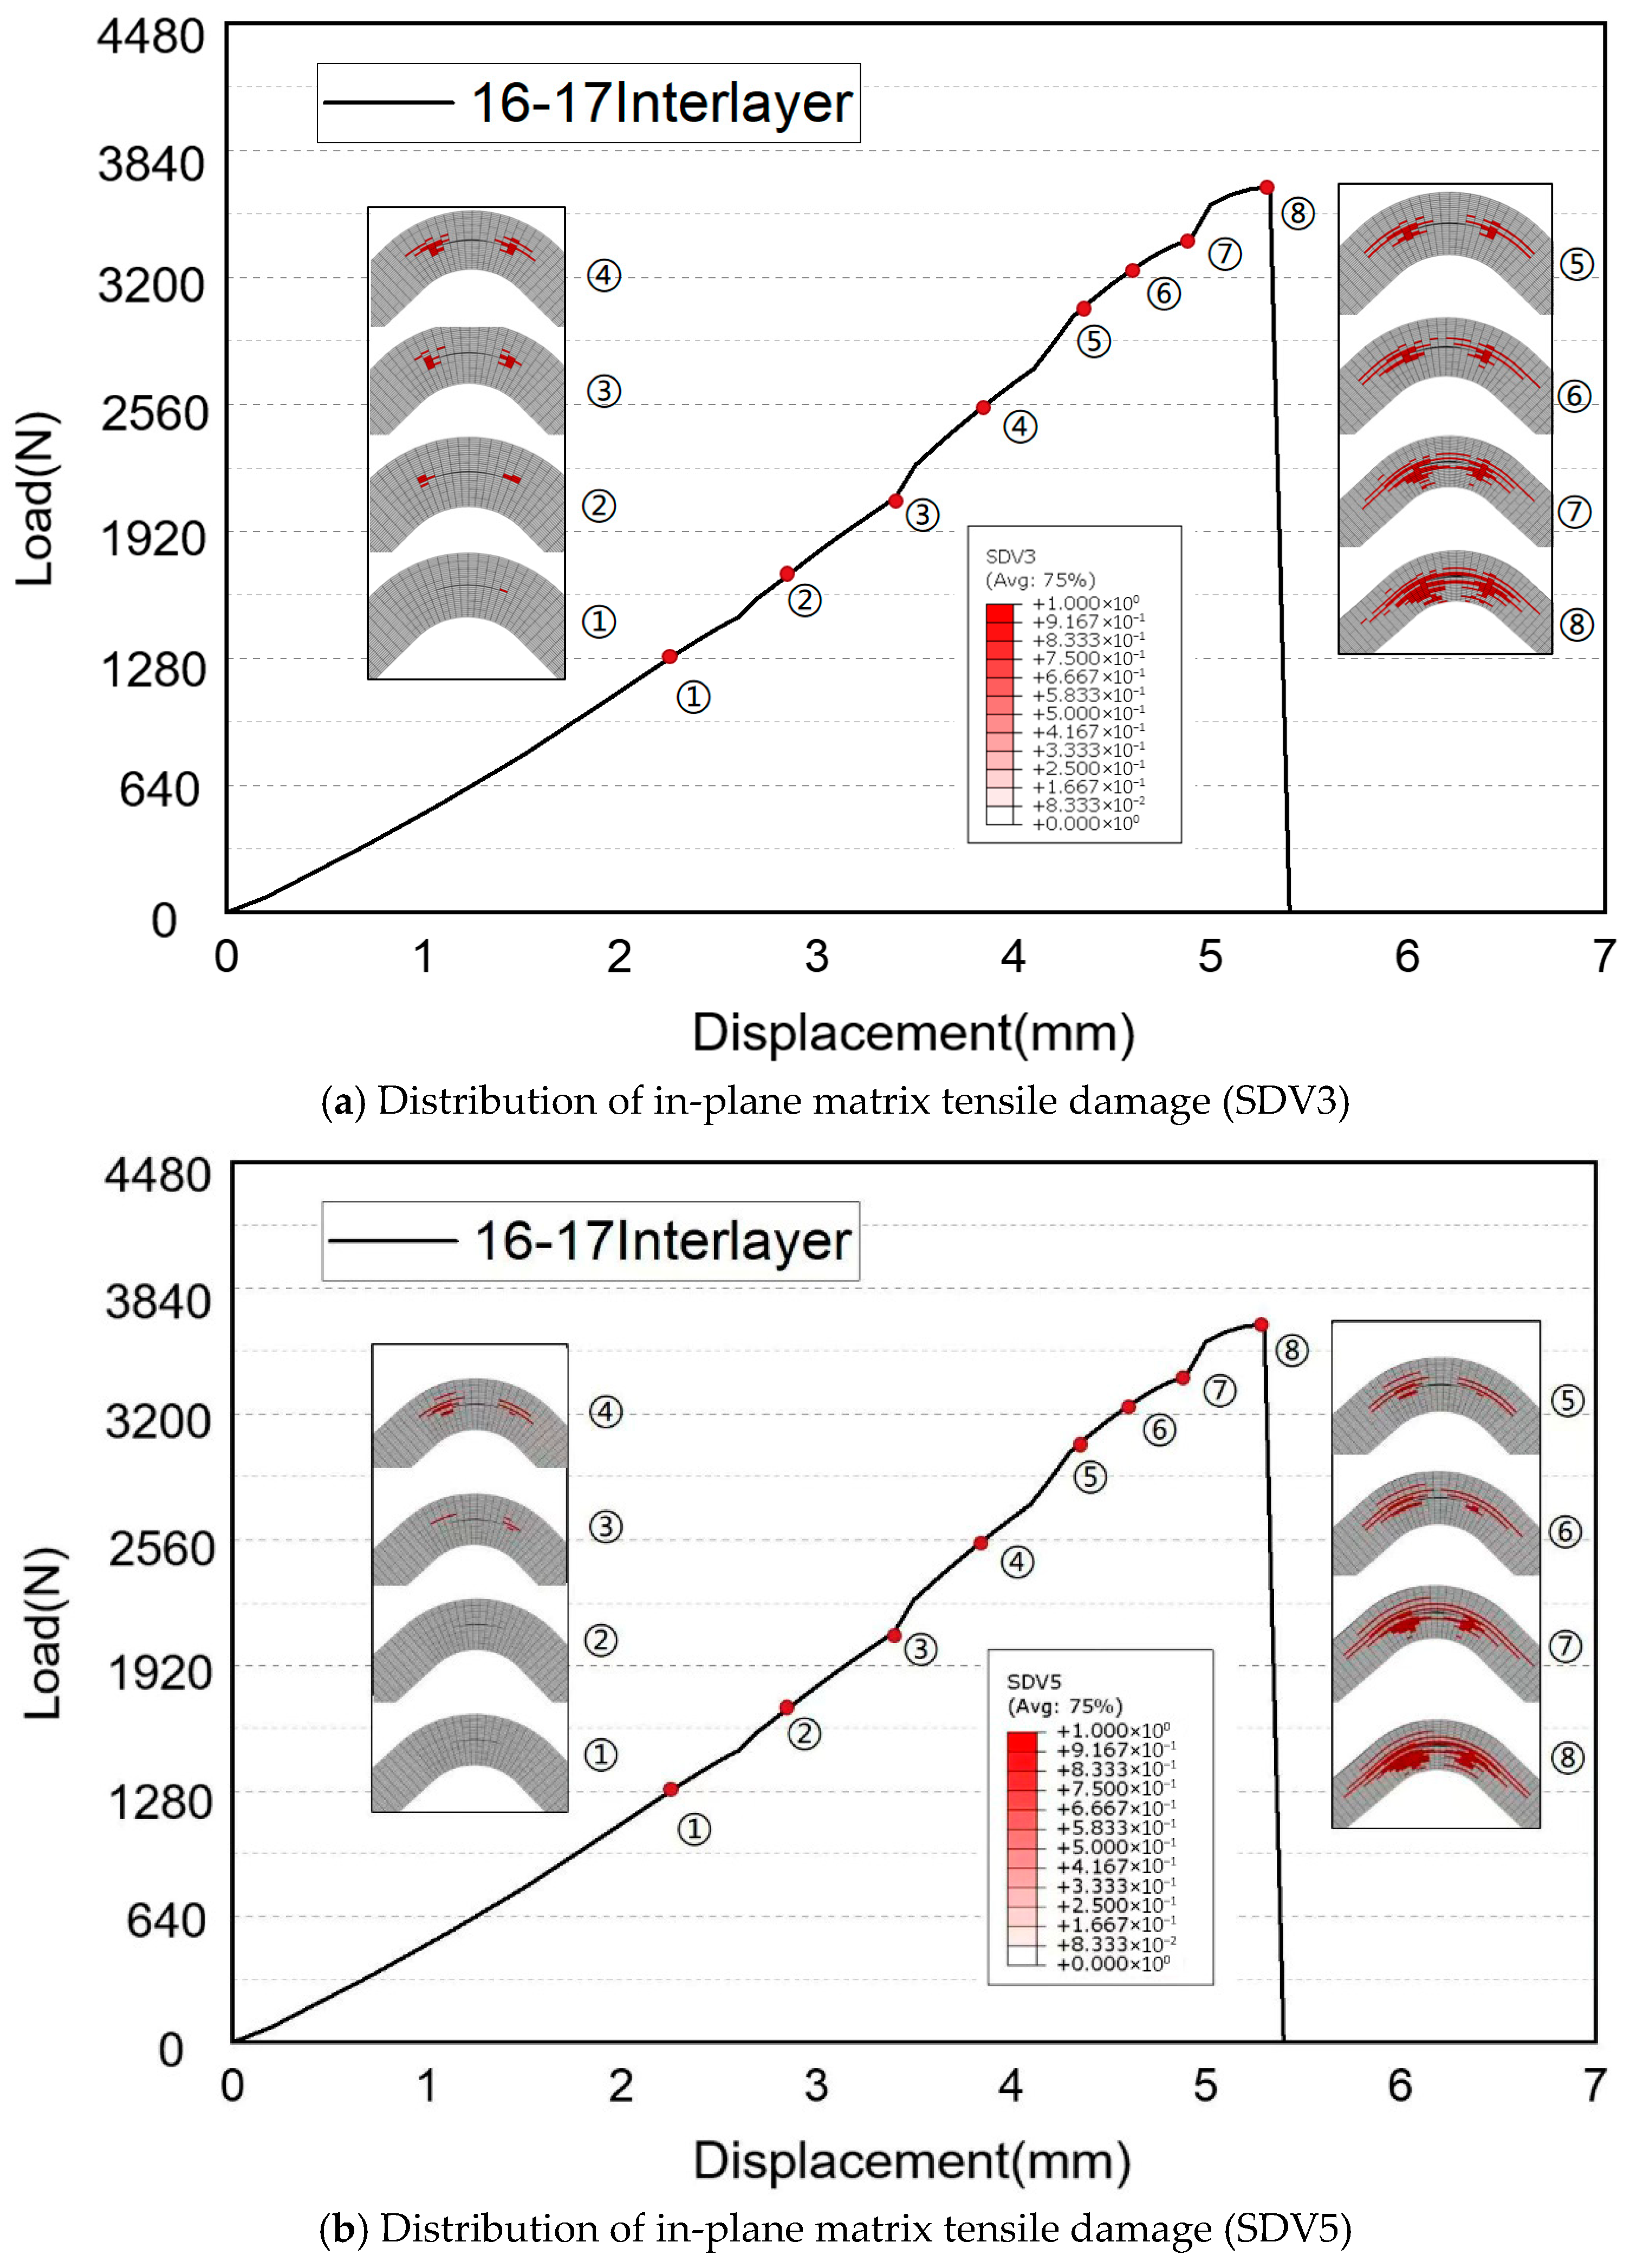
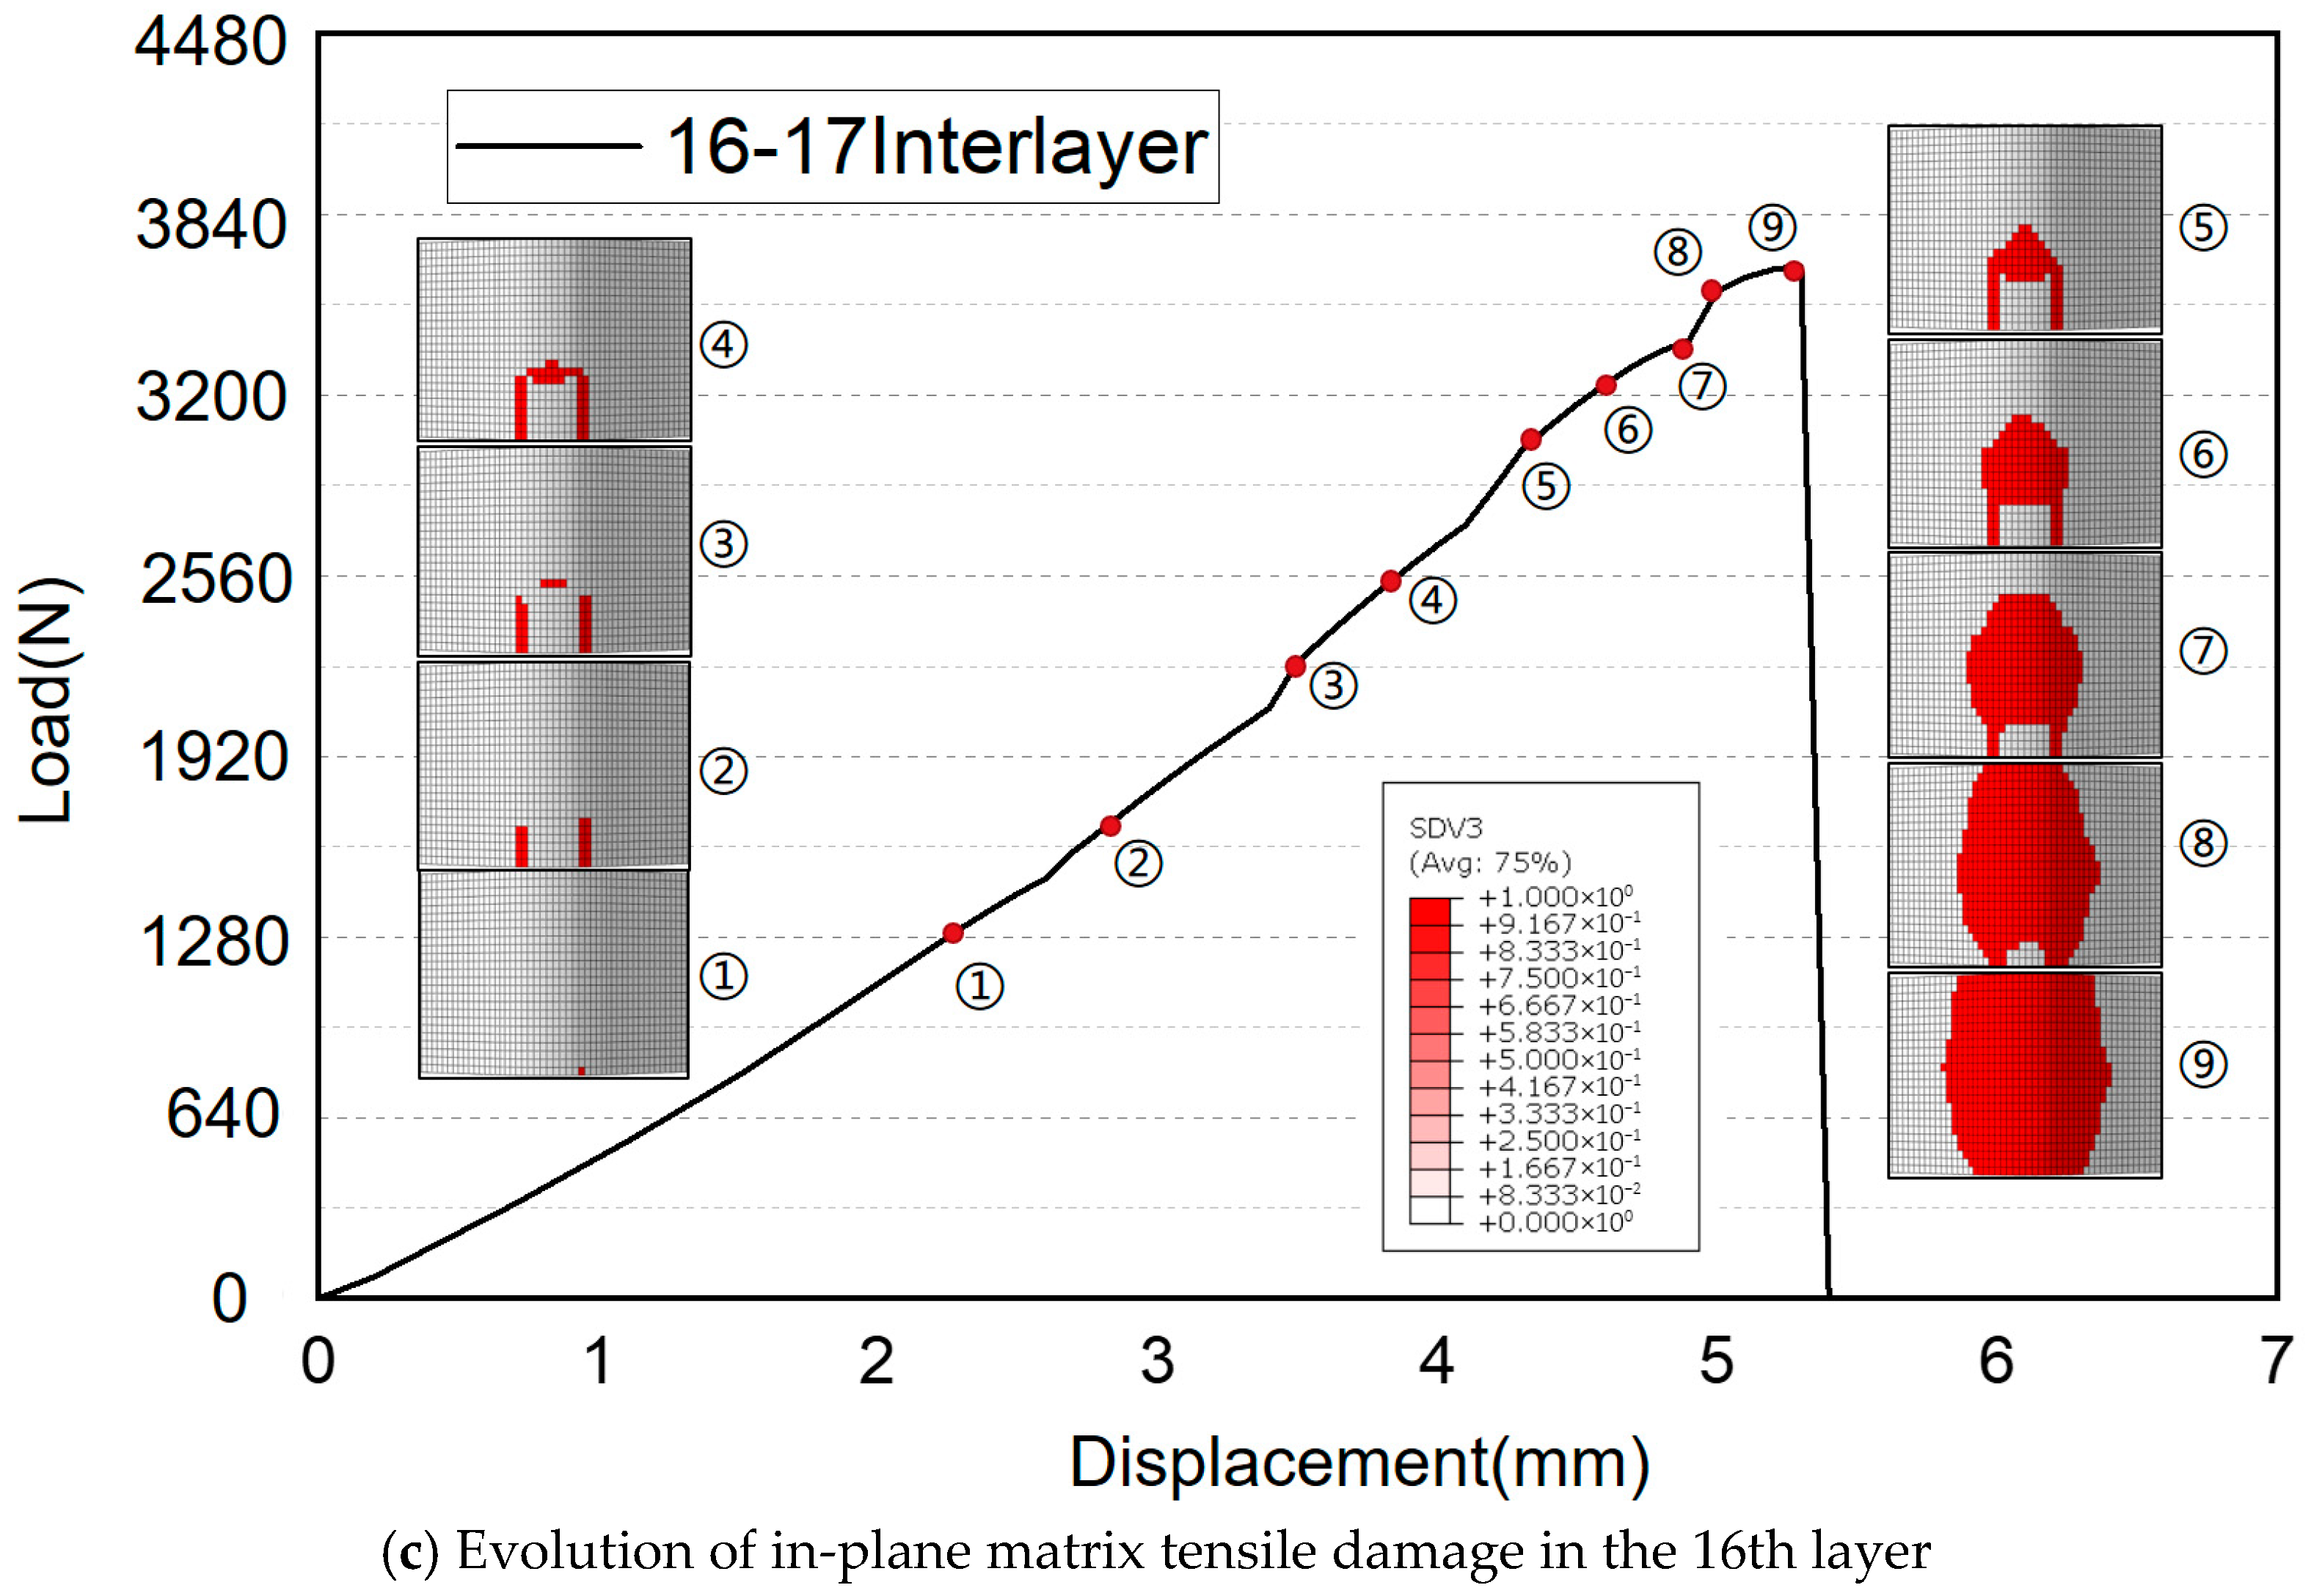
Figure 12 illustrates the damage failure process of the most severe delamination at position 2 in Figure 11. Comparing the load–displacement curves in Figure 12a,b, it is evident that, similar to the undamaged structure, the delamination area initially experiences in-plane resin tensile failure (SDV3), followed by out-of-plane tensile failure (SDV5) after a period of damage propagation. This process can be likened to peeling an onion, layer by layer. Initially, the damage spreads horizontally between layers, forming a cap-shaped crack (Figure 12c, steps 1–6), while small vertical cracks (SDV3) appear in the central region (Figure 12a, steps 1–6). Once the horizontal crack fully penetrates, the damage shifts to vertical propagation (Figure 12c, steps 7–8). Concurrently, additional SDV3 and SDV5 cracks emerge at the bottom of the beam, ultimately leading to complete structural collapse (Figure 12a,b, steps 7–8). This multidirectional damage progression is akin to a domino effect, where each stage triggers the next until the material fails entirely.
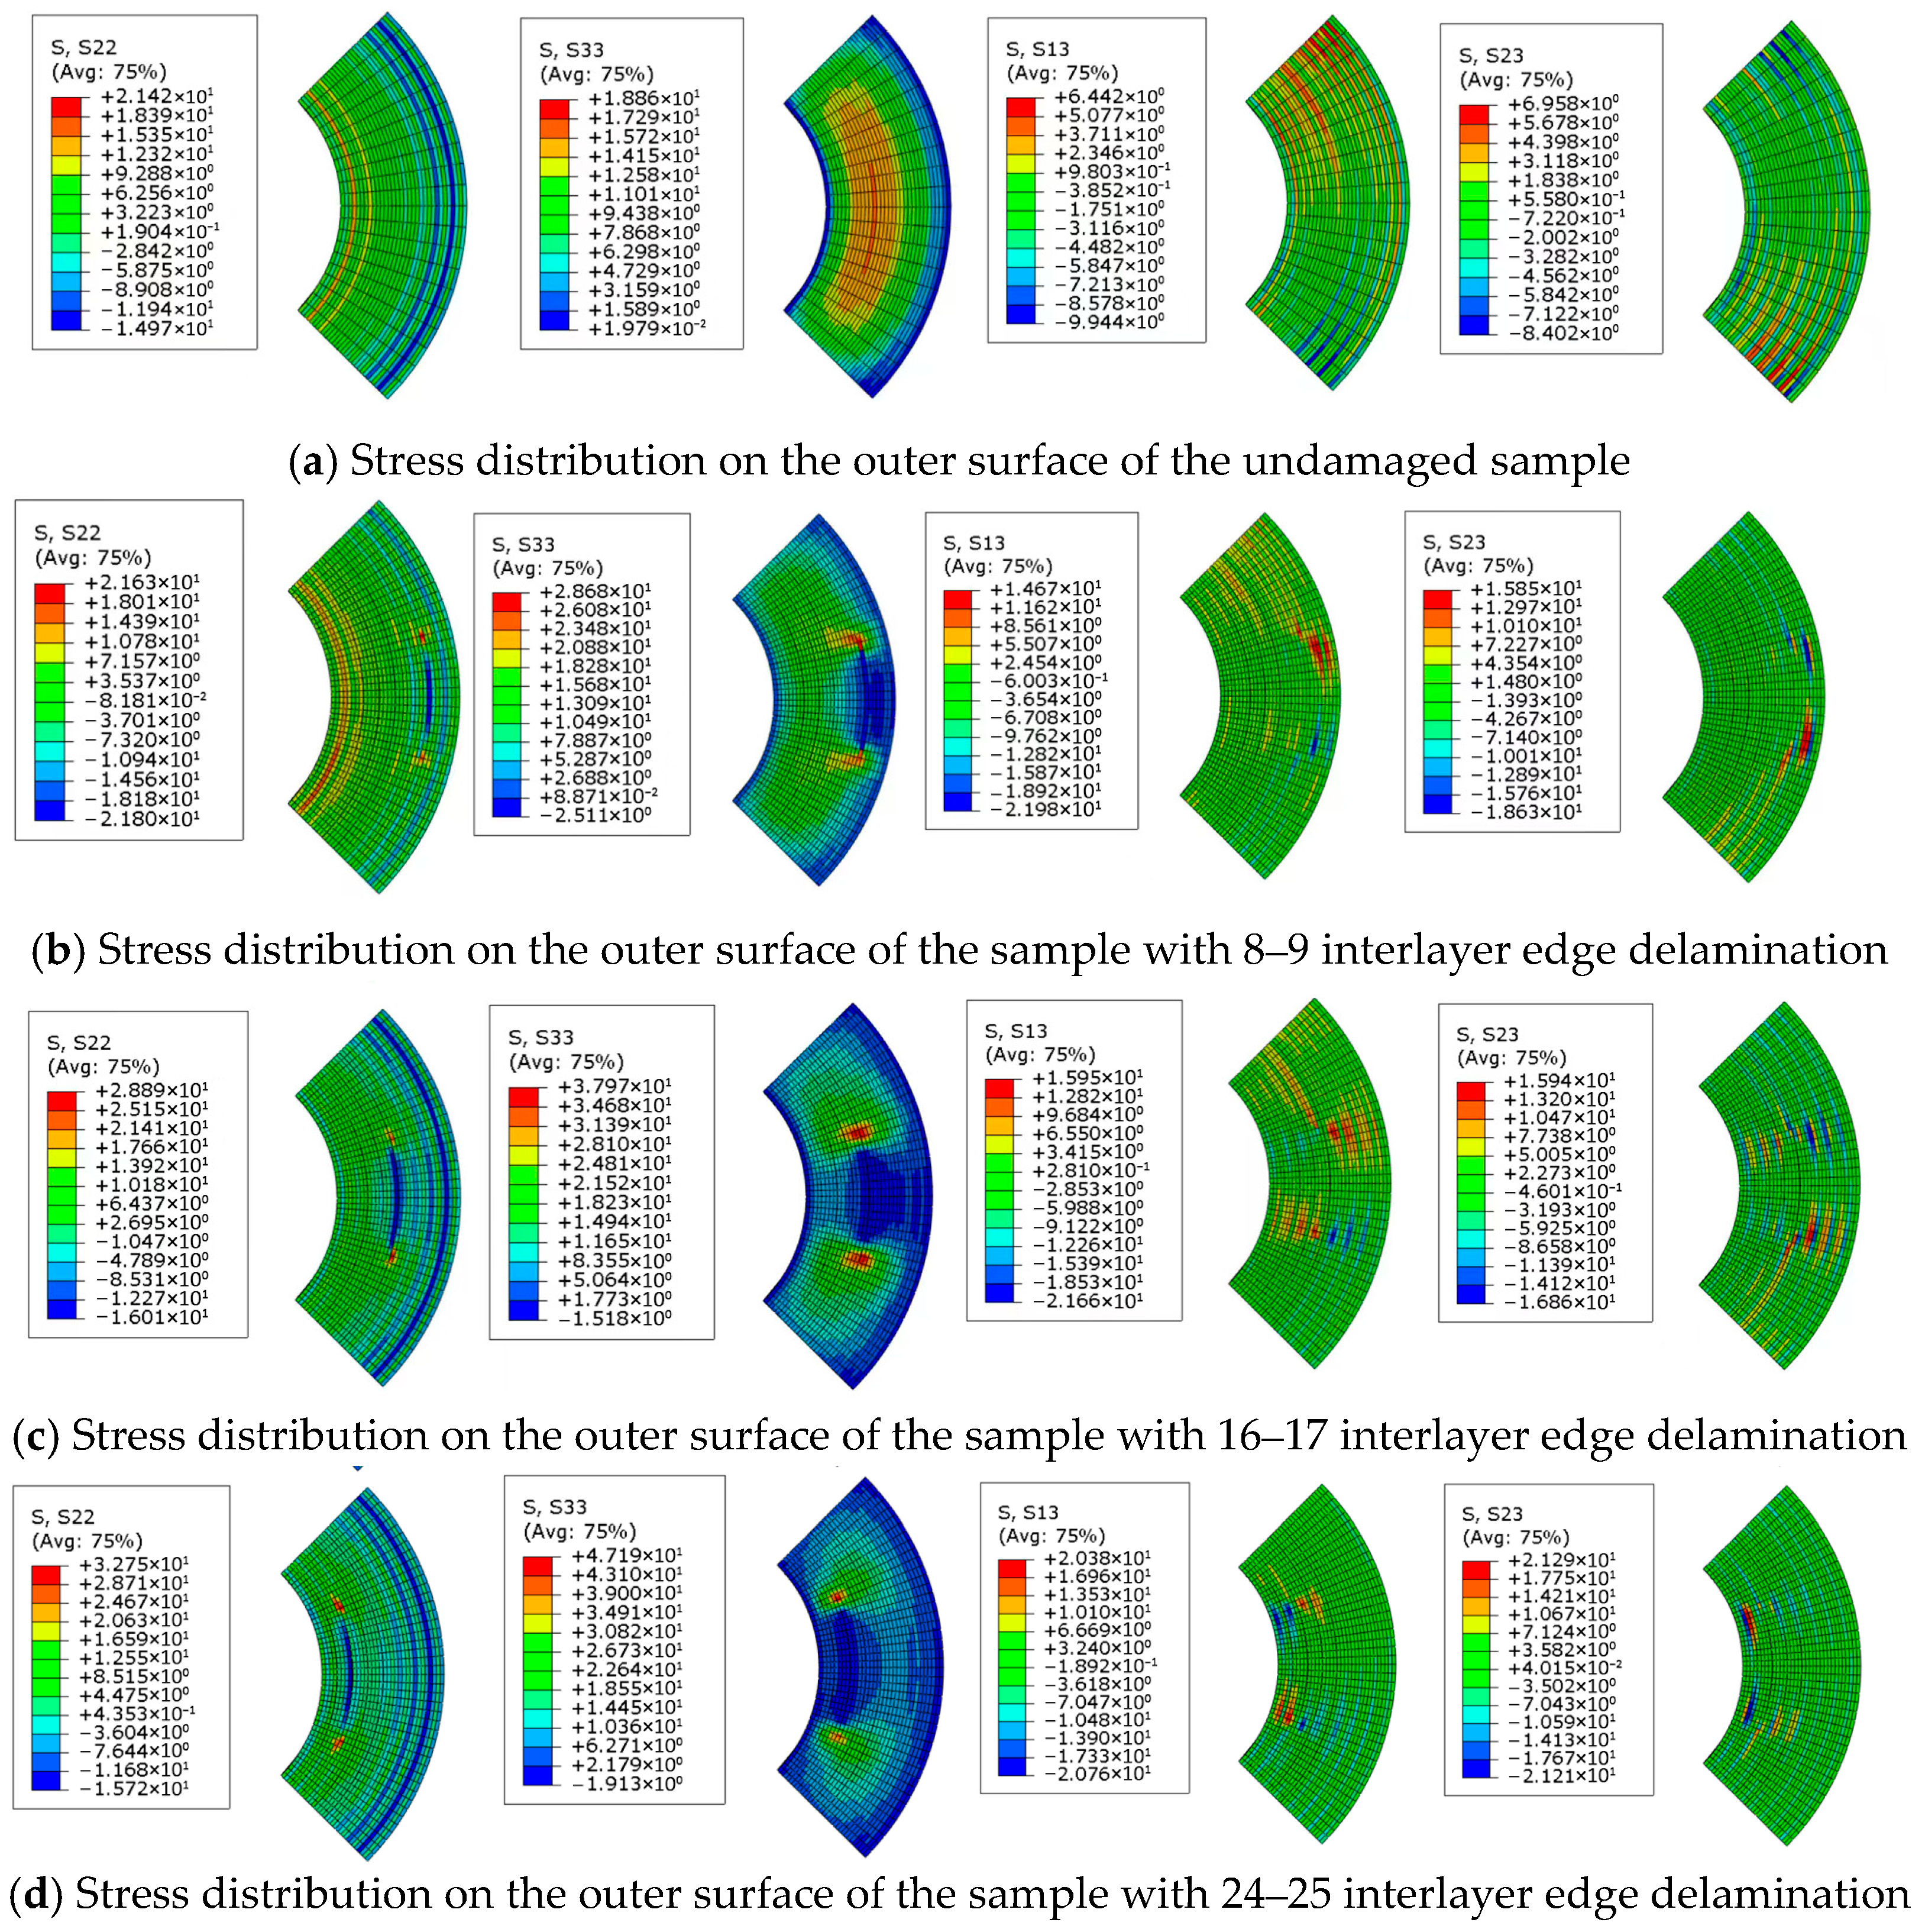
In the case of mid-plane delamination, compared to the stress distribution in an undamaged mid-plane, when the delamination is located between the 16th and 17th layers, the tensile stress S22 remains largely unchanged, but stress concentration occurs at the delamination front. The distribution of out-of-plane tensile stress S33 undergoes significant changes, with the tensile stress in the thickness direction decreasing and concentrating only at the delamination front. Shear stresses S13 and S23 also exhibit notable changes, with shear stress concentration appearing across the entire thickness at the delamination front; whereas when the delamination is located in the upper or lower regions, shear stress concentration only occurs in localized areas near the delamination. Overall, when the delamination is between the 16th and 17th layers, the stress distribution is more severe compared to cases where the delamination is between the 8th–9th layers or the 24th–25th layers, as shown in Figure 13.
When the delamination is located at the edge, the distribution characteristics of tensile stress and shear stress are similar to those when the delamination is located at the midplane, but the stress values at the edge delamination are significantly higher, indicating that edge delamination is more severe, as shown in Figure 14.

4. Conclusions

This paper utilizes numerical simulation methods to analyze the stress distribution and damage propagation in curved composite beams with pre-existing delamination under four-point bending loads. The research findings are summarized as follows:
(a)
The failure modes of curved beams with delamination damage are consistent with those of undamaged composite curved beams. Matrix tensile failure occurs initially, followed by tensile delamination. The combined effect of these failures leads to the progressive degradation of the curved beam.
(b)
For a quasi-isotropic laminated curved beam, delamination damage at the midplane of the specimen has the most significant impact on the load-bearing capacity of the curved beam. Delamination at the bottom of the curved beam affects its load-bearing capacity more severely than delamination at the top.
(c)
Delamination damage at the side edge of the midplane (Position 2) results in the greatest reduction in the load-bearing capacity of the curved beam. This observation is attributed to the manufacturing process, where cutting operations are likely to induce delamination damage at the side edges, thereby weakening the structural integrity of the curved beam.

Author Contributions

Conceptualization and methodology, X.Z.; validation, K.S.; formal analysis, K.S.; data curation, K.S.; writing—original draft preparation, K.S.; writing—review and editing, visualization, X.N.; supervision, X.Z.; funding acquisition, X.Z. All authors have read and agreed to the published version of the manuscript.

Funding

This research received no external funding.

Data Availability Statement

The data presented in this study are not available on request from the corresponding author because they are part of an ongoing study.

Conflicts of Interest

The authors declare no conflicts of interest.

References

  1. Hubert, P.; Poursartip, A. Aspects of the compaction of composite angle laminates: An experimental investigation. J. Compos. Mater. 2001, 35, 2–26. [Google Scholar] [CrossRef]
  2. Albert, C.; Fernlund, G. Spring-in and warpage of angled composite laminates. Compos. Sci. Technol. 2002, 62, 1895–1912. [Google Scholar] [CrossRef]
  3. Li, Y.; Li, M.; Gu, Y.; Zhang, Z. Numerical and Experimental Study on the Effect of Lay-Up Type and Structural Elements on Thickness Uniformity of L-Shaped Laminates. Appl. Compos. Mater. 2009, 16, 101–115. [Google Scholar] [CrossRef]
  4. Tamagawa, T.; Mori, Y.; Minakuchi, S. Consolidation mechanism of composite corners cured on convex and concave tools. Compos. Part A Appl. Sci. Manuf. 2023, 169, 107500. [Google Scholar] [CrossRef]
  5. Naji, M.I.; Hoa, S.V. Curing of Thick Angle-Bend Thermoset Composite Part: Curing Cycle Effect on Thickness Variation and Fiber Volume Fraction. J. Reinf. Plast. Compos. 1999, 18, 702–723. [Google Scholar] [CrossRef]
  6. Naji, M.I.; Hoa, S.V. Curing of Thick Angle-Bend Thermoset Composite Part: Curing Process Modification for Uniform Thickness and Uniform Fiber Volume Fraction Distribution. J. Compos. Mater. 2000, 34, 1710–1760. [Google Scholar] [CrossRef]
  7. Fernlund, G.; Griffith, J.; Courdji, R.; Poursartip, A. Experimental and numerical study of the effect of caul-sheets on corner thinning of composite laminates. Compos. Part A-Appl. Sci. Manuf. 2002, 33, 411–426. [Google Scholar] [CrossRef]
  8. Huoying, D.; Zuoguarng, Z.; Yizhuo, G.U.; Min, L.I. Experimental research on defects of L-shape laminates in vacuum-bag process. Acta Mater. Compos. Sin. 2007, 24, 34–39. [Google Scholar]
  9. Wang, X.; Xie, F.; Li, M.; Zhang, Z. Influence of Tool Assembly Schemes and Integral Molding Technologies on Compaction of T-stiffened Skins in Autoclave Process. J. Reinf. Plast. Compos. 2010, 29, 1311–1322. [Google Scholar] [CrossRef]
  10. Wang, X.; Xie, F.; Li, M.; Zhang, Z. Influence of core fillers on resin flow and fiber compaction of cocured skin-to-stiffener structures. Polym. Compos. 2010, 31, 1360–1368. [Google Scholar] [CrossRef]
  11. Xin, C.B.; Gu, Y.Z.; Li, M.; Luo, J.; Li, Y.X.; Zhang, Z.G. Experimental and numerical study on the effect of rubber mold configuration on the compaction of composite angle laminates during autoclave processing. Compos. Part A Appl. Sci. Manuf. 2011, 42, 1353–1360. [Google Scholar] [CrossRef]
  12. Wang, X.; Li, S.; Xie, F. Influence of curvature radius on manufacturing defect of composite component formed by autoclave. J. Aeronaut. Mater. 2020, 40, 90–96. [Google Scholar] [CrossRef]
  13. Wang, M.; Liu, Y. Elasticity solutions for orthotropic functionally graded curved beams. Eur. J. Mech.—A/Solids 2013, 37, 8–16. [Google Scholar] [CrossRef]
  14. Lekhnitskii, S. Anisotropic Plates, Gordon and Breach; Science Publishers: New York, NY, USA, 1968; pp. 95–101. [Google Scholar]
  15. Bai, J.; Meng, Q.; Zhang, X. Analytical method of solution on delamination in symmetrical orthogonal composite laminated curved beams. Fuhe Cailiao Xuebao/Acta Mater. Compos. Sin. 2003, 20, 142–146. [Google Scholar]
  16. Shenoi, R.A.; Wang, W. Through-thickness stresses in curved composite laminates and sandwich beams. Compos. Sci. Technol. 2001, 61, 1501–1512. [Google Scholar] [CrossRef]
  17. Lin, K.C.; Hsieh, C.M. The closed form general solutions of 2-D curved laminated beams of variable curvatures. Compos. Struct. 2007, 79, 606–618. [Google Scholar] [CrossRef]
  18. Lin, K.C.; Lin, C.W. Finite deformation of 2-D laminated curved beams with variable curvatures. Int. J. Non-Linear Mech. 2011, 46, 1293–1304. [Google Scholar] [CrossRef]
  19. Wang, M.; Zhang, H.; Xu, Y.; Chang, Y. Calculation of residual compressive strength of composite laminates with initial delamination. Aeroengine 2019, 45, 44–50. [Google Scholar] [CrossRef]
  20. Martulli, L.M.; Bernasconi, A. An efficient and versatile use of the VCCT for composites delamination growth under fatigue loadings in 3D numerical analysis: The Sequential Static Fatigue algorithm. Int. J. Fatigue 2023, 170, 107493. [Google Scholar] [CrossRef]
  21. Andraju, L.B.; Raju, G. Continuum and cohesive zone damage models to study intra/inter-laminar failure of curved composite laminates under four-point bending. Compos. Struct. 2020, 253, 112768. [Google Scholar] [CrossRef]
  22. Ranz, D.; Cuartero, J.; Castejón, L.; Miralbes, R.; Valladares, D. Enhanced cohesive zone model to predict delamination behavior of carbon/epoxy laminated curved beams. Mech. Adv. Mater. Struct. 2022, 29, 331–341. [Google Scholar] [CrossRef]
  23. Roach, J.; Zhang, D. Progressive failure simulation of angled composite beams subject to flexural loading. Compos. Struct. 2024, 340, 118111. [Google Scholar] [CrossRef]
  24. Hashin, Z. Failure Criteria for Unidirectional Fiber Composites. J. Appl. Mech. 1980, 47, 329–334. [Google Scholar] [CrossRef]
  25. Pinho, S.; Iannucci, L.; Robinson, P. Formulation and implementation of decohesion elements in an explicit finite element code. Compos. Part A Appl. Sci. Manuf. 2006, 37, 778–789. [Google Scholar] [CrossRef]
  26. McCarthy, C.T.; McCarthy, M.A.; Stanley, W.F.; Lawlor, V.P. Experiences with Modeling Friction in Composite Bolted Joints. J. Compos. Mater. 2005, 39, 1881–1908. [Google Scholar] [CrossRef]
  27. Lin, Y.C. Research on Static and Fatigue Performance of Composite Curved Beams. Master’s Thesis, Shanghai Jiao Tong University, Shanghai, China, 2022. [Google Scholar]
  28. ASTM D6415/D6415M-06a; Standard Test Method for Measuring the Curved Beam Strength of a Fiber-Reinforced Polymer-Matrix Composite. ASTM International: West Conshohocken, PA, USA, 2013. [CrossRef]
  29. Bian, J.; Zhou, B.; Zheng, Z.; Fan, Y. Analysis of ablation and residual strength for lightning strike on carbon fiber reinforced polymer laminates. Aero Weapon. 2024, 31, 115–122. [Google Scholar] [CrossRef]
  30. Songhan Plastic Technology Co., Ltd. Hexcel® HexPly® M21 356°F (180 °C) Curing Epoxy Matrix. Available online: https://www.lookpolymers.com/pdf/Hexcel-HexPly-M21-356F-180C-Curing-Epoxy-Matrix.pdf (accessed on 3 January 2016).
  31. Yang, Y.; Liu, X.; Wang, Y.; Gao, H.; Li, R.; Bao, Y. A progressive damage model for predicting damage evolution of laminated composites subjected to three-point bending. Compos. Sci. Technol. 2017, 151, 85–93. [Google Scholar] [CrossRef]
  32. González-Cantero, J.M.; Graciani, E.; López-Romano, B.; París, F. Competing mechanisms in the unfolding failure in composite laminates. Compos. Sci. Technol. 2018, 156, 223–230. [Google Scholar] [CrossRef]
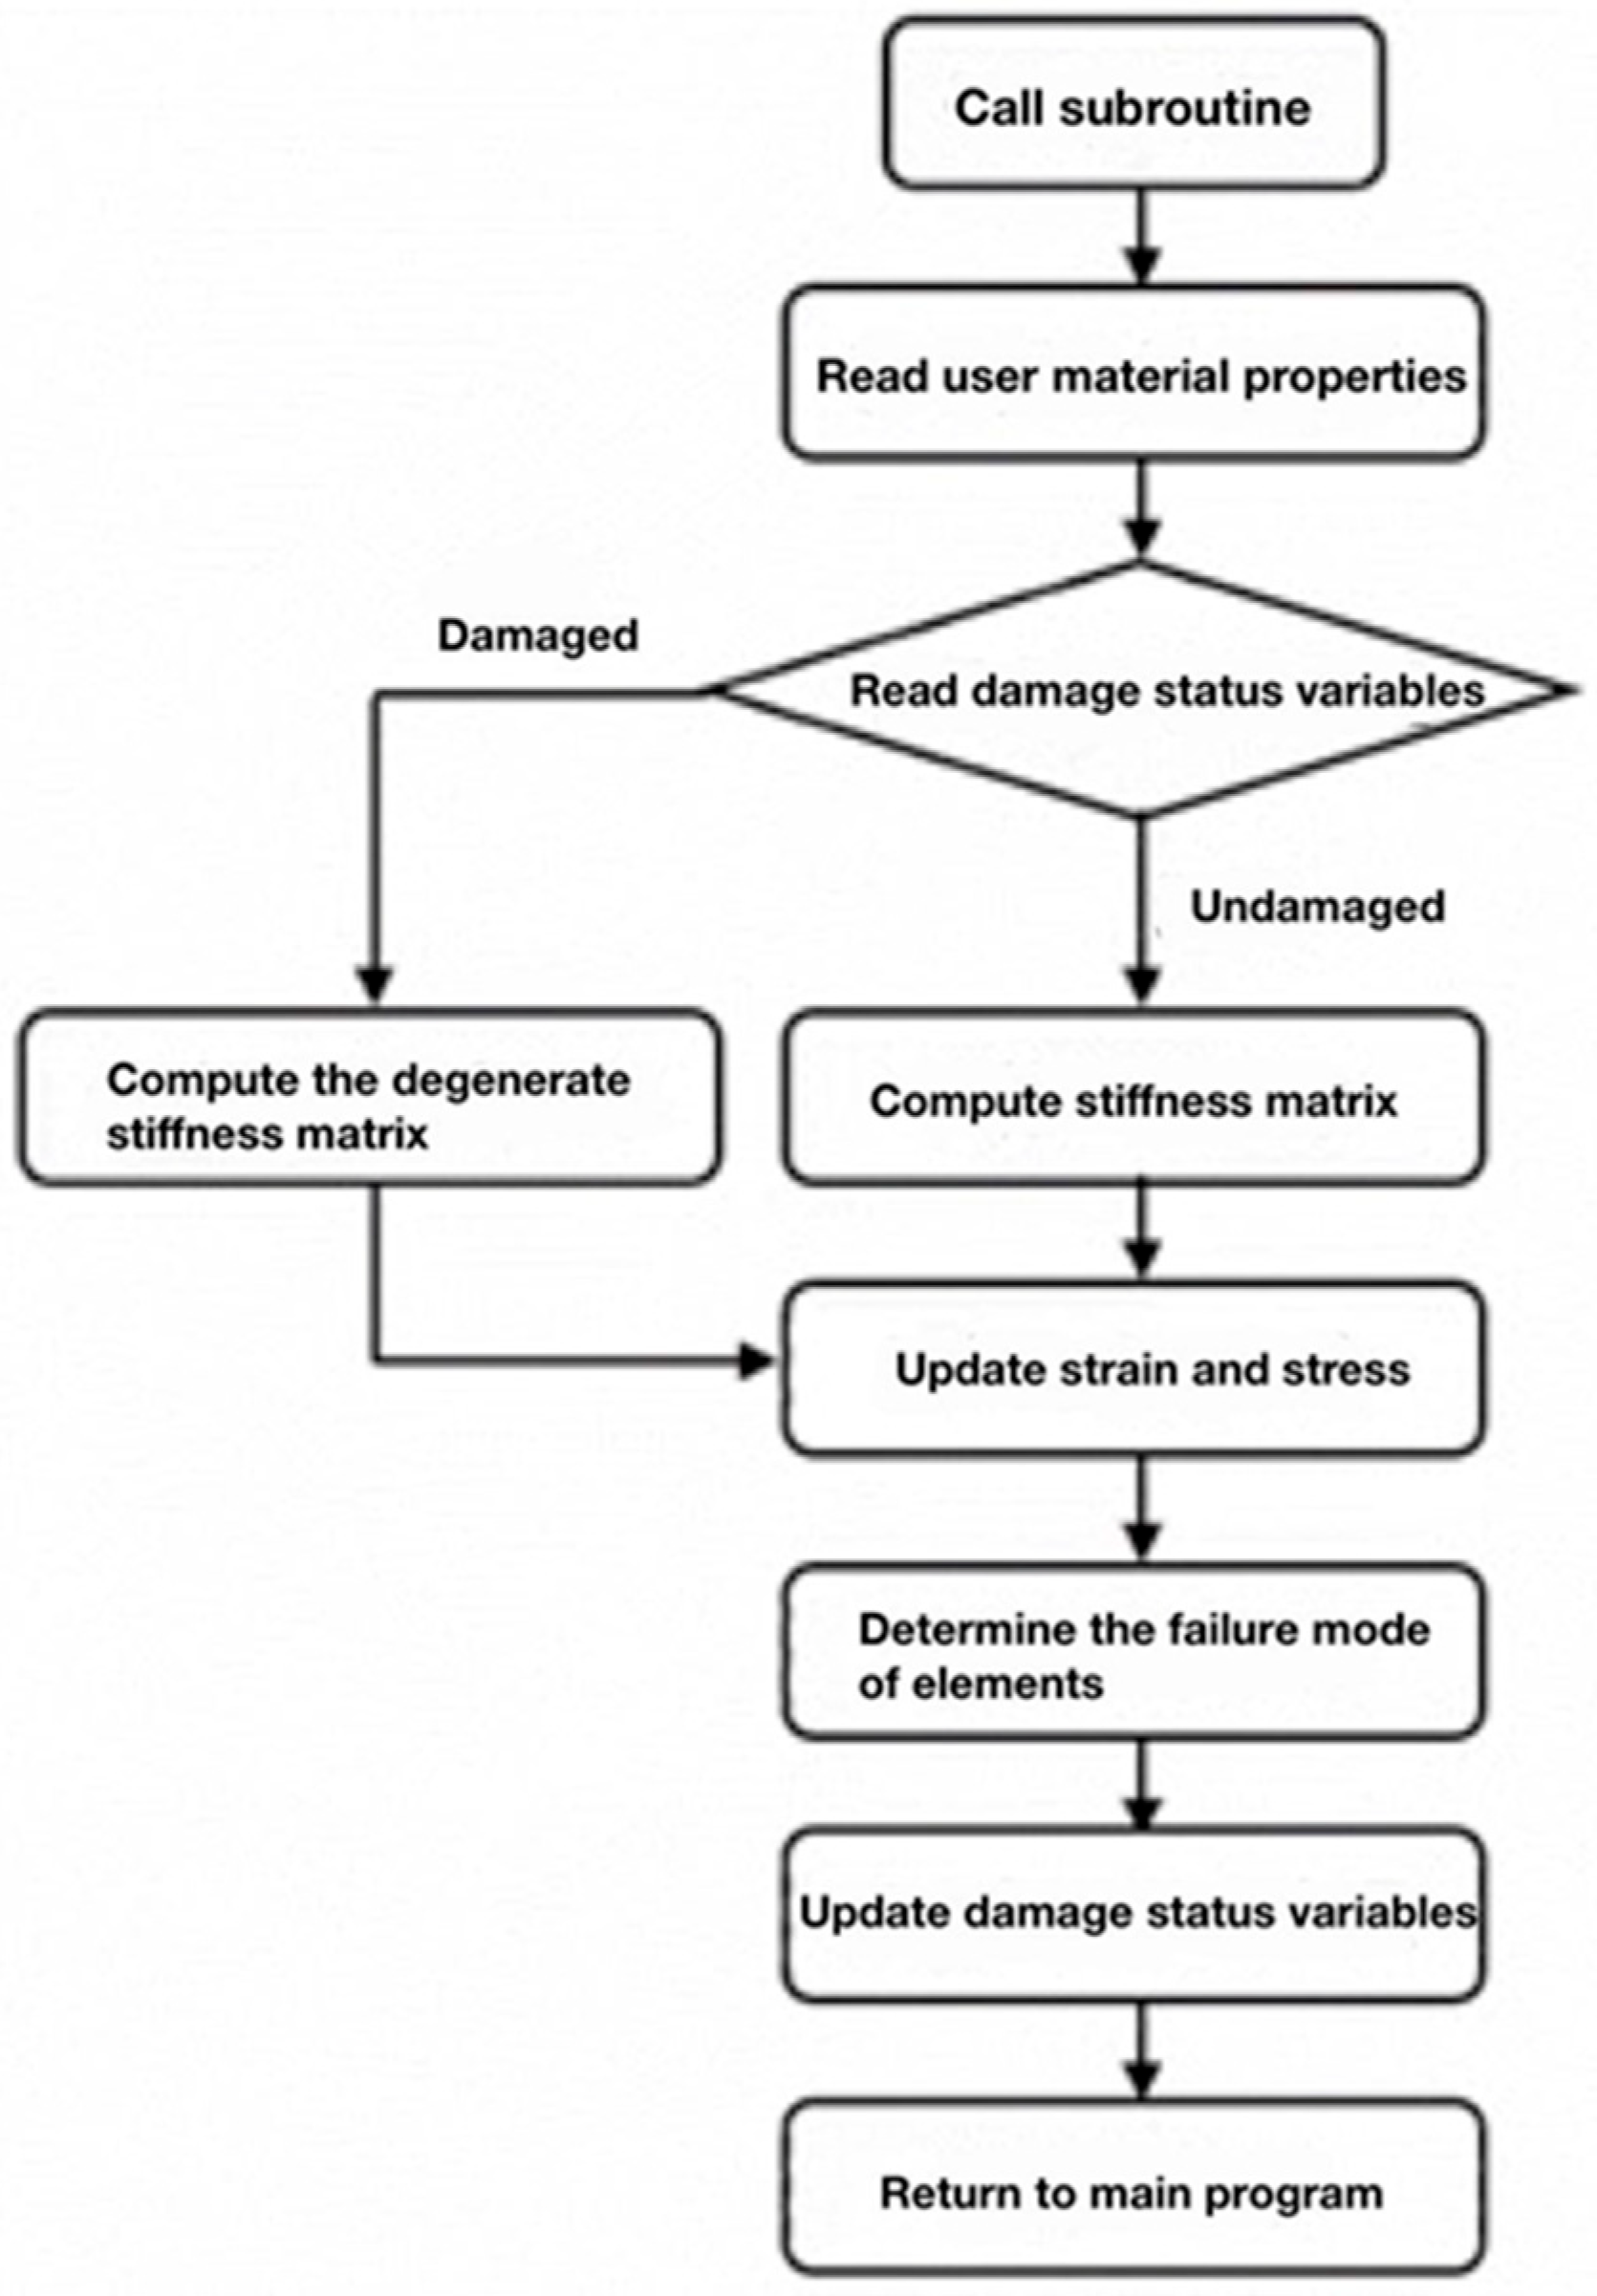
Figure 1. Flowchart of the UMAT subroutine.
Aerospace 12 00832 g001
Figure 2. Geometric dimensions of the composite curved beam.
Aerospace 12 00832 g002
Figure 3. Through-thickness position of the prefabricated layered area.
Aerospace 12 00832 g003
Figure 4. Different sizes of the initial delamination.
Aerospace 12 00832 g004
Figure 5. Different in-plane positions of the initial delamination.
Aerospace 12 00832 g005
Figure 6. Load–displacement curve of undamaged curved beams.
Aerospace 12 00832 g006
Figure 7. The final failure of the curved beam.
Aerospace 12 00832 g007
Figure 8. Damage evolution process in an intact curved beam.
Aerospace 12 00832 g008
Figure 9. Failure loads of different initial delamination sizes.
Aerospace 12 00832 g009
Figure 10. Failure loads of the initial delamination with different through-thickness position.
Aerospace 12 00832 g010
Figure 11. Failure loads of the initial delamination with different in-plane position.
Aerospace 12 00832 g011
Figure 12. Damage failure process at Position 2 shown in Figure 11.
Aerospace 12 00832 g012aAerospace 12 00832 g012b
Figure 13. Comparison of stress distribution at the mid-plane between delaminated specimens and undamaged specimens in the case of mid-plane delamination.
Aerospace 12 00832 g013
Figure 14. Comparison of stress distribution at the mid-plane between delaminated specimens and undamaged specimens in the case of edge delamination.
Aerospace 12 00832 g014
Table 1. Properties of UD prepreg carbon-epoxy composite [29,30].
Mechanical PropertiesValueUnits
E 1 146GPa
E 2 8.94GPa
G 12 5.66GPa
ν 12 0.33
X T 3400MPa
X C 1500MPa
Y T 75MPa
Y C 185MPa
S 12 102MPa
G f 105 N · mm 1
G m 0.3 N · mm 1
Disclaimer/Publisher’s Note: The statements, opinions and data contained in all publications are solely those of the individual author(s) and contributor(s) and not of MDPI and/or the editor(s). MDPI and/or the editor(s) disclaim responsibility for any injury to people or property resulting from any ideas, methods, instructions or products referred to in the content.