Article

Numerical Study on Self-Pulsation Phenomenon in Liquid-Centered Swirl Coaxial Injector with Recess

School of Mechanical Engineering, Chungbuk National University, Cheongju 28644, Republic of Korea
*
Author to whom correspondence should be addressed.
Aerospace 2025, 12(9), 796; https://doi.org/10.3390/aerospace12090796
Submission received: 6 July 2025 / Revised: 30 August 2025 / Accepted: 2 September 2025 / Published: 3 September 2025
(This article belongs to the Section Astronautics & Space Science)

Abstract

This study investigates self-pulsation phenomena in a liquid-centered swirl coaxial injector with a recess length of 4 mm, under varying liquid flow conditions, using numerical simulations. The simulations focused on analyzing spray patterns, pressure oscillations, and dominant frequency characteristics, and the results were compared with previous experimental data. Self-pulsation, observed at liquid flow rates of 60%, 90%, and 100% of nominal values, generated distinctive periodic oscillations in the spray pattern, forming “neck” and “shoulder” breakup structures that resemble a Christmas tree. Surface waves induced by Kelvin-Helmholtz and Rayleigh-Taylor instabilities were identified at the gas-liquid interface, contributing to enhanced atomization and reduced spray breakup length. FFT analysis of the pressure oscillations highlighted a match in trends between simulation and experimental data, although variations in dominant frequency magnitudes arose due to the absence of manifold space in simulations, confining oscillations and slightly elevating dominant frequencies. Regional analysis revealed that interactions between the high-speed gas and liquid film in the recess region drive self-pulsation, leading to amplified pressure oscillations throughout the injector’s internal regions, including the gas annular passage, tangential hole, and gas core. These findings provide insights into the internal flow dynamics of swirl coaxial injectors and inform design optimizations to control instabilities in liquid rocket engines.

1. Introduction

The swirl coaxial injector is extensively used in liquid rocket engines due to its high efficiency and stability in the atomization and mixing of fuel and oxidizer propellants [1,2,3,4]. Based on the phase of the fuel and oxidizer, swirl coaxial injectors are categorized into gas-gas, gas-liquid, and liquid-liquid types. Gas-liquid swirl coaxial injectors are further classified into liquid- and gas-centered configurations [4]. In a liquid-centered swirl coaxial injector, a liquid propellant is introduced through tangential holes in the inner injector. It generates rotational momentum as the liquid moves axially and forms a conical liquid sheet with a gas core at the center. The outer injector introduces a gas propellant at high velocity through an annular outlet, which disrupts the thin liquid film and leads to finer atomization downstream [5,6,7]. The atomization process in liquid-centered swirl coaxial injectors is influenced by the Kelvin-Helmholtz and Rayleigh-Taylor instabilities that arise during gas-liquid interactions [8]. These instabilities induce unstable wave patterns on the liquid sheet, which are often associated with self-pulsation [9,10,11].
The self-pulsation phenomenon in liquid-centered swirl coaxial injectors was first discovered in the mid-1970s during sub-nominal experiments on liquid oxygen (LOx)/hydrogen engines [12,13]. This phenomenon is characterized by flow and pressure oscillations that generate acoustic frequencies on the order of several kilohertz, which can resonate within the feed system and combustion chamber, destabilizing the engine [14,15,16]. If the pulsation frequency aligns with the acoustic mode frequencies of the combustion chamber, the resulting pressure oscillations may be amplified, posing a risk of severe engine damage [17]. Consequently, understanding the stable operating range of swirl coaxial injectors is vital for optimizing the performances of the injector and engine; thus, studying spray instabilities such as self-pulsation is critical.
The mass flow rate influences the internal flow dynamics within the injector, thereby affecting the spray angle and breakup of the liquid film sheet and altering the frequency response [16,18]. Additionally, the recess length affects the interaction between the gas and liquid phases; therefore, it is a critical design parameter for optimizing injector performance [19,20,21,22]. Huang et al. [9] observed that in swirl coaxial injectors, periodic self-pulsation occurred as the gas velocity increased; this observation led to their proposal of an acoustic model based on an analysis of the experimental results. They identified the annular gas velocity as a decisive factor in high-frequency oscillations, observing that free-running frequencies at the annular outlet coupled with pressure oscillations induce instabilities. Chu et al. [23] employed numerical simulations and confirmed that as the mixture ratio increased, the gas-liquid interaction became more dominant as the liquid film broke up, promoting pressure fluctuations in the surrounding flow field and triggering self-pulsation. Bai et al. [24] demonstrated that the blockage effect of a conical liquid sheet in recessed swirl coaxial injectors plays a key role in self-pulsation, identifying the upper and lower flow rate boundaries for its onset based on the conditions of the propellant flow. Im et al. [25] demonstrated that self-pulsation is caused by unstable surface waves on the liquid sheet, in which the frequency of self-pulsation is influenced by the dominant wave on the sheet. Eberhart et al. [11] investigated the acoustic eigenmodes of the major oscillators in swirl coaxial injectors and found that the dominant surface waves responsible for the self-pulsation mechanism occurred not only on the external liquid sheet but also within the injector.
Several other researchers [26,27,28,29] have also identified the flow conditions in recessed injectors as a critical factor that influences self-pulsation, focusing on the interaction between the liquid film and high-speed gas flow. The self-pulsation phenomenon is characterized by pressure oscillations that affect both the spray pattern and internal flow field. A comprehensive understanding of self-pulsation in liquid-centered swirl coaxial injectors requires insights into the properties of the complex internal flow and acoustic fields generated by vortex interactions. However, despite extensive research, this phenomenon remains only partially understood because of the variability in the injector geometry and operating conditions.
Ahn et al. [30] experimentally confirmed the occurrence of self-pulsation in liquid-centered swirl coaxial injectors with several recess lengths in a LOx/gaseous methane (GCH4) thrust chamber. Using pressure fluctuation data measured during the manifold and high-speed spray imaging process, they examined the effects of the recess length on the spray characteristics and mechanisms; however, a detailed analysis of the internal flow and acoustic fields proved to be challenging. Therefore, in this study, a numerical analysis of the internal flow was performed and the effects of the liquid flow conditions on self-pulsation in a recessed injector were investigated. The influence of self-pulsation on the internal flow was ascertained by placing multiple probes evenly throughout the injector and analyzing the properties of the distinct regions. Furthermore, by synthesizing the analysis results, the spray instability and occurrence of self-pulsation in the liquid-centered swirl coaxial injector were correlated with the liquid flow rate, ultimately elucidating the self-pulsation mechanism.

2. Numerical Methods

2.1. Injector Modeling

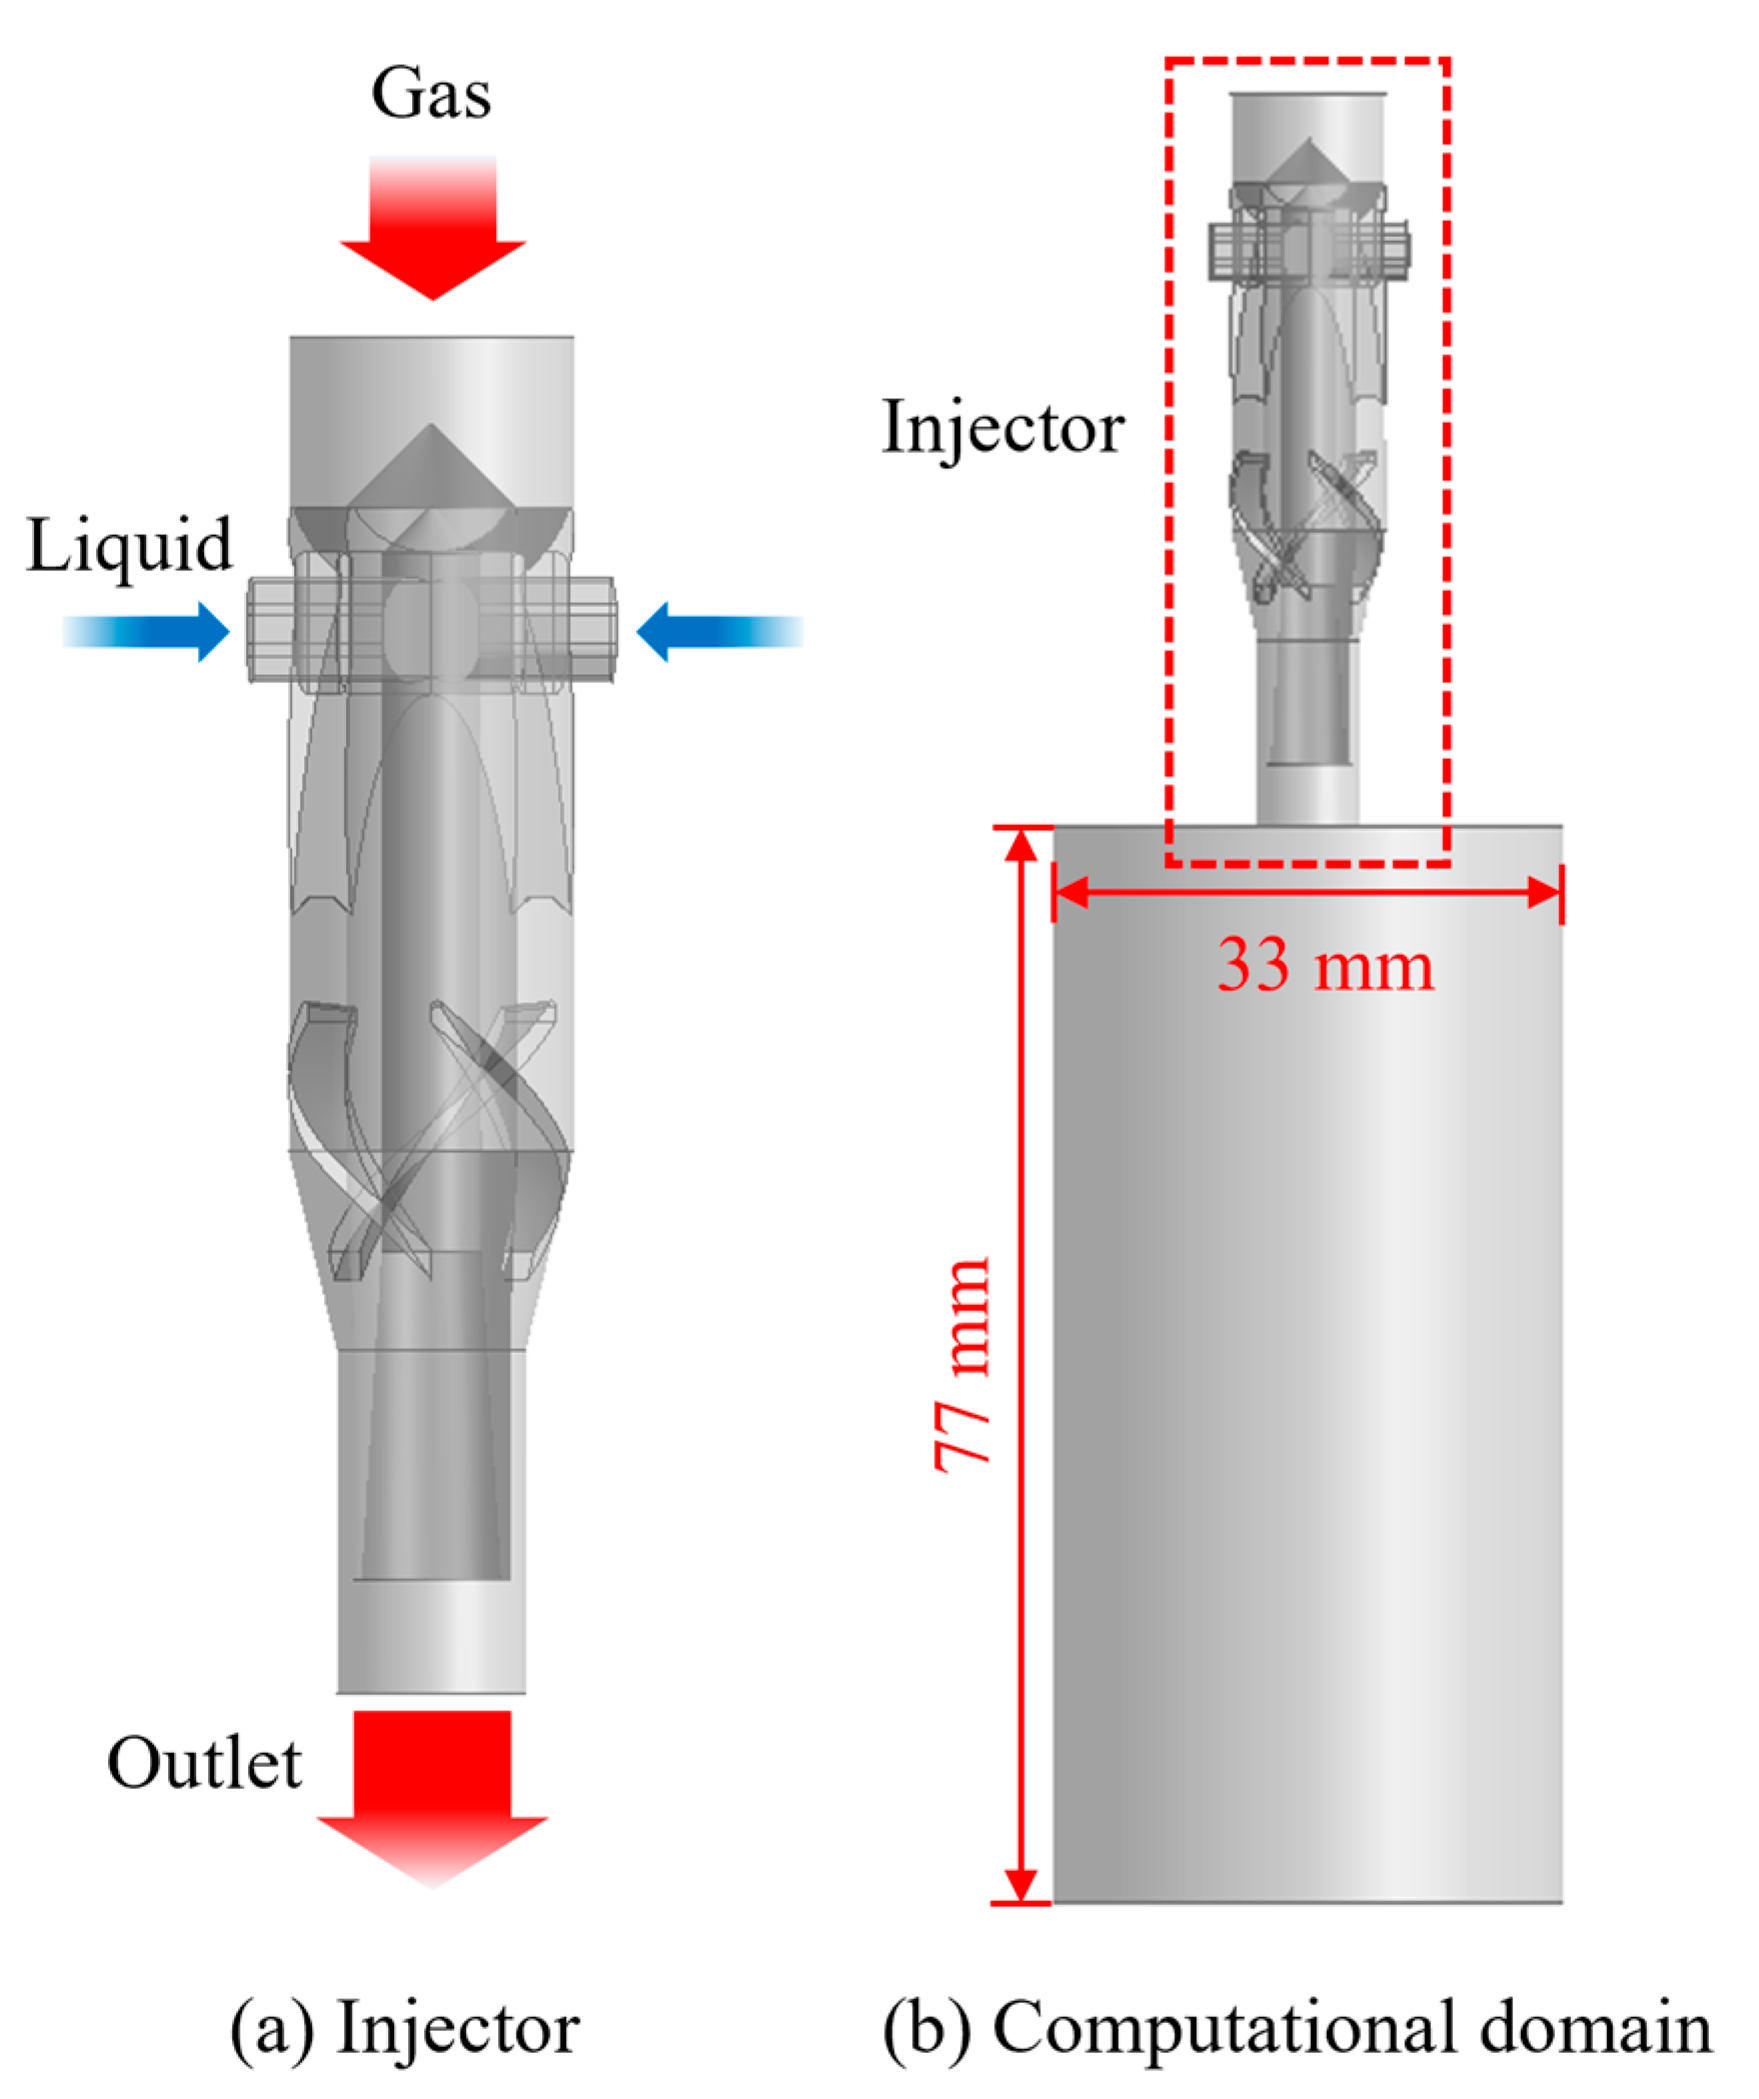
The injector used in this study was identical to that employed by Ahn et al. [30], and the analysis focused specifically on cases with a recess length of 4 mm. The schematic and geometric details of the injector are provided in Figure 1 and Table 1, respectively. The liquid propellant was introduced into the inner injector through two tangential holes, which generated rotational motion as it was injected. The gas propellant entered the outer injector through holes in the straight section and gained rotational momentum after passing through the three helical vanes. The vane angle was 42°, and its swirl number was calculated to be 0.74. This co-swirl injector design enables both the gas and liquid to rotate in the same direction.
As illustrated in Figure 2, a 3D model of the internal fluid section of the injector was created using a cylindrical spray domain 33 mm in diameter and 77 mm high. This domain was placed below the injector outlet to observe the spray pattern. Owing to the pointed geometry of the gas inlet within the injector, directly setting the inlet as a boundary condition could obstruct the fluid flow and introduce abrupt changes. Therefore, an additional cylindrical extension 3 mm long was added to the straight section of the gas inlet to facilitate the flow analysis.

2.2. Simulation Model Setup

The commercial computational fluid dynamics software ANSYS Fluent 2023 R2 [31,32] was used for the analysis. Given that the self-pulsation phenomenon in swirl coaxial injectors involves rapid flow and pressure oscillations, as well as kilohertz-range frequencies, a transient-state analysis was conducted using a time step of 2 μs. For the compressible gas-liquid two-phase flow, the Reynolds-averaged Navier–Stokes (RANS) equations were used in conjunction with the renormalization group (RNG) k-ε turbulence model and volume of fluid (VOF) multiphase flow equations.
The VOF method, which is suitable for tracking the gas–liquid interface, assumes that multiple fluids do not interpenetrate. Each computational cell or control volume is represented by the volume fraction of the q phase (αq), and the sum of the volume fractions of all phases in any given cell is equal to 1. In this analysis, for the spray in the liquid-centered swirl coaxial injector, gas was defined as the primary phase and liquid as the secondary phase. As a result, three possible scenarios could occur within the cells:
a 2 = 0 :   the cell is filled with gas (empty) ; a 2 = 1 :   the cell is filled with liquid ; 0 < a 2 < 1 :   the cell contains both gas and liquid .
Each phase satisfies the continuity equation, which is expressed as
α q ρ t + · α q ρ v = 0 .
The interface between the phases is tracked using the solutions to the continuity equations for the volume fractions of both phases, which are described by
α 1 ρ 1 t + · α 1 ρ 1 v 1 = m ˙ 21 m ˙ 12 ,
α 2 ρ 2 t + · α 2 ρ 2 v 2 = m ˙ 12 m ˙ 21 .
The VOF method was applied to a single momentum equation via
ρ v t + · ρ v v = P + · μ v + v T + ρ g + F ,
where T is the transposition matrix, P and F represent the pressure and surface tension, respectively, and a continuum surface force was applied to the surface tension model. The density and viscosity of the mixture were calculated as volume averages according to
ρ = α 1 ρ 1 + α 2 ρ 2 ,
μ = α 1 μ 1 + α 2 μ 2 .
The standard k-ε turbulence model is a type of RANS model based on the transport equations for the turbulent kinetic energy k and the turbulent dissipation rate ε. The RNG k-ε model, which enhances the k-ε model, uses statistical methods from renormalization group theory. This model is suitable for rapidly strained flows and includes the effects of vortices on the turbulence, thereby improving the accuracy of the vortex flows. The transport equations for the RNG k-ε model are similar to those for the standard k-ε model, and the turbulent kinetic energy and dissipation rate are expressed as
t ρ k + x i ρ k u i = x j α k μ e f f k x j + G k + G b ρ ε Y M ,
t ρ ε + x i ρ ε u i = x j α ε μ e f f ε x j + C 1 ε ε k G k + C 3 ε G b C 2 ε ρ ε 2 k R ε ,
where Gk is the production term of the turbulent kinetic energy owing to the mean velocity gradients, Gb is the production term owing to buoyancy, YM represents the contribution of the compressibility to the overall dissipation rate from fluctuating dilatations in turbulent flows, and αk and αε are the inverse effective Prandtl numbers for k and ε, respectively.
The pressure-velocity coupling scheme determines how the pressure and velocity are computed interactively when using a pressure-based solver. The pressure implicit with split operator (PISO) algorithm applied in the analysis is a segregated method that calculates pressure and velocity sequentially, utilizing neighbor and skewness corrections to enhance the stability and convergence in transient-state simulations. The pressure staggering option (PRESTO!) was used for pressure discretization, and second-order upwind schemes were applied for the momentum.

2.3. Simulation Conditions and Mesh Setup

The injector was designed for a one-ton class methane engine thrust chamber using LOx/GCH4 propellants, with a chamber pressure of 35 bar and an oxidizer-to-fuel mixture ratio of 3.0. In the atmospheric-pressure cold-flow tests, filtered water and dry air were used as simulants for the liquid oxidizer and gaseous fuel, respectively [30]. The nominal flow conditions were determined based on the actual propellant flow velocities in the injector during the design-point hot-firing test. Table 2 summarizes the numerical conditions specified in the analysis. Under nominal flow conditions, the gas and liquid mass flow rates were set to m ˙ g d = 2.083 g/s and m ˙ l d = 105.17 g/s, respectively. Here, m ˙ g and m ˙ l denote the generic gas and liquid mass flow rates used in this study, while m ˙ g d and m ˙ l d specifically indicate the nominal design-point values. While maintaining a constant gas flow rate, the gas-to-liquid mass ratio was varied by adjusting the liquid flow rate from 30% to 120% of the nominal value.
For the boundary conditions, the gas and liquid inlets were defined as mass flow inlets, whereas the sides of the cylindrical spray domain, excluding the top surface, were defined as pressure outlets. All the remaining surfaces, aside from the inlets and outlets, were treated as walls, accounting for wall adhesion and the contact angle between the gas and liquid. To extract data during the analysis, a total of 18 probe points were evenly distributed throughout the internal region of the injector. The probe locations and mesh cross sections are presented in Table 3 and Figure 3. The probe locations were categorized into four regions for the analysis: recess, gas line, tangential hole, and gas core.
The mesh was generated using a multizone method that combines tetrahedral and hexahedral mapping types. Tetrahedral meshes, which are efficient for modeling geometrically complex flow regions, were used for the 3D modeling of the injector’s internal flow, whereas hexahedral meshes were applied to generate high-quality meshes in the cylindrical spray region. To prevent mesh collisions at the interface between the injector outlet and the cylindrical spray region, the central portion connected to the injector outlet was meshed with tetrahedrons, and different mesh types were applied around it using the multizone method. The total mesh count was 1,786,392 second-order elements, resulting in 3,437,234 nodes.

2.4. Mesh Independence Test

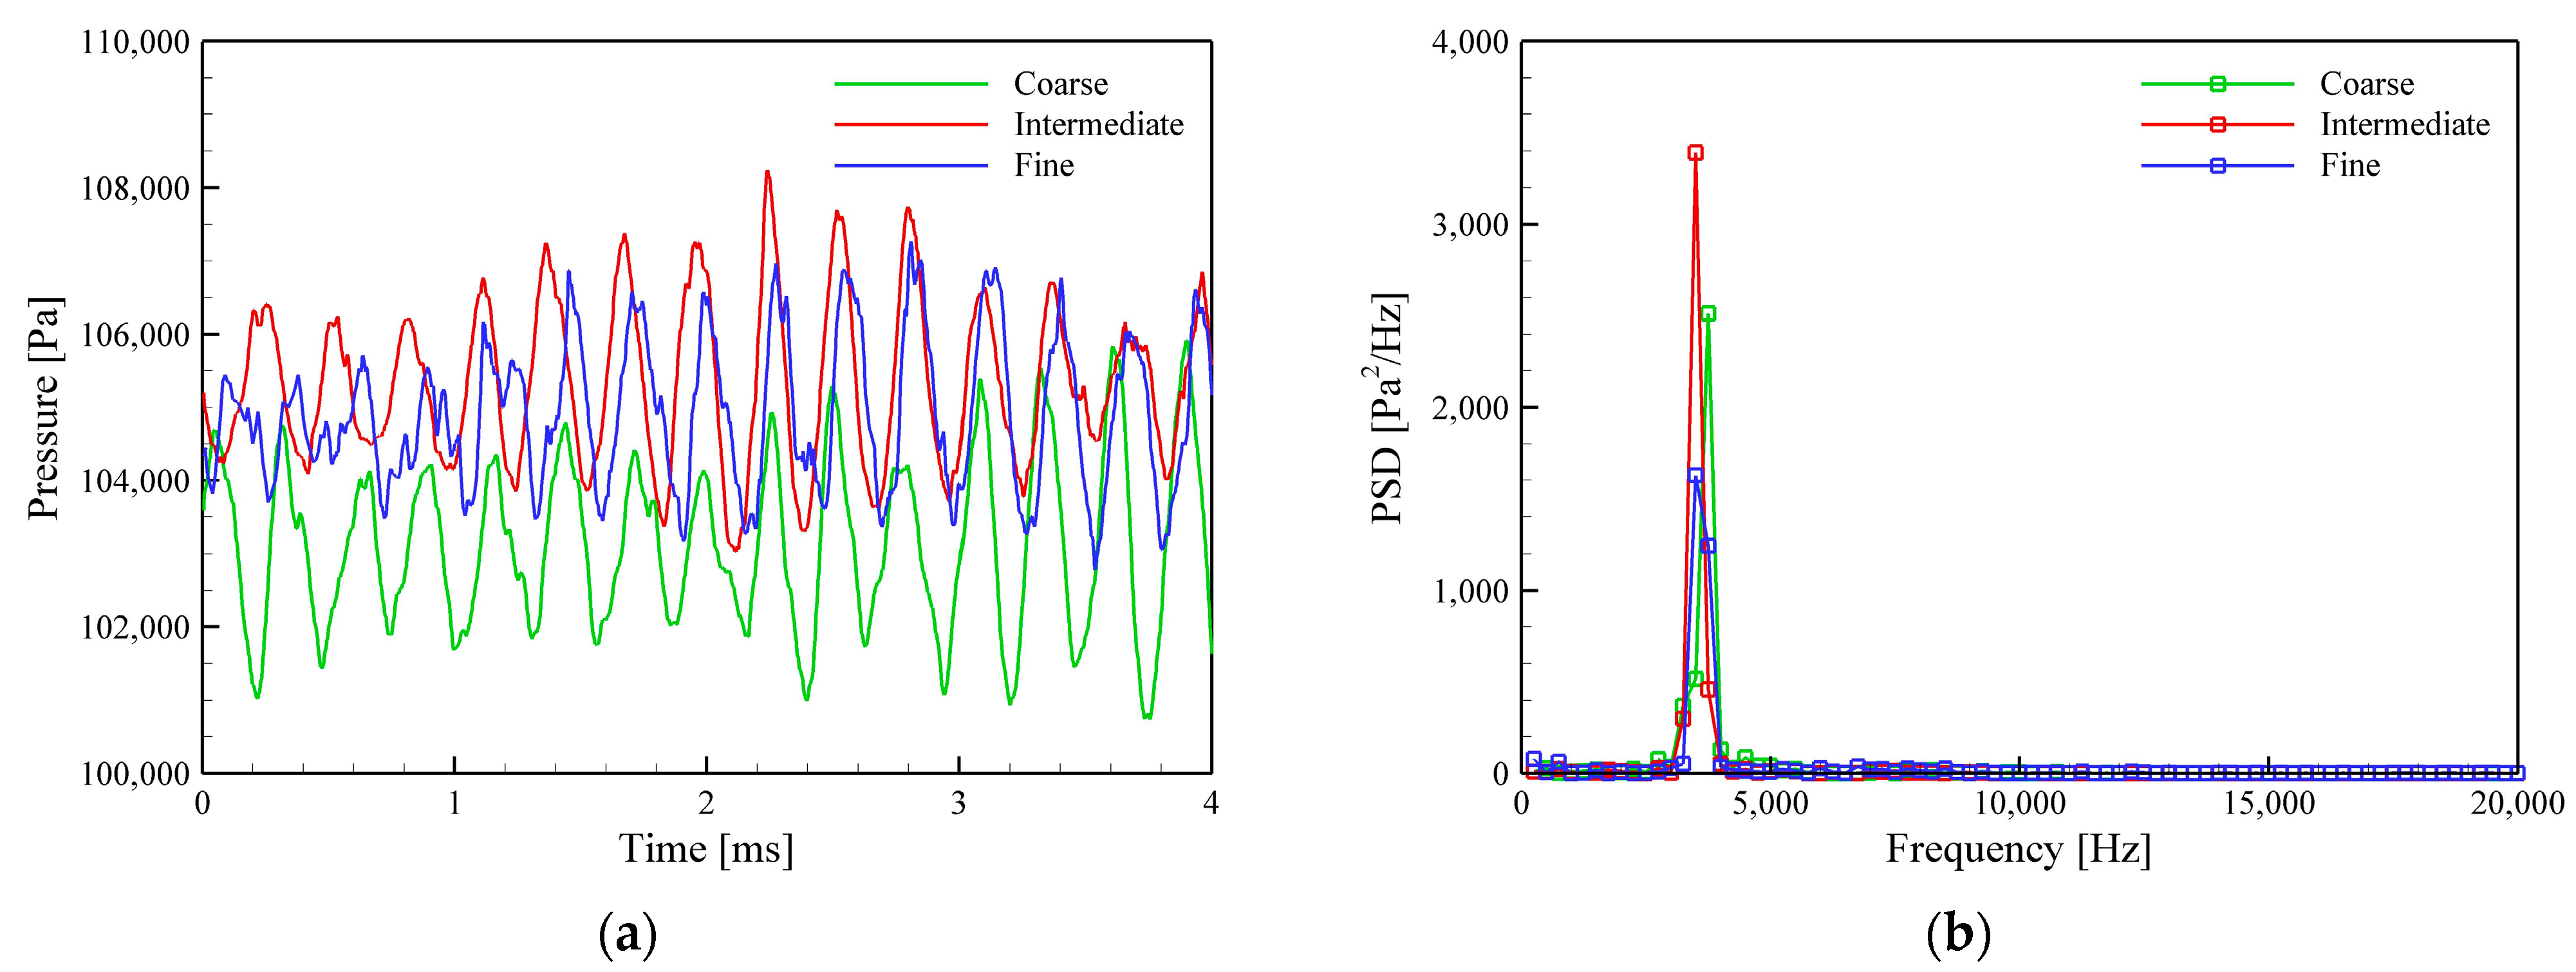
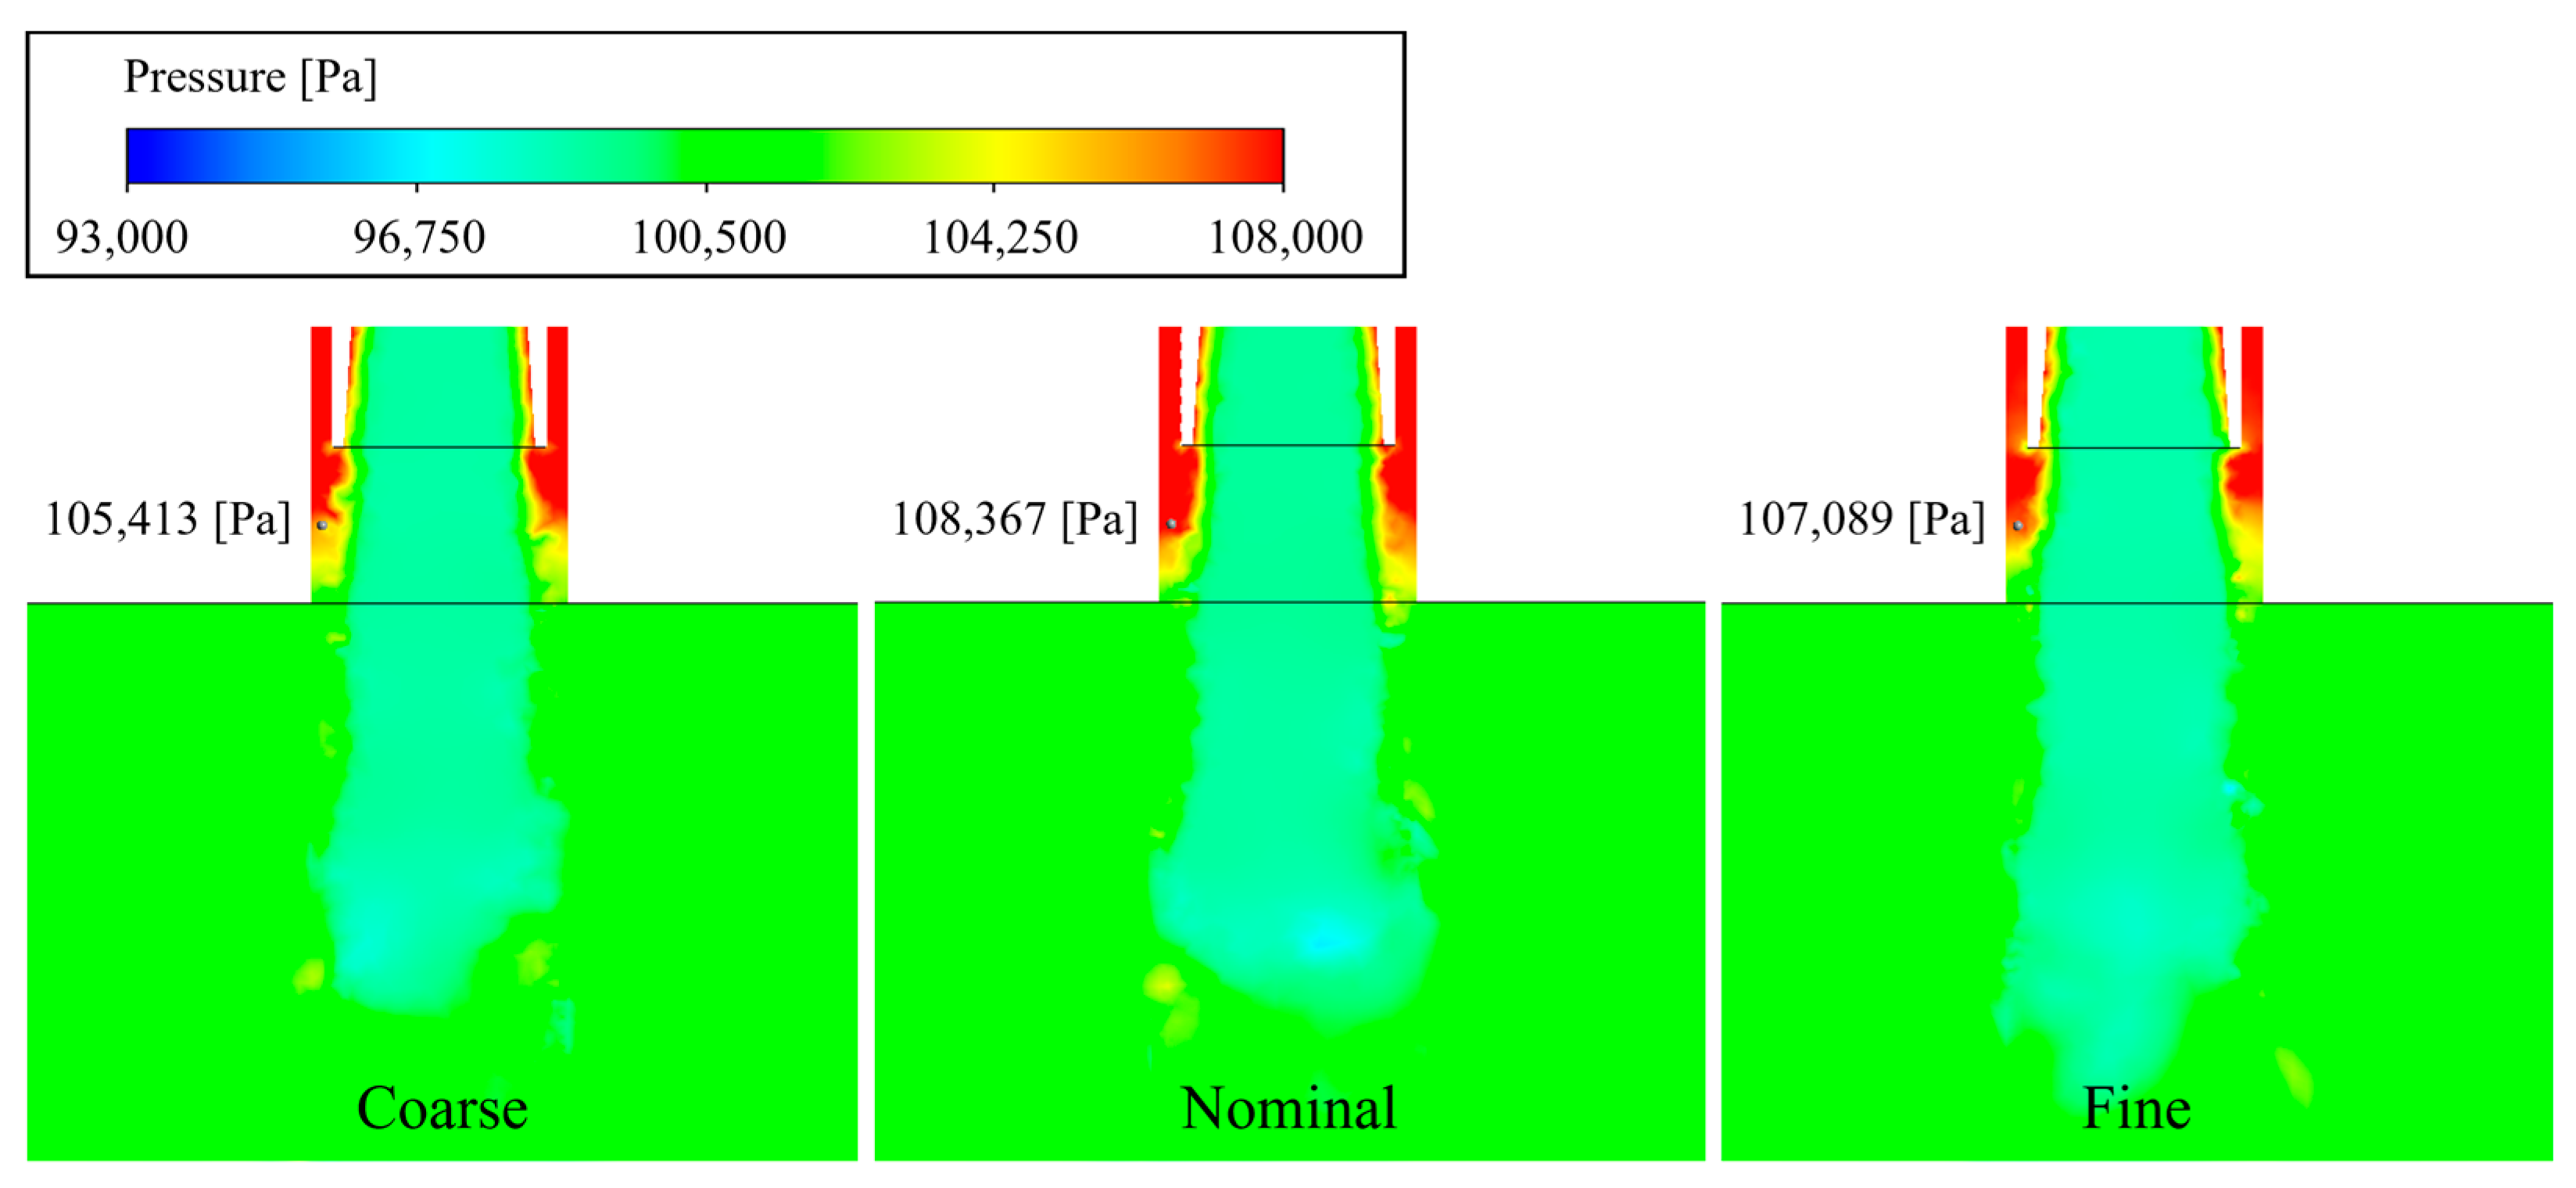
To enhance the reliability of the simulation results, a mesh independence test was conducted at m ˙ l / m ˙ l d = 100% for the model used in this study. In addition to the nominal mesh, a finer mesh with 2,063,360 cells (15.5% more) and a coarser mesh with 1,250,223 cells (30% fewer) were generated. Simulations under nominal flow conditions were performed for all three meshes, and the pressure oscillation data from probe 3, located at the midpoint of the recess region, were compared and analyzed over a 10-ms period. The pressure variations across all three meshes were similar, with steady pressure oscillations emerging after 6 ms. Figure 4 presents the pressure oscillations over a 4-ms interval, along with the results of a fast Fourier transform (FFT) analysis. The dominant frequency of the coarser mesh deviated from that of the nominal mesh by approximately 7.143%, whereas the nominal and finer meshes exhibited nearly identical results, differing by only 0.013%. Figure 5 displays the internal pressure distribution when the highest pressure was observed during one pressure oscillation cycle at probe 3. The wall pressure distribution influenced by the liquid film was similar for all three meshes, confirming that self-pulsation occurred. Therefore, the nominal mesh was deemed to be mesh-independent and suitable for use in the simulations.

3. Results and Discussion

3.1. Spray Pattern

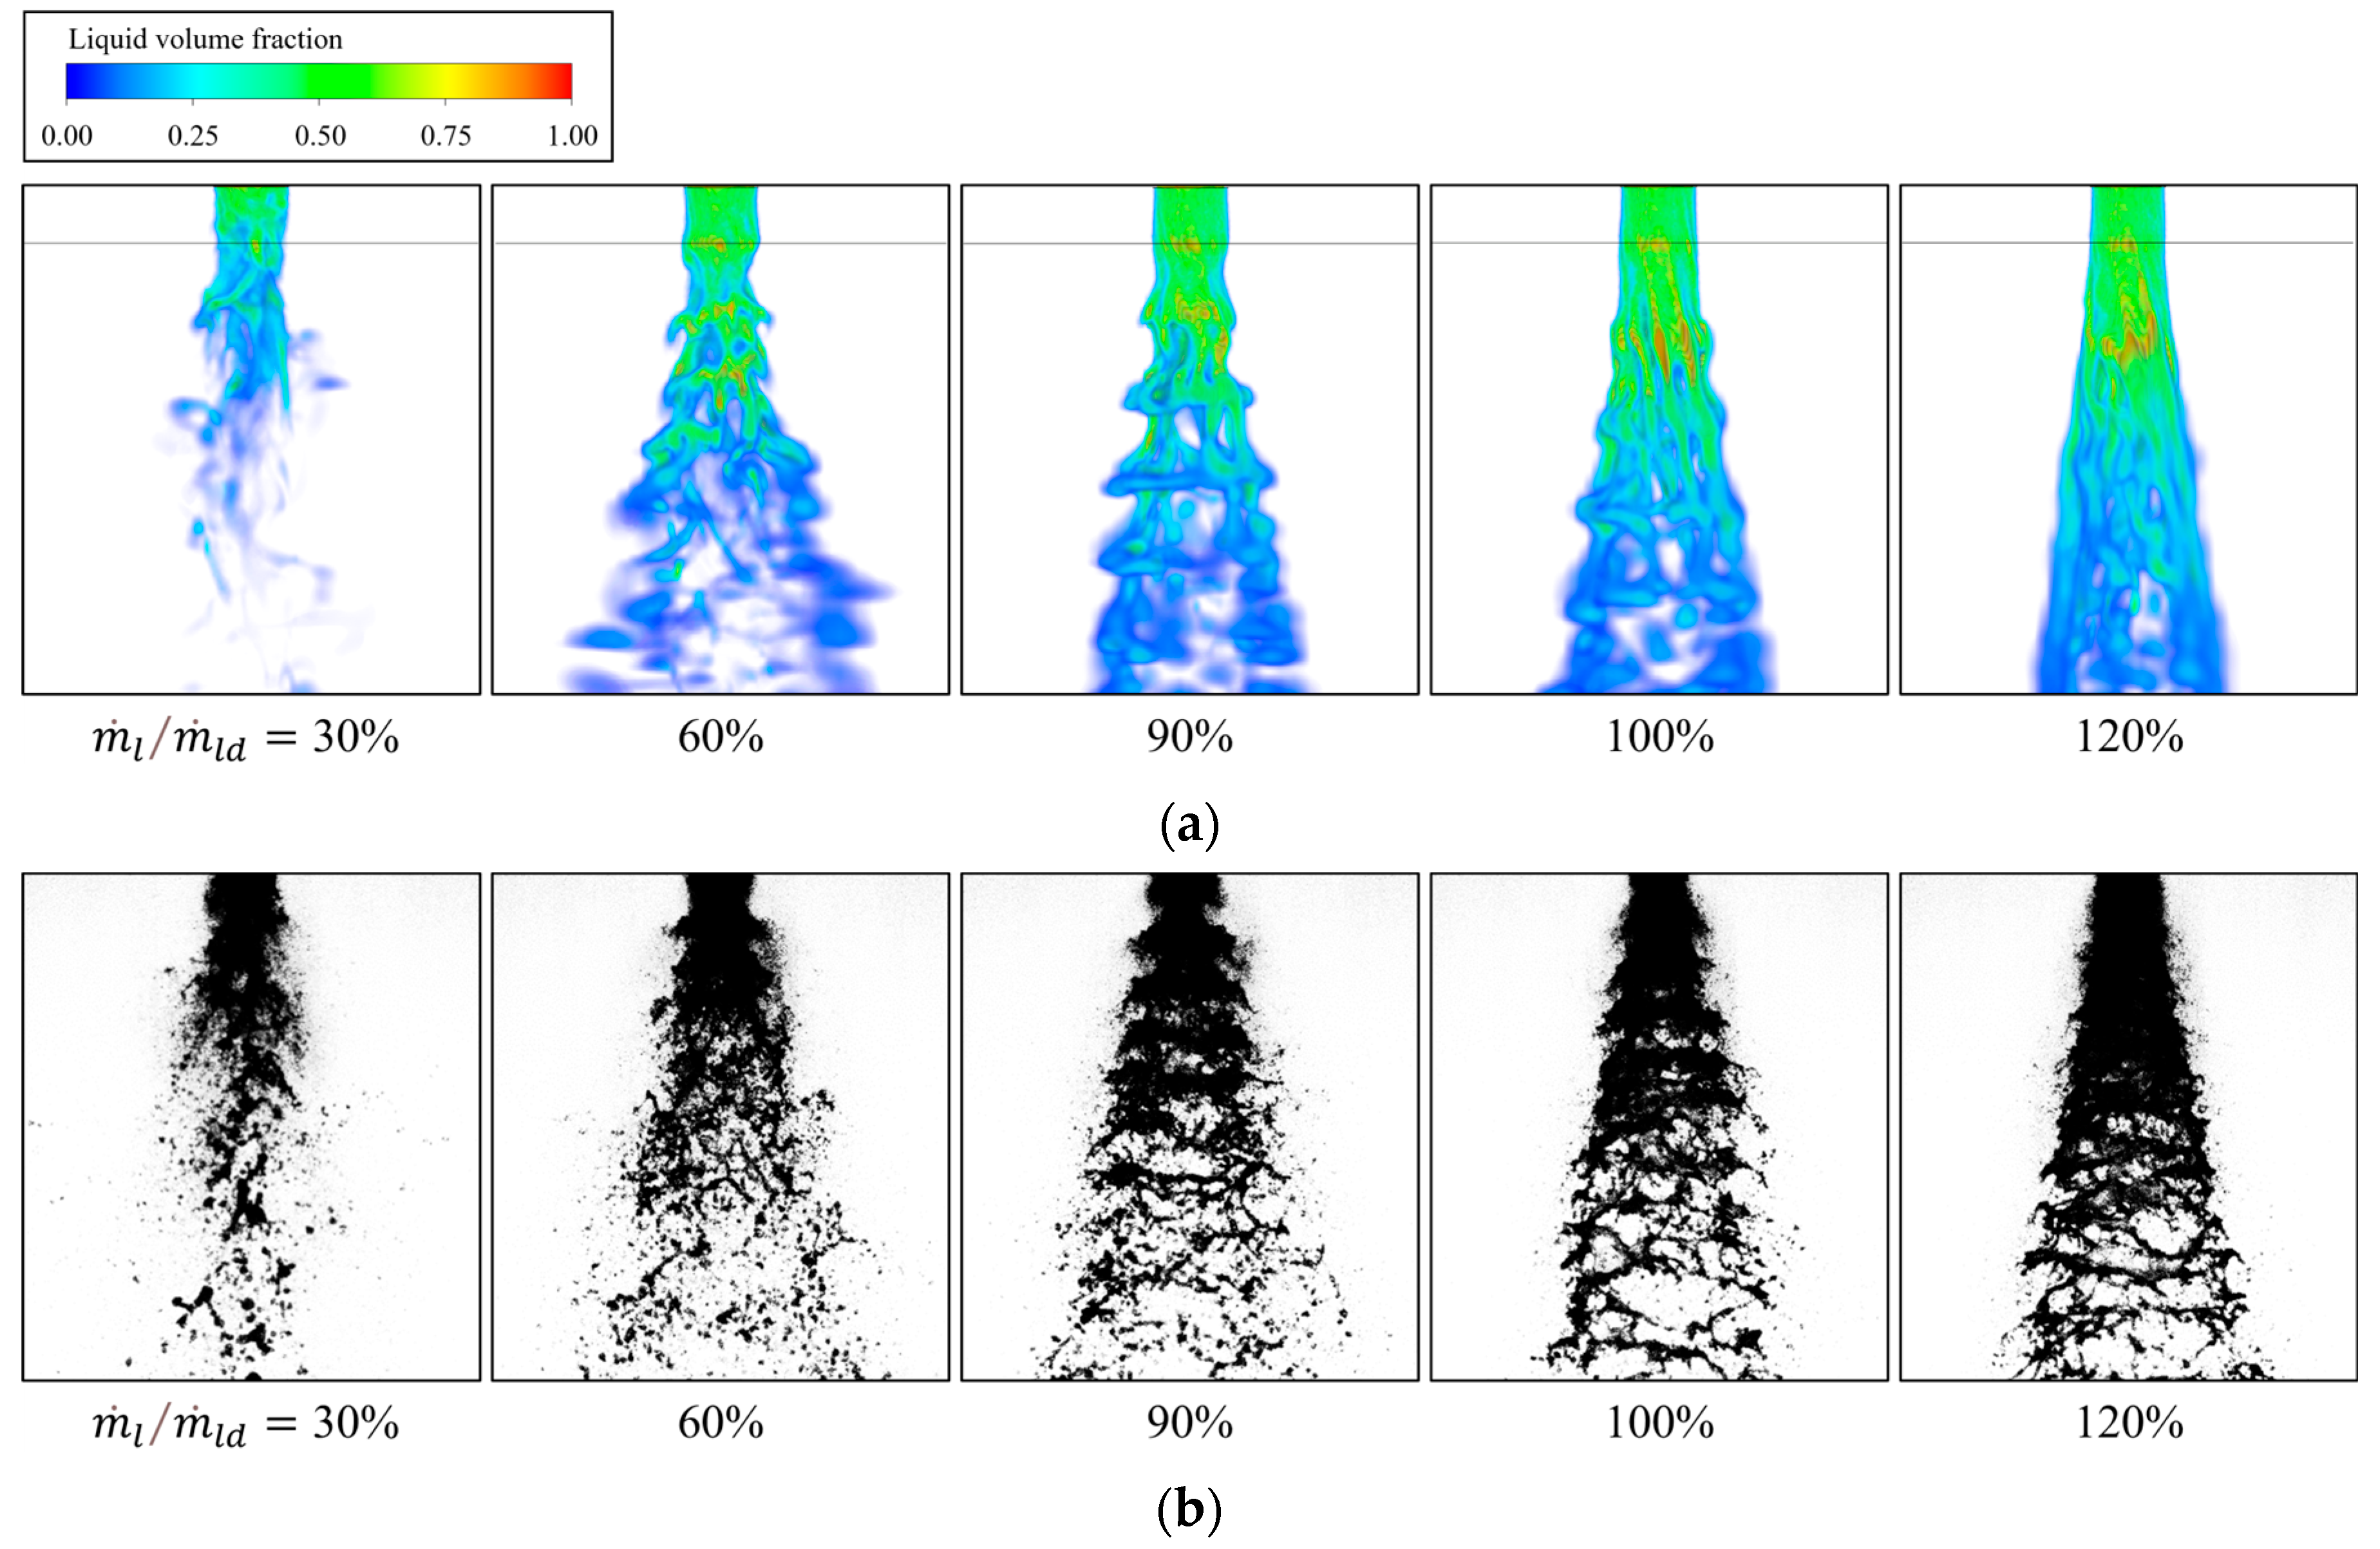
Figure 6a illustrates the three-dimensional spray patterns of the liquid-centered swirl coaxial injector with a recess length of 4 mm, which was obtained using numerical simulations executed with various liquid mass flow rates. In general, a decrease in the liquid flow rate under fixed gas flow conditions resulted in a more unstable spray. The spray pattern for m ˙ l / m ˙ l d = 120% appeared more stable than that for m ˙ l / m ˙ l d = 30%. In addition, the self-pulsation significantly affected the spray pattern. A stable spray formed a solid cone shape, whereas self-pulsation produced a spray pattern that resembled a Christmas tree. Self-pulsation periodically generated droplet clusters, causing periodic oscillations in the horizontal spray width and forming “neck” and “shoulder” structures [33]. For m ˙ l / m ˙ l d = 60%, 90%, and 100%, a spray pattern resembling a Christmas tree and featuring periodic “neck” and “shoulder” breakup structures was observed. Figure 6b illustrates spray images from the cold-flow experiment conducted in the reference study [30]; these images are consistent with the spray patterns predicted by the numerical analysis carried out in this study.
When the liquid-phase volume fraction reached 0.25, the gas-liquid interface was considered, and the isosurface at this point assisted in visualizing the surface waves resulting from the interaction between the gas and liquid [23,34]. Figure 7 illustrates the gas-liquid interface as a function of the gas-to-liquid mass ratio. The breakup length of the spray depended on the gas-to-liquid mass ratio and the occurrence of self-pulsation. As the gas flow rate ratio increased, the interaction between the gas and the liquid film intensified, resulting in stronger surface waves on the spray surface. These waves were attributed to the Kelvin-Helmholtz and Rayleigh-Taylor instabilities. Instability-induced surface waves decreased the breakup length and enhanced the spray atomization, whereas the high relative velocity of the gas narrowed the spray angle. The effects of self-pulsation were observed at m ˙ l / m ˙ l d   = 60%, 90%, and 100%. In regions where self-pulsation occurred, characteristic “neck” and “shoulder” breakup structures were observed; the liquid film broke at the “neck” and fragmented into spray jets at the “shoulder,” forming smaller droplets.

3.2. Analysis of Dominant Frequency in Self-Pulsation

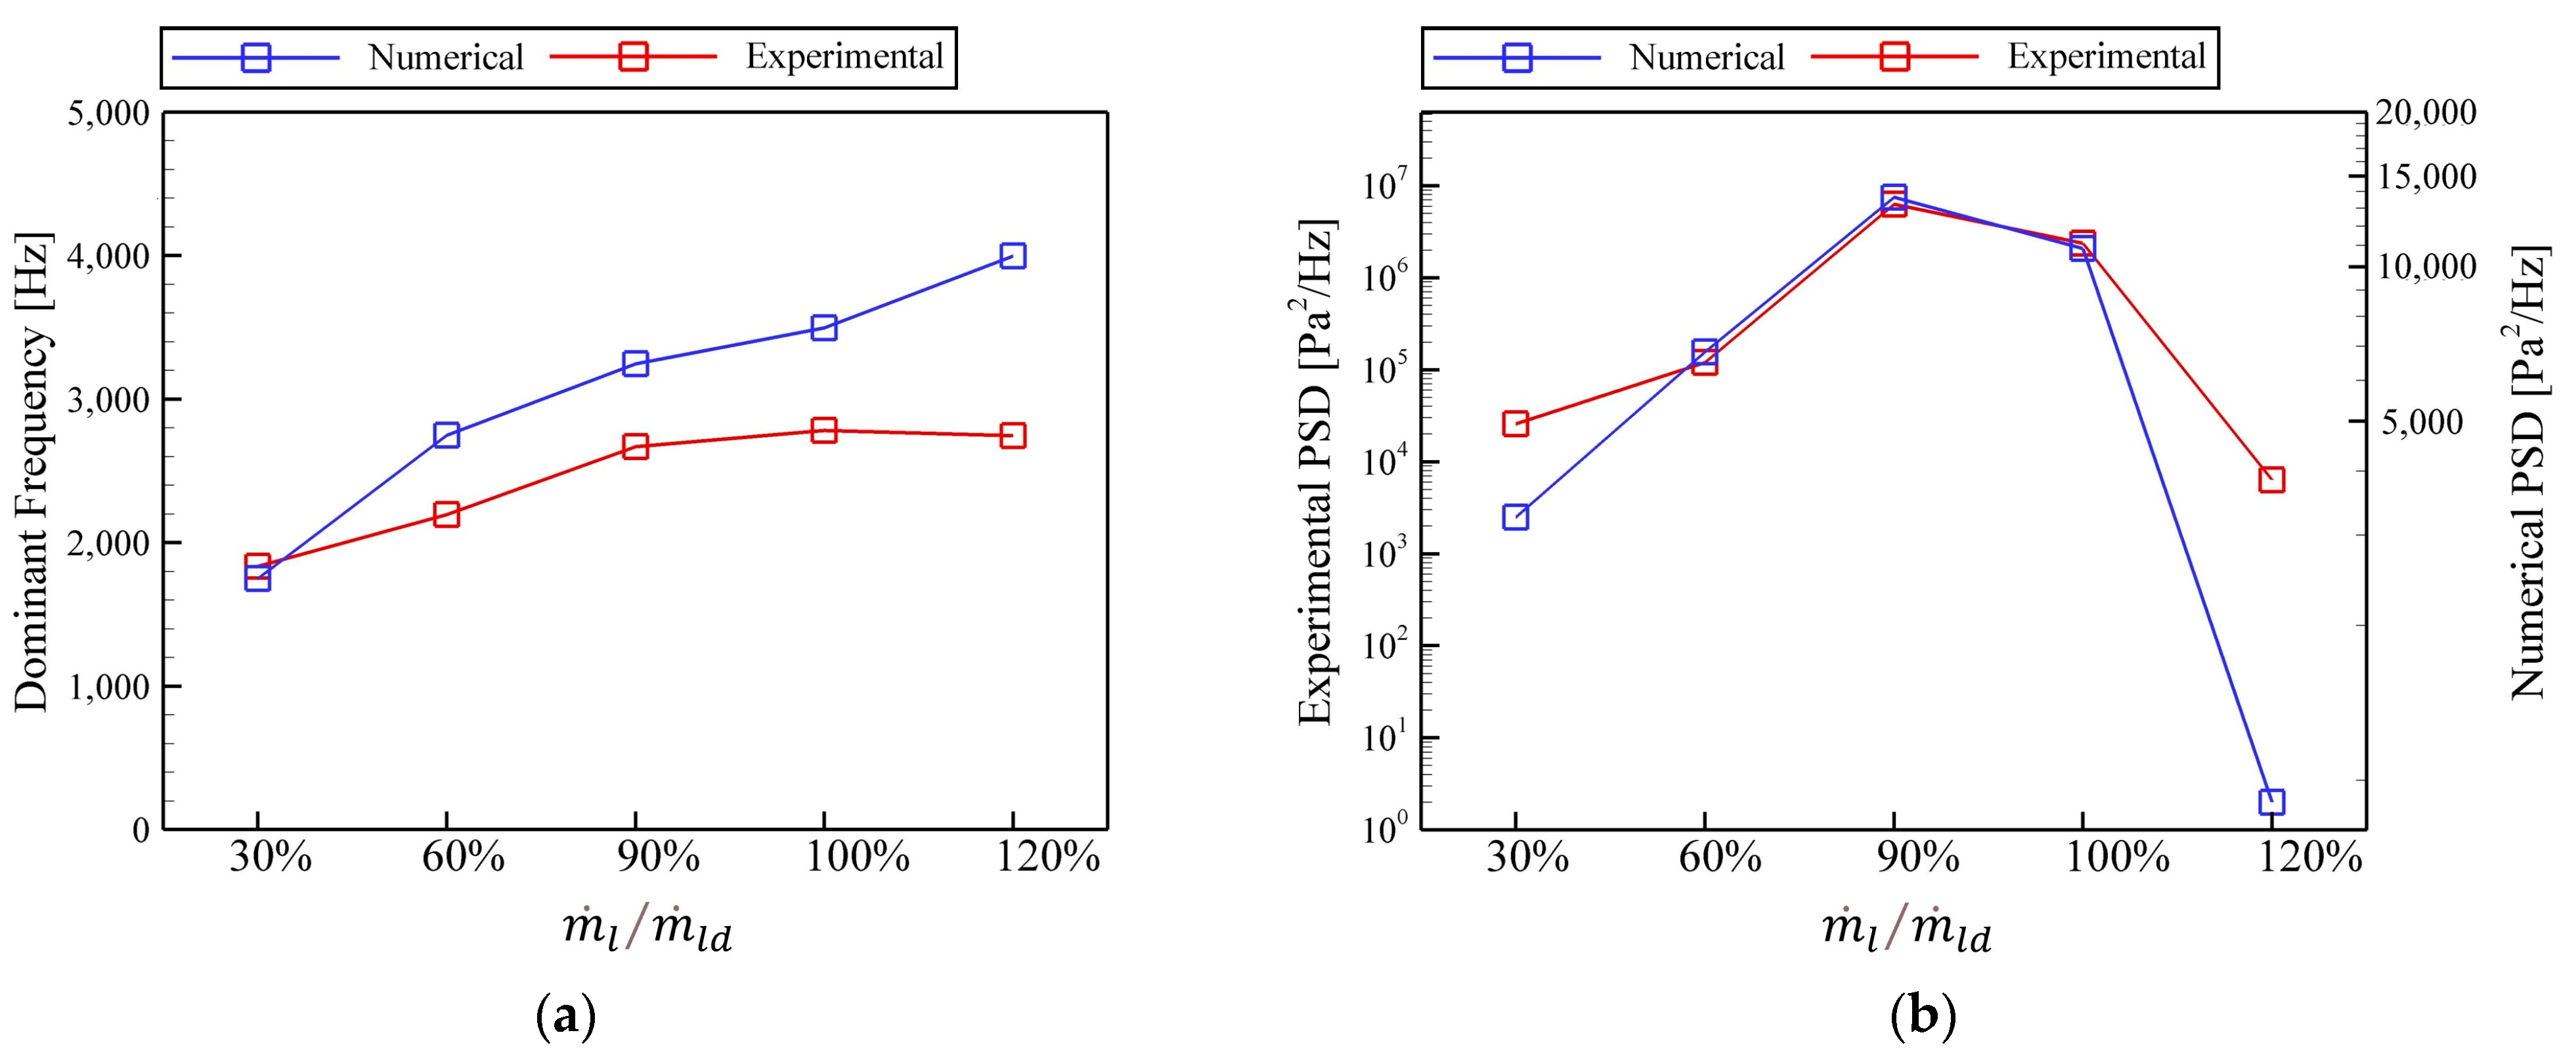
Pressure data over a 10-ms period were extracted from the probes illustrated in Figure 3, and an FFT analysis was conducted on the pressure oscillation data during the 4-ms period when self-pulsation occurred. Figure 8 compares the dominant frequency and power spectral density (PSD) values of the self-pulsation from both the numerical analysis and experimental results. Because the experimental dominant frequency was obtained from a dynamic pressure sensor installed in the gas manifold, the dominant frequency from the simulation was compared using data from probe a, which was located closest to the gas inlet. Although the magnitude of the dominant frequency was different for the simulation and experiment during the self-pulsation period, the trend in the frequency variation was consistent. Similarly, although the PSD value was different for the simulation and experiment, the overall trends remained comparable when plotted on a logarithmic scale.
The main cause of the difference in the magnitude of the dominant frequency was the absence of the manifold space for gas and liquid propellants in the simulation. In the experiment, pressure oscillations occurred throughout both the injector and manifold space. However, in the simulation, these oscillations were confined to the injector, resulting in a higher dominant frequency compared to that of the experimental data. During the FFT analysis, the sampling rate and total number of data points affected the frequency resolution and maximum frequency analysis range. A higher sampling rate allows higher-frequency components to be analyzed, and more data points improve the frequency resolution, enabling a more detailed analysis. In experiments, obtaining large amounts of data over extended periods is generally easier, as it allows for a better adjustment of the sampling rate and frequency resolution. However, in numerical simulations, obtaining long-duration data with small time step sizes is often inefficient and challenging in terms of computational time and data storage. Consequently, the sampling rate and data volume differed between the experiments and simulations, which contributed to slight differences in the dominant frequency and PSD values obtained from the FFT analysis.
For m ˙ l / m ˙ l d = 30% and 120%, where self-pulsation did not occur, small PSD values were observed. Conversely, for the three conditions in which self-pulsation occurred, the PSD values exceeded 6000 Pa2/Hz, with the highest PSD observed at m ˙ l / m ˙ l d = 90%. In experimental cold-flow tests on a swirl coaxial injector with a recess length of 4 mm, the strongest self-pulsation was also observed at m ˙ l / m ˙ l d = 90% [30]. In addition, the dominant frequency increased as the liquid flow rate increased in both the experiment and simulation. Under constant gas flow conditions, a higher liquid flow rate led to an increase in the relative velocity of the liquid, which shortened the cycle of internal pressure variations.

3.3. Self-Pulsation Analysis by Region

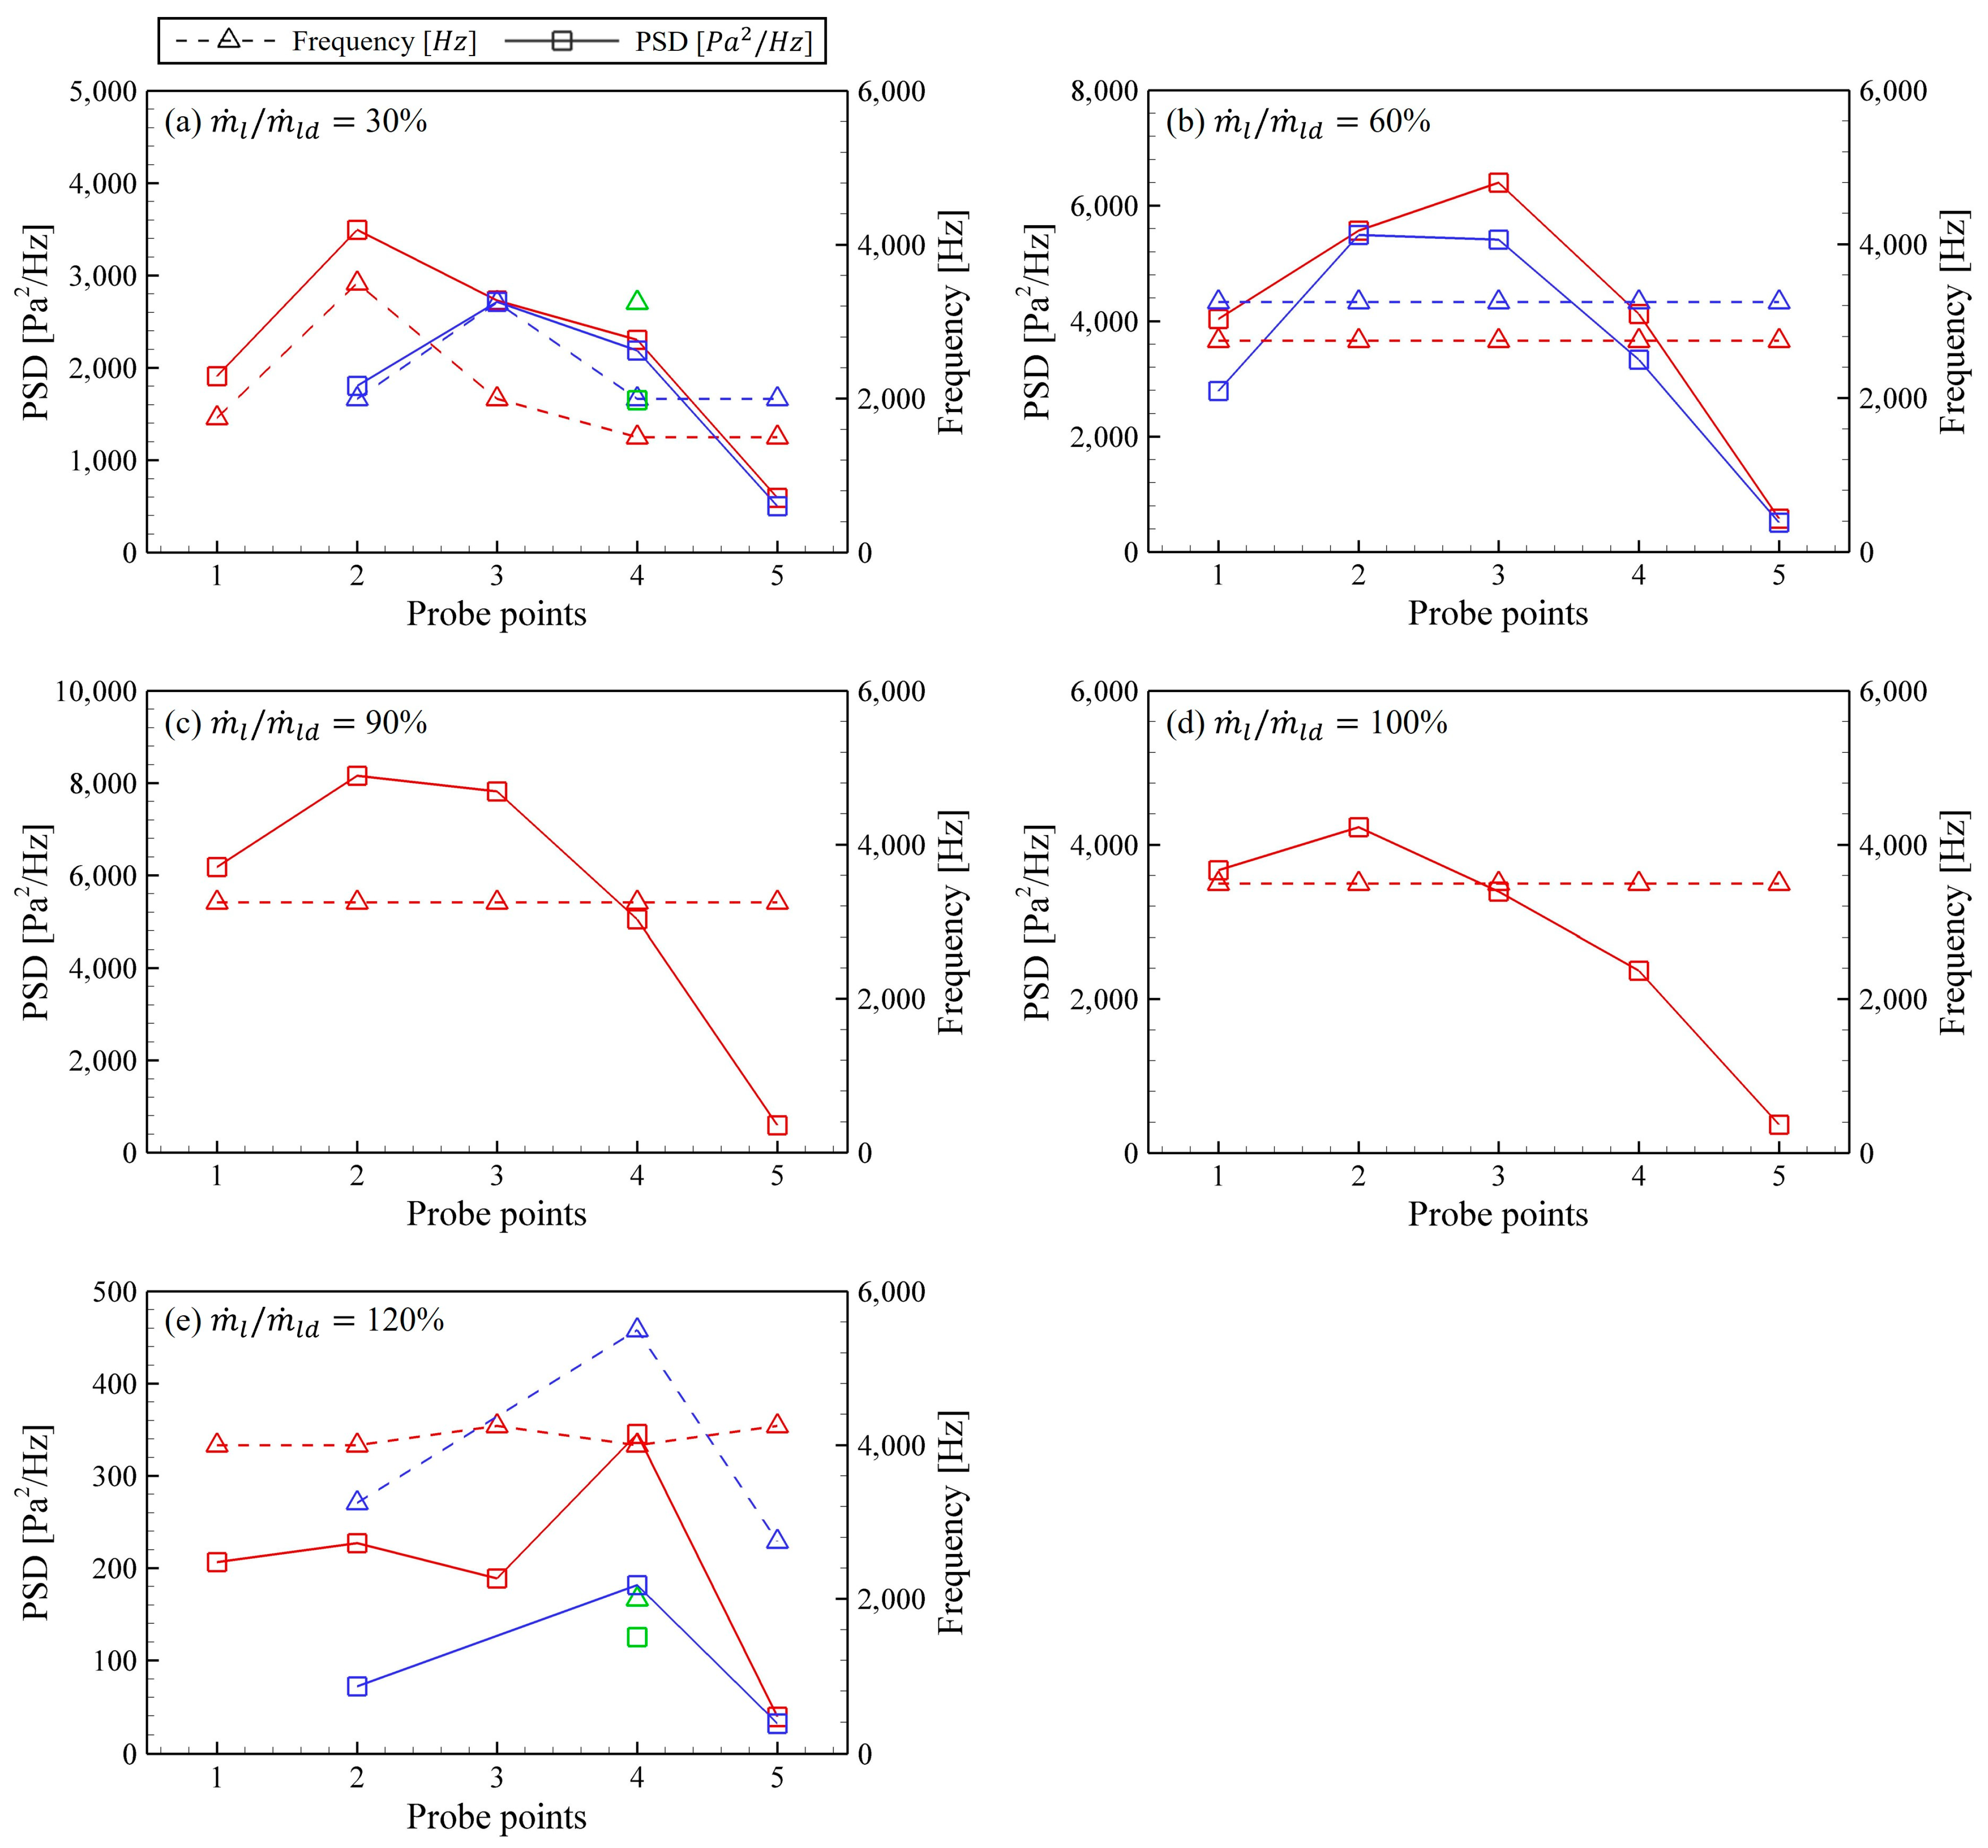
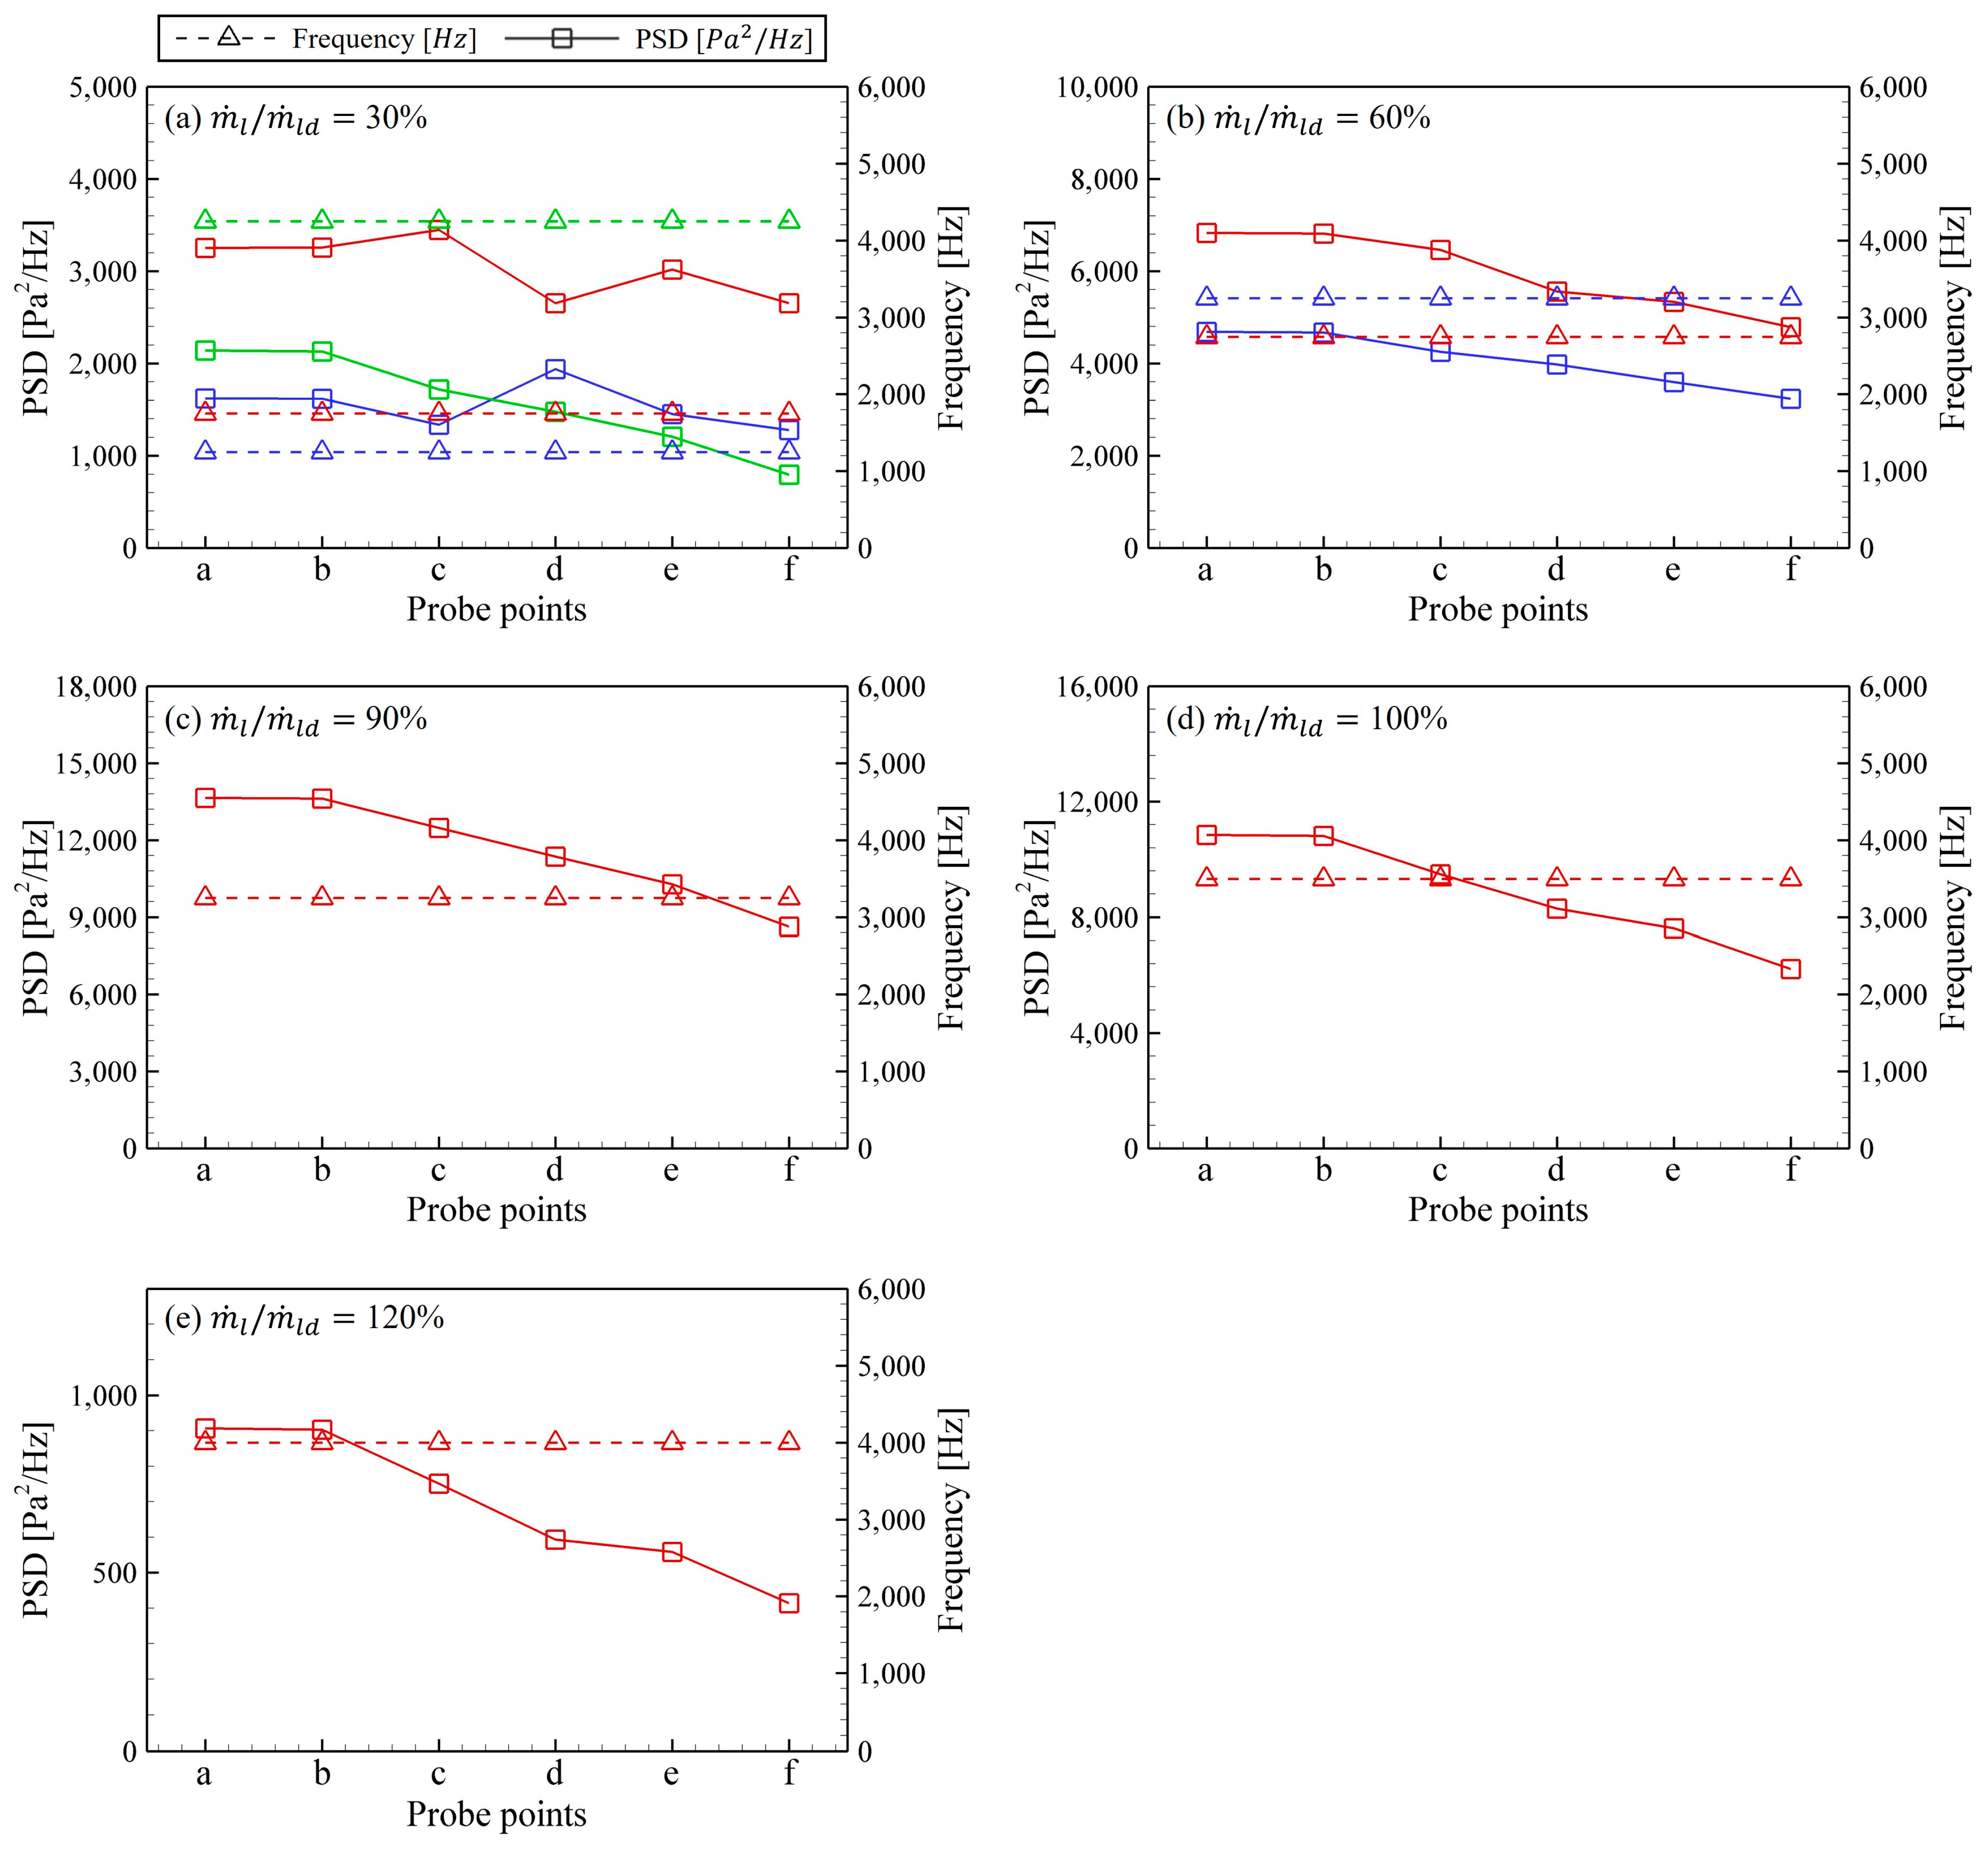
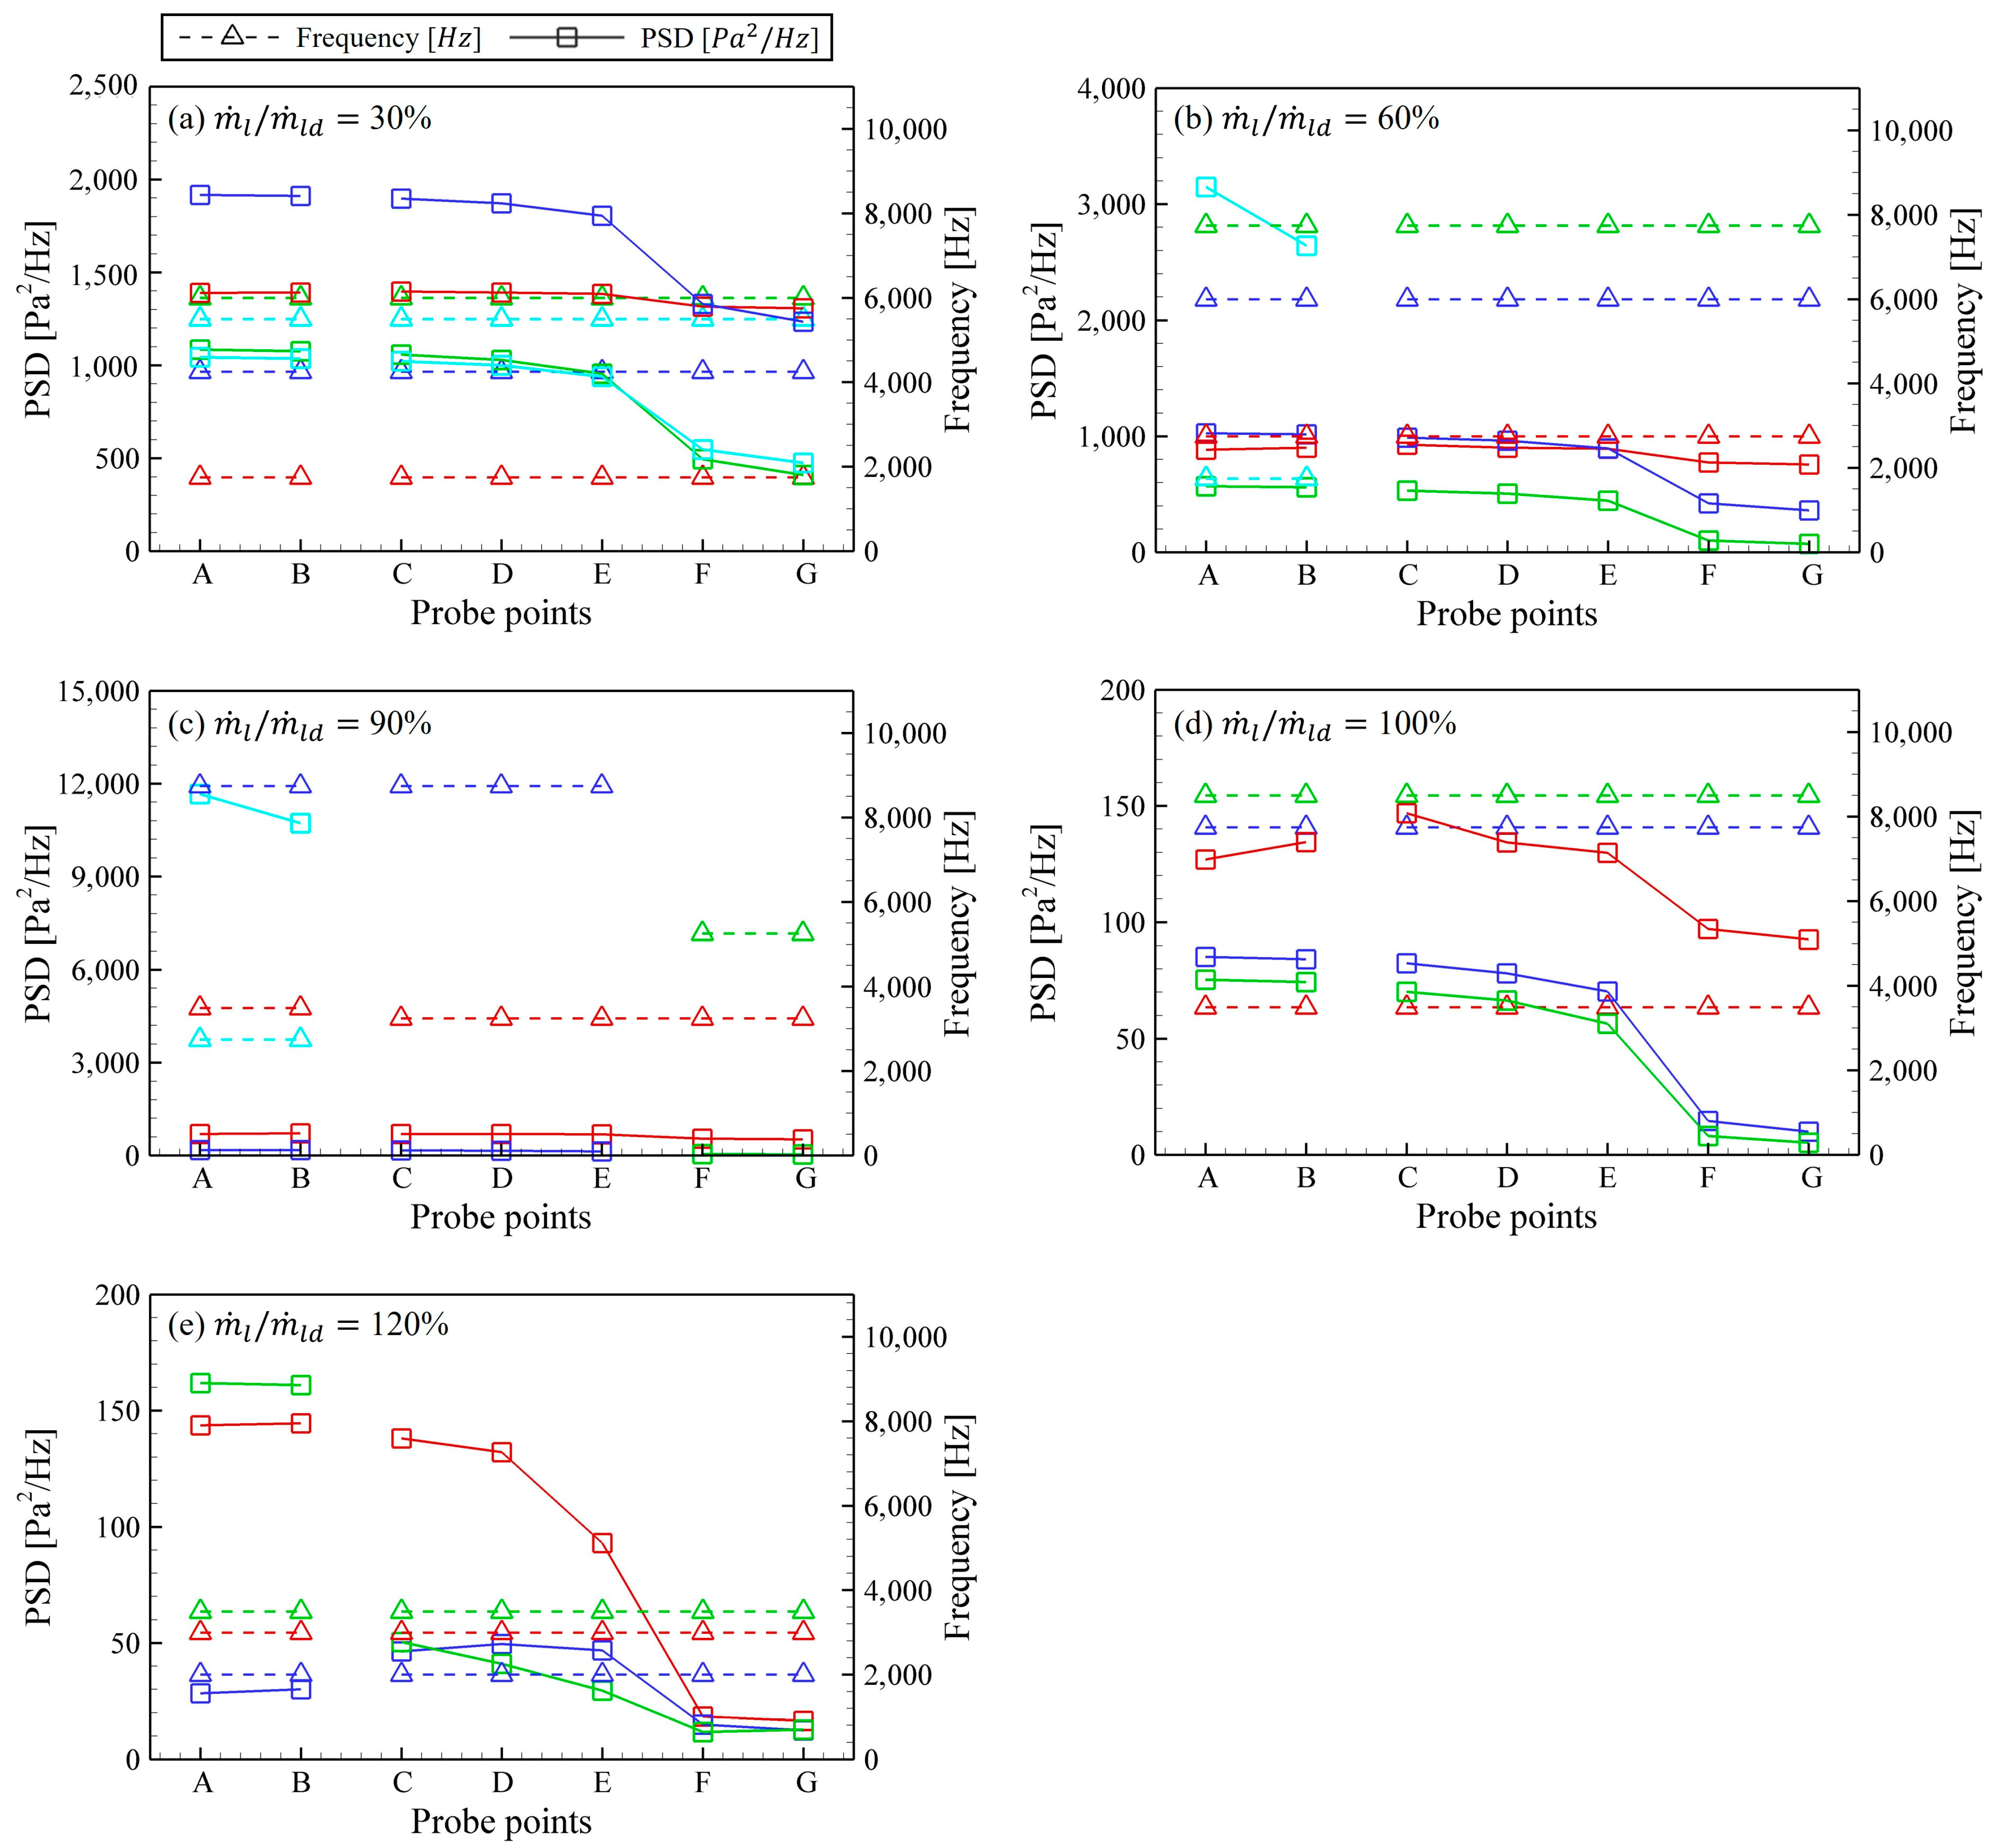
To understand the effect of self-pulsation based on the position inside the injector, FFT analysis was performed for each probe, and the results for each region were compared. Figure 9, Figure 10 and Figure 11 illustrate the FFT analysis results by region, displaying the dominant frequencies (f) and corresponding PSD values at the different probe locations. Red represents the dominant frequencies and PSD values from Figure 8, indicating the most influential values regardless of whether or not self-pulsation occurred. When other dominant frequencies appeared, blue, green, and cyan were used to indicate the second, third, and fourth most influential frequencies and their corresponding PSD values, respectively.
Figure 9 presents the results for the recess region under different liquid flow rate conditions. The recess region is directly influenced by the surface waves formed by the gas-liquid interactions and pressure oscillations in the liquid film. At m ˙ l / m ˙ l d = 30% and 120%, for which self-pulsation did not occur, various dominant frequencies appeared in different locations. At m ˙ l / m ˙ l d = 30%, the liquid film exhibited heightened instability at the interface due to the high relative velocity of the gas, resulting in strong surface waves. However, with a low liquid flow rate, spray development remained insufficient, and the spray contracted under the influence of the high-speed gas, suppressing the impact of surface waves. Consequently, the dominant frequency tended to decrease except at probe 2, where the interaction between the high-speed gas and the liquid film in the recess region was most active. Similarly, the limited influence of the liquid film motion weakened the overall pressure fluctuations, resulting in a lower dominant frequency compared to other flow conditions. At m ˙ l / m ˙ l d = 120%, the spray developed more stably, and surface waves with a low PSD value at the dominant frequency occurred. The largest dominant frequency was observed at probe 4, where there was significant interaction between the high-speed gas and the liquid film, while lower dominant frequencies were noted at other locations. Under the three conditions in which self-pulsation occurred, a clear dominant frequency caused by self-pulsation appeared, with no variations according to the location, and similar PSD trends were observed. At m ˙ l / m ˙ l d = 60%, two dominant frequencies were detected; however, the one originating from the self-pulsation had a greater impact at all probe locations. At m ˙ l / m ˙ l d = 90% and 100%, for which the self-pulsation was strong, only the dominant frequency from the self-pulsation was prominent. In other words, when self-pulsation did not occur, the dominant frequency from the surface waves varied by location. However, when self-pulsation occurred, the dominant frequency originating from the self-pulsation dominated the recess region. Additionally, when the gas-liquid interaction was strong, probes 2 and 3 exhibited high PSD values, indicating a significant pressure variation owing to the liquid film.
Figure 10 illustrates the results for the gas line under different liquid flow conditions. The gas line is a region where larger pressure oscillations occurred compared to the recess, with no frequency variation according to the location, and the dominant frequency with the highest PSD value was observed. The indirect effects of the gas-liquid interaction in the recess region were evident, and the dominant frequency originating from either the self-pulsation or surface waves appeared clearly under all flow conditions. Except at m ˙ l / m ˙ l d = 30%, where the low liquid flow rate prevented uniform spray development, the PSD value decreased downstream. This indicates that the gas inlet region experienced the most intense pressure oscillations, and the self-pulsation affected the entire gas annular flow passage.
Figure 11 illustrates the results for the tangential hole and gas core under different liquid flow conditions. Similarly, the internal injector at the center exhibited a decreasing trend in downstream PSD values. The tangential hole generally exhibited PSD values similar to those of the upstream gas core region. At m ˙ l / m ˙ l d = 60% and 90%, for which self-pulsation occurred, a dominant frequency with a high PSD value above 2500 Pa2/Hz was observed in the tangential hole. This frequency was lower than the dominant frequency originating from the self-pulsation in the recess region and gas line, as the tangential hole contained liquid, and some surface waves caused by the vibration of the liquid film were transmitted there. However, at m ˙ l / m ˙ l d = 120%, a slightly higher frequency of 3498 Hz was observed, unlike in the upstream gas core regions C, D, and E. This condition formed a relatively stable spray; therefore, the surface waves generated in the liquid film strongly influenced the tangential hole yet had a weaker effect on the gas core. Except for m ˙ l / m ˙ l d = 120%, which formed a stable spray, higher resonant dominant frequencies were accompanied by self-pulsation or surface waves upstream from the gas core. These resonant frequencies were caused by the conical gas core created by the liquid flow conditions and the geometric structure of the internal injector, which significantly weakened downstream. Under the three conditions in which self-pulsation occurred, the dominant frequency caused by self-pulsation was observed in both the tangential hole and gas core regions. At m ˙ l / m ˙ l d = 90% and 100%, for which self-pulsation was the strongest, the influence of self-pulsation was clearly observed throughout the entire gas core region.
The FFT analysis of the pressure oscillations in different regions revealed that the surface waves and pressure oscillations formed by the gas-liquid interaction in the recess region influenced the entire internal flow of the injector. Additionally, when self-pulsation occurred, the dominant frequency originating from the self-pulsation appeared consistently across all regions, with the gas region showing the highest PSD values. Therefore, in both simulations or experiments, it is advisable to define and compare the dominant frequency induced by self-pulsation through FFT analysis within the gas line and gas manifold regions.

3.4. Self-Pulsation Mechanism

The pressure distribution during one cycle (T) was analyzed for m ˙ l / m ˙ l d = 90%, for which self-pulsation was the strongest. Figure 12 illustrates the pressure distribution over one cycle for the three regions, excluding the tangential hole. The pressure oscillations in all three regions exhibited similar phases, in order of the recess, gas line, and gas core, with slight differences in timing. In other words, the starting and ending points of the pressure oscillation cycle varied slightly, depending on the region and probe location. Therefore, appropriate probes were selected for each region to analyze the oscillation cycle. For the recess and gas line regions, a cycle analysis was performed using the pressure data from probes 2 and a, where the pressure oscillations were the strongest. In contrast, for the gas core region, pressure oscillations caused by both self-pulsation and the gas core shape appeared upstream; therefore, the pressure data downstream at probe G was used for the cycle analysis. In the recess and gas line regions, the pressure increased from 1/4 T to 3/4 T, followed by a rapid decrease. The liquid film near the recess wall blocked and disrupted the flow between the recess wall and the gas line region, causing the pressure to increase until it reached a critical point. Once this critical pressure was reached, the high-speed gas rapidly displaced the liquid film, resulting in a sharp pressure drop.
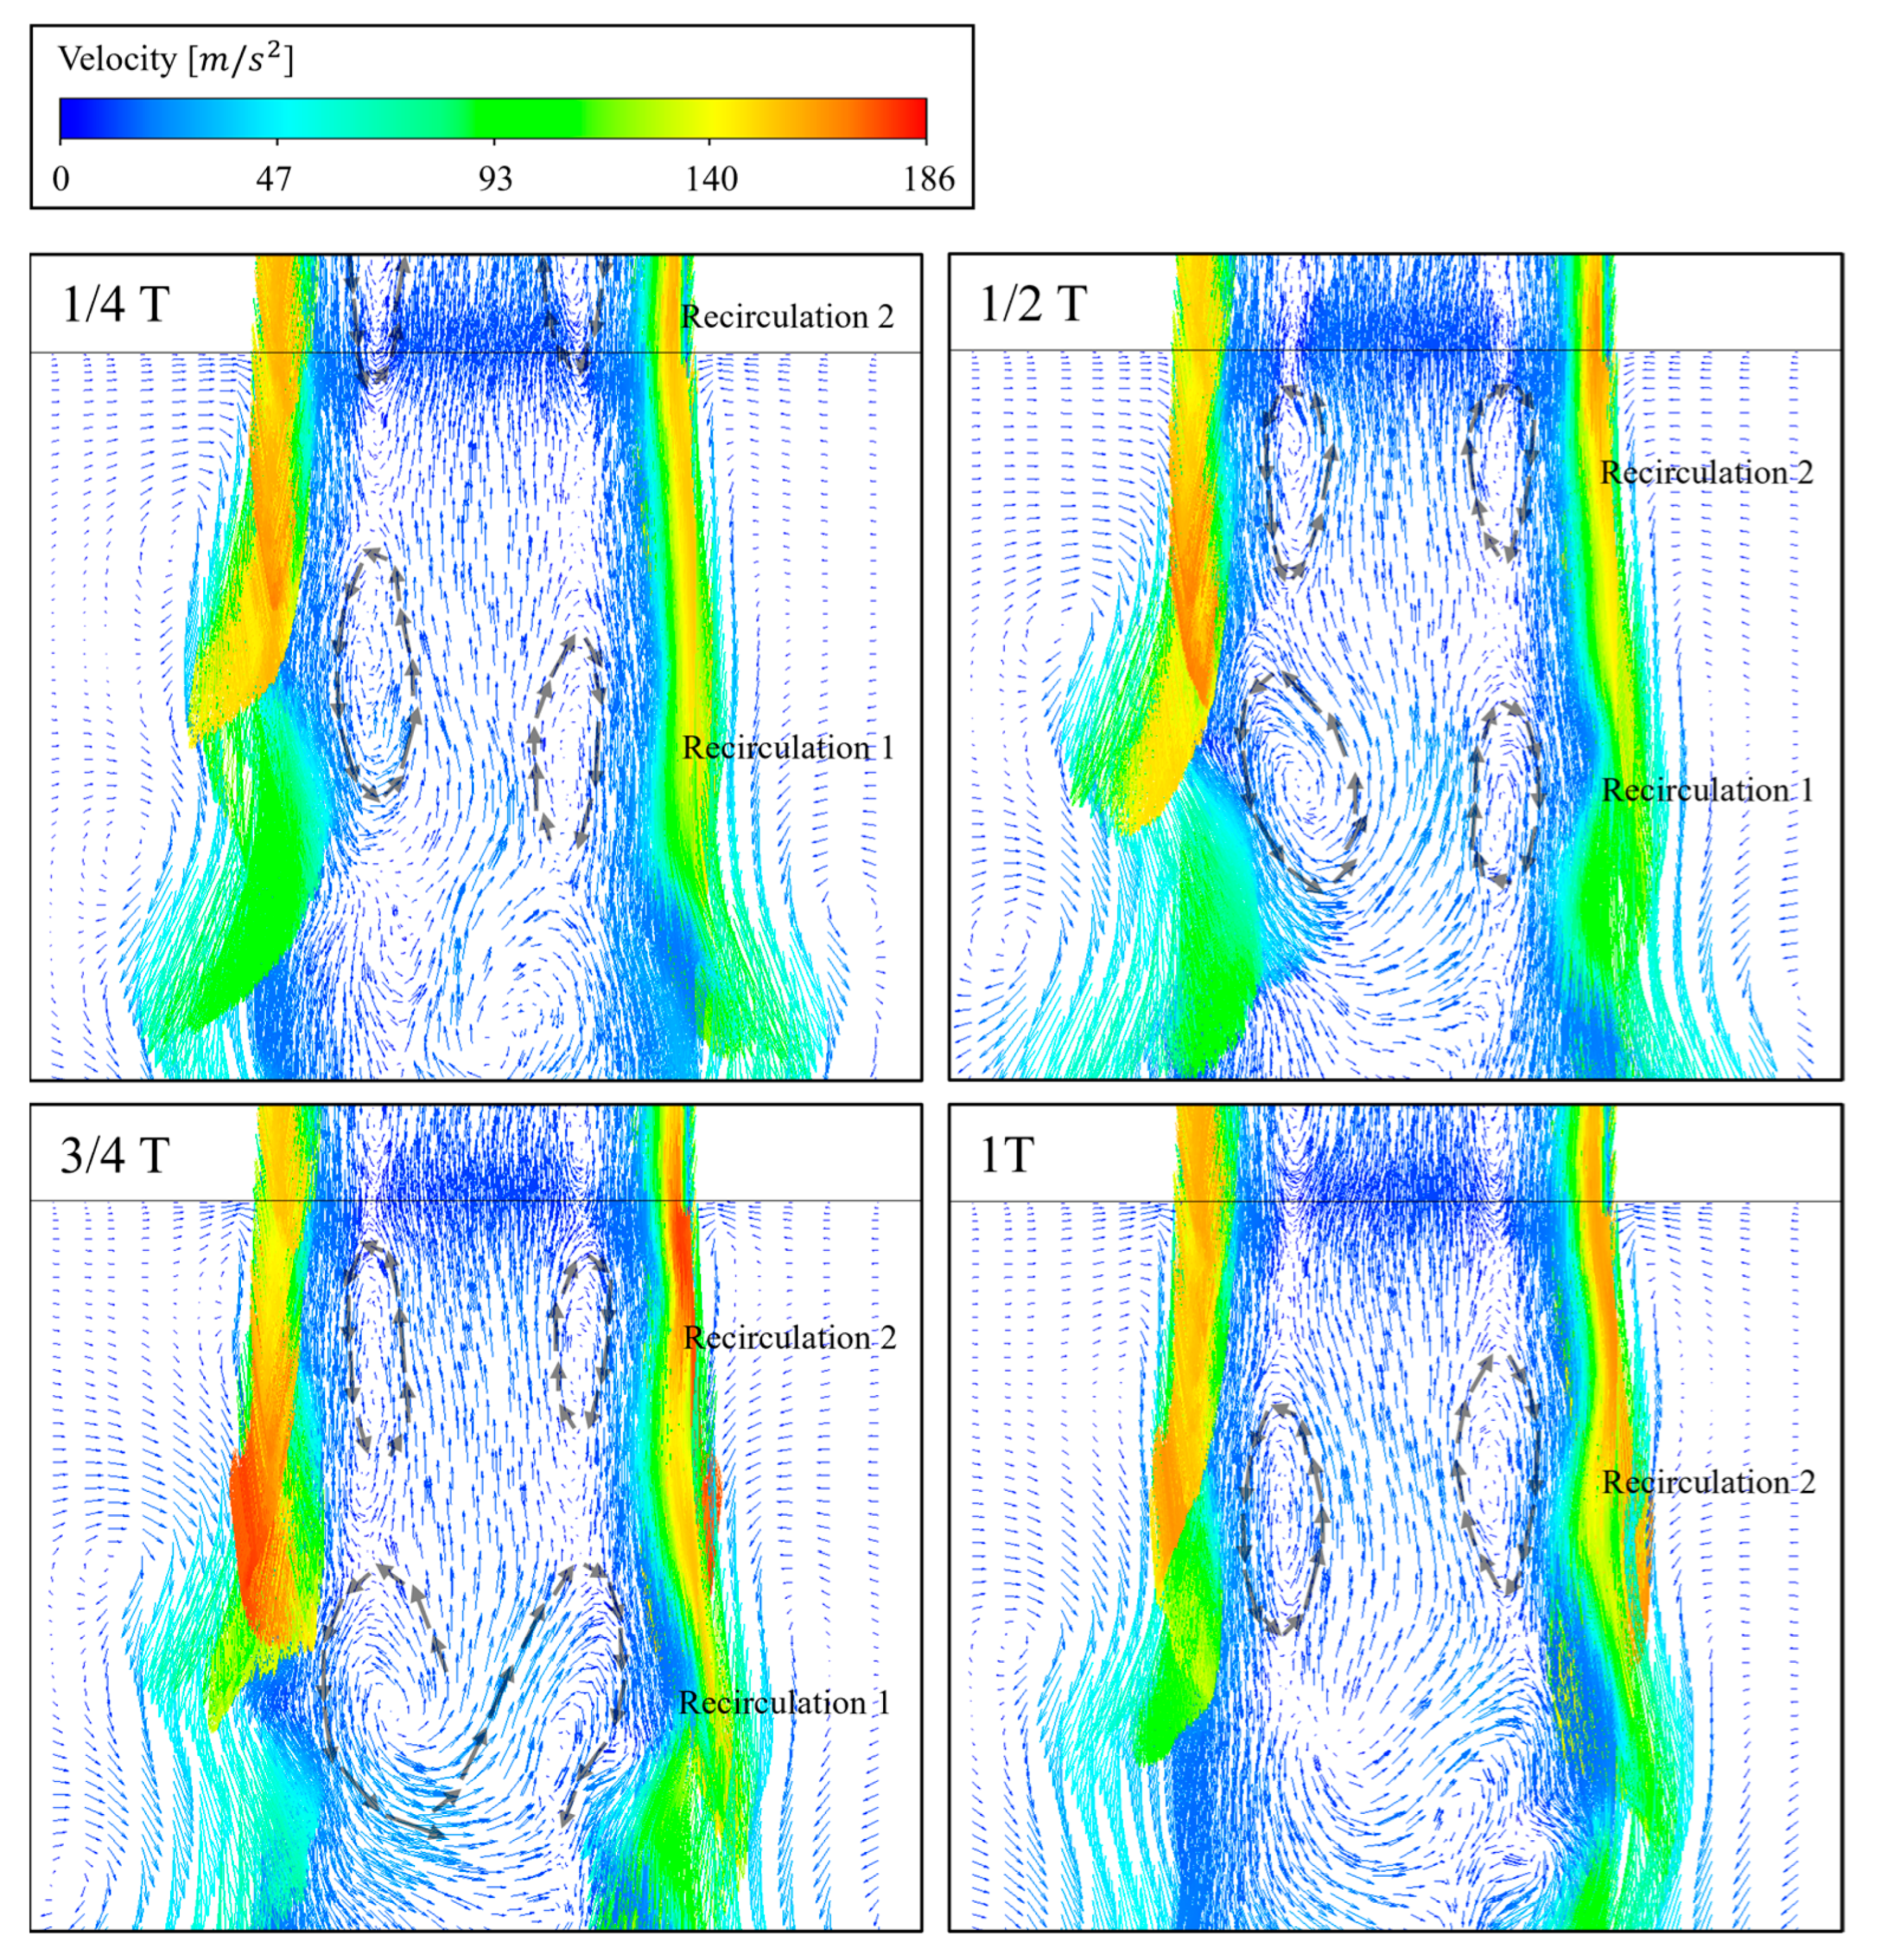
Figure 13 illustrates the recirculation of the turbulent zones formed by vortices within the gas core at the same times as those illustrated in Figure 12. At 1/4 T, recirculation zones occurred inside the recess region and within the sprayed liquid film. These recirculation zones moved downstream over time, growing and merging as the liquid film spread and blocked the recess wall. This led to an increase in the internal pressure from 1/4 to 3/4 T. After reaching the critical point, the high-speed gas displaced the liquid film, causing it to contract, and the downstream recirculation zones disappeared, leading to a sharp drop in the pressure within the gas core. In summary, when a liquid film blocked the recess wall and disrupted the flow of high-speed gas, the internal pressure in the recess and gas line regions increased, thereby triggering self-pulsation. During this process, the movement of the liquid film caused the formation and dissipation of recirculation zones within the gas core, leading to pressure fluctuations.

4. Conclusions

This study used numerical simulations to investigate the self-pulsation characteristics of a liquid-centered swirl coaxial injector with a recess length of 4 mm under various liquid flow conditions and compared the results with the experimental findings of Ahn et al. [30]. Flow analysis was performed to examine the spray pattern and pressure distribution, and FFT analysis was conducted to determine the occurrence of self-pulsation based on the liquid mass flow rate and to calculate the dominant frequency.
Self-pulsation was observed at m ˙ l / m ˙ l d = 60%, 90%, and 100%, whereas a stable spray was observed at 120%. When self-pulsation occurred, periodic pressure oscillations produced a spray pattern that resembled a Christmas tree, with regular “neck” and “shoulder” breakup structures; these results closely aligned with the experimental results of Ahn et al. [30]. The gas-liquid interface at a liquid-phase volume fraction of 0.25 revealed surface waves caused by Kelvin-Helmholtz and Rayleigh-Taylor instabilities, which intensified as the gas flow rate increased. These surface waves reduced the breakup length and accelerated atomization.
The FFT analysis demonstrated that the trends of the dominant frequencies and PSD values in the simulation closely matched those observed in the experiments, with dominant frequencies ranging from 2 to 4 kHz. However, differences in magnitude were exhibited. These were primarily caused by the absence of the manifold space in the simulation, confining pressure oscillations to a smaller volume and resulting in a higher dominant frequency compared to that of the experiment. Additionally, because very small time step sizes were used in the simulation, the collection of long-duration data was limited. This led to constraints on the total number of data points and the sampling rate, which slightly affected the dominant frequency and PSD values.
To further analyze the pressure oscillations caused by self-pulsation, FFT analysis was conducted by region. The recess region, which is directly influenced by the interaction between the liquid film and high-speed gas, exhibited various dominant frequencies. When self-pulsation occurred, a single dominant frequency became prominent because of resonance. In the gas line, the dominant frequency originating from the self-pulsation or surface waves was consistently observed under all flow conditions. The tangential hole, which generally displayed PSD values similar to those of the upstream gas core region, exhibited a lower dominant frequency owing to self-pulsation because it was measured in the liquid phase. Under the stable spray condition at m ˙ l / m ˙ l d = 120%, the surface waves formed in the liquid film had a stronger effect on the tangential hole yet a weaker influence inside the gas core. Except for m ˙ l / m ˙ l d = 120%, the gas core exhibited higher resonant frequencies upstream, which were caused by the conical gas core and geometric structure of the injector, but these influences diminished downstream.
In the recess region, instabilities resulting from the interaction between the liquid film and high-speed gas led to self-pulsation. The liquid film blocked the annular gas passage near the wall, causing the pressure in the recess and gas line regions to increase. Once the critical pressure was reached, the high-speed gas rapidly displaced the liquid film, causing a sharp pressure drop. This process was repeated owing to resonance, which led to self-pulsation. In the gas core, the pressure fluctuated and the spray broke up because of the creation and disappearance of recirculation zones formed by downstream vortices, which were driven by the interaction between the liquid film and gas.
This study confirmed that self-pulsation affects the entire internal injector and is driven by instabilities arising from the interaction between the liquid film and high-speed gas in the recess region. The unstable surface waves generated by this interaction led to pressure oscillations in the gas annular passage, tangential hole, and gas core. These oscillations caused periodic spray patterns and the breakup of the liquid film. The findings of this study offer valuable insights into the internal flow dynamics and impact of self-pulsation in liquid-centered swirl coaxial injectors.

Author Contributions

J.L.: conceptualization, methodology, software, investigation, writing—original draft, and visualization. H.J.: formal analysis, data curation. K.A.: validation, supervision, visualization, writing—review & editing, project administration, resources, and funding acquisition. All authors have read and agreed to the published version of the manuscript.

Funding

This work was supported by a Korea Research Institute for defense Technology planning and advancement (KRIT) grant funded by the Korean government (DAPA (Defense Acquisition Program Administration)) (No. KRIT-CT-22-030, Reusable Unmanned Space Vehicle Research Center, 2025). This work was also supported by the National Research Foundation (NRF; grant number 2021M1A3B9095872) funded by the Ministry of Science, ICT, and Future Planning (MSIP).

Data Availability Statement

The original contributions presented in the study are included in the article, further inquiries can be directed to the corresponding author.

Conflicts of Interest

The authors declare no conflicts of interest.

References

  1. Kang, Z.; Wang, Z.; Li, Q.; Cheng, P. Review on pressure swirl injector in liquid rocket engine. Acta Astronaut. 2018, 145, 174–198. [Google Scholar] [CrossRef]
  2. Kim, S.; Yoon, J.; Yoon, Y. Internal flow characteristics of liquid–liquid swirl coaxial injectors with different recess lengths and oxidizer–fuel ratios. At. Sprays 2011, 21, 971–987. [Google Scholar] [CrossRef]
  3. Kim, D.; Jeong, W.; Im, J.; Yoon, Y. The characteristics of swirl coaxial injector under varying geometric and environmental conditions. In Proceedings of the 40th AIAA/ASME/SAE/ASEE Joint Propulsion Conference and Exhibit, Fort Lauderdale, FL, USA, 11–14 July 2024; AIAA: Reston, VA, USA, 2004. Paper 2004-3521. [Google Scholar] [CrossRef]
  4. Im, J.; Cho, S.; Yoon, Y.; Moon, I. Comparative study of spray characteristics of gas-centered and liquid-centered swirl coaxial injectors. J. Propul. Power 2010, 26, 1196–1204. [Google Scholar] [CrossRef]
  5. Lefebvre, A.; McDonell, V. Atomization and Sprays; CRC Press: Boca Raton, FL, USA, 2017. [Google Scholar]
  6. Fu, Q.; Yang, L. Dynamic characteristics of the recessed chamber within a gas-liquid coaxial injector. Adv. Mech. Eng. 2016, 8, 1–7. [Google Scholar] [CrossRef]
  7. Fu, Q. Numerical simulation of the internal flow of swirl atomizer under ambient pressure. Proc. Inst. Mech. Eng. Part C J. Mech. Eng. Sci. 2016, 230, 2650–2659. [Google Scholar] [CrossRef]
  8. Liu, L.; Fu, Q.; Yang, L. Theoretical atomization model of liquid sheet generated by coaxial swirl injectors. Int. J. Multiph. Flow 2021, 142, 103725. [Google Scholar] [CrossRef]
  9. Huang, Y.; Zhou, J.; Hu, X.; Wang, Z. Acoustic model for the self-oscillation of coaxial swirl injector. In Proceedings of the 33rd Joint Propulsion Conference and Exhibit, Seattle, WA, USA, 6–9 July 1997. AIAA Paper 1997-3328. [Google Scholar] [CrossRef]
  10. Kang, Z.; Li, Q.; Cheng, P.; Zhang, X.; Wang, Z. Effects of recess on the self-pulsation characteristics of liquid-centered swirl coaxial injectors. J. Propul. Power 2016, 32, 1124–1132. [Google Scholar] [CrossRef]
  11. Eberhart, C.; Frederick, R. Fluid oscillations of a swirl coaxial injector under high-frequency self-pulsation. J. Propul. Power 2017, 33, 804–814. [Google Scholar] [CrossRef]
  12. Bazarov, V.; Yang, V. Liquid-propellant rocket engine injector dynamics. J. Propul. Power 1998, 14, 797–806. [Google Scholar] [CrossRef]
  13. Bazarov, V.; Lul’ka, L. Self-pulsation of liquid flow in coaxial air stream. Sov. Aeronaut. 1978, 3, 14–18. [Google Scholar]
  14. Zhou, J.; Hu, X.; Huang, Y.; Wang, Z. Flowrate and acoustics characteristics of coaxial swirling injector of hydrogen/oxygen rocket engine. In Proceedings of the 32nd Joint Propulsion Conference and Exhibit, Lake Buena Vista, FL, USA, 1–3 July 1996. AIAA Paper 1996-3135. [Google Scholar] [CrossRef]
  15. Bai, X.; Cheng, P.; Li, Q.; Sheng, L.; Kang, Z. Effects of self-pulsation on combustion instability in a liquid rocket engine. Exp. Therm. Fluid Sci. 2020, 114, 110038. [Google Scholar] [CrossRef]
  16. Tsohas, J.; Heister, S. Numerical simulations of liquid rocket coaxial injector hydrodynamics. J. Propul. Power 2011, 27, 793–810. [Google Scholar] [CrossRef]
  17. Yang, V.; Anderson, W. Liquid Rocket Engine Combustion Instability; Progress in Astronautics and Aeronautics; AIAA: Reston, VA, USA, 2012; Volume 169. [Google Scholar]
  18. Eberhart, C.; Lineberry, D.; Moser, M. Experimental cold-flow characterization of a swirl coaxial injector element. In Proceedings of the 45th AIAA/ASME/SAE/ASEE Joint Propulsion Conference & Exhibit, Denver, CO, USA, 2–5 August 2009. AIAA Paper 2009-5140. [Google Scholar] [CrossRef]
  19. Bazarov, V. Self-pulsations in coaxial injectors with central swirl liquid stage. In Proceedings of the 31st Joint Propulsion Conference and Exhibit, San Diego, CA, USA, 10–12 July 1995. AIAA Paper 1995-2358. [Google Scholar] [CrossRef]
  20. Yang, L.; Ge, M.; Zhang, M.; Fu, Q.; Cai, G. Spray characteristics of recessed gas-liquid coaxial swirl injector. J. Propul. Power 2008, 24, 1332–1339. [Google Scholar] [CrossRef]
  21. Kim, J.; Han, Y.; Choi, H.S.; Yoon, Y. Study on spray patterns of gas-centered swirl coaxial (GCSC) injectors in high-pressure conditions. Aerosp. Sci. Technol. 2013, 27, 171–178. [Google Scholar] [CrossRef]
  22. Son, J.; Sohn, C.; Park, G.; Yoon, Y. Spray patterns and injection characteristics of gas-centered swirl coaxial injectors. J. Aerosp. Eng. 2017, 30, 04017035. [Google Scholar] [CrossRef]
  23. Chu, W.; Li, X.; Tong, Y.; Ren, Y. Numerical investigation of the effects of gas–liquid ratio on the spray characteristics of liquid-centered swirl coaxial injectors. Acta Astronaut. 2020, 175, 204–215. [Google Scholar] [CrossRef]
  24. Bai, X.; Li, Q.; Cheng, P.; Sheng, L.; Kang, Z. Investigation of self-pulsation characteristics for a liquid-centered swirl coaxial injector with recess. Acta Astronaut. 2018, 151, 511–521. [Google Scholar] [CrossRef]
  25. Im, J.; Yoon, Y. The effects of the ambient pressure on self-pulsation characteristics of a gas/liquid swirl coaxial injector. In Proceedings of the 44th AIAA/ASME/SAE/ASEE Joint Propulsion Conference & Exhibit AIAA, Hartford, CT, USA, 21–23 July 2008. Paper 2008-4850. [Google Scholar] [CrossRef]
  26. Im, J.; Kim, D.; Yoon, Y.; Roh, T.; Koo, J. Self-pulsation characteristics of a swirl coaxial injector with various injection and geometric conditions. In Proceedings of the 41st AIAA/ASME/SAE/ASEE Joint Propulsion Conference & Exhibit, Tucson, AZ, USA, 10–13 July 2005. AIAA Paper 2005-3749. [Google Scholar] [CrossRef]
  27. Bai, X.; Cao, P.; Li, Q.; Cheng, P. The break phenomenon of self-pulsation for liquid-centered swirl coaxial injectors. Int. J. Multiph. Flow 2021, 142, 103708. [Google Scholar] [CrossRef]
  28. Ren, Y.; Guo, K.; Zhao, J.; Nie, W.; Tong, Y.; Chu, W. Numerical investigation of spray self-pulsation characteristics of liquid-centered swirl coaxial injector with different recess lengths. Int. J. Multiph. Flow 2021, 138, 103592. [Google Scholar] [CrossRef]
  29. Qiao, W.; Liang, C.; Liu, L.; Wang, S.; Zhang, B.; Yang, X.; Yang, L.; Fu, Q. Numerical study on the self-pulsation characteristics of LOX/GH2 swirl coaxial injector. Int. J. Aerosp. Eng. 2024, 1, 2249954. [Google Scholar] [CrossRef]
  30. Ahn, J.; Lim, H.; Jeong, G.; Ahn, K. Effect of the recess length on the dynamic characteristics of liquid-centered swirl coaxial injectors. Acta Astronaut. 2022, 199, 1–13. [Google Scholar] [CrossRef]
  31. ANSYS Inc. ANSYS Fluent Theory Guide, Release 2023 R2; ANSYS Inc.: Canonsburg, PA, USA, 2023. [Google Scholar]
  32. ANSYS Inc. ANSYS Fluent User’s Guide, Release 2023 R2; ANSYS Inc.: Canonsburg, PA, USA, 2023. [Google Scholar]
  33. Kang, Z.; Li, Q.; Cheng, P.; Zhang, X.; Wang, Z. Effects of self-pulsation on the spray characteristics of gas-liquid swirl coaxial injector. Acta Astronaut. 2016, 127, 249–259. [Google Scholar] [CrossRef]
  34. Li, J.; Lei, F.; Zhou, L.; Yang, A. Effects of misaligned impingement on atomization characteristics of impinging jet injector. J. Aerosp. Power 2019, 34, 2280–2293. [Google Scholar]
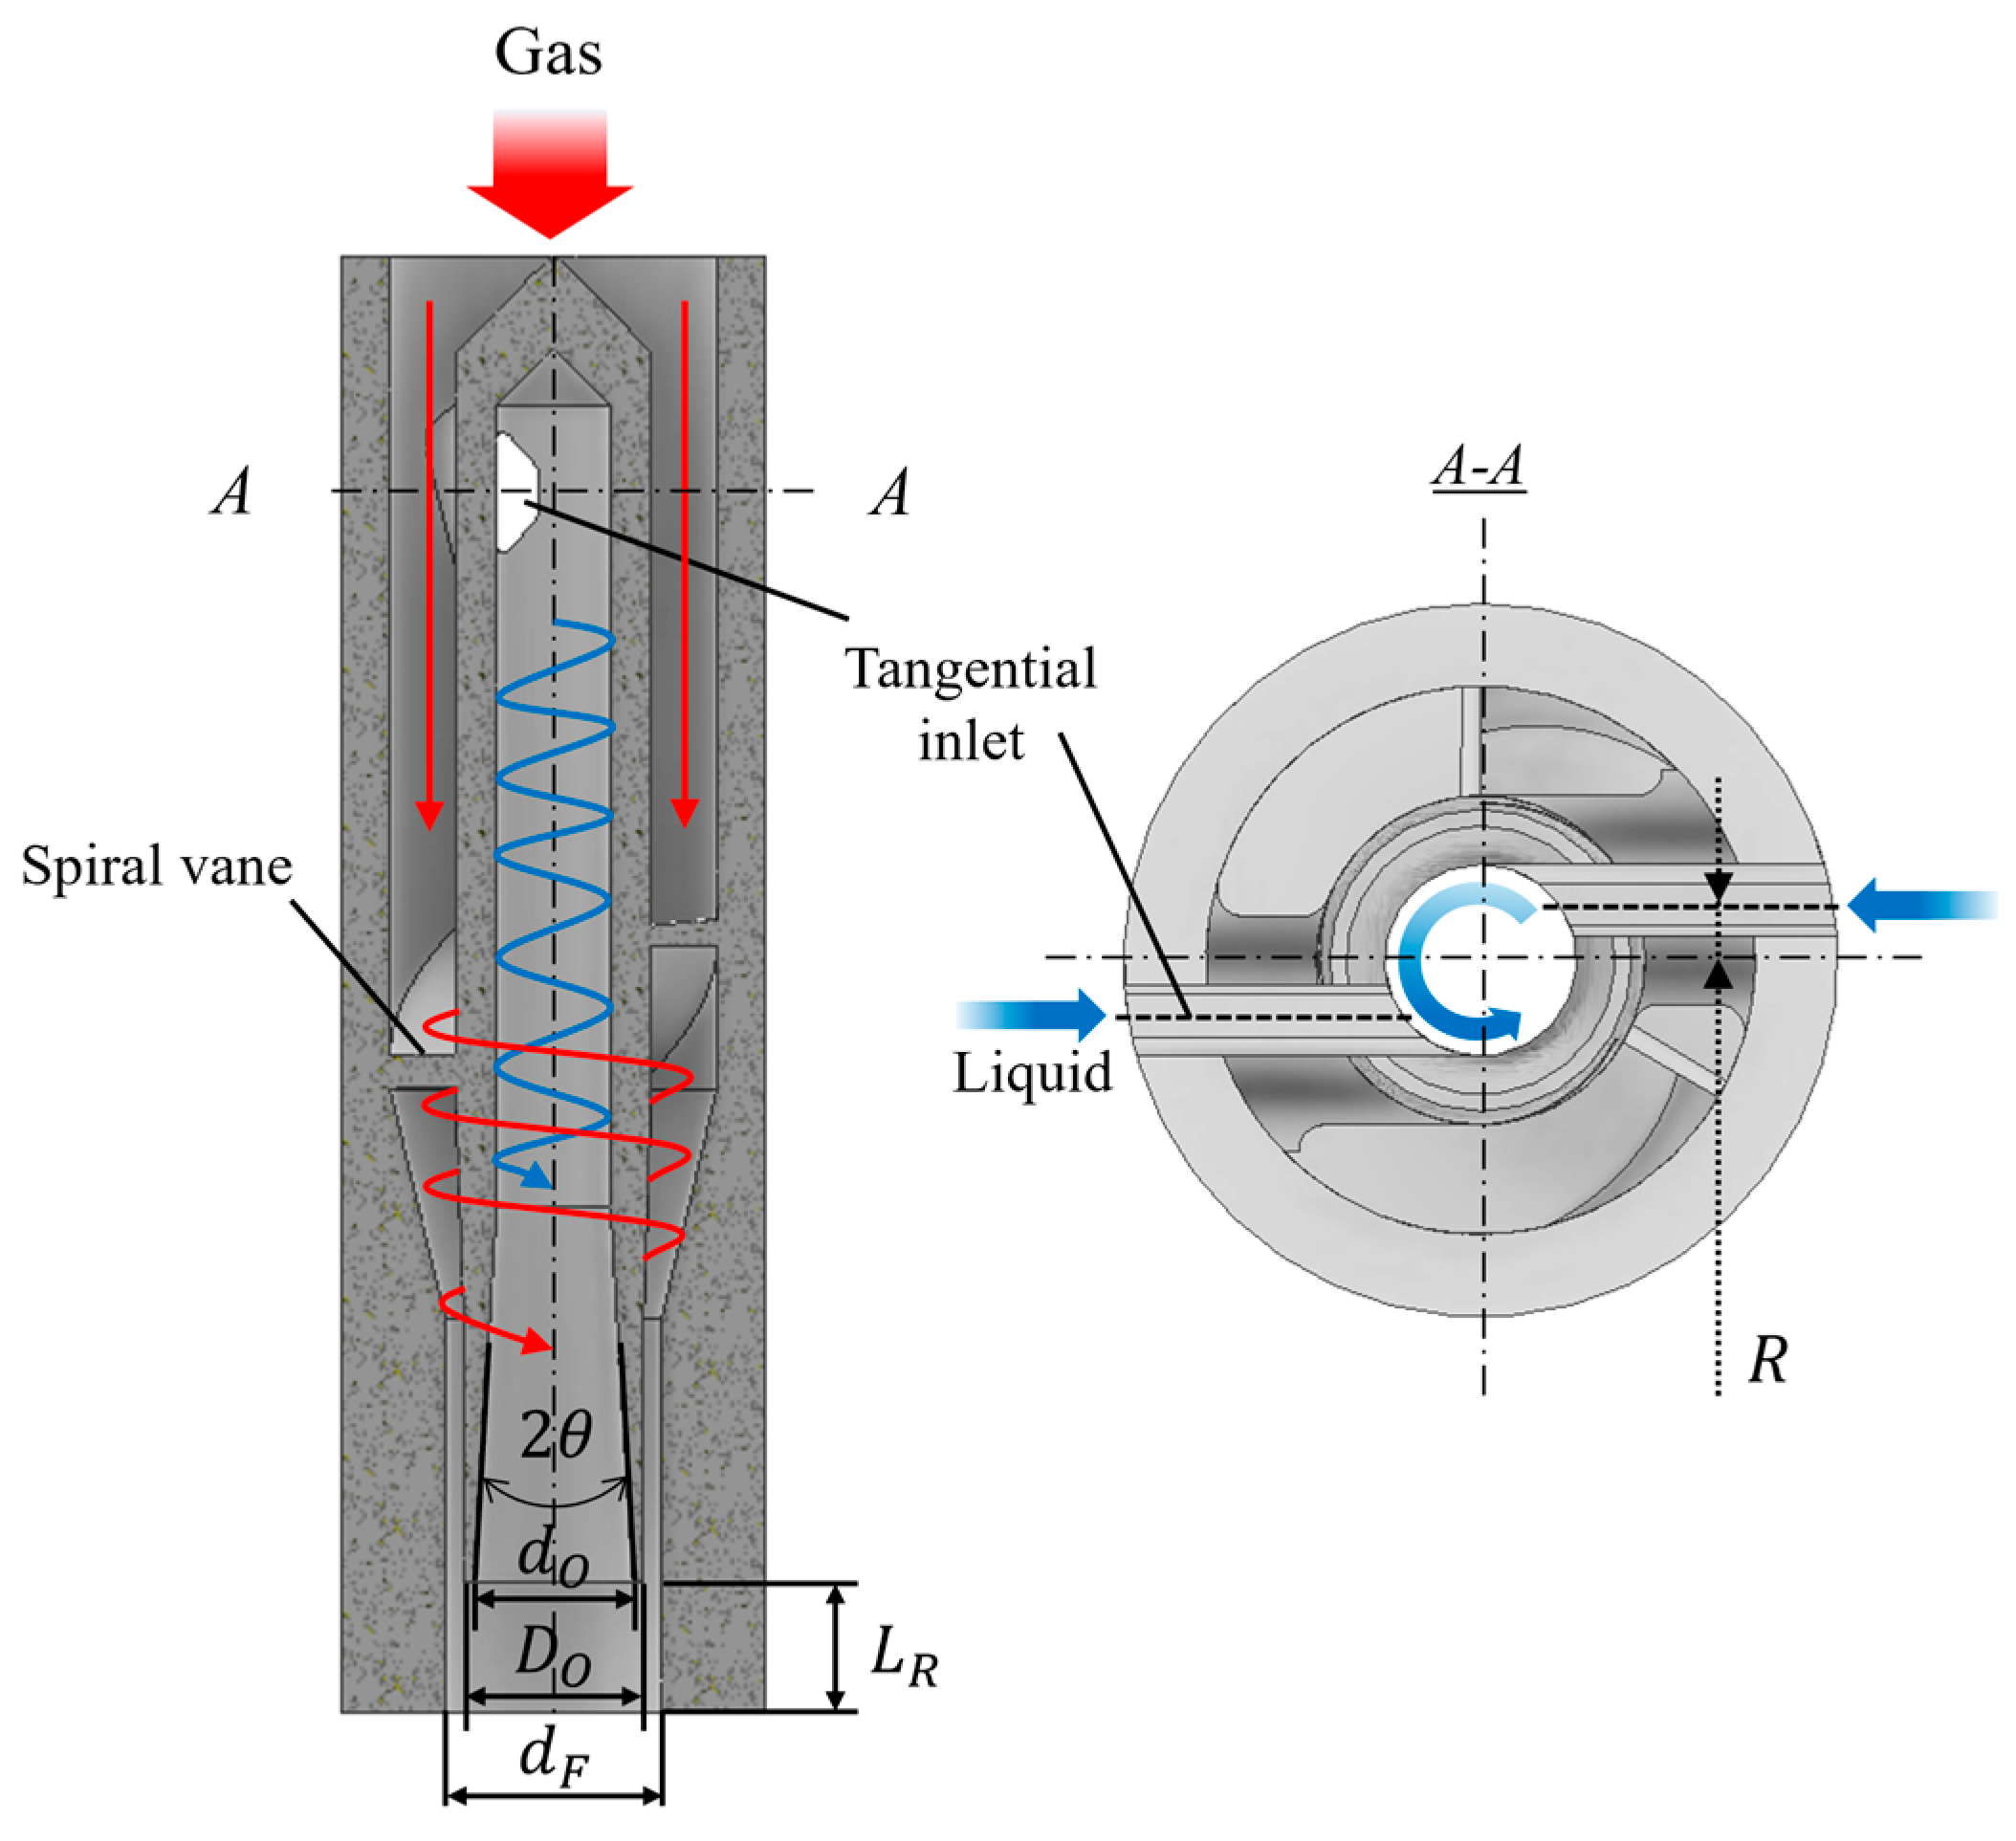
Figure 1. Schematic of the liquid-centered swirl coaxial injector.
Aerospace 12 00796 g001
Figure 2. Three-dimensional computational domain for the swirl coaxial injector.
Aerospace 12 00796 g002
Figure 3. Mesh/boundary conditions and probe placements.
Aerospace 12 00796 g003
Figure 4. Mesh independence study: (a) pressure oscillations for 4-ms and (b) FFT analysis results.
Aerospace 12 00796 g004
Figure 5. Mesh independence study: pressure distribution.
Aerospace 12 00796 g005
Figure 6. Spray patterns: (a) numerical simulation results and (b) corresponding images from the cold-flow experiment (Ahn et al. [30]).
Aerospace 12 00796 g006
Figure 7. Interface between gas and liquid at α2 = 0.25.
Aerospace 12 00796 g007
Figure 8. Comparison between numerical and experimental results (Ahn et al. [30]): (a) dominant frequency and (b) corresponding PSD value.
Aerospace 12 00796 g008
Figure 9. FFT results for the pressure probes in the recess region.
Aerospace 12 00796 g009
Figure 10. FFT results for the pressure probes in the gas line region.
Aerospace 12 00796 g010
Figure 11. FFT results for the pressure probes in the liquid tangential hole (A, B) and gas core region (C–G).
Aerospace 12 00796 g011
Figure 12. Pressure distribution over one cycle for each region.
Aerospace 12 00796 g012
Figure 13. Velocity field and recirculation zone within the gas core over one cycle.
Aerospace 12 00796 g013
Table 1. Geometric parameters of the injector.
ParameterValueUnit
D O 5.5mm
d O 4.9mm
d F 6.6mm
L R 4.0mm
R 1.1mm
2θ7.0°
Table 2. Numerical simulation conditions.
m ˙ g d [g/s]2.083
m ˙ l d [g/s]105.17
m ˙ g / m ˙ g d [%]100
m ˙ l / m ˙ l d [%]30, 60, 90, 100, 120
Table 3. Information on the probe points.
RegionProbe Points
Recess1–5
Gas linea–f
Tangential holeA, B
Gas coreC–G
Disclaimer/Publisher’s Note: The statements, opinions and data contained in all publications are solely those of the individual author(s) and contributor(s) and not of MDPI and/or the editor(s). MDPI and/or the editor(s) disclaim responsibility for any injury to people or property resulting from any ideas, methods, instructions or products referred to in the content.