Abstract
Traditional emergency reconnaissance UAV nest deployment methods face limitations such as blind coverage, delayed response, single coverage targets, and undifferentiated regional priorities. This paper proposes an optimized deployment approach that maximizes response satisfaction and regional coverage, achieving comprehensive coverage while avoiding resource waste and blind zones. UAV nest location needs to consider several factors, including UAV nest coverage, distribution of mandatory coverage areas, scope of critical areas, and various constraints. Mandatory coverage areas are disaster-prone zones identified from historical data, requiring focused reconnaissance. Critical areas are regions with high population density and critical infrastructure concentration. Constraints contain the nest coverage radius constraints, surplus coverage constraints, economic cost constraints, nest distance constraints, nest synergy constraints, and regional boundary constraints. We developed an improved multi-dimensional ant colony optimization algorithm tailored to the problem characteristics, which incorporates multi-dimensional pheromones representing coverage potential, cost efficiency, and spatial constraints, along with adaptive updating and dynamic selection mechanisms for effective problem-solving. This paper takes Nanjing, Jiangsu Province as an analysis case. And the solution achieved 100% regional coverage, redundant coverage of critical zones, and seamless inter-nest collaboration. Sensitivity analysis confirmed the model’s robustness and effectiveness under varying coverage radius and budget conditions.
1. Introduction
Emergency rescue originated from the need to systematically organize rescue forces and resources in response to major disasters in order to minimize loss of life and property. Its aim is to ensure the safety of life, maintain social stability, and promote economic development. In emergency rescue scenarios, emergency rescue reconnaissance is key to ensuring the accuracy and timeliness of rescue efforts. In response to the frequent challenges presented by natural disasters and public emergencies, unmanned aerial vehicles (UAVs) have proven their distinctive utility in various applications including forest fire prevention, earthquake rescue operations, and maritime search and rescue. Their inherent advantages like flexibility, operational efficiency, and cost-effectiveness—contribute to their robust environmental adaptability and extensive coverage capabilities. Within the framework of developing an emergency rescue reconnaissance management system utilizing drones, the strategic and scientific determination of drone base locations constitutes a pivotal component. An optimally designed layout of drone bases can significantly reduce response times, enhance surveillance coverage, improve the allocation of resources, minimize flight-related risks, and facilitate real-time information support for decision-making processes during rescue missions. Consequently, such a systematic approach maximizes the reconnaissance potential of drones in emergency rescue contexts.
Currently, research on drone nest site selection focuses on multiple fields, including post-disaster logistics distribution, medical services, and urban air traffic. Cicek C T et al. [1] reviewed the research progress on drone base station location optimization, proposed a unified Mixed Integer Non-Linear Programming (MINLP) framework and classification method, integrated relevant solution strategies. At the logistics distribution field, Shavarani S et al. [2] constructed a multi-objective location model for drone logistics and used the Nondominated Sorting Genetic Algorithm (NSGA) series algorithm to solve this problem. Jiang H et al. [3] proposed a joint optimization model for drone takeoff and landing site selection and path planning, used a two-layer genetic algorithm to solve the problem. Li X et al. [4] established an integer programming model and proposed an improved firefly algorithm to optimize the selection of logistics drone centers and maximize profits. At the healthcare service field, Rajesh Chauhan D et al. [5] proposed a multi-cycle robust site selection model, constructing a compact Mixed-integer Linear Programming (MILP) model by characterizing failure probabilities using polyhedral sets. Park Y et al. [6]. addressed the medical drone location allocation problem, proposing a robust nonlinear model and a branch-and-bound pricing algorithm framework. Tang C et al. [7] proposed a deployment scheme based on Particle Swarm Optimization (PSO) for the layout of medical Internet of Medical Things (IoMT) drone fog nodes, reducing the number of drones. Mao R et al. [8] established a location allocation model for emergency medical service timeliness requirements and applied a genetic algorithm to optimize drone base site selection, fleet configuration, and node division. Ren X et al. [9] constructed a medical drone takeoff and landing site selection model based on survival functions for out-of-hospital cardiac arrest emergency scenarios and solved it using an improved immune algorithm. At the urban air traffic field, Wang S et al. [10] established a drone site selection model for urban traffic accident emergency response needs and solved it using an improved simulated annealing algorithm. Chen L et al. [11] proposed a model for aerial taxi vertical airport site selection and developed an efficient variable neighborhood search algorithm. Rath S et al. [12] proposed an improved single-assignment p-hub median modelto optimize aerial airport site selection with dual objectives of maximizing passenger flow and revenue. Sinha A A et al. [13] proposed a two-stage optimization method for the site selection of Electric Vertical Takeoff and Landing (eVTOL) aerial taxi network infrastructure.
Compared to traditional site selection issues, site selection under emergency reconnaissance places greater emphasis on establishing a comprehensive management system. The system integrates risk prevention and control, rapid response, and coordinated collaboration. By leveraging technological empowerment and institutional safeguards, this approach aims to maximize disaster response efficiency, minimize losses, and protect lives and property. The research focuses on aspects such as spatial technology-based site optimization, modular design, and dynamic optimization. Mazaherifar A et al. [14] proposed methods for the coordinated optimization of drone three-dimensional deployment and flight trajectories, providing a key technical pathway to enhance drone response speed. In trajectory planning for mobility management, Tran-Dang H et al. [15] developed a reinforcement learning-based approach for UAV trajectory planning to handle ground user mobility in heterogeneous networks, enhancing adaptability and operational efficiency in dynamic environments.
In specific technical research, regarding spatial technology site optimization, Cicek C T et al. [16] established a joint optimization MINLP model for drone base stations and macro base stations targeting next-generation cellular networks. Alzenad M et al. [17] proposed a vertical/horizontal dimension decoupling deployment algorithm for drone base stations to maximize user coverage with minimal transmission power. Lyu J et al. [18] proposed a continuous deployment algorithm for unmanned aerial vehicle mobile base stations based on spiral centripetal paths. Lagum Faraj et al. [19] proposed a scalable deployment method for unmanned aerial vehicle base stations based on random geometry. Olgac T et al. [20] addressed the site selection problem for ground control stations of maritime search and rescue drones, applying the Set Covering Problem (SCP) and Maximal Covering Location Problem (MCLP) models. Wang B C et al. [21] constructed a time-cost-based mixed-integer programming model and solved the warehouse site selection and distribution problem under emergency conditions using particle swarm optimization and variable neighborhood search algorithms. Aakil M. Cauhye et al. [22] addressed the optimization of emergency logistics infrastructure site selection models from three perspectives. Şen A et al. [23] applied GIS technology to optimize fire station site selection models, reducing emergency response times while maximizing coverage and minimizing total costs. Gao R et al. [24] proposed a three-dimensional decoupled deployment framework for disaster emergency communication drone. In terms of coverage models and modular design, Alizadeh R et al. [25] applied the location set coverage problem to optimize the selection of emergency rescue station locations and introduced modular resource support. Yang P et al. [26] proposed a continuous maximum coverage localization model and a nonlinear distance linearization method. In terms of dynamic optimization and adaptability, Xin W et al. [27] introduced dynamic distance/cost parameter optimization for emergency facility site selection. Akram T et al. [28] proposed a dual-framework design for post-disaster communication reconstruction, using a low-complexity heuristic algorithm to support rapid network recovery decisions during disasters. Li Z et al. [29] proposed a multi-objective optimization model considering dynamic demand, using a power function solution method to achieve coordinated configuration. Zhao M et al. [30] constructed a three-objective model, using non-dominated sorting genetic algorithms and spatial coding strategies to optimize the location of emergency rescue facilities. In terms of algorithm-driven solutions, Habibi R et al. [31] used a minimum-maximum model and tabu search algorithms to minimize total cost and response time. This reasearch address the shortcomings in existing research on drone emergency rescue nest site selection, specifically the absence of surplus coverage mechanisms and the inadequate consideration of regional heterogeneity.
To address the limitations of existing research, this paper proposes a collaborative site-selection method for UAV nests in emergency reconnaissance, considering regionally differentiated coverage and redundant backup. The core contributions of this work are as follows:
- (1)
- A bi-objective optimization framework integrating regional heterogeneity and redundant coverage is proposed. By incorporating population density, urban function, and geographic data to classify critical and general areas with differentiated weights, and defining mandatory guarantee areas based on historical disaster data, a site-selection model is constructed aiming to maximize both emergency response satisfaction and area coverage rate.
- (2)
- A multi-constraint model tailored for specific rescue and reconnaissance scenarios is established. Comprehensive constraints are considered, including coverage radius, surplus coverage, economic cost, inter-nest distance, collaborative operation, and area boundaries, making the model more aligned with the practical requirements and deployment environments of emergency reconnaissance.
- (3)
- An improved multi-dimensional pheromone ant colony optimization algorithm is employed to solve the site-selection problem. To address the bi-objective and multi-constraint nature of the model, enhancements are made to the traditional ant colony algorithm by introducing a multi-dimensional pheromone mechanism to simultaneously optimize coverage rate and satisfaction, thereby ensuring better compatibility between the solver and the problem.
The remainder of this paper is structured as follows: In Section 2, we provides a systematic exposition of the drone nest site selection problem under investigation. In Section 3, a collaborative site selection model for drone nests that considers regionally differentiated coverage and surplus backup strategies is proposed. After that, a case study and sensitivity analysis are conducted using Nanjing as an example to verify the feasibility and efficiency of the model in Section 4. Finally, the summary of our work and conclusions are presented in Section 5.
2. Problem Statement
In the field of emergency rescue and reconnaissance, the site selection of UAV nests is of vital importance. This site selection is directly related to the rapid response capability and overall coverage effect of disaster-affected areas. When conducting site selection, multiple factors need to be comprehensively considered, including the selection of potential UAV nest sites, the coverage range of UAVs, the distribution of mandatory safeguard areas, the scope of critical areas, and cost constraints. Among these, potential UAV nest sites are selected based on open areas on high-rise buildings; mandatory safeguard areas refer to areas with a high frequency of disasters derived from historical disaster data, which require special attention and reconnaissance; critical areas refer to regions within a geographical area characterized by high population density and dense infrastructure. All the above factors being considered, the research problem described in this paper is to select an appropriate UAV nest location from several candidate sites within a limited budget. A key requirement is that UAVs should be able to rapidly reach mandatory safeguard areas to fulfill their tasks. Another critical objective is to achieve full coverage of the entire target areas.
The UAV nest site selection problem is illustrated as shown in the Figure 1:
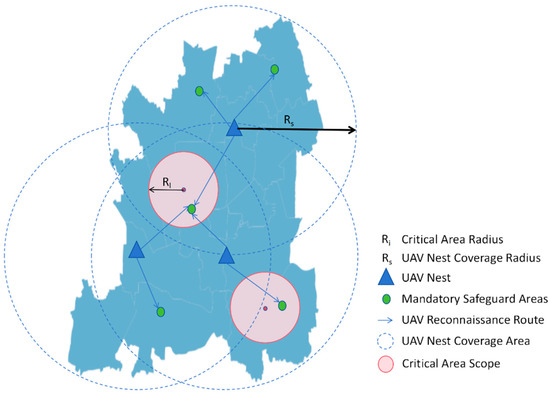
Figure 1.
This figure illustrates the schematic diagram of the problem.
Assume there are candidate sites for UAV nests within the emergency reconnaissance area, with each nest having a coverage radius of . The objective of this study is to deploy a number of UAV nests within a limited total budget, ensuring that all mandatory safeguard areas are covered by the deployed UAV nests, while maximizing the response satisfaction of UAVs arriving at different areas from the nests. To achieve the above dual objectives while satisfying multiple constraints, this study constructs a bi-objective optimization model. The model aims at maximizing both area coverage and UAV response satisfaction, while satisfying constraints such as nest coverage radius, surplus coverage, and total cost.
The UAV nest site selection problem requires a discrete location decision, i.e., whether or not to deploy a UAV nest at a candidate site, while optimizing the objective under multiple constraints. Therefore, this paper develops a 0–1 integer programming model. This model not only explicitly captures the binary decision logic and multiple constraints inherent in the UAV nest site selection problem but also facilitates sensitivity analysis and adjustment of model parameters in the research process. Through such a model, the impact of changes in key parameters on site selection outcomes can be effectively revealed. 0–1 integer programming defines binary decision variables (0 or 1) to describe binary decision scenarios, strictly representing the discrete selection logic of UAV nest deployment. In the UAV nest site selection problem, binary decision variables can be defined as , where = 1 indicates deploying a UAV nest at the candidate site, and = 0 indicates not deploying a UAV nest at the candidate site. Additionally, 0–1 integer programming abstracts complex real-world problems into mathematical optimization problems through the coupling of multiple constraints. This abstraction enables the application of solution algorithms to identify optimal or near-optimal solutions. Consequently, it provides effective decision support for UAV nest site selection in emergency rescue scenarios.
In the context of emergency reconnaissance, the site selection of drone nests must comprehensively consider response timeliness, regional coverage completeness, and system reliability. Its challenges can be summarized into the following two aspects:
- (1)
- How to construct a bi-objective function that balances response satisfaction and area coverage rate?
In the site selection of emergency reconnaissance drone nests, rapid response and comprehensive coverage are often conflicting objectives. Response satisfaction is directly related to seizing the “golden time” for rescue, while area coverage rate determines the minimization of rescue blind spots. Traditional single-objective optimization models cannot balance the two, often leading to a trade-off in actual deployment. Therefore, constructing a bi-objective function that can maximize both response satisfaction and area coverage rate has become a question. This function integrates a nonlinear satisfaction function (for critical areas) and a linear satisfaction function (for general areas), and uses weight coefficients to reflect priority differences under different geographical and social environments. How to scientifically set the form of the satisfaction function, distance sensitivity coefficient, and weight allocation mechanism in the model to achieve effective coordination and balance of the dual objectives is one of the core issues to be solved in this study.
- (2)
- How to deal with UAV nest failures?
In emergency incidents, UAV nests are at risk of failure. Therefore, system reliability must be considered. To meet this demand, we propose the regionally differentiated surplus coverage, which reduces the risk of interruption of reconnaissance tasks in critical areas. How to set surplus coverage according to area differences to ensure system robustness while avoiding resource waste is another key issue in the design of this model.
3. UAV Nest Sitting Model
In this section, seven modeling assumptions are first proposed and related symbols are illustrated, covering sets, parameters and decision variables. Secondly, the UAV nest response satisfaction functions for critical and general areas are established separately, and the bi-objective function is established by combining the area coverage. Finally, six constraints are constructed, including nest coverage radius, surplus coverage, total cost, nest distance, nest synergy and area boundary constraints.
3.1. Model Assumptions and Notation Description
Assumption 1.
Each UAV nest is equipped with a limited number of UAVs of the same model that can serve multiple mission points.
Assumption 2.
UAV nests satisfy all reconnaissance needs in the coverage area, and the location of nests is discretely distributed from the area where reconnaissance needs to be carried out and the nests do not affect each other.
Assumption 3.
UAV flies at a constant speed. To ensure the fastest emergency response, it always takes the direct, obstacle-free path between the nest and the area.
Assumption 4.
UAV response time does not include UAV loading equipment, take-off and landing time.
Assumption 5.
In determining the number of sites, the size of multiple nests is the same as the size of one to satisfy the emergency response.
Assumption 6.
UAV involved in each reconnaissance mission fly at a constant speed, and the considered UAV response time can be measured by the distance relationship.
Assumption 7.
The selected UAV nest candidates all have good communications and full communications coverage.
In Table 1, Table 2 and Table 3, we present the descriptions of set, parameters, and decision variables, respectively.

Table 1.
Set descriptions.

Table 2.
Parameters descriptions.

Table 3.
Decision variables descriptions.
3.2. Bi-Objective Function
The bi-objective function design ensures that UAV operations achieve both rapid emergency response and comprehensive area coverage.
3.2.1. Response Satisfaction
In the field of emergency rescue reconnaissance, the satisfaction of the response time of UAV reconnaissance arrival will be directly related to whether the rescue operation can seize the “golden rescue time”. If this goal is ignored, the delay in the arrival of the UAV at the scene may cause the trapped people to miss the best time for rescue. The rescuers may also lack accurate information and blindly carry out rescue operations, which is not only inefficient, but also may cause unnecessary waste of resources and casualties of the rescuers. Therefore, from the perspective of saving lives and reducing losses, reaching the mission area quickly is the top priority.
We define the historical disaster occurrence areas as mandatory safeguard areas and extract the geometric centroids of these areas. For the centroids of mandatory safeguard areas in critical and general areas, nonlinear and linear satisfaction functions are used to evaluate the metrics of UAV response, respectively, and then normalized. The objective function (1) represents the satisfaction of UAV reconnaissance response.
denotes the set of mandatory safeguard area centroids in the critical area. denotes the set of UAV nests that can provide service to the mandatory safeguard area centroids . denotes the weights of mandatory safeguard area centroids in the critical area. denotes the weights of mandatory safeguard area centroids in the general area. and denote the nonlinear satisfaction functions of mandatory safeguard area centroids in the critical area and the general area. With respect to the distance , and satisfaction is measured according to the degree of the distance deviation from the ideal range. Satisfaction is measured according to how far the distance deviates from the ideal range. For the center point of the mandatory safeguard area within the critical area, once a disaster occurs, the impact range and the degree of harm are wide, and the response speed of the UAV is required to be extremely high. When calculating the response time satisfaction , it can give more priority to meet the needs of these mission points.
- Nonlinear satisfaction functions for critical areas
From the viewpoint of urgency of emergency rescues, such as population, buildings, natural terrain, transportation network and other such critical areas in the event of a disaster, the arrival response requirements for UAV detection are extremely high. The setting of the distance sensitivity coefficient for critical areas makes it preferable to choose UAV nests close to these critical areas when considering UAV nest site selection. This is because once the distance is out of the desired range, the satisfaction of the UAV reconnaissance response drops rapidly, ensuring that the UAV can reach the critical areas in the shortest possible time. denotes the completely ideal distance. denotes the incomplete ideal distance. These distances are from the center of the mandatory safeguard area of the critical area to the UAV nest.
The critical area distance sensitivity factor , the satisfaction will decrease rapidly in a nonlinear manner as the distance between the UAV nest point and the center point of the critical mandatory safeguard area when deviates from the ideal distance range.
- 2.
- Linear satisfaction function in general areas
For general areas, the requirements for UAV arrival response are not as strict as those for critical areas. But they also need to receive appropriate attention and resource allocation. denotes the completely ideal distance from the center point of the mandatory safeguard area to the UAV nest in the general area. denotes the incomplete ideal distance from the center point of the mandatory safeguard area to the UAV nest in the general area.
The general area distance sensitivity factor so that the satisfaction varies linearly with the distance .
3.2.2. Area Coverage
Emergency responses can happen anywhere and anytime, and there may be affected people and targets in different locations. Part of the area is neglected, and the inability to obtain timely reconnaissance information in the event of an emergency incident can cause great losses to the safety of people and property. Ensuring the coverage of areas enables comprehensive monitoring, avoids the emergence of rescue blind zones, and guarantees that all affected areas can receive due attention and support.
Higher area coverage can be achieved by rationally planning the location of nests. Assuming a total of area units, denotes the coverage status of nest j on area unit k. ( = 1 indicates coverage, = 0 indicates no coverage)
denotes the set of UAV nest candidate points. This equation indicates that the number of area units covered by all nests should be a larger proportion of the total number of area units.
3.2.3. Integrated Construction of Bi-Objective Function
Combining (1) with (4), the bi-objective function is as follows:
and denote the weight coefficients, , . denotes the importance of maximizing the satisfaction of UAV reconnaissance arrival response. denotes the importance of maximizing the area coverage.
In the actual decision-making, considering the differences in the characteristics of different provinces, the weights and should be set according to the local conditions. From the perspective of geography, provinces with a large proportion of mountainous areas, such as Sichuan, have mountain ranges and complex terrain. UAVs face many obstacles when flying and signal transmission is easily affected. To ensure rapid response and timely access to disaster site information during emergencies, such provinces tend to give higher weight to maximizing the satisfaction of drone reconnaissance arrival response time, is relatively large. In plain provinces such as Shandong, the terrain is flat and open, and there are fewer restrictions on drone flights. In this case, to fully grasp a larger range of geographic information, and to better carry out disaster monitoring and assessment, the area rate will be more critical.
3.3. Constraints
3.3.1. Nest Coverage Radius Constraint
Based on the UAV range limitation, the farthest reachable area of the nest is constrained. denotes the distance between the UAV nest and the center point of the mandatory safeguard area, and denotes the coverage radius of the UAV nest.
(6) indicates that the UAV reconnaissance distance must be less than or equal to the nest coverage radius.
denotes the distance between the UAV nest and the center point of the mandatory safeguard area in two-dimensional space, so it is expressed as Euclidean distance. For each nest, it is only responsible for reconnaissance targets within its coverage radius.
3.3.2. Surplus Coverage Constraint
In actual rescue, UAVs may not work properly due to malfunction, bad weather and other accidents. If the reconnaissance point is served by only one nest, the point will not be monitored once that UAV or nest has problems. The surplus requirement reduces the risk of mission interruption and ensures stable and continuous rescue work. denotes the set of UAV nest candidates that can cover the center point of the mandatory safeguard area in an critical area. denotes the set of UAV nest candidates that can cover the center point of the mandatory safeguard area in an general area. denotes the set of mandatory safeguard area center points in critical areas, and denotes the set of mandatory safeguard area center points in general areas.
(7) indicates that there are at least two UAV nests available for reconnaissance coverage of the mandatory safeguard area center points for critical areas, and at least one UAV nest available for reconnaissance coverage of the mandatory safeguard area center points for general areas.
3.3.3. Total Cost Constraint
From a cost perspective, the construction and operation of UAV nests requires a significant investment. Construction costs (site rental, infrastructure building, etc.) will limit the number of nests and the rationality of the layout. UAV equipment costs affect the number of purchases and performance. Power consumption costs (charging, power consumption for equipment operation), if ignored, will result in a high expenditure in the long run; and overhauling costs (regular maintenance, fault repair costs) are related to the reliability and service life of UAVs. Considering these costs comprehensively can realize the rational allocation of resources and guarantee the sustainability of rescue operations.
denotes the fixed construction cost of deploying drone nests in candidate nests. denotes the number of UAVs deployed at candidate nest , and denotes the cost per unit of UAV equipment. denotes the unit time power consumption cost of candidate nest , denotes the reconnaissance mission cycle, denotes candidate nest annual maintenance costs, and denotes the total budget ceiling.
(8) indicates that the total cost (construction cost, UAV equipping cost, power consumption cost, maintenance cost) is less than or equal to the budget ceiling.
3.3.4. Nest Distance Constraint
If the nests are deployed in an overly concentrated manner in a localized area, it will lead to the duplication of resources in that area, resulting in unnecessary waste. At the same time, it will not be able to achieve efficient coverage of the entire area. Therefore, it is critical to set at least a certain distance between nests to avoid excessive surpluses in localized areas and prevent waste of resources.
denotes the minimum distance between nests, denotes the distance between nests and .
and are the projected coordinates of UAV nests and . This constraint can effectively avoid excessive concentration of nests in local areas, reduce unnecessary over-coverage surpluses, and achieve optimal allocation of resources.
3.3.5. Nest Synergy Constraint
When the UAV performs emergency reconnaissance missions, the cooperative operation capability between nests is crucial. If the distance between the nests is too far, it will lead to the difficulty of mutual support and synergistic cooperation between UAVs during the execution of the mission, which will not be able to give full play to the overall advantages and reduce the efficiency of emergency response. Therefore, to realize the efficient cooperative work between nests, the constraint that the distance between nests should not exceed a certain distance is set.
denotes the maximum synergistic distance between nests, which needs to be satisfied for all the possible synergistic operation of nest pairs.
(10) indicates that within the coverage range of each nest, there is at least one other nest that can collaborate with it. This equation ensures that the distance between the nests is appropriate, which facilitates mutual support and cooperative operation in emergency reconnaissance and improves the overall emergency response efficiency.
3.3.6. Area Boundary Constraint
If the nests are too close to the area boundary, the coverage of the UAVs may extend beyond the delineated target area, resulting in ineffective consumption of resources. To ensure that resources are focused on emergency reconnaissance of the target area, set the constraint that the nest should be a certain distance away from the area boundary.
The area grid boundary is represented by a series of point sets , and for each UAV nest candidate point , the safe distance from the boundary is set to . For the boundary point , calculate the distance to the candidate point . And should be satisfied:
This constraint can effectively circumvent the redundant coverage of the UAV nest outside the target area and accurately focus on the emergency reconnaissance in the target area.
3.4. Solution Methodology
Given the bi-objective discrete optimization characteristics in emergency rescue scenarios, this study selects Ant Colony Optimization (ACO) as the core solution framework and incorporates a multi-dimensional pheromone mechanism. To accommodate model constraints, four pheromone types were introduced: coverage pheromone, cost-efficiency pheromone, critical area satisfaction pheromone, general area satisfaction pheromone. The adoption of multi-dimensional pheromones enables ACO to holistically incorporate model-specific features during optimization, ensuring final solutions comply with model requirements.
As shown in the Figure 2, the solution is structured as follows specifically. During the precomputation and initialization phase, the algorithm first inputs geospatial data and task point information, then computes two core matrices in parallel: the coverage matrix (indicating the task points and grids covered by each candidate nest) and the distance matrix (storing distances between candidate points, and between candidate points and task points). This step completes time-consuming spatial calculations in advance, laying the foundation for high-speed iteration. Subsequently, the algorithm initializes a four-dimensional pheromone matrix, providing initial guidance for the search process.
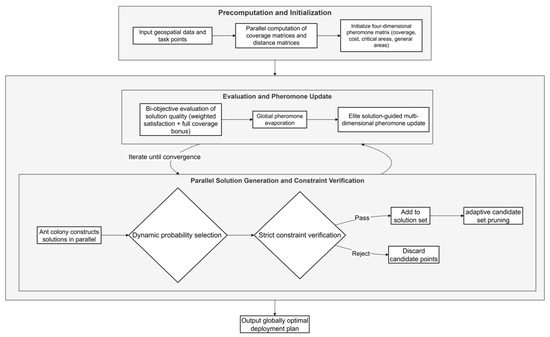
Figure 2.
This figure illustrates the flowchart of the solution methodology.
Upon entering the iteration loop, the algorithm employs a multi-process parallel mechanism to simulate an ant colony simultaneously constructing solutions. Each ant constructs a solution through probabilistic selection cycles: the next candidate point is selected based on a dynamic probability formula, which integrates four types of pheromone concentrations, coverage heuristic information, and a critical distance penalty factor. The penalty mechanism strictly enforces spatial constraints to avoid forming isolated nests. Once a candidate point is selected, it must immediately undergo constraint validation, including the nest coverage radius constraint, surplus coverage constraint, total cost constraint, nest distance constraint, nest synergy constraint, and area boundary constraint. If any constraint is not met, the point is discarded; if it passes, it is added to the solution set. Each time a point is successfully added, the algorithm performs adaptive candidate set pruning, comprehensively evaluating the remaining candidate points based on real-time coverage potential, cost-effectiveness, and spatial diversity to dynamically prune and retain an efficient candidate set, thereby improving search efficiency.
After all ants complete solution construction, the algorithm enters the evaluation and pheromone update phase: first, each valid solution is scored using a bi-objective evaluation function, calculating weighted satisfaction and full coverage rewards. Then, global pheromone evaporation is performed to avoid premature convergence, and multidimensional pheromone updates are guided by elite solutions: each selected nest point independently enhances the corresponding four types of pheromone matrices based on its contribution to total coverage, cost efficiency, critical area satisfaction improvement value, and general area satisfaction improvement value, thereby tightly aligning the search process with multiple optimization objectives.
The process iterates until convergence, ultimately outputting the globally optimal deployment scheme—i.e., the UAV nest deployment scheme that comprehensively optimizes coverage performance, satisfaction, and cost-effectiveness under all complex constraints.
The pseudocode of the improved ant colony optimization algorithm used in this paper is shown in Algorithm 1. Specifically, during the initialization phase, coverage matrices and distance metrics are precomputed to accelerate subsequent solving (lines 1–2). In the core iteration loop, a multi-process parallel mechanism is used to generate solutions (line 4). Each ant selects candidate points through a dynamic weighting strategy (comprehensively considering coverage, cost-effectiveness, distance penalty, and exploration reward) (lines 8–11) and strictly validates constraint conditions: cost constraints, nest synergy constraints, nest distance constraints, and surplus coverage constraints (lines 13–19). During construction, the candidate list is dynamically pruned based on real-time coverage potential, cost efficiency, and spatial diversity (lines 20–23). Solution evaluation uses a bi-objective function, quantifying critical area/general area satisfaction and coverage rewards (lines 30–33), based on which the global best solution is updated. The pheromone update phase introduces an elite solution intensification mechanism (line 36), and multidimensional updates are performed based on four pheromone matrices: coverage, cost efficiency, critical area satisfaction, and general area satisfaction (lines 37–41), ensuring the optimization process is closely aligned with the model objectives.
| Algorithm 1: Pseudocode of the Enhanced Ant Colony Optimization for Drone Nest Deployment |
| 1: Initialize parameters 2: Precompute coverage matrices and distance metrics for critical/normal tasks 3: for iter = 1 to max_iter do 4: Generate solutions in parallel using multiprocessing pool: 5: for each ant in num_ants do 6: Initialize empty solution and candidate list 7: while solution size <Q and candidates exist do 8: Calculate selection probabilities with: 9: -Dynamic weights (coverage, cost_efficiency) 10: -Distance penalty (block < d_min, reward d_min-drone_radius, penalize > drone_radius) 11: -Exploration reward for unvisited candidates 12: Select candidate via roulette wheel selection 13: Validate distance constraints for new candidate: 14: -∀ existing_nest ∈ solution: 15: distance(candidate, existing_nest) ≥ d_min 16: -∃ at_least_one existing_nest ∈ solution: 17: distance(candidate, existing_nest) ≤ drone_radius 18: -∀ boundary_point ∈ area_border: 19: distance(candidate, boundary_point) ≥ d_jb 20: Update solution and prune candidates based on: 21: -Coverage potential (uncovered grids) 22: -Cost efficiency (coverage per unit cost) 23: -Spatial diversity (minimum inter-nest distance) 24: end while 25: Validate solution against: 26: -critical_task 27: -normal_task 28: -Total cost 29: end for 30: Evaluate valid solutions using objective function: 31: -Critical satisfaction 32: -Normal satisfaction 33: -Coverage bonus 34: Update global best solution if improved 35: Evaporate pheromone: τ ← τ × evaporation_rate 36: Enhance pheromone for elite solutions (5× intensification) 37: Update pheromone matrices based on: 38: -coverage 39: -cost_efficiency 40: -critical_sat 41: -normal_sat 42: Output iteration metrics end for |
4. Case Analysis
This section collects and applies multi-source data from the experimental area of Nanjing, including geographic boundaries, population density, water distribution, road and railway networks, communities, and building vector data (primarily sourced from the Nanjing Emergency Management Bureau and the China Natural Disaster Database). Using these data, the entire city of Nanjing is divided into general areas and critical areas. Meanwhile, historical disaster data for Nanjing is incorporated to identify appropriate mandatory safeguard points (disaster-prone locations that must be covered). Using the constructed model and optimization algorithms, differentiated drone nest candidate points are selected for critical and general areas. Furthermore, to explore how the nest coverage radius performs under real conditions, this section sets sensitivity experiments. These experiments analyze the impact of changes in the nest coverage radius and total cost on area coverage and response satisfaction.
4.1. Case Description
To validate the performance of the model’s selected drone nest candidate sites in terms of geographic coverage and satisfaction, this section selects Nanjing, Jiangsu Province as the experimental region. Nanjing, as shown in Figure 3, (latitude: 31°14′–32°37′, longitude: 118°22′–119°14′), with a total area of 6587 km2, is an important central city in East China. The city has a dense population, mature infrastructure, and a high risk of sudden-onset disasters. These factors make the demand for emergency response capabilities particularly critical. Therefore, Nanjing is chosen as the research case to verify the feasibility and efficiency of the proposed drone nest site selection method. The study simulates and optimizes the deployment layout of drone nests using actual geographic data and multi-source spatial information. This approach ensures a rapid response and comprehensive coverage in emergency reconnaissance missions.
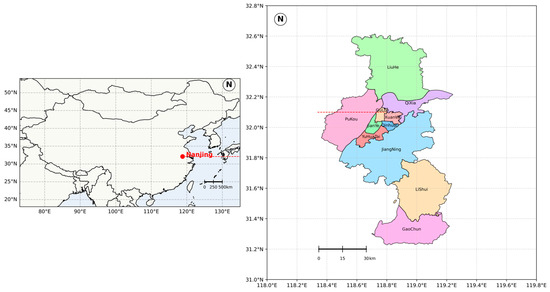
Figure 3.
This figure shows the Map of Nanjing, China.
4.2. Critical Areas
The experiment identified critical areas through a weighted analysis of multi-source spatial data combined with spatial filtering mechanisms. The specific steps are as follows:
- Grid System Construction
Based on Nanjing’s geographic boundaries, a projection coordinate system (EPSG:32650) is used to generate candidate grid points covering the entire area.
- 2.
- Hierarchical Analysis Method for Determining Indicator Weights
- (1)
- Construct Hierarchical Model: The decision problem of identifying critical areas is structured into three levels: an objective level (determining the critical areas in Nanjing), a criteria level (e.g., population density, water bodies, roads, railways, communities, buildings), and an indicator level (specific metrics such as community density, building density, etc.).
- (2)
- Construct Judgment Matrix: For each factor at the criteria level, pairwise comparisons of indicators are made based on the 1–9 scale method to construct a judgment matrix. These six factors are ranked in terms of their impact on selecting the center of critical aeras as: community density, building density, proximity to railways, road density, population density, and water risk. A separate judgment matrix is constructed for each of these six factors.
- (3)
- Hierarchical Ranking and Consistency Test: The maximum eigenvalue and corresponding eigenvector of each judgment matrix are calculated. The eigenvector is normalized to obtain the relative weight vector of each indicator for the corresponding criteria. Consistency check, calculate the consistency index (where is the largest eigenvalue, and n is the number of judgment matrix rows). Introducing a random consistency index (calculated based on random matrices), then calculate the consistency ratio , When the judgment matrix is considered acceptable; otherwise, it needs to be adjusted.
- (4)
- Overall Hierarchical Ranking and Consistency: The composite weight of each indicator for the objective level is calculated by weighting the indicator weights at the criteria level. A total sorting consistency test is conducted, and if passed, the weight results are reliable.
- 3.
- Multi-Factor Weighted Scoring
The candidate points are scored based on six types of spatial data (population density, water, roads, railways, communities, and buildings). The weight distribution of each factor is shown in the Table 4 below, and the visualization of the evaluation indicators is provided in the accompanying Figure 4a.

Table 4.
Multi-Factor Weight Distribution.
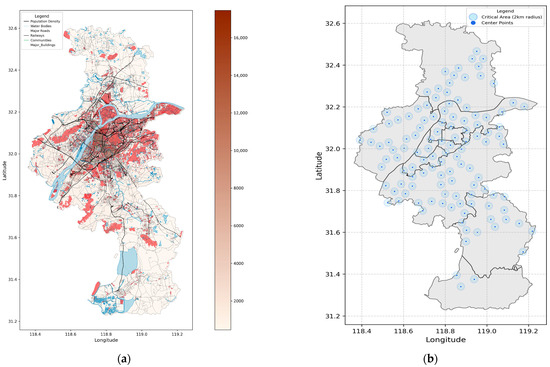
Figure 4.
(a) This figure presents the spatial distribution of urban evaluation metrics across Nanjing, China. The base map (light gray) outlines the administrative boundaries, overlaid with six thematic layers: (1) Population density (brown gradient), (2) Water bodies (blue polygons), (3) Major roads (gray lines), (4) Railways (black dashed lines), (5) Communities (green polygons), and (6) Major buildings (red polygons). (b) This figure illustrates the spatial distribution of critical areas in Nanjing, with dark blue circular markers indicating center points and light blue translucent zones representing 2-km coverage areas, overlain on administrative boundaries in light gray.
Critical area center points are shown in Figure 4b with a defined radius, and the circular areas around them are highlighted on the map. This visualization illustrates the distribution of critical areas across Nanjing.
4.3. Parameter Settings
When performing drone nest site selection optimization, the parameters are divided into several categories, including deployment of drone nests, task point assignment, economic cost control, algorithm optimization, and satisfaction evaluation. Below, Table 5 presents the Optimization Algorithm Parameters, Table 6 presents the Drone Nest and Task-Related Parameters, Table 7 presents the Cost and Resource Parameters, and Table 8 presents the Satisfaction Weight Parameters.

Table 5.
Optimization Algorithm Parameters.

Table 6.
Drone Nest and Task-Related Parameters.

Table 7.
Cost and Resource Parameters.

Table 8.
Satisfaction Weight Parameters.
4.4. Experimental Results and Analysis
The experiment evaluates the area coverage and response satisfaction of the selected drone nest positions, verifying the effectiveness of the model. And the results is shown in the following Figure 5.
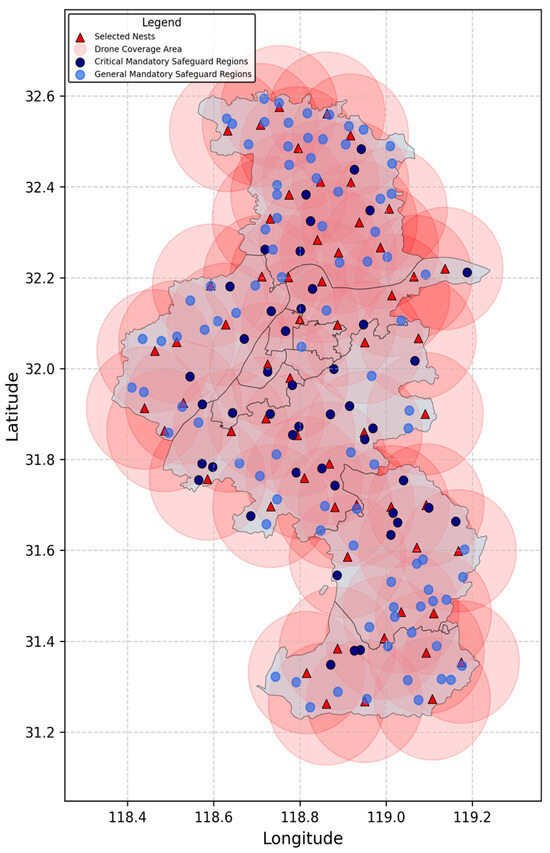
Figure 5.
This figure presents the optimal drone nest distribution derived from the model in Nanjing, where red triangles indicate selected nest locations and translucent red circles represent their coverage areas. Critical mandatory safeguard regions are shown as solid navy circles, while general mandatory regions appear as semi-transparent royal blue circles.
The results are shown in the Figure 5 and illustrate optimized drone nest locations and mandatory safeguard point distribution. Red triangles mark selected nest locations, blue circles represent general mandatory safeguard points, purple circles represent critical mandatory safeguard points, and pink shaded areas indicate coverage. The model achieves 100% area coverage with a reasonable budget of CNY 2.5 million, ensuring that all mandatory guarantee areas are covered.
The distribution of drone nests shows differentiated coverage for critical and general areas. For critical areas (near the purple circles), due to their higher response time requirements, several nests are deployed in more concentrated locations. In contrast, in general areas (near the blue circles), the nest deployment is more dispersed. The model’s ability to achieve differentiated coverage is mainly due to the construction of the dual-level response satisfaction function. In the model, critical areas use a nonlinear satisfaction function, which drives the algorithm to prioritize selecting nests closer to the critical areas for deployment, forming high-density redundant coverage. In comparison, general areas (near the blue circles) use a linear satisfaction function, which allows for a higher tolerance of response distance, making the deployment strategy more spread out for broader coverage. This heterogeneous design of the satisfaction function ensures differentiated regional response strategies and prioritizes resource allocation, optimizing resource configuration and avoiding excessive investment in regions with lower demand. This ultimately enhances the overall system’s efficiency.
The nest synergy constraint is also reflected in the experiment. In Figure 3, the overlapping areas of drone nest coverage indicate that these nests can work together. Specifically, when a drone nest is responsible for a task, after completing the task, the drone can choose to return to a nearby nest based on task requirements, rather than just returning to the initial nest. In the model, this is achieved by setting the distance between any two nests working together to be no greater than the maximum coordination distance between nests. This design reduces response delays caused by excessive load or temporary failures of a nest. Even if a nest in a critical area fails to complete the task on time, a nearby nest can quickly take over the task.
The proposed drone nest site selection optimization model achieves 100% area coverage in the emergency rescue scenario in Nanjing, ensuring that all mandatory safeguard points are covered.
4.5. Sensitivity Analysis
The mandatory safeguard area and the overall area coverage ratio are directly influenced by the coverage radius of the nest. In practical applications, the drone radius value may vary due to factors such as UAV endurance limitations, environmental constraints, or changing mission requirements. Therefore, we conducted a sensitivity analysis on the nest coverage radius. Budget is a critical factor that must be considered in real-world engineering problems, and projects often face budget deficits. The model’s performance under different budget levels is crucial. Therefore, conducting a sensitivity analysis on the budget is necessary. The analysis of these two parameters will be presented sequentially below.
4.5.1. Nest Coverage Radius
While keeping other parameters consistent with the baseline model, we varied the nest coverage radius to obtain the results visualized in the following figures.
As illustrated in Figure 6, the nest coverage radius exhibits a distinct two-stage correlation characteristic with geographic coverage rate. When the coverage radius expands from 12 km to 14 km, the geographic coverage rate increases. Evidently, a larger radius enables each nest to cover more geographical units (grid points), resulting in accelerated coverage growth within this range. Beyond 14 km, the model achieves full coverage status, maintaining a stable area coverage rate at 100%. This indicates a saturation threshold that exists in the area coverage rate’s response to coverage radius—beyond this threshold, changes in the parameter no longer cause numerical fluctuations in area coverage rate.
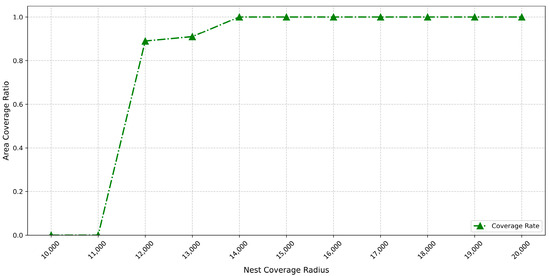
Figure 6.
This figure demonstrates the trend of area coverage ratio variation with changes in nest coverage radius.
Figure 7 illustrates the impact of the nest coverage radius on the response satisfaction of mandatory safeguard area centers across different types. Significant satisfaction disparities exist between critical and general area due to three design parameter differences:
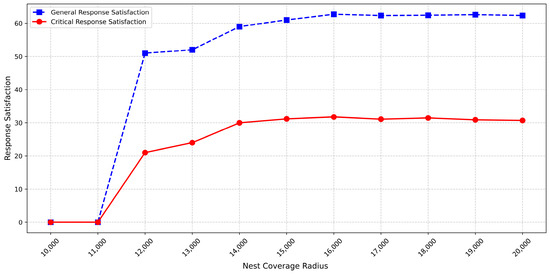
Figure 7.
This figure demonstrates the trend of response satisfaction variation with changes in nest coverage radius.
- The “incomplete ideal distance” threshold () for critical areas is smaller than for general areas (), resulting in a narrower effective response range of nests for critical area centers.
- The “ideal distance” threshold () for critical areas is more rigorous than for general areas (), permitting smaller distance deviations.
- Within the interval from the “ideal distance” to “ incomplete ideal distance”, the critical area’s attenuation coefficient () is larger than that of general areas (), leading to faster satisfaction attenuation rates and heightened sensitivity to distance variations.
Consequently, both the absolute satisfaction values and their incremental gains due to radius changes are lower for critical areas versus general areas.
The nest coverage radius and response satisfaction also exhibit a two-stage correlation. When the radius ranges from 12 km to 16 km, response satisfactions for both area types increase with radius expansion. This is because larger radius enhance nest coverage density within the “incomplete ideal distance” of mandatory safeguard areas, increasing the number of covered centers within this interval and thereby driving satisfaction growth. Beyond 16 km, the model enters a stabilization phase: most newly covered guarantee centers under further radius expansion lie outside the “incomplete ideal distance”, contributing zero satisfaction.
Sensitivity analysis for the nest coverage radius reveals a distinct threshold effect in regulating model performance. Before reaching the critical threshold, both the geographic coverage rate and response satisfactions increase with expanding radius. Beyond this threshold, the coverage rate stabilizes at its maximum value while satisfaction metrics exhibit minor fluctuations influenced by heuristic algorithms. This threshold-triggered response pattern validates the model’s boundary constraint mechanism, demonstrating strong robustness in the super-threshold region. Meanwhile, the experimentally measured critical thresholds (14 km for coverage, 16 km for satisfaction) fall within the typical coverage ranges of practical nests, demonstrating applicability in engineering scenarios.
4.5.2. Budget
In practical engineering scenarios with budget constraints, sensitivity analysis of budget parameters is of significant practical importance. While keeping other parameters consistent with the baseline model, we obtained the results shown in the following Figure 8 and Figure 9.
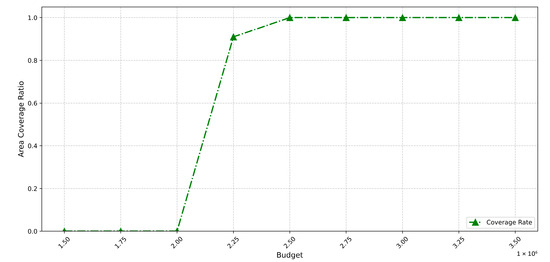
Figure 8.
This figure demonstrates the trend of area coverage ratio variation with changes in budget.
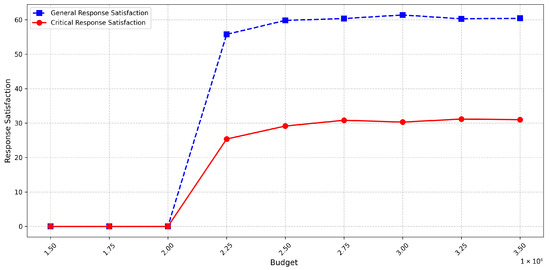
Figure 9.
This figure demonstrates the trend of response satisfaction variation with changes in budget.
When the budget falls below CNY 2.25 million, the model yields no feasible solutions. This results from the dual effects of discrete task point distribution and nest synergy constraint. On the one hand, dispersed areas layout require nests to possess wide-area coverage capabilities. On the other hand, synergy constraints limit the spatial dispersion of nest placements.
This contradiction makes it infeasible to obtain valid deployment schemes under low budgets. When the budget exceeds CNY 2.5 million, algorithm optimization drives resource allocation toward cost minimization convergence, where fluctuations in satisfaction metrics primarily stem from the randomness of heuristic algorithms.
To address the infeasibility cause, we implemented moderate relaxation of the nest synergy constraint, increasing it to 30 km. While keeping other parameters unchanged, the results are shown in the Figure 10 and Figure 11.
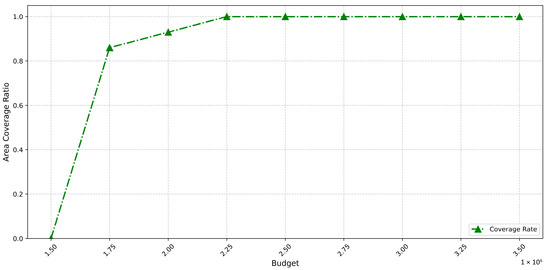
Figure 10.
This figure demonstrates the trend of area coverage ratio variation with changes in budget with relaxation of the nest synergy constraint.
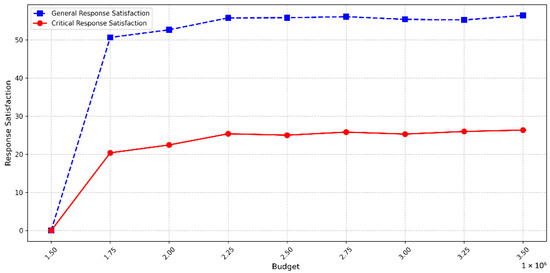
Figure 11.
This figure demonstrates the trend of response satisfaction variation with changes in budget with relaxation of the nest synergy constraint.
It is evident that under low-budget conditions, model performance improves. Feasible solutions become obtainable when the budget reaches CNY 1.75 million. However, at CNY 2.25 million, a threshold effect emerges: further budget increases cause no significant improvement in satisfaction levels, with both critical and general areas exhibiting lower satisfaction than model maintaining standard nest synergy constraints. This indicates that while constraint relaxation enhances solution feasibility in low-budget regimes, it compromises the peak performance ceiling in high-budget regions. This phenomenon reflects the inherent trade-off characteristic between constraint conditions and resource allocation in engineering optimization, providing critical design boundary references for practical deployment.
5. Conclusions
In this paper, we have provided a site selection methodology for decision makers to find suitable UAV nest deployment locations. We developed a mixed linear integer programming model that rationally integrates regional differentiation and satisfaction metrics into the nest sitting problem. First, we gridded the geographic area, considered population density, urban planning, natural geographic conditions, and historical dis-aster data indicators, and determined the weights of different factors through hierarchical analysis to analyze regional differentiation. We used the open area of high-rise buildings as the basis for the selection of candidate nests. Second, we considered the radius of the nests’ coverage, the surplus constraint of the coverage, the economic cost constraint, the distance constraint of nests, the synergy constraint, and the area boundary constraint, and modeling with area coverage and response satisfaction. Then, the traditional ant colony algorithm is improved to find an optimal nest deployment layout method. Finally, Nanjing, Jiangsu Province, is used as a analyze case to find an optimal set of deployment points, and the stability of the model is verified through sensitivity analysis of the coverage radius and Budget.
Our research effectively addresses the issues of missing coverage surplus mechanisms, single—objective optimization, and insufficient consideration of regional heterogeneity. It yields an optimal deployment scheme for nests and balances area coverage and response satisfaction. Future research will focus on the following areas: first, distinguishing the resource differences among nests to refine scheduling strategies; second, verifying the integrity of regional communication coverage to ensure information transmission; and third, improving the end-to-end transmission mechanism for reconnaissance information from collection terminals to designated departments to enhance operational effectiveness.
Furthermore, the adaptability of the model under complex terrain has not yet been fully validated. Although the topography of Nanjing includes plains, hills, and a small proportion of mountainous areas, offering certain diversity and reasonably representing the general geophysical characteristics of eastern China, the model’s generalization capability in more challenging environments—such as typical mountainous regions, coastal wetlands, or high-altitude areas—still requires further investigation. In the future, we will endeavor to collect more data to validate its generalization performance and gradually extend its application to other regions.
Author Contributions
Conceptualization, X.Z., X.C. and W.Z.; Data curation, X.C. and J.L.; Formal analysis, X.Z. and X.C.; Funding acquisition, W.Z.; Investigation, X.Z., X.C. and J.L.; Methodology, X.Z. and X.C.; Project administration, W.Z.; Resources, W.Z.; Software, X.Z.; Supervision, W.Z.; Validation, X.Z. and R.Y.; Visualization, X.Z.; Writing—original draft, X.Z., X.C., R.Y., J.L. and Y.Y.; Writing—review and editing, X.Z., X.C. and W.Z. All authors have read and agreed to the published version of the manuscript.
Funding
The Fundamental Research Funds for the Central Universities (No. NT2023014); the National Key R&D Program of China (No. 2022YFB2602403).
Institutional Review Board Statement
Not applicable.
Informed Consent Statement
Not applicable.
Data Availability Statement
This study did not report any data.
Conflicts of Interest
The authors declare no conflicts of interest.
References
- Cicek, C.T.; Gultekin, H.; Tavli, B.; Yanikomeroglu, H. UAV Base Station Location Optimization for Next Generation Wireless Networks: Overview and Future Research Directions. In Proceedings of the 2019 1st International Conference on Unmanned Vehicle Systems-Oman (UVS), Muscat, Oman, 5–7 February 2019; pp. 1–6. [Google Scholar]
- Shavarani, S.M.; Golabi, M.; Izbirak, G. A Capacitated Biobjective Location Problem with Uniformly Distributed Demands in the UAV-Supported Delivery Operation. Int. Trans. Oper. Res. 2021, 28, 3220–3243. [Google Scholar] [CrossRef]
- Jiang, H.; Wang, J.; Ren, X. Location-Route Planning for VTOL Airport and UAV Urban Logistics Network—A Case Study of Tianjin. Promet-Traffic Transp. 2025, 37, 456–476. [Google Scholar] [CrossRef]
- Li, X.; Shen, Z.; Wei, W. An Improved Firefly Algorithm Used to Location Selection of Distribution Center for Logistics UAV. In Proceedings of the 2019 IEEE/AIAA 38th Digital Avionics Systems Conference (DASC), San Diego, CA, USA, 8–12 September 2019; pp. 1–8. [Google Scholar]
- Chauhan, R.; Unnikrishnan, A.; Figliozzi, M.A.; Boyles, S.D. Robust Multi-Period Maximum Coverage Drone Facility Location Problem Considering Coverage Reliability. Transp. Res. Rec. 2023, 2677, 98–114. [Google Scholar] [CrossRef]
- Park, Y.; Lee, S.; Sung, I.; Nielsen, P.; Moon, I. Facility Location-Allocation Problem for Emergency Medical Service with Unmanned Aerial Vehicle. IEEE Trans. Intell. Transp. Syst. 2023, 24, 1465–1479. [Google Scholar] [CrossRef]
- Tang, C.; Zhu, C.; Wei, X.; Rodrigues, J.J.P.C.; Guizani, M.; Jia, W. UAV Placement Optimization for Internet of Medical Things. In Proceedings of the 2020 International Wireless Communications and Mobile Computing (IWCMC), Limassol, Cyprus, 15–19 June 2020; pp. 752–757. [Google Scholar]
- Mao, R.; Du, B.; Sun, D.; Kong, N. Optimizing a UAV-Based Emergency Medical Service Network for Trauma Injury Patients. In Proceedings of the 2019 IEEE 15th International Conference on Automation Science and Engineering (CASE), Vancouver, BC, Canada, 22–26 August 2019; pp. 721–726. [Google Scholar]
- Ren, X.; Li, R. The Location Problem of Medical Drone Vertiports for Emergency Cardiac Arrest Needs. Sustainability 2024, 16, 44. [Google Scholar] [CrossRef]
- Wang, S.; Shang, Y. Pre-Siting of UAV Stations for Traffic Accident Assessment Considering Road Dispersion. PLoS ONE 2025, 20, e0316431. [Google Scholar] [CrossRef]
- Chen, L.; Wandelt, S.; Dai, W.; Sun, X. Scalable Vertiport Hub Location Selection for Air Taxi Operations in a Metropolitan Region. INFORMS J. Comput. 2022, 34, 834–856. [Google Scholar] [CrossRef]
- Rath, S.; Chow, J.Y.J. Air Taxi Skyport Location Problem with Single-Allocation Choice-Constrained Elastic Demand for Airport Access. J. Air Transp. Manag. 2022, 105, 102294. [Google Scholar] [CrossRef]
- Sinha, A.A.; Rajendran, S. A Novel Two-Phase Location Analytics Model for Determining Operating Station Locations of Emerging Air Taxi Services. Decis. Anal. J. 2022, 2, 100013. [Google Scholar] [CrossRef]
- Mazaherifar, A.; Mostafavi, S. UAV Placement and Trajectory Design Optimization: A Survey. Wirel. Pers. Commun. 2022, 124, 2191–2210. [Google Scholar]
- Tran-Dang, H.; Kim, D.S. Reinforcement Learning-Based Unmanned Aerial Vehicle Trajectory Planning for Ground Users’ Mobility Management in Heterogeneous Networks. IEEE Trans. Veh. Technol. 2021, 70, 12333–12347. [Google Scholar]
- Cicek, C.T.; Gultekin, H.; Tavli, B.; Yanikomeroglu, H. Backhaul-Aware Optimization of UAV Base Station Location and Bandwidth Allocation for Profit Maximization. IEEE Access 2020, 8, 154573–154588. [Google Scholar] [CrossRef]
- Alzenad, M.; El-Keyi, A.; Lagum, F.; Yanikomeroglu, H. 3-D Placement of an Unmanned Aerial Vehicle Base Station (UAV-BS) for Energy-Efficient Maximal Coverage. IEEE Wirel. Commun. Lett. 2017, 6, 434–437. [Google Scholar] [CrossRef]
- Lyu, J.; Zeng, Y.; Zhang, R.; Lim, T.J. Placement Optimization of UAV-Mounted Mobile Base Stations. IEEE Commun. Lett. 2017, 21, 604–607. [Google Scholar] [CrossRef]
- Lagum, F.; Bor-Yaliniz, I.; Yanikomeroglu, H. Strategic Densification with UAV-BSs in Cellular Networks. IEEE Wirel. Commun. Lett. 2018, 7, 384–387. [Google Scholar] [CrossRef]
- Olgac, T.; Toz, A.C. Determining the Optimum Location of Ground Control Stations (GCSs) for Unmanned Aerial Vehicles (UAVs) in Marine Search and Rescue (MSAR) Operations. Int. J. Aeronaut. Space Sci. 2022, 23, 1021–1032. [Google Scholar] [CrossRef]
- Wang, B.C.; Qian, Q.Y.; Gao, J.J.; Tan, Z.Y.; Zhou, H. The Optimization of Warehouse Location and Resources Distribution for Emergency Rescue under Uncertainty. Adv. Eng. Inform. 2021, 48, 101278. [Google Scholar] [CrossRef]
- Caunhye, A.M.; Zhang, Y.; Li, M.; Nie, X. A Location-Routing Model for Prepositioning and Distributing Emergency Supplies. Transp. Res. Part E Logist. Transp. Rev. 2016, 90, 161–176. [Google Scholar] [CrossRef]
- Şen, A.; İsmail, Ö.; Gökgöz, T.; Şen, C. A GIS Approach to Fire Station Location Selection. In Proceedings of the 4th International Symposium on Geo-Information for Disaster Management, Antalya, Turkey, 3–8 May 2011. [Google Scholar]
- Gao, R.; Wang, X. Rapid Deployment Method for Multi-Scene UAV Base Stations for Disaster Emergency Communications. Appl. Sci. 2023, 13, 10723. [Google Scholar] [CrossRef]
- Alizadeh, R.; Nishi, T. Hybrid Covering Location Problem: Set Covering and Modular Maximal Covering Location Problem. In Proceedings of the 2019 IEEE International Conference on Industrial Engineering and Engineering Management (IEEM), Macao, China, 15–18 December 2019; pp. 865–869. [Google Scholar]
- Yang, P.; Xiao, Y.; Zhang, Y.; Zhou, S.; Yang, J.; Xu, Y. The Continuous Maximal Covering Location Problem in Large-Scale Natural Disaster Rescue Scenes. Comput. Ind. Eng. 2020, 146, 106608. [Google Scholar] [CrossRef]
- Wang, X.; Qin, G.; Zhao, H. Based on Immune Optimization Algorithm for Multi-Storage Site Selection Algorithm. In Proceedings of the 2024 7th International Conference on Advanced Algorithms and Control Engineering (ICAACE), Shanghai, China, 1–3 March 2024; pp. 31–36. [Google Scholar]
- Akram, T.; Awais, M.; Naqvi, R.; Ahmed, A.; Naeem, M. Multicriteria UAV Base Stations Placement for Disaster Management. IEEE Syst. J. 2020, 14, 3475–3482. [Google Scholar] [CrossRef]
- Li, Z.; Xie, C.; Peng, P.; Gao, X.; Wan, Q. Multi-Objective Location-Scale Optimization Model and Solution Methods for Large-Scale Emergency Rescue Resources. Environ. Sci. Pollut. Res. 2021, 28, 1–14. [Google Scholar] [CrossRef] [PubMed]
- Zhao, M.; Chen, Q. Risk-Based Optimization of Emergency Rescue Facilities Locations for Large-Scale Environmental Accidents to Improve Urban Public Safety. Nat. Hazards 2015, 75, 163–189. [Google Scholar] [CrossRef]
- Habibi, R.; Panjaitan, A.C. A Model for Blood Bank Facility-Location Problem at Post Disaster Area. ADI J. Recent Innov. 2023, 4, 128–137. [Google Scholar] [CrossRef]
Disclaimer/Publisher’s Note: The statements, opinions and data contained in all publications are solely those of the individual author(s) and contributor(s) and not of MDPI and/or the editor(s). MDPI and/or the editor(s) disclaim responsibility for any injury to people or property resulting from any ideas, methods, instructions or products referred to in the content. |
© 2025 by the authors. Licensee MDPI, Basel, Switzerland. This article is an open access article distributed under the terms and conditions of the Creative Commons Attribution (CC BY) license (https://creativecommons.org/licenses/by/4.0/).