Article

Analysis of the Compressive Buckling and Post-Buckling Behaviour of Wood-Based Sandwich Panels Used in Light Aviation

ISAE-SUPAERO—UPS—IMT Mines Albi—INSA, Institut Clément Ader, Université de Toulouse, F-31400 Toulouse, France
*
Author to whom correspondence should be addressed.
Aerospace 2025, 12(9), 782; https://doi.org/10.3390/aerospace12090782
Submission received: 21 July 2025 / Revised: 22 August 2025 / Accepted: 27 August 2025 / Published: 29 August 2025
(This article belongs to the Special Issue Composite Materials and Aircraft Structural Design)

Abstract

This work aims to investigate the buckling and post-buckling behaviour of wood-based sandwich structures with and without a manufacturing defect, under compressive loading. The specimens were made by gluing birch veneers to a balsa wood core. The defect consisted of a central zone where glue was lacking between the skin and the core. A compression load was applied to the plate using the VERTEX test rig, with the plate placed on the upper surface of a rectangular box and bolted at its borders. The upper surface of the plate was monitored using optical and infrared cameras. The stereo digital image correlation method was used to capture the in-plane and out-of-plane deformations of the specimen, and to calculate the strains and stresses. The infrared camera enabled the failure scenario to be identified. The buckling behaviour of pristine specimens showed small local debonding in the post-buckling range, which was not detrimental to overall performance. In the presence of a manufacturing defect, the decrease in buckling load was only about 15%, but final failure occurred at lower compressive loads.

1. Introduction

Aeronautical composite structures can be of three types: laminated, sandwich, or geodesic [1]. Sandwich structures are predominant in light aviation and, historically, the first ones were made of wood in the 1920s [2]. These were made using a combination of plywood skins and cork cores (the Brodeau process) or plywood cores and aluminium skins (the Morane-Saulnier 406) [2]. During the Second World War, when metal was expensive and difficult to access, interest shifted towards using wood for war aircraft due to its availability and light weight [2,3,4]. A well-known example of wood being used in aeronautics is the De Havilland Mosquito aircraft [2]. Designed with a wooden sandwich structure, this aircraft was known as the “Wooden Wonder” due to its maximum speed of 612 km/h. It made its first flight in 1940 and was successful in several missions during the Second World War. Nowadays, a French company called “Avions Mauboussin” is designing lightweight aircraft using a wood-based sandwich structure [2,5].
In general, there has been a significant resurgence of interest in wood-based structures for various applications, including space exploration [6], automotive engineering [2,7,8], and construction [9,10,11]. Many authors have used wood as a core with various combinations of materials for the skins [10,11,12,13,14,15]. In particular, Susainathan et al. [15] studied the mechanical response to bending of many sandwich structures with different plywood cores and glass, carbon, and flax skins. They showed that the mechanical characteristics were very high compared to a reference sandwich currently used for civil aircraft floors, but optimisation in terms of mass was required. Indeed, wood also exhibits remarkable properties in terms of dynamic behaviour and damage tolerance. Recent research has demonstrated the excellent behaviour of these wooden sandwich structures under low-velocity, low-energy impact [16,17,18] and compression after impact [19,20], which is of great interest in the context of aeronautical structures [1,2]. In general, wood has also been shown to perform well in dynamic tests [20,21,22,23,24], particularly when confined between two skins [25,26,27]. Recent studies have also shown that birch, the material used for the skins in this study, has excellent crash qualities [24,28,29]. However, modelling wood-based structures, particularly under low-velocity/low-energy impact and crash, remains an open field [2,30,31,32,33].
Designing an aeronautical composite sandwich structure is difficult and challenging, especially for lightweight aviation, since the structures are thin and prone to local and global buckling [1,2]. This becomes even more complex when wood is used, due to its intrinsic complexities and the almost lost knowledge of how to work with it. Local buckling is a type of instability that is difficult to handle and predict, as it can be highly localised and coupled with global buckling [34,35,36,37,38]. In general, numerical or analytical calculation models are based on beam-type tests, but according to the authors’ experience, this type of test has proven to be either unrealistic or overly conservative for light aircraft structures [39]. It has also been proposed that structural tests on panels be conducted using the VERTEX machine [40,41], which has previously been used to address various issues related to aeronautical structures, such as large notches in thermoset or thermoplastic composites, impact on stiffeners [42], and local buckling of sandwich structures [43,44]. Specimens measuring 558 mm × 536 mm2 were designed to represent the technology of Elixir Aircraft and were then tested under compression and shear loadings. The bolting areas were reinforced using adapted stackings and stiffer cores. The tests were monitored using various methods, such as a high-speed camera, a thermal camera, and a pair of cameras for stereo digital image correlation. Despite the phenomenon of failure being very instantaneous and energetic, local buckling was identified as the cause of this catastrophic failure. A complex test/computation dialogue was also proposed [43]. Further details can be found in references [40,43,44]. Previous studies have demonstrated the feasibility of local and global structural buckling tests on sandwich structures using the VERTEX test bench, and this experience was very useful for the present study.
In this context, the present study focuses on investigating the buckling behaviour and failure scenarios of wooden sandwich structures under compressive loading at a structural scale. Particular attention is given to analysing the influence of the most common manufacturing defect in light aviation sandwich structures: the lack of glue between the core and skins, which creates local debonding. The next subsection will present the design of the wood sandwich specimens, followed by an explanation of the experimental methodology using the Vertex test rig. Finally, the experimental results will be discussed.

2. Materials and Manufacturing

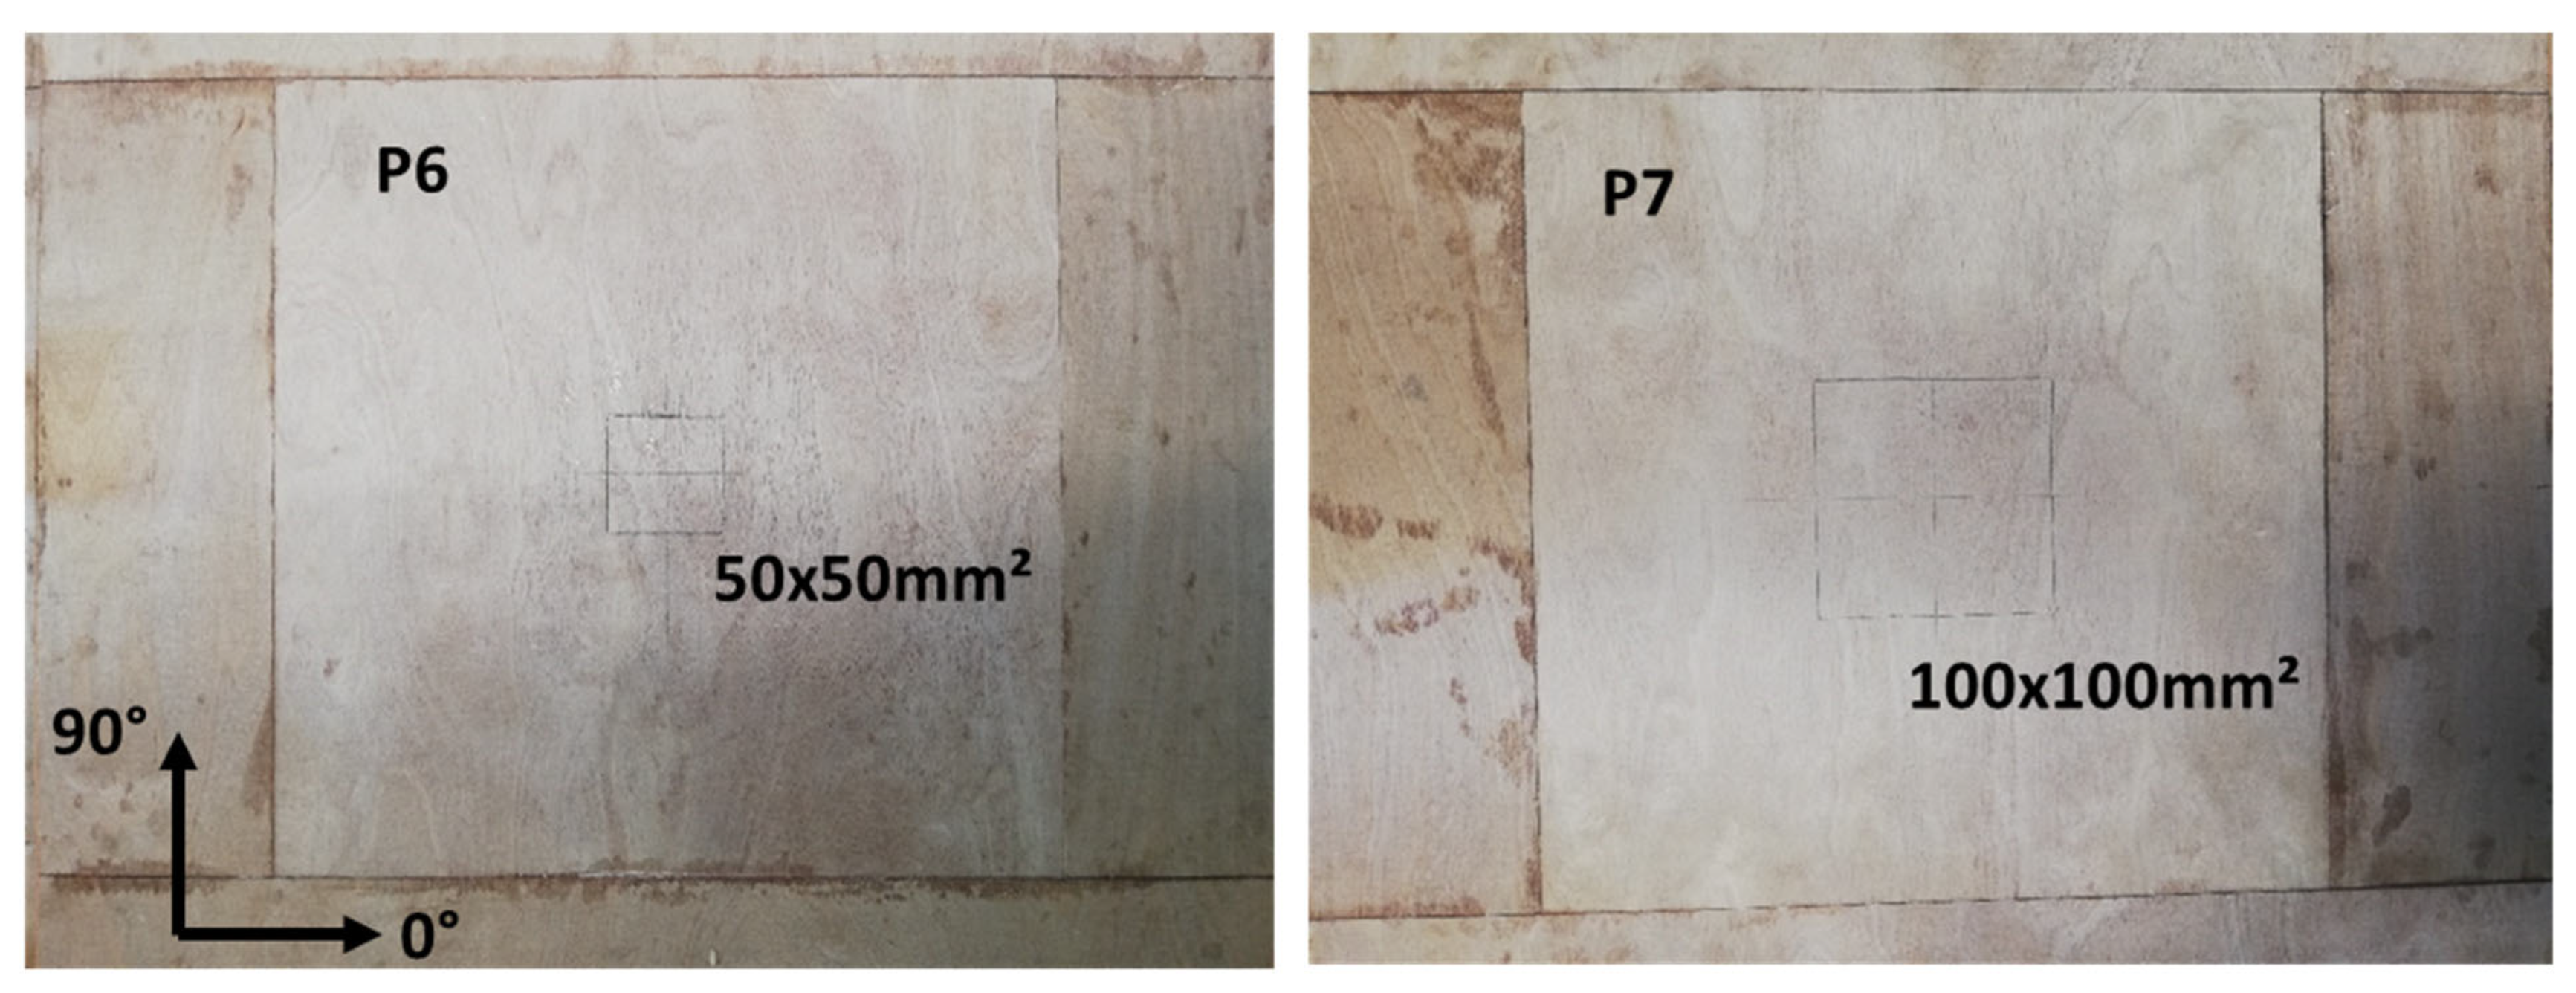
The wood sandwich structure used in the study was manufactured by Avions Mauboussin, a company in the French light aviation sector. The sandwich consisted of a skin made of two layers of Finnish birch veneer (each layer 0.4 mm thick) oriented at 0° and 90°. The core was made of balsa. However, contrary to classical structures where the grain of the balsa is aligned with the normal direction of the sandwich [2,17,45], the direction of the grain was in the plane of the sandwich structure, which is unusual for sandwich structures with balsa cores, because usually the grain direction is perpendicular to the facesheets to improve the out-of-plane strength. However, here, due to the very low thickness of the core (5 mm), the manufacturing of curved panels would have been too complex and therefore too expensive. The balsa core comprised several strips of random size, as shown in Figure 1. This method of arranging strips of balsa of random sizes was adopted to simulate the actual sandwich structure used in the manufacture of a light aircraft. The core was then glued to the skins. A 558 × 536 mm2 plate, corresponding to the size of the VERTEX test rig, was manufactured using this process. Additional layers of plywood were added to the top and bottom faces of the plate, extending beyond the plate’s edges to prevent stress concentration at the embedded edges. To reinforce the four borders of the plate, which were embedded in the VERTEX test rig boards, the balsa was replaced with beech on these borders, as beech is harder, stiffer, and stronger. No additional information can be provided on the manufacturing of the specimens, as this is the proprietary right of Avions Mauboussin. Two types of plates were manufactured using this process: six pristine plates, named P0 to P5 below, and two plates with a central delamination defect, P6 and P7. The central delamination zones measured 50 × 50 mm2 and 100 × 100 mm2, respectively, as shown in Figure 2.

3. Experimental Procedure

3.1. Vertex Test Rig

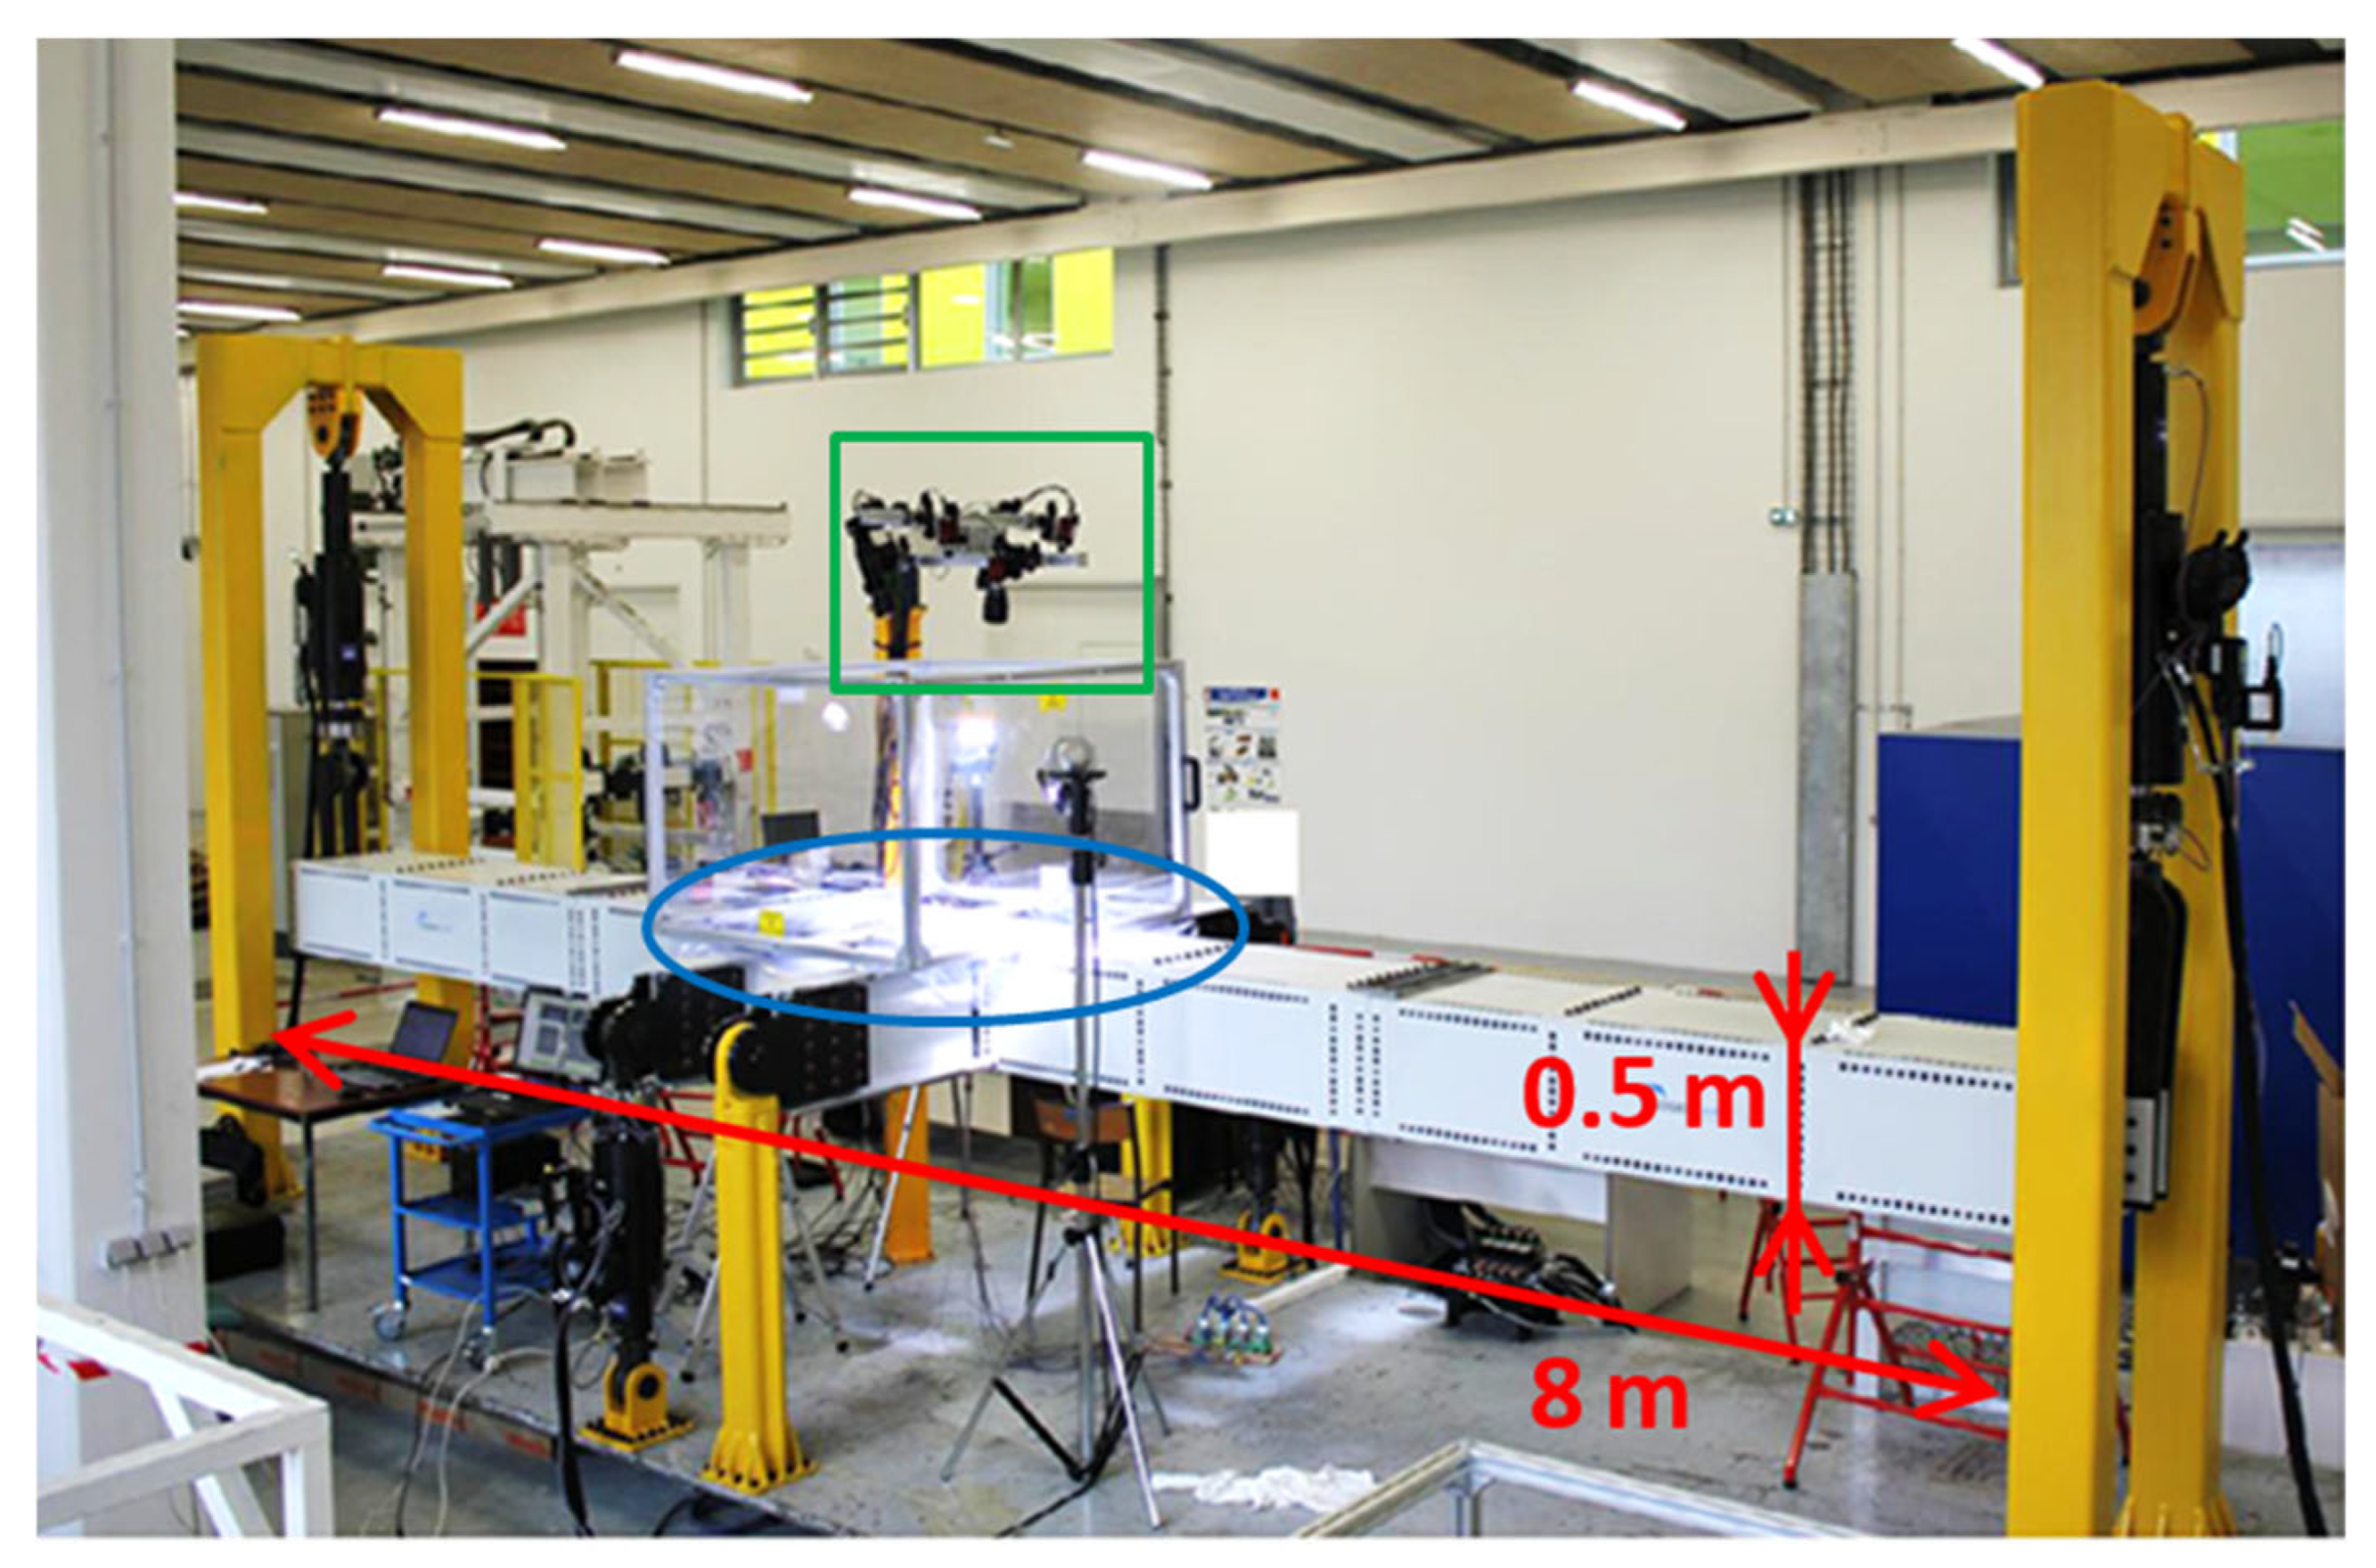
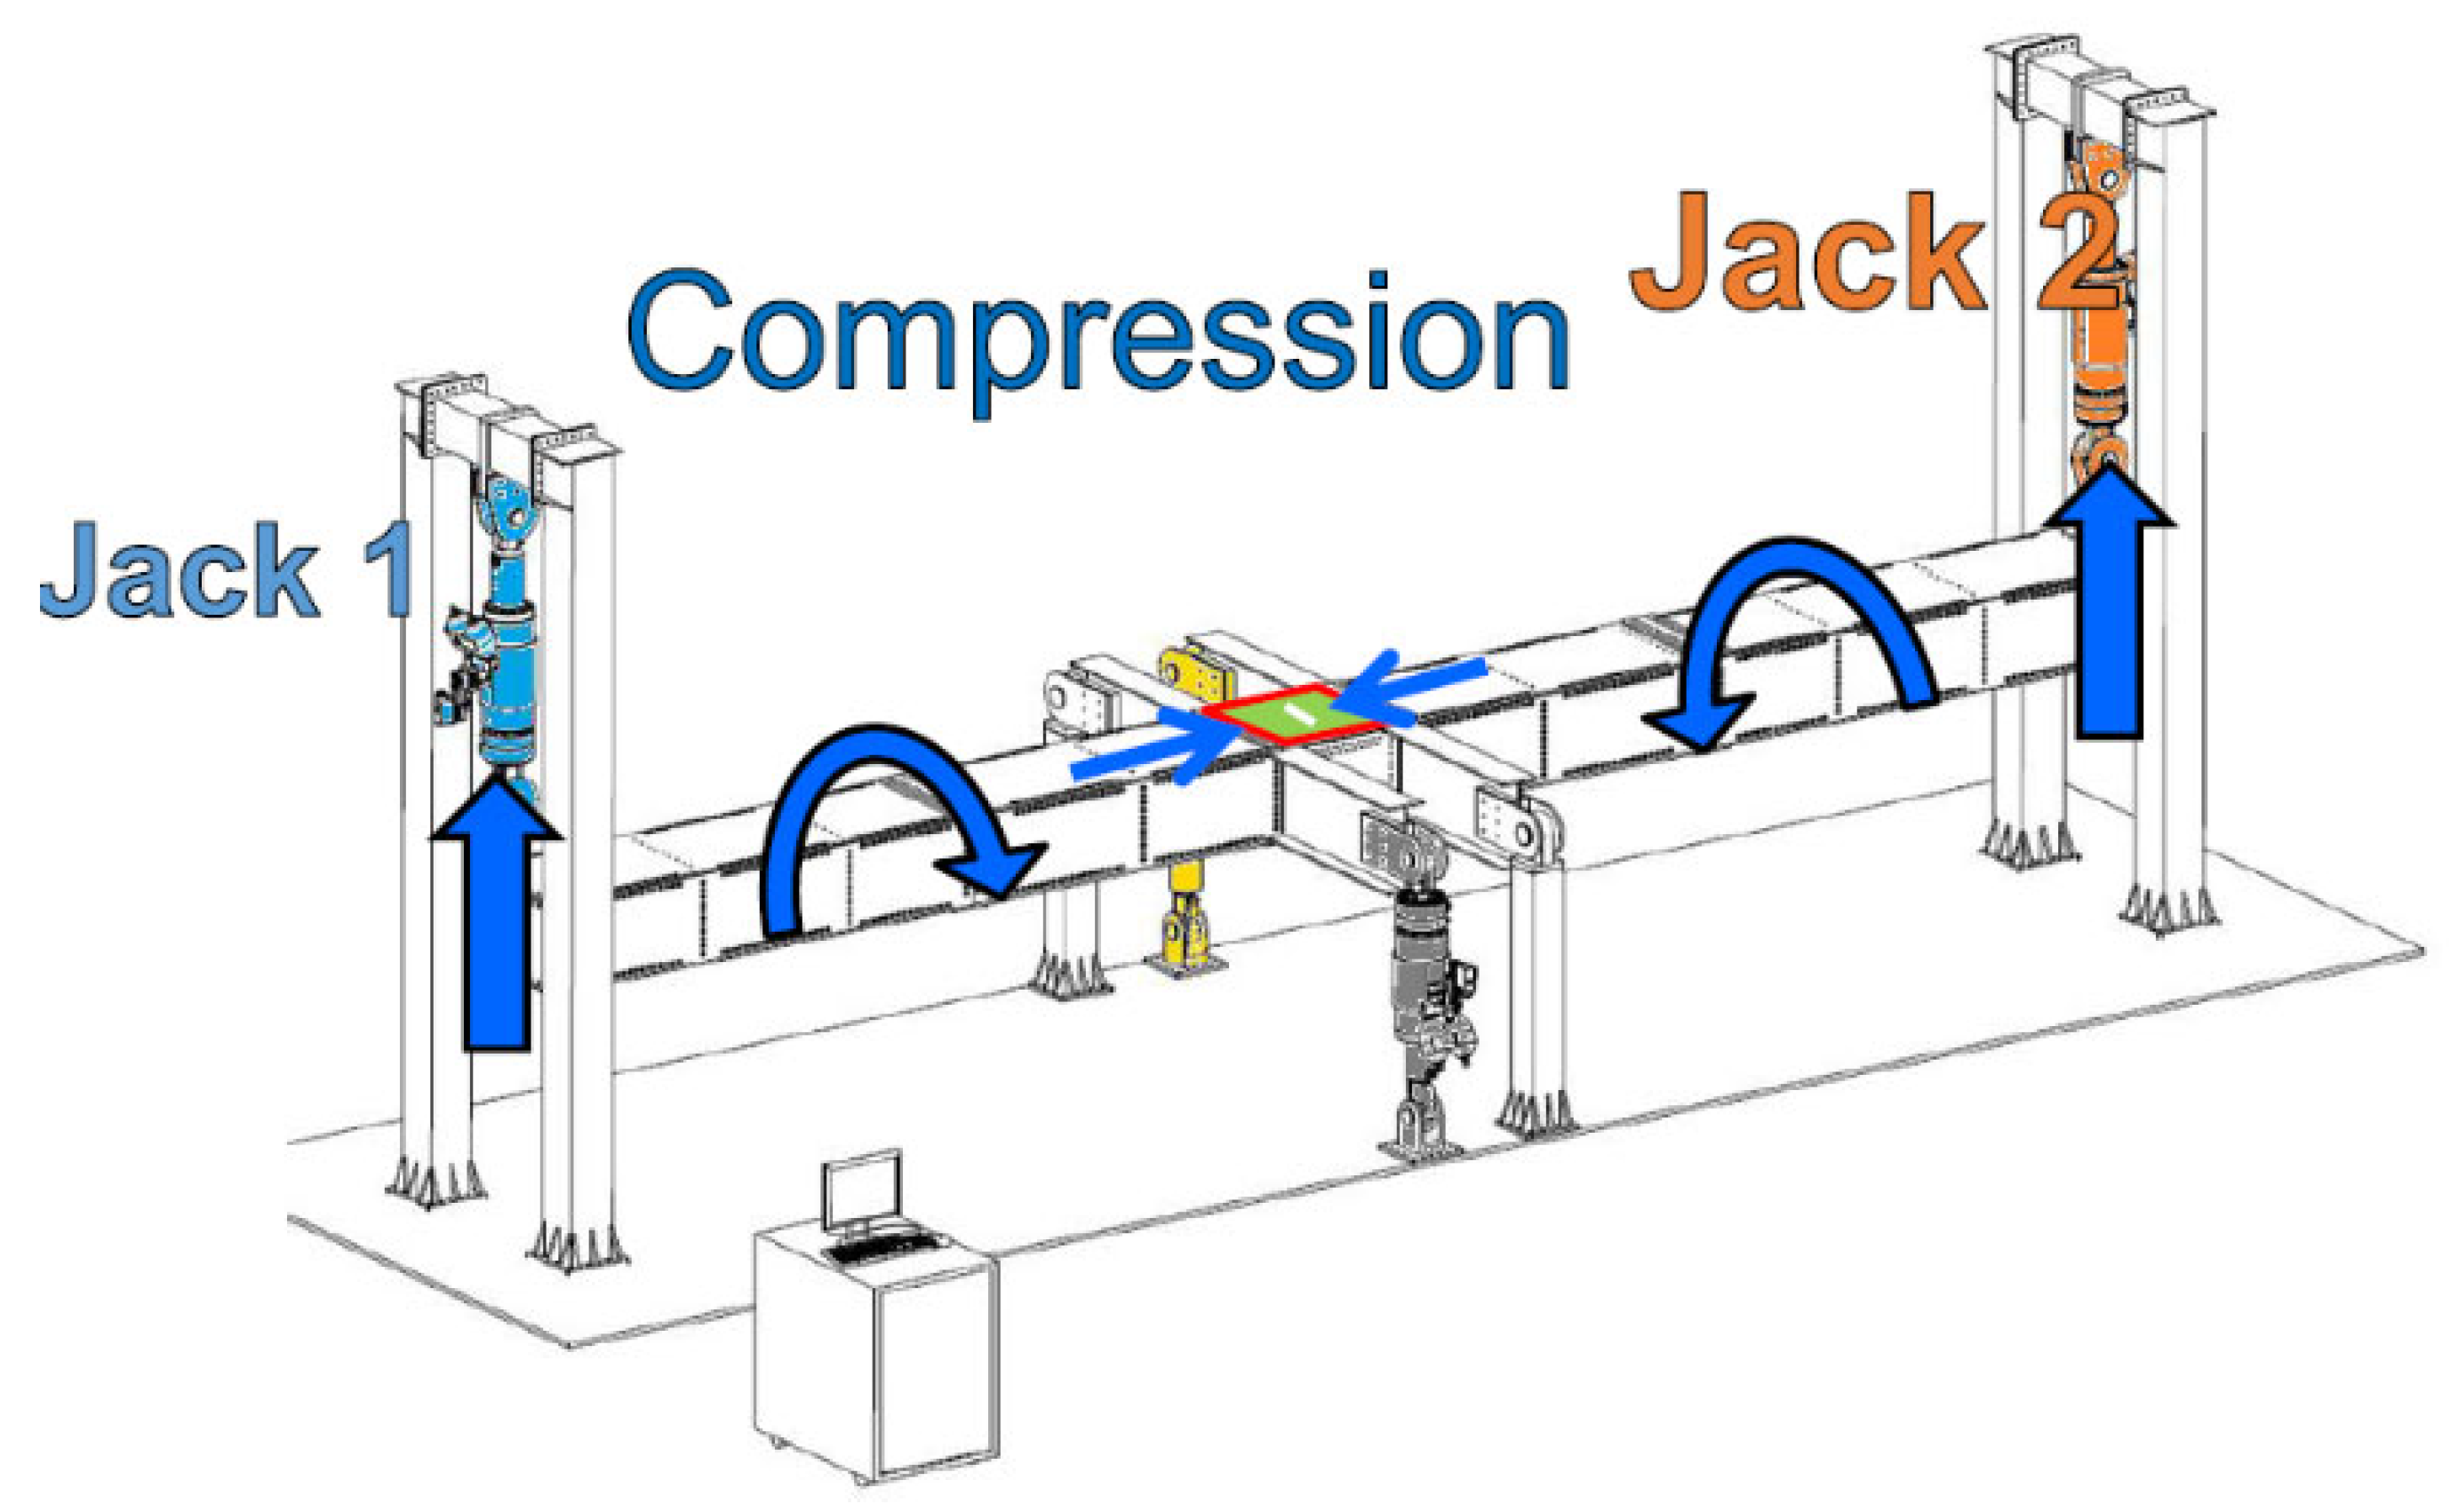
The VERTEX test bench comprises a longitudinal box, two transverse beams with an IPN shape, four jacks, and an internal bladder for adding internal pressure if necessary. The specimens have overall dimensions of 558 × 536 mm2, with a central area of interest measuring 400 × 400 mm2. The specimens are bolted onto the upper part of the central box, which is located between the two IPN transverse beams, using 128 bolts (see Figure 3 and Figure 4, which show the specimen in green, and Figure 5). The actuators can exert compressive, tensile, and shear forces on the plate bolted to the upper side of the central box of the test bench via their up-and-down displacements ([40,41,42,43,44], Figure 4 and Figure 5).

3.2. Test Monitoring

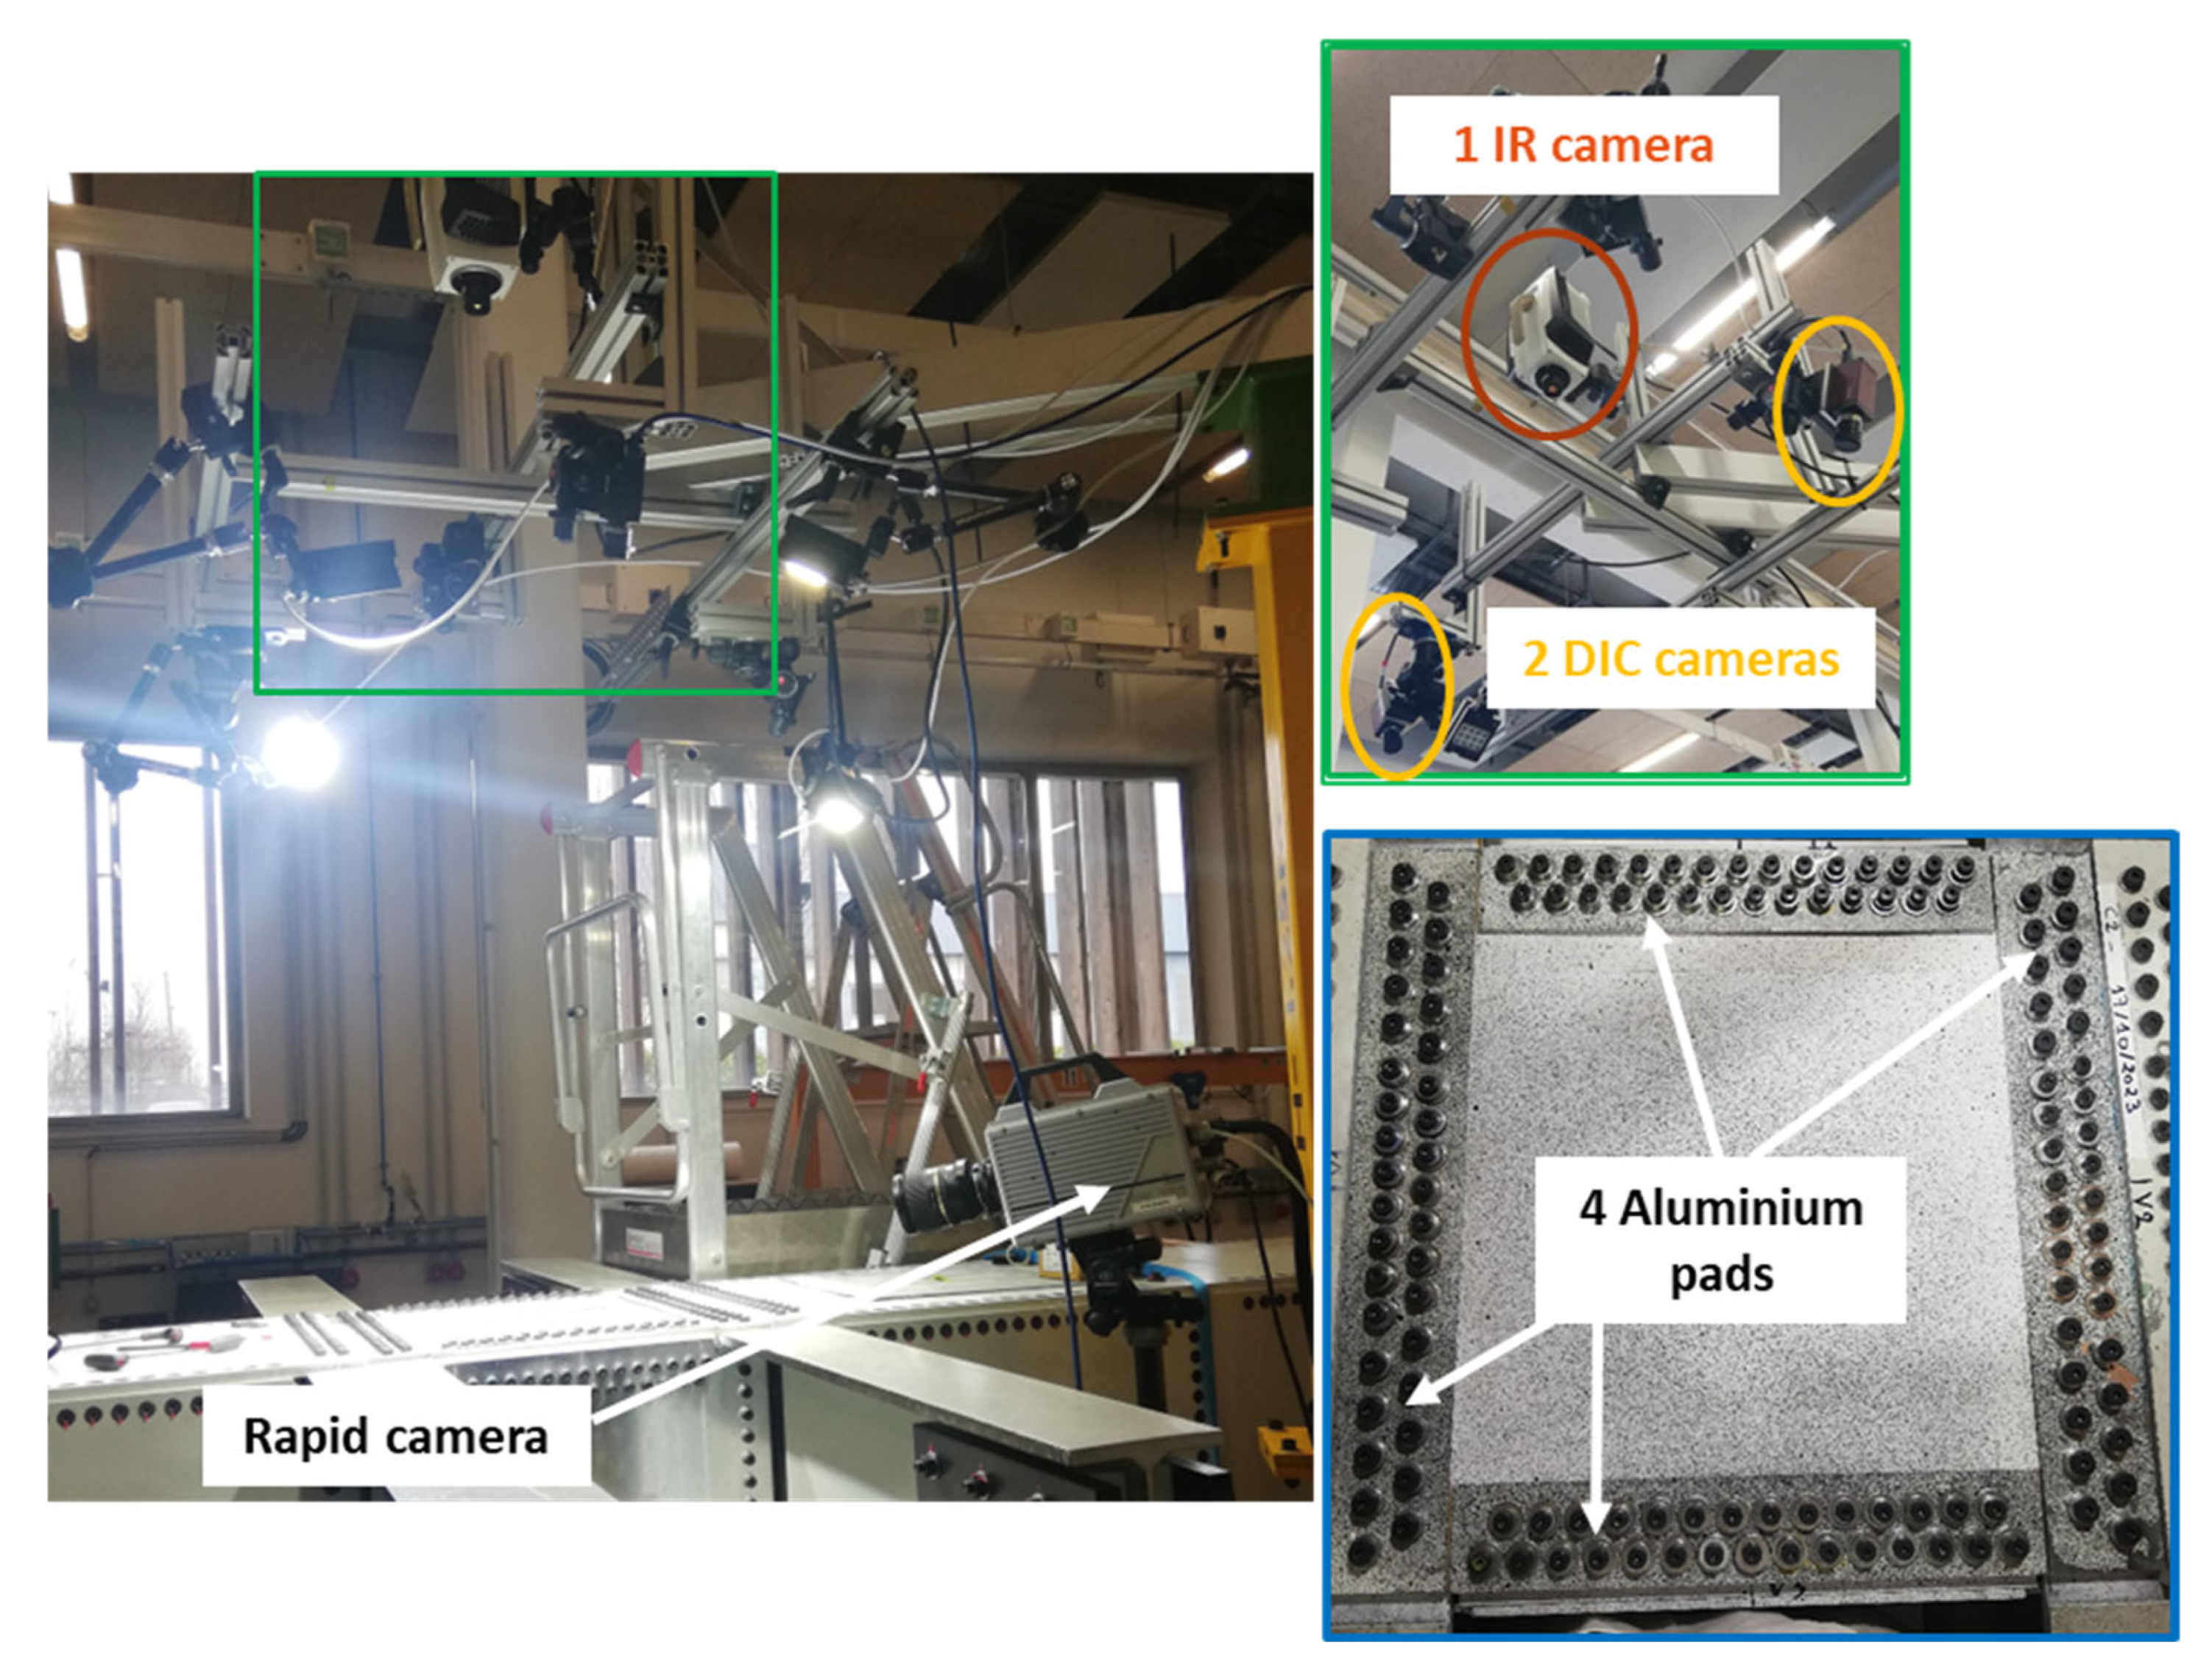
All plate deformations are tracked by three types of monitoring systems, as shown in Figure 5. The first type of tracking is provided by a stereo digital image correlation system comprising two optical cameras set up to record one image every two seconds. This system captures the in-plane and out-of-plane displacement of the plate and requires a speckle pattern on its top surface to perform properly. First, a coat of matt white paint is applied. This is followed by spotting with matt black paint. It should be noted that the Vic-Snap software synchronises the recording of images with the movement of the jacks and the application of forces.
The second type of monitoring uses an infrared (IR) camera. This camera detects changes in the temperature field on the plate, which may indicate delamination or fracture. As a result, the first damaged areas of the plate can be identified and the failure scenario traced and analysed. The IR camera is also synchronised with the stereo correlation and the VERTEX machine to link the events detected by the IR camera to the corresponding force fluxes and deformations.
The third type of monitoring is provided by a high-speed camera. The camera’s field of view is angled between 15 and 30° above the specimen’s top plane to capture its 3D shape (see Figure 6). Unlike the other two types of monitoring, the high-speed camera is not used for continuous monitoring of the entire test. Instead, it records data via a buffering system that temporarily stores a few seconds of video information. When a fracture is heard or a break is seen with the IR camera, the buffering of the high-speed camera is triggered. This leads to a recording of a 3.21-s time sequence preceding the click, at an acquisition frequency of 7000 frames per second. The 3D shape of the failure events is therefore captured. Once all the tracking systems are in place, the plate is fixed to the test bench. Aluminium pads (shown in Figure 5) are placed between the wooden plate and the screws.

3.3. DIC and Data Reduction Methods

As for plate strain and stress, digital image correlation (DIC) is applied to each recorded image using the VIC-3D® software package version Vic 3D-8. The software uses the first image taken (at the beginning of the test) as a reference image. A calculation zone corresponding to the centre of the plate is then defined in this image. This calculation zone is then divided into rectangular subsets, each of which contains three to four speckles. Displacement of the plate (i.e., movement of the speckles) encountered in subsequent images (during the test) is calculated using the speckle pixel offset from the reference image. Using this procedure, the strains of the panel in the loading plane (the xy plane) can be calculated from the displacements of the speckles: ε x x , ε x y , and ε y y .
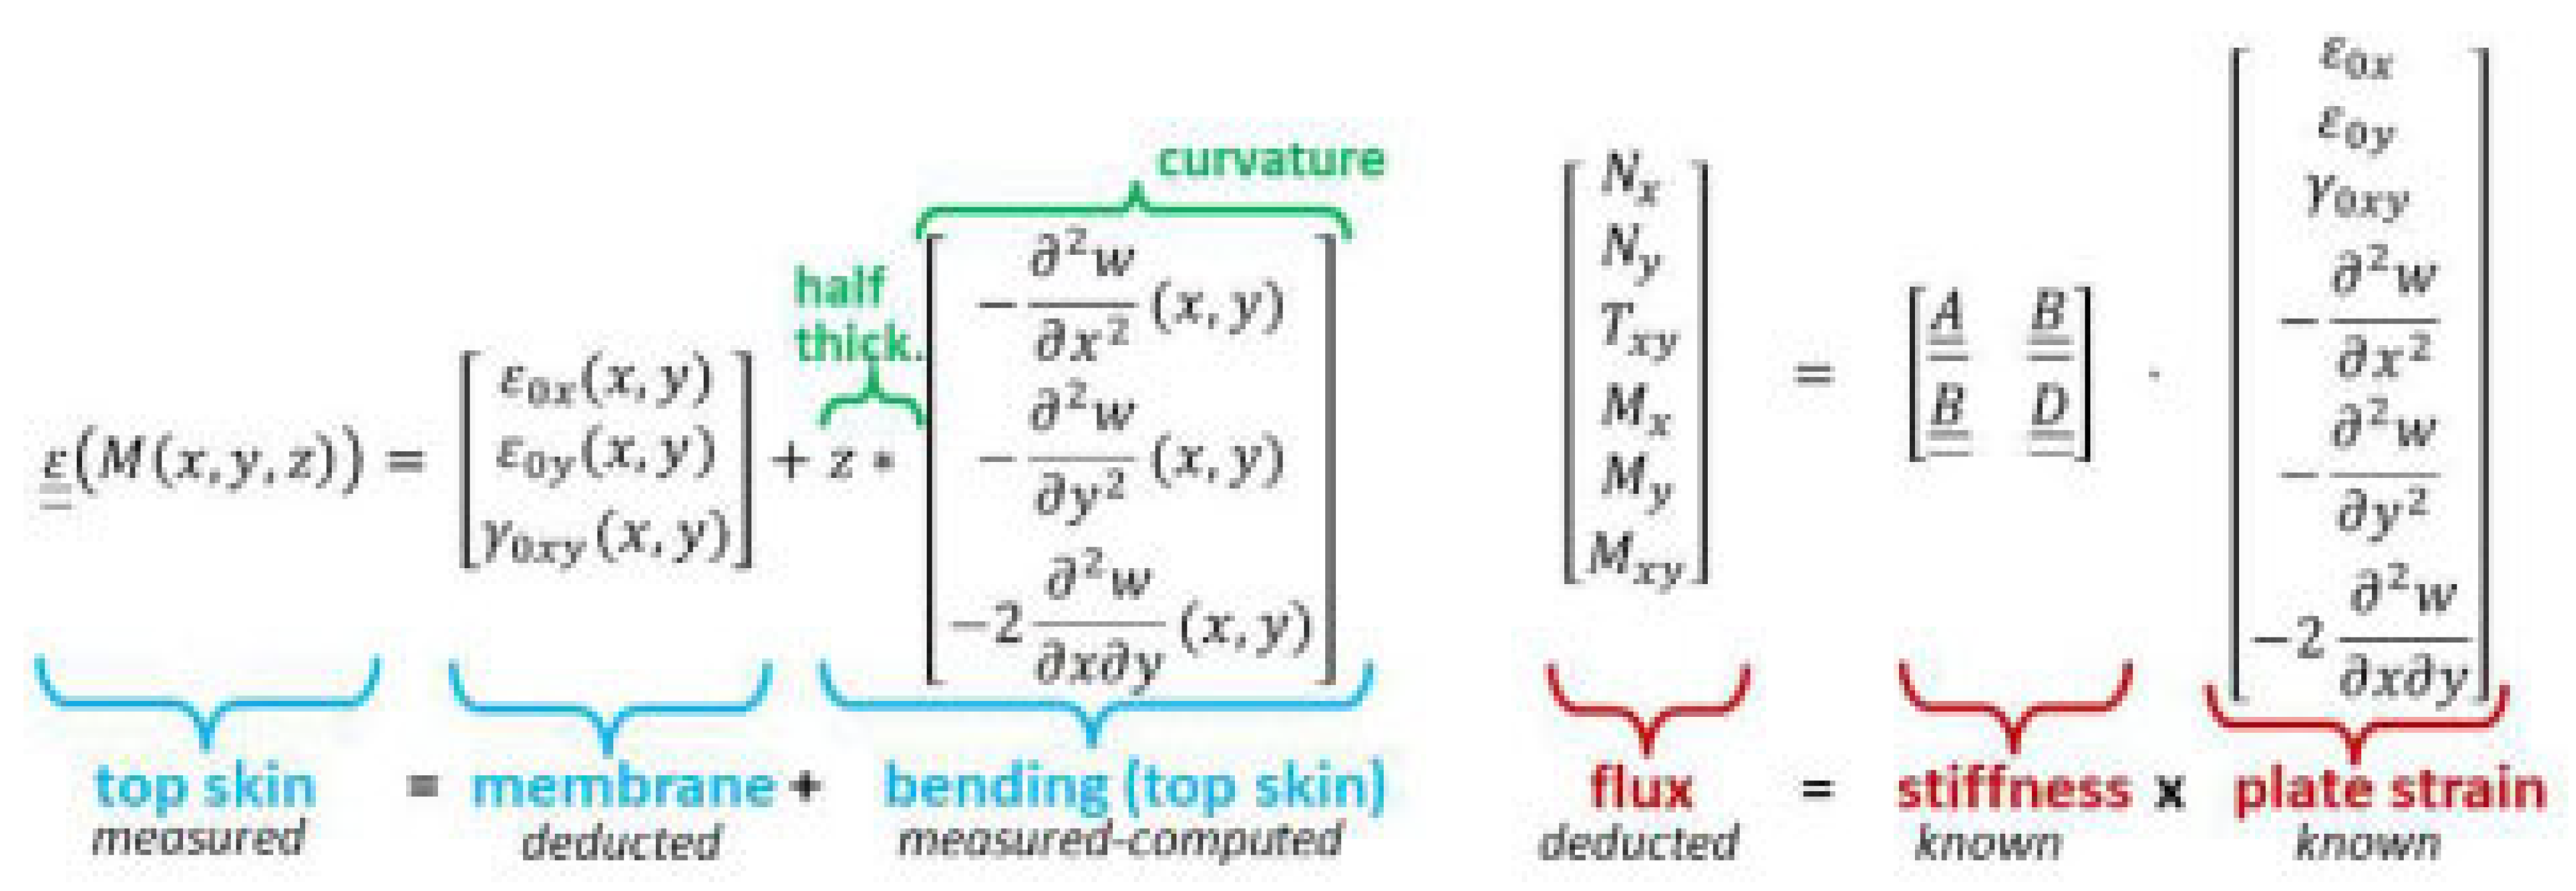
The detailed computation of stress fluxes in the specimens can be found in references [40,41,42,43,44]. Knowledge of the upper skin strains and curvatures, as calculated by DIC, makes it possible to determine the force and moment fluxes (N and M) by solving the following system of equations, adapted for our specimens (see Figure 7).

3.4. Virtual Test

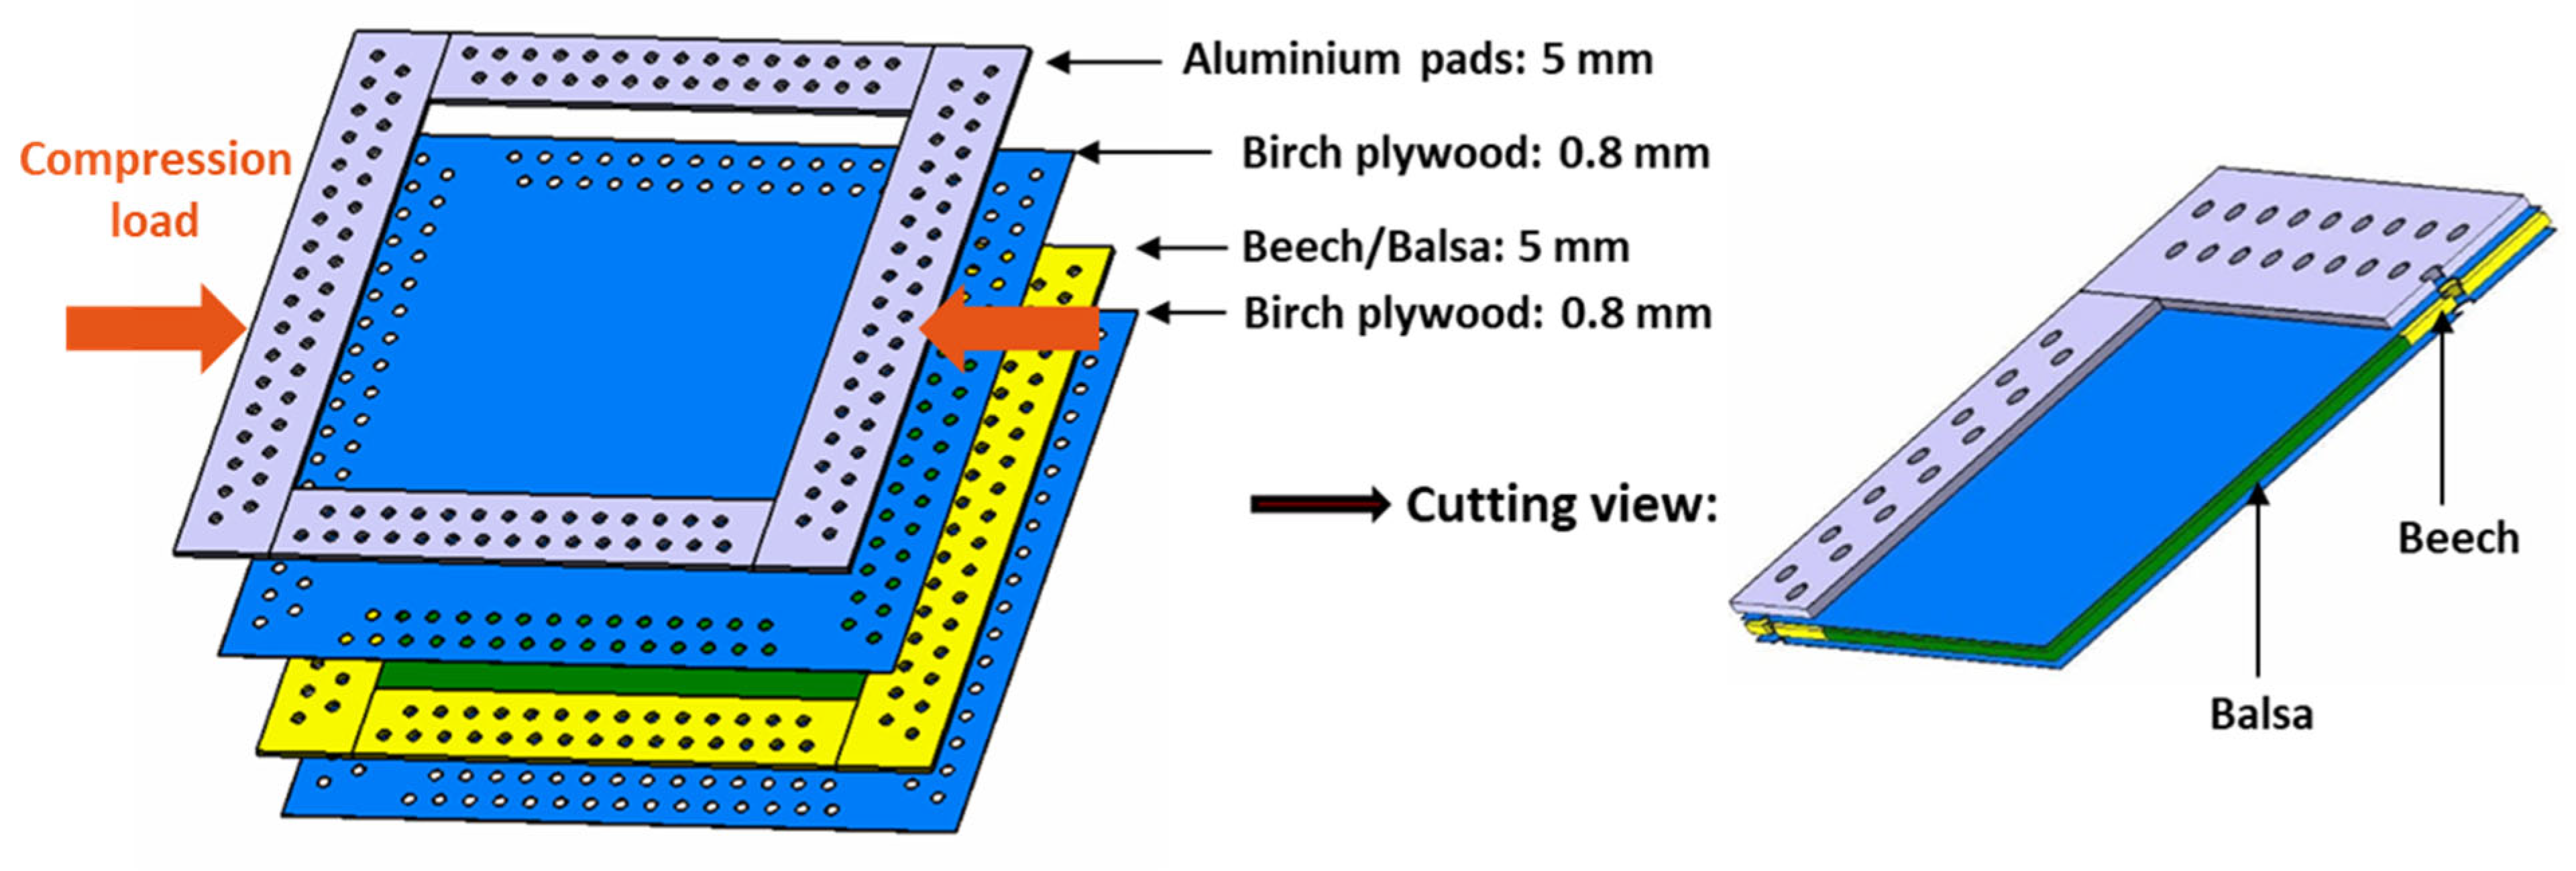
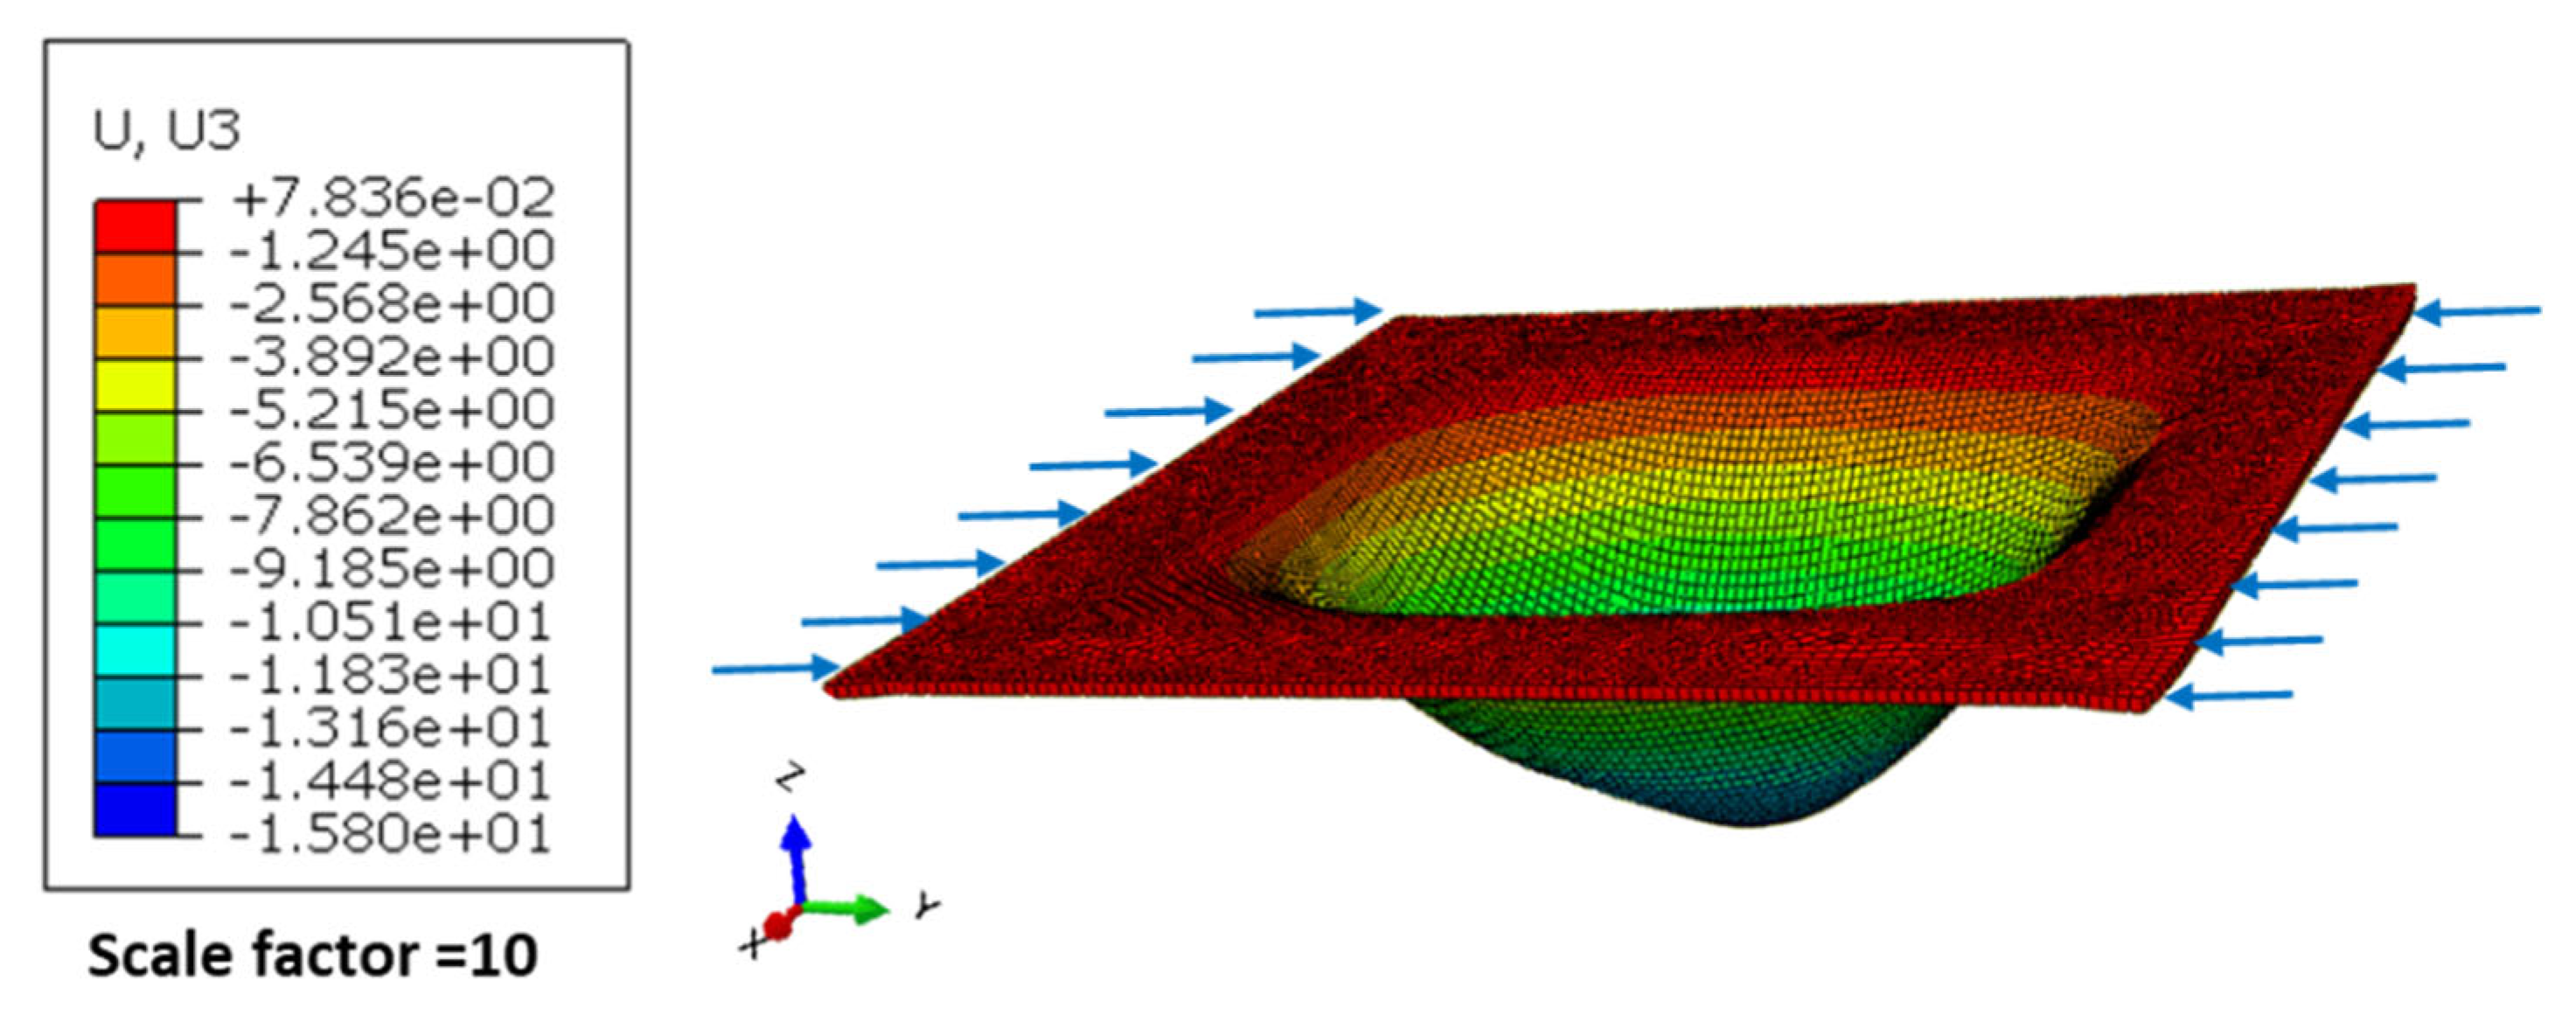
A pre-test finite element simulation was performed to predict the buckling shape of the plate. It was important to ensure that the plate bent downwards so that the cameras set up above the plate could detect displacements across the entire surface. The simulation also made it possible to determine the range of compressive loads to be applied to the specimen, and thus to adapt the actuator displacements during the test execution. This modelling is based on a previous finite element model of the entire VERTEX bench [41]. This numerical model incorporates the entire VERTEX machine and specimen. The structural parts of VERTEX were modelled using Abaqus shell and beam elements from the real dimensions of the test rig. The specimen was modelled using Abaqus thick shell elements (SC8R: quadrilateral continuum shell element). The bolted joints between the elements were modelled using coupling connectors with axial and radial stiffness. The compression load on the plate was applied by moving the two jacks of the VERTEX machine. Each jack was modelled with a truss element, then its temperature was controlled to dilate the initial length. A virtual coefficient of thermal expansion was defined so that a + 1 °C temperature rise caused a + 1 mm dilatation [41]. The wood specimen model was created by defining the properties of each ply (skin or core) in a composite lay-up. Due to the reinforcement area, two types of composite lay-up were defined. The first lay-up (birch plywood/beech core/birch plywood) was assigned to the mesh elements at the edges of the specimen. The second (birch plywood/balsa core/birch plywood) was assigned to the central area of the panel (Figure 8).
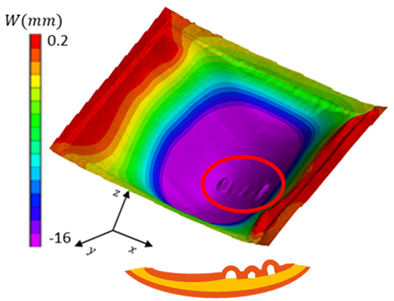
The numerical model incorporated the material properties of the skins and cores, including the orthotropic properties of the wooden materials supplied by Avions Mauboussin, which cannot be provided here. Figure 9 shows an example of out-of-plane displacement and buckling shape predictions for the wood sandwich panel using the developed finite element model. The finite element model made it possible to confirm that the bending was applied so that the upper skin (the one visible to the cameras) was under compression and the loads required were within the limitations of the jacks.

4. Results and Discussion

4.1. Overall Behaviour

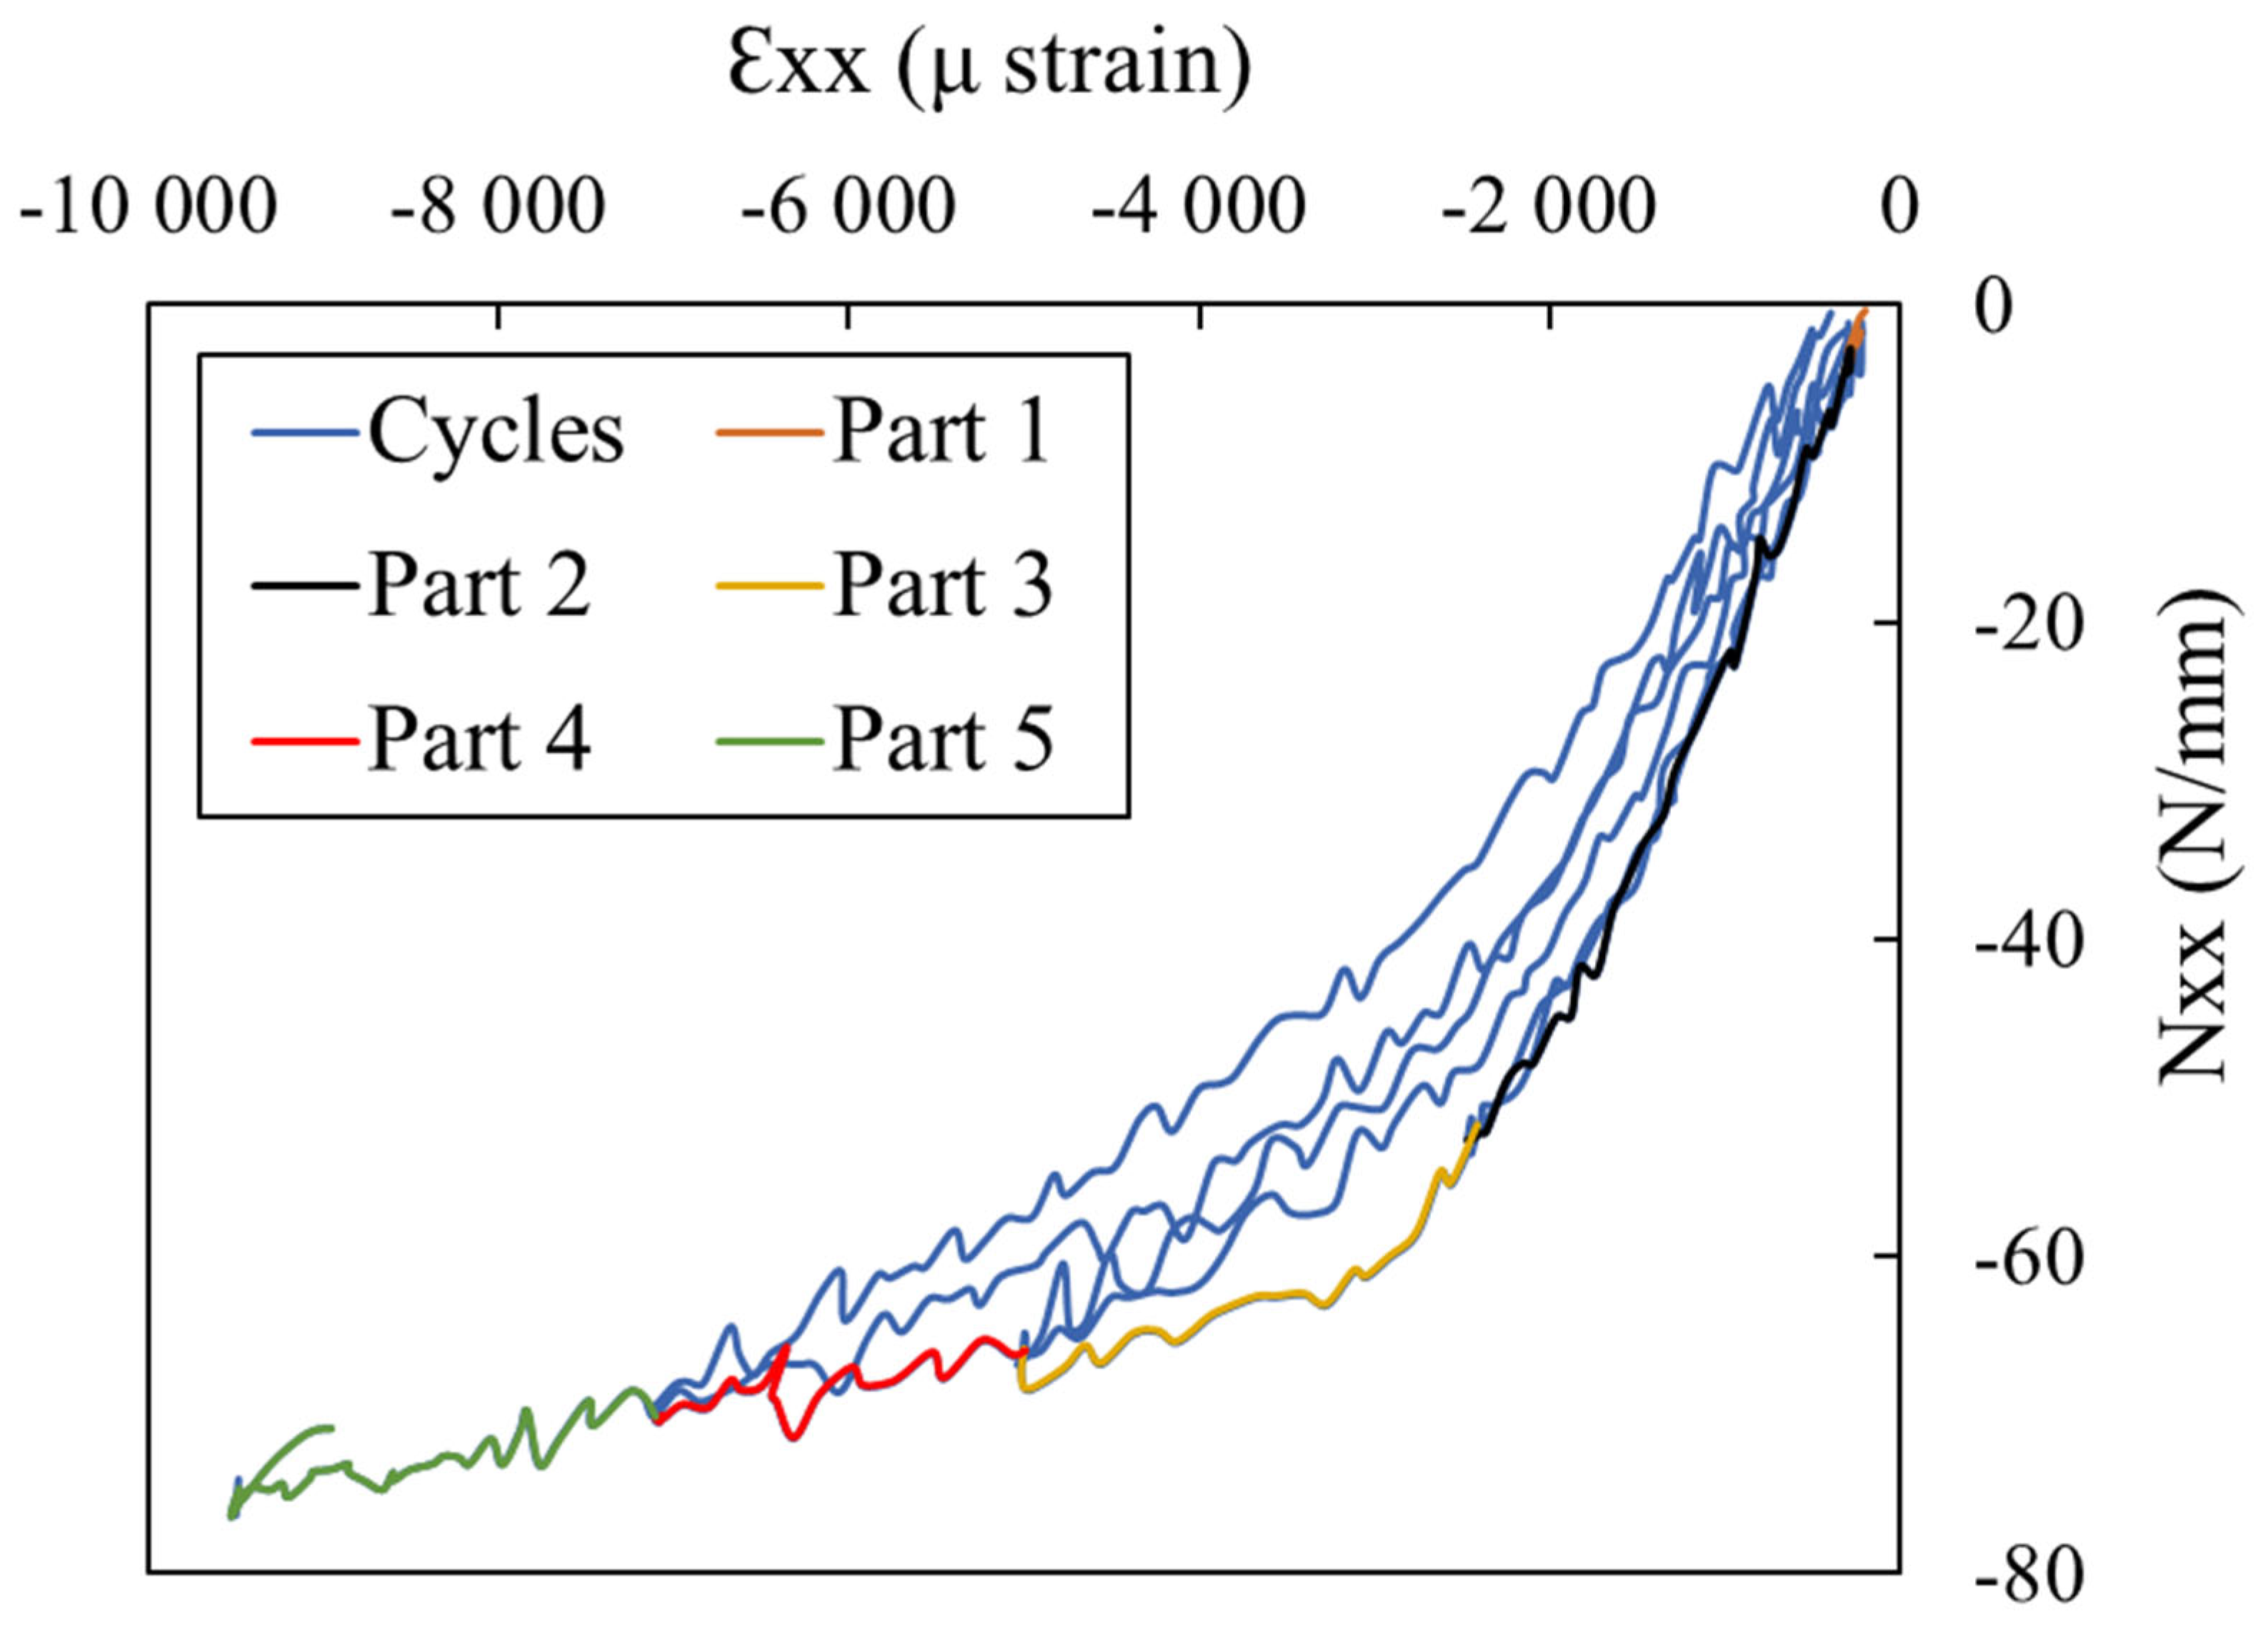
Using stereo DIC on the upper surface of the plate during the test allowed plane deformations and stresses to be calculated, providing an indication of the plate’s overall behaviour N x x = f ( ε x x ) . The infrared camera was used to capture complex behaviour such as core failure. However, delamination does not release enough energy to be detected by the thermal camera at this distance; therefore, the plate was exposed to an external lamp at different times during the test to heat it up and enable the delaminated area to evolve (from the unglued initial surfaces) so that it could be detected through a difference in conducted heat. For this reason, load–unload cycles were applied to test the plate. Unfortunately, our method did not yield sufficiently accurate resolution to quantitatively assess delaminated area evolution. The main advantage was gaining knowledge of the internal arrangement of the sandwich structures. The compression test on the VERTEX bench was carried out as follows: First, the plate was tightened with screws along its four edges, and then it was exposed to the external lamp for 10 s. The thermal camera then detected the energy released by the plate and revealed the initial configuration of the balsa. Second, a short load cycle was applied, the test was stopped, the plate was unloaded, and a second exposure to the lamp was carried out. This procedure was repeated throughout the test until the plate failed. Therefore, compression force was applied in load–unload cycles. Figure 10 shows an example of how compression load flux evolved as strain increased for plate P1. Five load–unload cycles were applied to the plate and the final N x x = f ( ε x x ) curve was obtained by combining the new load portions of each cycle that had not been applied in the previous cycle.
After calculating the plane deformations of the plate using DIC, the loading fluxes were determined by applying the equation shown in Figure 7. Figure 11 shows how the fluxes N x x , N y y , and T x y changed over time for the intact plate P1. As expected, the N x x flux is the highest since it is the load flux in the compression direction. The shear flux T x y is almost zero, indicating that there is no shear in the plate. The load flux N y y in the direction perpendicular to the compressive loading is not zero, but also not as great as the flux in the loading direction; this results from the reaction with the central box. Figure 12 shows the curve depicting the evolution of the load flux in the compression direction. A change in slope occurs at point B, which marks the end of the linear domain and the onset of plate buckling. Therefore, the load at this point can be determined and is subsequently referred to as the critical buckling load.
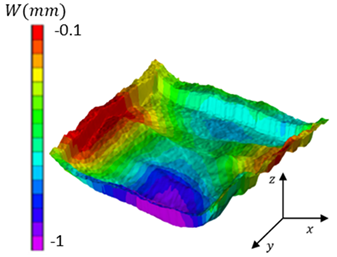
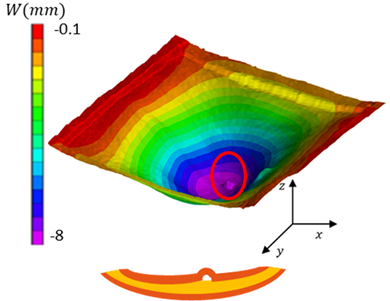
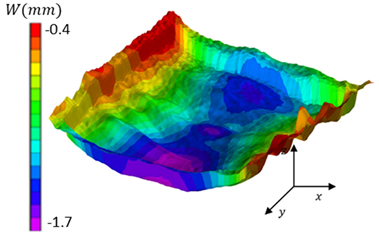
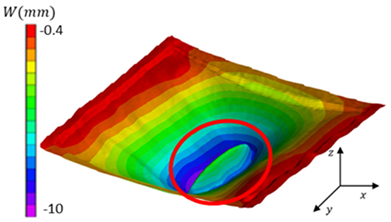
Table 1 shows the amplified 3D deformed shapes obtained by digital image correlation (DIC) of plate P1 and its out-of-plane displacement at selected stages during the test. These stages were chosen because they represent changes in the plate’s behaviour. Four characteristic points were selected during the compression tests (see Figure 13). The first point, labelled “I”, and the last point, labelled “F”, represent the initial and final states of the test, respectively. Point I corresponds to the stage at which the plate was tightened by the screws on the bench before the load was applied. Point F corresponds to the final load applied in the test. Point B, the critical buckling point, corresponds to the change in slope on the N x x = f ε x x curve, as previously explained. Point D indicates the start of the top layer of the plate debonding upwards in the opposite direction to the rest of the plate. As can be seen at point I, the plate initially experienced a maximum out-of-plane downward displacement of 1 mm around the clamped edges, due to the force applied by the screws during clamping. At the critical buckling point B, the negative deformation of the plate indicated that it was buckling downwards, with the maximum displacement caused by buckling at the centre of the plate (w) reaching 2 mm.
Another phenomenon observed during the test was the localised upward buckling of the top ply of the wood sandwich plate, indicating that the skin moved upwards in certain areas, in contrast to the rest of the plate, which buckled downwards. Notably, this buckling remained very localised, did not propagate instantaneously, and did not result in the overall failure of the panel, as observed in [37,38]. Due to the high stiffness modulus of the balsa core, this is probably local debonding rather than wrinkling. Furthermore, due to the curvature, out-of-plane tensile stresses were applied to the core/skin interface on this side of the panel. This local debonding occurred after the critical buckling point, as shown in Figure 13 for plate P1. Indeed, no local buckling was detected from the start of the test to point B at a strain of −2000 µstrain. From a deformation of −4650 µstrain, this local buckling began to appear. The same was observed for all five of the other tested plates, confirming that local debonding occurred after the critical buckling point. Furthermore, referring to the N x x = f ε x x curve depicted in Figure 13, the N x x flux continued to increase as deformation increased, even after local debonding occurred at point D. This confirmed that local debonding had no critical influence on the plate’s overall post-buckling mechanical behaviour.
Table 1 shows the deformed shape of plate P1 at the debonding point (D). As can be seen, the size of the debonding surface is much smaller than the entire upper surface.
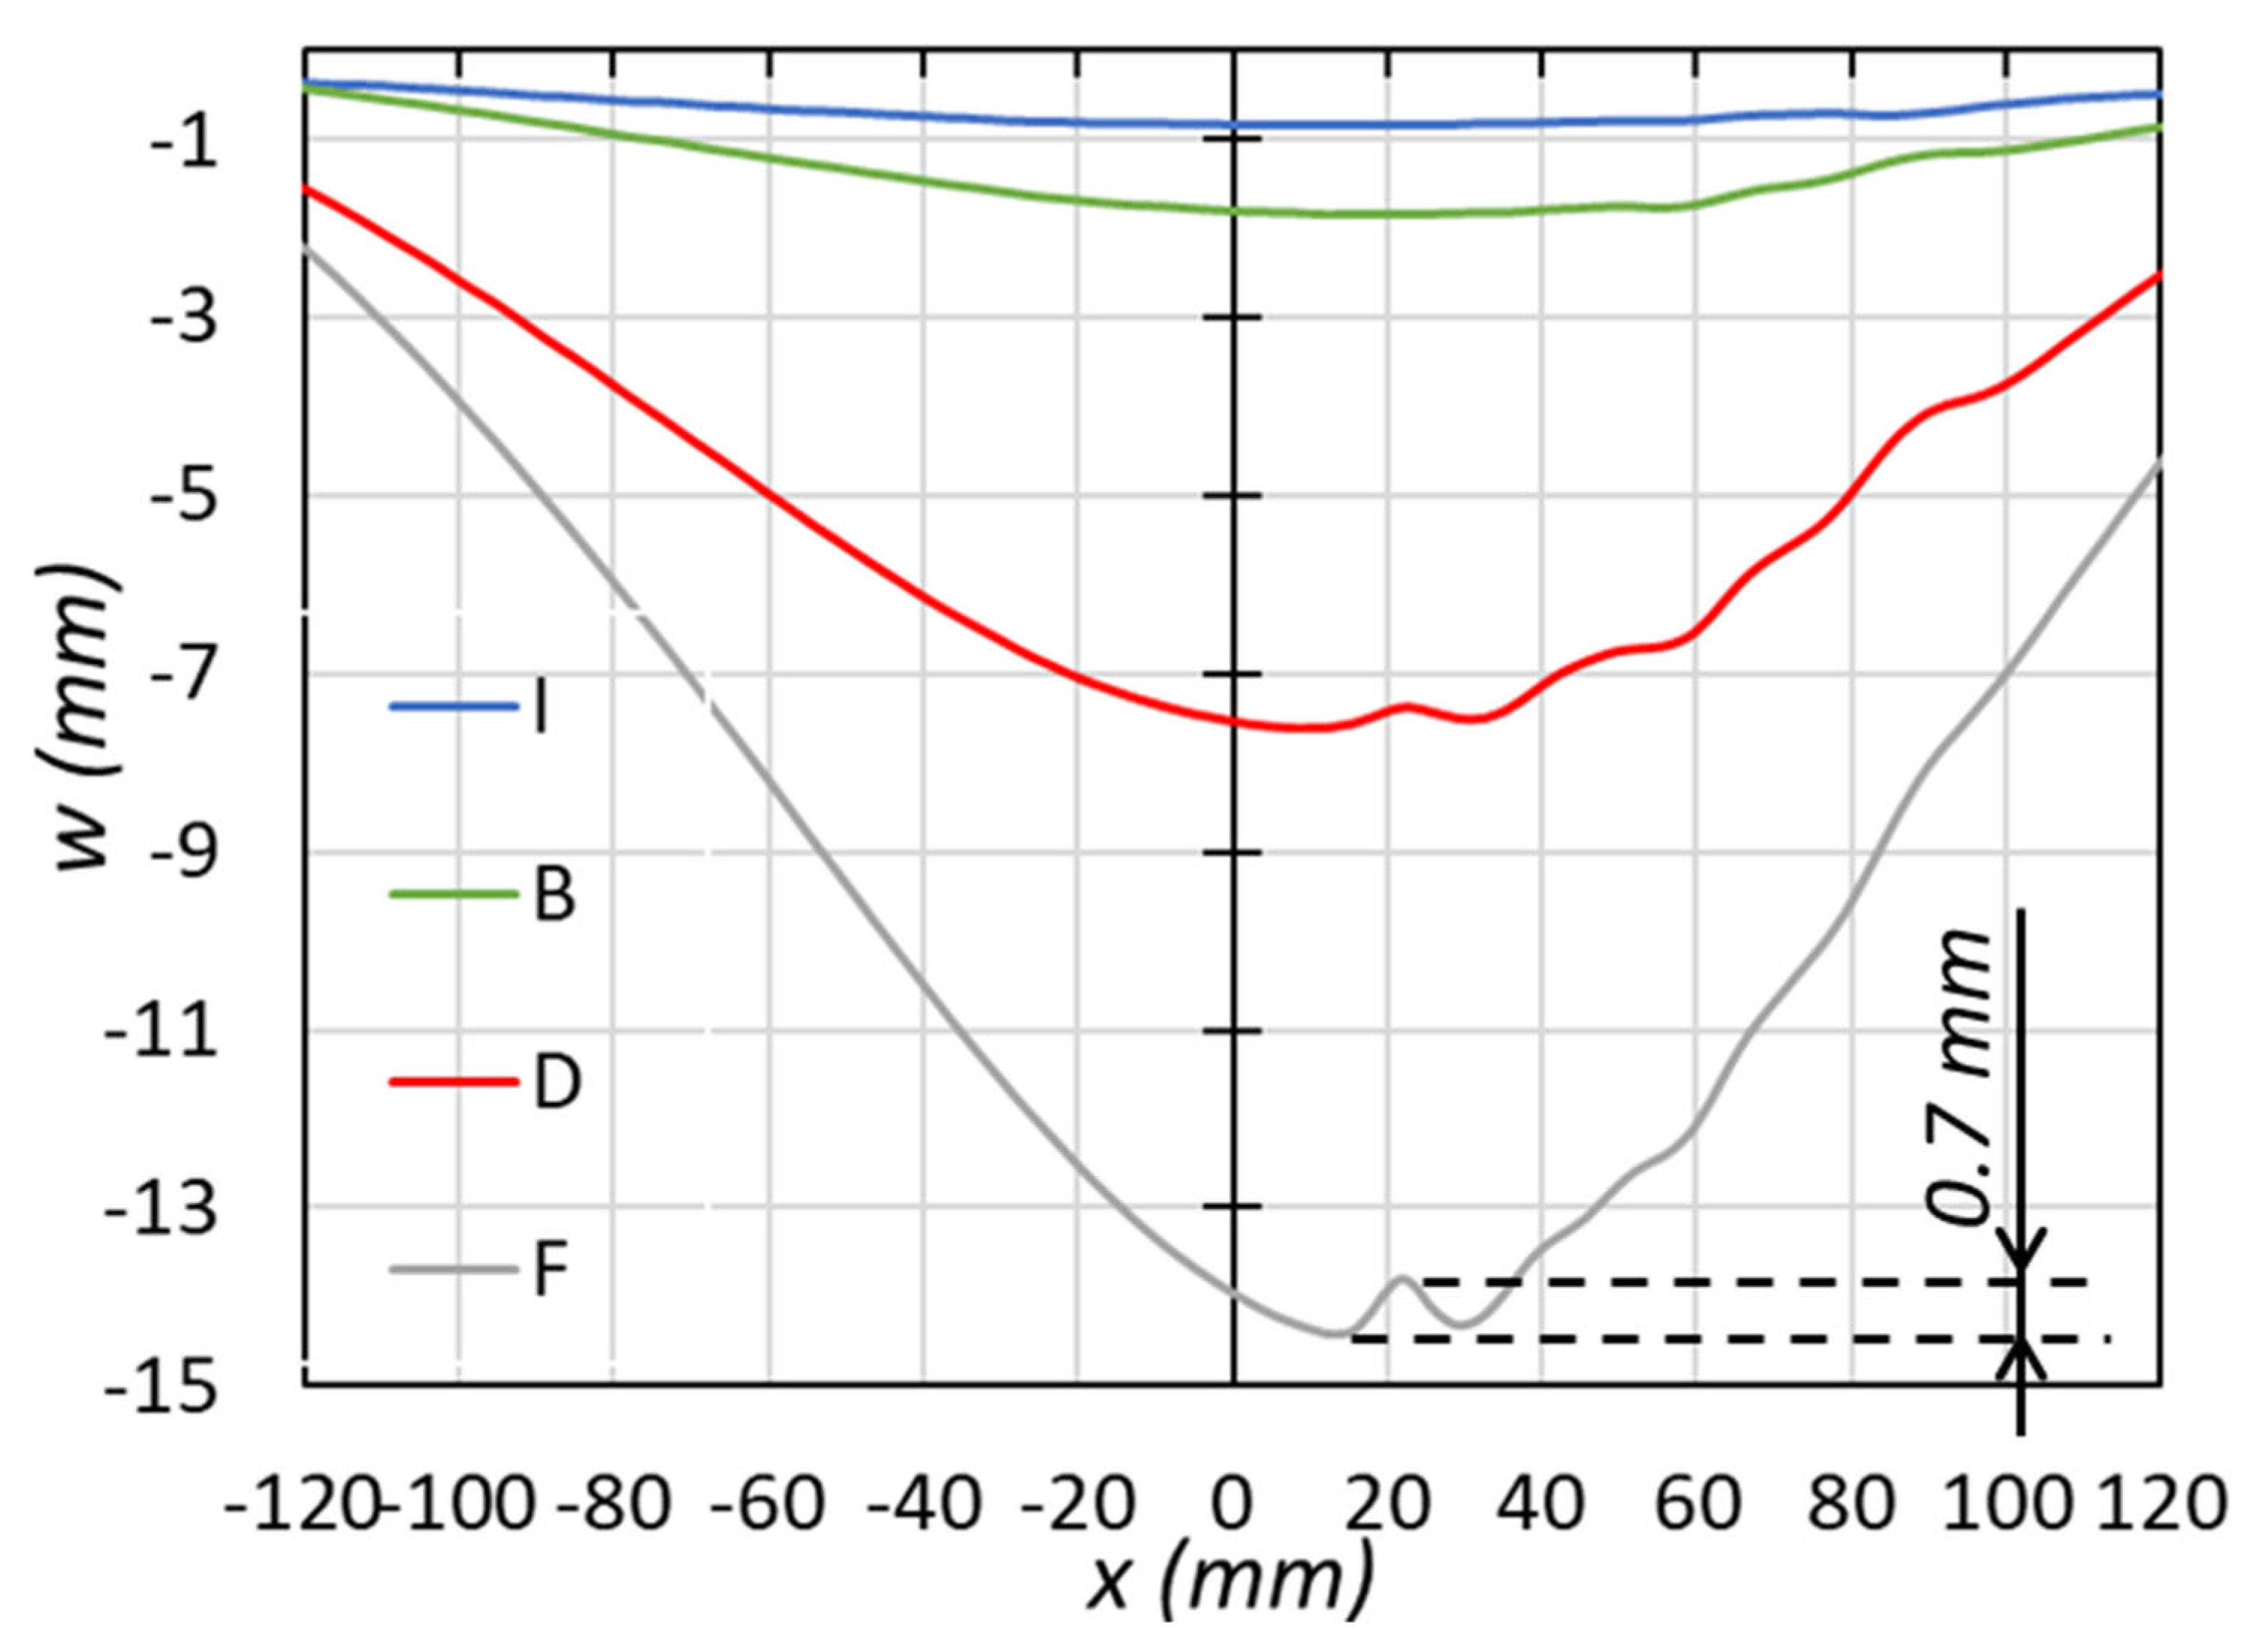
To quantify the out-of-plane displacement at the debonding area in comparison to the overall buckling of the entire plate, DIC was employed using the following method: a line L 0 was drawn through the debonding area, as illustrated in Figure 14. In this figure, the parameter C x x is the curvature, which allows the local upward curvatures extending out from the plate’s global downward curvature to be visualised. Next, the out-of-plane displacement (w) was calculated along this line over all the recorded images, i.e., over the entire test. Figure 15 shows the results obtained for w at the points on L0 for the images corresponding to the characteristic points I, B, D, and F. Up to point B, there was uniform global buckling across the entire width of the plate at line L0. From point D onwards, a small area of upper debonding can be seen that does not follow the global curvature of line L0. The out-of-plane displacement is approximately 0.7 mm, which is 5% of the plate’s maximum out-of-plane displacement and can therefore be neglected. Up to the final point, F, the local debonding continued to expand while remaining negligible compared to the overall out-of-plane displacement. New local debondings continued to appear until the end of the test (curve F), with out-of-plane displacements remaining negligible compared to those of the whole plate.
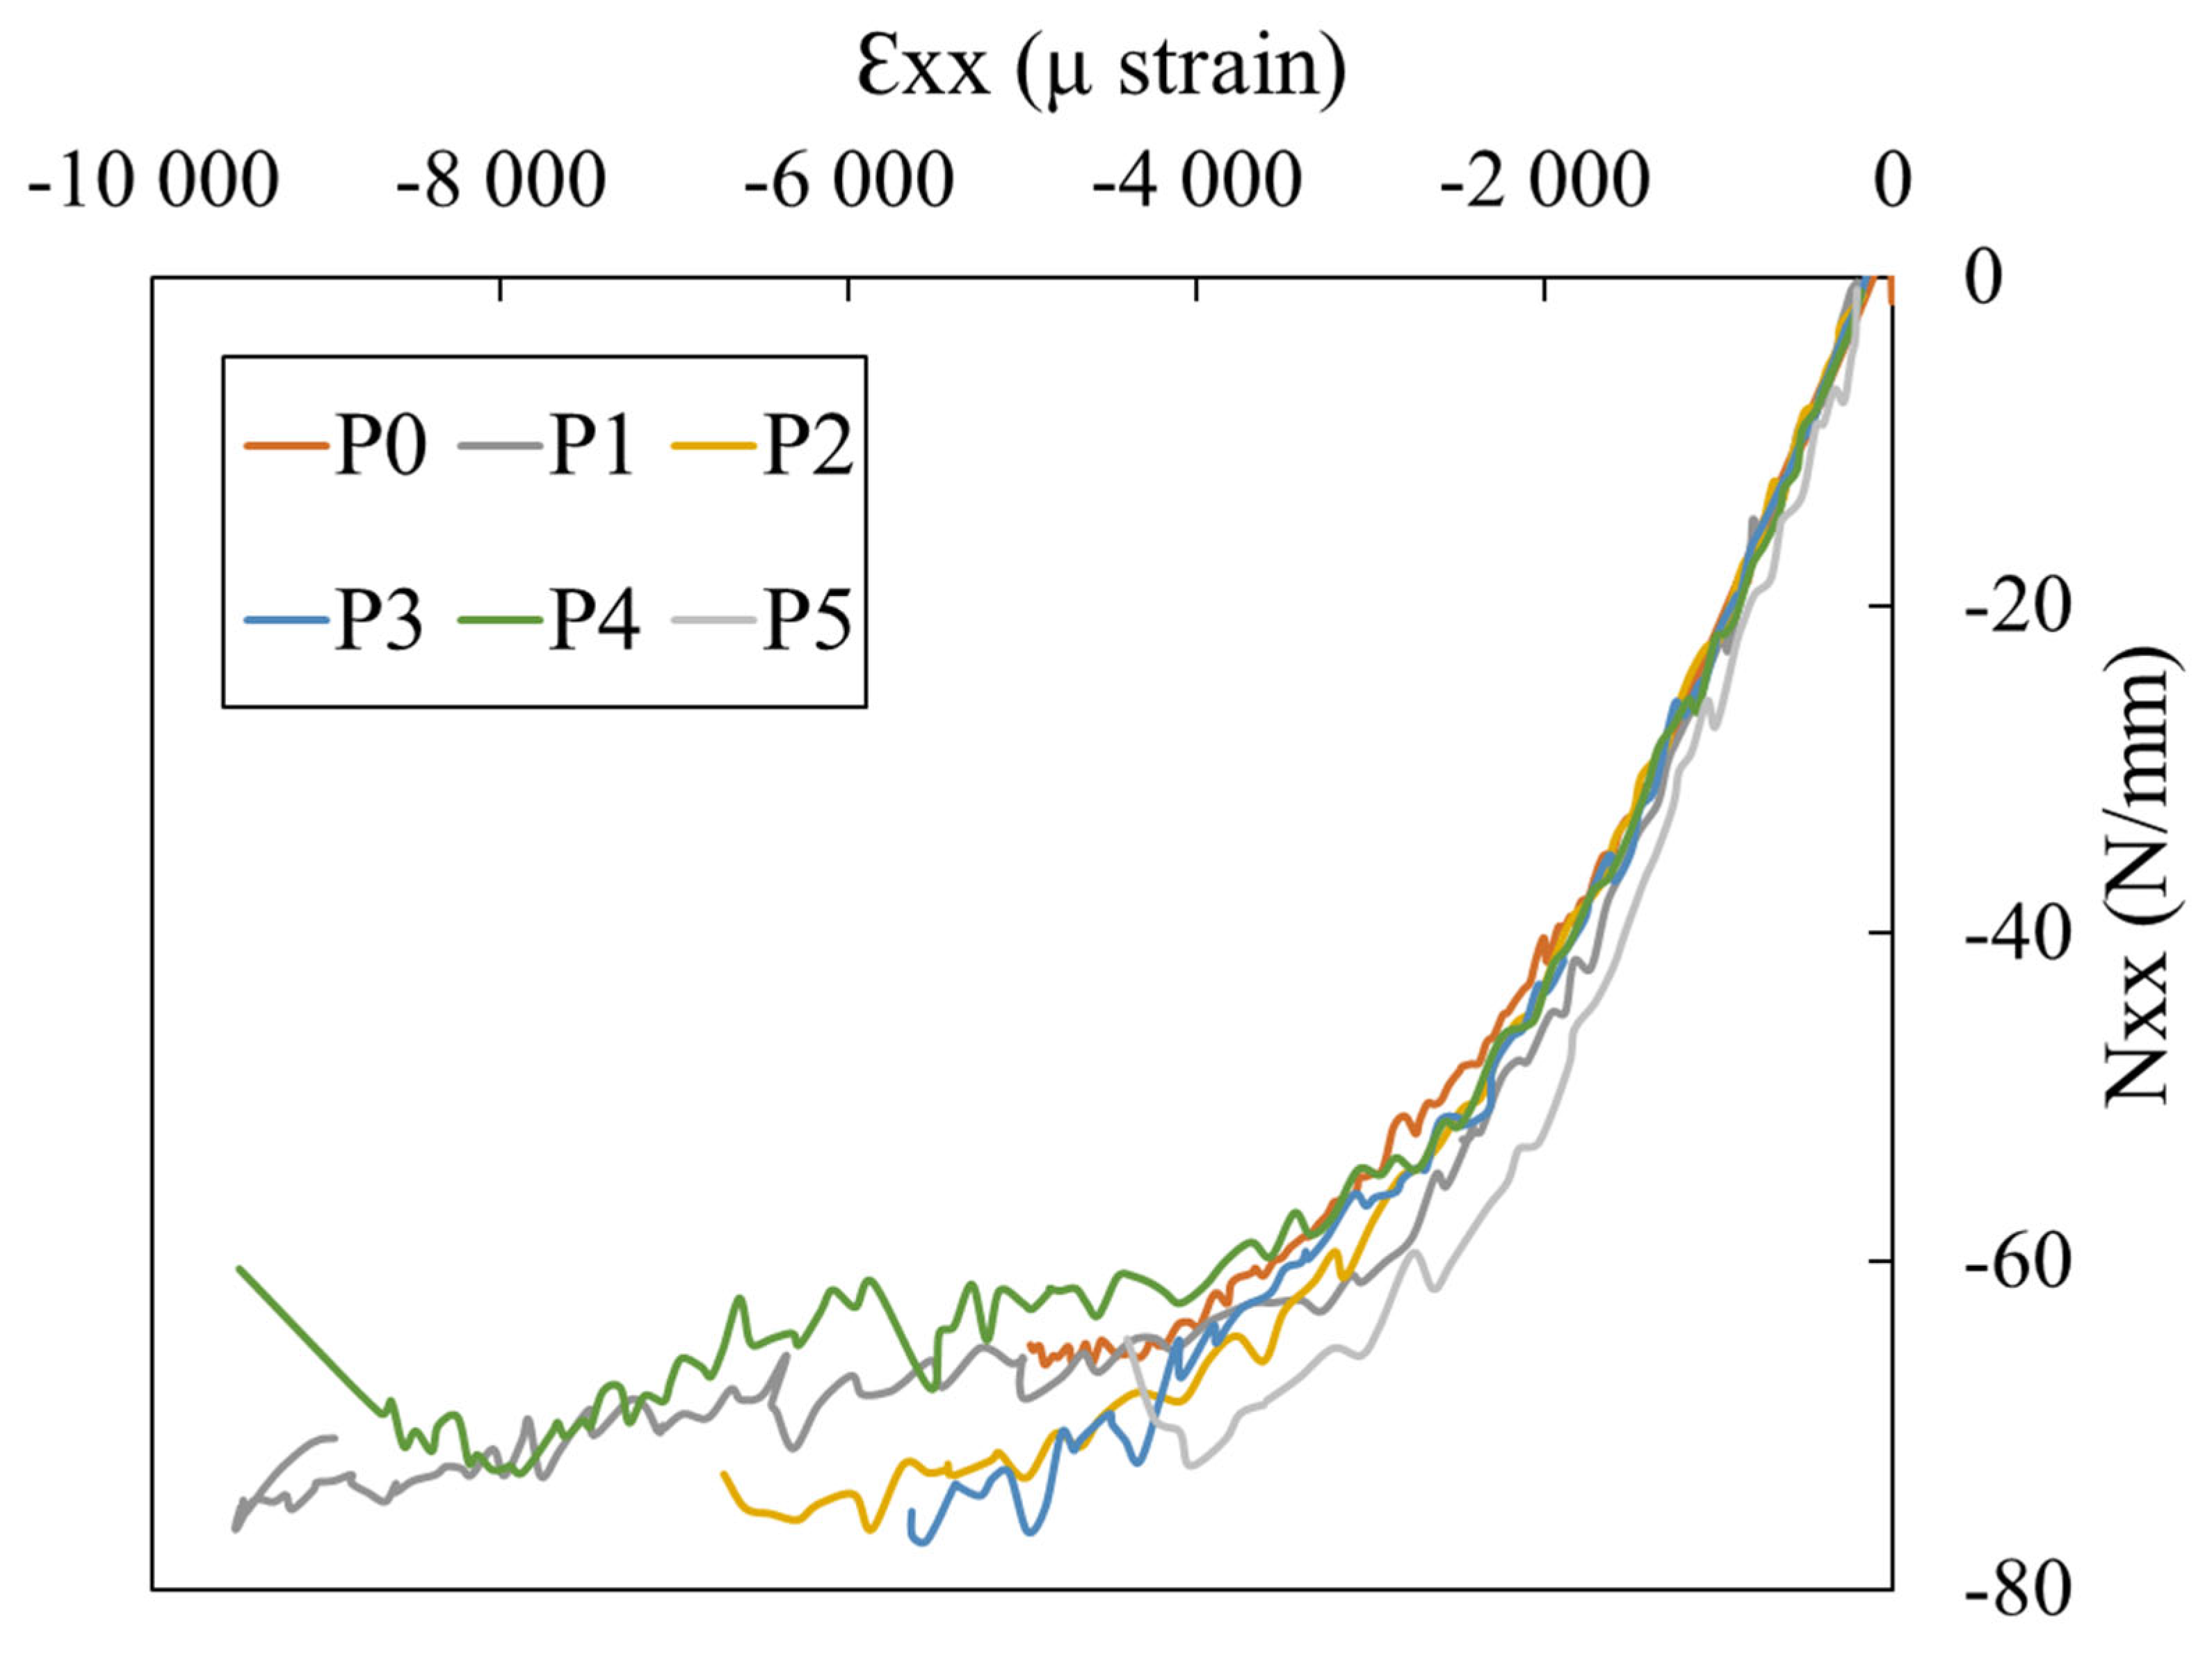
To obtain an accurate value for the critical bending point, six wood sandwich panels were tested and the N x x curves relative to the plate strain ε x x are depicted in Figure 16. On average, the buckling point was approximately −42.33 N/mm at a strain of 1898 µstrain, with low deviation indicating satisfactory test repeatability (see Table 2), particularly for highly variable materials such as wood. Similar to plate P1, local debonding (point D) occurred after the critical buckling point (B), as can be seen in Table 2.

4.2. Influence of a Debonding Manufacturing Defect on the Buckling of Wood Sandwich Panels

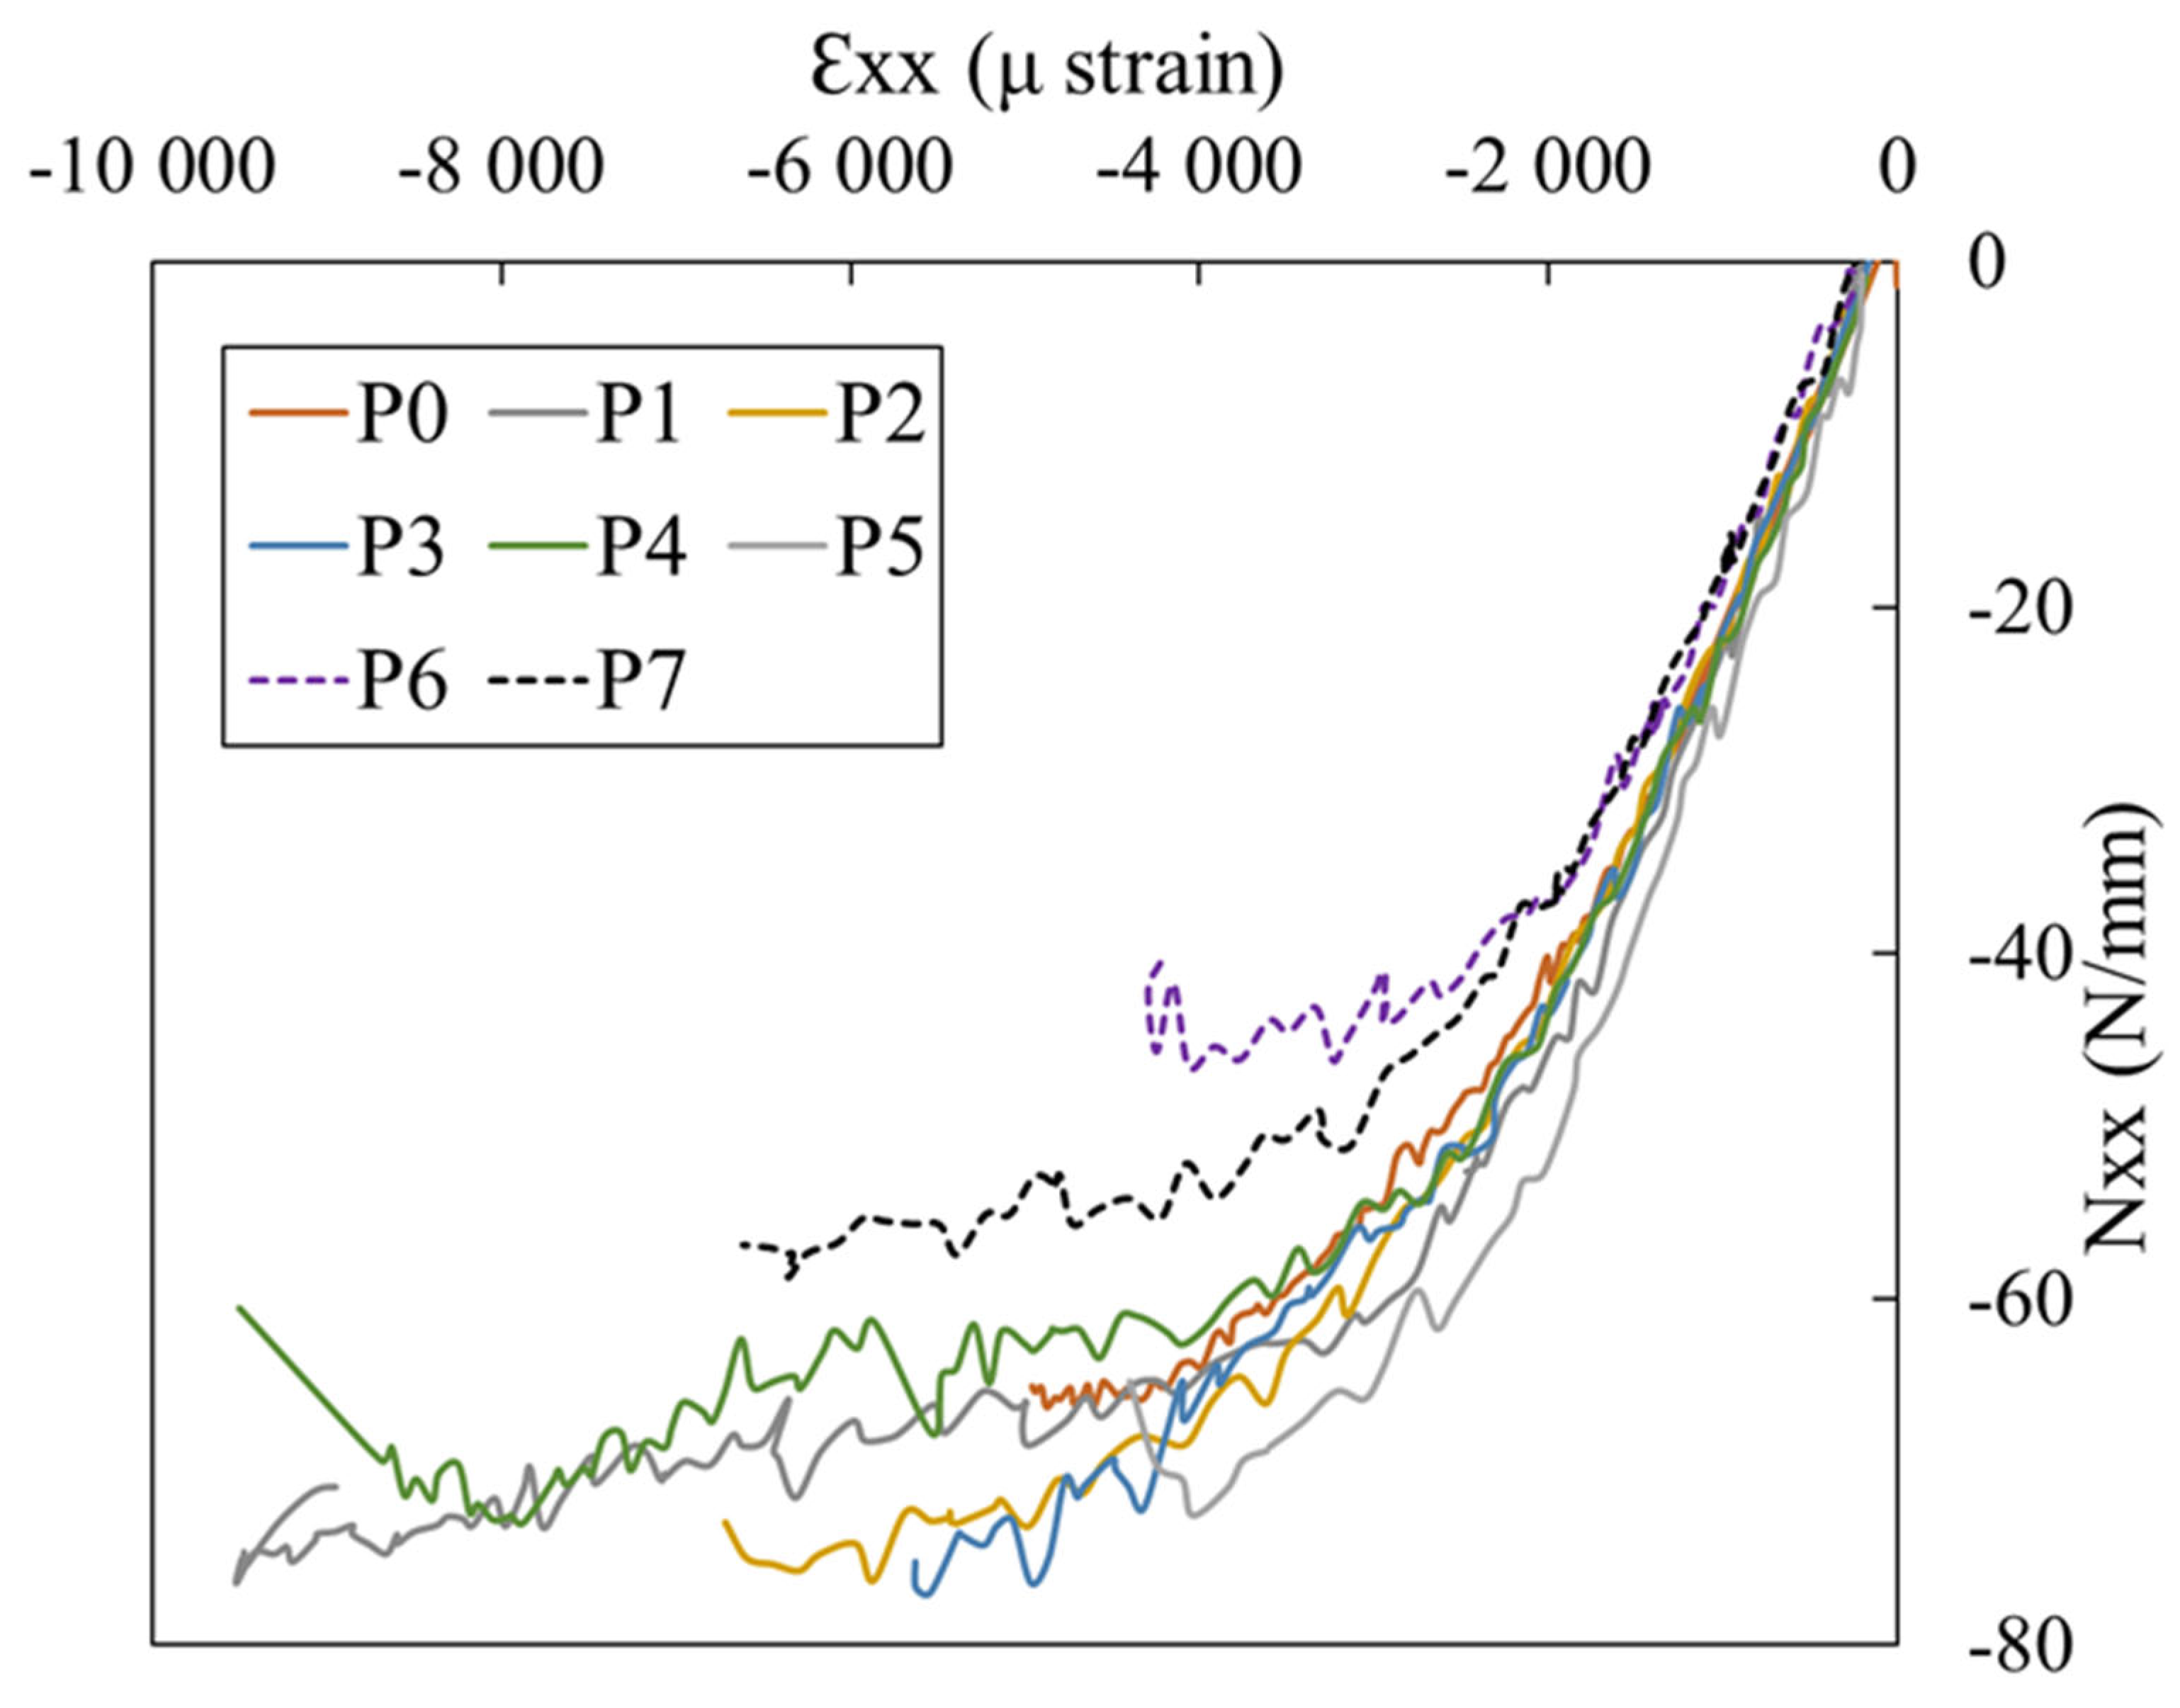
One of the most common defects encountered during the manufacture of a wood-based sandwich structure is a lack of glue, or poor adhesion of the glue, in part of the structure. Therefore, it is essential, and required by certification authorities, to analyse the impact of this defect on the structure’s mechanical behaviour. The aim of this section is therefore to investigate the influence of a lack of glue on the buckling behaviour of wood sandwich plates at a structural scale. To conduct this analysis, two plates (P6 and P7) were manufactured as described in Section 2, with no glue between the upper birch plywood skin and the balsa core. The surface areas were 50 × 50 mm2 for P6 and 100 × 100 mm2 for P7. Both plates were tested under the same conditions as the pristine plates (P0 to P5) and analysed in the same way. Figure 17 shows the N x x = f ε x x curves for these two plates compared with the six pristine plates. As can be seen in the figure, the overall behaviour of the two plates is the same as that of a plate without a defect: the load flux increases linearly with strain, then a change in slope occurs, indicating the beginning of plate buckling. Thereafter, the load flux continues to increase until the end of the test. However, a decrease in load flux was observed, particularly at the critical buckling point B, with an average of 35.5 N/mm for the two defective plates. This indicates that a lack of glue affecting 3% (P6) or 9% (P7) of the plate’s total area caused a 17% or 15% decrease in the buckling load, respectively, compared to the mean load found for pristine plates. Nevertheless, final failure occurred earlier, at approximately 5000 and 7000 µstrain, and at a lower stress, due to a different failure scenario.
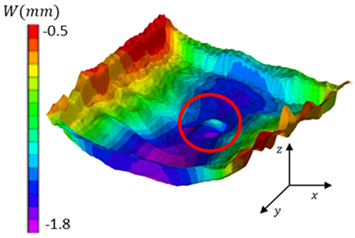
Digital Image correlation was used to investigate the entire test sequence and identify the events that occurred. These events were noted as characteristic points I, B0, B, and F on the P7 plate with an unglued zone of 100 × 100 mm2 (Figure 18). Points I and F still indicate the start and end of the test, respectively, while point B marks the onset of plate buckling. For these defective plates, a new event appeared, noted as B0 in Figure 18: an upward buckling of the glue-free zone of the plate measuring 100 × 100 mm2 for the P7 plate. This upward buckling occurred at an early stage of the test, before the critical buckling point B, at a strain of −704 µstrain and a load of −11 N/mm, i.e., 30% of the buckling load at point B.
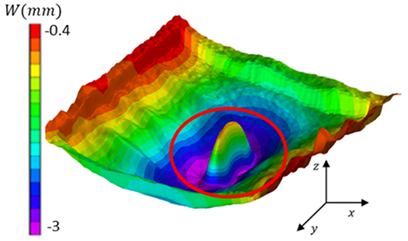
No other local buckling was observed for plates P6 or P7. The amplified 3D deformations of plate P7 for stages I, B0, B, and F are shown in Table 3. As with the pristine plates, the beginning of the test was characterised by slight out-of-plane displacement at the plate’s four edges due to the clamping effect. At stage B0, local buckling began in the unglued central zone of the plate, appearing as an upward out-of-plane displacement in the centre of the plate, unlike the rest of the plate. From B0 to the end of the test, the upward displacement continued to increase, and the 100 × 100 mm2 debonded zone progressively expanded in a non-proportional way according to the x- and y-axes.
Indeed, it can be seen that by the end of the test (point F), the debonding had propagated in a direction preferential to the y-axis, which is perpendicular to the compressive loading direction. The defect area was no longer square-shaped. This behaviour is quite similar to that of impacted sandwich plates [2]. To quantify this propagation, an out-of-plane curvature calculation was performed on a centreline in the x-direction (Figure 19a) and a second calculation was performed on a perpendicular centreline in the y-direction (Figure 19b). This allowed the central out-of-plane displacement to be found in both directions for the images corresponding to the characteristic points I, B0, B, and F, as shown in Figure 18, which depicts the evolution of the plate’s curvature at the centre along the x- and y-axes. The two vertical lines on the curves in Figure 19 indicate the position of the initial defect: 100 mm along the x-axis and 100 mm along the y-axis. Following the direction of compressive loading along the x-axis, the delamination in the unglued zone did not propagate; rather, it was compressed, with only 50 mm of the zone buckling upwards (Figure 19a). Conversely, delamination propagated to around 112 mm in the y-direction, which is perpendicular to the loading. This may be because the y-direction is not constrained by compressive forces, which enhances delamination and facilitates upward buckling. The initial defect, measuring 100 mm along the y-axis, reached 112 mm by the end of the test, representing a propagation of 12 mm (Figure 19b). The same kind of behaviour was observed for the P6 plate with a 50 × 50 mm2 unglued surface, but this is not reported here.

4.3. Failure Scenarios

4.3.1. Failure Scenarios Observed for the Pristine Plates

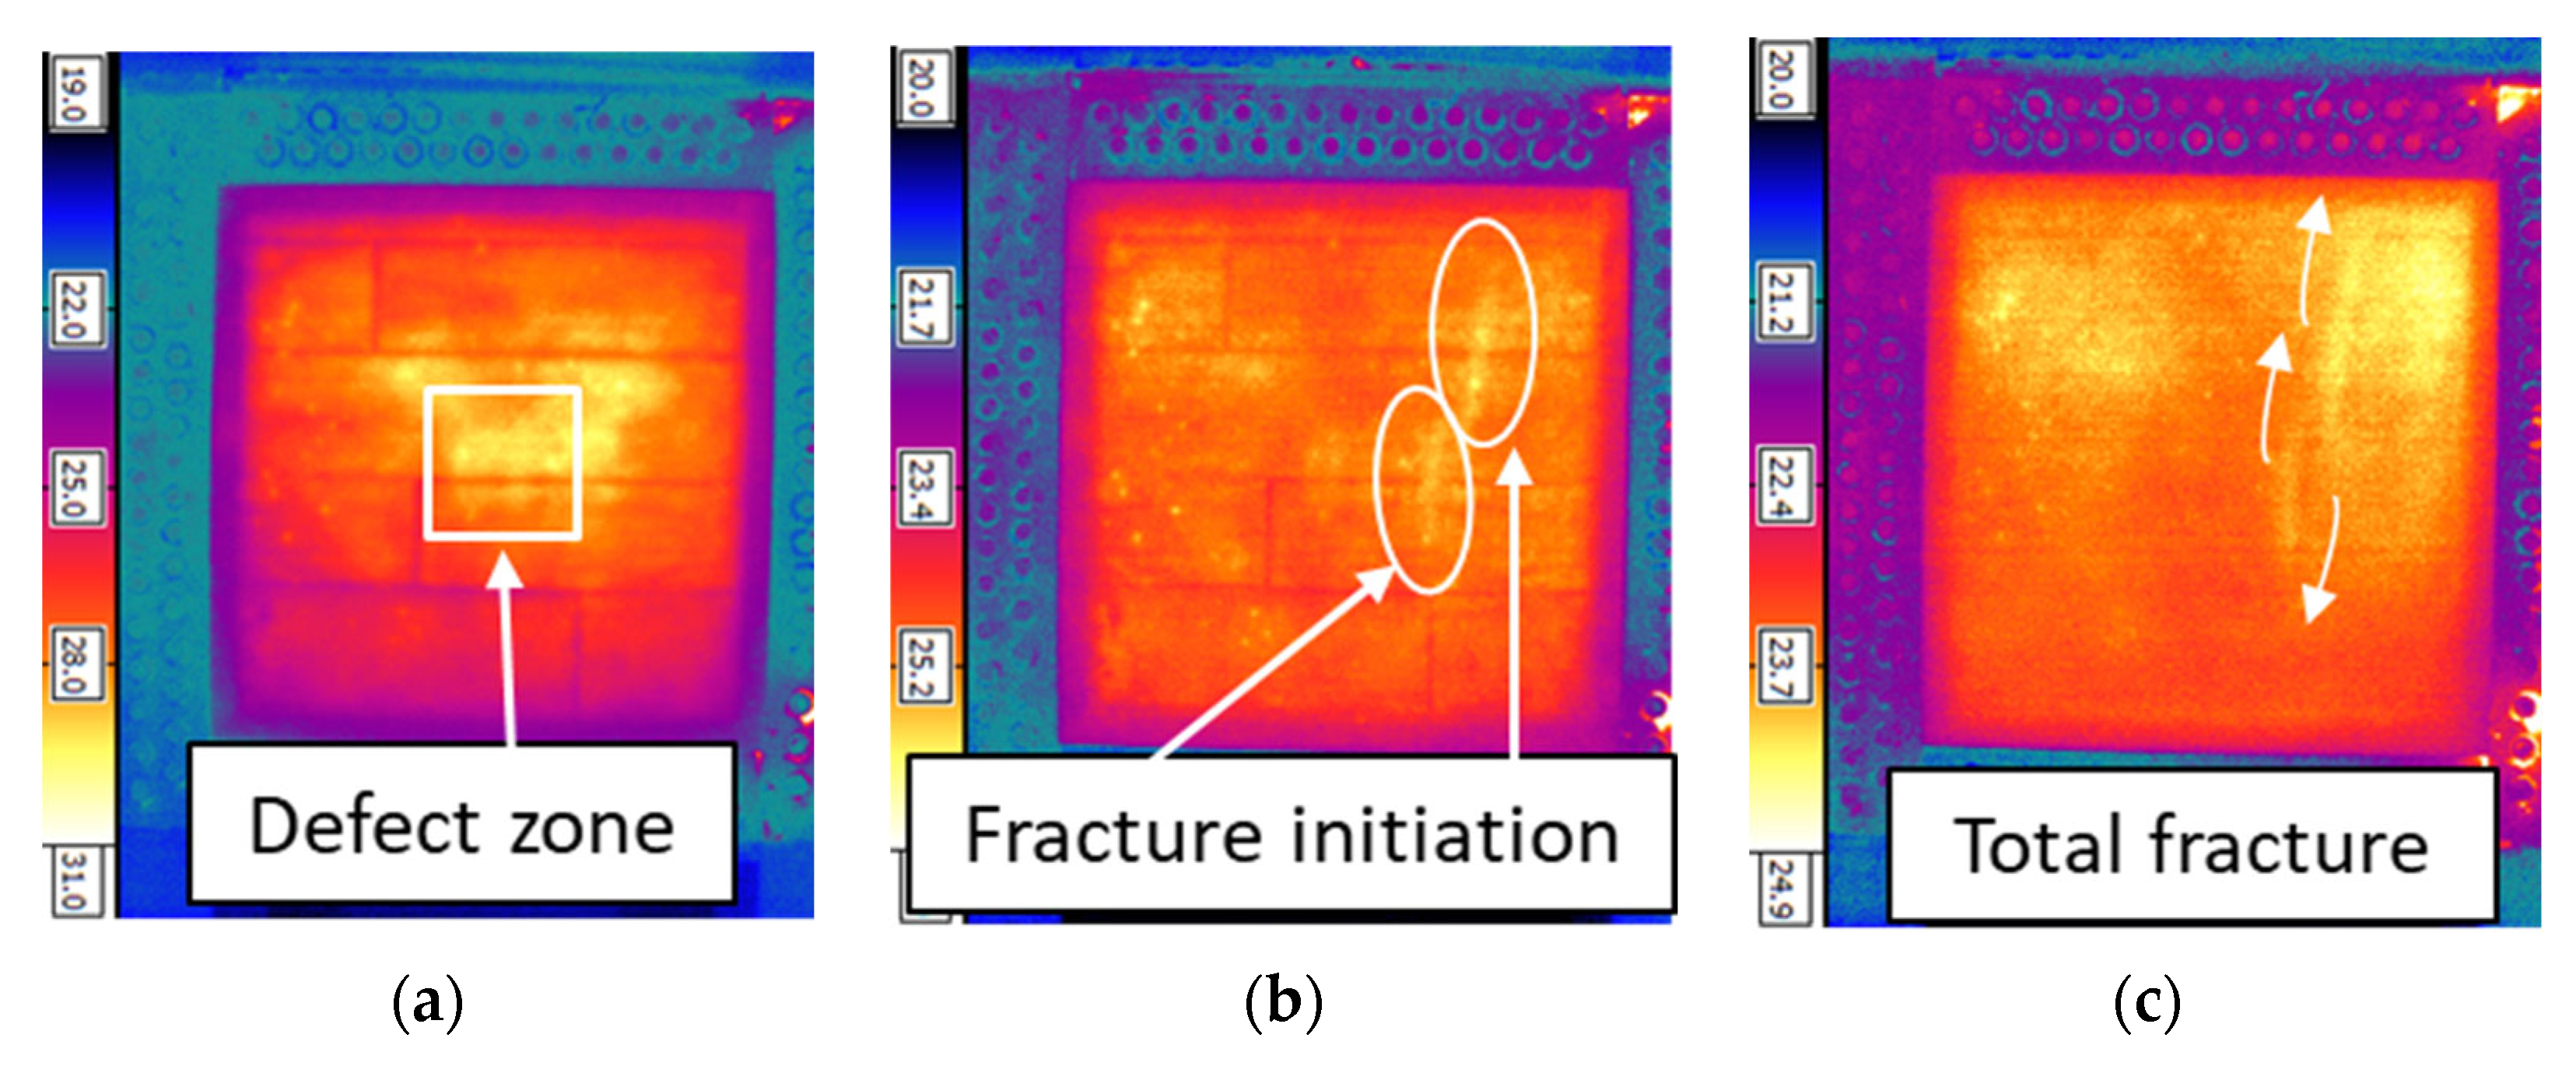
To determine the failure scenarios of the tested plates, the sequences recorded by the thermal camera throughout the test were reviewed. Once delamination or a fracture occurs in an area of the plate, heat is released, resulting in a higher temperature compared to the rest of the plate. The sequences obtained by the thermal camera for the six intact plates (P0 to P5) were therefore analysed to identify the locations of temperature peaks, and thus failure in the plates. Using this approach, two failure scenarios were identified, as shown in Figure 20. The first scenario involved a fracture in the birch skin starting at a corner of the plate and continuing inwards. Figure 20a shows the initial state of the plate and the layout of the balsa bands that were glued together to form the core of the wooden sandwich. This visualisation was achieved by heating the plate with an external lamp positioned in front of it, which stored the thermal energy captured by the infrared (IR) camera. The aim was to visualise the balsa core of the sandwich panel in order to determine whether the disposition of the balsa bands and their interfaces corresponded to the fracture location. Figure 20b shows the location of fracture initiation, which was caused by a temperature jump at this point compared to the rest of the plate. Figure 20c illustrates the progression of the fracture towards the interior of the plate. This scenario was observed for both the P0 and P2 plates. The second scenario involved a fracture in the centre of the plate. Unlike the situation shown in Figure 20b, there was no fracture at the borders of the plate, but rather a fracture that started at the centre of the plate and continued to propagate (Figure 20e,f). It can also be seen that the location of fracture initiation was not related to the initial arrangement of the balsa strips (Figure 20d). This scenario was observed for the two plates tested: P1 and P3. For the final two plates (P4 and P5), it was not possible to visualise failure initiation precisely as the energy levels detected by the thermal camera were too low. However, a fracture line in a similar location to the birch ply drops, which corresponded to the final failure mode, was visible in the skin.

4.3.2. Failure Scenarios for the Plates with Bonding Defects

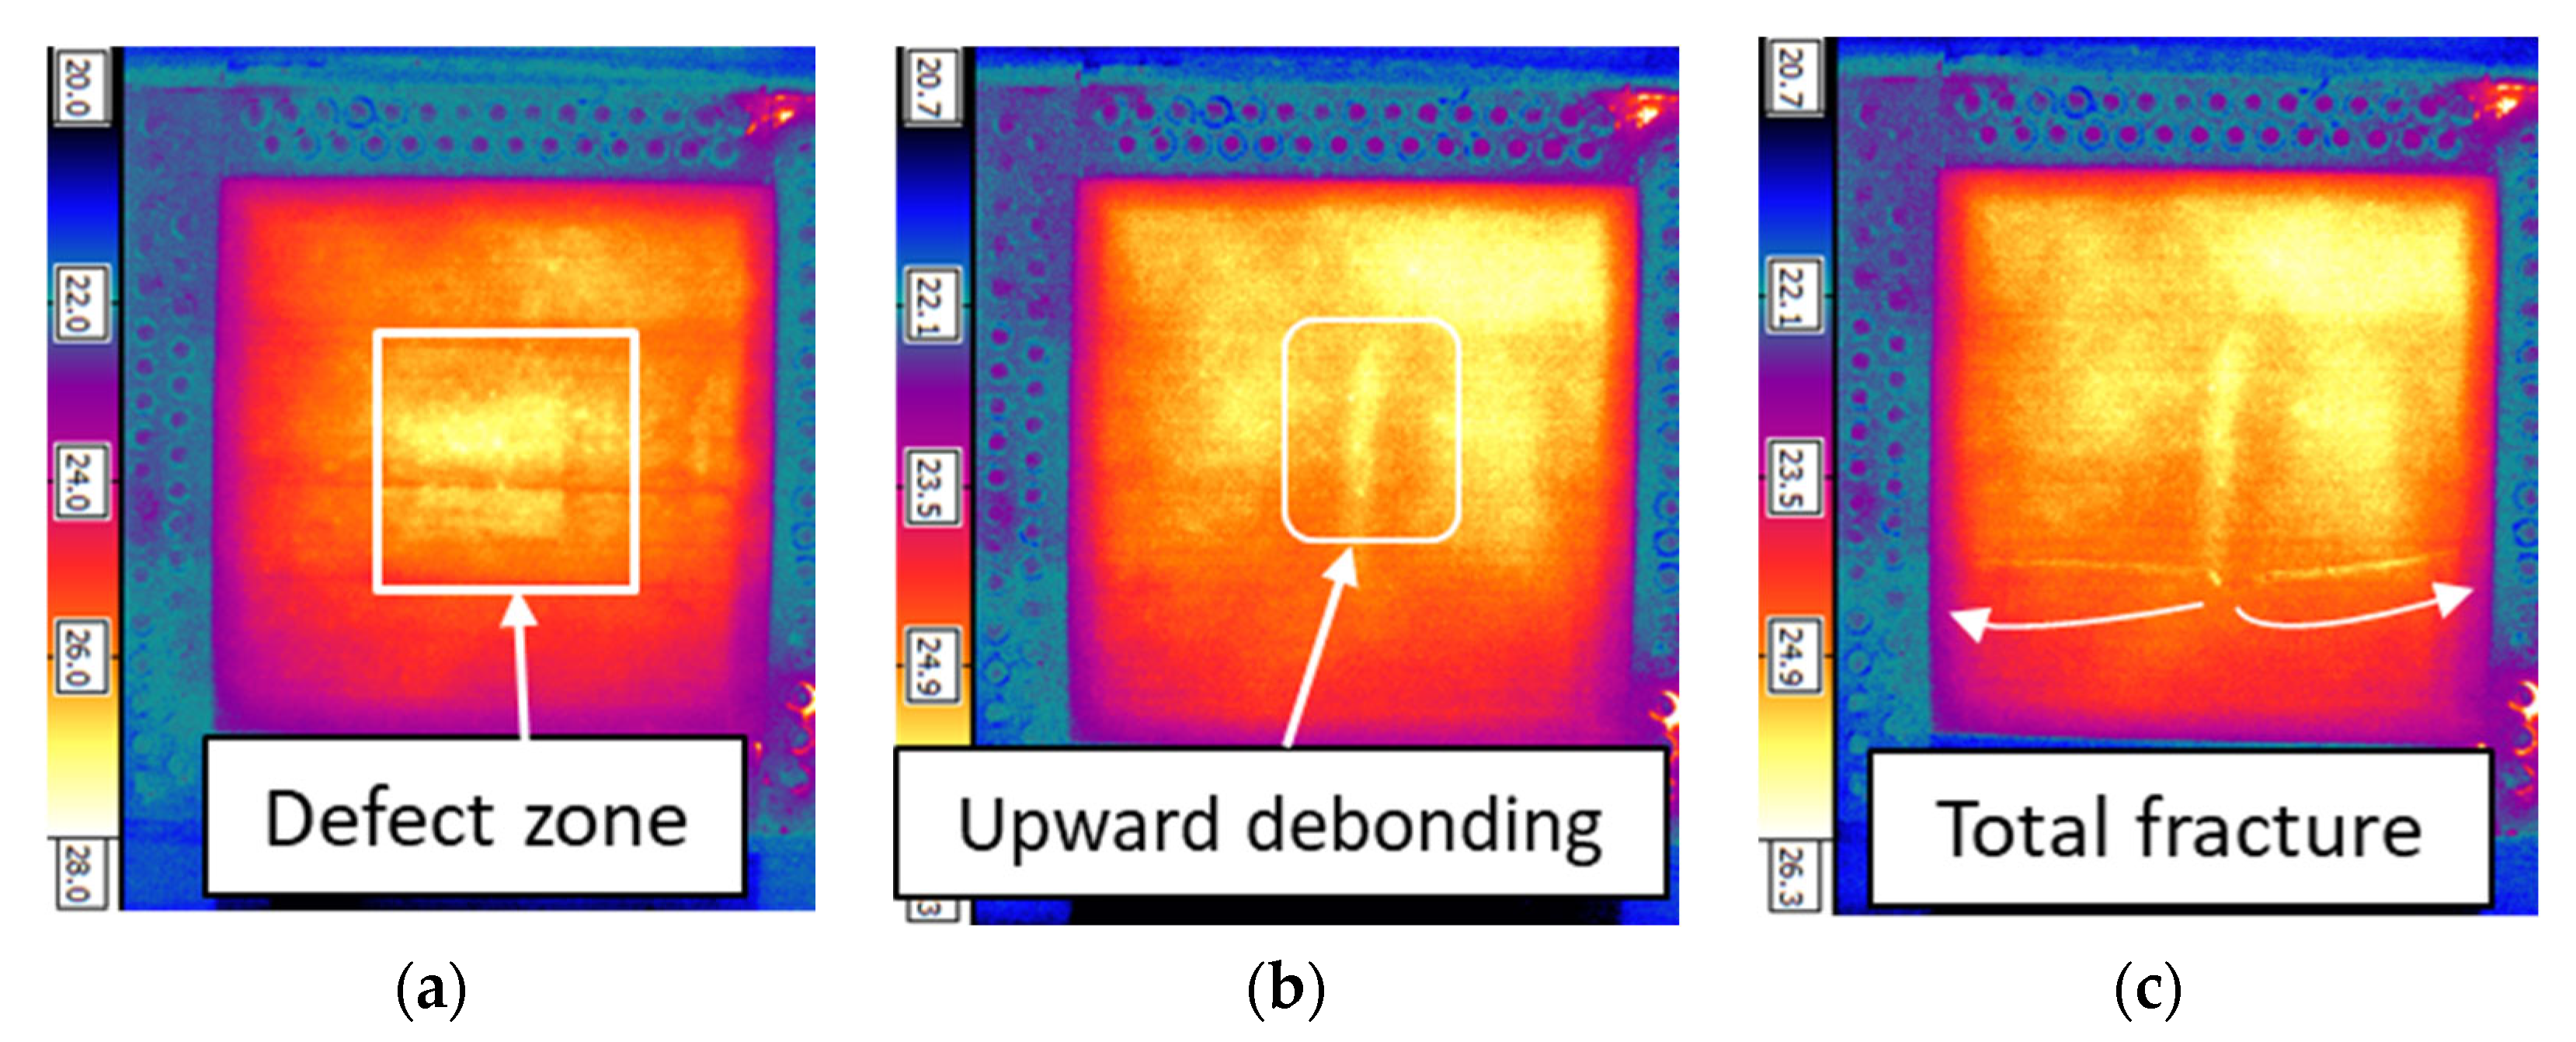
An investigation was also carried out using IR camera sequences on plates with defects (P6 and P7). When the upper face of the plate was exposed to the halogen lamp at the start of the test, the internal structure of the balsa core could be seen, as shown in Figure 21a. The white square highlights the shape and size of the defect (i.e., the debonded area). The IR camera sequence was analysed until a temperature rise was encountered, indicating delamination or crack initiation in the skins.
In the case of plate P6, a fracture began in the central zone (Figure 21b) and propagated towards the bonded edge (Figure 21c). The start of the fracture was clearly visible as it was located far from the borders of the plate. It was also located at the tip of the unglued zone. However, it cannot be concluded that the lack of glue was the cause of the fracture, as delamination between the balsa bands is another possible cause. For plate P7, the unglued zone was larger, with a central area measuring 100 × 100 mm2 (Figure 22a), accounting for 9% of the total plate area. When a compressive load was applied, delamination propagated in a direction perpendicular to the load (Figure 22b). Failure of the birch plies appeared immediately at the end of the debonding zone, as shown in Figure 22c.
Indeed, Figure 23a,b were captured by a high-speed camera at the moment of failure and the instant before, with an interval of 3.21 s. The two images corresponding to the fracture (Figure 22b,c) clearly show that it occurred at the end of the debonding zone and far from the edges. Therefore, it can be deduced that in the case of a large defect, such as plate P7 with a glue-free central zone of 9%, the propagated delamination around the unglued zone may cause failure.

4.4. Fracture Surfaces

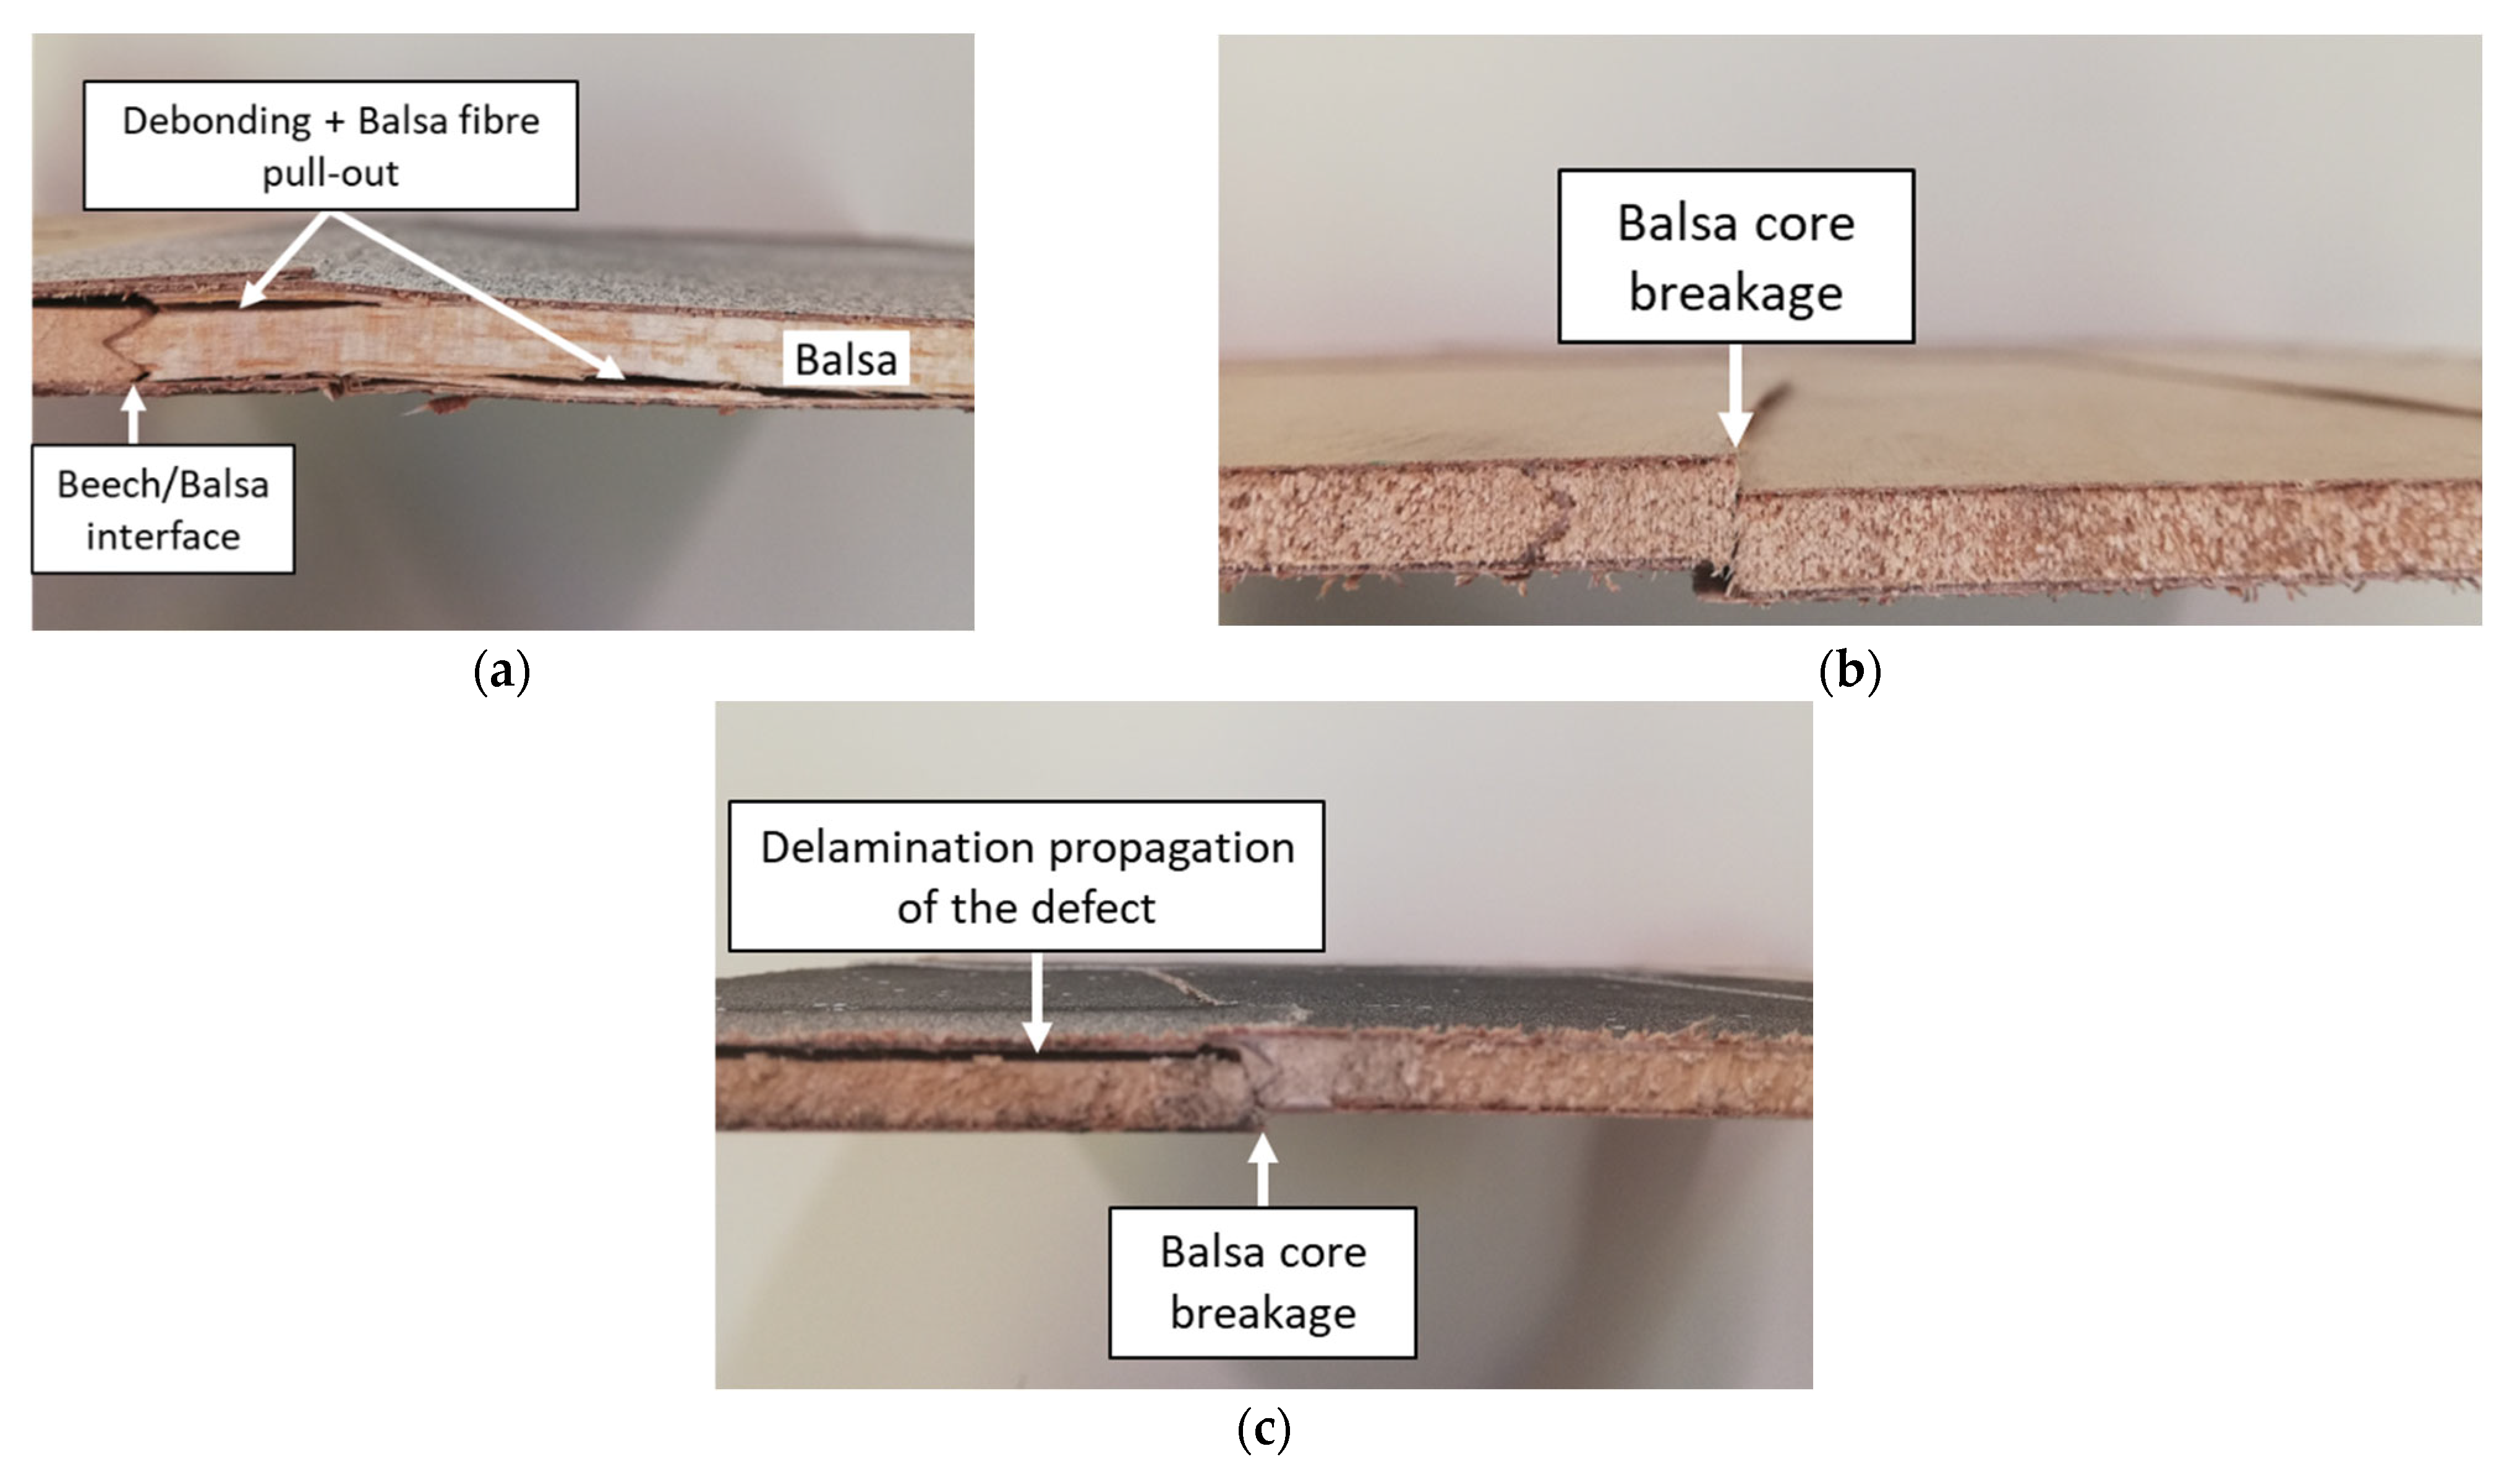
After the tests had been carried out, the plates were cut at the beginning of the fracture region to investigate the fracture surfaces through the thickness section. As noted earlier, two types of fracture scenarios were encountered for intact plates. Figure 24a shows an example of a fracture surface through a cross-section of plate P0, which began at the embedded border. The figure shows the interface between the balsa core at the centre of the plate and the beech core at the border, which replaced the balsa to reinforce the clamped edges. There is significant delamination between the birch plywood skins and the balsa core at the centre of the ply, as well as with the beech core at the border. Additionally, some balsa fibres were pulled out during the delamination process between the skins and the core. Figure 24b depicts the fracture surfaces of plate P1, which is the second type of fracture encountered, starting from the centre of the plate. In the centre section of the plate, the two aforementioned phenomena were absent, and delamination between the core and the skins was negligible. Instead, there was a sharp fracture in the balsa core. Figure 24c shows an example of a fracture surface for plate P7, which fractured at the tip of the delaminated zone. Delamination can be seen along the entire interface between the top birch plywood skin and the balsa core, with breakage in the balsa core at the end.

5. Conclusions

Sandwich structures with Finnish birch skins and a plywood core were tested in compression at the structural scale on the VERTEX bench. This type of structure demonstrated good post-buckling tolerance, with buckling occurring at approximately 1850 µstrain and final failure occurring between 7000 and 9000 µstrain. However, local debonding was observed in the meantime. Using balsa in the core also prevented local buckling, which usually leads to the structure failing prematurely. It was also observed that bonding defects only slightly affected the critical buckling load, reducing it by around 15%. Nevertheless, failure scenarios were modified by the appearance of local buckling of the skins in the unbonded zones, initially without propagation and without causing general failure. Furthermore, the method of manufacturing the core using balsa strips did not appear to significantly affect the propagation of fractures or the strength of the wood sandwich structure.
In conclusion, this type of structure is of significant interest in the design of lightweight, carbon-free aeronautical structures. Additional tests should be conducted under shear and combined compression/shear stresses to complete the representativeness of the conditions to which these structures are subjected.

Author Contributions

Conceptualization, J.S. and B.C.; Validation, R.C. and B.C.; Investigation, H.H., J.S. and R.C.; Writing—original draft, H.H.; Writing—review & editing, J.S., R.C. and B.C.; Supervision, J.S. and B.C.; Project administration, B.C. All authors have read and agreed to the published version of the manuscript.

Funding

This research received no external funding.

Conflicts of Interest

The authors declare no conflict of interest.

References

  1. Castanie, B.; Azoti, W.; Crouzeix, L.; Bello, A.; Taborda, R.P.; Mahmood, A.; Viste, A. Review of Monolithic Composite Laminate and Stiffened Structures in Aeronautic Applications. Compos. Part C Open Access 2025, 17, 100585. [Google Scholar] [CrossRef]
  2. Castanié, B.; Peignon, A.; Marc, C.; Eyma, F.; Cantarel, A.; Serra, J.; Curti, R.; Hadiji, H.; Denaud, L.; Girardon, S.; et al. Wood and plywood as eco-materials for sustainable mobility: A review. Compos. Struct. 2023, 329, 117790. [Google Scholar] [CrossRef]
  3. Sutherland, J. Revival of structural timber in Britain after 1945. Constr. Hist. Soc. 2010, 25, 101–113. Available online: https://www.jstor.org/stable/41613962 (accessed on 5 August 2025).
  4. Klemin, A. Aviation Surveyed. Sci. Am. 1944, 170, 214–216. Available online: https://www.jstor.org/stable/10.2307/24997774 (accessed on 5 August 2025). [CrossRef]
  5. Available online: https://avionsmauboussin.fr/en/elementor-9080/ (accessed on 5 August 2025).
  6. Guenther, R.; Tajmar, M.; Bach, C. Wood and Wood-Based Materials in Space Applications—A Literature Review of Use Cases, Challenges and Potential. Aerospace 2024, 11, 910. [Google Scholar] [CrossRef]
  7. Wurm, S.; Wagner, M.; Baumann, G.; Vitzthum, K.; Sehrschön, H.; Krenke, T.; Feist, F. Wood-steel hybrid beams for electric vehicle battery housings: A comparative study with aluminum profiles in bending load case. Eur. J. Wood Wood Prod. 2025, 83, 114. [Google Scholar] [CrossRef]
  8. Jennings, M.; Subhani, M.; Reiner, J.; Piazza, G.; Heyner, D. Towards manufacturing of full scale wood veneer automotive panel. In Proceedings of the 14th World Conference on Timber Engineering 2025 (WCTE 2025), Brisbane, Australia, 22–26 June 2025; pp. 2734–2742. [Google Scholar]
  9. Vladimirova, E.; Gong, M. Advancements and Applications of Wood-Based Sandwich Panels in Modern Construction. Buildings 2024, 14, 2359. [Google Scholar] [CrossRef]
  10. Wei, P.; Chen, J.; Zhang, Y.; Pu, L. Wood-based sandwich panels: A review. Wood Res. 2021, 66, 875–890. [Google Scholar] [CrossRef]
  11. Oliveira, P.R.; May, M.; Panzera, T.H.; Hiermaier, S. Bio-based/green sandwich structures: A review. Thin-Walled Struct. 2022, 177, 109426. [Google Scholar] [CrossRef]
  12. Smardzewski, J. Experimental and numerical analysis of wooden sandwich panels with an auxetic core and oval cells. Mater. Des. 2019, 183, 108159. [Google Scholar] [CrossRef]
  13. Smardzewski, J.; Wojciechowski, K.W. Study on the bending and failure behaviour of wooden sandwich panels with corrugated core, randomized gaps, and wood defects. Constr. Build. Mater. 2023, 409, 133924. [Google Scholar] [CrossRef]
  14. Zuccarello, B.; Bongiorno, F.; Militello, C. Structural Optimization of a High-Performance Green Sandwich Made of Sisal Reinforced Epoxy Facings and Balsa Core. Polymers 2024, 16, 3341. [Google Scholar] [CrossRef]
  15. Susainathan, J.; Eyma, F.; De Luycker, E.; Cantarel, A.; Castanie, B. Manufacturing and quasi-static bending behavior of wood-based sandwich structures. Compos. Struct. 2017, 182, 487–504. [Google Scholar] [CrossRef]
  16. Demircioğlu, T.; Balıkoğlu, F.; İnal, O.; Arslan, N.; Ay, I.; Ataş, A. Experimental investigation on low-velocity impact response of wood skinned sandwich composites with different core configurations. Mater. Today Commun. 2018, 17, 31–39. [Google Scholar] [CrossRef]
  17. Jendli, Z.; Haggui, M.; Monti, A.; El Mahi, A.; Guillaumat, L. Experimental analysis of low-velocity impact behaviour on flax-balsa biobased sandwich. Compos. Part C Open Access 2024, 14, 100489. [Google Scholar] [CrossRef]
  18. Smardzewski, J.; Majnusz, M.; Murlak, K. Bending and energy absorption performance of novel openwork wooden panels. Eur. J. Wood Wood Prod. 2022, 80, 515–528. [Google Scholar] [CrossRef]
  19. Basha, M.; Wagih, A.; Melaibari, A.; Lubineau, G.; Abdraboh, A.; Eltaher, M. Impact and post-impact response of lightweight CFRP/wood sandwich composites. Compos. Struct. 2022, 279, 114766. [Google Scholar] [CrossRef]
  20. Susainathan, J.; Eyma, F.; De Luycker, E.; Cantarel, A.; Bouvet, C.; Castanie, B. Experimental investigation of compression and compression after impact of wood-based sandwich structures. Compos. Struct. 2019, 220, 236–249. [Google Scholar] [CrossRef]
  21. Walley, S.M.; Perry, J.I. The High-Rate Mechanical Properties of Wood Mostly Obtained Using the Kolsky Bar: A Review. J. Dyn. Behav. Mater. 2025, 11, 284–337. [Google Scholar] [CrossRef]
  22. Wouts, J.; Haugou, G.; Oudjene, M.; Coutellier, D.; Morvan, H. Strain rate effects on the compressive response of wood and energy absorption capabilities—Part A: Experimental investigations. Compos. Struct. 2016, 149, 315–328. [Google Scholar] [CrossRef]
  23. Guélou, R.; Eyma, F.; Cantarel, A.; Rivallant, S.; Castanié, B. Crashworthiness of poplar wood veneer tubes. Int. J. Impact Eng. 2021, 147, 103738. [Google Scholar] [CrossRef]
  24. Baumann, G.; Müller, U.; Brandner, R.; Feist, F. Compression characteristics of birch wood over wide ranges of strain, strain-rate and temperature. Results Eng. 2025, 26, 104942. [Google Scholar] [CrossRef]
  25. Reiner, J.; Subhani, M.; Jennings, M. A comparison of energy absorption in axial crush tests between wood veneers, basalt fibre reinforced polymers and hybrid combinations. Structures 2025, 79, 109599. [Google Scholar] [CrossRef]
  26. Li, S.; Zhang, Y. Experiment on the impact response of aluminum alloy wood core sandwich composites. Adv. Mech. Eng. 2023, 15, 11. [Google Scholar] [CrossRef]
  27. Wouts, J.; Haugou, G.; Oudjene, M.; Morvan, H.; Coutellier, D. Strain rate effects on the compressive response of wood and energy absorption capabilities—Part B: Experimental investigation under rigid lateral confinement. Compos. Struct. 2018, 204, 95–104. [Google Scholar] [CrossRef]
  28. Guélou, R.; Eyma, F.; Cantarel, A.; Rivallant, S.; Castanié, B. Static and dynamic crushing of sandwich tubes with composite skins and three plywood cores (poplar, birch, and oak). Int. J. Crashworthiness 2023, 29, 626–647. [Google Scholar] [CrossRef]
  29. Baumann, G.; Brandner, R.; Müller, U.; Stadlmann, A.; Feist, F. A comparative study on the temperature effect of solid birch wood and solid beech wood under impact loading. Materials 2021, 14, 7616. [Google Scholar] [CrossRef]
  30. Susainathan, J.; Eyma, F.; De Luycker, E.; Cantarel, A.; Castanie, B. Numerical modelling of impact on wood-based sandwich structures. Mech. Adv. Mater. Struct. 2019, 27, 1583–1598. [Google Scholar] [CrossRef]
  31. Susainathan, J.; Barbero, E.; Sanchez, S.; Cantarel, A.; Eyma, F. Modelling of dynamic flexural response of composite eco-structure beams using a 3D elastic–plastic damage model. Compos. Struct. 2025, 364, 119119. [Google Scholar] [CrossRef]
  32. Müller, U.; Jost, T.; Kurzböck, C.; Stadlmann, A.; Wagner, W.; Kirschbichler, S.; Baumann, G.; Pramreiter, M.; Feist, F. Crash simulation of wood and composite wood for future automotive engineering. Wood Mater. Sci. Eng. 2019, 15, 312–324. [Google Scholar] [CrossRef]
  33. Pramreiter, M.; Bodner, S.C.; Keckes, J.; Stadlmann, A.; Feist, F.; Baumann, G.; Maawad, E.; Müller, U. Predicting strength of Finnish birch veneers based on three different failure criteria. Holzforschung 2021, 75, 847–856. [Google Scholar] [CrossRef]
  34. Fagerberg, L.; Zenkert, D. Effects of anisotropy and multiaxial loading on the wrinkling of sandwich panels. J. Sandw. Struct. Mater. 2005, 7, 177–194. [Google Scholar] [CrossRef]
  35. Kassapoglou, C. Design and Analysis of Composites Structures; Wiley: Hoboken, NJ, USA, 2010. [Google Scholar]
  36. Douville, M.-A.; Le Grognec, P. Exact analytical solutions for the local and global buckling of sandwich beam-columns under various loadings. Int. J. Solids Struct. 2013, 50, 2597–2609. [Google Scholar] [CrossRef]
  37. D’oTtavio, M.; Polit, O.; Ji, W.; Waas, A.M. Benchmark solutions and assessment of variable kinematics models for global and local buckling of sandwich struts. Compos. Struct. 2016, 156, 125–134. [Google Scholar] [CrossRef]
  38. Di Cara, G.; D’ottavio, M.; Polit, O. Variable kinematics finite plate elements for the buckling analysis of sandwich composite panels. Compos. Struct. 2023, 330, 117856. [Google Scholar] [CrossRef]
  39. Ginot, M.; D’OTtavio, M.; Polit, O.; Bouvet, C.; Castanié, B. Benchmark of wrinkling formulae and methods for pre-sizing of aircraft lightweight sandwich structures. Compos. Struct. 2021, 273, 114387. [Google Scholar] [CrossRef]
  40. Castanié, B.; Passieux, J.-C.; Périé, J.-N.; Bouvet, C.; Dufour, J.-E.; Serra, J. Multiaxial loading of aeronautic composite structures at intermediate scale: A review of VERTEX developments. Compos. Part C Open Access 2024, 13, 100439. [Google Scholar] [CrossRef]
  41. Grotto, F.; Peta, O.; Bouvet, C.; Castanié, B.; Serra, J. Testing structural elements under multiaxial loading: A numerical model of the bench to understand and predict complex boundary conditions. Aerospace 2024, 11, 68. [Google Scholar] [CrossRef]
  42. Grotto, F.; Bouvet, C.; Castanié, B.; Serra, J. Design and Testing of Impacted Stiffened CFRP Panels under Compression with the VERTEX Test Rig. Aerospace 2023, 10, 327. [Google Scholar] [CrossRef]
  43. Ginot, M.; Bouvet, C.; Castanié, B.; D’OTtavio, M.; Serra, J.; Mahuet, N. Local buckling on large sandwich panels applied to light aviation: Experimental and computation dialogue. Int. J. Solids Struct. 2023, 264, 112170. [Google Scholar] [CrossRef]
  44. Ginot, M.; Bouvet, C.; Castanié, B.; Serra, J.; Mahuet, N. Local buckling on large sandwich panels used in light aviation: Experimental setup and failure scenarios. Compos. Struct. 2022, 304, 116439. [Google Scholar] [CrossRef]
  45. Galos, J.; Das, R.; Sutcliffe, M.P.; Mouritz, A.P. Review of balsa core sandwich composite structures. Mater. Des. 2022, 221, 111013. [Google Scholar] [CrossRef]
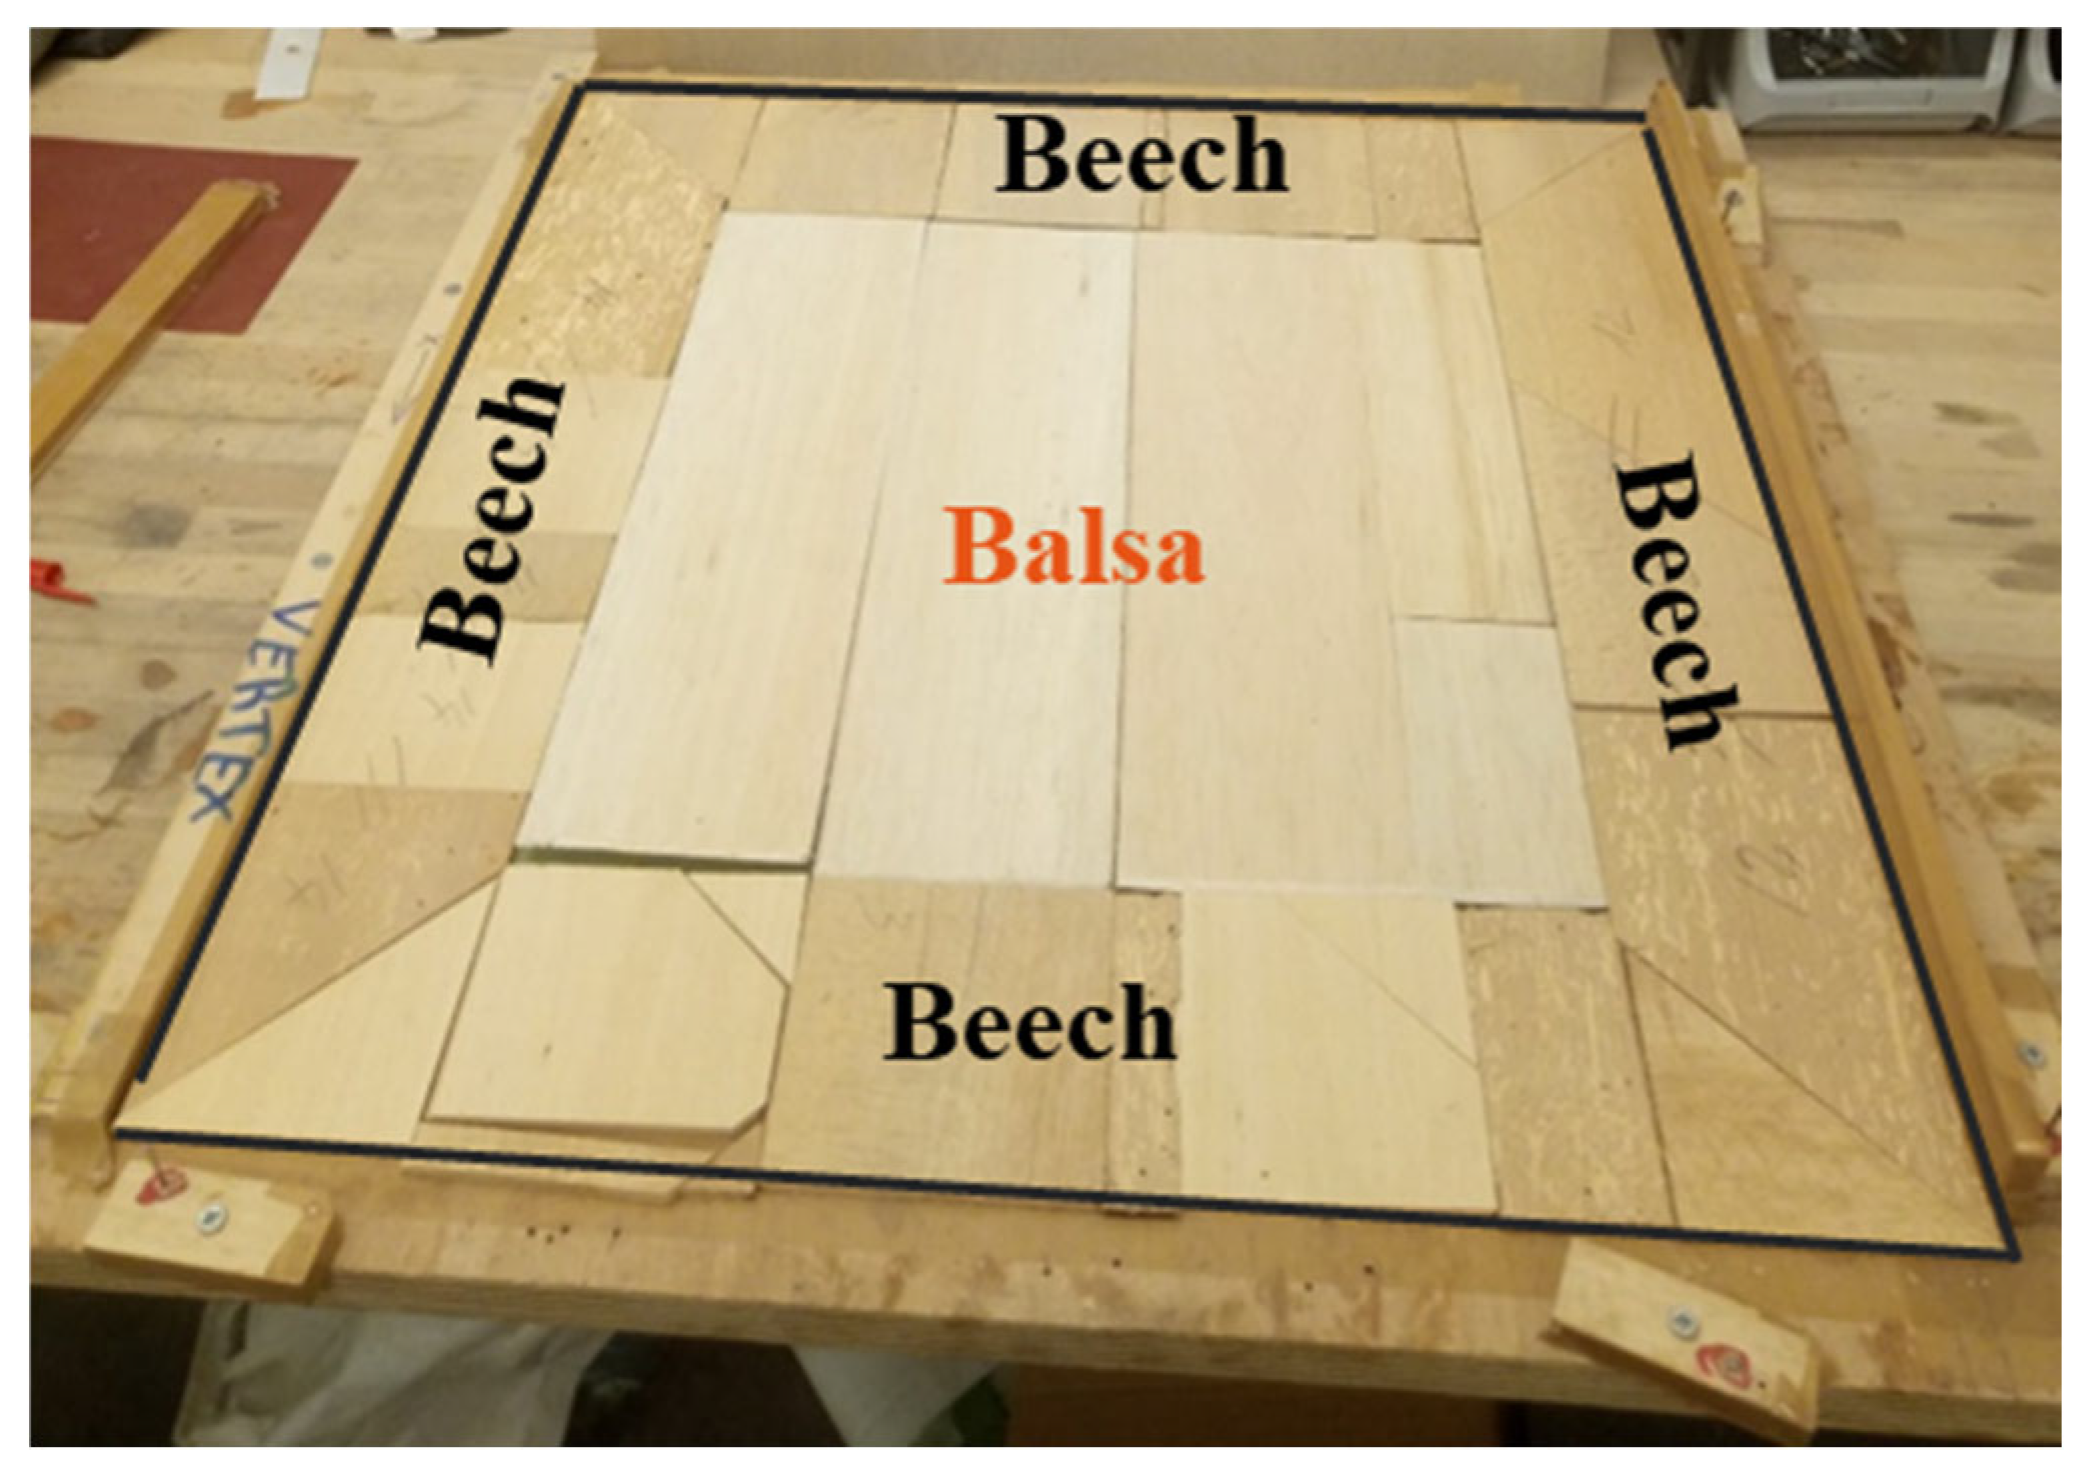
Figure 1. Disposition of balsa strips in the core of the wood sandwich plate and border reinforcements made of beech.
Aerospace 12 00782 g001
Figure 2. Size of the central defect on the manufactured panels P6 and P7.
Aerospace 12 00782 g002
Figure 3. VERTEX test rig.
Aerospace 12 00782 g003
Figure 4. Schematic diagram of jack displacement on the VERTEX test bench under compression loading.
Aerospace 12 00782 g004
Figure 5. Test set-up and monitoring of the VERTEX test rig.
Aerospace 12 00782 g005
Figure 6. High-speed camera field of view.
Aerospace 12 00782 g006
Figure 7. Determination of force and moment fluxes on the specimens from stereo digital image correlation [40,41,42,43,44].
Aerospace 12 00782 g007
Figure 8. Composite lay-up defined in the numerical model.
Aerospace 12 00782 g008
Figure 9. Out-of-plane displacement of the wood sandwich panel obtained by the finite element model.
Aerospace 12 00782 g009
Figure 10. N x x = f ε x x cycled curves for wood sandwich plate P1.
Aerospace 12 00782 g010
Figure 11. Evolution of N x x , N y y , and T x y loads during the test for plate P1.
Aerospace 12 00782 g011
Figure 12. Determination of the critical buckling point from the N x x = f ε x x curve.
Aerospace 12 00782 g012
Figure 13. Compression load and strain at the four selected points of the test for plate P1.
Aerospace 12 00782 g013
Figure 14. DIC calculation method of the local debonding.
Aerospace 12 00782 g014
Figure 15. Out-of-plane displacement at line L 0 from DIC calculations for 4 characteristic frames.
Aerospace 12 00782 g015
Figure 16. N x x = f ε x x curves for the six pristine plates.
Aerospace 12 00782 g016
Figure 17. N x x = f ε x x curves for the six pristine plates (P0 to P5) and the plates with bonding defects (P6 and P7).
Aerospace 12 00782 g017
Figure 18. Compression load and strain at the four selected points for plate P7.
Aerospace 12 00782 g018
Figure 19. Out-of-plane displacement at line L 0 from DIC calculations along the x-axis (a) and along the y-axis (b) for plate P7.
Aerospace 12 00782 g019
Figure 20. Two encountered failure scenarios for the pristine wood sandwich plates.
Aerospace 12 00782 g020
Figure 21. Failure scenario of P6 (plate with 50 × 50 mm2 central defect surface).
Aerospace 12 00782 g021
Figure 22. Failure scenario of P7 (plate with 100 × 100 mm2 central defect surface).
Aerospace 12 00782 g022
Figure 23. High-speed camera images taken at the fracture of plate P7, 3.21 s apart.
Aerospace 12 00782 g023
Figure 24. Fracture surfaces of the pristine plates (a) P0 and (b) P1, and (c) the defective plate P7.
Aerospace 12 00782 g024
Table 1. 3D deformed shapes and out-of-plane displacement of plate P1 at the four selected stages of the test.
I: Initial pointB: Buckling
Aerospace 12 00782 i001Aerospace 12 00782 i002
D: First debondingF: Final point
Aerospace 12 00782 i003Aerospace 12 00782 i004
Table 2. Points B and D strains and compression flux the six pristine plates.
Point BPoint D
ε x x  (µstrain) N x x   (N/mm) ε x x  (µstrain) N x x  (N/mm)
P0−1870−38−3510−55
P1−1880−44−4650−66
P2−1980−43−5417−72
P3−1893−41−2350−49
P4−2056−45No local debonding
P5−1711−43−1831−43
Mean load
(Standard deviation)
−1898.33
(79.77)
−42.33
(1.88)
−3551.60
(1185.60)
−57
(9.60)
Table 3. Three-dimensional deformed shapes and out-of-plane displacement of plate P7.
I: initial point B 0 : Upward buckling
Aerospace 12 00782 i005Aerospace 12 00782 i006
B: BucklingF: Final point
Aerospace 12 00782 i007Aerospace 12 00782 i008
Disclaimer/Publisher’s Note: The statements, opinions and data contained in all publications are solely those of the individual author(s) and contributor(s) and not of MDPI and/or the editor(s). MDPI and/or the editor(s) disclaim responsibility for any injury to people or property resulting from any ideas, methods, instructions or products referred to in the content.