Article

Strong Tracking Unscented Kalman Filter for Identification of Inflight Icing

Department of Aeronautics and Astronautics, Fudan University, Shanghai 200433, China
*
Author to whom correspondence should be addressed.
Aerospace 2025, 12(9), 779; https://doi.org/10.3390/aerospace12090779
Submission received: 21 July 2025 / Revised: 21 August 2025 / Accepted: 28 August 2025 / Published: 29 August 2025
(This article belongs to the Section Aeronautics)

Abstract

Aircraft icing degrades aerodynamic performance and poses safety risks, especially under nonlinear and uncertain conditions. In order to identify inflight icing in real time, this work proposes a Strong Tracking Unscented Kalman Filter (STUKF) which integrates the Unscented Kalman Filter (UKF) with an adaptive fading factor from strong tracking theory. The proposed STUKF improves robustness and responsiveness without requiring Jacobian matrices. A nonlinear airplane model with six degrees of freedom is used, with icing effects represented by a time-varying severity parameter estimated through state augmentation. Simulations are conducted under varying turbulence intensities and icing scenarios, including both gradual ice accretion and sudden ice shedding. When it comes to tracking speed and precision, the results demonstrate that STUKF performs better than the normal UKF. Notably, STUKF identifies sudden drops in icing severity within 12 s even under strong disturbances. STUKF also maintains stable performance across light to heavy turbulence levels. These findings demonstrate the effectiveness of STUKF for timely and reliable icing diagnosis, supporting its potential integration into smart icing protection systems or adaptive flight control strategies.

1. Introduction

Current aviation research has increasingly focused on flight safety under severe weather conditions. Because it significantly impairs aircraft performance, aviation icing is one of these meteorological situations that is of major concern. In the past, icing-induced aviation mishaps have been documented worldwide. The majority of aviation freezing accidents are caused by the effects of ice accumulation on an aircraft’s controllability, stability, and performance [1].
Ice protection strategies can be broadly categorized into (1) pre-flight application of anti-icing or de-icing fluids to aircraft surfaces, (2) design and application of ice-resistant surface treatments, and (3) active in-flight ice removal using systems such as thermal anti-icing, electro-thermal heaters, or pneumatic boots. Meteorological information and icing forecasts are not physical protection methods but serve as important operational tools to reduce the likelihood of entering icing conditions. However, relying solely on flight cancellations or route changes based on forecast data is generally impractical for most commercial operations due to cost and scheduling constraints.
The functions of ice protection system usually include icing detection and deicing. Icing detection is mainly accomplished by various icing sensors. Although some modern aircraft are equipped with icing sensors, these only indicate the presence of icing and cannot provide information about performance degradation [2].
Studies have been carried out to accurately detect and diagnose aviation icing. Since 1986, NASA has conducted many flight tests for DHC-6 inflight icing [3,4], and numerous helpful facts on how aircraft ice affects control and stability were gathered. A Smart Icing System (SIS) has been suggested by NASA and Illinois University experts who have examined aircraft icing from a variety of angles [5,6]. The idea of SIS is to quantify how ice accretion affects performance and control. If icing is severe, this data will be used to adjust the control law, adjust the flying envelope, and regulate deicers. Note that SIS is a complementary mitigation strategy, not a replacement for physical ice prevention.
The SIS idea states that the primary goal is to measure how ice affects control and performance, which is why aircraft settings are changed. After icing, a popular and practical technique for calculating flying parameters is parameter identification. Numerous approaches exist for identifying parameters, including the H algorithm, the Kalman filter, the batch least squares algorithm, and neural networks. To solve the ice detection issue, Melody et al. used the H algorithm, the batch least squares method, and the extended Kalman filter (EKF) [7]. The outcomes of the simulation demonstrated how much better the H algorithm performs than the rest. Melody and colleagues introduced the H NPFSI technique to account for the time-varying situation of ice accretion and showed that it was possible to produce dependable results [8]. Aykan et al. developed a neural network and Kalman filter-based icing detection technique [9]. The icing issue was determined using five aerodynamic factors that are impacted by ice accumulation. The algorithm was tested on A340 and F16 aircraft models [10]. Dong et al. used the H algorithm and a probabilistic neural network to identify aerodynamic parameters and detect the location of the icing [11]; the simulation results indicated the method has a satisfying accuracy.
Existing studies in icing identification were always based on a longitudinal linear aircraft model, while the aerodynamic model was also described as a linear polynomial. Linear models cannot accurately capture real aircraft dynamics, particularly at high angles of attack. The performance of identification algorithms may degrade or even fail with these mismatches. Furthermore, these previous studies treated the parameters after icing as constants or slowly varying variables. However, after deicers activate, the change in the parameters is sudden when ice begins shedding. Operating deicing systems consumes additional fuel and negatively affects overall efficiency. Therefore, the identification algorithm should catch up with the sudden change in icing in time. A recent numerical study [12] analyzed the effect of anti-icing geometric parameters on system performance using computational investigation, which further underscored the value of real-time estimates of aerodynamic degradation for control and protection logic.
The Unscented Kalman Filter (UKF) and the Strong Tracking UKF (STUKF) are presented in this study for the detection of icing. By using the unscented transformation to estimate the probability density of state distribution, the UKF circumvents the laborious Jacobian matrix computation of the EKF [13], simplifying the algorithm’s implementation. Additionally, since the system is a high-order nonlinear system, the UKF improves accuracy by lowering the linearization error of the EKF. The UKF, conversely, struggles to monitor the abruptly changing parameters and is vulnerable to model uncertainty. This work introduces STUKF to improve the tracking performance and robustness of the UKF. The prediction covariance of the UKF is altered by the STUKF using an adaptive suboptimal fading factor, after which the Kalman gain matrix is adjusted live. The orthogonality concept is used to determine the suboptimal fading factor [14,15]. The performance of the STUKF has been assessed by simulations based on a nonlinear six-degree-of-freedom aircraft model.
The rest of this paper is structured as follows: In Section 2, the models for the simulations are presented, including the icing aircraft model and ice accretion model. The UKF and STUKF algorithms for icing identification are introduced in Section 3. The simulation results of the methods are presented and discussed in Section 4. Finally, the conclusions are given in Section 5.

2. Model

This section describes the model of an icing aircraft that is used for simulations. The subject aircraft is a civil configuration with a size and aerodynamic layout similar to that of an A320. Elevators, ailerons, and rudders are examples of the aircraft’s traditional control surfaces. The thrust generated by engines is in the x-axis of the body reference frame.

2.1. Motion Equations

The airplane is treated as a rigid body, and the assumption is made that the Earth is flat and does not rotate for the sake of simplicity. In the aircraft model, which is a nonlinear model with six degrees of freedom, the motion of the aircraft is given by Equations (1)–(4) [16]:
u ˙ v ˙ w ˙ = r v q w p w r u q u p v + 1 m X + T Y Z + g sin θ sin ϕ cos θ cos ϕ cos θ
p ˙ q ˙ r ˙ = J 1 L M N p q r × J p q r
ϕ ˙ θ ˙ ψ ˙ = 1 sin ϕ tan θ cos ϕ tan θ 0 cos ϕ sin ϕ 0 sin ϕ / cos θ cos ϕ / cos θ p q r
x ˙ y ˙ z ˙ = cos ψ cos θ sin ψ cos ϕ + cos ψ sin θ sin ϕ sin ψ sin ϕ + cos ψ sin θ cos ϕ sin ψ cos θ cos ψ cos ϕ + sin ψ sin θ sin ϕ cos ψ sin ϕ + sin ψ sin θ cos ϕ sin θ cos θ sin ϕ cos θ cos ϕ u v w
Here, the velocities are denoted by u, v, and w, while the rotational rates are denoted by p, q, and r, all of which are in the body axis. x, y, and z are location coordinates in the Earth fixed reference frame, while ϕ , θ , and ψ are used to represent the Euler angles. The moment of inertia matrix is denoted by J , the gravitational acceleration is denoted by g, the thrust is denoted by T, and the mass is denoted by m. With X, Y, and Z representing the aerodynamic forces that are stated along the body axis, and L, M, and N representing the aerodynamic moments that occur along the body axis, the following equations may be used to describe these forces and moments:
X Y Z = cos α cos β cos α sin β sin α sin β cos β 0 sin α cos β sin α sin β cos α 1 2 ρ V 2 S C D 1 2 ρ V 2 S C Y 1 2 ρ V 2 S C L
L M N = 1 2 ρ V 2 S b C l 1 2 ρ V 2 S c ¯ C m 1 2 ρ V 2 S b C n
The dimensionless moment coefficients are C l , C m , and C n , whereas the dimensionless force coefficients are C D , C Y , and C L , representing drag, side force, and lift coefficients, respectively. Angle of attack α , sideslip angle β , air density ρ , airspeed V, wing surface area S, wing span b, and mean aerodynamic chord c ¯ are all represented by these variables. The dimensionless coefficients of aerodynamic force and moment are represented by Equation (7).
C D = C D , b a s e α C Y = C Y β β + C Y p p b 2 V + C Y r r b 2 V + C Y δ r δ r C L = C L , b a s e α + C L q q c ¯ 2 V + C L δ e δ e C l = C l β β + C l p p b 2 V + C l r r b 2 V + C l δ a δ a + C l δ r δ r C m = C m , b a s e α + C m q q c ¯ 2 V + C m α ˙ α ˙ c ¯ 2 V + C m δ e δ e C n = C n β β + C n p p b 2 V + C n r r b 2 V + C n δ a δ a + C n δ r δ r
where δ a , δ e , and δ r denote the deflection of ailerons, elevators, and rudders, respectively. C L , b a s e , C D , b a s e , and C m , b a s e are basic coefficients when angular rates and control surface deflections are set to zero. Angle of attack affects the fundamental coefficients. The data of basic coefficients are given by wind tunnel experiments. Digital Datcom uses empirical methods and lookup tables of current aircraft designs to determine stability and control derivatives, such as C Y β .

2.2. Icing Effect on Model

In iced-aircraft modeling, it is important to characterize how ice accumulation affects the aircraft. The results of wind tunnel research and flight testing demonstrate that ice accretion on aircraft mostly alters the aerodynamic model of the aircraft, resulting in changes to the aerodynamic parameters.
To describe icing effects, Bragg et al. presented a model in 2000 that had a straightforward structure and a clear physical meaning [17]. The study of flight simulation for aircraft icing has made extensive use of this model. Equation (8) may be used to estimate the aerodynamic parameters of iced aircraft.
C A i c e = 1 + η k C A C A
For clean and iced aircraft, the arbitrary aerodynamic coefficients are C A and C A i c e , respectively. An icing severity measure called η is used to reflect how ice accretion affects an aircraft’s aerodynamic properties; an aircraft with η = 0 is clean, while one with η = 1 is experiencing the highest amount of ice accretion. Here, η represents an equivalent symmetric severity, while asymmetric icing would require extended states or asymmetric coefficients. In this study, the severity parameter η is parameterized from aerodynamic degradation trends reported in previous icing studies on comparable transport-class wings. Direct calibration against flight or wind tunnel measurements was not performed here. Such a calibration will be necessary to align η with measured performance changes for a given aircraft configuration. As a constant for a particular aircraft, k C A is the weight factor of C A , which quantifies the impact of ice accretion on various aerodynamic characteristics.
With this model, the aerodynamic parameters under different levels of icing severity could be calculated [18]. The basic aerodynamic data with η = 0 and η = 1 are achieved using wind tunnel experiments, the clean and iced aircraft’s lift, drag, and pitch moment curves are exhibited in Figure 1. Figure 1 shows aerodynamic coefficients for clean and iced conditions, taken from published wind tunnel tests. The experiments used an aircraft model similar to the A320 configuration in a wind tunnel for clean and iced conditions. Details of the measurement technique and icing simulation are given in [19]. Lift loss and drag increment is obvious on icing, especially at a higher angle of attack [20]. At high angles of attack beyond stall, the clean and iced curves converge because the flow is fully separated over most of the wing, making the incremental effect of leading-edge ice negligible. Stability and control derivatives also vary more or less, Table 1 lists the value of these parameters in both clean and iced configurations.
Ice accretion is actually a continuous varying process, hence the icing severity parameter η varies with time. Melody et al. built a model to calculate the ice accretion rate [8]. The differential equation provides the following model, which accounts for both atmospheric conditions and the quantity of ice that has previously accreted:
η ˙ = k 1 1 + k 2 η d η
where d η is the atmosphere icing-friendly factor. The constant coefficients k 1 and k 2 are derived from an expected profile of ice severity that is defined by the length of the icing encounter. As ice accretion rises, k 2 > 0 causes the ice accretion rate to increase, whereas k 2 < 0 has the opposite effect.
The scenario explored in this research is predicated on a period of level, steady flying interrupted by a “cloud” of possible icing conditions. The duration time T c l d and the icing severity factor at T c l d and T c l d / 2 , respectively, define the icing encounter; hence, η T c l d and η T c l d / 2 . Equation (10) assumes that the atmosphere conduciveness to icing is a rising cosine for all of the scenarios covered here.
d η t = 1 2 1 cos 2 π t / T c l d
Substituting T c l d , η T c l d and η T c l d / 2 into Equations (9) and (10), k 1 and k 2 are determined as follows:
k 1 = 2 k 2 T c l d ln 1 + k 2 η T c l d
k 2 = η T c l d 2 η T c l d / 2 η 2 T c l d / 2
According to the equations mentioned above, different icing encounter scenarios can be created by changing T c l d , η T c l d and η T c l d / 2 . As an example, two scenarios with different ice accretion process are modeled, as depicted in Figure 2. The severe icing encounter is characterized by T c l d = 300 , η T c l d = 1 , and η T c l d / 2 = 0.6 . For the mild icing encounter, the corresponding values are T c l d = 600 , η T c l d = 0.4 , and η T c l d / 2 = 0.25 .
The present icing-severity model implicitly assumes a representative ice shape consistent with literature-based aerodynamic degradation coefficients. In reality, ice accretion morphology depends on environmental parameters such as droplet size distribution, liquid water content, and ambient temperature, as well as airfoil geometry. These factors influence both the rate of performance loss and the transient response following ice shedding. Extending the model to explicitly account for such variations will be pursued in future work to enhance estimator generality.

3. Parameter Identification Algorithm

In this section, the UKF and STUKF algorithms used for icing identification are introduced.

3.1. UKF Algorithm

Examining the subsequent discrete stochastic nonlinear system [13]:
x k = f x k 1 , u k 1 + w k 1 y k = h x k + v k
where the nonlinear functions that describe the process and measurement models are f · and h · . The elements x k R n and y k R m at timestep k represent the state and measurement vectors, and w k R n and v k R m represent the uncorrelated zeros-mean Gaussian white noises with the following statistical properties:
E w k = q k E w k w j T = Q k δ k j E v k = r k E v k v j T = R k δ k j E w k v j T = 0
The Kronecker- δ function is δ k j , and q k and r k are the mean vectors of w k and v k , while Q k and R k are the covariance matrices of of w k and v k , respectively.
Equation (13) provides the UKF method for the nonlinear system, which may be explained as follows [21,22,23]:
Step 1:
Initializing the state variable:
x ^ 0 = E x 0
P 0 = E x 0 x ^ 0 x 0 x ^ 0 T
Step 2:
Making a matrix χ of 2 n + 1 by calculating the sigma points χ i
χ i , k 1 = x ^ k 1 i = 0 x ^ k 1 + n + λ P k 1 i i = 1 , 2 , , n x ^ k 1 n + λ P k 1 i n i = n + 1 , n + 2 , , 2 n
The scaling parameter is λ = α 2 n + κ n . The dispersion of sigma points around x ^ k 1 is determined by the constant α , which is often chosen to be a modest positive value. As a supplementary scaling parameter, κ is often set to 3 n or 0. n + λ P k 1 i is the ith column of the matrix that contains the square root of n + λ P k 1 .
Step 3:
Time updating produces a collection of modified samples by propagating each of the sigma points through the process model.
χ i , k | k 1 = f χ i , k 1 , u k 1 + q k 1
The following is an update to the anticipated mean and covariance:
x ^ k | k 1 = i = 0 2 n W i m χ i , k | k 1
P k | k 1 = i = 0 2 n W i c χ i , k | k 1 x ^ k | k 1 χ i , k | k 1 x ^ k | k 1 T + Q k 1
If the sigma points’ scalar weights, W i m and W i c , are chosen as follows:
W i m = λ n + λ i = 0 λ 2 n + λ i = 1 , 2 , , 2 n
W i c = λ n + λ + 1 α 2 + β i = 0 λ 2 n + λ i = 1 , 2 , , 2 n
where previous information of the distribution is included using β . It is ideal to set β to 2 for Gaussian distributions.
A new set of sigma points is then recalculated using the covariance of P k | k 1 and the mean of x ^ k | k 1 . For the new sigma points, χ i , k | k 1 is utilized.
χ i , k 1 = x ^ k | k 1 i = 0 x ^ k | k 1 + n + λ P k | k 1 i i = 1 , 2 , , n x ^ k | k 1 n + λ P k | k 1 i n i = n + 1 , n + 2 , , 2 n
Substituting the sigma points into measurement equations and calculating the anticipated measurements’ weighted mean.
γ i , k | k 1 = h χ i , k 1 + r k
y ^ k | k 1 = i = 0 2 n W i m γ i , k | k 1
Step 4:
Measurement updating: An analysis of the cross-covariance between the anticipated states and measurements, as well as the weighted covariance of the predicted measurements, is performed.
P y , k = i = 0 2 n W i c γ i , k | k 1 y ^ k | k 1 γ i , k | k 1 y ^ k | k 1 T + R k
P x y , k = i = 0 2 n W i c χ i , k | k 1 x ^ k | k 1 γ i , k | k 1 y ^ k | k 1 T
A determination of the Kalman gain is made by
K k = P x y , k P y , k 1
According to the following, the state estimate x ^ k and the error covariance matrix P k that corresponds to it at time step k may be updated.
x ^ k = x ^ k | k 1 + K k y k y ^ k | k 1
P k = P k | k 1 K k P y , k K k T
Step 5:
To proceed to the following time step, repeat Steps 1 through 4.

3.2. Algorithm of the STUKF

UKF may provide outstanding results if the system model under consideration is correct. Nevertheless, uncertainty in the aircraft model’s icing is unavoidable, and the noise statistics change with time. The UKF’s estimating accuracy may drastically decline or the algorithm maybe stop working altogether. The influence of past information on the present state estimate diminishes when the Strong Tracking Filter (STF) adds a time-varying suboptimal fading component to the prediction covariance. STUKF adopts the property of STF to the UKF, obtaining a better estimation accuracy, robustness and suddenly varying status tracking ability than UKF [24,25].
In contrast to UKF, STUKF allows for the introduction of an adaptive fading factor μ k to alter the error covariance matrix in the manner described below:
P k | k 1 = μ k i = 0 2 n W i c χ i , k | k 1 x ^ k | k 1 χ i , k | k 1 x ^ k | k 1 T + Q k 1
In this case, μ k represents the suboptimal fading factor. Use y ˜ k = y k y ^ k | k 1 to represent the innovation vector, and μ k may be determined analytically by resolving the following equations:
E x k x ^ k x k x ^ k T = min E y ˜ k + j y ˜ k T = 0 k = 0 , 1 , , j = 1 , 2 , .
The requirements for a filter to arrive at the best answer are found in the first equation. The orthogonality principle is the name given to the second equation. This implies that in order to obtain all of the valuable information from the innovation sequence, they must be orthogonal to one another.
STF theory states that the suboptimal fading factor μ k may be computed as follows:
μ k + 1 = max 1 , t r N k + 1 / t r M k + 1
N k + 1 = V k + 1 H k + 1 Q k H k + 1 T R k + 1
M k + 1 = H k + 1 Φ k + 1 | k P k Φ k + 1 | k T H k + 1 T = H k + 1 P k + 1 | k l H k + 1 T H k + 1 Q k H k + 1 T = H k + 1 P k + 1 | k l H k + 1 T + R k + 1 V k + 1 + N k + 1
Φ k + 1 | k = f x k , u k x k | x k = x ^ k
H k + 1 = h x k + 1 x k + 1 | x k + 1 = x ^ k + 1 | k
V k = y ˜ k y ˜ k T k = 1 ρ V k 1 + y ˜ k y ˜ k T 1 + ρ k 2
where t r · is an operator to compute the trace of the matrix. Prior to the introduction of μ k , the expected covariance matrix is P k + 1 | k l . ρ is often adjusted to 0.95 as a forgetting factor.
According to Equations (33)–(38), Jacobian matrices Φ k + 1 | k and H k + 1 are necessary to achieve the fading factor; however, Jacobian matrices are sometimes difficult to calculate. A equivalent form of the fading factor calculation is used in this paper; it is described as follows:
N k + 1 = V k + 1 R k + 1 P x y , k + 1 l T P k + 1 | k l T 1 Q k P k + 1 | k l 1 P x y , k + 1 l
M k + 1 = P y , k + 1 l V k + 1 + N k + 1
The Jacobian matrices are no longer required when Equations (33) and (38)–(40) are used to obtain μ k . The following are the primary stages in the STUKF procedure:
Step 1:
Executing traditional UKF procedure from Equation (15) to Equation (27).
Step 2:
Calculating the adaptive fading factor μ k according to Equations (33) and (38)–(40).
Step 3:
Achieving modified P k | k 1 using Equation (31).
Step 4:
Finishing the rest of UKF algorithm with the new P k | k 1 , completing the update of x ^ k and P k .
Step 5:
Repeating the above steps.

3.3. Identification of Icing Severity Parameter

In Figure 3, the icing identification frame is shown. UKF is a state estimation approach. Identifying the icing severity parameter is a parameter estimation problem, which is addressed by augmenting it into the system state for estimation. To do this, the unknown parameters are added to the state vector as extra state variables [26,27].
Considering the aircraft model introduced in Section 2, the state variable of the model is x = u , v , w , p , q , r , ϕ , θ , ψ , x , y , z T , the control variable is x = δ a , δ e , δ r , T T , the output variable is y = V m , α m , β m , p m , q m , r m , ϕ m , θ m , ψ m T . The subscript “m” denotes the variable is a measurement variable. The corresponding observation equations are given as follows:
V m = u 2 + v 2 + w 2 + v V α m = arctan w / u + v α β m = arcsin v / u 2 + v 2 + w 2 + v β p m = p + v p q m = q + v q r m = r + v r ϕ m = ϕ + v ϕ θ m = θ + v θ ψ m = ψ + v ψ
where v * is the corresponding noise of variable *.
One way to express the model is as Equation (13). The icing severity parameter η is treated as a model parameter and assumed to be constant in a very short sample time. The definition of x a = x , η T is the augmented state vector. The following is a description of the expanded system:
x a k = x k η k = f x a k 1 , u k 1 + w k 1 η k 1 + w η k 1 y k = h x a k 1 + v k
where w η is a artificial noise term of η with a small value. Then, the icing severity parameter η may be estimated using the identification procedures presented in this section.

4. Simulation Results

The evaluation focuses on two representative icing-severity profiles (moderate and severe) at a single operating condition: trimmed level flight at 5000 m altitude and 130 m/s airspeed. This setup isolates the filters’ ability to track severity changes without interference from variations in baseline aerodynamic characteristics. Although this restriction limits generalizability, it enables a controlled UKF–STUKF comparison. Future work will extend the analysis to multiple flight regimes and a wider range of icing profiles.
The UKF and STUKF algorithms were simulated in order to assess the precision and promptness of the icing identification. Ice accretion begins at t = 30 s, following the two severity profiles shown in Figure 2. In each case, turbulence is the sole external excitation applied to stimulate the system response. All scenarios start from the trimmed level-flight state at 5000 m and 130 m/s, with a trimmed angle of attack of 7.5 ° and an elevator deflection of +10.8 ° upward [28].
Both process and measurement noise were included in the simulations. Process noise was modeled as zero-mean, band-limited white Gaussian disturbances representing horizontal and vertical body-axis accelerations. These perturbations are denoted by the symbols u ˙ w i n d , v ˙ w i n d , and w ˙ w i n d . The standard deviation of the perturbations, σ u ˙ w i n d , σ u ˙ w i n d , and σ u ˙ w i n d , was used to define the process noise intensity levels. To evaluate algorithm robustness against process noise, three distinct turbulence intensity levels were selected, with σ u ˙ w i n d = σ v ˙ w i n d = σ w ˙ w i n d . A small disturbance is equivalent to 0.05 g, a moderate disturbance is equal to 0.2 g, and a major disturbance is equal to 0.4 g [29]. As shown by Equation (41), there are nine parameters that need to be monitored. The choices made regarding the intensities of measurement noise are determined by the resolutions of the sensors that correspond to them; the values that were used in the simulation are shown in the table. The subscript of σ represents the measurement parameter that corresponds to the relevant value in Table 2.
Before the procedure of icing identification, the initial estimation and covariance of states need to be defined. The initial x a was chosen as [ 130 m / s , 0 m / s , 0 m / s , 0 rad / s , 0 rad / s , 0 rad / s , 0 rad , 0.13 rad , 0 rad , 0 m , 0 m , 5000 m , 0 ] T , corresponding to the trimmed flight state and no-ice status. The initial covariance P 0 was chosen as d i a g ( 10 , 10 , 10 , 0.01 , 0.01 , 0.01 , 0.1 , 0.1 , 0.1 , 100 , 100 , 100 , 0.01 ) . α = 0.0001 , β = 2 , κ = 0 , and μ = 0.95 were the values that were chosen for the parameters that were associated with the UKF and STUKF methods.
To investigate the tracking performance of algorithms when the parameters suddenly change, it was assumed that the deicers were activated after the icing severity parameter η reaches a maximum, and η remained unchanged during deicing. The ice on the airplane surface began to melt 60 s later, and η abruptly dropped to 0. The accuracy and stability of each method were tested using 100 Monte Carlo simulation runs with various noise and icing situations.
The aircraft responses under moderate and severe icing conditions are presented in Figure 4 (up to 830 s) and Figure 5 (up to 530 s), respectively. As the icing severity parameter η increased, the most pronounced effect was a reduction in altitude, with the aircraft descending by approximately 1000 m within 400 s. In operational practice, pilots are required to compensate for this altitude loss through corrective control inputs [30], such as increasing throttle and applying elevator deflection. The angle of attack also increased under icing conditions. Although the increment was relatively small, it remains significant, as icing reduces the stall margin; consequently, even a modest rise in angle of attack elevates the risk of stall. Following ice shedding, the aircraft states exhibited oscillatory behavior, reflecting transient stability effects.
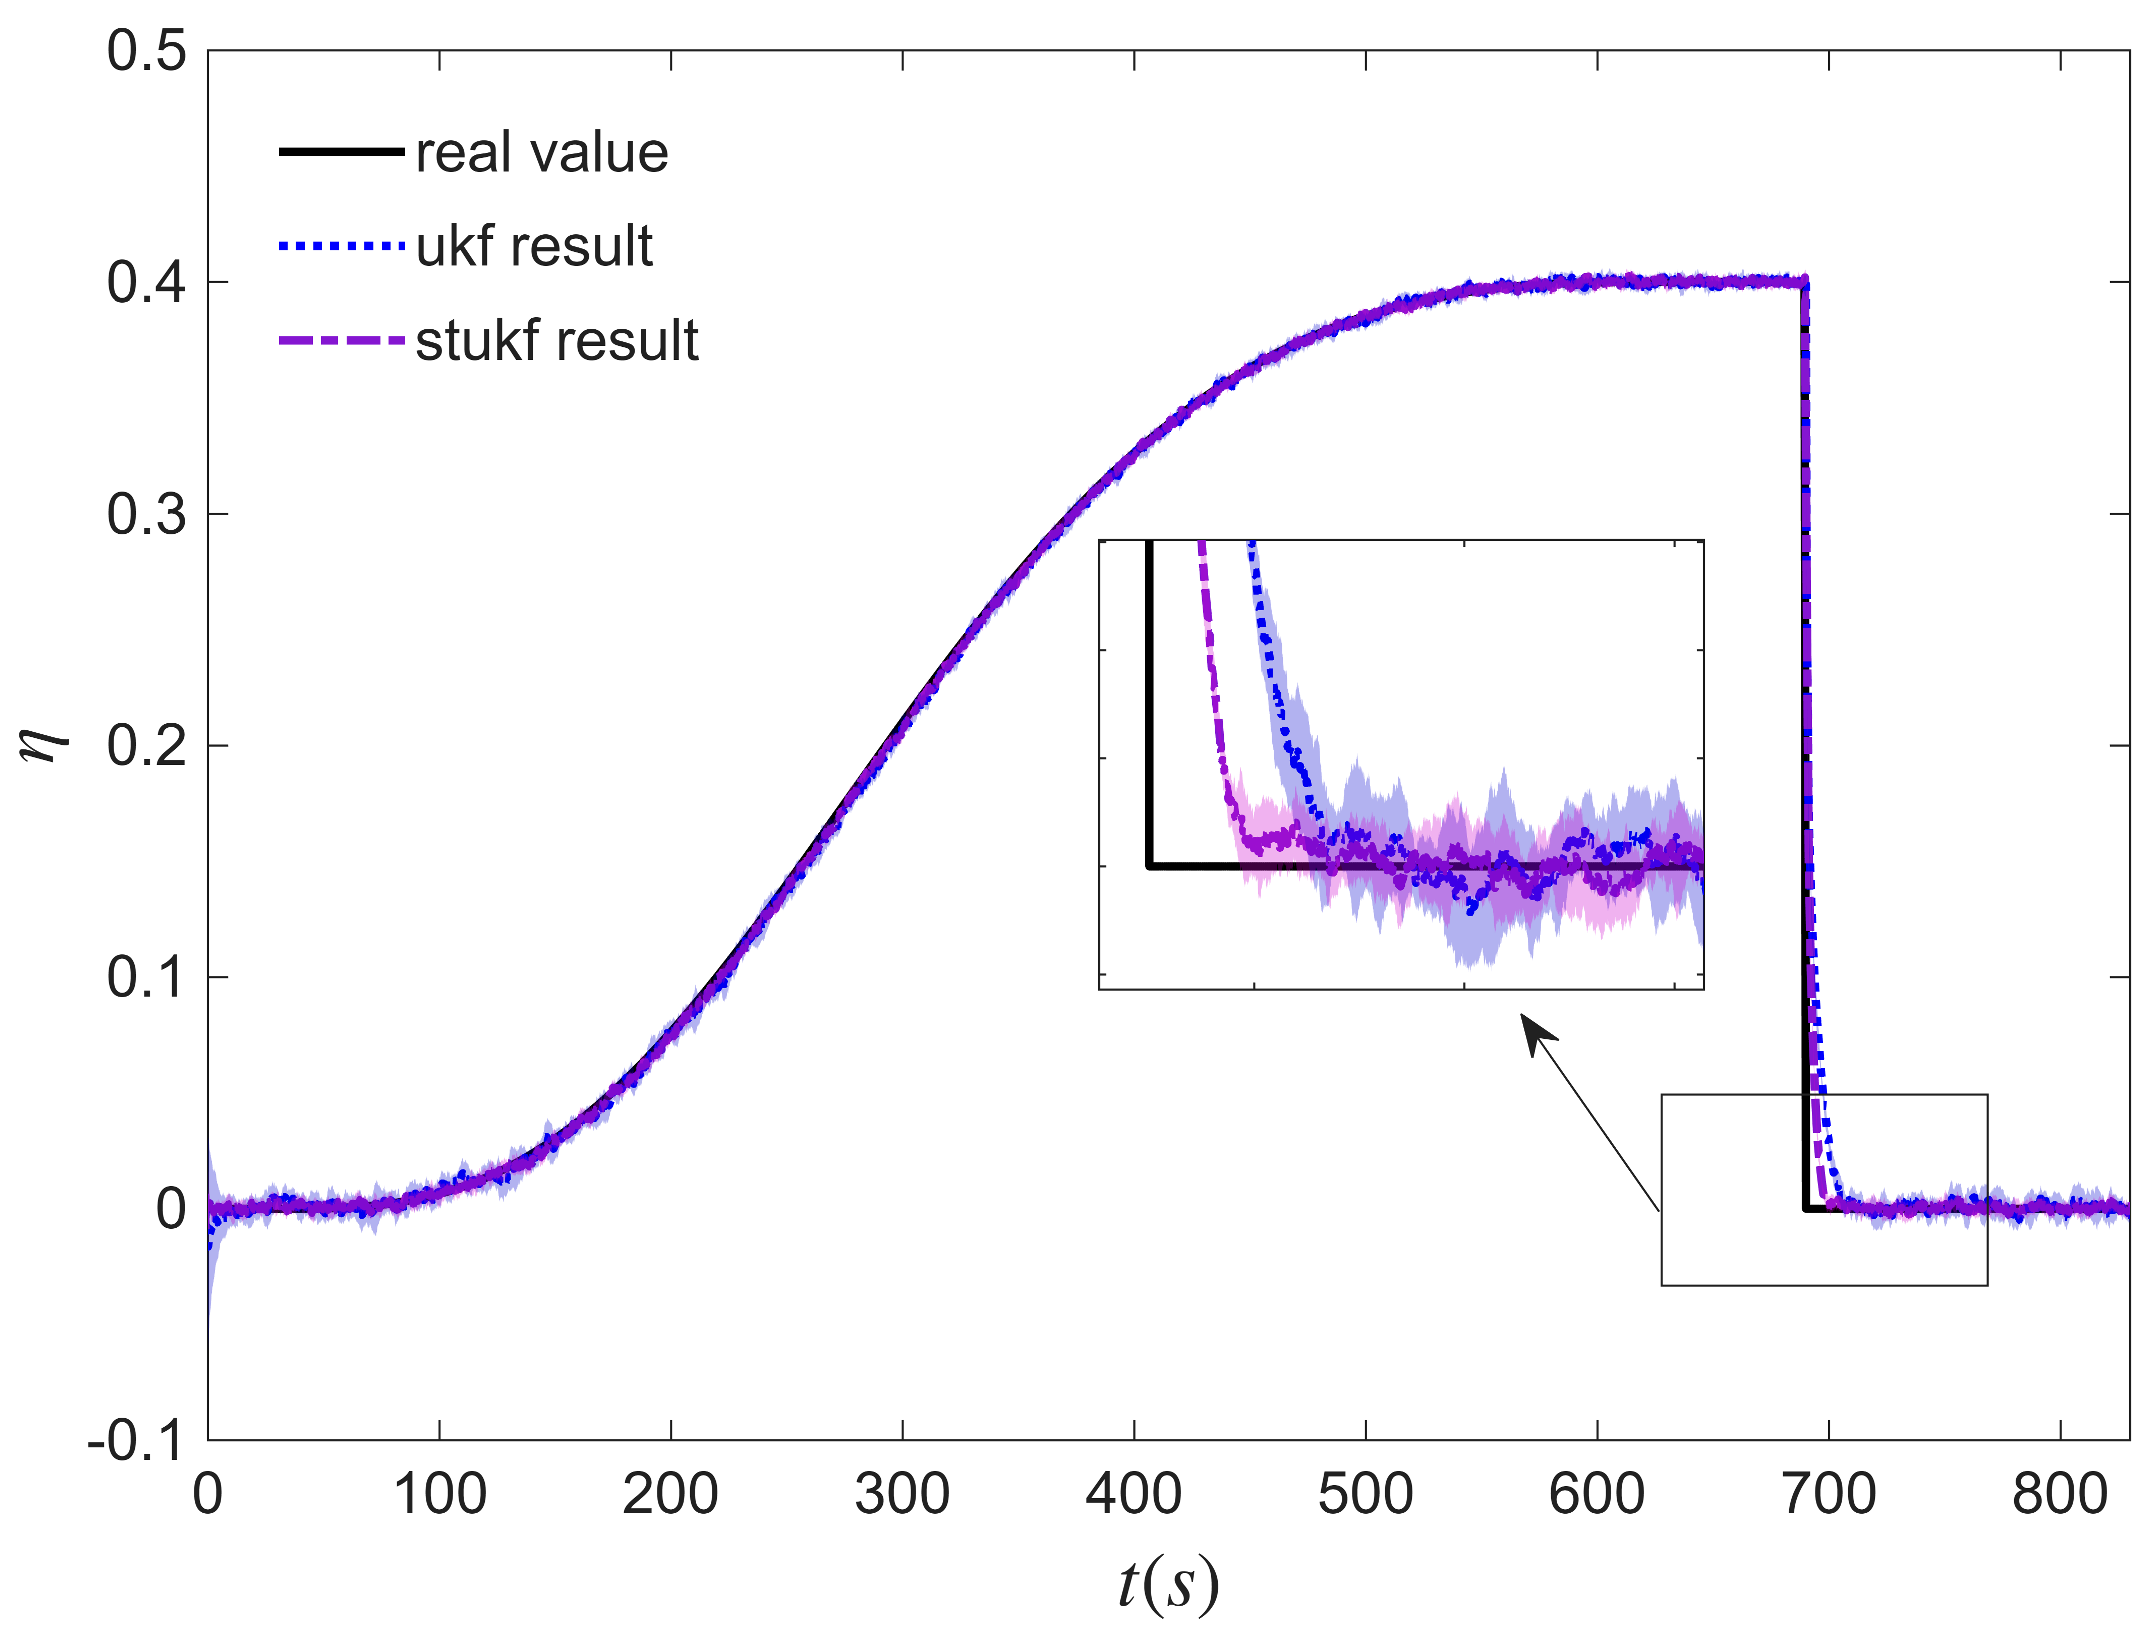
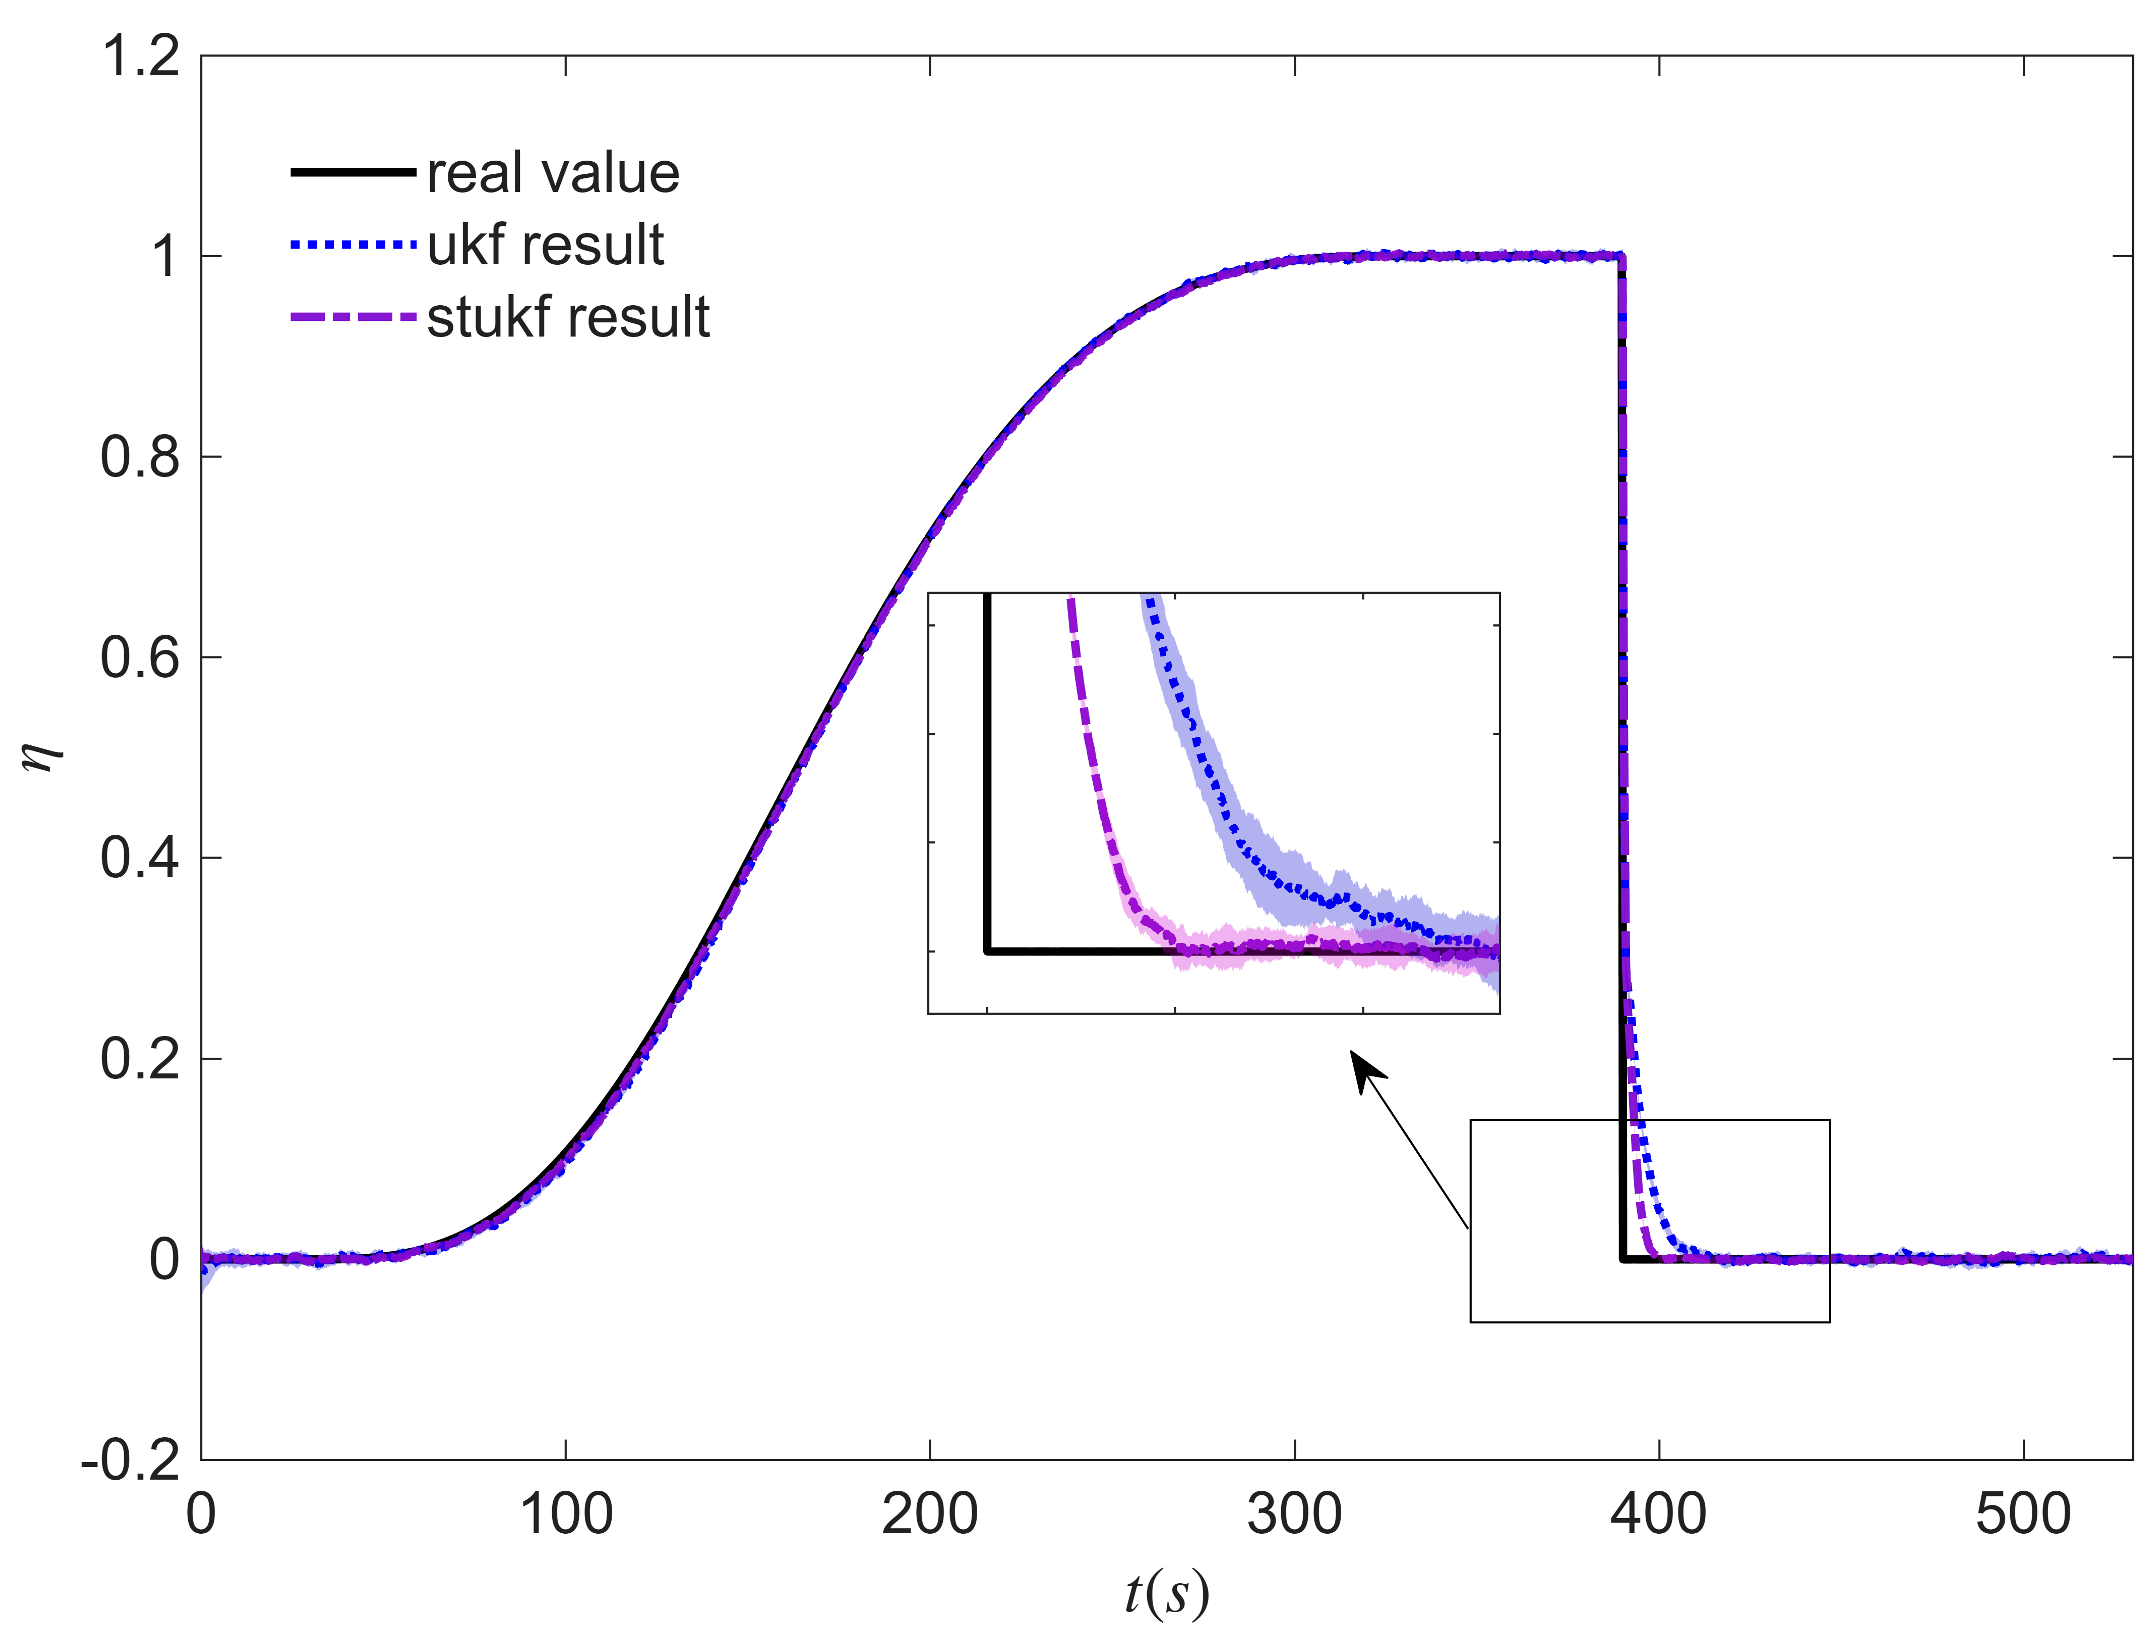
The simulation results of the UKF and STUKF algorithms are shown in Figure 6 and Figure 7. In these plots, the solid lines denote the mean trajectories over 100 Monte Carlo runs, while the shaded regions indicate the ± 1 σ variability around the mean. This representation highlights both the average behavior and the spread across runs. The corresponding statistical metrics, such as the Root Mean Square Error (RMSE) and identification delays, are summarized in Table 3, Table 4 and Table 5. When η slowly varied before the deicers began running, the performance of UKF and STUKF was similar. However, the convergence time of STUKF was much less than that of UKF when η suddenly decreased to 0. Table 3 presents the identification errors of the UKF and STUKF algorithms under different icing conditions and noise intensities. The RMSE of each example was calculated by taking the average of one hundred Monte Carlo simulations. The RMSE values of UKF had a notable increment with the turbulence became stronger, but there was no significant difference in RMSE values when using STUKF. As a result, STUKF is more robust toward noise than UKF [31]. It can also be seen that both algorithms had higher accuracy under the moderate icing condition than the severe icing condition, indicating that the slower variation could be tracked more accurately.
Another issue that must be considered is tracking delay. In reality, different thresholds of icing severity can be defined, and different strategies of icing protection can be implemented according to the thresholds. For example, we can activate the first level of deicers if η = 0.1 , and second level when η = 0.3 . The shorter the tracking delay, the faster the available measures could be taken. Table 4 and Table 5 show the average tracking delays in each case. Four threshold were chosen, including the sudden variation to 0 when there is ice shedding. STUKF could catch up with the abrupt change in icing severity parameter within about 12 s, but UKF took more than 30 s. The performance of STUKF in terms of tracking was much superior to that of UKF, particularly in situations when the parameters saw a quick change. The adaptive fading factor increases the prediction covariance around abrupt changes, allowing STUKF to weight new measurements more and converge faster. This is consistent with the measured identification delays reported in the manuscript: STUKF identifies the sudden drop within around 12 s across noise levels, whereas UKF requires at least 30 s, refer to Table 4 and Table 5. Across all icing scenarios and turbulence intensities, STUKF consistently achieved lower RMSE and shorter identification delays than UKF. These improvements were most pronounced in severe icing with heavy turbulence, where STUKF maintained accuracy while UKF’s performance degraded significantly.
This work evaluates STUKF by Monte-Carlo simulation on a six-DOF aircraft model with literature-based icing-induced aerodynamic degradation and band-limited turbulence perturbations. We did not include cross-dataset comparisons to flight or wind tunnel data because open datasets do not match the present configuration, operating point, and icing-severity parameterization; such a comparison would entangle estimator error with geometry and envelope mismatch. Within this scope, STUKF demonstrates lower RMSE and substantially reduced identification delay versus UKF across turbulence intensities and during abrupt ice shedding. A dedicated experimental validation using matched configuration data (flight test or IRT wind tunnel) is planned as future work and will include calibration of the severity parameter against measured aerodynamic changes.
The computational complexity of STUKF is comparable to that of UKF, as both require identical sigma-point generation and propagation steps for a given state dimension. The primary additional load in STUKF is the fading factor calculation, which consists of vector-matrix multiplications and small-matrix inversions. In simulation, this additional step did not constitute a measurable increase in total runtime relative to UKF. UKF and STUKF were benchmarked in MATLAB 2025a on an Intel Ultra 7 255HX processor. Simulation runtimes for moderate icing (830 s) were 110.4 s (UKF) and 117.0 s (STUKF); for severe icing (530 s), they were 69.3 s and 72.6 s, respectively. These results show that STUKF introduces only a small overhead relative to UKF and is feasible for real-time integration. Therefore, STUKF is computationally feasible for integration into real-time flight control systems, provided that sensor sampling rates and data buses meet the assumed update frequencies. While the present study did not include embedded-hardware benchmarking, the negligible complexity overhead indicates that STUKF can meet the same real-time execution constraints as UKF.
Sudden ice shedding can occur due to aerodynamic loads, temperature changes, or activation of de-icing systems. Such a rapid removal may produce transient aerodynamic and control responses that are more abrupt than the gradual changes modeled in this study. While the STUKF method can detect abrupt parameter changes, ensuring safe flight through these transients also requires integration with flight control laws capable of accommodating rapid shifts in aerodynamic characteristics. Coordinated design of the estimation algorithm and control system is, therefore, essential to maintain stability and handling qualities during sudden ice loss events.

5. Conclusions

Aircraft icing poses serious risks to flight safety by degrading aerodynamic performance and control. While traditional detection systems offer limited information on performance loss, real-time identification of icing severity enables more responsive and adaptive flight management.
This paper proposed a STUKF algorithm for real-time inflight icing identification that combines the nonlinear estimation accuracy of the UKF with the adaptability of strong tracking theory. A time-varying severity parameter was used to represent the icing impact in a nonlinear six-DOF aircraft model. By augmenting this parameter into the state vector, STUKF enabled real-time estimation without the need for Jacobian matrices. Simulation results under various turbulence intensities demonstrated that STUKF outperformed the standard UKF in both accuracy and responsiveness. Notably, it identified sudden drops in icing severity within 12 s even under strong disturbances, while UKF required more than 30 s. STUKF also showed higher robustness to noise and faster convergence across scenarios.
The present study was conducted using a single transport-class aircraft model and a fixed operating condition (trimmed level flight at 5000 m and 130 m/s). As such, the quantitative results are specific to this configuration. Nevertheless, the STUKF-based identification framework is general and can be applied to other aircraft types and flight regimes provided that appropriate aerodynamic and control system models are available. Future work will extend the methodology to multiple configurations and operating conditions to assess broader applicability.
Future research can focus on validating STUKF using experimental or flight test data, comparing its performance with other nonlinear estimation methods, and assessing its real-time computational efficiency for onboard implementation.

Author Contributions

Conceptualization, methodology, software, validation, formal analysis, investigation, writing—original draft preparation, H.L.; resources, writing—review and editing, supervision, project administration, J.A. All authors have read and agreed to the published version of the manuscript.

Funding

This research received no external funding.

Data Availability Statement

The data are available from the corresponding author on reasonable request.

Acknowledgments

The help of the COMAC researchers is much appreciated by the authors.

Conflicts of Interest

The authors declare that they have no known competing financial interests or personal relationships that could have appeared to influence the work reported in this paper.

References

  1. Bragg, M.B. Aircraft Aerodynamic Effects Due To Large Droplet Ice Accretions. In Proceedings of the 34th Aerospace Sciences Meeting and Exhibit, AIAA Paper 96-0932, Reno, NV, USA, 15–18 January 1996. [Google Scholar] [CrossRef]
  2. Caliskan, F.; Hajiyev, C. A Review of In-flight Detection and Identification of Aircraft Icing and Reconfigurable Control. Prog. Aerosp. Sci. 2013, 60, 12–34. [Google Scholar] [CrossRef]
  3. Cole, J.; Sands, W. Statistical Study of Aircraft icing accidents. In Proceedings of the 29th Aerospace Sciences Meeting and Exhibit, AIAA Paper 91-0558, Reno, NV, USA, 7–10 January 1991. [Google Scholar] [CrossRef]
  4. Merret, J.; Hossain, K.N.; Bragg, M.B. Envelope Protection and Atmospheric Disturbances in Icing Encounters. In Proceedings of the 40th Aerospace Sciences Meeting and Exhibit, AIAA Paper 2002-0814, Reno, NV, USA, 14–17 January 2002. [Google Scholar] [CrossRef]
  5. Bragg, M.B.; Perkins, W.R.; Sarter, N.B.; Basar, T.; Voulgaris, P.G.; Gurbacki, H.M.; Melody, J.W.; McCray, S.S. An Interdisciplinary Approach to Inflight Aircraft Icing Safety. In Proceedings of the 36th Aerospace Sciences Meeting and Exhibit, AIAA Paper 98-0095, Reno, NV, USA, 12–15 January 1998. [Google Scholar] [CrossRef]
  6. Bragg, M.; Basar, T.; Perkins, W.; Selig, M.; Voulgaris, P.; Melody, J.; Sarter, N. Smart Icing Systems for Aircraft Icing Safety. In Proceedings of the 40th Aerospace Sciences Meeting and Exhibit, AIAA Paper 2002-0813, Reno, NV, USA, 14–17 January 2002. [Google Scholar] [CrossRef]
  7. Melody, J.W.; Basar, T.; Perkins, W.R.; Voulgaris, P.G. Parameter Identification for Inflight Detection and Characterization of Aircraft Icing. Control Eng. Pract. 2000, 8, 985–1001. [Google Scholar] [CrossRef]
  8. Melody, J.W.; Hillbr, T.; Basar, T.; Perkins, W.R. H Parameter Identification for Inflight Detection of Aircraft Icing: The Time-varying Case. Control Eng. Pract. 2001, 8, 1327–1335. [Google Scholar] [CrossRef]
  9. Aykan, R.; Hajiyev, C.; Caliskan, F. Kalman Filter and Neural Network-based Icing Identification Applied to A340 Aircraft Dynamics. Aircr. Eng. Aerosp. Technol. 2005, 77, 23–33. [Google Scholar] [CrossRef]
  10. Caliskan, F.; Aykan, R.; Hajiyev, C. Aircraft Icing Detection, Identification, and Reconfigurable Control Based on Kalman Filtering and Neural Networks. J. Aerosp. Eng. 2008, 21, 51–60. [Google Scholar] [CrossRef]
  11. Dong, Y.; Ai, J. Research on Inflight Parameter Identification and Icing Location Detection of the Aircraft. Aerosp. Sci. Technol. 2013, 29, 305–312. [Google Scholar] [CrossRef]
  12. Farghaly, M.B.; Aldabesh, A. Studying the Effect of Geometric Parameters of Anti-Icing System on the Performance Characteristics of an Airplane Wing: Computational Analysis. Case Stud. Therm. Eng. 2025, 73, 106733. [Google Scholar] [CrossRef]
  13. Menegaz, H.M.; Ishihara, J.Y.; Borges, G.A.; Vargas, A.N. A Systematization of the Unscented Kalman Filter Theory. IEEE Trans. Autom. Control 2015, 60, 2583–2598. [Google Scholar] [CrossRef]
  14. Zhou, D.; Wang, Q. Strong Tracking Filtering of Nonlinear Systems With Colored Noise. Trans. Beijing Inst. Technol. 1997, 17, 321–326. [Google Scholar]
  15. Li, M.; Zhu, B.L.; Wang, S.Y.; Zhang, Y.C.; Li, H.Y. Strong Tracking Unscented Kalman Filtering Algorithm Based on Satellite Attitude Determination System. Int. J. Future Gener. Commun. Netw. 2014, 7, 155–166. [Google Scholar] [CrossRef]
  16. Stevens, B.L.; Lewis, F.L.; Johnson, E.N. Aircraft Control and Simulation: Dynamics, Controls Design, and Autonomous Systems; John Wiley & Sons: Hoboken, NJ, USA, 2015. [Google Scholar]
  17. Bragg, M.B.; Hutchison, T.; Merret, J. Effect of Ice Accretion on Aircraft Flight Dynamics. In Proceedings of the 38th Aerospace Sciences Meeting and Exhibit, AIAA Paper 2000-0360, Reno, NV, USA, 10–13 January 2000. [Google Scholar] [CrossRef]
  18. Løw-Hansen, B.; Hann, R.; Stovner, B.N.; Johansen, T.A. UAV Icing: A Survey of Recent Developments in Ice Detection Methods. IFAC-PapersOnLine 2023, 56, 10727–10739. [Google Scholar] [CrossRef]
  19. Enache, A.; Wallisch, J.; van Beeck, J.; Hendrick, P.; Hann, R. Ice Accretion: Image Post-Processing Measurement Techniques for 2D Ice Shapes. Aerospace 2023, 10, 451. [Google Scholar] [CrossRef]
  20. Hann, R. Numerical Simulation of In-Flight Icing of Unmanned Aerial Vehicles. In Handbook of Numerical Simulation of In-Flight Icing; Springer: Berlin/Heidelberg, Germany, 2023. [Google Scholar] [CrossRef]
  21. Huang, P.; Li, H.; Wen, G.; Wang, Z. Application of Adaptive Weighted Strong Tracking Unscented Kalman Filter in Non-Cooperative Maneuvering Target Tracking. Aerospace 2022, 9, 468. [Google Scholar] [CrossRef]
  22. Tian, F.; Wang, S.; Fu, W.; Wei, T. Vehicle Target Tracking Algorithm Based on Improved Strong Tracking Unscented Kalman Filter. Appl. Sci. 2025, 15, 3276. [Google Scholar] [CrossRef]
  23. Liu, J.; Chen, X.; Wang, J. Strong Tracking UKF-Based Hybrid Algorithm and Its Application to Initial Alignment of Rotating SINS With Large Misalignment Angles. IEEE Trans. Ind. Electron. 2022, 70, 833–8343. [Google Scholar] [CrossRef]
  24. Liu, X.; Guan, J.; Jiang, R.; Gao, X.; Chen, B.; Ge, S. Robust Strong Tracking Unscented Kalman Filter for Non-linear Systems with Unknown Inputs. IET Signal Process. 2022, 16, 351–365. [Google Scholar] [CrossRef]
  25. Zhang, L.; Hou, Y. A Modified Strong Tracking Adaptive Kalman Filter for Precision Clock Synchronization. IEEJ Trans. Electr. Electron. Eng. 2023, 18, 1702–1711. [Google Scholar] [CrossRef]
  26. Zhou, Z.; Zhan, M.; Wu, B.; Xu, G.; Zhang, X.; Cheng, J.; Gao, M. A Novel Adaptive Unscented Kalman Filter Algorithm for SOC Estimation to Reduce the Sensitivity of Attenuation Coefficient. Energy 2024, 307, 132598. [Google Scholar] [CrossRef]
  27. Feng, S.; Li, X.; Zhang, S.; Jian, Z.; Duan, H.; Wang, Z. A Review: State Estimation Based on Hybrid Models of Kalman Filter and Neural Network. Syst. Sci. Control Eng. 2023, 11, 2173682. [Google Scholar] [CrossRef]
  28. Løw-Hansen, B.; Müller, N.C.; Coates, E.M.; Johansen, T.A.; Hann, R. Identification of an Electric UAV Propulsion System in Icing Conditions; SAE Technical Paper, No. 2023-01-1378; SAE: Warrendale, PA, USA, 2023. [Google Scholar] [CrossRef]
  29. Løw-Hansen, B.; Hann, R.; Johansen, T.A. UAV Icing: Ice Shedding Detection Method for an Electrothermal De-Icing System. In Proceedings of the AIAA Aviation Forum, Chicago, IL, USA, 27 June–1 July 2022; p. 3904. [Google Scholar] [CrossRef]
  30. Wallisch, J.; Hann, R. UAV Icing: Experimental Investigation of Ice Shedding Times with an Electrothermal De-icing System. In Proceedings of the AIAA AVIATION Forum, Chicago, IL, USA, 27 June–1 July 2022; p. 3905. [Google Scholar] [CrossRef]
  31. Singh, H.; Mishra, K.V.; Chattopadhyay, A. Inverse Unscented Kalman Filter. IEEE Trans. Signal Process. 2024, 72, 2692–2709. [Google Scholar] [CrossRef]
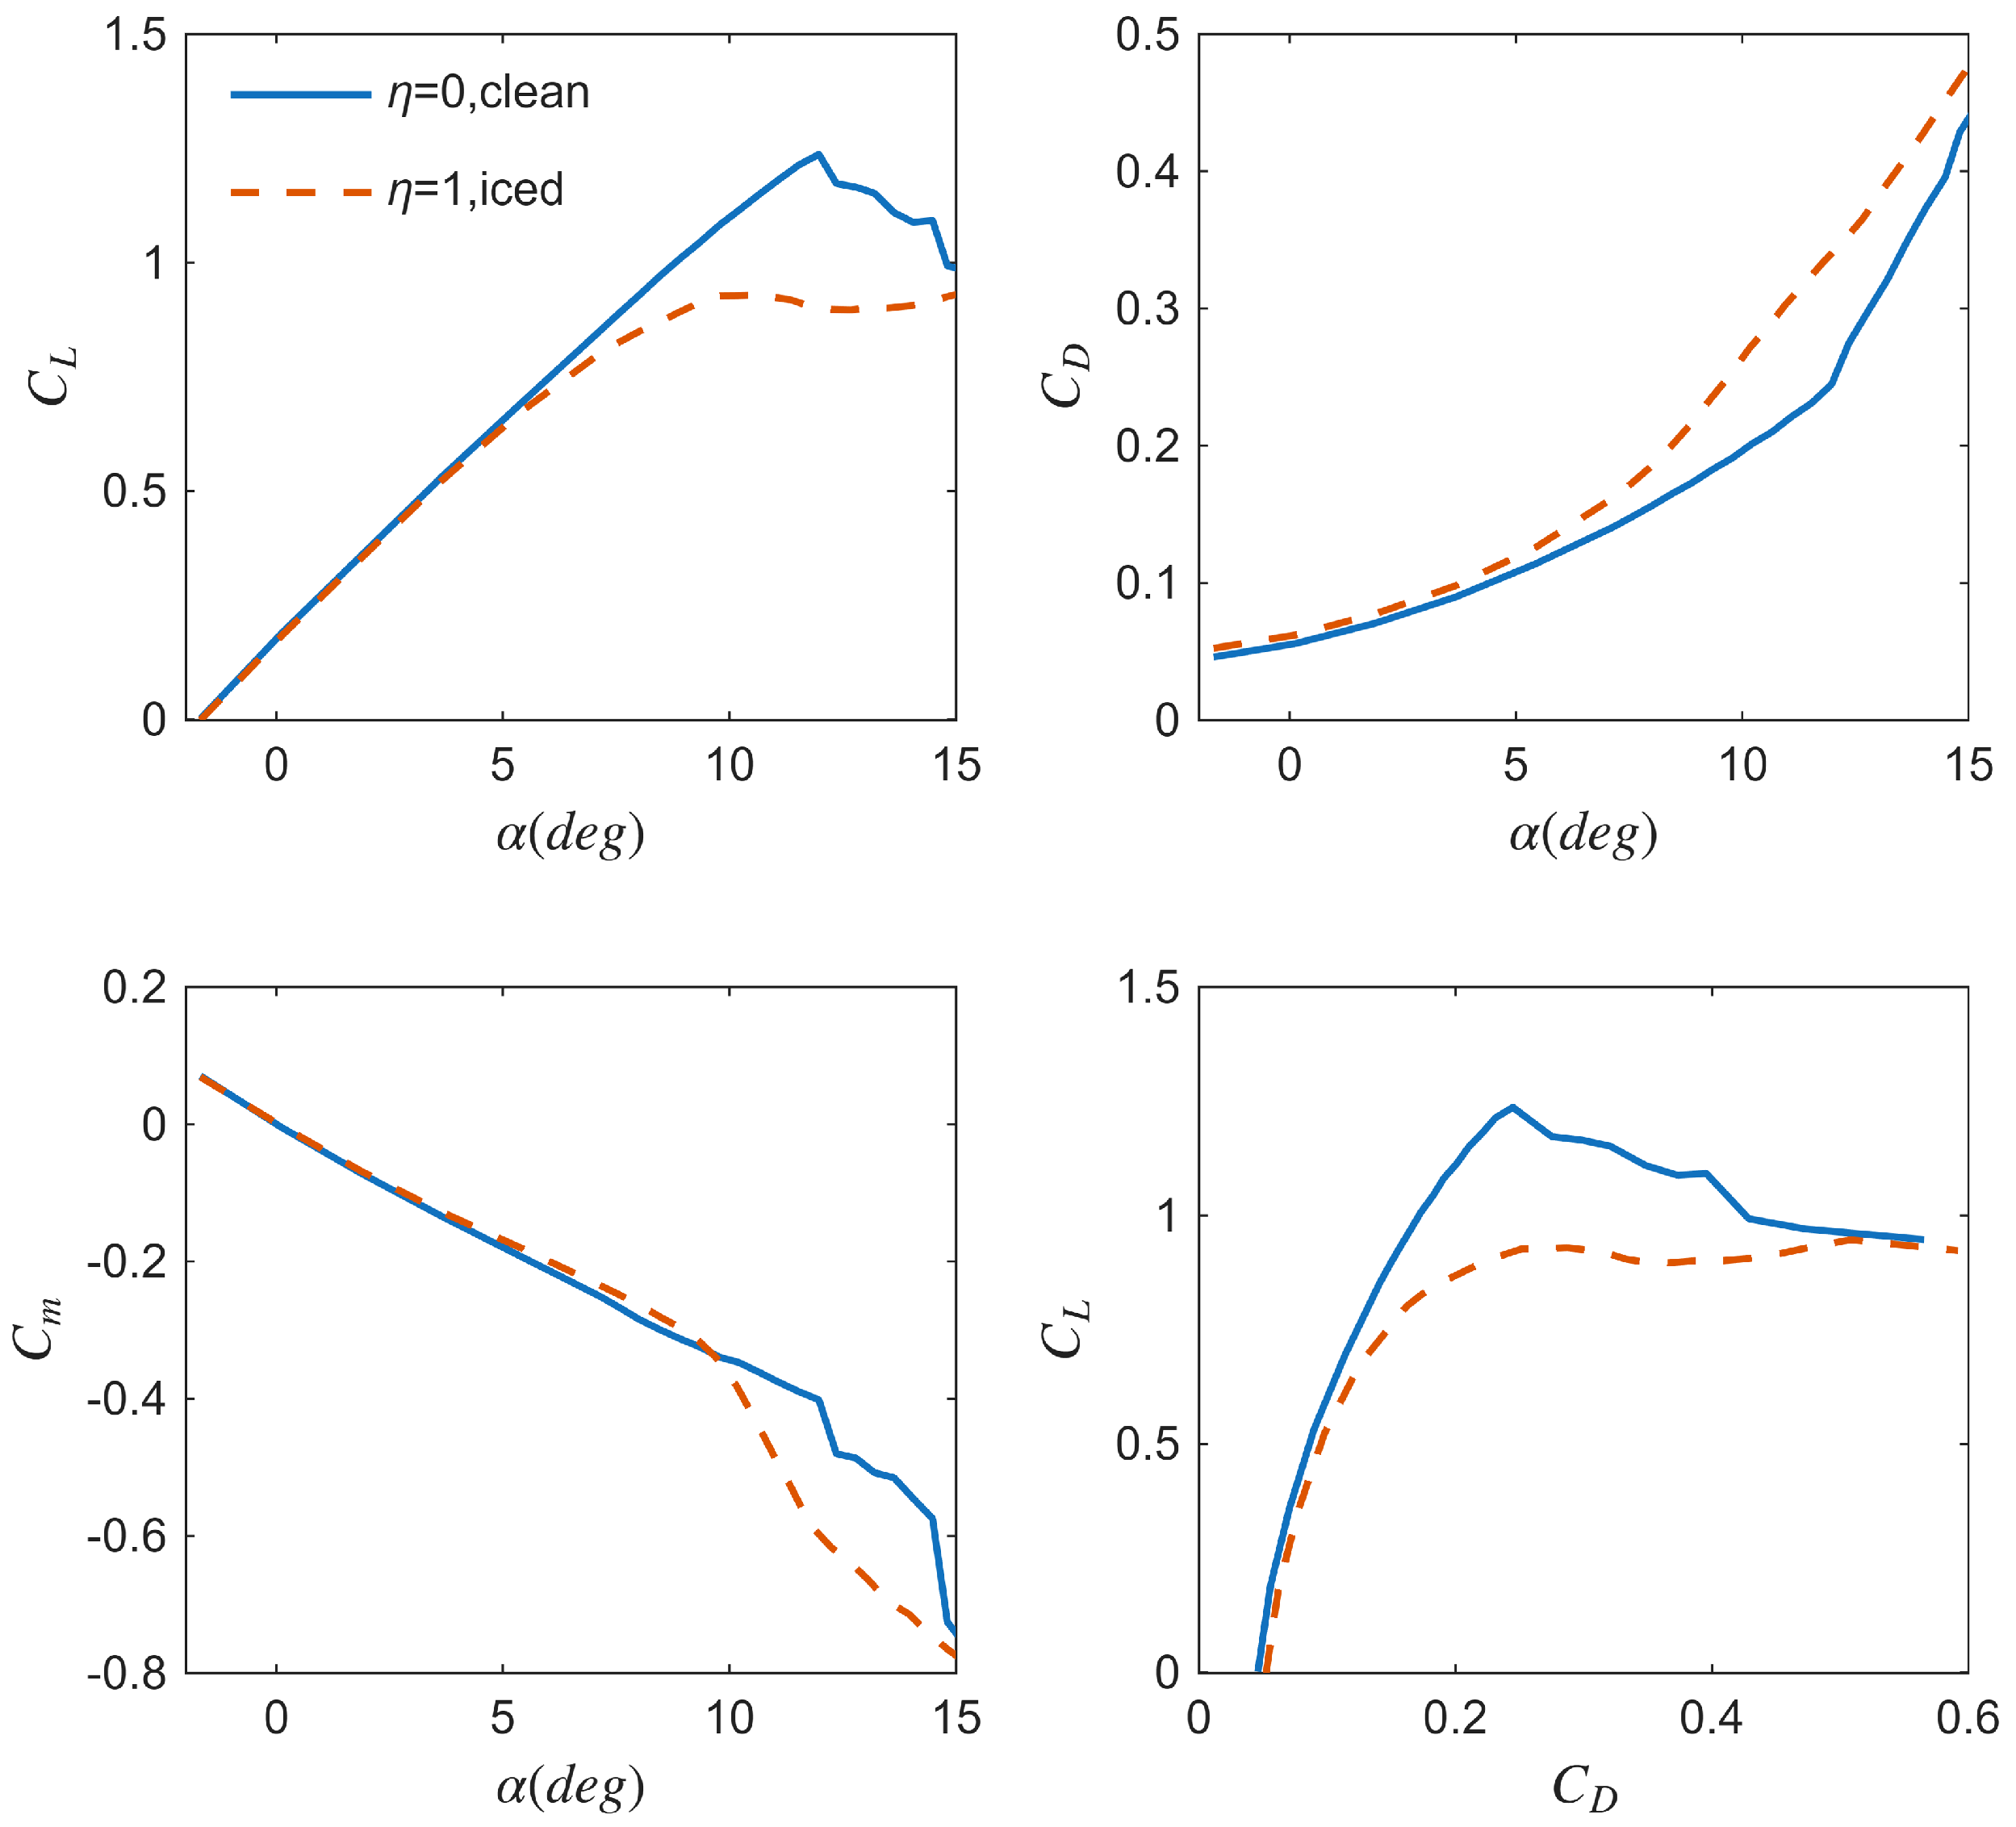
Figure 1. Aerodynamic coefficients in clean and iced configurations.
Aerospace 12 00779 g001
Figure 2. Variation in icing severity parameter in two different icing scenarios.
Aerospace 12 00779 g002
Figure 3. Identification of UKF and STUKF in moderate icing scenario with moderate turbulence.
Aerospace 12 00779 g003
Figure 4. Aircraft response under moderate icing condition with heavy turbulence.
Aerospace 12 00779 g004
Figure 5. Aircraft response under severe icing condition with moderate turbulence.
Aerospace 12 00779 g005
Figure 6. The identification results of UKF and STUKF in moderate icing scenario with heavy turbulence.
Aerospace 12 00779 g006
Figure 7. The identification results of UKF and STUKF in severe icing scenario with moderate turbulence.
Aerospace 12 00779 g007
Table 1. Control derivatives and stability in icy and clean settings.
C L q C L δ e C m q C m α ˙ C m δ e C Y β C Y p C Y r C Y δ r
clean 19.97 0.45 41.45 13.30 1.90 0.60 0.20 0.40 0.15
iced 19.70 0.40 41.45 13.30 1.75 0.48 0.20 0.40 0.14
C l β C l p C l r C l δ a C l δ r C n β C n p C n r C n δ a C n δ r
clean 0.08 0.5 0.06 0.15 0.02 0.10 0.06 0.18 0.12 0.001
iced 0.08 0.5 0.06 0.14 0.02 0.08 0.06 0.17 0.11 0.001
Table 2. Measurement noise intensities chosen in the simulations.
σ V σ α σ β σ p σ q σ r σ ϕ σ θ σ ψ
0.8464 m/s0.003 ° 0.003 ° 0.0069 ° /s0.0069 ° /s0.0069 ° /s0.0293 ° 0.0293 ° 0.0293 °
Table 3. RMSEs of UKF and STUKF in different icing and noise configurations.
Process Noise IntensityModerate IcingSevere Icing
UKFSTUKFUKFSTUKF
light0.00450.00350.00720.0057
moderate0.01170.00370.01520.0058
heavy0.03260.00400.03680.0063
Table 4. Time delays in icing identification of UKF. (“↓” represents the abrupt change).
Process Noise IntensityModerate IcingSevere Icing
η = 0 . 2 η = 0 . 5 η = 0 . 8 η 0 η = 0 . 2 η = 0 . 5 η = 0 . 8 η 0
light4.26//38.65.413.292.5232.7
moderate5.37//44.367.024.423.2439.2
heavy7.10//55.428.225.504.1847.8
Table 5. Time delays in icing identification of STUKF. (“↓” represents the abrupt change).
Process Noise IntensityModerate IcingSevere Icing
η = 0 . 2 η = 0 . 5 η = 0 . 8 η 0 η = 0 . 2 η = 0 . 5 η = 0 . 8 η 0
light4.12//8.323.572.011.775.64
moderate4.56//9.133.982.051.836.17
heavy4.88//11.164.172.071.916.89
Disclaimer/Publisher’s Note: The statements, opinions and data contained in all publications are solely those of the individual author(s) and contributor(s) and not of MDPI and/or the editor(s). MDPI and/or the editor(s) disclaim responsibility for any injury to people or property resulting from any ideas, methods, instructions or products referred to in the content.