Article

A Long Sequence Time-Series Forecasting Method for Early Warning of Long Landing Risks with QAR Flight Data

1
College of Aeronautical Engineering, Air Force Engineering University, Xi’an 710038, China
2
Tianjin Airlines Co., Ltd., Tianjin 300300, China
*
Author to whom correspondence should be addressed.
Aerospace 2025, 12(8), 744; https://doi.org/10.3390/aerospace12080744
Submission received: 28 May 2025 / Revised: 30 July 2025 / Accepted: 12 August 2025 / Published: 21 August 2025
(This article belongs to the Section Air Traffic and Transportation)

Abstract

Long landings can reduce runway utilization and increase the probability of runway incursions and excursions. Previous studies on long landings often lacked support from actual operational data and primarily relied on event-triggering logic established by airlines for parameter exceedance detection and retrospective analysis. In response, a comprehensive risk prediction framework for aircraft long landings, supported by Quick Access Recorder (QAR) data, was constructed. The framework includes a data analysis pipeline, a sequence prediction model, and performance evaluation metrics for accident warning efficiency. Specifically, approximately 3 million rows of real QAR data were collected, and reasonable landing intervals were extracted based on pilots’ correct landing sightlines, attention allocation, and actual visual scenarios at departure heights. Gradient Boosting Decision Trees (GBDT) were employed to develop a method for extracting landing interval feature data, based on monitored parameters and ranges of landing distance. Additionally, the GBDT-Informer long-sequence time series prediction model was developed to forecast landing distance, accompanied by the construction of effective metrics for evaluating prediction performance. The results indicate that the GBDT-Informer model effectively models the temporal dimensions of landing intervals, accurately predicting ground speed (GS), radio altitude (RALT), and landing distance sequences. Compared to other prediction models, the GBDT-Informer model consistently achieved the smallest RMSE, MAE, and MAPE values, demonstrating high prediction accuracy. This predictive framework allows for the analysis of the coupling relationships among multiple parameters in flight data and their interrelations with exceedance anomalies. The findings can be applied in actual flight landings to promptly assess whether landing distances exceed limits, providing quick references for flight crews during landing or go-around decisions, thereby enhancing operational safety margins during the landing phase.

1. Introduction

1.1. Long Landing Incident and QAR

Landing is the most dangerous phase of commercial aircraft flight. Although it accounts for only 1% of the total flight duration, 24% of flight accidents occur during this period, with the incidence of accidents and unsafe events significantly higher than in other flight phases [1,2]. In recent years, the phenomenon of extended landing distances during aircraft landings, caused by various factors, has posed significant risks to operational safety [3]. In response to this situation, civil aviation has established the concept of long landings [4]. It is stipulated that aircraft should land in a standard posture, with the standard landing distance defined as the ground length from the runway threshold (50 ft above ground) to the touchdown point. If the actual landing distance from the runway threshold to the touchdown point exceeds the standard distance, it is classified as a long landing. Specifically, a landing distance that exceeds the standard distance by 750 to 900 m (2450 to 2950 ft) is considered a mild long landing, while a distance greater than 900 m is classified as a severe long landing. Although long landings do not directly cause significant loss of life or property, they can reduce runway utilization and increase the probability of runway incursions and excursions [5,6,7]. Research on the issue of long landings has received considerable attention [8].
Quick Access Recorder (QAR) data refers to the real-time operational parameter data recorded by onboard electronic devices. This data typically includes information on the aircraft’s flight speed, altitude, flight attitude, acceleration, air pressure, temperature, fuel levels, and engine RPM. The introduction of QAR data provides essential flight parameters for studying long landings, as it implicitly reflects the influences of four key factors—human (pilot operations), machine (aircraft performance), environment (operational conditions), and management (human–machine interface)—on the aircraft’s status. The QAR is one of the storage devices in the flight status monitoring system. It continuously records the actual status and failure indication signals of the aircraft throughout its operational period, from engine start to shutdown [9,10]. In practical applications, airlines often utilize flight data analysis methods to detect parameter exceedances related to long landing events and conduct retrospective analyses after flights [4]. However, there has been no use of QAR data for proactive forecasting of landing distance exceedance events to advance safety measures. The FlySmart+ [11] landing performance calculator, widely used in modern commercial aviation, estimates landing distances but lacks real-time integration with aircraft sensors, leading to delays in responding to dynamic changes. Additionally, reliance on manual data input introduces errors and limits real-time recalculations, reducing the accuracy and efficiency of landing performance assessments. Furthermore, due to dynamic propagation effects in tightly coupled aircraft systems, airlines currently struggle to quantify multi-parameter coupling relationships and their synergistic effects with abnormal landing patterns. Consequently, the information extraction rate from the data is extremely low, leading to substantial data waste [12,13].

1.2. Long Landing Research Progress

Based on the formation mechanisms and prevention methods of long landings, previous studies can be divided into two stages. The first stage is represented by the safety initiative to reduce runway excursions issued by aviation safety authorities in 2009 [14], which relied on historical runway excursion accident data as its foundation. Subsequently, factors such as pilot operations, aircraft performance, environment, and air-ground management [15,16,17,18] were gradually incorporated into the analysis, broadening the approaches to studying long landings. According to the revised advisory circular issued by the Federal Aviation Administration (FAA) in 2014 regarding reducing the risk of runway excursions (AC No.: 91-79A) [17], factors such as unstable approaches, landing at high airport elevations or high-density altitudes leading to increased GS, excessive airspeed over the runway threshold, high landing loads, and tailwind landings all contribute to an increased risk of long landings. During this stage, statistical analyses were primarily conducted by establishing relevant models [19,20,21,22]. Methods such as the combined weighting, binary tree principles, CREM (Causal Reasoning Event Model), regression analysis, and variance analysis were employed to study historical long landing events. The limitation of the aforementioned studies lies in their retrospective nature, focusing on analyzing long landing events only after they have occurred, without proactively shifting the safety threshold forward.
With the continuous development of big data, the use of modern technologies to analyze large volumes of high-dimensional and unstructured flight data has become a trend. However, due to the challenges in effectively acquiring, mining, and processing real flight data, research on this issue remains limited. The second phase of research introduces comprehensive QAR data across all time periods, further investigating the relationships between landing distance and various flight parameter variables using traditional machine learning methods or classical statistical models, such as Logistic regression, linear regression models, and SVM-based landing risk models [23,24,25]. However, the processing of features heavily relies on expert experience, and traditional machine learning approaches struggle to capture time series data. Consequently, scholars both domestically and internationally have begun to preliminarily apply deep learning techniques to the processing of QAR data. For instance, CHAO Tong et al. [26] utilized LSTM models to predict landing speeds, demonstrating through experiments that this method is more effective than traditional approaches. Zongwei Kang et al. [27] conducted preliminary research on predicting landing distances and ground speed (GS) time series data using a CNN-LSTM model. Furthermore, deep learning methods for analyzing QAR data and conducting proactive accident prediction have begun to emerge, such as predicting hard landings [28] and fuel flow during the cruise phase [10]. Zhang Peng et al. [29] proposed a flight state prediction method that combines CNN and LSTM, and introduced a prediction algorithm within a multi-task learning (MTL) framework.
The prediction of long landings based on QAR data is essentially a form of Long Sequence Time-Series Forecasting (LSTF), which involves predicting a long sequence with continuous time steps, typically focusing on forecasting values or trends over multiple future time steps [30]. In recent years, the Informer model proposed by Zhou et al. has been developed as an improvement over the Transformer model, aimed at addressing the high time and space complexity issues associated with Transformers, making it more suitable for the study of long time series forecasting problems [31,32,33]. Unfortunately, despite the significant potential of the Informer in time series analysis, there has been no research applying the Informer to real-time warning studies for aircraft long landings.

1.3. Aim and Structure of This Study

A review of the research on long landings reveals several significant limitations. First, the difficulty in obtaining and mining QAR data has slowed the progress of long landing studies. Additionally, prior research has mainly relied on expert experience for delineating landing intervals in QAR data, with no scholars adopting systematic methods for this purpose. Secondly, past studies often focused on retrospective analyses following accidents, with little exploration of proactive warning issues related to long landings. To address these gaps, this work contributes a comprehensive framework for predicting aircraft long landings based on QAR data, which includes a data analysis pipeline, sequence prediction models, and accident warning evaluation metrics. Within the data analysis pipeline, we thoroughly analyze the significance and application methods of QAR data in proactive warnings. Specifically, we obtained approximately 3 million rows of real QAR data and reasonably extracted landing intervals based on pilots’ landing sightlines, attention allocation, and actual visual scenarios at departure heights. We also processed QAR data using machine learning and feature analysis. In the flight sequence prediction model, this work used Gradient Boosting Decision Trees (GBDT) to construct multiple decision trees. This approach captured the nonlinear relationships and interactions between features in QAR data, identifying key factors influencing long landings. Based on this, an effective long-sequence prediction framework, GBDT-Informer, was developed to model and learn from QAR data. Additionally, effective metrics for evaluating long landing performance were constructed, demonstrating that this framework achieved high fitting accuracy in long landing predictions. Overall, this work provides comprehensive and profound insights for proactive warnings related to long landing accidents. Figure 1 illustrates the framework for predicting aircraft long landings based on QAR data.

2. Extraction of Landing Phase Based on QAR Data

2.1. Classification and Characterization of QAR Data

The time series data of QAR parameters are directly obtained from onboard sensors and are widely used by airlines for flight quality monitoring, situational maintenance, performance monitoring, and incident analysis. The QAR data, originally formatted in compliance with the ARINC 717 standard, is decoded using the widely used flight decoding software, AIRFACE, to produce a CSV format table. This data has undergone decoding, with each file documenting multiple parameters throughout the entire flight period. The flight parameters are organized in columns, while each row corresponds to multiple parameter data points at the same timestamp. Analyzing QAR data enhances flight safety management and quality control. For the study of long landings, the QAR data is categorized as shown in Table 1.
QAR data is classified into continuous and discrete types. Continuous parameters include radio altitude (RALT), airspeed, and pitch angle, while discrete variables include landing gear status, flap position, and autopilot engagement. To facilitate the representation of discrete variables, one-hot encoding is employed. For example, the landing gear status is categorized into two states: GROUND and AIR. The GROUND state is encoded as 1, while the AIR state is encoded as 0, and vice versa for the AIR state. Before inputting the selected flight feature data into the training model, erroneous information and fields are removed, missing values are completed using multiple imputation methods, and normalization is applied to map the data to the range [0, 1] to eliminate dimensional differences between features.

2.2. Definition of the Landing Phase

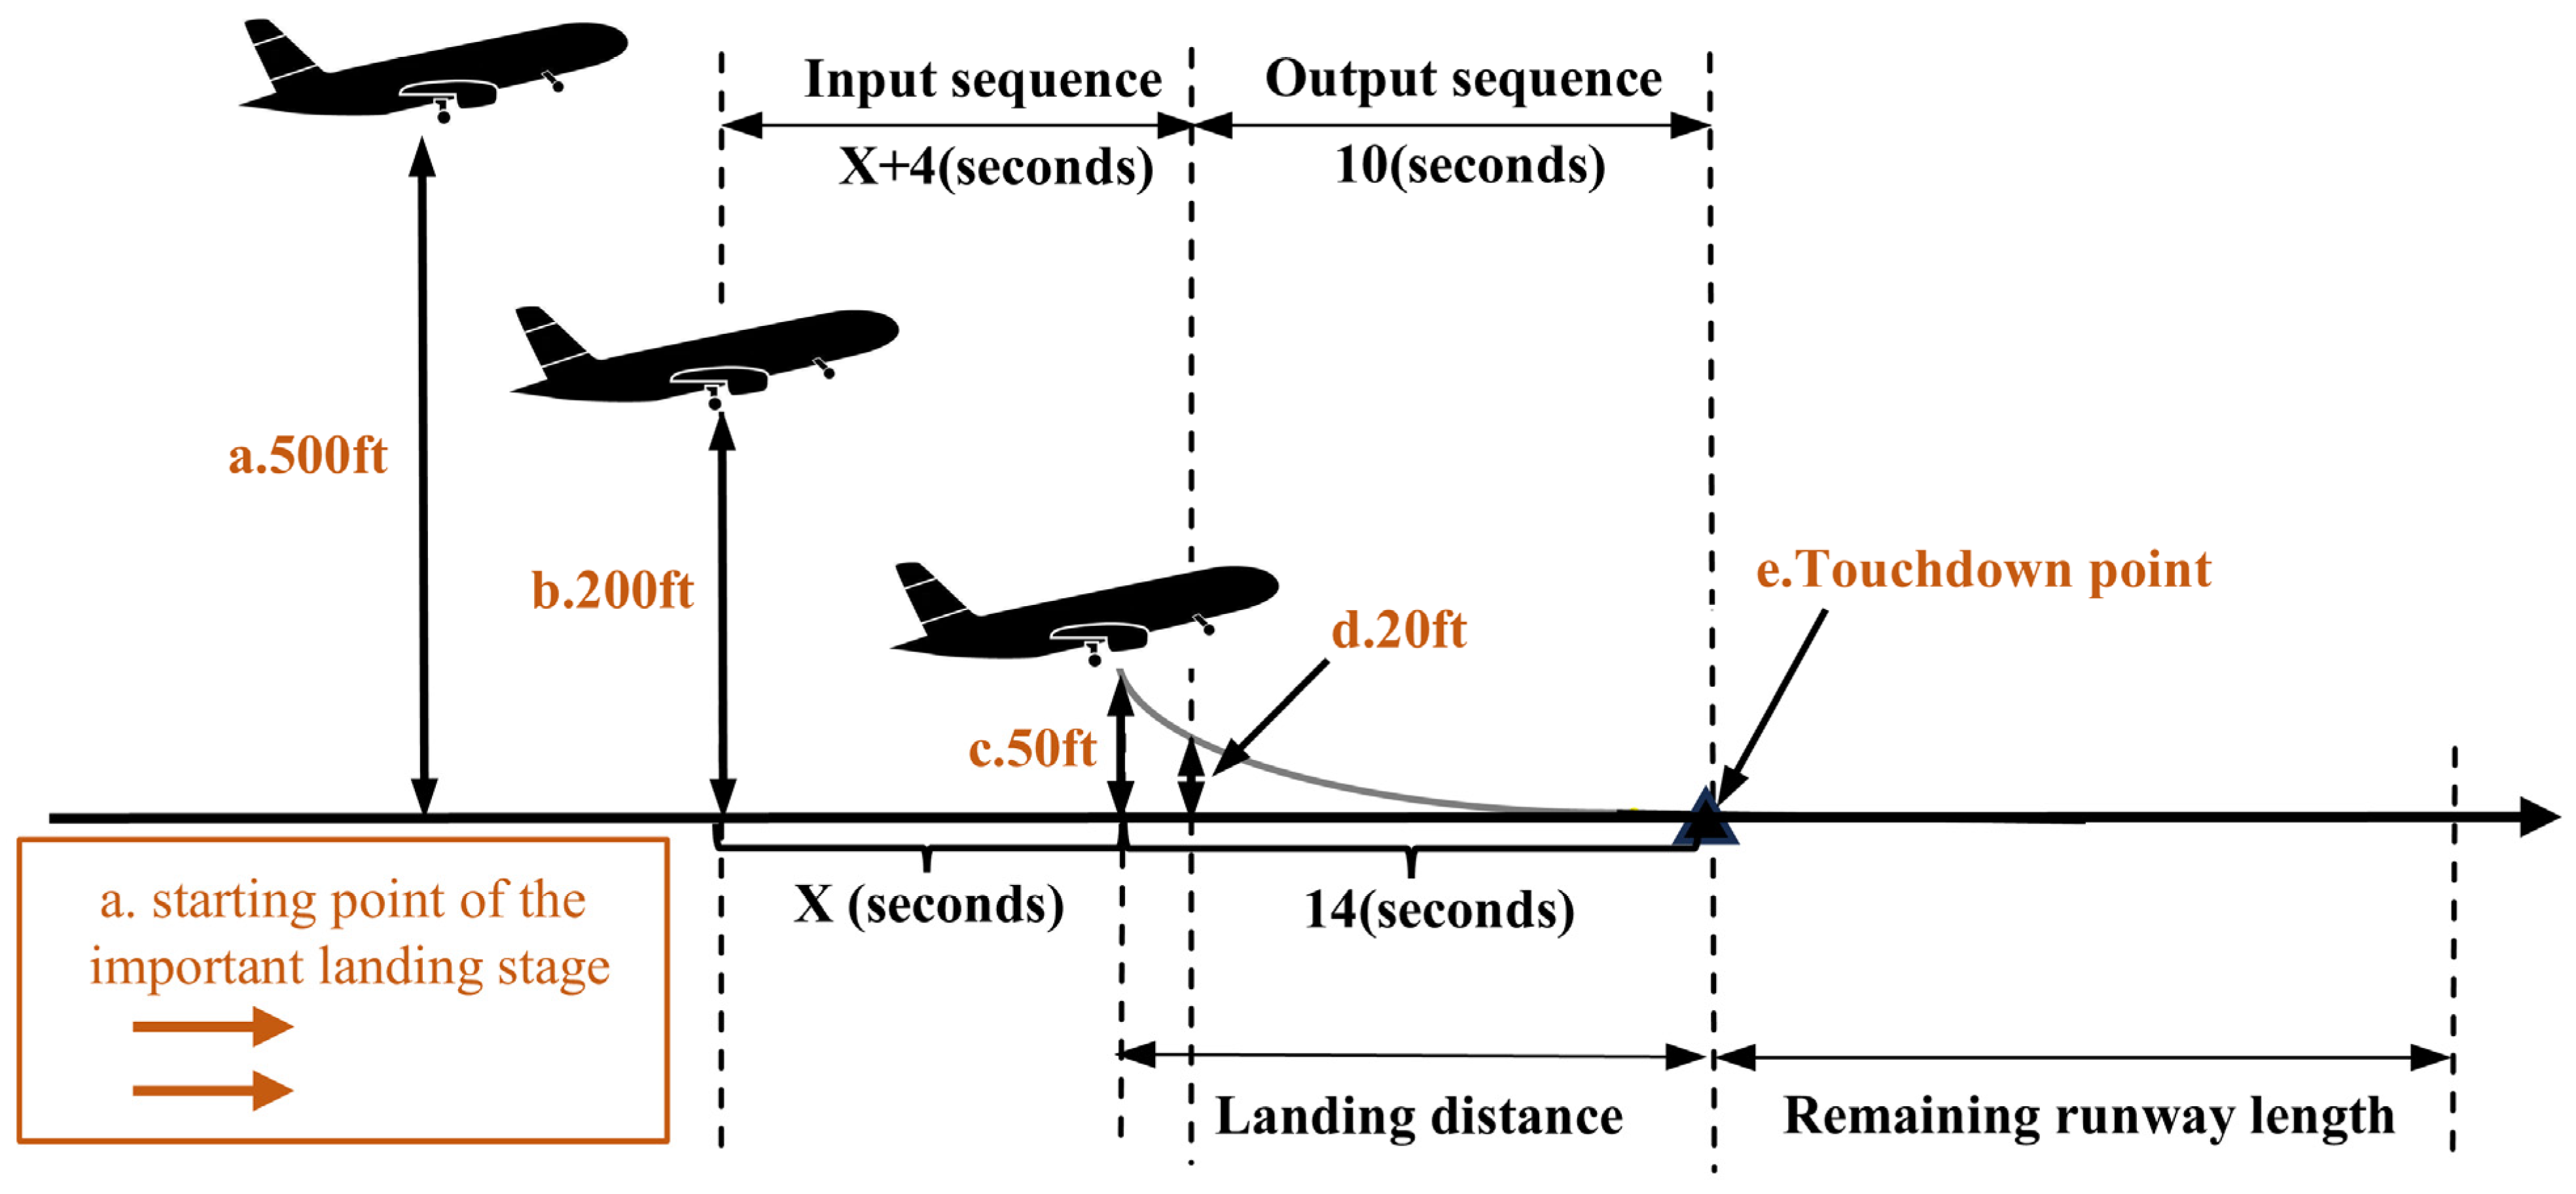
The typical process of aircraft landing is illustrated in Figure 1. During actual operations, various factors such as atmospheric conditions (e.g., wind direction, wind speed, temperature), aircraft performance (e.g., engine status), and pilot skill can affect the landing process, leading to deviations. These deviations are reflected in changes in the aircraft’s attitude and parameters. For long landing events, being able to predict the aircraft’s landing distance during the approach phase enables pilots to adjust the aircraft’s state in a timely manner, thereby helping to reduce the likelihood of long landings.
To predict variations in aircraft landing distance using QAR data, a comprehensive analysis of the landing process is essential. Using real-time RALT as a reference, specific altitude points such as 500, 200, 50, 20, and 0 ft (touchdown point) above ground level (AGL) are analyzed, as illustrated in Figure 2. During the approach phase, the glide path aligns with the ground touchdown point; when the visual reference is fixed, the location of the glide point on the correct trajectory remains constant within the pilot’s field of view. At this stage, from point a to point b in Figure 2, the pilot’s attention is primarily directed towards the instruments, with visual reliance increasing as altitude decreases. Between 200 and 100 ft, the pilot must cross-check instruments with visual references. At point c, the aircraft is approximately at the upper end of the runway threshold, and the distance covered by the aircraft from point c to point e can be approximately defined as the runway length consumed during landing. Below this altitude, flight is conducted visually, controlling the aircraft’s energy to level off and reduce throttle at the appropriate moment. This corresponds to significant visual runway scenes at crucial departure heights during the landing phase, as shown in Figure 3 from points a to e. Based on this analysis of the landing process, the concept of the landing phase is established, corresponding to the interval a–e in Figure 2.

2.3. Application of Landing Phase Parameters

As shown in Figure 2, when the aircraft reaches point a, it enters a critical phase of landing. The input sequence for the deep learning model begins at the key altitude at point b and ends 4 s after point c (i.e., at point d). This input includes significant features that influence GS and RALT, with detailed feature extraction discussed in the next chapter. The interval length of the input sequence is X + 4 s, which represents a crucial period affecting landing quality. The predicted GS and RALT for the interval from d to e serve as the output sequence. Since 99.94% of flights have landing distances within the 5 to 14 s timeframe, the output sequence interval is set to 10 s. Real QAR data from the b–d interval is used as the input sequence for the deep learning model to predict the GS and RALT sequence for the d–e interval. When the aircraft is at 20 ft above the ground, the predicted landing distance can be obtained, assisting pilots and air traffic controllers in monitoring the flight status, making precise adjustments to flight decisions, and preventing incidents such as runway excursions.

3. Methodology

3.1. Problem Formulation

Due to the absence of landing distance as a parameter in QAR data, the monitoring parameter for landing distance, as stated in Advisory Circulars (AC-121/135) [3], is the GS integral distance value. Therefore, GS and RALT serve as indirect indicators for predicting landing distance. When the predicted RALT reaches 0 ft, the aircraft is considered to have touched down, which indicates the length of time for predicting the landing distance. By integrating the predicted GS sequence over the duration of the landing distance prediction, we can obtain the predicted landing distance. Predicting the future time series state of the aircraft during the landing phase is of significant guidance for flight operations and decision-making in this phase, allowing for real-time alerts to pilots during flight and reasonably mitigating the risk of long landing incidents. We define the landing distance prediction problem as follows:
Definition 1—Landing Distance: During the landing phase, the landing distance is defined as the horizontal distance traveled by the aircraft from 50 ft above ground to the touchdown point on the runway (in this work, the landing distance specifically refers to the airborne segment of the landing). The sum of the landing distance and the remaining runway length equals the total runway length. The longer the landing distance, the shorter the remaining runway length, increasing the likelihood of a runway overrun incident.
Based on the definition of landing distance, the landing distance prediction problem is further defined as follows:
Definition 2—Landing Distance Prediction: The QAR data within the 4 s interval following the aircraft’s altitude from 200 ft to 50 ft is used as the input sequence. The interval data from 50 ft after 4 s to touchdown serves as the output sequence, predicting the future landing distance.

3.2. Extraction of Key Features for Landing Distance Based on GBDT

This study employs Gradient Boosting Decision Trees (GBDT) [34,35,36] to construct multiple decision trees that capture the nonlinear relationships and interactions among features in QAR data, identifying key factors that influence GS and RALT. The core of this approach lies in utilizing gradient descent to minimize the loss function, thereby achieving precise modeling of flight data. Figure 4 illustrates a schematic diagram of the GBDT algorithm.
For the given QAR time series training sample set {(x1,y1), (x2,y2), (x3,y3)…(xn,yn)}, the loss function L(yi,c) is used to evaluate the discrepancy between the predicted values and the actual values of the QAR data. Here, c represents the parameters of the initial model, and n denotes the number of QAR sample data points. The formulation for constructing the GBDT model is as follows, and after M iterations, the final learner of GBDT is obtained:
f 0 ( x ) = arg min c i = 0 n L ( y i , c )
r i m = y i f m x i
f M x = F 0 ( x ) + m = 1 M j = 1 J c m j ( x R m j )
Here, m denotes the number of iterations, and j = 1, 2,…, J represents the number of leaf nodes for each tree. cmj is the predicted value at the j-th leaf node of the m-th tree, while Rmj refers to the sample interval associated with the j-th leaf node of the m-th tree.

3.3. Long-Term Time Series Forecasting Based on Informer

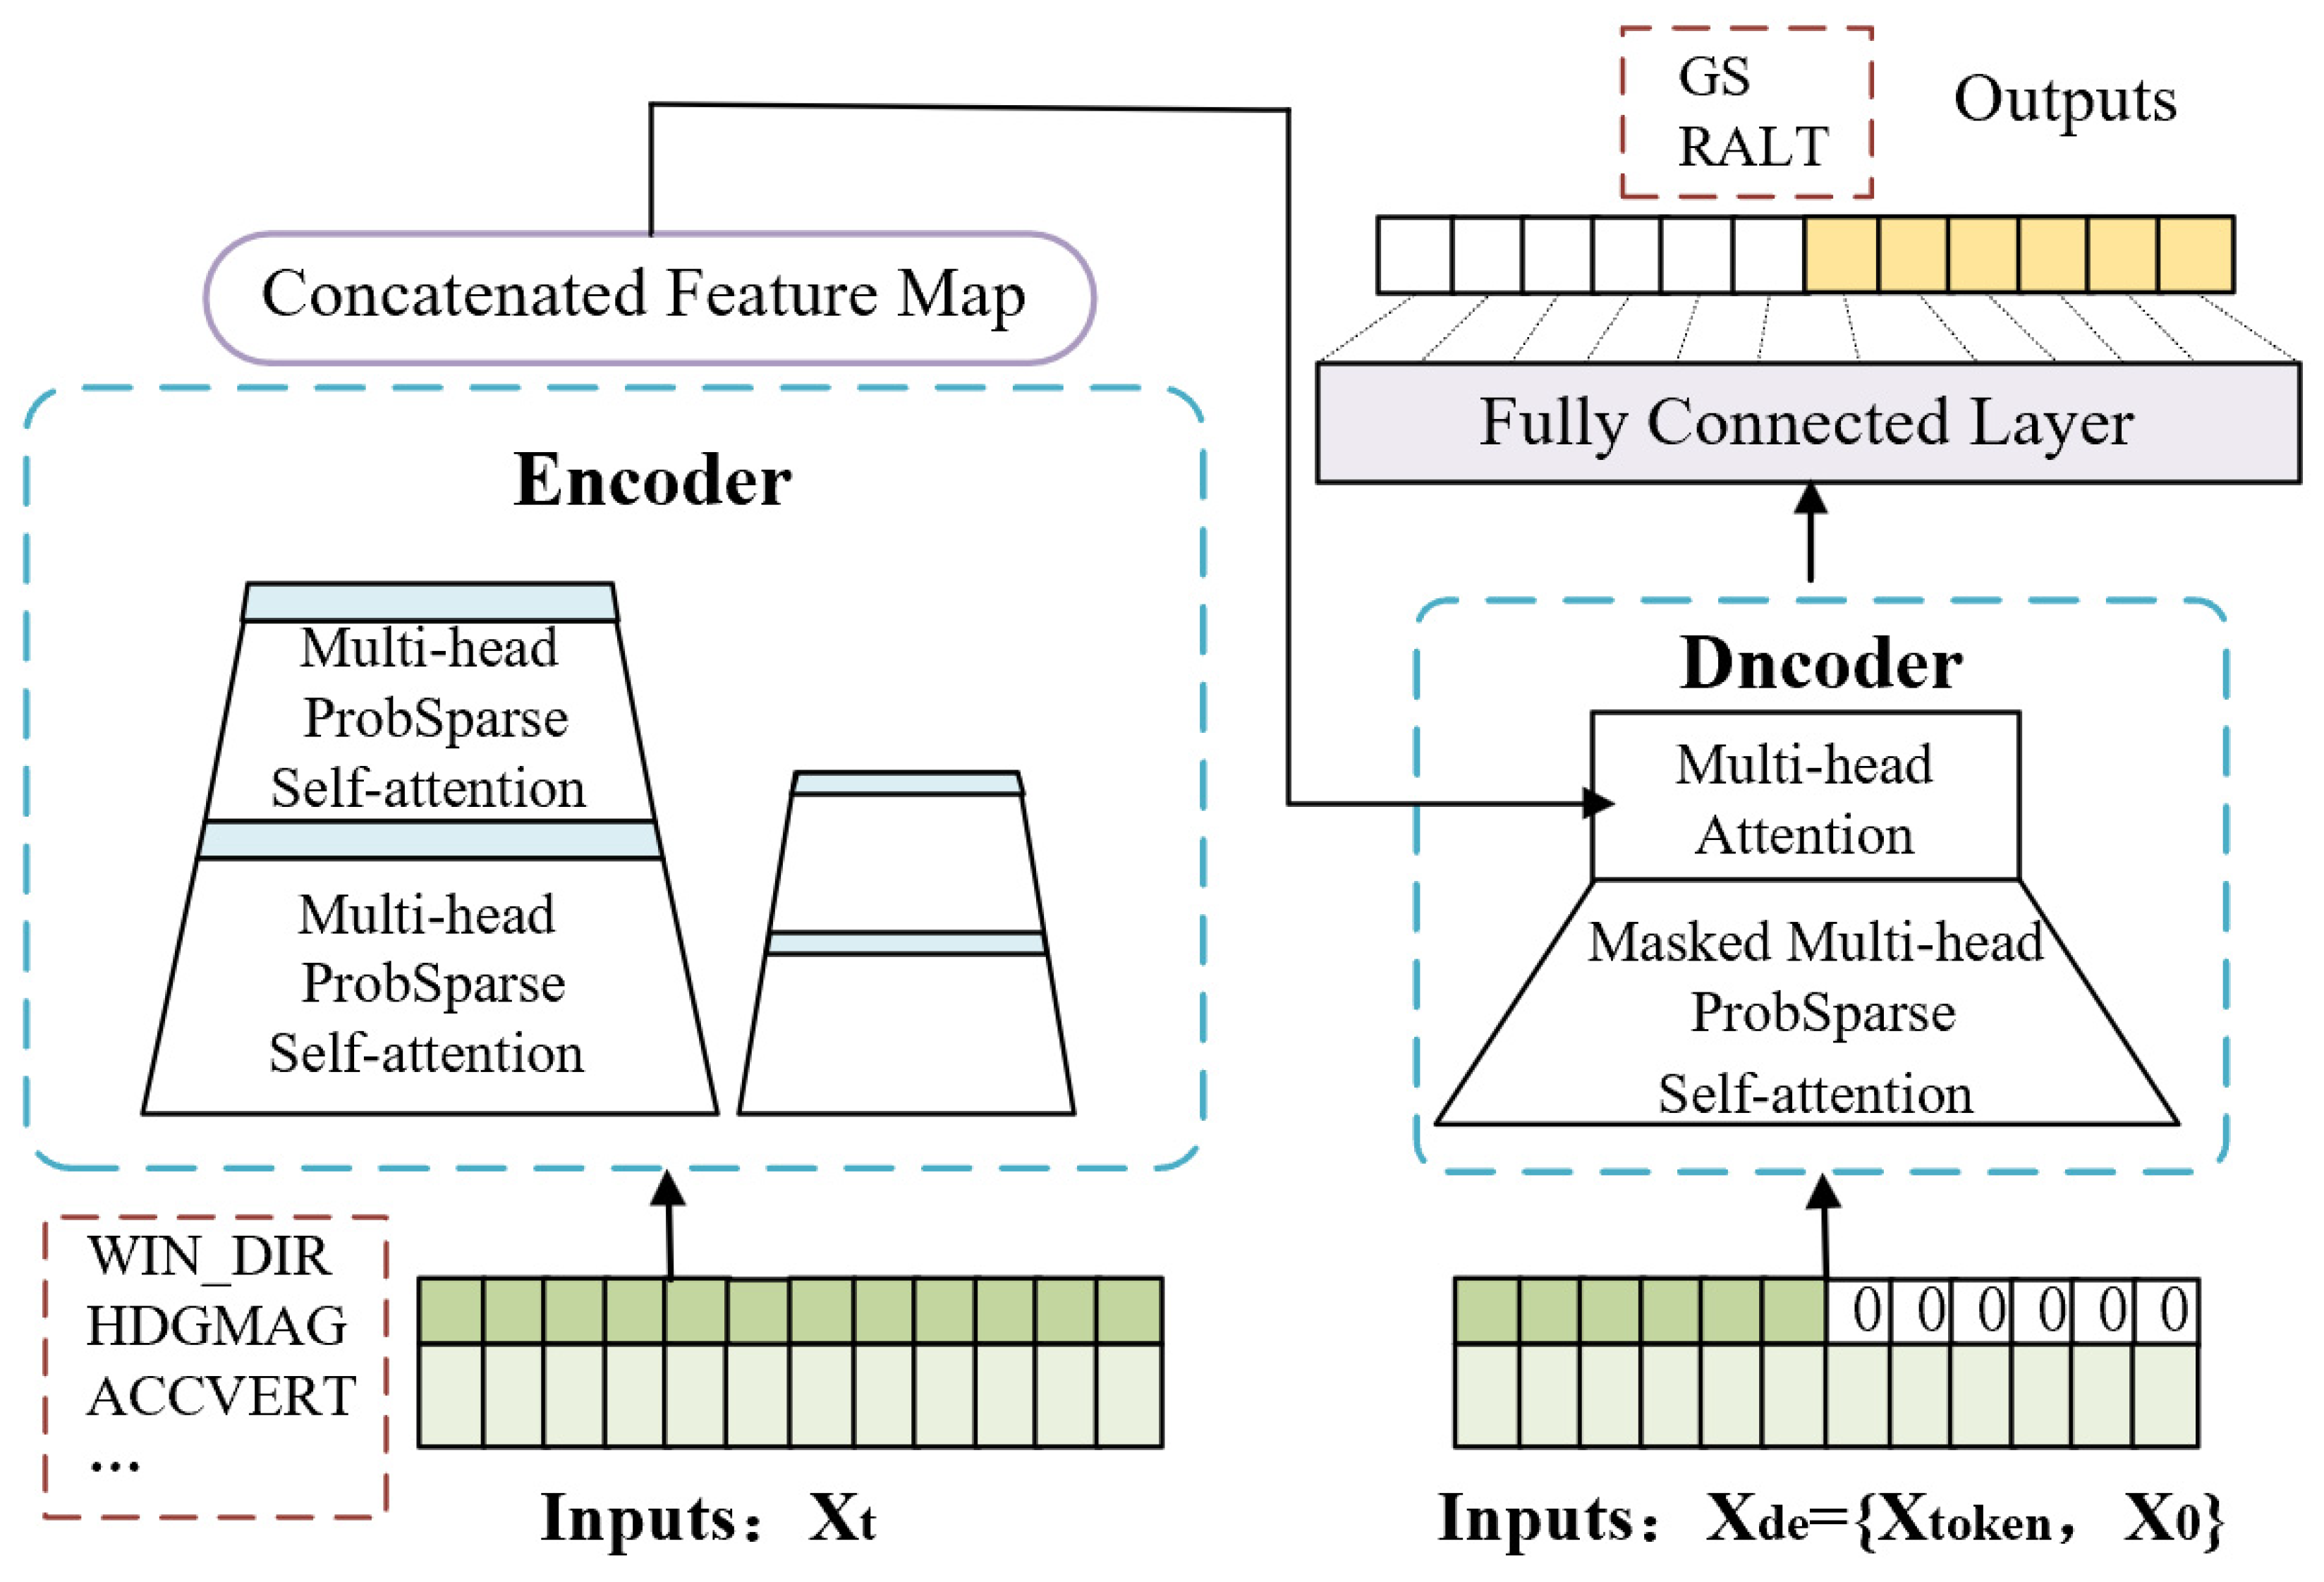
The prediction of long landings based on QAR data is essentially a Long Sequence Time-Series Forecasting (LSTF) problem. The Informer model addresses the high temporal and spatial complexity issues associated with the Transformer architecture, making it more suitable for LSTF research [32,33]. Figure 5 illustrates the structure of the Informer model, where the left side represents the encoder, which receives input from long sequence data such as wind direction and magnetic heading. It utilizes the ProbSparse self-attention module and self-attention distillation module to obtain feature representations of flight parameters. The right side is the decoder, which takes the long time series input and interacts with the encoded features through multi-head attention, ultimately producing a single output of the GS and RALT sequences during the landing phase.

3.3.1. The ProbSparse Self-Attention Mechanism of Informer

The encoder of the Informer model primarily consists of a multi-head probabilistic sparse self-attention module and a distillation module. When processing QAR data, the attention mechanism performs scaled dot-product operations using the query matrix Q, the key matrix K, and the value matrix V. The formula is as follows:
A Q , K , V = Soft max Q K T d V
Here, d represents the input dimension, while LQ denotes the number of rows in matrix Q and d indicates the feature dimension of the matrix. Building on this, the Informer model employs a probabilistic sparse approach to perform random sampling in K, calculating the scaled dot product for each qi (where qiq) with the corresponding keys, as evaluated by the Formula (5). The evaluation values are then sorted in descending order, and the u largest evaluation values are used to obtain the corresponding q values for the original attention calculation, as shown in Formula (7). This process significantly enhances the model’s ability to focus on key features of flight data. In the equations, Q ¯ represents the newly filtered query matrix, u is the number of filtered qi values, and c is the filtering factor, taking a value of 5.
M ¯ ( q i , K ) = max j q i k j T d 1 L K j = 1 L K q i k j T d
u = c · ln L Q
A ( Q ¯ , K , V ) = Soft max ( Q ¯ K T d ) V

3.3.2. The Structure of the Informer Encoder and Decoder

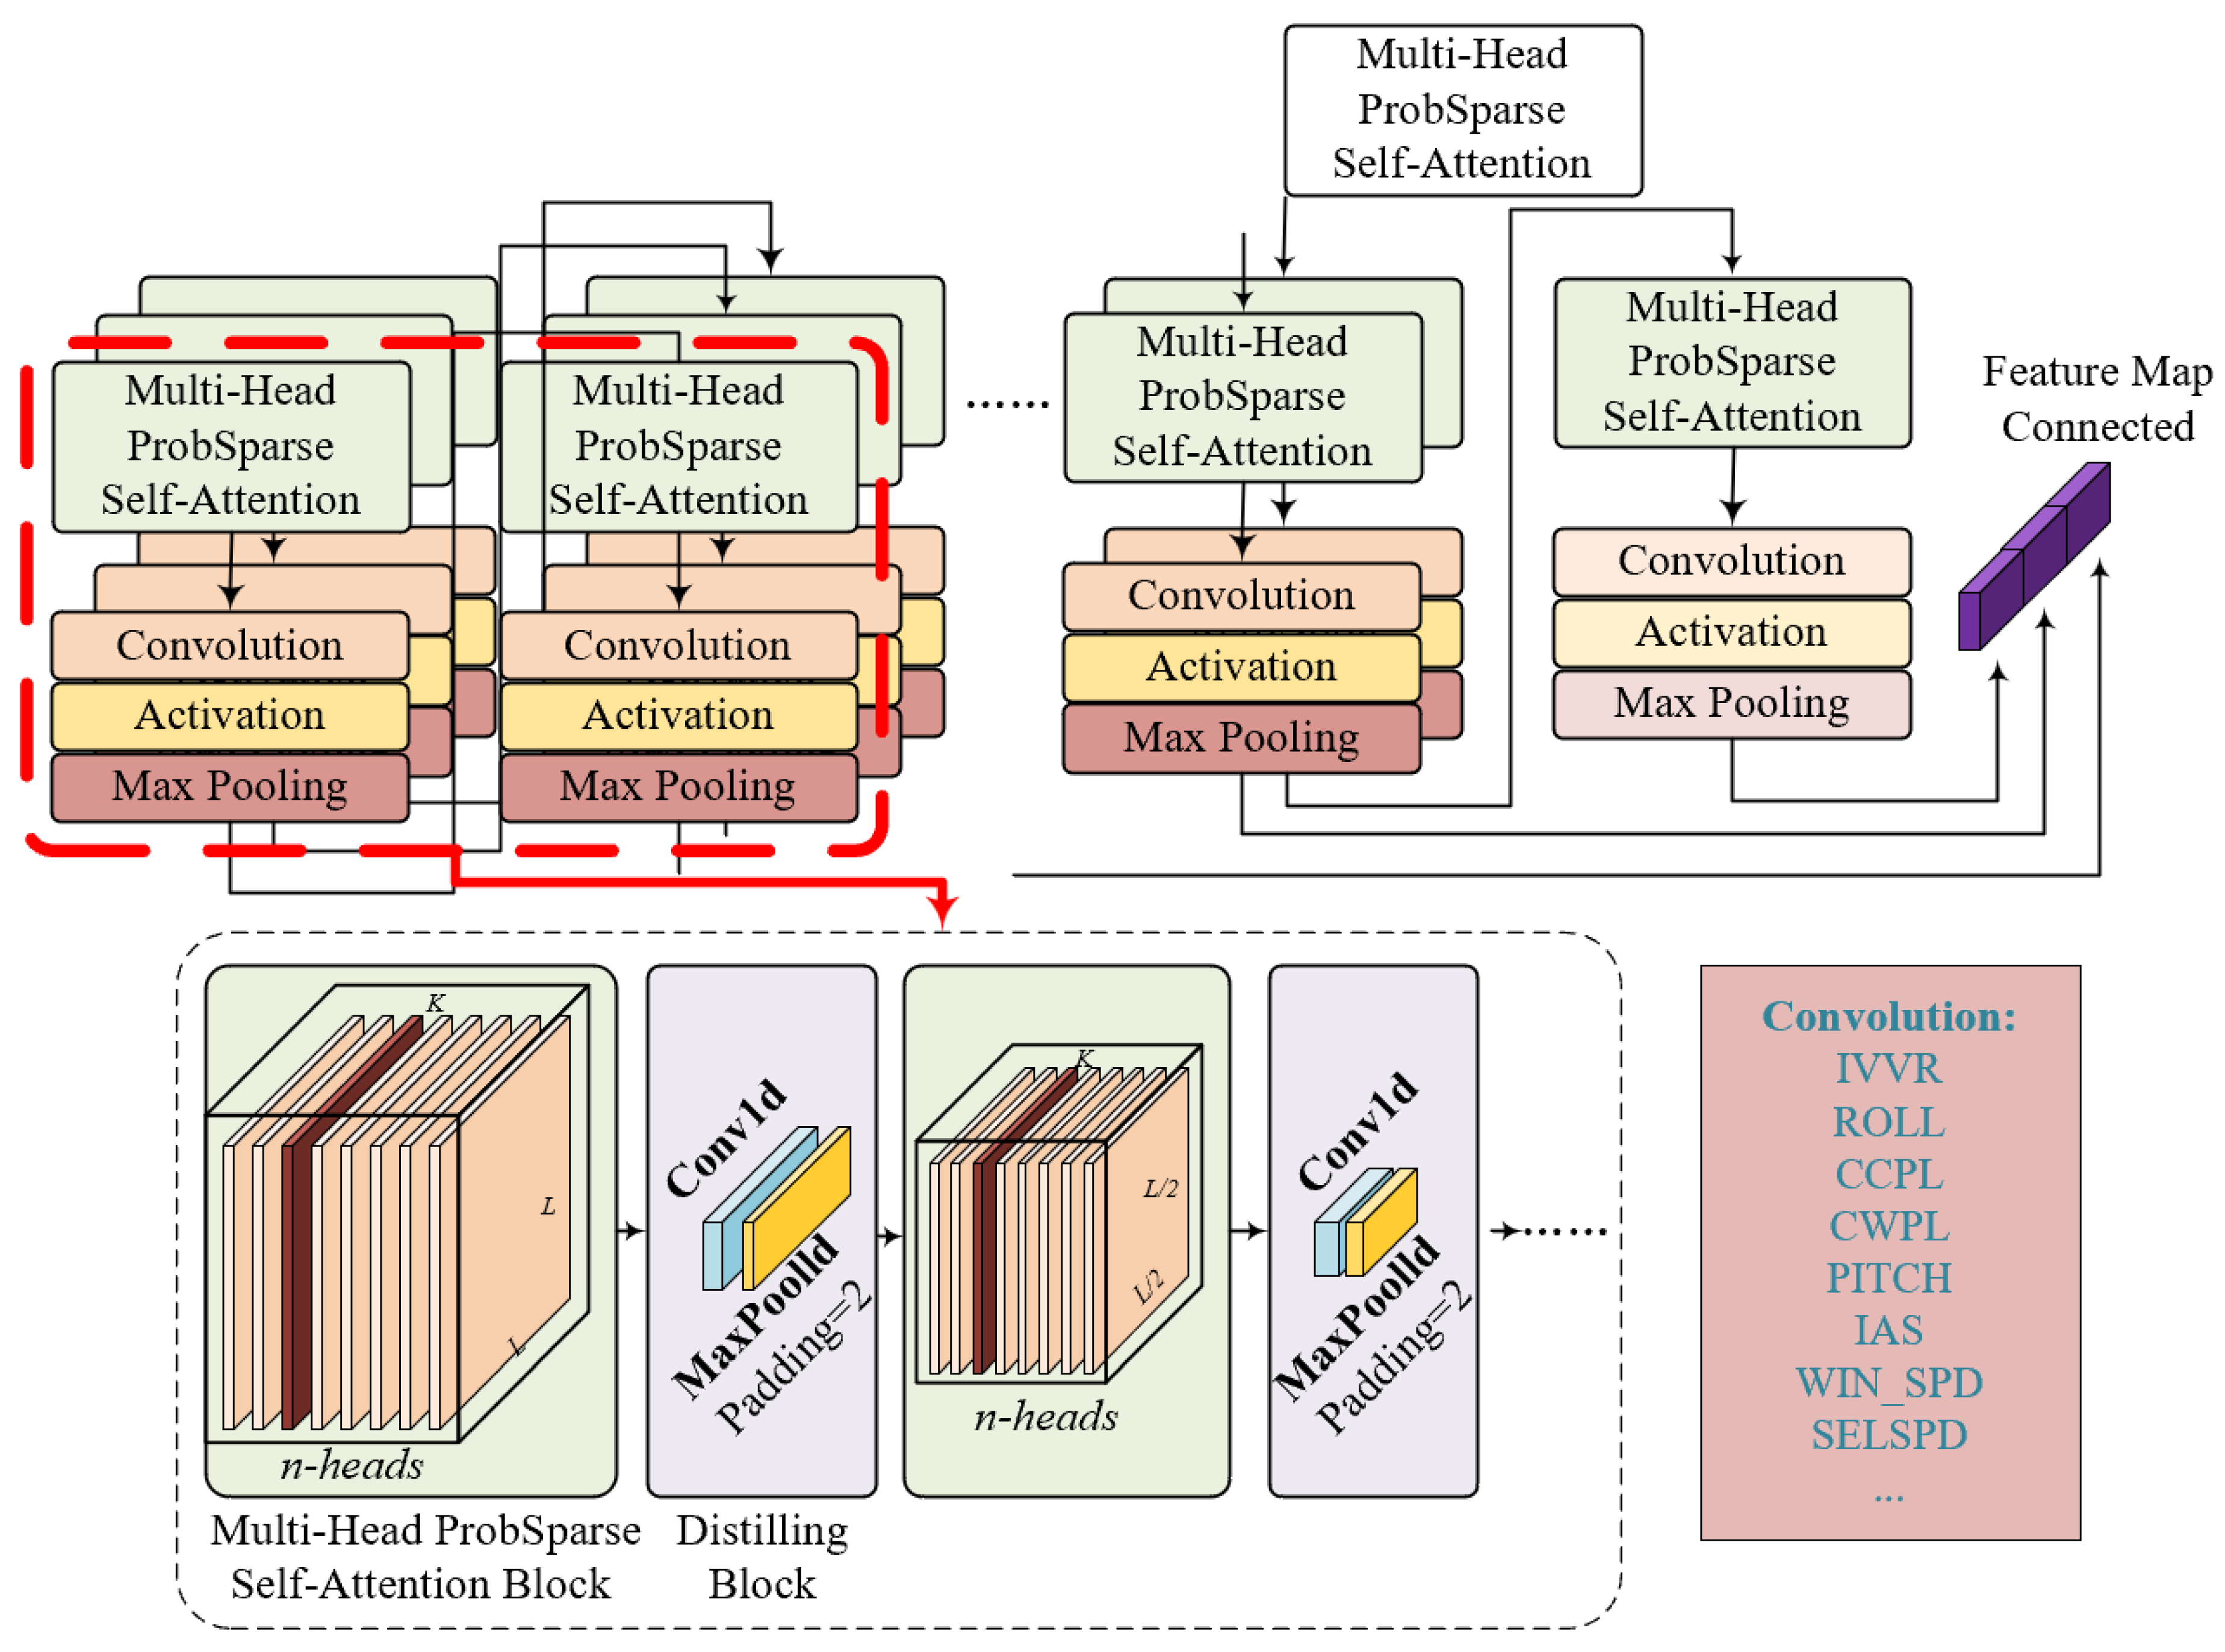
When processing QAR data, the encoder captures the dynamic changes in flight status, as illustrated in Figure 6. The self-attention module performs dimensionality reduction and compression on the input QAR flight data through one-dimensional convolution and max pooling operations. The schematic diagram of the encoder’s deconstruction illustrates the distillation operation from layer j to layer j + 1, as shown in Equation (8).
X j + 1 t = MaxPool ELU Convld X j t A B
Here, Xtj represents the distilled output of the t-th sequence at layer j; AB denotes the matrix resulting from the dot product; Convld refers to the one-dimensional convolution operation, which enhances the model’s sensitivity to short-term variations in flight data; ELU is the activation function, and MaxPool indicates the max pooling operation.
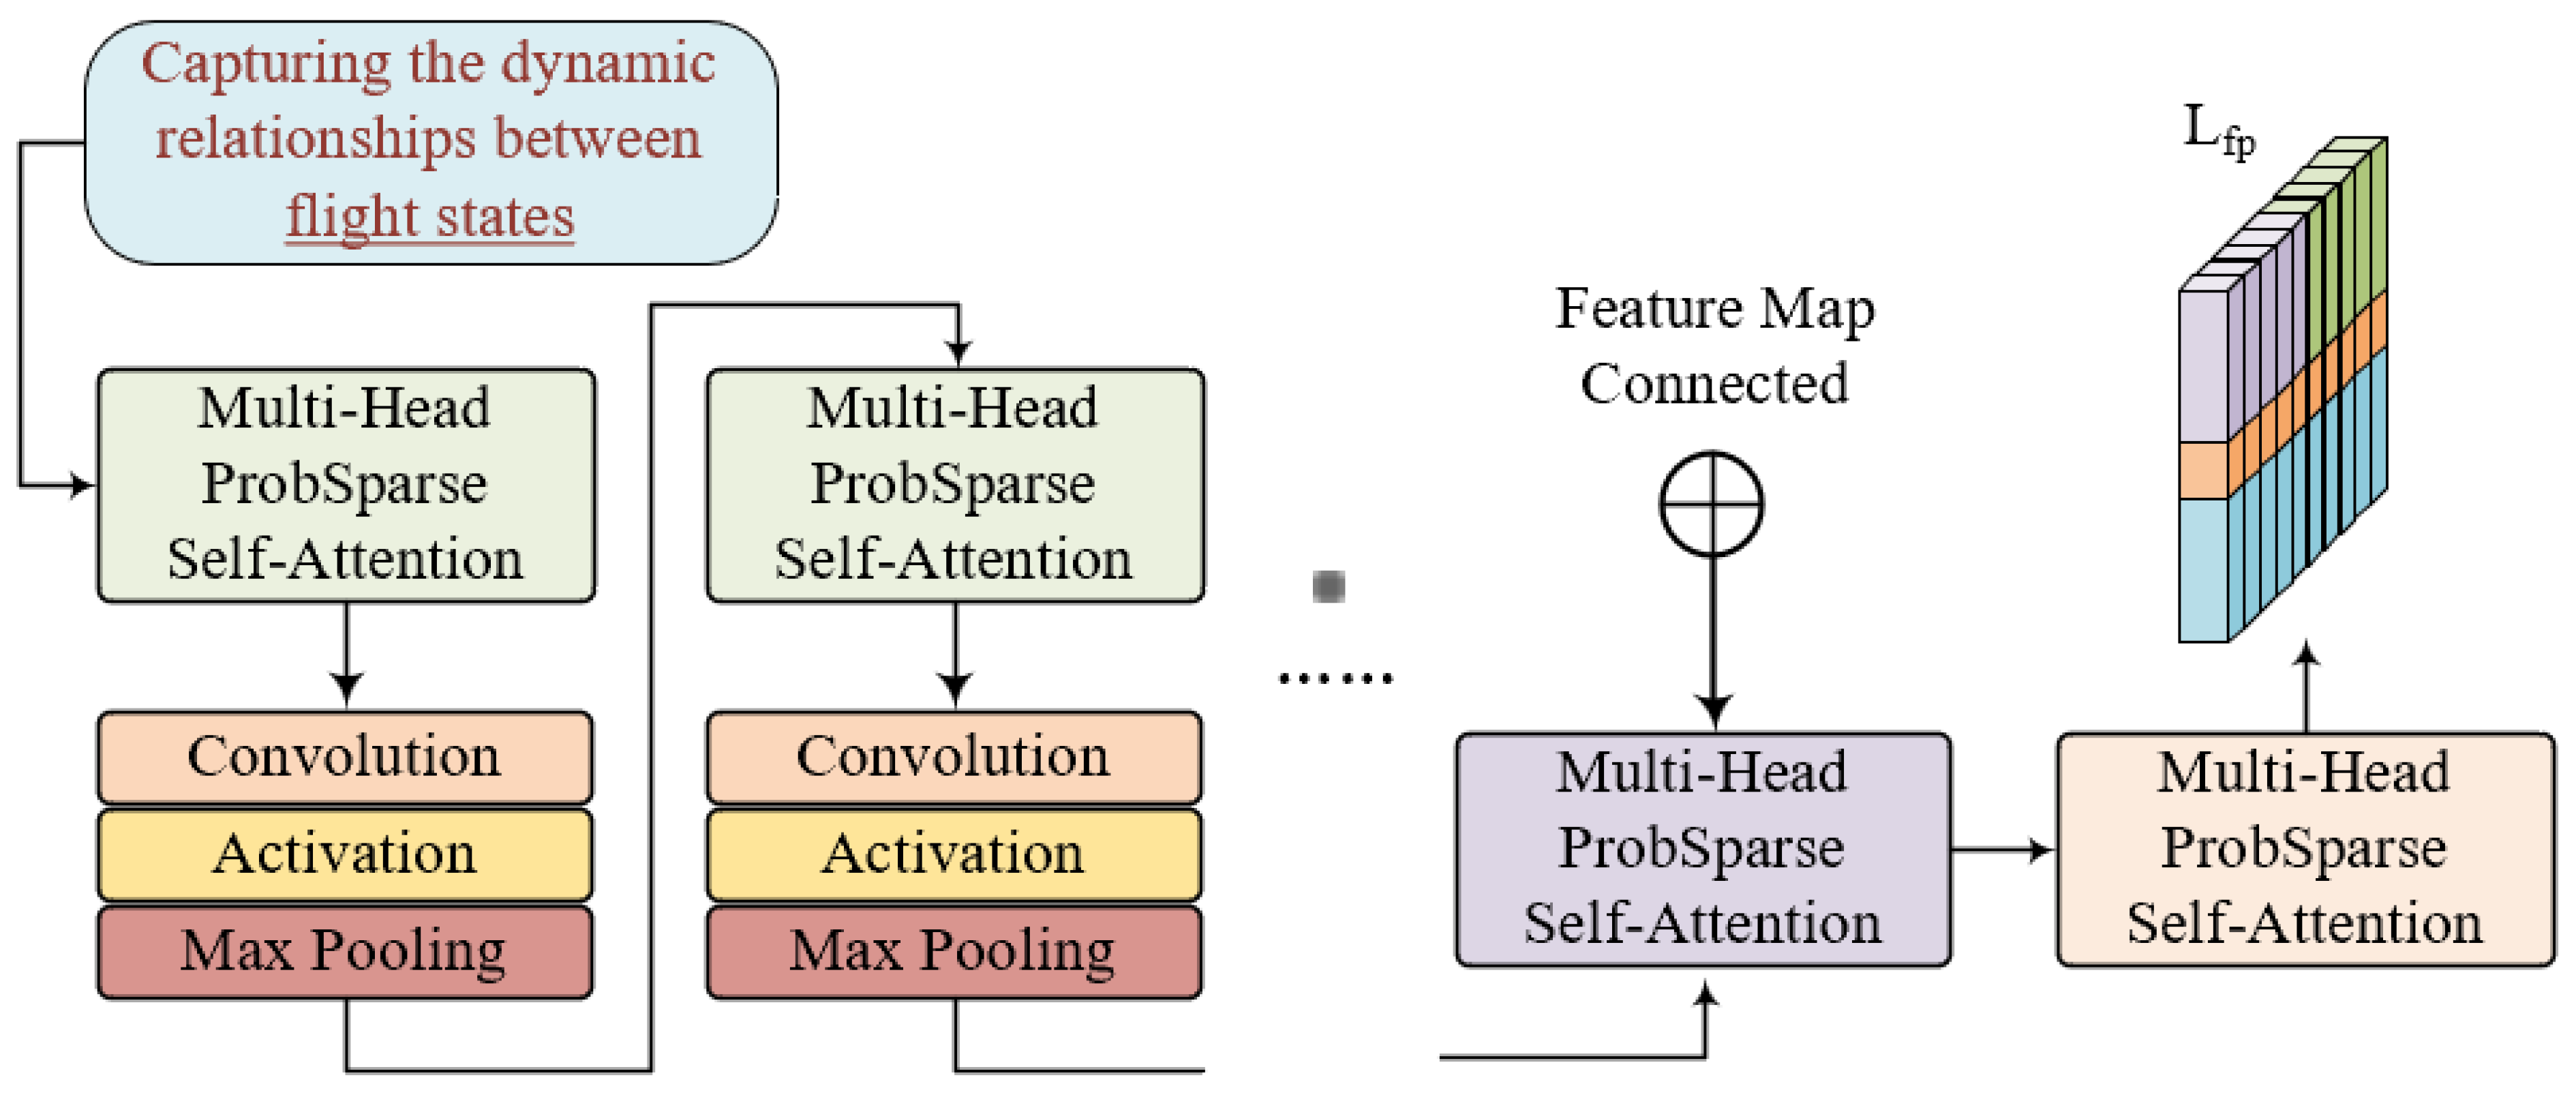
The input to the decoder (Figure 7) is obtained by concatenating the starting token with placeholders for the target sequence (with scalar values set to 0). The input vector is represented as follows:
X f e e d _ d e t = Concat X t o k e n t , X 0 t R K t o k e n + L y × d m o d e l
Here, X t o k e n t is the guiding sequence (start token) extracted from the input flight parameter sequence. X 0 t serves as the placeholder for the output GS and RALT sequences, with scalar values set to 0, indicating that there are no actual output values at the initial stage.

3.4. Baselines

To validate the effectiveness of the proposed GBDT-Informer model, it was compared and evaluated against the following baseline models:
  • LSTM: Long Short-Term Memory networks are currently applied to time prediction (TP) tasks, with optimizations based on LSTM to improve prediction accuracy [25]. In this study, the basic LSTM model was used as a reference for the prediction of GS, RALT, and landing distance.
  • Traditional Machine Learning Methods [37,38,39,40,41]: Classical machine learning methods were used as prediction baselines, including Decision Tree (DT), Linear Regression (LR), GBDT, Random Forest (RF), Neural Network (NN), and Support Vector Machine (SVM).
  • Informer: This model focuses on time series (TP) tasks with long sequence inputs. It uses a multi-head attention framework combined with a distillation mechanism, overcoming the limitations of recurrent neural networks in handling long-term dependencies and enabling parallel computation. Informer reduces computational complexity during training and prediction through attention distillation and generative decoding strategies, enhancing speed.

4. Data Description and Experimental Results

This study selected approximately 3 million rows of valid data from Y-type aircraft operated by a specific airline, covering the period from March 2023 to March 2024, with a total of 45 flight parameters. The dataset was divided into a training set (60%), a test set (20%), and a validation set (20%). Table 2 presents the meanings and units of some QAR parameters.

4.1. Evaluation Metrics

To evaluate the model’s performance on long landing time series prediction regression, it is essential to effectively quantify the error between predicted and true values. This study employs the coefficient of determination (R2), root mean square error (RMSE), mean absolute error (MAE), and mean absolute percentage error (MAPE) as evaluation metrics, defined by the following formulas:
R 2 = 1 i = 0 n ( y i y ^ i ) 2 i = 0 n ( y i y ¯ ) 2
RMSE = i = 1 n ( y i y ^ i ) 2 n
MAE = 1 n i = 1 n | y i y ^ i |
MAPE = 100 n i = 1 n | y i y ^ i | y i
In these formulas, n represents the number of test samples corresponding to the actual observed values yi (i = 1, 2, 3,… n) for aircraft GS, RALT, and landing distance. Additionally, the model will output the corresponding predicted values y ^ i . The landing distance value is obtained by integrating the GS sequence and landing time from 50 feet above ground to the touchdown point, as detailed in Section 3.1.

4.2. Selection of Important Features for GS and RALT

GBDT is valued for its high prediction accuracy and strong learning and generalization capabilities. Table 3 compares the important features of GS and RALT selected by this algorithm with the regression results of other traditional learning algorithms. The coefficient of determination (R2) ranges from 0 to 1, with values close to 1 indicating a strong explanatory power of the model. In terms of feature selection, GBDT demonstrates the highest regression efficiency, followed closely by the random forest model.
In predicting GS and RALT, ref. [25] also incorporated the gravitational potential energy and kinetic energy of the aircraft, which are not recorded in the original QAR data. The formula for calculating gravitational potential energy (P_ENERGY) is as follows:
P _ E N E R G Y = G W _ C × g × R A L T
The calculation formula for kinetic energy (K_ENERGY) is as follows:
K _ E N E R G Y = 1 2 × G W _ C × G S × G S
In this equation, GW_C represents the aircraft’s gross weight, g is the acceleration due to gravity. Therefore, kinetic energy is not considered in the set of features for predicting GS, and gravitational potential energy is not taken into account in the set of features for predicting RALT.
GBDT measures the frequency with which each flight feature is used during subtree splits; the more frequently a feature is utilized, the higher its importance score, indicating a greater contribution to the variations in GS and RALT. Using this method, the importance scores of 107 QAR parameters related to GS and RALT were calculated, and the top 24 most important features were selected, as shown in Table 4. Figure 8 illustrates the importance scores of the key features that GS and RALT. For GS, WIN_DIR, indicated IAS, and HDGMAG exhibit the highest importance scores, indicating their significant influence on GS variations. These parameters are closely related to the aircraft’s aerodynamic and environmental conditions, which directly affect its ground speed. In contrast, for radio altitude, WIN_DIR, ACCVERT, and CWPL show the highest importance scores. This highlights the strong relationship between these parameters and the aircraft’s altitude changes during flight, particularly during takeoff and landing phases.

4.3. Landing Distance Prediction

4.3.1. Prediction Results for GS

For the training set 25,536 samples were used to train the model. Additionally, 1920 test samples were utilized to evaluate the model’s performance, with each flight having a sequence length of 10, and a total of 192 flights being predicted. As shown in Figure 9, it illustrates the comparison between the actual GS and the predicted GS during the landing phase for different flights. The trends of the actual and predicted values are generally well-fitted, which preliminarily indicates the effectiveness and feasibility of using this model to predict GS sequences.
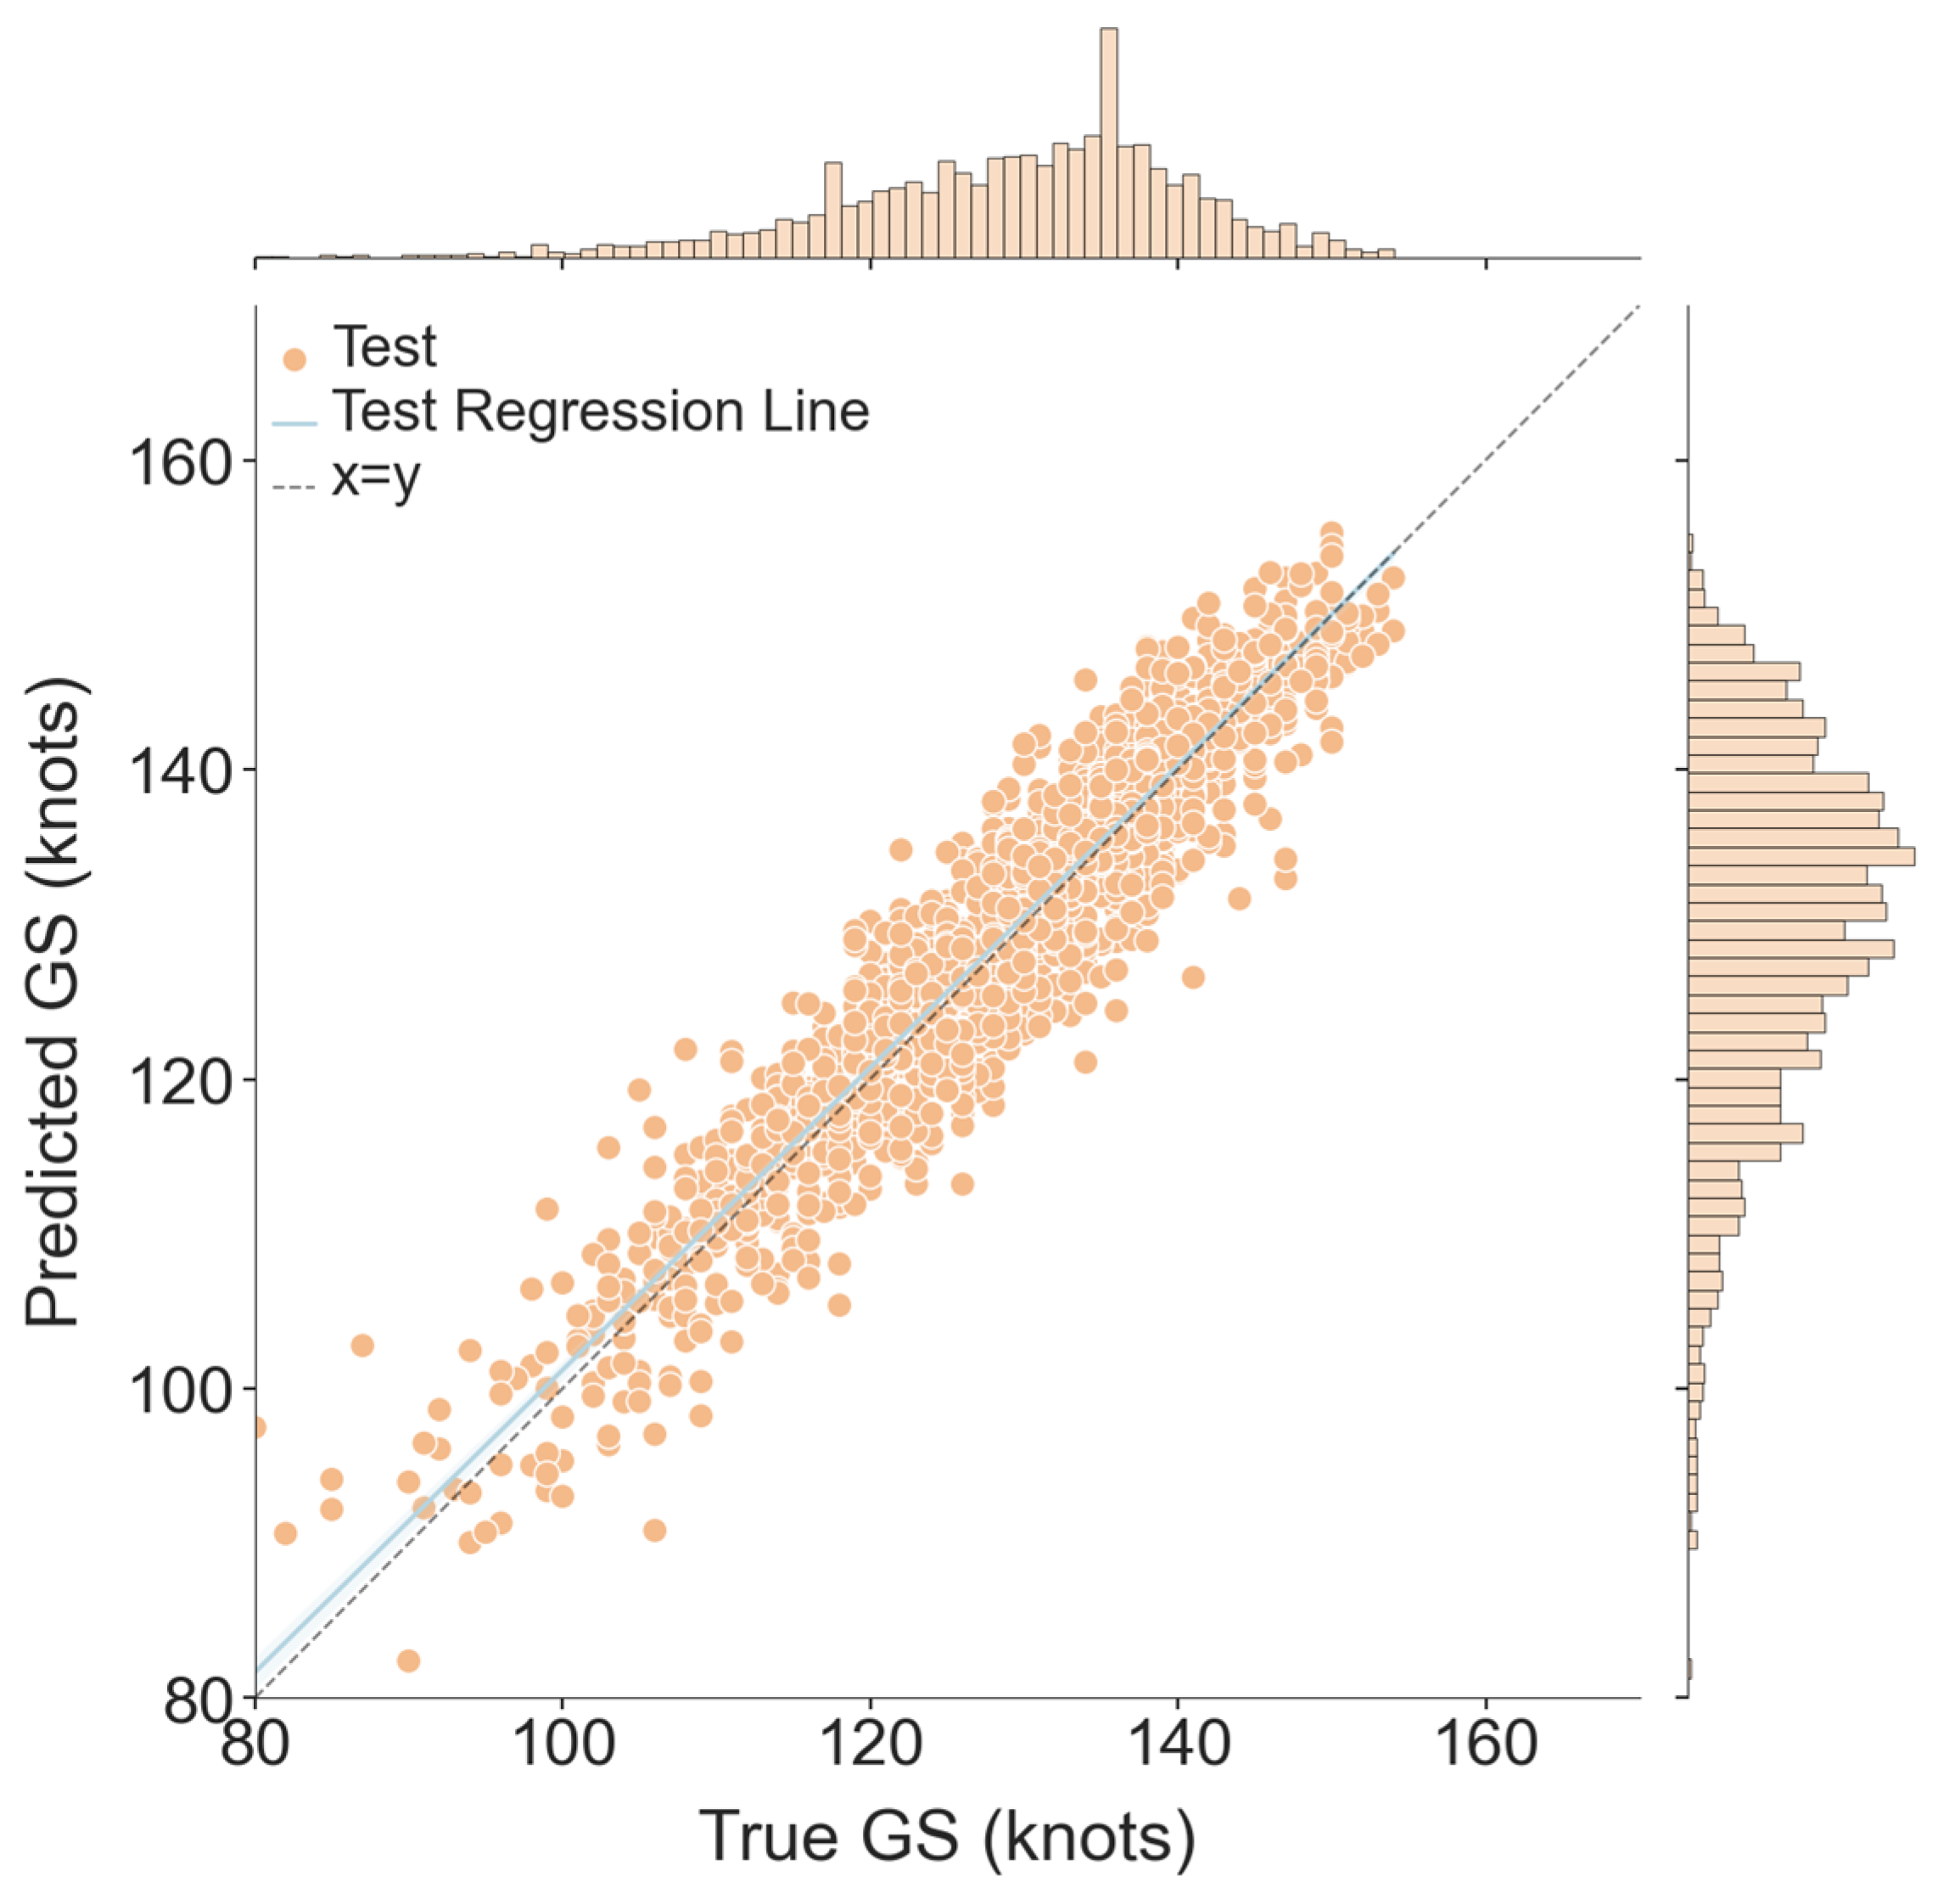
Figure 10 presents a scatter plot comparing the actual and predicted GS sequences, along with the line y = x. As shown, the scatter points are evenly distributed around the y = x line, indicating that the predicted GS values are quite accurate. The histogram above illustrates the distribution of the actual values, which are primarily concentrated in the range of 100 to 160 knots, with a notable peak around 130 knots, suggesting that most actual GS values fall within this interval. The histogram on the right displays the distribution of the predicted values, which are mainly concentrated in the range of 99 to 150 knots, with a significant peak at 135 knots. The blue line represents the test regression line, which is the best linear regression fit obtained from all test data points. The slope of this line is close to 1, indicating a strong positive correlation between the predicted and actual values. The blue regression line is also close to the y = x line. Overall, particularly when handling actual data distributed in the range of 100 to 160 knots, the model demonstrates impressive performance in predicting GS sequences.

4.3.2. Prediction Results for RALT

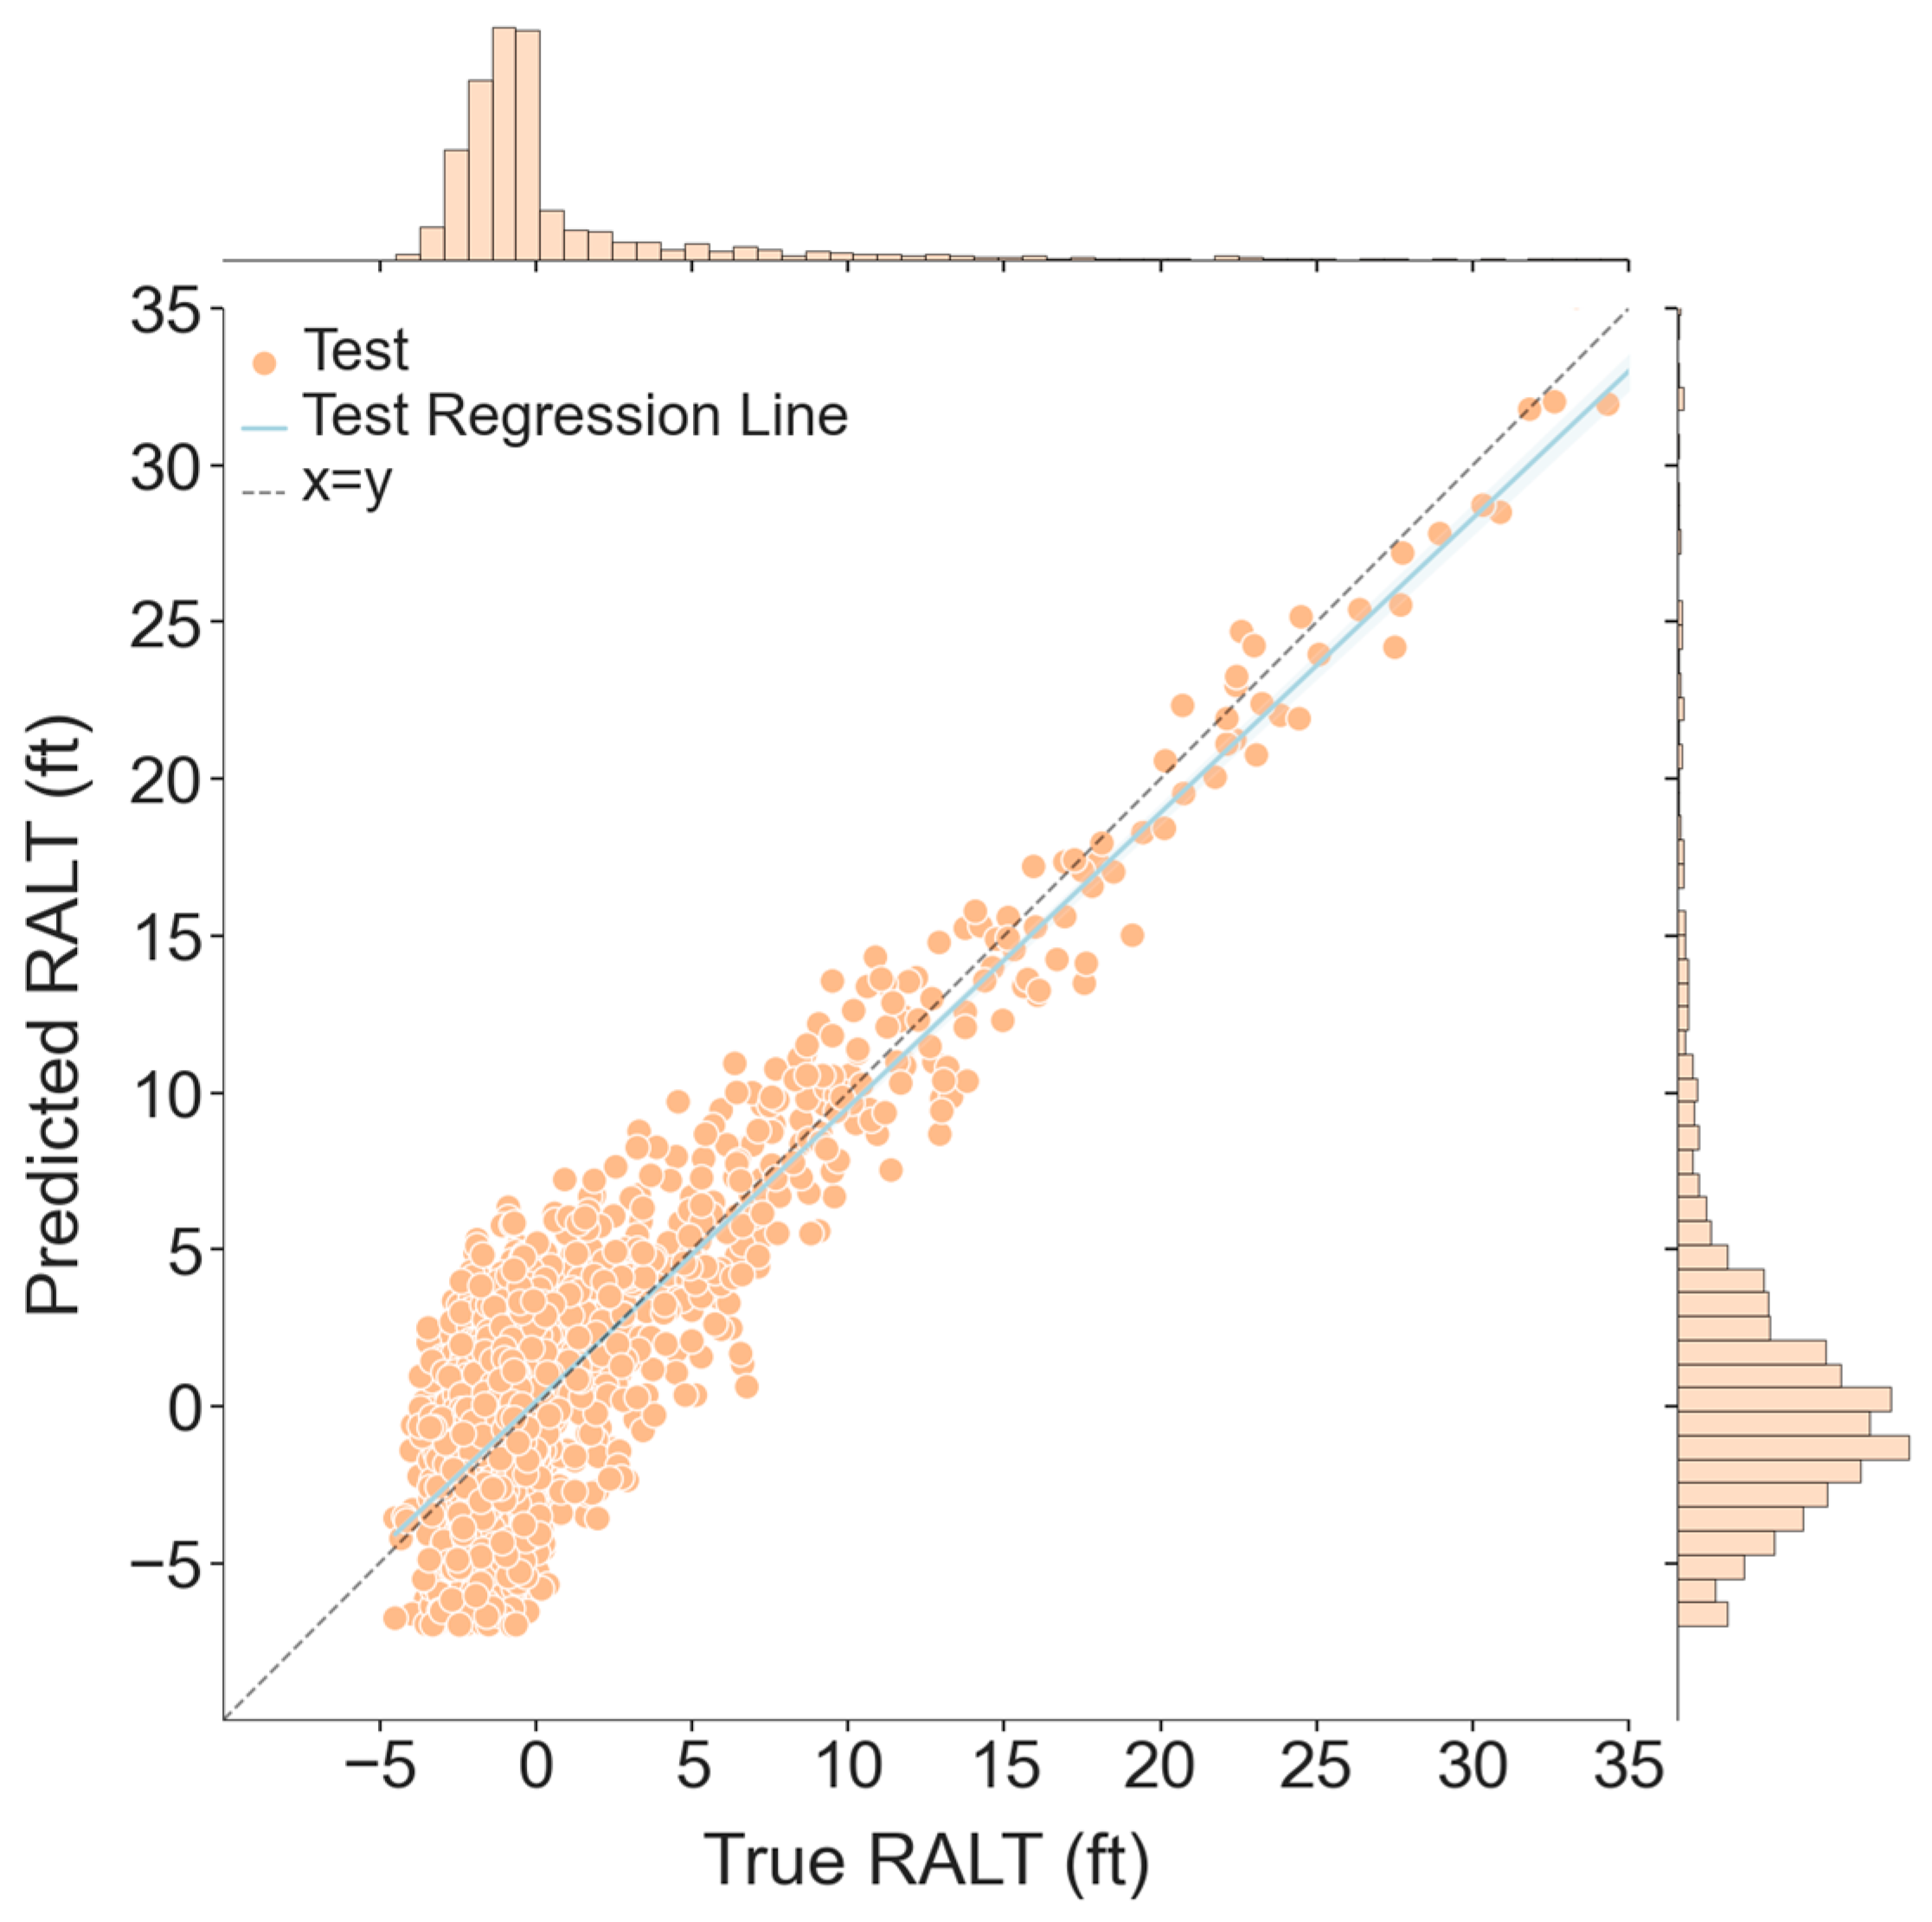
Predicting the RALT sequence is essential for truncating the aircraft’s altitude threshold and can also provide insights into the predicted flight path, aiding airline flight reviews and data analysis. Figure 11 illustrates a scatter plot comparing the actual and predicted RALT sequences, with points distributed near the y = x line. The slope of the blue regression line is close to 1, indicating a strong positive correlation between the predicted and actual values. The blue regression line closely aligns with the y = x line. Overall, the model demonstrates significant performance in predicting RALT sequences.

4.3.3. Prediction Results for Landing Distance

The landing point is determined by monitoring the status of the landing gear during the first transition from “AIR” to “GROUND,” which occurs when the RALT reaches 0 ft at touchdown. This model predicts the GS and RALT during the landing phase, truncating the altitude threshold by setting the predicted RALT to less than 0.5 ft to assess whether the aircraft has landed. The integral of the GS is used to calculate the flight distance from 50 feet above ground level to the landing point, defined as the predicted landing distance. Figure 12 presents a scatter plot of the actual versus predicted landing distances, with data points clustered near the y = x line. The histogram above illustrates the distribution of actual landing distances, which are mainly concentrated in the range of 350 to 750 m, with a notable peak around 450 m, indicating that most actual landing distances fall within this interval. The histogram to the right shows the distribution of predicted landing distances, displaying similar characteristics. The slope of the blue regression line is close to 1, indicating a strong positive correlation between the predicted and actual landing distances, demonstrating that the model’s predictions closely fit the real landing distances.
Table 5 presents a comparative analysis of the performance of different methods for predicting GS, RALT, and landing distance sequences. Generally, smaller values of the evaluation metrics indicate that the predicted values are closer to the actual values, reflecting superior predictive performance of the model. Among the metrics RMSE, MAE, and MAPE, the GBDT-Informer model outperforms the other prediction methods. The accuracy of the GBDT-LSTM and GBDT-Transformer models ranks just below that of the GBDT-Informer model, while all classic machine learning models demonstrate poorer predictive accuracy, with linear regression performing the worst. Compared to the LSTM model, the RMSE values for GS, RALT, and landing distance are reduced by 48.15%, 38.45%, and 41.93%, respectively. The MAE values decrease by 46.60%, 37.33%, and 42.34%, respectively, while the MAPE values decline by 14.46%, 30.73%, and 30.41%. In comparison to the Transformer model, the RMSE values are reduced by 64.16%, 60.60%, and 52.70%. The MAE values decrease by 57.62%, 64.17%, and 54.28%, and the MAPE values decline by 50.79%, 43.49%, and 30.41%. Overall, the GBDT-Informer model consistently achieves the lowest RMSE, MAE, and MAPE values for all three features compared to other prediction models, indicating its superior accuracy in predicting landing distance. This validates the effectiveness and accuracy of the proposed GBDT-Informer model for predicting long landings.
Table 6 compares the performance of the GBDT-Informer and Informer models in predicting GS (Ground Speed) and RALT (Radio Altitude) using QAR data. The results indicate that applying GBDT to select key influencing factors for GS and RALT prior to prediction with Informer yields higher accuracy compared to using the Informer model alone. Specifically, the RMSE values for GS, RALT, and landing distance are reduced by 40.40%, 26.77%, and 34.48%, respectively. Similarly, the MAE values are decreased by 19.47%, 14.81%, and 17.32%, while the MAPE values are lowered by 12.50%, 28.88%, and 21.57%, respectively. In addition to improved accuracy, the GBDT-Informer model demonstrates higher computational efficiency. The inference time for GS prediction is 601.70 milliseconds, which is shorter than the 701.38 milliseconds required by the Informer model. For RALT prediction, the GBDT-Informer model achieves an inference time of 582.40 milliseconds, compared to 693.26 milliseconds for the Informer model. Overall, these findings underscore the effectiveness and reliability of the GBDT-Informer model in landing distance prediction tasks, highlighting its advantages in both accuracy and efficiency.
A Long landing increases the risk of runway excursions. Pilots can access the predicted landing distance at the 4th second after the aircraft descends to 50 ft above ground level. By comparing this predicted distance against predetermined deviation limits, they can promptly assess whether the landing distance is within safe regulations. Additionally, by considering the runway surface condition and the Runway Condition Code (RWYCC) based on the braking effects reported by the preceding pilot, flight crews can have a rapid reference for landing or go-around decisions.

5. Discussion

Previous research on long landing has predominantly relied on retrospective analysis of historical flight data [18,19,20,21], failing to achieve real-time warning capabilities. The segmentation of QAR data landing intervals typically depends on expert experience, and systematic methods for this segmentation have yet to be developed. To address these gaps, this paper proposes a comprehensive framework for predicting long landings based on QAR data, encompassing a data analysis pipeline, sequence prediction models, and accident warning evaluation metrics. Overall, this study provides a thorough and insightful approach to proactive long landing accident warnings.
Although the GBDT-Informer model proposed in this study demonstrates significant advantages in predicting long landing distances, its limitations warrant further discussion. Firstly, the model’s training and validation rely on QAR data from a single aircraft type. Variations in aerodynamic characteristics, weight distribution, and braking systems across different aircraft types may alter the contribution of key features to landing distance, potentially reducing the robustness of the model if directly transferred. Secondly, the feasibility of real-time warnings is constrained by the processing delay of QAR data streams. Although the model can output predictions within 4 s after the aircraft reaches a height of 50 feet, it does not account for the overall latency involved in data decoding and transmission to the cockpit display, which may compress the pilot’s decision-making window.
Future work should expand the dataset to cover major aircraft types (such as the Airbus A320 and Boeing 737 series) and optimize cross-type adaptability through transfer learning. Additionally, exploring the integration of multimodal data (such as runway friction coefficient reports and real-time wind shear radar information) could enhance prediction reliability in complex environments. Methodologically, it is necessary to test lightweight models to accommodate the constraints of onboard computing resources. These improvements not only facilitate the practical application of long landing warning systems but also provide a technical framework for proactive prevention of related risks such as runway incursions and excursions. Furthermore, the proposed model is applicable to other aviation safety studies, contributing to the overall enhancement of civil aviation safety. Future applications may include: (1) studies on long landings, runway overruns, and planned runway operational efficiency; (2) supplementing missing or erroneous QAR data, which aids airlines in flight reviews and data analysis, as well as in analyzing pilot operations and guiding flight training.

6. Conclusions

Long landings represent a significant safety risk during the landing phase of civil aviation aircraft. To proactively predict landing distances, enabling pilots to adjust flight operations and aircraft status in real-time, and to reduce the likelihood of runway overruns, this study establishes a risk warning framework for aircraft long landings based on QAR data and GBDT-Informer. The main conclusions are as follows:
(1)
A comprehensive pipeline was constructed for the preprocessing of QAR data. This involves defining critical heights during the landing phase based on the pilot’s correct landing perspective, attention allocation, and the visual scene of actual altitude above ground level. The landing interval was effectively extracted from the QAR data to avoid redundancy. Additionally, using GBDT, multiple decision trees were constructed to capture the nonlinear relationships and interactions among features within the QAR data, identifying key characteristics of ground speed and radio altitude as indirect indicators of landing distance. The regression results of this algorithm have been validated to be superior.
(2)
A GBDT-Informer long sequence time-series forecasting model was established, which learns from QAR data and fits the implicit influences of human, machine, environment, and management factors on landing. The model separately predicts the sequences of ground speed and radio altitude within the landing interval and calculates the predicted landing distance. Effective metrics were constructed to evaluate the performance of long landing predictions. Validation using extensive QAR datasets demonstrates that the model achieves high fitting accuracy in predicting aircraft long landings. This predictive framework provides insights into the coupling relationships among multiple parameters in flight data and their interrelations with abnormal exceedance patterns, facilitating an extension of the pilot’s operational response time before an incident occurs. This allows for timely adjustments to the aircraft’s status and provides quick references for flight crews when making landing or go-around decisions, enhancing safety margins during the landing phase and improving runway management efficiency.

Author Contributions

Methodology, Z.Z.; Validation, X.C.; Formal analysis, P.G.; Resources, Z.C.; Data curation, J.Z. (Jicheng Zhou); Writing—original draft, Z.Z.; Project administration, Z.Z. and J.Z. (Jichao Zhang). All authors have read and agreed to the published version of the manuscript.

Funding

This research received no external funding.

Data Availability Statement

The original contributions presented in this study are included in the article and Appendix A. Further inquiries can be directed to the corresponding author.

Conflicts of Interest

Author Jicheng Zhou was employed by the company Tianjin Airlines Co., Ltd. The remaining authors declare that the research was conducted in the absence of any commercial or financial relationships that could be construed as a potential conflict of interest.

Appendix A. Hyperparameter Tuning Data for the GBDT-Informer Model

This study constructed a search space for hyperparameters and optimization functions, targeting aspects such as the attention mechanism, model network architecture (including the number of encoder and decoder layers, and attention heads), training configuration (batch size, iterations, learning rate), regularization (dropout), and optimizer (Adam). Hyperparameter tuning experiments were conducted, and the table below presents the optimal parameter sets and performance evaluations of the GBDT-Informer model after training across various intersections.
Table A1. The optimal parameter sets and performance evaluations of the GBDT-Informer model after training across various intersections.
FeathersHyperparametersPerformance Scores
NumberAttation MechanismModel Network StructureTraining Configuration
ProbSparseEncoder LayersDecoder LayersNo. of HeadsBatch SizeEpoch NumberLearning RateActivationDropoutOptimization FunctionRMSEMAEMAPE/%
GS1(BEST)5215512500.001GELU0.05Adam2.953.063.43
25115512500.001GELU0.05Adam3.212.413.99
33115512500.001GELU0.05Adam3.492.594.16
45315512500.001GELU0.05Adam4.002.964.46
58215512500.001GELU0.05Adam4.863.705.09
RALT1(BEST)5215512500.001GELU0.05Adam3.012.304.08
28215512500.001GELU0.05Adam3.632.365.29
35115512500.001GELU0.05Adam3.942,575.82
43115512500.001GELU0.05Adam3.972.425.15
53215512500.001GELU0.05Adam4.392.685.55

References

  1. BOEING, 1959–2001, Statistical Summary of Commercial Jet Airplane Accidents. 2018. Available online: http://www.boeing.com/resources/boeingdotcom/company/about_bca/pdf/statsum.pdf (accessed on 5 June 2019).
  2. Flight Safety Foundation. Flight Safety Foundation ALAR Briefing Note 4.2—Energy Management; Flight Safety Foundation: Alexandria, VA, USA, 2000. [Google Scholar]
  3. Wang, L.; Wu, C.; Sun, R. Pilot Operating Characteristics Analysis of Long Landing Based on Flight QAR Data; Springer: Berlin/Heidelberg, Germany, 2013. [Google Scholar]
  4. 121/135-FS-2012-45; Implementation and Management of Flight Operation Quality Assurance. Civil Aviation Administration of China: Beijing, China, 2012.
  5. Aviation Office of Civil Aviation Administration of China. Annual Statistical Report on Incidents of CAAC; Aviation Office of Civil Aviation Administration of China: Beijing, China, 2011.
  6. Jasra, S.K.; Valentino, G.; Muscat, A.; Zammit-Mangion, D.; Camilleri, R. Evaluation of Flight Parameters During Approach and Landing Phases by Applying Principal Component Analysis. In Proceedings of the AIAA Scitech 2020 Forum, Orlando, FL, USA, 6–10 January 2020. [Google Scholar]
  7. Wang, L.; Wu, C.; Sun, R. An analysis of flight Quick Access Recorder (QAR) data and its applications in preventing landing incidents. Reliab. Eng. Syst. Saf. 2014, 127, 86–96. [Google Scholar] [CrossRef]
  8. Li, X.; Zhang, L.; Shang, J.; Li, X.; Qian, Y.; Zheng, L. A Runway Overrun Risk Assessment Model for Civil Aircraft Based on Quick Access Recorder Data. Appl. Sci. 2023, 13, 9828. [Google Scholar] [CrossRef]
  9. Li, R.; Pan, S.; Fang, H.; Xiong, Y.; Wang, F. Fault Prediction Technology of Civil Aircraft Based on Qar Data. In Proceedings of the 2017 International Conference on Sensing, Diagnostics, Prognostics, and Control (SDPC), Shanghai, China, 16–18 August 2017. [Google Scholar]
  10. Luo, W.; Wu, Z.; Chen, C. An Aircraft Fuel Flow Model of Cruise Phase Based on LSTM and QAR Data. In Proceedings of the 2020 13th International Symposium on Computational Intelligence and Design (ISCID), Hangzhou, China, 12–13 December 2020. [Google Scholar]
  11. Kang, C.; Zhang, P. The Solution of FlySmart with Airbu. China Civ. Aviat. 2014. [Google Scholar]
  12. Run, S.; Ze, Y.; Lei, W. Study of flight safety evaluation based on QAR data. China Saf. Sci. J. 2015, 25, 87–92. [Google Scholar]
  13. Jian, W.; Wei, D.; Zheng, X.; Jian, W. Flight risk assessment method of transport aviation. China Saf. Sci. J. 2019, 29, 110–116. [Google Scholar]
  14. Flight Safety Foundation. Reducing the Risk of Runway Excursions—Report of the Runway Safety Initiative; Flight Safety Foundation: Alexandria, VA, USA, 2009. [Google Scholar]
  15. Payne, K.H.; Harris, D.A. Psychometric Approach to the Development of a Multidimensional Scale to Assess Aircraft Handling Qualities. Int. J. Aviat. Psychol. 2000, 10, 343–362. [Google Scholar] [CrossRef]
  16. AIRBUS. Getting to Grips with Aircraft Performance; Airbus Company: Blagnac, France, 2002. [Google Scholar]
  17. Federal Aviation Administration. Runway Overrun Prevention; AC No.: 91-79; Federal Aviation Administration: Washington, DC, USA, 2007. [Google Scholar]
  18. Australian Transport Safety Bureau. Runway Excursions; Aviation Research and Analysis Report-AR-2008-018; Central Office: Canberra, Australia, 2008.
  19. Wang, L. Effects of flare operation on landing safety: A study based on ANOVA of real flight data. Saf. Sci. 2018, 102, 14–25. [Google Scholar] [CrossRef]
  20. Boer, R.D. The automatic identification of unstable approaches from flight. In Proceedings of the 6th International Conference on Research in Air Transportation (ICRAT), Istanbul, Turkey, 26–30 May 2014. [Google Scholar]
  21. Jenkins, M.; Aaron, R.F. Reducing runway landing overruns. Aero Mag. 2012, 3, 14–19. [Google Scholar]
  22. Bukov, V.N.; Bykov, V.N.A. Predictive algorithm for runway overrun protection. J. Comput. Syst. Sci. Int. 2017, 56, 862–873. [Google Scholar] [CrossRef]
  23. Wen, R.; Wu, B.; Chu, S.; Wang, H. Prediction of landing distance for civil aircraft. China Saf. Sci. J. 2017, 27, 77–81. [Google Scholar]
  24. Yu, C. Flight Characteristics Analysis Based on QAR Data of a Jet Transport During Landing at a High-altitude Airport. Chin. J. Aeronaut. 2012, 25, 13–24. [Google Scholar] [CrossRef]
  25. Wang, L.; Wu, C.; Sun, R.; Cui, Z. An Analysis of Hard Landing Incidents Based on Flight QAR Data. In Proceedings of the International Conference on Engineering Psychology and Cognitive Ergonomics, Vancouver, BC, Canada, 9–14 July 2014. [Google Scholar]
  26. Tong, C.; Yin, X.; Wang, S.; Zheng, Z. A novel deep learning method for aircraft landing speed prediction based on cloud-based sensor data. Future Gener. Comput. Syst. 2018, 88, 552–558. [Google Scholar] [CrossRef]
  27. Kang, Z.; Shang, J.; Feng, Y.; Zheng, L.; Liu, D.; Qiang, B.; Wei, R. A Deep Sequence-to-Sequence Method for Aircraft Landing Speed Prediction Based on QAR Data. In Proceedings of the International Conference on Web Information Systems Engineering, Amsterdam, The Netherlands, 20–24 October 2020. [Google Scholar]
  28. Tong, C.; Yin, X.; Jun, L.; Zhu, T.; Lv, R.; Sun, L.; Rodrigues, J.J. An innovative deep architecture for aircraft hard landing prediction based on time-series sensor data. Appl. Soft Comput. 2018, 73, 344–349. [Google Scholar] [CrossRef]
  29. Peng, Z.; Tao, Y.; Ya, L. Servo System State Prediction Algorithn Based on Deep Learning. Comput. Appl. Softw. 2019. [Google Scholar]
  30. Chen, Z.; Ma, M.; Li, T.; Wang, H.; Li, C. Long sequence time-series forecasting with deep learning: A survey. Inf. Fusion 2023, 97, 101819. [Google Scholar] [CrossRef]
  31. Zhou, H.; Wang, D.; Li, H. Informer: Beyond efficient transformer for long sequence time-series forecasting. In Proceedings of the AAAI Conference on Artificial Intelligence, Vancouver, BC, Canada, 2–9 February 2021; Volume 35, pp. 11106–11115. [Google Scholar]
  32. Li, Y.; Lin, Y.; Xiao, T.; Zhu, J. An efficient transformer decoder with compressed sub-layers. In Proceedings of the AAAI Conference on Artificial Intelligence, Vancouver, BC, Canada, 2–9 February 2021; pp. 13315–13323. [Google Scholar]
  33. Vaswani, A.; Shazeer, N.; Parmar, N.; Uszkoreit, J.; Jones, L.; Gomez, A.N.; Kaiser, Ł.; Polosukhin, I. Attention is all you need. In Proceedings of the Advances in Neural Information Processing Systems 30: Annual Conference on Neural Information Processing Systems, Long Beach, CA, USA, 4–9 December 2017; pp. 5998–6008. [Google Scholar]
  34. Liang, W.; Luo, S.; Zhao, G.; Wu, H. Predicting Hard Rock Pillar Stability Using GBDT, XGBoost, and LightGBM Algorithms. Mathematics 2020, 8, 765. [Google Scholar] [CrossRef]
  35. Friedman, J.H. Greedy function approximation: A gradient boosting machine. Ann. Stat. 2001, 29, 1189–1232. [Google Scholar] [CrossRef]
  36. Xu, H. GBDT-LR: A Willingness Data Analysis and Prediction Model Based on Machine Learning. In Proceedings of the 2022 IEEE International Conference on Advances in Electrical Engineering and Computer Applications (AEECA), Dalian, China, 20–21 August 2022; pp. 396–401. [Google Scholar]
  37. Barros, R.C.; Basgalupp, M.P.; de Carvalho, A.C.P.L.F.; Freitas, A.A. A Survey of Evolutionary Algorithms for Decision-Tree Induction. IEEE Trans. Syst. Man Cybern. Part C (Appl. Rev.) 2012, 42, 291–312. [Google Scholar] [CrossRef]
  38. Porter, D.R. Introduction to Linear Regression Analysis. J. Appl. Stat. 2015, 25, 388. [Google Scholar] [CrossRef]
  39. Krishna, A.; Subash, V.; Krishnan, S. Comparative study of stock price prediction using SVR, KNN regressor, random forest regressor, LSTM and GRU (gated recurrent unit). AIP Conf. Proc. 2025, 3237, 030048. [Google Scholar]
  40. Saini, L.M.; Soni, M.K. Artificial Neural Network-Based Peak Load Forecasting Using Conjugate Gradient Methods. IEEE Power Eng. Rev. 2007, 22, 59. [Google Scholar] [CrossRef]
  41. Wu, Y.C.; Feng, J.W. Development and Application of Artificial Neural Network. Wirel. Pers. Commun. 2017, 102, 1645–1656. [Google Scholar] [CrossRef]
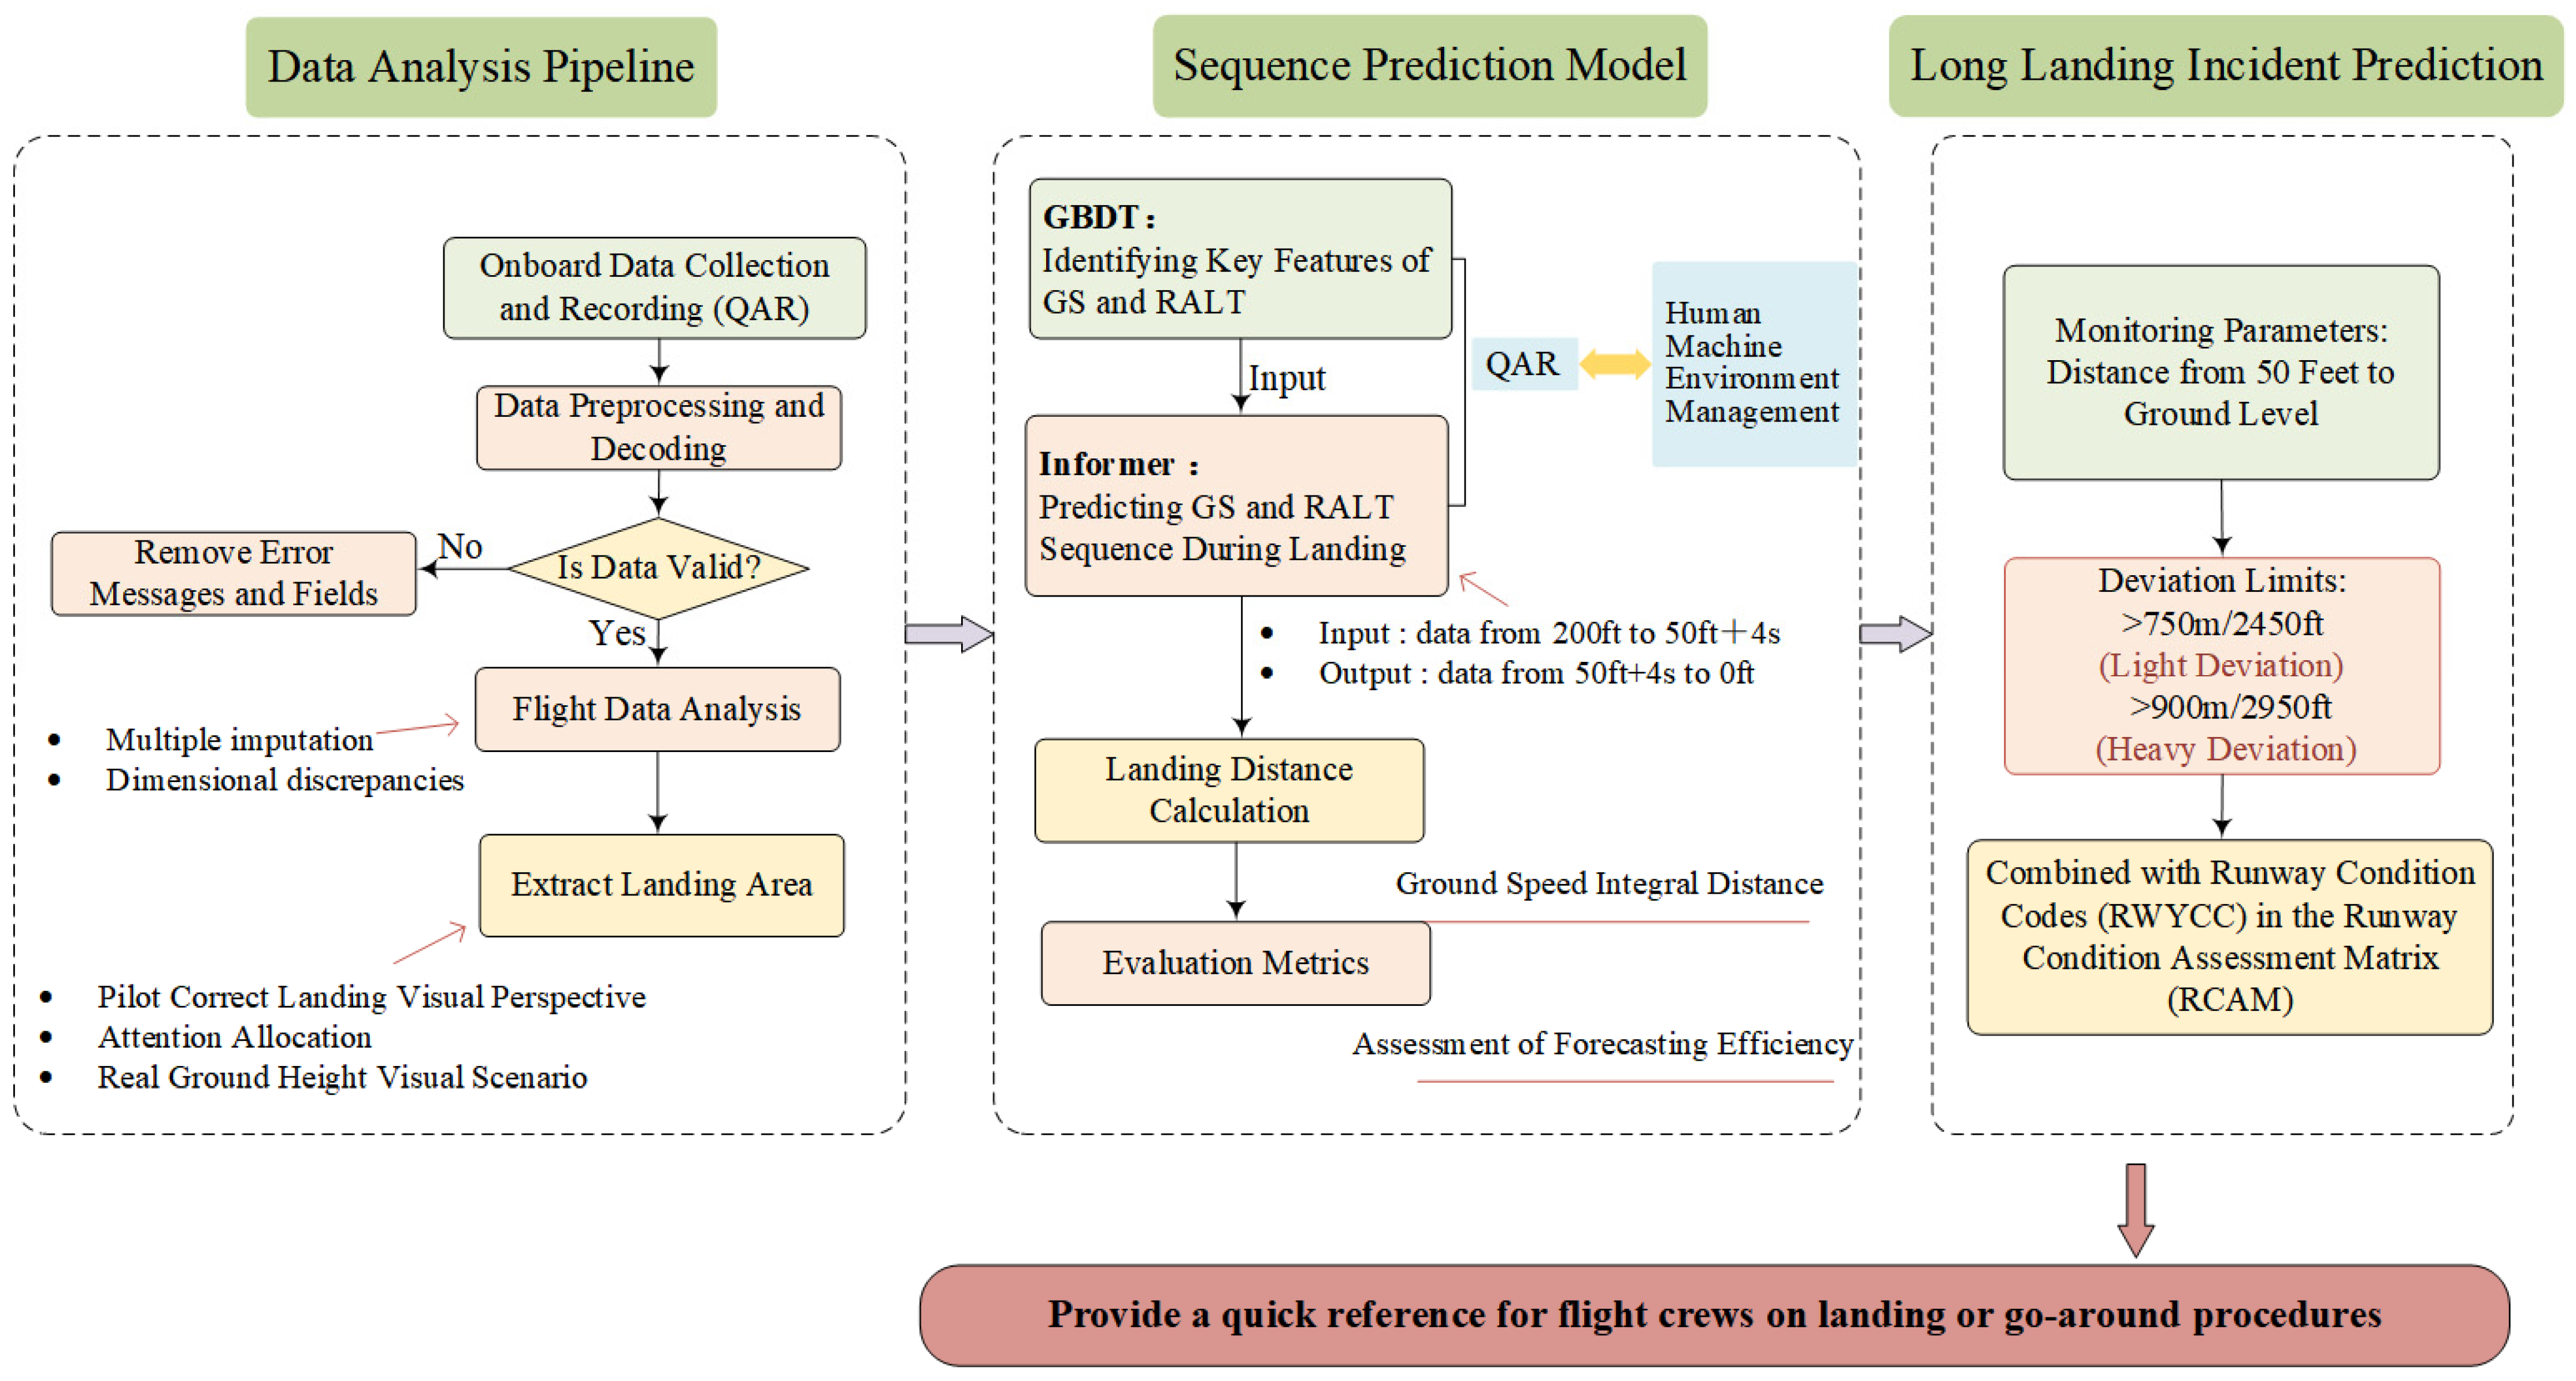
Figure 1. Diagram of the Framework for Predicting Aircraft Long Landings Based on QAR Data.
Aerospace 12 00744 g001
Figure 2. Schematic diagram of aircraft landing area.
Aerospace 12 00744 g002
Figure 3. Visual Scene Diagram of the Runway During the Aircraft Landing Phase; (a) 500 ft AGL; (b) 200 ft AGL; (c) 50 ft AGL; (d) 20 ft AGL; (e) Touchdown point (0 ft AGL).
Aerospace 12 00744 g003
Figure 4. Schematic diagram of GBDT algorithm.
Aerospace 12 00744 g004
Figure 5. Informer model overview.
Aerospace 12 00744 g005
Figure 6. Architecture of the encoder part.
Aerospace 12 00744 g006
Figure 7. Architecture of the decoder part.
Aerospace 12 00744 g007
Figure 8. Figure of GS and RALT Feature Importance Scores.
Aerospace 12 00744 g008
Figure 9. Comparison chart between true GS and predicted GS (ad).
Aerospace 12 00744 g009aAerospace 12 00744 g009b
Figure 10. Scatter plot of real GS and predicted GS.
Aerospace 12 00744 g010
Figure 11. Scatter plot of real RALT and predicted RALT.
Aerospace 12 00744 g011
Figure 12. Scatter plot of real landing distance and predicted landing distance.
Aerospace 12 00744 g012
Table 1. QAR Parameter Type Table.
Parameter TypesType DescriptionTypical Example
Operational ParametersParameters that directly reflect the operating action of the unitlanding gear retraction, pedal action, spoiler switch, etc.
Positional ParametersParameters reflecting the position of the aircraftaltitude, latitude, longitude, etc.
System ParametersParameters that describe whether an on-board alarm is triggered or notindicates airspeed, etc.
Environmental ParametersParameters that reflect the external environment of the aircraftwind speed, wind direction, etc.
Table 2. QAR parameters information.
NumberParameterMeaningUnitNumberParameterMeaningUnit
1ALTAltitudeft15SELHDGSelected Heading°
2PITCHPitch Angle°16IVVRAcceleration Rateknot/h
3ROLLRoll Angle°17ENG2N1Engine 2 N1 SpeedRPM
4IASIndicated Airspeedknot18ENGTLAEngine Thrust Level 1°
5VAPPVapp Reference Speedknot19ENG1N1Engine 1 N1 SpeedRPM
6HDGMAGMagnetic Heading°20CCPRRight Aileron Position°
7GW_CCorrected Aircraft Weightkg21CWPLControl Wheel Position 1A°
8LONPCLongitude°22ILSFRILS FrequencyMHz
9LATPCLatitude°23CCPLLeft Aileron Position°
10VRTGVertical Loadkg24SELSPEEDSelected Speedknot
11WIN_DIRWind Direction°25V1_VREFV1 and Vref Speedknot
12WIN_SPDWind Speedknot26VR_VAPPRApproach Speedknot
13ACCVERTVertical Accelerationg27CWPRControl Wheel Position 1B°
Table 3. Regression results of various algorithms for selecting GS and RALT features.
FeatureMachine Learning AlgorithmsR2
GSGBDT97.60%
Random Forest92.38%
Linear Regression71.09%
SVM15.83%
Decision Tree95.43%
RALTGBDT87.49%
Random Forest80.26%
Linear Regression49.28%
SVM3.21%
Decision Tree67.99%
Table 4. List of Selected Features.
ZonesSelected Features
GS‘WIN_DIR’, ‘IAS’, ‘HDGMAG’, ‘WIN_SPD’, ‘ALTRAD’, ‘GW_C’ ‘PITCH’, ‘ACCVERT’
‘CWPR’, ‘ROLL’, ‘SELHDG’, ‘IVVR’
‘ENG2N1’, ‘ENGTLA’, ‘ENG1N1’, ‘CCPR’
‘CWPL’, ‘P_ENERGY’, ‘ILSFRQ1’, ‘ILSFRQ2’
‘CCPL’, ‘SELSPEED’, ‘V1_VREF’, ‘VR_VAPPR’
RALT‘WIN_DIR’, ‘ACCVERT’, ‘HDGMAG’, ‘WIN_SPD’
‘GNDSPD’, ‘GW_C’, ‘PITCH’, ‘K_ENERGY’
‘CWPR’, ‘ROLL’, ‘SELHDG’, ‘IVVR’
‘ENG2N1’, ‘ENGTLA’, ‘ENG1N1’, ‘CCPR’
‘CWPL’, ‘IAS’, ‘ILSFRQ1’, ‘ILSFRQ2’
‘CCPL’, ‘SELSPEED’, ‘V1_VREF’, ‘VR_VAPPR’
Table 5. Performance comparison of GS, RALT, landing distance prediction models.
Predictive FeaturesMachine Learning Algorithms
(Based on the GBDT)
RMSEMAEMAPE/%
GSGBDT-Informer2.953.063.43
LSTM5.695.734.01
Transformer8.237.226.97
Linear Regression11.2810.858.32
Decision Tree11.4311.119.89
Random Forest10.5210.189.46
RALTGBDT-Informer3.012.304.08
LSTM4.893.675.89
Transformer7.646.427.22
Linear Regression9.227.8314.88
Decision Tree9.538.3415.90
Random Forest10.277.4716.45
Landing DistanceGBDT-Informer24.7516.225.24
LSTM42.6228.137.53
Transformer52.3335.488.37
Linear Regression171.84148.1817.15
Decision Tree159.34139.7216.19
Random Forest156.92133.8415.41
Table 6. Comparative Performance Analysis of GBDT-Informer and Informer Models in Predicting GS, RALT, and Landing Distance.
FeaturesModelsRMSEMAEMAPE/%Inference Times/ms
GSGBDT-Informer2.953.063.43601.70
Informer4.953.803.92701.38
RALTGBDT-Informer3.012.304.08582.40
Informer4.112.705.74693.26
Landing DistanceGBDT-Informer24.7516.225.24/
Informer37.7919.626.68/
Disclaimer/Publisher’s Note: The statements, opinions and data contained in all publications are solely those of the individual author(s) and contributor(s) and not of MDPI and/or the editor(s). MDPI and/or the editor(s) disclaim responsibility for any injury to people or property resulting from any ideas, methods, instructions or products referred to in the content.